Embed Size (px)
Citation preview
Purpose of Today’s Presentation
1. Review solid waste industry safety data.
2. Discuss principal causes of fatalities, accidents and injuries and how to prevent them.
3. Update on OSHA and DOT compliance and regulatory issues.
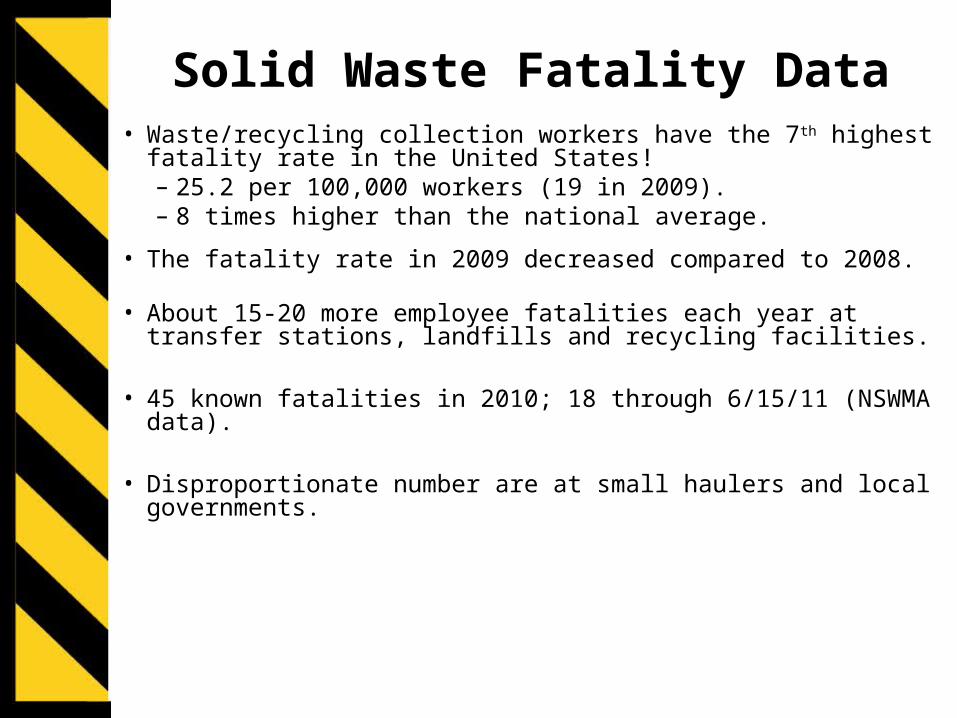
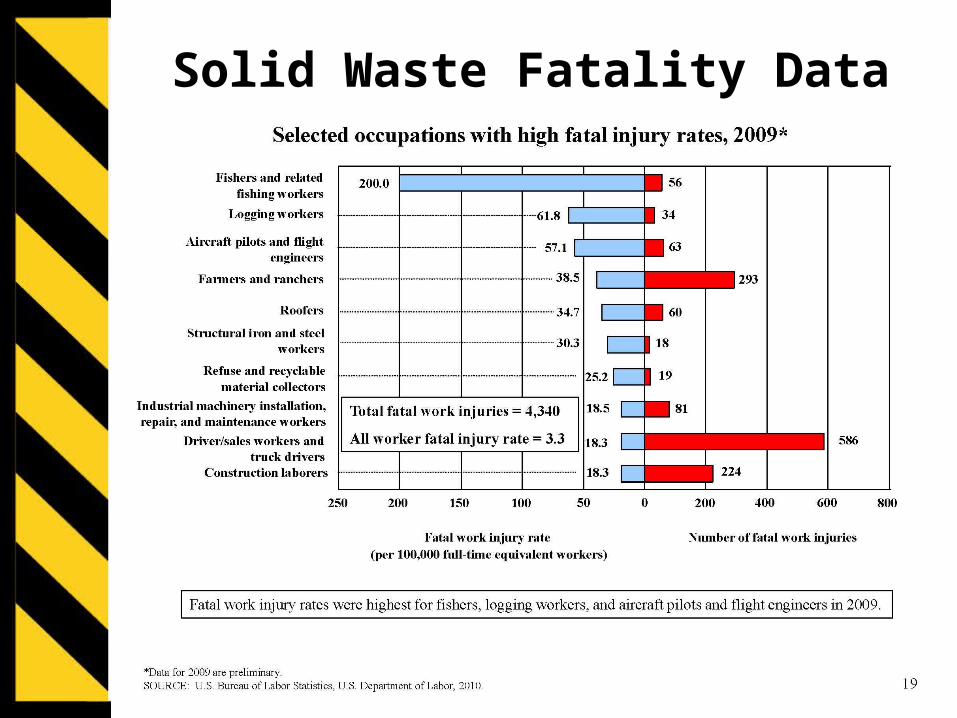
Solid Waste Fatality Data• Waste/recycling collection workers have the 7th highest fatality
rate in the United States!– 25.2 per 100,000 workers (19 in 2009).– 8 times higher than the national average.
• The fatality rate in 2009 decreased compared to 2008.
• About 15-20 more employee fatalities each year at transfer stations, landfills and recycling facilities.
• 45 known fatalities in 2010; 18 through 6/15/11 (NSWMA data).
• Disproportionate number are at small haulers and local governments.
Solid Waste Fatality Data
Solid Waste Fatality Data
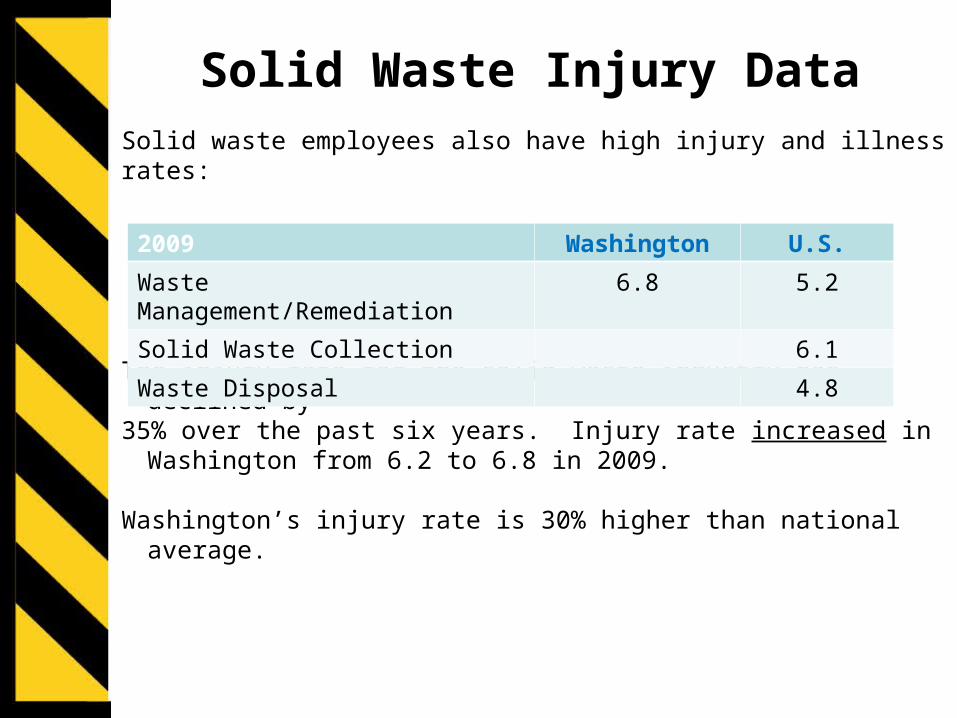
Solid Waste Injury Data
Solid waste employees also have high injury and illness rates:
The injury rate for the solid waste industry has declined by35% over the past six years. Injury rate increased in Washington
from 6.2 to 6.8 in 2009.
Washington’s injury rate is 30% higher than national average.
2009 Washington U.S.
Waste Management/Remediation 6.8 5.2
Solid Waste Collection 6.1
Waste Disposal 4.8
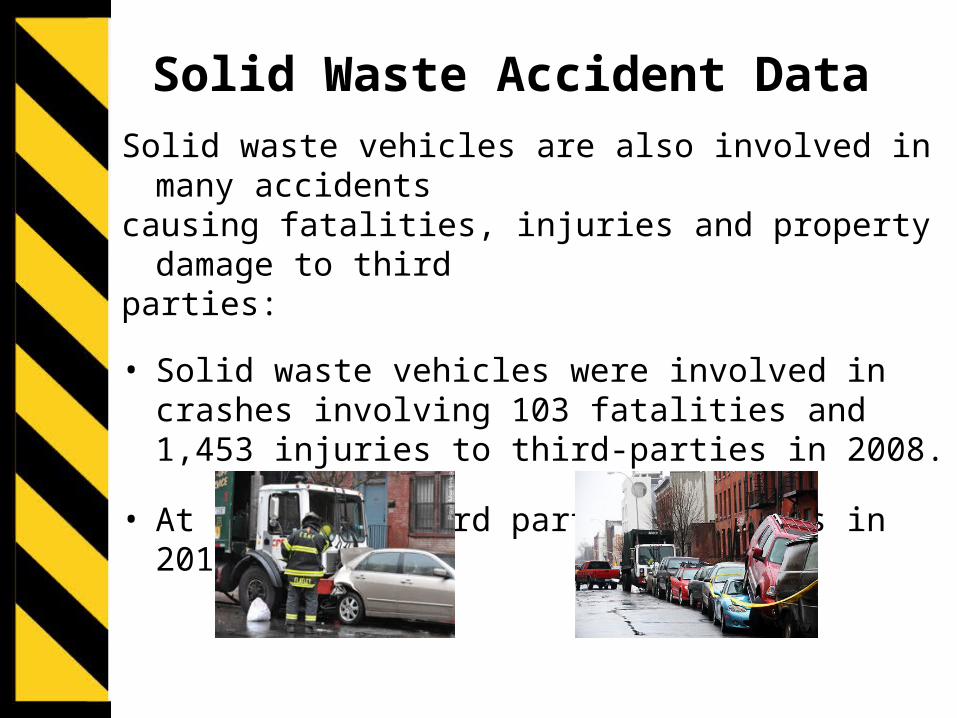
Solid Waste Accident Data
Solid waste vehicles are also involved in many accidentscausing fatalities, injuries and property damage to thirdparties:
• Solid waste vehicles were involved in crashes involving 103 fatalities and 1,453 injuries to third-parties in 2008.
• At least 80 third party fatalities in 2010 (NSWMA).

Changing Worker Behavior is Key
• The majority of accidents and injuries are caused by unsafe BEHAVIOR, not unsafe conditions.
• Safety = getting adults to change their unsafe behavior.
• This is not easy – and the culture in our industry doesn’t help!
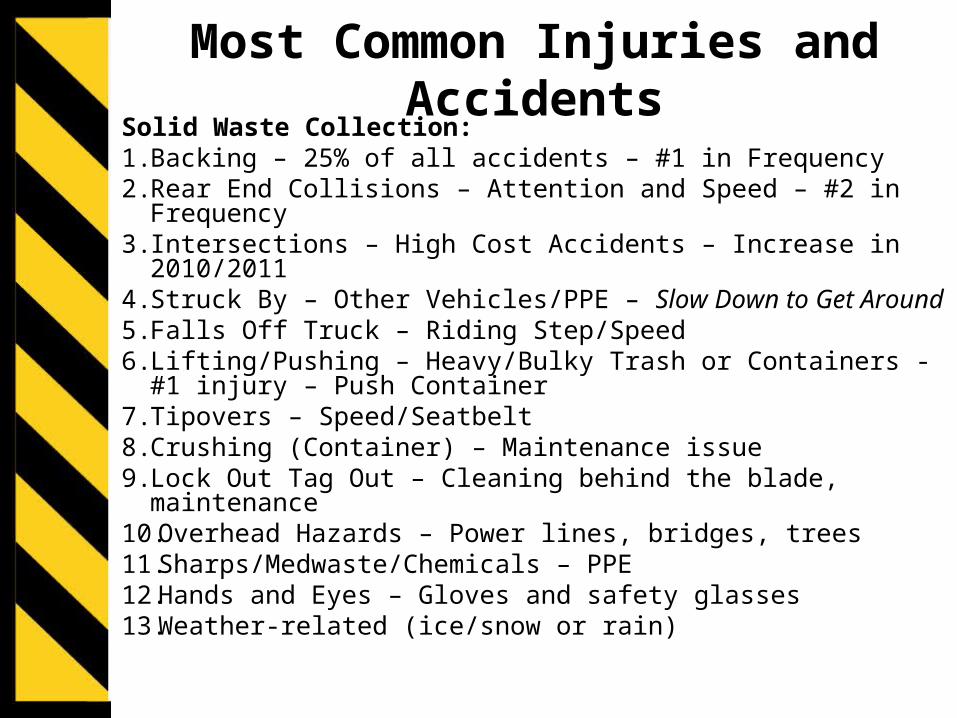
Most Common Injuries and AccidentsSolid Waste Collection:1. Backing – 25% of all accidents – #1 in Frequency2. Rear End Collisions – Attention and Speed – #2 in Frequency 3. Intersections – High Cost Accidents – Increase in 2010/20114. Struck By – Other Vehicles/PPE – Slow Down to Get Around5. Falls Off Truck – Riding Step/Speed6. Lifting/Pushing – Heavy/Bulky Trash or Containers - #1
injury – Push Container7. Tipovers – Speed/Seatbelt8. Crushing (Container) – Maintenance issue9. Lock Out Tag Out – Cleaning behind the blade, maintenance10.Overhead Hazards – Power lines, bridges, trees11.Sharps/Medwaste/Chemicals – PPE12.Hands and Eyes – Gloves and safety glasses13.Weather-related (ice/snow or rain)
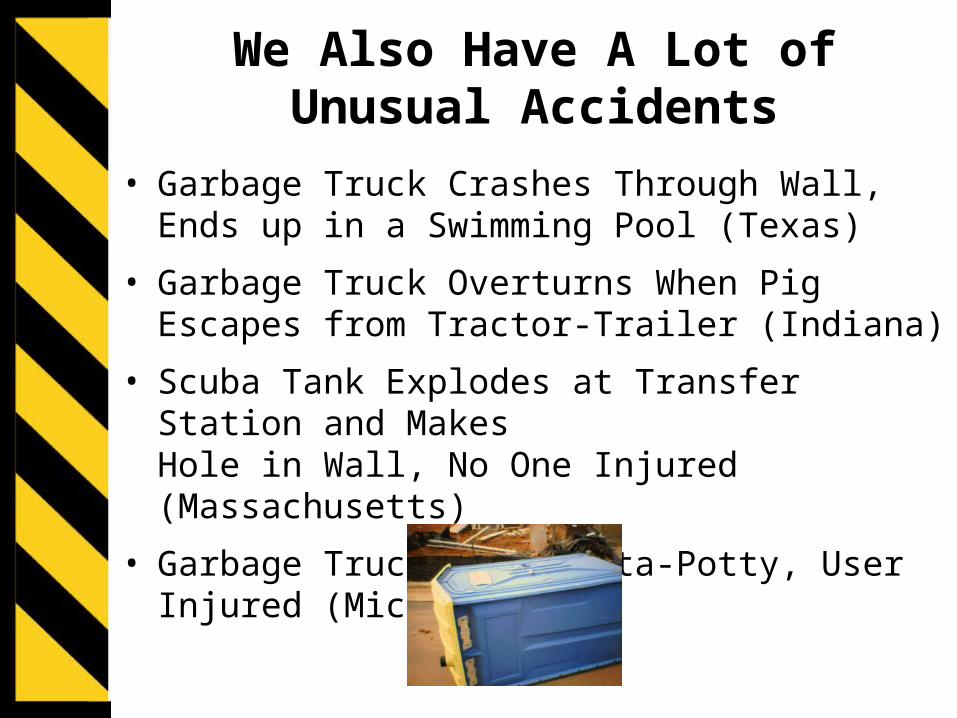
We Also Have A Lot of Unusual Accidents
• Garbage Truck Crashes Through Wall, Ends up in a Swimming Pool (Texas)
• Garbage Truck Overturns When Pig Escapes from Tractor-Trailer (Indiana)
• Scuba Tank Explodes at Transfer Station and Makes Hole in Wall, No One Injured (Massachusetts)
• Garbage Truck Hits Porta-Potty, User Injured (Michigan)
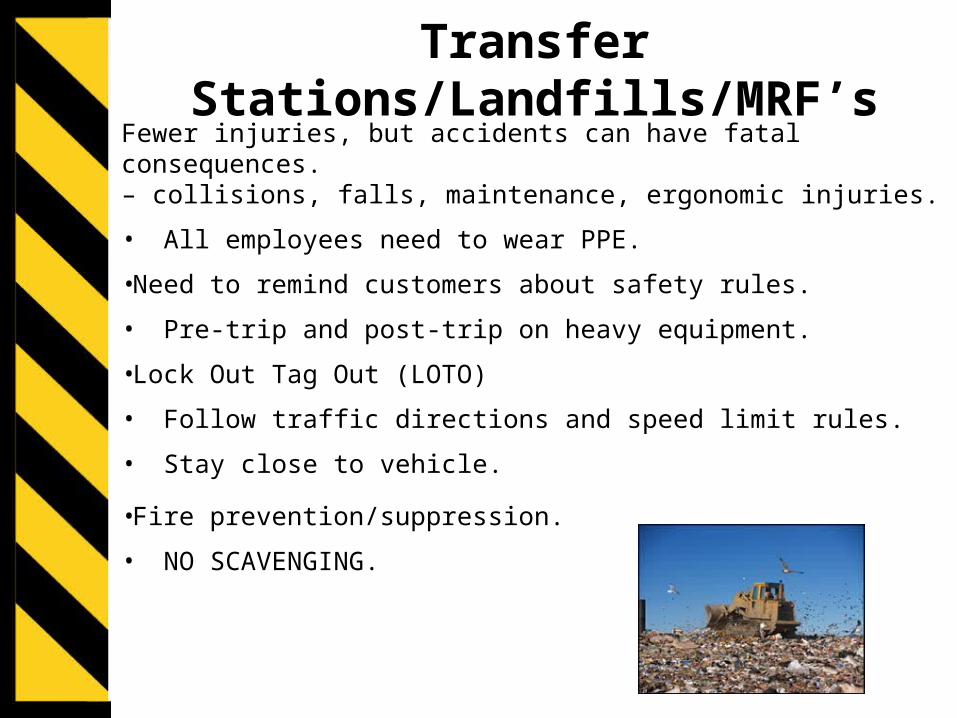
Transfer Stations/Landfills/MRF’sFewer injuries, but accidents can have fatal consequences.– collisions, falls, maintenance, ergonomic injuries.
• All employees need to wear PPE.
•Need to remind customers about safety rules.
• Pre-trip and post-trip on heavy equipment.
•Lock Out Tag Out (LOTO)
• Follow traffic directions and speed limit rules.
• Stay close to vehicle.
•Fire prevention/suppression.
• NO SCAVENGING.

Decision Making – On the Route What are the typical bad decisions that get solid wastedrivers into unsafe situations?
1. Not fit for work
2. Inadequate Pre-Trip or Post-Trip
3. Rushing/Excessive Speed
4. Personal Protective Equipment (PPE)
5. Safety Belt
6. Cell phones, texting and other distractions
7. Lack of communication with helper or other drivers

Decision Making – On the Route
Helper decisions – hundreds everyday. One of them isabsolutely critical to safety.
When is a helper allowed to be on the riding step of agarbage truck? Per ANSI Z245.1 (2008):
1. Truck is going less than 10 mph2. Truck is going less than 1/5 mile
Helper should never, ever be on the riding step when the truck is backing! Helper also needs to wear high visibilityapparel.

Rushing – Consequences
Several recent fatal accidents were caused, in part, becausethe driver or helper was in a rush:
1. Louisiana Collection – December 2008– Helper tried to jump on step of backing truck
2. Wyoming Maintenance – December 2009– Mechanic testing truck did not put on safety belt

How to Reduce Fatalities, Accidents and Injuries
1. Look at your injury logs and workers comp. data:• What is most common? (frequency)• What is most expensive? (severity)
2. Driver Training:• New drivers – how long? (two weeks or two hours)• Coaching the Refuse Driver/Smith System.• Pre-trip and post-trip inspections.
3. Helper Training:• Lifting – videos, hands-on.• Riding on side.• Dealing with traffic.• Wearing PPE.
How to Reduce Fatalities, Accidents and Injuries
4. Route Observation:• Observe workers on routes.• Coach if not following rules: Talk to them not at them.
5. Safety meetings and communication.
6. Accident Investigation:• Root cause analysis.
7. Incentives/Discipline:• Individual rewards (e.g., X yrs no accident).• Group rewards (e.g., x months no accident/injury).• Progressive discipline – 3 strikes v. zero tolerance.

How to Reduce Fatalities, Accidents and Injuries
8. Medical Management:• A light duty program is an effective way to get a
worker back to work. Median days missed due to reportable injury/illness for collection employees is five.
9. Equipment/Technology:• Cameras, lighting packages, collision avoidance
systems, etc.
10. Routing/Workload.

Improving Your Safety Program
• Look for patterns – time of day, type of accident or injury, certain employees (repeaters), temporary workers or weather conditions.
• Identify a few priorities based on frequency and/or severity.
• Route observation.

Reducing Fatalities, Accidents and Injuries is Everyone’s Job
1. Owners and Senior Management need to take itseriously:
• Establish a goal and make it a priority• Resources and Training• Communication – signs, posters, etc.
2. Supervisors need to reinforce rules and do route observations:• Driving (speed, cell phone, turn signals)• PPE (high visibility; gloves; shoes; eyewear)• Safety belts and Equipment
3. Front line employees need to understand how they benefit – make it personal.
What’s in it for them?1. Employee can’t provide for his/her family if dead, injured
or unemployed.2. Tie worker’s personal interests (e.g., hunting, fishing) to
workplace safety.
Communicate the program:1. Signs/posters – make it interesting.2. Verbal reminders.
Training:1. Short, ongoing, interactive.2. Language and literacy barriers.3. Use pictures and videos.4. Use humor…
Getting Employees to Care About Safety
OSHA Compliance and Regulations
Every single business day, an OSHA inspector shows up at a solid waste company to perform an inspection.
– 270 federal inspections in SIC Code 4953 in 2010. •24 in Washington.
– More than half of OSHA’s inspections are in response to fatalities/complaints or are “programmed.”
– Relatively few “random inspections.”
• Companies with high injury rates are vulnerable to OSHA inspections.
Washington Department of Labor & Industries
• DLI enforces workplace safety rules in Washington.
– DLI rules differ from OSHA (fall protection, respiratory protection, aerial lifts).
– DLI requires written safety and health programs.
– DLI’s “Core Rules” – Chapter 296-800 WAC.
OSHA Compliance
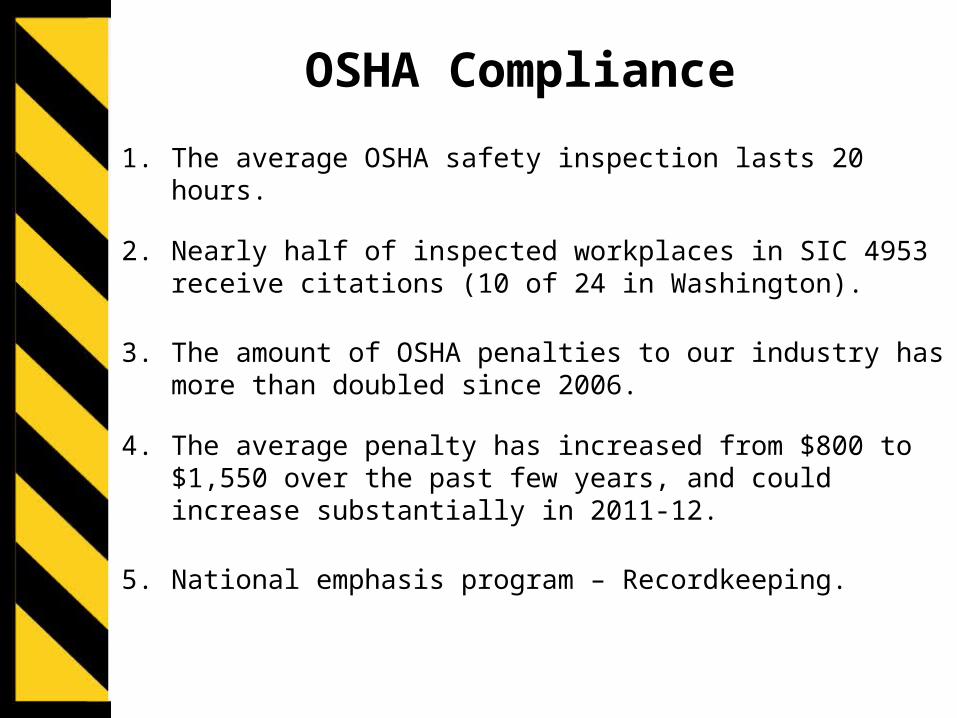
1. The average OSHA safety inspection lasts 20 hours.
2. Nearly half of inspected workplaces in SIC 4953 receive citations (10 of 24 in Washington).
3. The amount of OSHA penalties to our industry has more than doubled since 2006.
4. The average penalty has increased from $800 to $1,550 over the past few years, and could increase substantially in 2011-12.
5. National emphasis program – Recordkeeping.

Hazard Communication – provide information to employees re chemicals in the workplace, through MSDS’s, labels and training.
Lockout Tagout – shutting down vehicles or machines to protect employees from unexpected startup.
Electrical Equipment/Systems – protecting employees against hazards involving electricity.
Powered Industrial Trucks – forklifts – training.
Respiratory Protection – protecting workers from fumes, dust, etc. (PPE).
Top 5 OSHA Violations – SIC 4953
OSHA Regulations and Enforcement
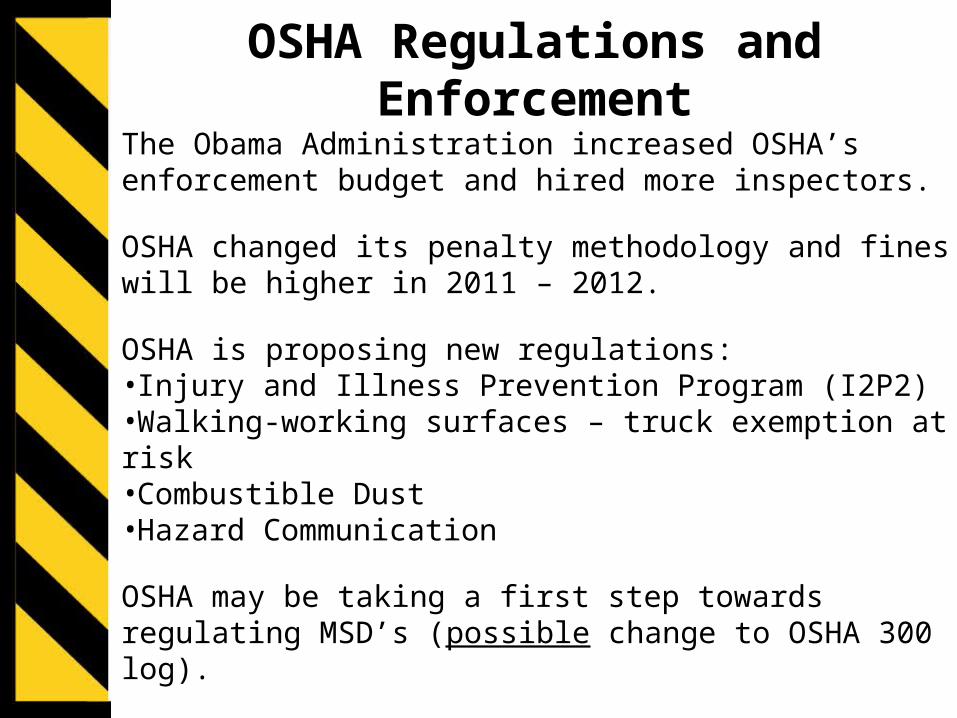
The Obama Administration increased OSHA’s enforcement budget and hired more inspectors.
OSHA changed its penalty methodology and fines will be higher in 2011 – 2012.
OSHA is proposing new regulations: •Injury and Illness Prevention Program (I2P2)•Walking-working surfaces – truck exemption at risk•Combustible Dust•Hazard Communication
OSHA may be taking a first step towards regulating MSD’s (possible change to OSHA 300 log).
DOT Issues – CSA
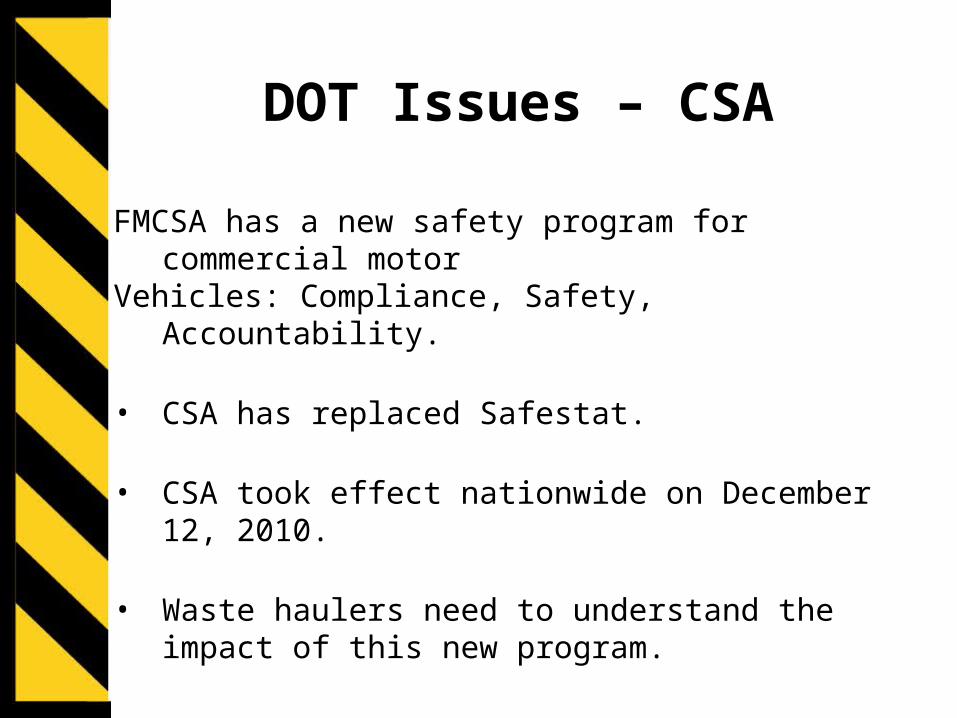
FMCSA has a new safety program for commercial motorVehicles: Compliance, Safety, Accountability.
• CSA has replaced Safestat.
• CSA took effect nationwide on December 12, 2010.
• Waste haulers need to understand the impact of this new program.

CSA
FMCSA is using roadside inspection and crash data tocalculate safety performance using seven (7) “BASICs”(Behavioral Analysis and Safety ImprovementCategories).
1. Unsafe Driving – speeding, reckless driving2. Fatigued Driving – HOS violations3. Driver Fitness – lacks valid CDL4. Controlled Substance/Alcohol5. Vehicle Maintenance – brakes, lights, etc.6. Cargo Related – load securement 7. Crash History – frequency and severity

CSA
BASICs include past 24 months of data with greatestemphasis on most recent six months.
Carriers are being evaluated against other carriers of similar size.
NSWMA sent letter to FMCSA raising concerns over theCrash BASIC – all “crashes” are weighted equally, whichis a problem for an industry with thousands of cars rear-ending its trucks each year.
Overweights may be problematic – NSWMA assessingwhether overweight trucks “cause accidents.”

CSA
What should you be doing?
1. Understand how BASICs works and FMCSA’s methodology.
2. Make sure your drivers are aware of FMCSA rules (hours of service, overweight, cargo securement, etc,)
3. Review your CSA data and contest not at fault accidents.
More info at www.csa.fmcsa.dot.gov.

Other DOT Issues
Reducing distracted driving is a top DOT priority:
• Texting Ban for CDL Drivers – Up to $2,750 fine.• Proposed Hand Held Cell Phone Ban.
FMCSA Pre-Employment Screening Program
• $10 for driver history and annual subscription fee.
Hours of Service – Revised HOS rules – OctoberTruck Weights – Possible Congressional Relief?
Sleep Apnea – NTSB letter to DOT• Bus crashes may force action.

Improving Your Safety Program
Where do you start?
• Identify Goals and Objectives
− Determine your safety problem areas. How? Look at your data!
* OSHA or injury logs* Loss reports – insurance company* Accident reports* Workers comp data

Solid Waste Safety – The Bottom Line
• There is no magic solution.
• Identify principal causes and address them.
• Successful employers are focusing on employee behavior.
• The goal is continued improvement.
• Don’t wait until an accident happens.
EIA and NSWMA want to help you reduce fatalities, accidents, injuries and claims.
Solid Waste Safety – Resources
• EIA/NSWMA/WASTEC
– Safety Monday
– ANSI Standards
– Slow Down to Get Around
– Be Safe Be Proud Safety Videos
– EIA Safety Manual (revision in early 2012)
– Driver of the Year Program
– Concorde (drug/alcohol testing)
• OSHA (www.osha.gov), DLI (www.lni.wa.gov/safety) and DOT (www.dot.gov)
• Insurance company/brokers
• Safety-oriented companies
– www.nswma.org– www.wastec.org