Embed Size (px)
Citation preview
Sagar Cements Ltd
Enhancing investment decisions
Initiating coverage
Explanation of CRISIL Fundamental and Valuation (CFV) matrix
The CFV Matrix (CRISIL Fundamental and Valuation Matrix) addresses the two important analysis of an investment making process –
Analysis of Fundamentals (addressed through Fundamental Grade) and Analysis of Returns (Valuation Grade) The fundamental
grade is assigned on a five-point scale from grade 5 (indicating Excellent fundamentals) to grade 1 (Poor fundamentals) The
valuation grade is assigned on a five-point scale from grade 5 (indicating strong upside from the current market price (CMP)) to
grade 1 (strong downside from the CMP).
CRISIL Fundamental Grade
Assessment CRISIL Valuation Grade
Assessment
5/5 Excellent fundamentals 5/5 Strong upside (>25% from CMP)
4/5 Superior fundamentals 4/5 Upside (10-25% from CMP)
3/5 Good fundamentals 3/5 Align (+-10% from CMP)
2/5 Moderate fundamentals 2/5 Downside (negative 10-25% from CMP)
1/5 Poor fundamentals 1/5 Strong downside (<-25% from CMP)
Analyst Disclosure Each member of the team involved in the preparation of the grading report, hereby affirms that there exists no conflict of interest
that can bias the grading recommendation of the company. Additional Disclosure This report has been sponsored by NSE - Investor Protection Fund Trust (NSEIPFT). Disclaimer: This Exchange-commissioned Report (Report) is based on data publicly available or from sources considered reliable. CRISIL Ltd.
(CRISIL) does not represent that it is accurate or complete and hence, it should not be relied upon as such. The data / Report are
subject to change without any prior notice. Opinions expressed herein are our current opinions as on the date of this Report. Nothing
in this Report constitutes investment, legal, accounting or tax advice or any solicitation, whatsoever. The subscriber / user assumes
the entire risk of any use made of this data / Report. CRISIL especially states that it has no financial liability, whatsoever, to the
subscribers / users of this Report. This Report is for the personal information only of the authorized recipient in India only. This
Report should not be reproduced or redistributed or communicated directly or indirectly in any form to any other person – especially
outside India or published or copied in whole or in part, for any purpose.
CRISIL EQUITIES | 1
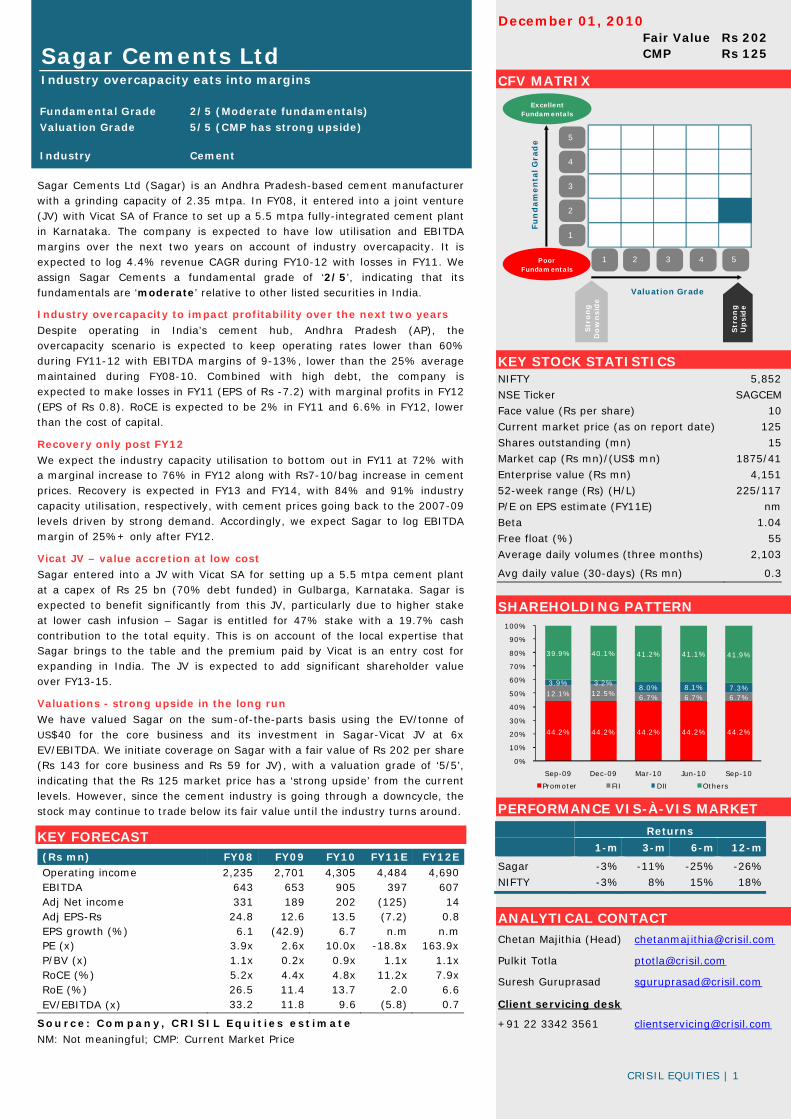
December 01, 2010 Fair Value Rs 202 CMP Rs 125
Fundamental Grade 4/5 (Strong fundamentals) Valuation Grade5/5 (CMP has strong upside)
IndustryInformation technology
Polaris Software Limited
Business momentum remains intact
Fundamental Grade 2/5 (Moderate fundamentals)
Valuation Grade 5/5 (CMP has strong upside) Industry Cement
Sagar Cements Ltd Industry overcapacity eats into margins
Sagar Cements Ltd (Sagar) is an Andhra Pradesh-based cement manufacturer with a grinding capacity of 2.35 mtpa. In FY08, it entered into a joint venture (JV) with Vicat SA of France to set up a 5.5 mtpa fully-integrated cement plant in Karnataka. The company is expected to have low utilisation and EBITDA margins over the next two years on account of industry overcapacity. It is expected to log 4.4% revenue CAGR during FY10-12 with losses in FY11. We assign Sagar Cements a fundamental grade of ‘2/5’, indicating that its fundamentals are ‘moderate’ relative to other listed securities in India.
Industry overcapacity to impact profitability over the next two years
Despite operating in India’s cement hub, Andhra Pradesh (AP), the overcapacity scenario is expected to keep operating rates lower than 60% during FY11-12 with EBITDA margins of 9-13%, lower than the 25% average maintained during FY08-10. Combined with high debt, the company is expected to make losses in FY11 (EPS of Rs -7.2) with marginal profits in FY12 (EPS of Rs 0.8). RoCE is expected to be 2% in FY11 and 6.6% in FY12, lower than the cost of capital.
Recovery only post FY12
We expect the industry capacity utilisation to bottom out in FY11 at 72% with a marginal increase to 76% in FY12 along with Rs7-10/bag increase in cement prices. Recovery is expected in FY13 and FY14, with 84% and 91% industry capacity utilisation, respectively, with cement prices going back to the 2007-09 levels driven by strong demand. Accordingly, we expect Sagar to log EBITDA margin of 25%+ only after FY12.
Vicat JV – value accretion at low cost
Sagar entered into a JV with Vicat SA for setting up a 5.5 mtpa cement plant at a capex of Rs 25 bn (70% debt funded) in Gulbarga, Karnataka. Sagar is expected to benefit significantly from this JV, particularly due to higher stake at lower cash infusion – Sagar is entitled for 47% stake with a 19.7% cash contribution to the total equity. This is on account of the local expertise that Sagar brings to the table and the premium paid by Vicat is an entry cost for expanding in India. The JV is expected to add significant shareholder value over FY13-15.
Valuations - strong upside in the long run
We have valued Sagar on the sum-of-the-parts basis using the EV/tonne of US$40 for the core business and its investment in Sagar-Vicat JV at 6x
EV/EBITDA. We initiate coverage on Sagar with a fair value of Rs 202 per share
(Rs 143 for core business and Rs 59 for JV), with a valuation grade of ‘5/5’, indicating that the Rs 125 market price has a ‘strong upside’ from the current levels. However, since the cement industry is going through a downcycle, the
stock may continue to trade below its fair value until the industry turns around.
KEY FORECAST
(Rs mn) FY08 FY09 FY10 FY11E FY12E Operating income 2,235 2,701 4,305 4,484 4,690 EBITDA 643 653 905 397 607 Adj Net income 331 189 202 (125) 14 Adj EPS-Rs 24.8 12.6 13.5 (7.2) 0.8 EPS growth (%) 6.1 (42.9) 6.7 n.m n.m PE (x) 3.9x 2.6x 10.0x -18.8x 163.9x P/BV (x) 1.1x 0.2x 0.9x 1.1x 1.1x RoCE (%) 5.2x 4.4x 4.8x 11.2x 7.9x RoE (%) 26.5 11.4 13.7 2.0 6.6 EV/EBITDA (x) 33.2 11.8 9.6 (5.8) 0.7
Source: Company, CRISIL Equ it ies est imate
NM: Not meaningful; CMP: Current Market Price
CFV MATRIX
KEY STOCK STATISTICS NIFTY 5,852
NSE Ticker SAGCEM
Face value (Rs per share) 10
Current market price (as on report date) 125
Shares outstanding (mn) 15
Market cap (Rs mn)/(US$ mn) 1875/41
Enterprise value (Rs mn) 4,151
52-week range (Rs) (H/L) 225/117
P/E on EPS estimate (FY11E) nm
Beta 1.04
Free float (%) 55
Average daily volumes (three months) 2,103
Avg daily value (30-days) (Rs mn) 0.3
SHAREHOLDING PATTERN
PERFORMANCE VIS-À-VIS MARKET
Returns
1-m 3-m 6-m 12-m
Sagar -3% -11% -25% -26%
NIFTY -3% 8% 15% 18%
ANALYTICAL CONTACT Chetan Majithia (Head) [email protected]
Pulkit Totla [email protected]
Suresh Guruprasad [email protected]
Client servicing desk
+91 22 3342 3561 [email protected]
1 2 3 4 5
1
2
3
4
5
Valuation Grade
Fu
nd
am
en
tal G
rad
e
Poor Fundamentals
ExcellentFundamentals
Str
on
gD
ow
nsi
de
Str
on
gU
psi
de
44.2% 44.2% 44.2% 44.2% 44.2%
12.1% 12.5% 6.7% 6.7% 6.7%
3.9% 3.2%8.0% 8.1% 7.3%
39.9% 40.1% 41.2% 41.1% 41.9%
0%
10%
20%
30%
40%
50%
60%
70%
80%
90%
100%
Sep-09 Dec-09 Mar-10 Jun-10 Sep-10
Promoter FII DII Others
CRISIL EQUITIES | 2
Sagar Cements Ltd
Table: 1 Sagar Cements: Business environment
Parameter Cement business
Product / service offering Ordinary portland cement, pozzolona portland cement, sulphate resistant cement
Geographic presence Southern India: Mainly caters to Andhra Pradesh. It has started selling in other southern
states and Maharashtra
New joint venture with Vicat of France in Karnataka; will again cater to southern region
Market position Highly fragmented and regional industry, with top five players in South having slightly less
than 50% market share. Sagar Cement has 2.35 mtpa out of total 67 mtpa capacity in the
South
Industry growth expectations 10% for the next five years driven by growth in the IT/ITeS sector and government spending
on different government schemes
Sales growth
(FY07-FY10 – 3-yr CAGR) 28.9%
Sales forecast
(FY10-FY12 – 2-yr CAGR) 4.4%
Demand drivers • Growth in the IT/ITeS sector and government spending on schemes like JNNURM, NREGA,
IAS
Key competitors • Regional players – India Cements, Madras Cements, Ultratech, ACC and Grasim Industries
• Pan India players—Ambuja Cements, Shree Cements, Birla Corp, Binani Cement
Source: Company, CRISIL Equ it ies
CRISIL EQUITIES | 3
Sagar Cements Ltd
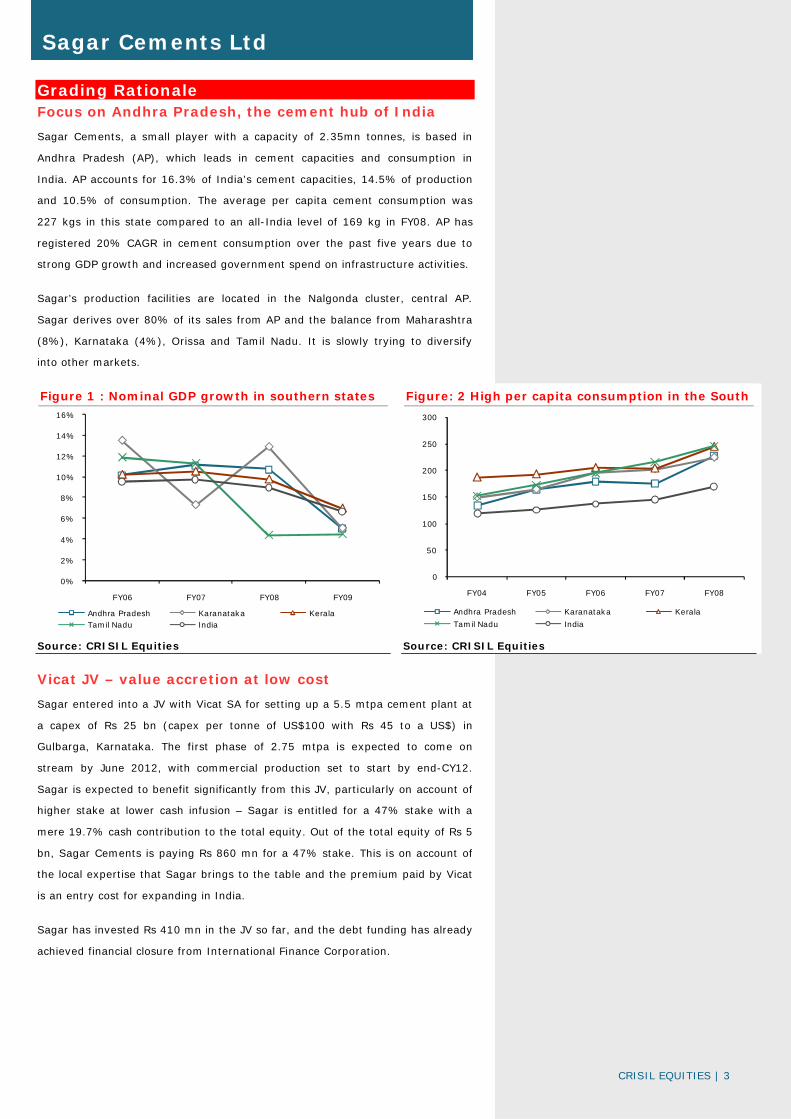
Grading Rationale Focus on Andhra Pradesh, the cement hub of India
Sagar Cements, a small player with a capacity of 2.35mn tonnes, is based in
Andhra Pradesh (AP), which leads in cement capacities and consumption in
India. AP accounts for 16.3% of India’s cement capacities, 14.5% of production
and 10.5% of consumption. The average per capita cement consumption was
227 kgs in this state compared to an all-India level of 169 kg in FY08. AP has
registered 20% CAGR in cement consumption over the past five years due to
strong GDP growth and increased government spend on infrastructure activities.
Sagar’s production facilities are located in the Nalgonda cluster, central AP.
Sagar derives over 80% of its sales from AP and the balance from Maharashtra
(8%), Karnataka (4%), Orissa and Tamil Nadu. It is slowly trying to diversify
into other markets.
Figure 1 : Nominal GDP growth in southern states Figure: 2 High per capita consumption in the South
Source: CRISIL Equities Source: CRISIL Equities
Vicat JV – value accretion at low cost
Sagar entered into a JV with Vicat SA for setting up a 5.5 mtpa cement plant at
a capex of Rs 25 bn (capex per tonne of US$100 with Rs 45 to a US$) in
Gulbarga, Karnataka. The first phase of 2.75 mtpa is expected to come on
stream by June 2012, with commercial production set to start by end-CY12.
Sagar is expected to benefit significantly from this JV, particularly on account of
higher stake at lower cash infusion – Sagar is entitled for a 47% stake with a
mere 19.7% cash contribution to the total equity. Out of the total equity of Rs 5
bn, Sagar Cements is paying Rs 860 mn for a 47% stake. This is on account of
the local expertise that Sagar brings to the table and the premium paid by Vicat
is an entry cost for expanding in India.
Sagar has invested Rs 410 mn in the JV so far, and the debt funding has already
achieved financial closure from International Finance Corporation.
0%
2%
4%
6%
8%
10%
12%
14%
16%
FY06 FY07 FY08 FY09
Andhra Pradesh Karanataka KeralaTamil Nadu India
0
50
100
150
200
250
300
FY04 FY05 FY06 FY07 FY08
Andhra Pradesh Karanataka Kerala
Tamil Nadu India
CRISIL EQUITIES | 4
Sagar Cements Ltd
Table 2: Details of Sagar-Vicat JV Phase I Phase II Total
Cement grinding capacity (mtpa) 2.75 2.75 5.5
Power plant (MW) 40 20 60
Plant commissioning Jun-12 NA
Capex (Rs mn) 16,000 9,000 25,000
Capex per tonne (Rs mn) 5,818 3,273 4,545
Capex per tonne (US$ mn) 130 70 100
Funding
Equity 5,000 2,400 7,400
- Sagar contribution 860 600 1,460
- Vicat contribution 4,140 1,800 5,940
Debt funding 11,000 6,600 17,600
Financial closure achieved Yes No
Sagar stake (%) 47 47 47
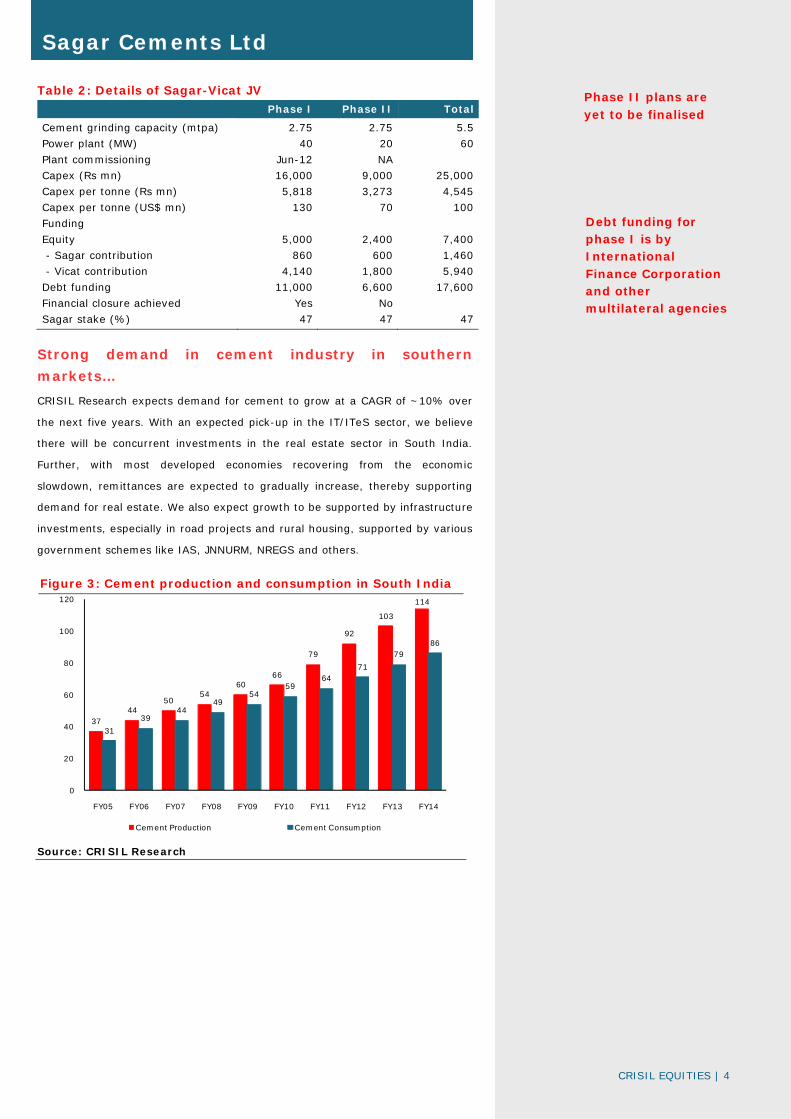
Strong demand in cement industry in southern
markets…
CRISIL Research expects demand for cement to grow at a CAGR of ~10% over
the next five years. With an expected pick-up in the IT/ITeS sector, we believe
there will be concurrent investments in the real estate sector in South India.
Further, with most developed economies recovering from the economic
slowdown, remittances are expected to gradually increase, thereby supporting
demand for real estate. We also expect growth to be supported by infrastructure
investments, especially in road projects and rural housing, supported by various
government schemes like IAS, JNNURM, NREGS and others.
Figure 3: Cement production and consumption in South India
Source: CRISIL Research
3744
5054
6066
79
92
103
114
31
3944
4954
5964
71
7986
0
20
40
60
80
100
120
FY05 FY06 FY07 FY08 FY09 FY10 FY11 FY12 FY13 FY14
Cement Production Cement Consumption
Phase II plans are yet to be finalised
Debt funding for phase I is by International Finance Corporation and other multilateral agencies
CRISIL EQUITIES | 5
Sagar Cements Ltd
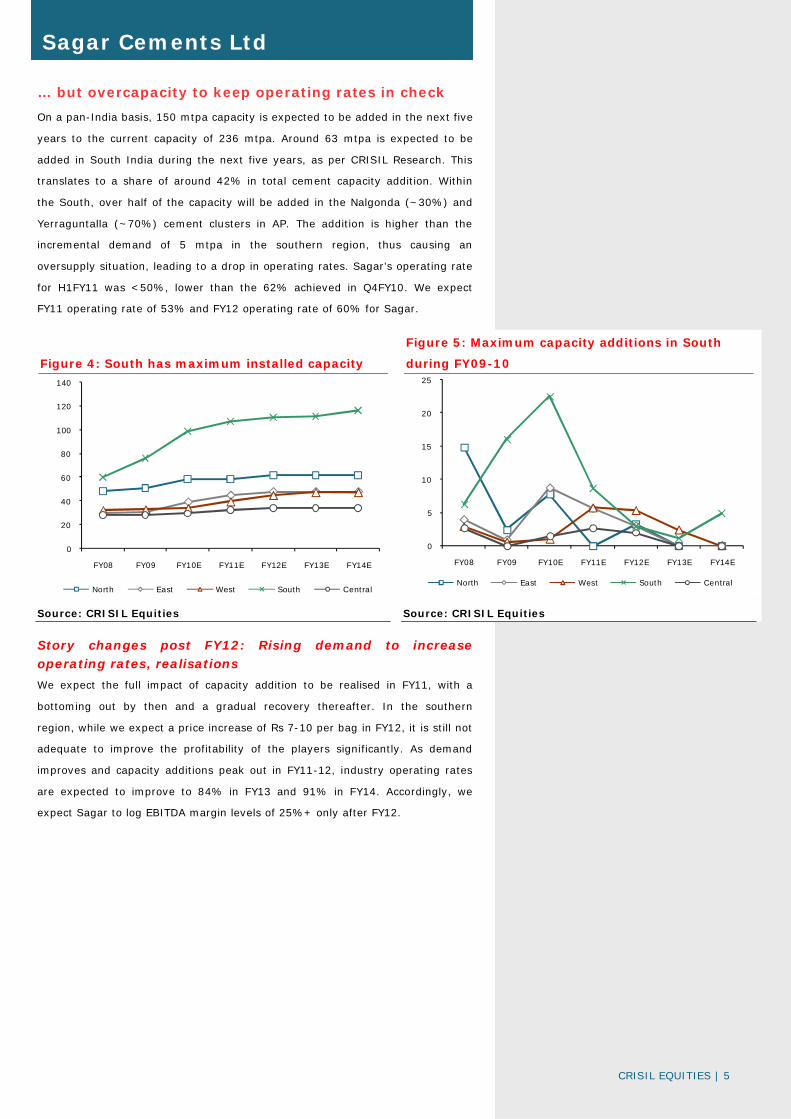
… but overcapacity to keep operating rates in check
On a pan-India basis, 150 mtpa capacity is expected to be added in the next five
years to the current capacity of 236 mtpa. Around 63 mtpa is expected to be
added in South India during the next five years, as per CRISIL Research. This
translates to a share of around 42% in total cement capacity addition. Within
the South, over half of the capacity will be added in the Nalgonda (~30%) and
Yerraguntalla (~70%) cement clusters in AP. The addition is higher than the
incremental demand of 5 mtpa in the southern region, thus causing an
oversupply situation, leading to a drop in operating rates. Sagar’s operating rate
for H1FY11 was <50%, lower than the 62% achieved in Q4FY10. We expect
FY11 operating rate of 53% and FY12 operating rate of 60% for Sagar.
Figure 4: South has maximum installed capacity
Figure 5: Maximum capacity additions in South
during FY09-10
Source: CRISIL Equities Source: CRISIL Equities
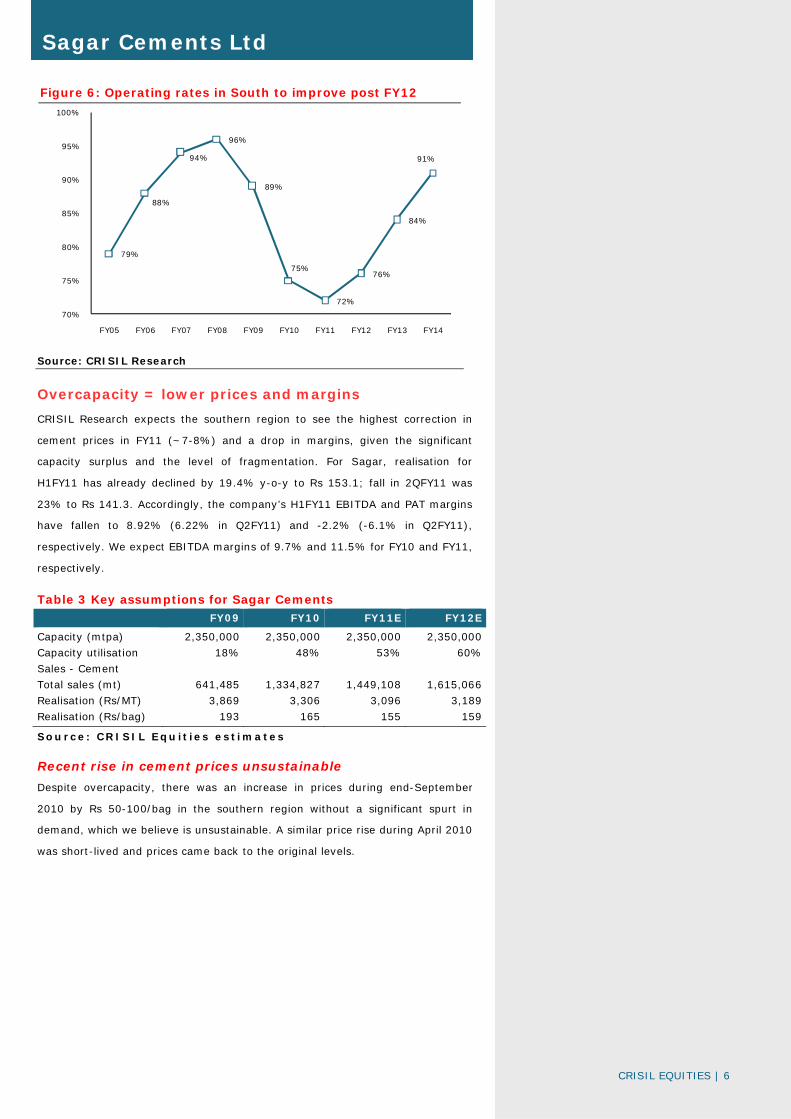
Story changes post FY12: Rising demand to increase operating rates, realisations
We expect the full impact of capacity addition to be realised in FY11, with a
bottoming out by then and a gradual recovery thereafter. In the southern
region, while we expect a price increase of Rs 7-10 per bag in FY12, it is still not
adequate to improve the profitability of the players significantly. As demand
improves and capacity additions peak out in FY11-12, industry operating rates
are expected to improve to 84% in FY13 and 91% in FY14. Accordingly, we
expect Sagar to log EBITDA margin levels of 25%+ only after FY12.
0
20
40
60
80
100
120
140
FY08 FY09 FY10E FY11E FY12E FY13E FY14E
North East West South Central
0
5
10
15
20
25
FY08 FY09 FY10E FY11E FY12E FY13E FY14E
North East West South Central
CRISIL EQUITIES | 6
Sagar Cements Ltd
Figure 6: Operating rates in South to improve post FY12
Source: CRISIL Research
Overcapacity = lower prices and margins
CRISIL Research expects the southern region to see the highest correction in
cement prices in FY11 (~7-8%) and a drop in margins, given the significant
capacity surplus and the level of fragmentation. For Sagar, realisation for
H1FY11 has already declined by 19.4% y-o-y to Rs 153.1; fall in 2QFY11 was
23% to Rs 141.3. Accordingly, the company’s H1FY11 EBITDA and PAT margins
have fallen to 8.92% (6.22% in Q2FY11) and -2.2% (-6.1% in Q2FY11),
respectively. We expect EBITDA margins of 9.7% and 11.5% for FY10 and FY11,
respectively.
Table 3 Key assumptions for Sagar Cements FY09 FY10 FY11E FY12E
Capacity (mtpa) 2,350,000 2,350,000 2,350,000 2,350,000
Capacity utilisation 18% 48% 53% 60%
Sales - Cement
Total sales (mt) 641,485 1,334,827 1,449,108 1,615,066
Realisation (Rs/MT) 3,869 3,306 3,096 3,189
Realisation (Rs/bag) 193 165 155 159
Source: CRISIL Equ it ies estimates
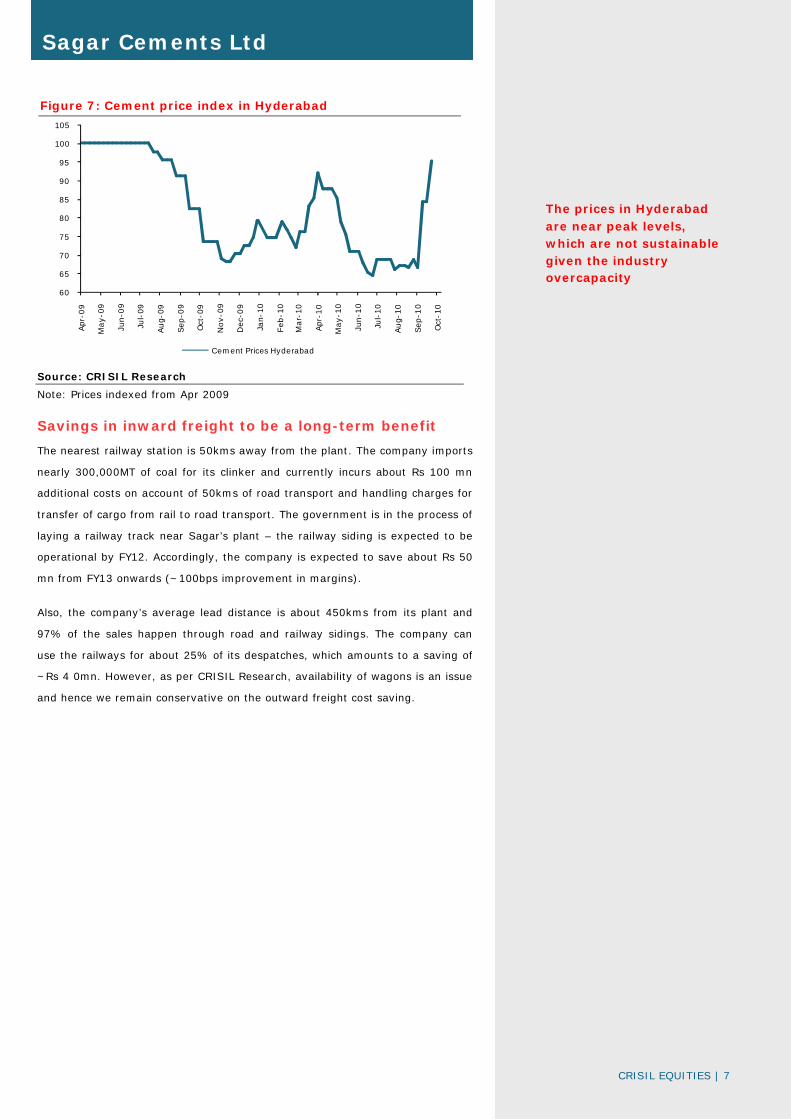
Recent rise in cement prices unsustainable
Despite overcapacity, there was an increase in prices during end-September
2010 by Rs 50-100/bag in the southern region without a significant spurt in
demand, which we believe is unsustainable. A similar price rise during April 2010
was short-lived and prices came back to the original levels.
79%
88%
94%
96%
89%
75%
72%
76%
84%
91%
70%
75%
80%
85%
90%
95%
100%
FY05 FY06 FY07 FY08 FY09 FY10 FY11 FY12 FY13 FY14
CRISIL EQUITIES | 7
Sagar Cements Ltd
Figure 7: Cement price index in Hyderabad
Source: CRISIL Research
Note: Prices indexed from Apr 2009
Savings in inward freight to be a long-term benefit
The nearest railway station is 50kms away from the plant. The company imports
nearly 300,000MT of coal for its clinker and currently incurs about Rs 100 mn
additional costs on account of 50kms of road transport and handling charges for
transfer of cargo from rail to road transport. The government is in the process of
laying a railway track near Sagar’s plant – the railway siding is expected to be
operational by FY12. Accordingly, the company is expected to save about Rs 50
mn from FY13 onwards (~100bps improvement in margins).
Also, the company’s average lead distance is about 450kms from its plant and
97% of the sales happen through road and railway sidings. The company can
use the railways for about 25% of its despatches, which amounts to a saving of
~Rs 4 0mn. However, as per CRISIL Research, availability of wagons is an issue
and hence we remain conservative on the outward freight cost saving.
60
65
70
75
80
85
90
95
100
105
Apr
-09
May-
09
Jun-0
9
Jul-
09
Aug-
09
Sep
-09
Oct
-09
Nov-
09
Dec
-09
Jan-
10
Feb
-10
Mar-
10
Apr
-10
May-
10
Jun-1
0
Jul-
10
Aug-
10
Sep
-10
Oct
-10
Cement Prices Hyderabad
The prices in Hyderabad are near peak levels, which are not sustainable given the industry overcapacity
CRISIL EQUITIES | 8
Sagar Cements Ltd
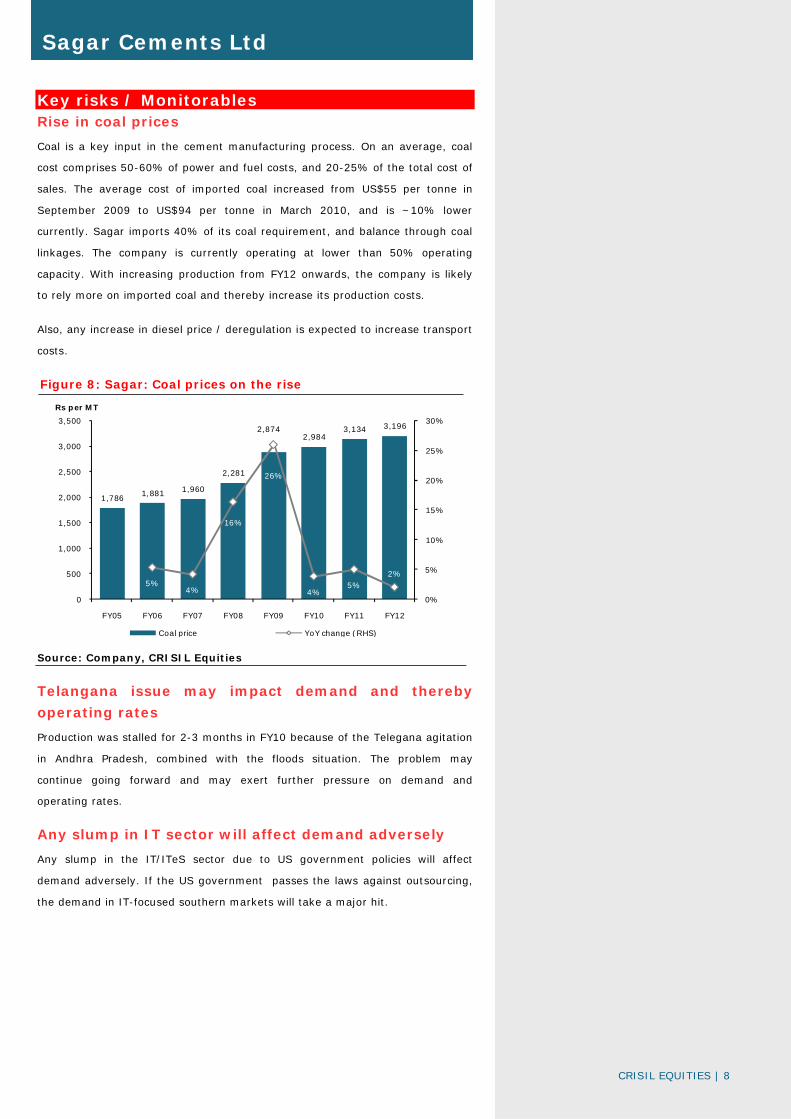
Key risks / Monitorables Rise in coal prices
Coal is a key input in the cement manufacturing process. On an average, coal
cost comprises 50-60% of power and fuel costs, and 20-25% of the total cost of
sales. The average cost of imported coal increased from US$55 per tonne in
September 2009 to US$94 per tonne in March 2010, and is ~10% lower
currently. Sagar imports 40% of its coal requirement, and balance through coal
linkages. The company is currently operating at lower than 50% operating
capacity. With increasing production from FY12 onwards, the company is likely
to rely more on imported coal and thereby increase its production costs.
Also, any increase in diesel price / deregulation is expected to increase transport
costs.
Figure 8: Sagar: Coal prices on the rise
Source: Company, CRISIL Equities
Telangana issue may impact demand and thereby
operating rates
Production was stalled for 2-3 months in FY10 because of the Telegana agitation
in Andhra Pradesh, combined with the floods situation. The problem may
continue going forward and may exert further pressure on demand and
operating rates.
Any slump in IT sector will affect demand adversely
Any slump in the IT/ITeS sector due to US government policies will affect
demand adversely. If the US government passes the laws against outsourcing,
the demand in IT-focused southern markets will take a major hit.
1,786 1,881 1,960
2,281
2,8742,984
3,134 3,196
5%4%
16%
26%
4%5%
2%
0%
5%
10%
15%
20%
25%
30%
0
500
1,000
1,500
2,000
2,500
3,000
3,500
FY05 FY06 FY07 FY08 FY09 FY10 FY11 FY12
Rs per MT
Coal price YoY change (RHS)
CRISIL EQUITIES | 9
Sagar Cements Ltd
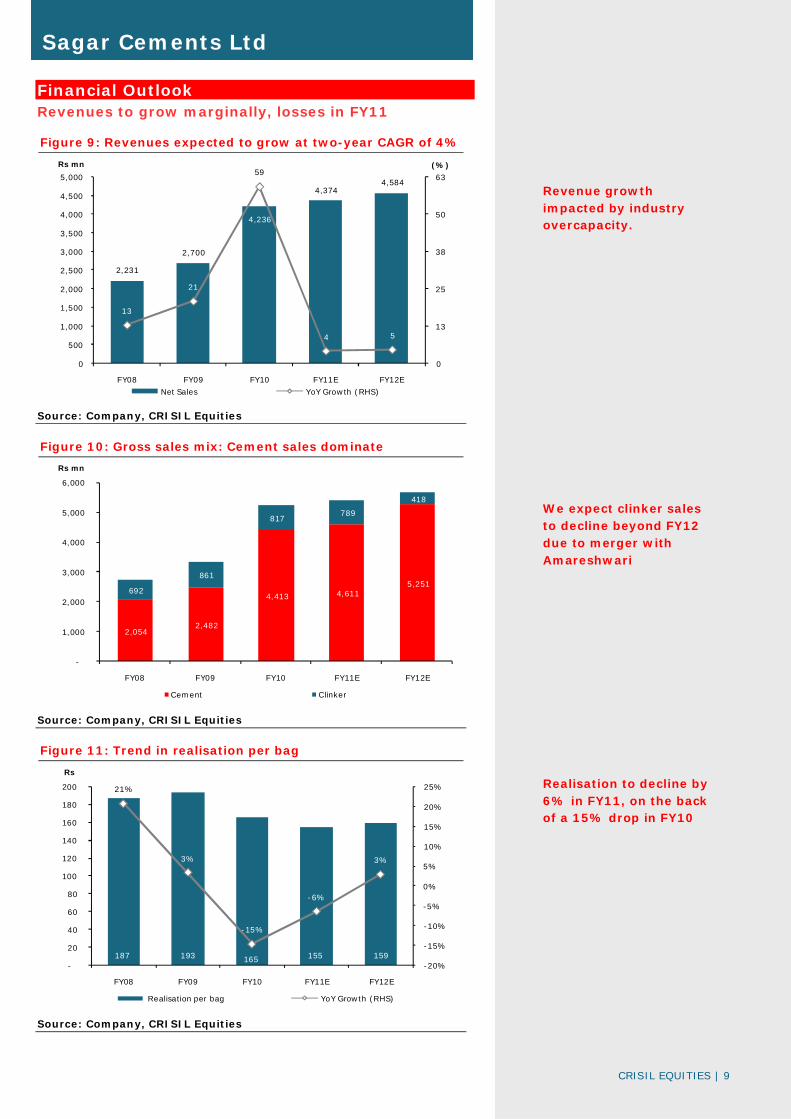
Financial Outlook Revenues to grow marginally, losses in FY11
Figure 9: Revenues expected to grow at two-year CAGR of 4%
Source: Company, CRISIL Equities
Figure 10: Gross sales mix: Cement sales dominate
Source: Company, CRISIL Equities
Figure 11: Trend in realisation per bag
Source: Company, CRISIL Equities
2,231
2,700
4,236
4,3744,584
13
21
59
4 5
0
13
25
38
50
63
0
500
1,000
1,500
2,000
2,500
3,000
3,500
4,000
4,500
5,000
FY08 FY09 FY10 FY11E FY12E
(%)Rs mn
Net Sales YoY Growth (RHS)
2,054 2,482
4,413 4,611 5,251
692
861
817 789
418
-
1,000
2,000
3,000
4,000
5,000
6,000
FY08 FY09 FY10 FY11E FY12E
Rs mn
Cement Clinker
187 193 165 155 159
21%
3%
-15%
-6%
3%
-20%
-15%
-10%
-5%
0%
5%
10%
15%
20%
25%
-
20
40
60
80
100
120
140
160
180
200
FY08 FY09 FY10 FY11E FY12E
Rs
Realisation per bag YoY Growth (RHS)
Realisation to decline by 6% in FY11, on the back of a 15% drop in FY10
Revenue growth impacted by industry overcapacity.
We expect clinker sales to decline beyond FY12 due to merger with Amareshwari
CRISIL EQUITIES | 10
Sagar Cements Ltd
Figure12: EBITDA margin trend
Source: Company, CRISIL Equities
Figure 13: PAT losses in FY11
Source: Company, CRISIL Equities
Figure 14: Debt and interest coverage
Source: Company, CRISIL Equities
187 193 165 155 159
29%
24%
21%
9%
13%
0%
5%
10%
15%
20%
25%
30%
35%
-
20
40
60
80
100
120
140
160
180
200
FY08 FY09 FY10 FY11E FY12E
Rs
Realisation per bag EBITDA margin (RHS)
331 189 202 -125 14
33
12
10
-61
26
11
14
2
7
-10
-5
0
5
10
15
20
25
30
35
40
-200
-150
-100
-50
0
50
100
150
200
250
300
350
400
FY08 FY09 FY10 FY11E FY12E
(%)Rs bn
Net Profit (LHS) ROE (RHS) ROCE (RHS)
2,079 2,510 2,296 2,110 2,510
2.7
2.1
0.3
1.1
0.0
0.5
1.0
1.5
2.0
2.5
3.0
0
500
1,000
1,500
2,000
2,500
3,000
FY08 FY09 FY10 FY11E FY12E
Rs bn
Debt Net-Debt/Equity (RHS)
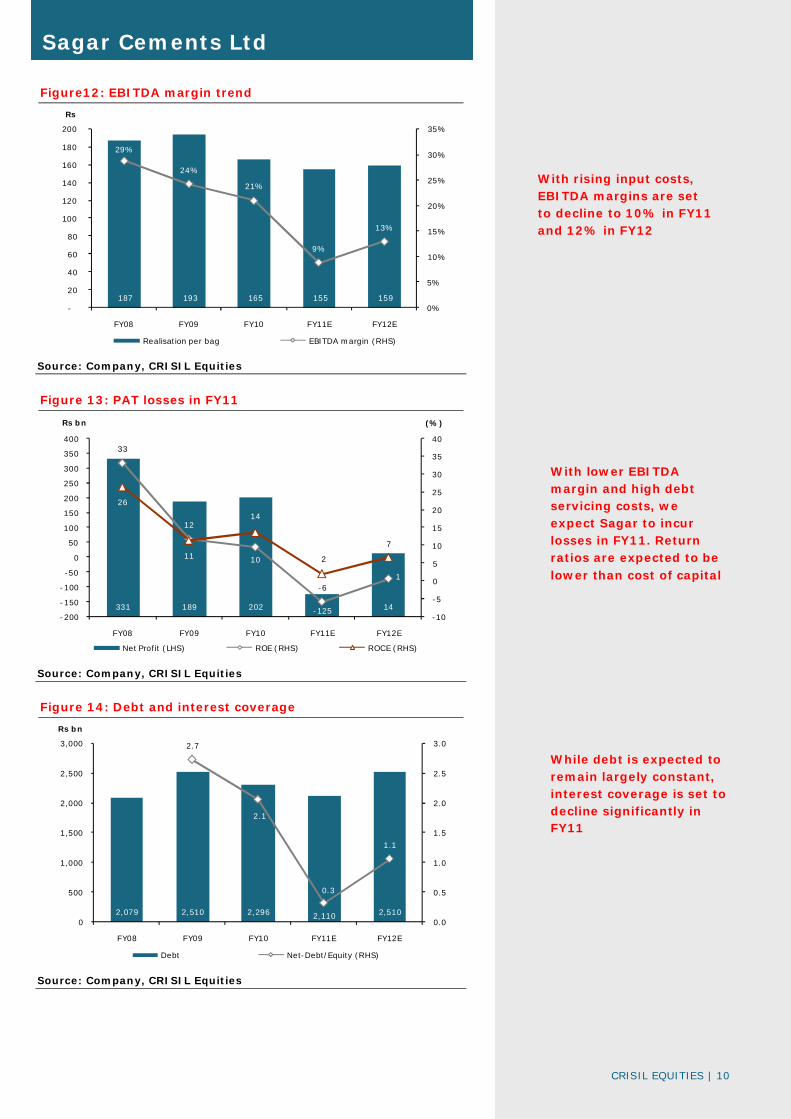
With rising input costs, EBITDA margins are set to decline to 10% in FY11 and 12% in FY12
With lower EBITDA margin and high debt servicing costs, we expect Sagar to incur losses in FY11. Return ratios are expected to be lower than cost of capital
While debt is expected to remain largely constant, interest coverage is set to decline significantly in FY11
CRISIL EQUITIES | 11
Sagar Cements Ltd
Management Overview CRISIL's fundamental grading methodology includes a broad assessment of
management quality, apart from other key factors such as industry and business
prospects, and financial performance.
Highly qualified management with good industry
experience
Sagar Cements has a highly qualified and experienced management headed by
Mr S.Veera Reddy, CEO and Managing Director, who was the co-promoter of the
Priyadarshini Group. He joined the board as Managing Director in 1991. Mr
S.Veera Reddy is supported by S. Anand Reddy and S. Sreekanth Reddy, part of
the promoter family. Mr. Sreekanth Reddy, whole-time promoter director of the
company has a PG Diploma in Cement Technology and Mr. Anand Reddy, the
executive director of the company, is an MBBS. They both have cement industry
experience of more than 15 years.
Management has expanded capacities on a slow pace
until recently
Sagar’s capacity was expanded slowly from .2 mtpa in 1992 to 0.3mtpa in FY08.
However, in FY09, it expanded its capacity multi-fold to 2.35 MTPA. In FY08,
management also signed a JV with VICAT SA to set up a 5.5 MTPA plant in
Karnataka. This plant, once operational, will make the company one of the mid-
sized players in South India.
Second line of management
Based on our interactions, we believe the company’s second line is reasonably
experienced. Key managerial personnel have more than 10 years of experience
in their respective fields.
CRISIL EQUITIES | 12
Sagar Cements Ltd
Corporate Governance CRISIL’s fundamental grading methodology includes a broad assessment of
corporate governance and management quality, apart from other key factors
such as industry and business prospects, and financial performance. In this
context, CRISIL Equities analyses the shareholding structure, board composition,
typical board processes, disclosure standards and related-party transactions.
Any qualifications by regulators or auditors also serve as useful inputs while
assessing a company’s corporate governance.
Overall, corporate governance at Sagar Cements meets the regulatory
requirements.
Board composition
Sagar’s board is headed by O.Swaminatha Reddy, an independent director and
consists of nine members, of whom three are independent directors, which is in
line with the requirements under Clause 49 of SEBI’s listing guidelines.
Disclosure levels and board’s processes
The company’s quality of disclosure can be considered good judged by the level
of information and details furnished in the annual report websites and other
publicly available data. The company also conducts analyst conference calls on a
quarterly basis. The company has all the necessary committees – audit,
remuneration, and investment and investor grievance - in place to support
corporate governance practices. The audit committee is chaired by an
independent director, O.Swaminatha Reddy, ex-chairman of Andhra Bank and
AP State Finance Corporation. The committee meets at timely and regular
intervals.
Table 4: Group company transactions
Group
company
Nature of
transaction Comments
Amareswari
Cements
Sale of Clinker and
purchase of cement
Amareswari is expected to be
merged with Sagar in FY11. It has a
cement-grinding capacity of 0.35mn
and 43mn tonnes of limestone
reserves
Panchavati
Polyfibres
Purchase of bags for
packaging of cement
-
CRISIL EQUITIES | 13
Sagar Cements Ltd
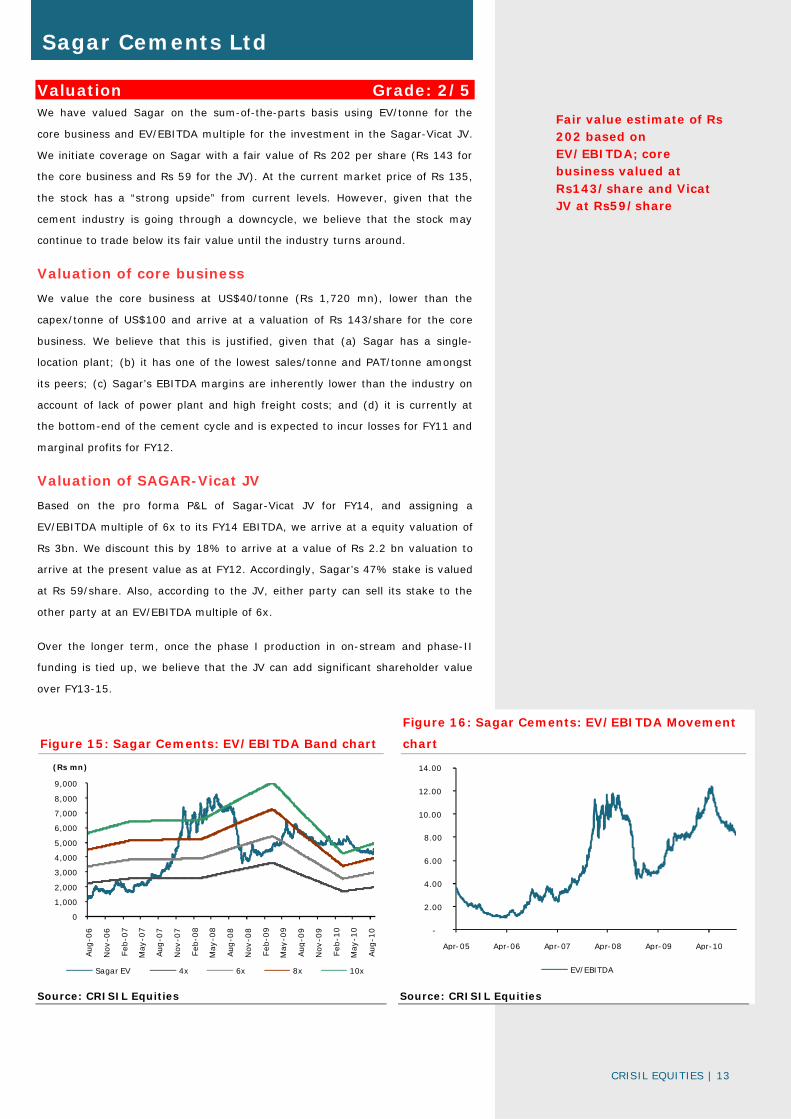
Valuation Grade: 2/5 We have valued Sagar on the sum-of-the-parts basis using EV/tonne for the
core business and EV/EBITDA multiple for the investment in the Sagar-Vicat JV.
We initiate coverage on Sagar with a fair value of Rs 202 per share (Rs 143 for
the core business and Rs 59 for the JV). At the current market price of Rs 135,
the stock has a “strong upside” from current levels. However, given that the
cement industry is going through a downcycle, we believe that the stock may
continue to trade below its fair value until the industry turns around.
Valuation of core business
We value the core business at US$40/tonne (Rs 1,720 mn), lower than the
capex/tonne of US$100 and arrive at a valuation of Rs 143/share for the core
business. We believe that this is justified, given that (a) Sagar has a single-
location plant; (b) it has one of the lowest sales/tonne and PAT/tonne amongst
its peers; (c) Sagar’s EBITDA margins are inherently lower than the industry on
account of lack of power plant and high freight costs; and (d) it is currently at
the bottom-end of the cement cycle and is expected to incur losses for FY11 and
marginal profits for FY12.
Valuation of SAGAR-Vicat JV
Based on the pro forma P&L of Sagar-Vicat JV for FY14, and assigning a
EV/EBITDA multiple of 6x to its FY14 EBITDA, we arrive at a equity valuation of
Rs 3bn. We discount this by 18% to arrive at a value of Rs 2.2 bn valuation to
arrive at the present value as at FY12. Accordingly, Sagar’s 47% stake is valued
at Rs 59/share. Also, according to the JV, either party can sell its stake to the
other party at an EV/EBITDA multiple of 6x.
Over the longer term, once the phase I production in on-stream and phase-II
funding is tied up, we believe that the JV can add significant shareholder value
over FY13-15.
Figure 15: Sagar Cements: EV/EBITDA Band chart
Figure 16: Sagar Cements: EV/EBITDA Movement
chart
Source: CRISIL Equities Source: CRISIL Equities
0
1,000
2,000
3,000
4,000
5,000
6,000
7,000
8,000
9,000
Aug
-06
Nov
-06
Feb
-07
Ma y
-07
Aug
-07
Nov
-07
Feb
-08
May
-08
Aug
-08
Nov
-08
Feb
-09
Ma y
-09
Au g
-09
Nov
-09
Feb
-10
May
-10
Aug
-10
(Rs mn)
Sagar EV 4x 6x 8x 10x
-
2.00
4.00
6.00
8.00
10.00
12.00
14.00
Apr-05 Apr-06 Apr-07 Apr-08 Apr-09 Apr-10
EV/EBITDA
Fair value estimate of Rs 202 based on EV/EBITDA; core business valued at Rs143/share and Vicat JV at Rs59/share
CRISIL EQUITIES | 14
Sagar Cements Ltd
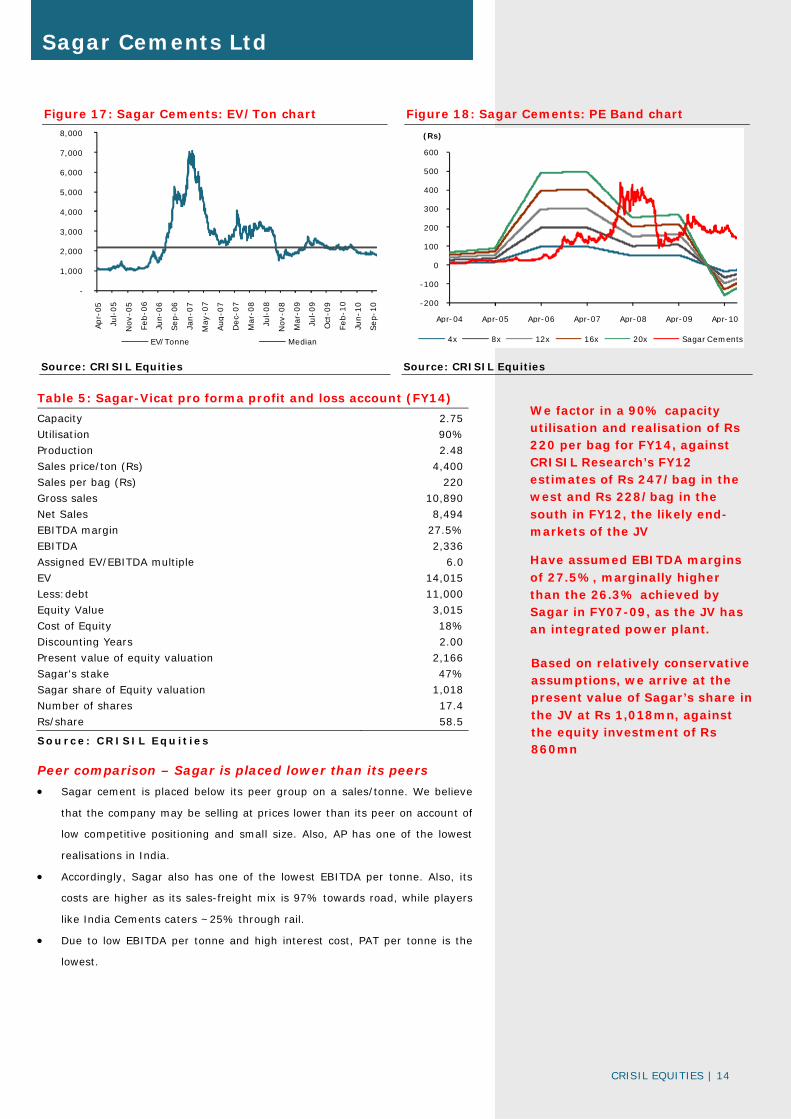
Figure 17: Sagar Cements: EV/Ton chart Figure 18: Sagar Cements: PE Band chart
Source: CRISIL Equities Source: CRISIL Equities
Table 5: Sagar-Vicat pro forma profit and loss account (FY14)
Capacity 2.75
Utilisation 90%
Production 2.48
Sales price/ton (Rs) 4,400
Sales per bag (Rs) 220
Gross sales 10,890
Net Sales 8,494
EBITDA margin 27.5%
EBITDA 2,336
Assigned EV/EBITDA multiple 6.0
EV 14,015
Less:debt 11,000
Equity Value 3,015
Cost of Equity 18%
Discounting Years 2.00
Present value of equity valuation 2,166
Sagar's stake 47%
Sagar share of Equity valuation 1,018
Number of shares 17.4
Rs/share 58.5
Source: CRISIL Equ it ies
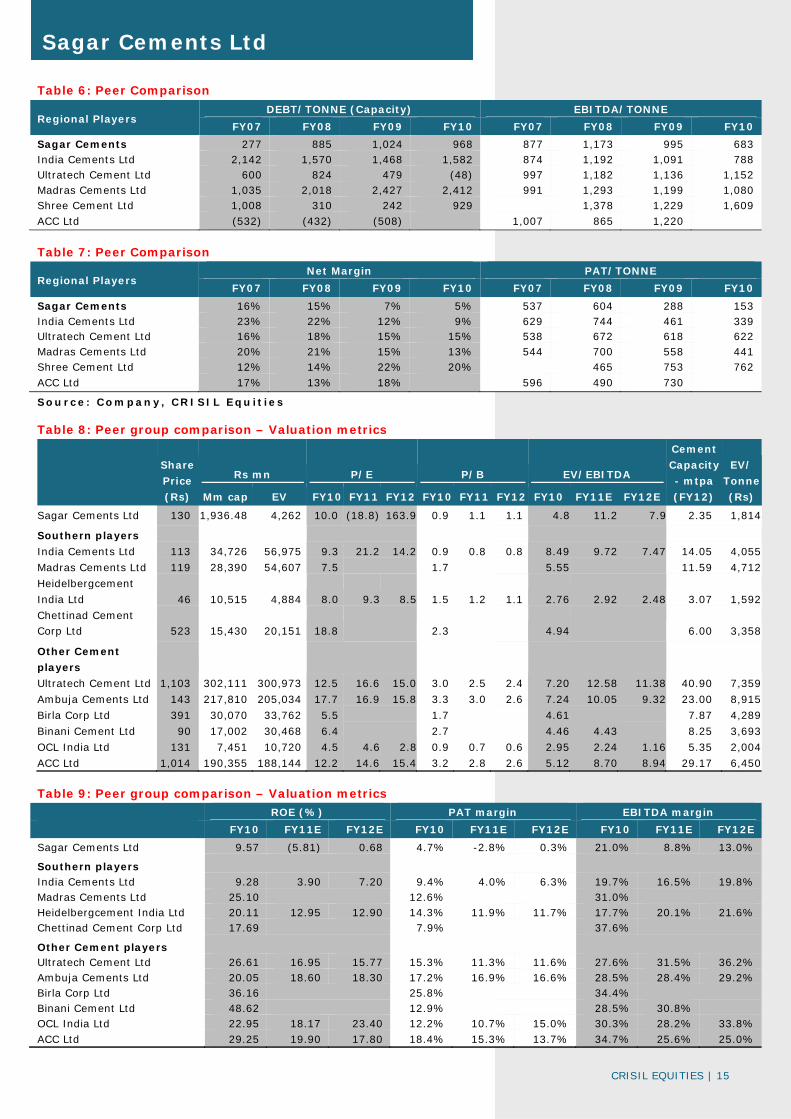
Peer comparison – Sagar is placed lower than its peers
• Sagar cement is placed below its peer group on a sales/tonne. We believe
that the company may be selling at prices lower than its peer on account of
low competitive positioning and small size. Also, AP has one of the lowest
realisations in India.
• Accordingly, Sagar also has one of the lowest EBITDA per tonne. Also, its
costs are higher as its sales-freight mix is 97% towards road, while players
like India Cements caters ~25% through rail.
• Due to low EBITDA per tonne and high interest cost, PAT per tonne is the
lowest.
-
1,000
2,000
3,000
4,000
5,000
6,000
7,000
8,000
Apr-
05
Jul-
05
Nov
-05
Feb-0
6
Jun-
06
Sep-
06
Jan-0
7
May
-07
Au g
-07
Dec-
07
Mar
-08
Jul-
08
Nov
-08
Mar
-09
Jul-
09
Oct
-09
Feb-1
0
Jun-
10
Sep-
10
EV/Tonne Median
-200
-100
0
100
200
300
400
500
600
Apr-04 Apr-05 Apr-06 Apr-07 Apr-08 Apr-09 Apr-10
(Rs)
4x 8x 12x 16x 20x Sagar Cements
We factor in a 90% capacity utilisation and realisation of Rs 220 per bag for FY14, against CRISIL Research’s FY12 estimates of Rs 247/bag in the west and Rs 228/bag in the south in FY12, the likely end-markets of the JV
Have assumed EBITDA margins of 27.5%, marginally higher than the 26.3% achieved by Sagar in FY07-09, as the JV has an integrated power plant.
Based on relatively conservative assumptions, we arrive at the present value of Sagar’s share in the JV at Rs 1,018mn, against the equity investment of Rs 860mn
CRISIL EQUITIES | 15
Sagar Cements Ltd
Table 6: Peer Comparison
Regional Players DEBT/TONNE (Capacity) EBITDA/TONNE
FY07 FY08 FY09 FY10 FY07 FY08 FY09 FY10
Sagar Cements 277 885 1,024 968 877 1,173 995 683 India Cements Ltd 2,142 1,570 1,468 1,582 874 1,192 1,091 788 Ultratech Cement Ltd 600 824 479 (48) 997 1,182 1,136 1,152 Madras Cements Ltd 1,035 2,018 2,427 2,412 991 1,293 1,199 1,080 Shree Cement Ltd 1,008 310 242 929 1,378 1,229 1,609 ACC Ltd (532) (432) (508) 1,007 865 1,220
Table 7: Peer Comparison
Regional Players Net Margin PAT/TONNE
FY07 FY08 FY09 FY10 FY07 FY08 FY09 FY10
Sagar Cements 16% 15% 7% 5% 537 604 288 153 India Cements Ltd 23% 22% 12% 9% 629 744 461 339 Ultratech Cement Ltd 16% 18% 15% 15% 538 672 618 622 Madras Cements Ltd 20% 21% 15% 13% 544 700 558 441 Shree Cement Ltd 12% 14% 22% 20% 465 753 762 ACC Ltd 17% 13% 18% 596 490 730
Source: Company, CRISIL Equ it ies
Table 8: Peer group comparison – Valuation metrics
Share
Price
(Rs)
Rs mn P/E P/B EV/EBITDA
Cement
Capacity
- mtpa
(FY12)
EV/
Tonne
(Rs) Mm cap EV FY10 FY11 FY12 FY10 FY11 FY12 FY10 FY11E FY12E
Sagar Cements Ltd 130 1,936.48 4,262 10.0 (18.8) 163.9 0.9 1.1 1.1 4.8 11.2 7.9 2.35 1,814
Southern players
India Cements Ltd 113 34,726 56,975 9.3 21.2 14.2 0.9 0.8 0.8 8.49 9.72 7.47 14.05 4,055
Madras Cements Ltd 119 28,390 54,607 7.5 1.7 5.55 11.59 4,712
Heidelbergcement
India Ltd 46 10,515 4,884 8.0 9.3 8.5 1.5 1.2 1.1 2.76 2.92 2.48 3.07 1,592
Chettinad Cement Corp Ltd 523 15,430 20,151 18.8 2.3 4.94 6.00 3,358
Other Cement
players
Ultratech Cement Ltd 1,103 302,111 300,973 12.5 16.6 15.0 3.0 2.5 2.4 7.20 12.58 11.38 40.90 7,359
Ambuja Cements Ltd 143 217,810 205,034 17.7 16.9 15.8 3.3 3.0 2.6 7.24 10.05 9.32 23.00 8,915
Birla Corp Ltd 391 30,070 33,762 5.5 1.7 4.61 7.87 4,289
Binani Cement Ltd 90 17,002 30,468 6.4 2.7 4.46 4.43 8.25 3,693
OCL India Ltd 131 7,451 10,720 4.5 4.6 2.8 0.9 0.7 0.6 2.95 2.24 1.16 5.35 2,004
ACC Ltd 1,014 190,355 188,144 12.2 14.6 15.4 3.2 2.8 2.6 5.12 8.70 8.94 29.17 6,450
Table 9: Peer group comparison – Valuation metrics
ROE (%) PAT margin EBITDA margin
FY10 FY11E FY12E FY10 FY11E FY12E FY10 FY11E FY12E
Sagar Cements Ltd 9.57 (5.81) 0.68 4.7% -2.8% 0.3% 21.0% 8.8% 13.0%
Southern players India Cements Ltd 9.28 3.90 7.20 9.4% 4.0% 6.3% 19.7% 16.5% 19.8% Madras Cements Ltd 25.10 12.6% 31.0% Heidelbergcement India Ltd 20.11 12.95 12.90 14.3% 11.9% 11.7% 17.7% 20.1% 21.6% Chettinad Cement Corp Ltd 17.69 7.9% 37.6%
Other Cement players Ultratech Cement Ltd 26.61 16.95 15.77 15.3% 11.3% 11.6% 27.6% 31.5% 36.2% Ambuja Cements Ltd 20.05 18.60 18.30 17.2% 16.9% 16.6% 28.5% 28.4% 29.2% Birla Corp Ltd 36.16 25.8% 34.4% Binani Cement Ltd 48.62 12.9% 28.5% 30.8% OCL India Ltd 22.95 18.17 23.40 12.2% 10.7% 15.0% 30.3% 28.2% 33.8% ACC Ltd 29.25 19.90 17.80 18.4% 15.3% 13.7% 34.7% 25.6% 25.0%
CRISIL EQUITIES | 16
Sagar Cements Ltd
Company Overview Sagar Group is a Hyderabad-based group mainly into cement manufacturing.
Sagar Cement Ltd, the flagship company of the group, was founded in 1981 by
Mr. Muni Krishna, Mr. J. Rama Rao and Mr. Butchaiah as a mini cement plant in
Andhra Pradesh with a clinker and cement capacity of 66000 tonnes per annum.
It was then a part of the Priyadarshini Cement Group which is also the parent
group for Rain Commodities. The present Sagar Group split from the
Priyadarshini Group and became an individual group in 1992. After 1992, it
gradually increased its capacity to the present 2.1 mtpa clinker and 2.35 mtpa
cement capacity.
Table 10: History and major developments
1981 Incorporated as Sagar Cements on 15 January
1992 Sagar Group split from Priyadarshini group.
2007 Blackstone group picked up stake in Sagar Cements
2008 VICAT Sagar Pvt Ltd, a 53:47 JV between Vicat SA and Sagar Cements finalized
2008 Expanded cement capacity to 2.35 mtpa
2008 Belgium-based Ackermans & Van Haaren (AvH) picked up 14.99% stake in Sagar Cements.
Business
Sagar Cements is located in the Nalgonda cement cluster of Andhra Pradesh.
The Nalgonda cluster is strategically located for producing cement. It has
availability for limestone, coal and gypsum, the main raw materials required to
produce cement. Sagar Cements has proven reserves of around 700 million
tonnes of limestone. The company relies on the state grid for its power
requirements. The company has not faced any power issues so far. As per
CRISIL Research, AP’s power deficit is expected to decline from 8% in FY11 to a
surplus of 1% in FY15. Accordingly, the company is not expected to face any
issue of unavailability of power.
As a part of the promoter-holding restructuring, Sagar Cement is merging
Amareswari and divesting the power business. Sagar Power, a hydel and wind
power company, with revenues of Rs 74 mn is expected to be divested during
FY11.
Amareswari merger
Sagar Cements has announced the merger of its group company Amareswari
Cements with itself. Amareswari Cements, a sick company, was acquired by the
promoters of Sagar Cements about five years ago. It has a grinding capacity of
0.35 mtpa and 43 MT of proven limestone reserves. Amareswari also has all
necessary approvals for 1.5 MTPA capacity extension. As per the management,
the merger of Amareswari Cements will add Rs 40-50 mn to the company’s
EBITDA. As per the valuation from Delloite and KPMG, the determined exchange
ratio for the said merger is 10 equity shares of Rs. 10/- each of Sagar Cements
for every 14 equity shares of Rs.10/- held in Amareswari Cements. After the
extinguishment of 900000 shares of Sagar held by Amareswari, there will be a
net addition of 2.3 mn shares in Sagar Cements. We have accounted for the
merger to be effective from FY12 onwards.
CRISIL EQUITIES | 17
Sagar Cements Ltd
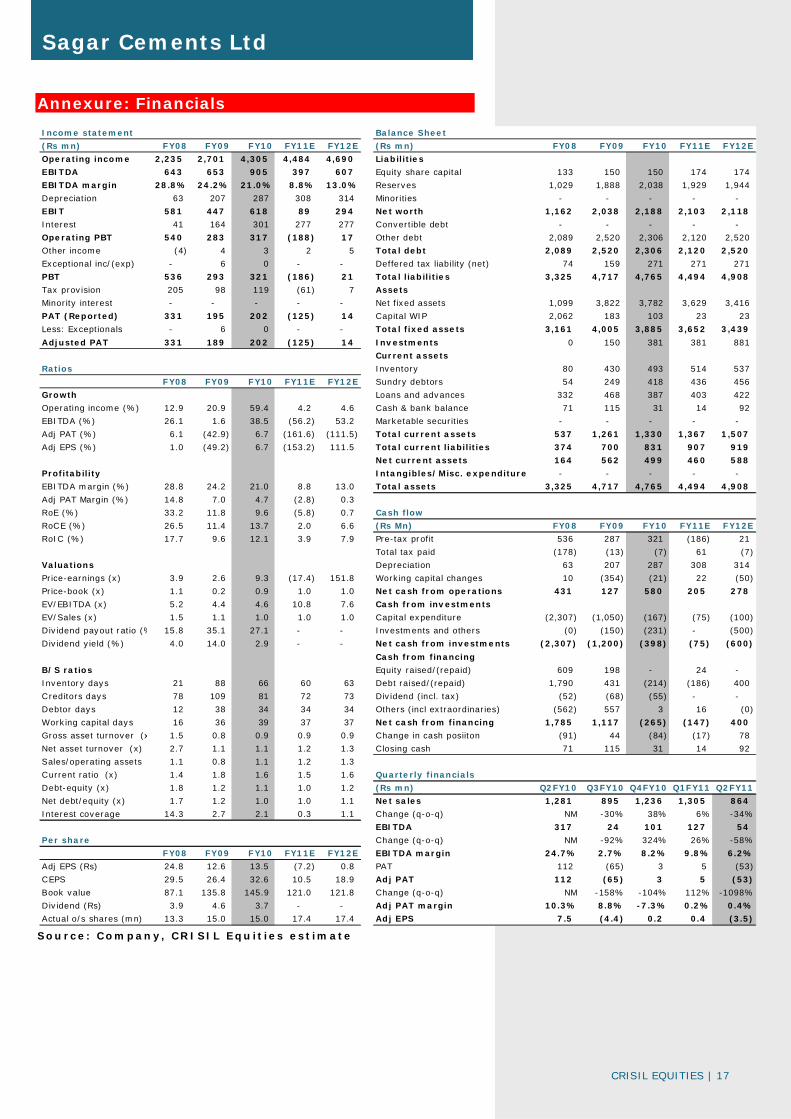
Annexure: Financials
Source: Company, CRISIL Equ it ies est imate
Income statement Balance Sheet
(Rs mn) FY08 FY09 FY10 FY11E FY12E (Rs mn) FY08 FY09 FY10 FY11E FY12E
Operating income 2,235 2,701 4,305 4,484 4,690 Liabilities
EBITDA 643 653 905 397 607 Equity share capital 133 150 150 174 174
EBITDA margin 28.8% 24.2% 21.0% 8.8% 13.0% Reserves 1,029 1,888 2,038 1,929 1,944
Depreciation 63 207 287 308 314 Minorities - - - - -
EBIT 581 447 618 89 294 Net worth 1,162 2,038 2,188 2,103 2,118
Interest 41 164 301 277 277 Convertible debt - - - - -
Operating PBT 540 283 317 (188) 17 Other debt 2,089 2,520 2,306 2,120 2,520
Other income (4) 4 3 2 5 Total debt 2,089 2,520 2,306 2,120 2,520
Exceptional inc/(exp) - 6 0 - - Deffered tax liability (net) 74 159 271 271 271
PBT 536 293 321 (186) 21 Total liabilities 3,325 4,717 4,765 4,494 4,908
Tax provision 205 98 119 (61) 7 Assets
Minority interest - - - - - Net fixed assets 1,099 3,822 3,782 3,629 3,416
PAT (Reported) 331 195 202 (125) 14 Capital WIP 2,062 183 103 23 23
Less: Exceptionals - 6 0 - - Total fixed assets 3,161 4,005 3,885 3,652 3,439
Adjusted PAT 331 189 202 (125) 14 Investments 0 150 381 381 881
Current assets
Ratios Inventory 80 430 493 514 537
FY08 FY09 FY10 FY11E FY12E Sundry debtors 54 249 418 436 456
Growth Loans and advances 332 468 387 403 422
Operating income (%) 12.9 20.9 59.4 4.2 4.6 Cash & bank balance 71 115 31 14 92
EBITDA (%) 26.1 1.6 38.5 (56.2) 53.2 Marketable securities - - - - -
Adj PAT (%) 6.1 (42.9) 6.7 (161.6) (111.5) Total current assets 537 1,261 1,330 1,367 1,507
Adj EPS (%) 1.0 (49.2) 6.7 (153.2) 111.5 Total current liabilities 374 700 831 907 919
Net current assets 164 562 499 460 588
Profitability Intangibles/Misc. expenditure - - - - -
EBITDA margin (%) 28.8 24.2 21.0 8.8 13.0 Total assets 3,325 4,717 4,765 4,494 4,908
Adj PAT Margin (%) 14.8 7.0 4.7 (2.8) 0.3
RoE (%) 33.2 11.8 9.6 (5.8) 0.7 Cash flow
RoCE (%) 26.5 11.4 13.7 2.0 6.6 (Rs Mn) FY08 FY09 FY10 FY11E FY12E
RoIC (%) 17.7 9.6 12.1 3.9 7.9 Pre-tax profit 536 287 321 (186) 21
Total tax paid (178) (13) (7) 61 (7)
Valuations Depreciation 63 207 287 308 314
Price-earnings (x) 3.9 2.6 9.3 (17.4) 151.8 Working capital changes 10 (354) (21) 22 (50)
Price-book (x) 1.1 0.2 0.9 1.0 1.0 Net cash from operations 431 127 580 205 278
EV/EBITDA (x) 5.2 4.4 4.6 10.8 7.6 Cash from investments
EV/Sales (x) 1.5 1.1 1.0 1.0 1.0 Capital expenditure (2,307) (1,050) (167) (75) (100)
Dividend payout ratio (% 15.8 35.1 27.1 - - Investments and others (0) (150) (231) - (500)
Dividend yield (%) 4.0 14.0 2.9 - - Net cash from investments (2,307) (1,200) (398) (75) (600)
Cash from financing
B/S ratios Equity raised/(repaid) 609 198 - 24 -
Inventory days 21 88 66 60 63 Debt raised/(repaid) 1,790 431 (214) (186) 400
Creditors days 78 109 81 72 73 Dividend (incl. tax) (52) (68) (55) - -
Debtor days 12 38 34 34 34 Others (incl extraordinaries) (562) 557 3 16 (0)
Working capital days 16 36 39 37 37 Net cash from financing 1,785 1,117 (265) (147) 400
Gross asset turnover (x 1.5 0.8 0.9 0.9 0.9 Change in cash posiiton (91) 44 (84) (17) 78
Net asset turnover (x) 2.7 1.1 1.1 1.2 1.3 Closing cash 71 115 31 14 92
Sales/operating assets 1.1 0.8 1.1 1.2 1.3
Current ratio (x) 1.4 1.8 1.6 1.5 1.6 Quarterly financials
Debt-equity (x) 1.8 1.2 1.1 1.0 1.2 (Rs mn) Q2FY10 Q3FY10 Q4FY10 Q1FY11 Q2FY11
Net debt/equity (x) 1.7 1.2 1.0 1.0 1.1 Net sales 1,281 895 1,236 1,305 864
Interest coverage 14.3 2.7 2.1 0.3 1.1 Change (q-o-q) NM -30% 38% 6% -34%
EBITDA 317 24 101 127 54
Per share Change (q-o-q) NM -92% 324% 26% -58%
FY08 FY09 FY10 FY11E FY12E EBITDA margin 24.7% 2.7% 8.2% 9.8% 6.2%
Adj EPS (Rs) 24.8 12.6 13.5 (7.2) 0.8 PAT 112 (65) 3 5 (53)
CEPS 29.5 26.4 32.6 10.5 18.9 Adj PAT 112 (65) 3 5 (53)
Book value 87.1 135.8 145.9 121.0 121.8 Change (q-o-q) NM -158% -104% 112% -1098%
Dividend (Rs) 3.9 4.6 3.7 - - Adj PAT margin 10.3% 8.8% -7.3% 0.2% 0.4%
Actual o/s shares (mn) 13.3 15.0 15.0 17.4 17.4 Adj EPS 7.5 (4.4) 0.2 0.4 (3.5)
CRISIL EQUITIES | 18
Sagar Cements Ltd
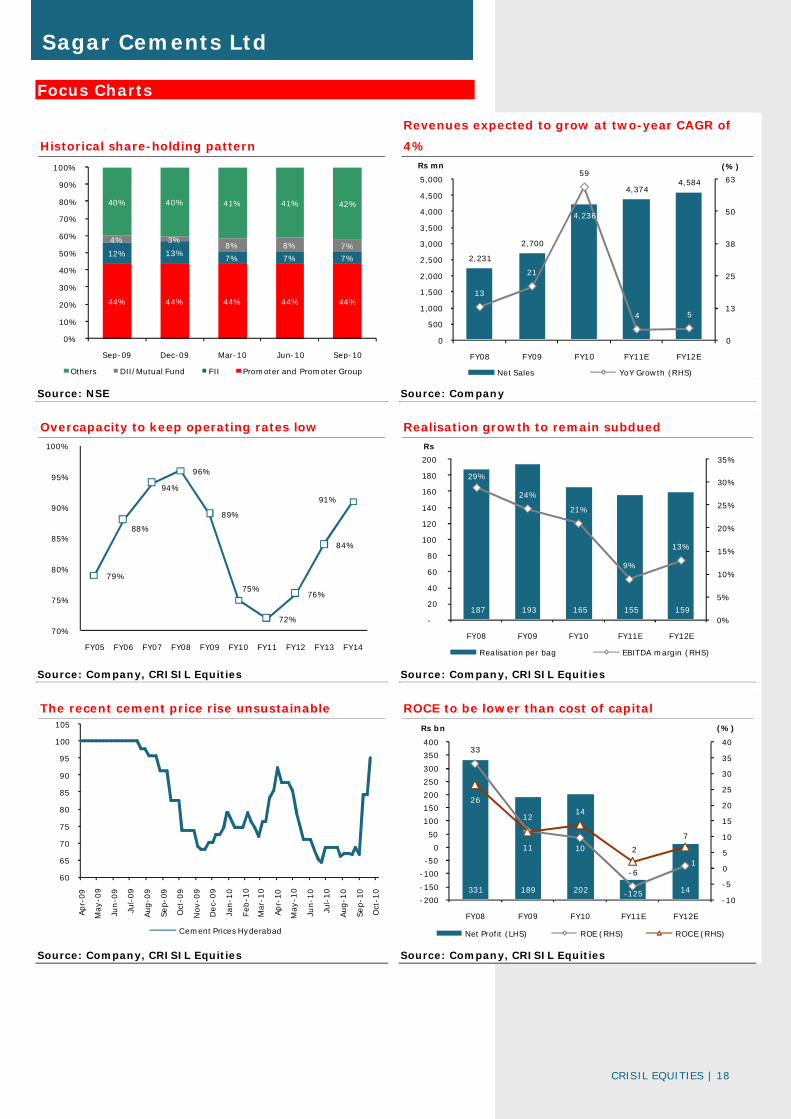
Focus Charts
Historical share-holding pattern
Revenues expected to grow at two-year CAGR of
4%
Source: NSE Source: Company
Overcapacity to keep operating rates low Realisation growth to remain subdued
Source: Company, CRISIL Equities Source: Company, CRISIL Equities
The recent cement price rise unsustainable ROCE to be lower than cost of capital
Source: Company, CRISIL Equities Source: Company, CRISIL Equities
44% 44% 44% 44% 44%
12% 13%7% 7% 7%
4% 3%8% 8% 7%
40% 40% 41% 41% 42%
0%
10%
20%
30%
40%
50%
60%
70%
80%
90%
100%
Sep-09 Dec-09 Mar-10 Jun-10 Sep-10
Others DII/Mutual Fund FII Promoter and Promoter Group
2,231
2,700
4,236
4,3744,584
13
21
59
4 5
0
13
25
38
50
63
0
500
1,000
1,500
2,000
2,500
3,000
3,500
4,000
4,500
5,000
FY08 FY09 FY10 FY11E FY12E
(%)Rs mn
Net Sales YoY Growth (RHS)
79%
88%
94%
96%
89%
75%
72%
76%
84%
91%
70%
75%
80%
85%
90%
95%
100%
FY05 FY06 FY07 FY08 FY09 FY10 FY11 FY12 FY13 FY14
187 193 165 155 159
29%
24%
21%
9%
13%
0%
5%
10%
15%
20%
25%
30%
35%
-
20
40
60
80
100
120
140
160
180
200
FY08 FY09 FY10 FY11E FY12E
Rs
Realisation per bag EBITDA margin (RHS)
60
65
70
75
80
85
90
95
100
105
Apr-
09
May
-09
Jun-0
9
Jul-
09
Aug
-09
Sep-
09
Oct
-09
Nov
-09
Dec-
09
Jan-1
0
Feb
-10
Mar
-10
Apr-
10
May
-10
Jun-1
0
Jul-
10
Aug
-10
Sep-
10
Oct
-10
Cement Prices Hyderabad
331 189 202 -125 14
33
12
10
-61
26
11
14
2
7
-10
-5
0
5
10
15
20
25
30
35
40
-200
-150
-100
-50
0
50
100
150
200
250
300
350
400
FY08 FY09 FY10 FY11E FY12E
(%)Rs bn
Net Profit (LHS) ROE (RHS) ROCE (RHS)
CRISIL Independent Equity Research Team
Mukesh Agarwal Director +91 (22) 3342 3035 [email protected]
Tarun Bhatia Director, Capital Markets +91 (22) 3342 3226 [email protected]
Chetan Majithia Head, Equities +91 (22) 3342 4148 [email protected]
Sudhir Nair Head, Equities +91 (22) 3342 3526 [email protected]
Nagarajan Narasimhan Director, Research +91 (22) 3342 3536 [email protected]
Ajay D'Souza Head, Research +91 (22) 3342 3567 [email protected]
Manoj Mohta Head, Research +91 (22) 3342 3554 [email protected]
Sachin Mathur Head, Research +91 (22) 3342 3541 [email protected]
Sridhar C Head, Research +91 (22) 3342 3546 [email protected] CRISIL’s Equity Offerings The Equity Group at CRISIL Research provides a wide range of services including:
Independent Equity Research IPO Grading White Labelled Research Valuation on companies for use of Institutional Investors, Asset Managers, Corporate
Other Services by the Research group include
CRISINFAC Industry research on over 60 industries and Economic Analysis Customised Research on Market sizing, Demand modelling and Entry strategies Customised research content for Information Memorandum and Offer documents
About CRISIL
CRISIL is India's leading Ratings, Research, Risk and Policy Advisory Company.
About CRISIL Research CRISIL Research is India's largest independent, integrated research house. We leverage our unique, integrated
research platform and capabilities spanning the entire economy-industry-company spectrum to deliver superior
perspectives and insights to over 750 domestic and global clients, through a range of subscription products and
customised solutions.
Vinaya Dongre – Head, Business Development
Email : [email protected] I Phone : 9920225174
To know more about CRISIL IER, please contact our team members:
Sagar Sawarkar – Senior Manager, Business Development
Email : [email protected] I Phone : 9821638322
Kolkata Priyanka Agarwal - Manager, Business Development Email : [email protected] I Phone : 9903060685 Mumbai Supriya Tapase - Manager, Business Development Email : [email protected] I Phone : 9820745668 New Delhi Vipin Saboo - Manager, Business Development Email : [email protected] I Phone : 9820779873
Ahmedabad I Mumbai I Pune Salil Srivastava - Manager, Business Development Email : [email protected] I Phone : 9833996430 Bengaluru I Chennai Anand Krishnamoorthy - Manager, Business Development Email : [email protected] I Phone : 9884704111 Hyderabad Kaliprasad Ponnuru - Manager, Business Development Email : [email protected] I Phone : 9642004668
Regional Contacts:
Head Office: CRISIL House, Central Avenue, Hiranandani Business Park, Powai, Mumbai - 400 076 Phone : 91-22-3342 3000 Web: www.crisil.com Download reports from: www.ier.co.in