Embed Size (px)
Citation preview
FAT LEVEL IN BODY OF JUVENILE ATLANTIC SALMON
(Salmo salar L.), AND SEA TROUT (Salmo trutta m. trutta L.), AND
METHOD OF ESTIMATION FROM MORPHOMETRIC DATA
Piotr Dêbowski*, Stefan Dobosz*, Stanis³aw Robak*, Zygmunt Usydus**
*The Stanis³aw Sakowicz Inland Fisheries Institute in Olsztyn**Marine Fisheries Institute in Gdynia
ABSTRACT. Average fat levels in one and two years old sea trout (Salmo trutta m. trutta L.) and two
years old Atlantic salmon (S. salar L.) measured in May were similar, about 9% of fresh weight. One year
old salmon showed higher fat content – about 11%. Fat level and fish measurements: body length, we-
ight, and depth correlated, and so did fat level and morphometric data. Equations of multiple re-
gression explained 66-99% of fat content variation.
Key words: SALMON, SEA TROUT, ESTIMATION OF FAT LEVEL
INTRODUCTION
Body fat content is a measure of energetic resources in fish. Low fat content insalmonid parr may result in high mortality, especially in winter (Gardiner, Geddes1980). Also successful fish maturation depends, among other, on body fat content.Low fat level may inhibit maturation of salmon parr males (Rowe, Thorpe 1990), andfish showing earlier fat level increase in spring are more likely to reach maturation inautumn (Rowe et al. 1991). Thus, development of non-destructive method of body fatlevel estimation would be useful for predicting sexual maturation of fish in a givenyear. This could be of great importance for the fishery practice.
The only non-destructive and simple method was developed by Simpson et al.(1992), who found relationships between body fat level and simple body measures in
Atlantic salmon (Salmo salar L.) parr. The relationships explained 40-94% of fat levelvariation in fish of different size, and in different seasons. Testing such relationshipsfor various morphometric data sets for hatchery-reared Atlantic salmon and sea troutjuveniles was the aim of the present study.
Archivesof Polish Fisheries
Vol. 7 Fasc. 2 237 - 243 1999Arch.
Ryb. Pol.
MATERIAL AND METHODS
One and two years old salmon from Œwierzenko Hatchery (Aquamar), and seatrout at the same age from the Dept. of Salmonid Fish Breeding of Inland Fishery In-
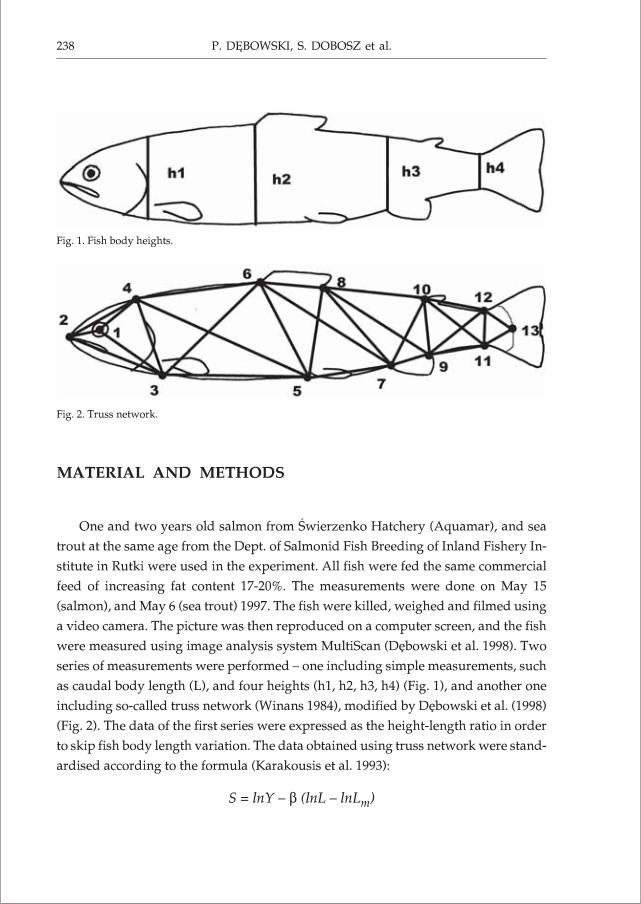
stitute in Rutki were used in the experiment. All fish were fed the same commercialfeed of increasing fat content 17-20%. The measurements were done on May 15(salmon), and May 6 (sea trout) 1997. The fish were killed, weighed and filmed usinga video camera. The picture was then reproduced on a computer screen, and the fishwere measured using image analysis system MultiScan (Dêbowski et al. 1998). Twoseries of measurements were performed – one including simple measurements, suchas caudal body length (L), and four heights (h1, h2, h3, h4) (Fig. 1), and another oneincluding so-called truss network (Winans 1984), modified by Dêbowski et al. (1998)(Fig. 2). The data of the first series were expressed as the height-length ratio in orderto skip fish body length variation. The data obtained using truss network were stand-
ardised according to the formula (Karakousis et al. 1993):
S = lnY – � (lnL – lnLm)
238 P. DÊBOWSKI, S. DOBOSZ et al.
Fig. 1. Fish body heights.
Fig. 2. Truss network.
where:
S – standardised measurement,
Y – crude measurement,
� – regression coefficient of lnY and lnL,
L – caudal fish body length,
Lm – average fish length in each group.Fulton’s fish condition coefficient was also calculated according to the formula:
CF W L 3
where:
W – fish body weight.In order to evaluate body fat content, the fish were minced and dried at 60oC for 3
days. Fat was extracted with petroleum ether according to Soxleth’s method. The re-sults were expressed as percentage of fresh fish body weight.
Stepwise regression analysis was applied to determine fat content (F) versus cau-dal length (L), weight (W), and the four heights (H1, H2, H3, and H4, where Hi = hi *L-1) for the first data series, and for F versus L, and standardised Si, j distances (wherei, j – points in Fig. 2) for the second series.
RESULTS AND DISCUSSION
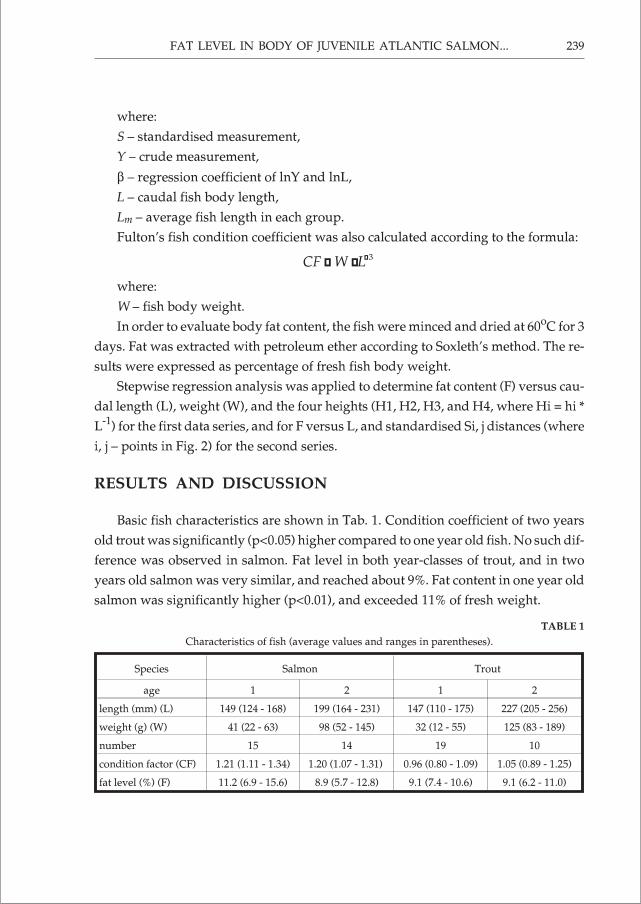
Basic fish characteristics are shown in Tab. 1. Condition coefficient of two yearsold trout was significantly (p<0.05) higher compared to one year old fish. No such dif-
ference was observed in salmon. Fat level in both year-classes of trout, and in twoyears old salmon was very similar, and reached about 9%. Fat content in one year oldsalmon was significantly higher (p<0.01), and exceeded 11% of fresh weight.
TABLE 1
Characteristics of fish (average values and ranges in parentheses).
Species Salmon Trout
age 1 2 1 2
length (mm) (L) 149 (124 - 168) 199 (164 - 231) 147 (110 - 175) 227 (205 - 256)
weight (g) (W) 41 (22 - 63) 98 (52 - 145) 32 (12 - 55) 125 (83 - 189)
number 15 14 19 10
condition factor (CF) 1.21 (1.11 - 1.34) 1.20 (1.07 - 1.31) 0.96 (0.80 - 1.09) 1.05 (0.89 - 1.25)
fat level (%) (F) 11.2 (6.9 - 15.6) 8.9 (5.7 - 12.8) 9.1 (7.4 - 10.6) 9.1 (6.2 - 11.0)
FAT LEVEL IN BODY OF JUVENILE ATLANTIC SALMON... 239
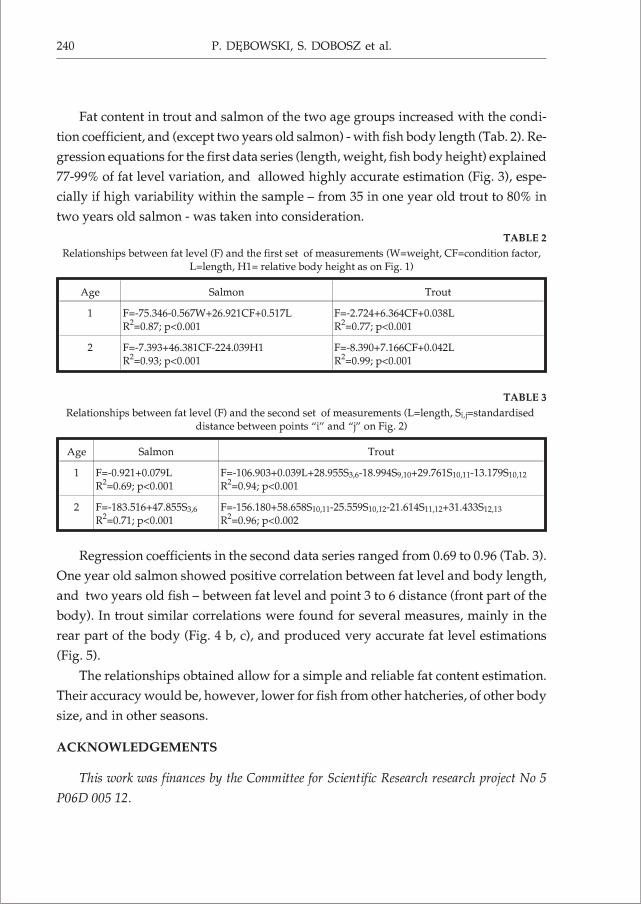
Fat content in trout and salmon of the two age groups increased with the condi-tion coefficient, and (except two years old salmon) - with fish body length (Tab. 2). Re-gression equations for the first data series (length, weight, fish body height) explained77-99% of fat level variation, and allowed highly accurate estimation (Fig. 3), espe-cially if high variability within the sample – from 35 in one year old trout to 80% intwo years old salmon - was taken into consideration.
TABLE 2
Relationships between fat level (F) and the first set of measurements (W=weight, CF=condition factor,L=length, H1= relative body height as on Fig. 1)
Age Salmon Trout
1 F=-75.346-0.567W+26.921CF+0.517LR2=0.87; p<0.001
F=-2.724+6.364CF+0.038LR2=0.77; p<0.001
2 F=-7.393+46.381CF-224.039H1R2=0.93; p<0.001
F=-8.390+7.166CF+0.042LR2=0.99; p<0.001
TABLE 3
Relationships between fat level (F) and the second set of measurements (L=length, Si,j=standardiseddistance between points “i” and “j” on Fig. 2)
Age Salmon Trout
1 F=-0.921+0.079LR2=0.69; p<0.001
F=-106.903+0.039L+28.955S3,6-18.994S9,10+29.761S10,11-13.179S10,12
R2=0.94; p<0.001
2 F=-183.516+47.855S3,6
R2=0.71; p<0.001F=-156.180+58.658S10,11-25.559S10,12-21.614S11,12+31.433S12,13
R2=0.96; p<0.002
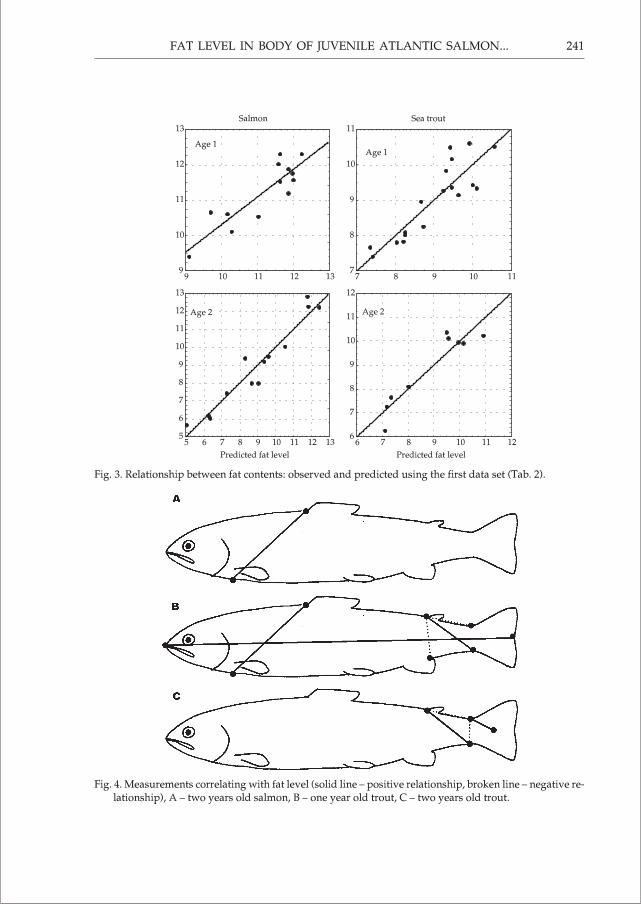
Regression coefficients in the second data series ranged from 0.69 to 0.96 (Tab. 3).One year old salmon showed positive correlation between fat level and body length,and two years old fish – between fat level and point 3 to 6 distance (front part of thebody). In trout similar correlations were found for several measures, mainly in therear part of the body (Fig. 4 b, c), and produced very accurate fat level estimations(Fig. 5).
The relationships obtained allow for a simple and reliable fat content estimation.Their accuracy would be, however, lower for fish from other hatcheries, of other bodysize, and in other seasons.
ACKNOWLEDGEMENTS
This work was finances by the Committee for Scientific Research research project No 5
P06D 005 12.
240 P. DÊBOWSKI, S. DOBOSZ et al.
FAT LEVEL IN BODY OF JUVENILE ATLANTIC SALMON... 241
Salmon
9
10
11
12
13
9 10 11 12 13
Age 1
Sea trout
7
8
9
10
11
7 8 9 10 11
Age 1
Predicted fat level
5
6
7
8
9
10
11
12
13
5 6 7 8 9 10 11 12 13
Age 2
Predicted fat level
6
7
8
9
10
11
12
6 7 8 9 10 11 12
Age 2
Fig. 3. Relationship between fat contents: observed and predicted using the first data set (Tab. 2).
Fig. 4. Measurements correlating with fat level (solid line – positive relationship, broken line – negative re-lationship), A – two years old salmon, B – one year old trout, C – two years old trout.
REFERENCES
Dêbowski P., Robak S., Dobosz S. 1998 - Przyk³ad zastosowania komputerowej analizy obrazu do pomia-rów cech biometrycznych ryb - Komun. Ryb. 3:24-25.
Gardiner W.R., Geddes P. 1980- The influence of body composition on the survival of juvenile salmon-Hy-drobiologia 69:67-72.
Karakousis Y., Peios C., Economidis P.S., Triantaphyllidis C. 1993 - Multivariate analysis of the morpholo-gical variability among Barbus peloponnesius (Cyprinidae) populations from Greece and two popula-tions of B.meridionalis meridionalis and B.meridionalis petenyi-Cybium 17:229-240.
Rowe D.K., Thorpe J.E., Shanks A.M. 1991 - Role of fat stores in the maturation of male Atlantic salmon(Salmo salar) parr-Can. J. Fish. Aquat. Sc. 48:405-413.
Rowe D.K., Thorpe J.E. 1990 - Suppression of maturation in male Atlantic salmon (Salmo salar L.) parr by re-duction in feeding and growth during spring months - Aquaculture 86:291-313.
242 P. DÊBOWSKI, S. DOBOSZ et al.
Salmon
6
7
8
9
10
11
12
13
6 7 8 9 10 11 12 13
Sea trout
7
8
9
10
11
7 8 9 10 11
Predicted fat level
5
6
7
8
9
10
11
12
13
14
5 6 7 8 9 10 11 12 13 14Predicted fat level
5
6
7
8
9
10
11
12
5 6 7 8 9 10 11 12
Fig. 5. Relationship between fat contents: observed and predicted using the second data set (Tab. 3).
Simpson A.L., Metcalfe N.B., Thorpe J.E. 1992 - A simple non-destructive biometric method for estimatingfat levels in Atlantic salmon, Salmo salar L., parr -Aquacult. Fish. Manage. 23:23-29.
Winans G.A. 1984- Multivariate morphometric variability in Pacific salmon: technical demonstration - Can.J. Fish. Aquat. Sc. 41:1150-1159.
STRESZCZENIE
POZIOM T£USZCZU W CIELE M£ODOCIANEGO £OSOSIA (Salmo salar L.) I TROCI(Salmo trutta m. trutta L.) ORAZ METODA JEGO SZACOWANIA NA PODSTAWIEDANYCH MORFOMETRYCZNYCH
Œrednia zawartoœæ t³uszczu u jedno i dwuletnich troci (Salmo trutta m. trutta L.) i dwuletnich ³ososi(Salmo salar L.) w maju by³a podobna i wynosi³a ok. 9% mokrej masy. Wiêcej t³uszczu mia³y jednoroczne³ososie – ok. 11%. Znaleziono zale¿noœci pomiêdzy poziomem t³uszczu a prostymi pomiarami ryb: mas¹,d³ugoœci¹ i wysokoœciami cia³a (rys. 1, tab. 1), a tak¿e miêdzy poziomem t³uszczu a pomiaramimorfometrycznymi przeprowadzonymi metod¹ „truss network” (rys. 2, tab. 3) przy zastosowaniu analizykomputerowej obrazów ryb zarejestrowanych kamer¹ video. Uzyskane równania regresji wielokrotnejwyjaœnia³y od 69 do 99% zmiennoœci zawartoœci t³uszczu w ciele ryb. Zaprezentowana metoda mo¿eznaleŸæ praktyczne zastosowanie w przy¿yciowej ocenie poziomu zapasów energetycznych u m³odo-cianych ryb obu badanych gatunków.
ADRESY AUTORÓW:
Dr Piotr DêbowskiPracownia Rybactwa RzecznegoInstytut Rybactwa Œródl¹dowego80-761 Gdañsk, ul. Reduta ¯bik 5
Dr Stefan DoboszZak³ad Hodowli Ryb £ososiowatych RutkiInstytut Rybactwa Œródl¹dowego83-330 ¯ukowo
Mgr in¿. Stanis³aw RobakZak³ad IchtiobiologiiInstytut Rybactwa Œródl¹dowego10-719 Olsztyn, ul. Oczapowskiego 10
Dr Zygmunt UsydusZak³ad Technologii PrzetwórstwaMorski Instytut Rybacki81-332 Gdynia, ul. Ko³³¹taja 1
FAT LEVEL IN BODY OF JUVENILE ATLANTIC SALMON... 243