Embed Size (px)
DESCRIPTION
Gold geochimistry, honduras
Citation preview
7172019 Salvioli et al 2015
httpslidepdfcomreaderfullsalvioli-et-al-2015 114
Gold mineralisations in the Canan area Lepaguare District east-centralHonduras Fluid inclusions and geochemical constraints on gold deposition
E Salvioli-Mariani a L Toscani a T Boschetti a D Bersani a M Mattioli b
a Dipartimento di Fisica e Scienze della Terra ldquo Macedonio Mellonirdquo Universitagrave di Parma Viale Parco Area delle Scienze 157A 43124 Parma Italyb Dipartimento di Scienze della Terra della Vita e dellAmbiente Universitagrave di Urbino ldquo Carlo Bordquo Campus Scienti 1047297co E Mattei 61029 Urbino Italy
a b s t r a c ta r t i c l e i n f o
Article history
Received 17 November 2014Revised 12 May 2015Accepted 3 August 2015Available online 5 August 2015
Keywords
Fluid inclusionsGoldSulphidationCananHonduras
Gold mineralisations in the Canan area (Honduras) occur within altered metamorphic rocks crossed by quartz
veins which 1047297lled the fractures where the hydrothermal 1047298uids carrying gold 1047298owed Quartz crystals of theveins contain abundant 1047298uid inclusions which have been divided into four main types on the basis of the petro-graphic features and microthermometric data The association of L-rich and V-rich inclusions with the samemajor components supports boiling at the time of entrapment The trapped hydrothermal 1047298uid consists of anaqueous solution (09ndash48 wt NaCl equivalent) plus a CO2ndashCH4-bearing bubble Some 1047298uid inclusions containgraphite of hydrothermal origin Microthermometric and spectroscopic data on 1047298uidinclusionsindicate thathy-drothermal 1047298uidscarryinggoldwereatT=300degCP=500 ndash1400bar log f O2 ~ minus376 plusmn 25 and with a pHvalueof 29 plusmn 04 Large amounts of sulphides (mainly pyrite) are associated with gold We infer that Au wastransported as AundashS complex in particular as Au(HS)deg The activity of sulphur in the hydrothermal 1047298uids wasat least 10minus2 The precipitation of gold can be related to several processes that reduced the stability of AuHSdeg1) boiling and vapour loss following the pressure drop caused both by fracture opening and 1047298uid uprise2) sulphidation as a result of the presence of Fe2+ (and other metal cations) from the mineralogical alteration(mainly of biotite and chlorite) in the wall-rocks and 3) hydrothermal alteration of feldspars and micas into ka-olinite and diaspore with increase in pH of the hydrothermal 1047298uids The mineralogical petrological geochemicalfeatures and the geological setting are broadly consistent with those of orogenic-type gold deposits
copy 2015 Elsevier BV All rights reserved
1 Introduction
Over the past decades several studies on the relationships betweenthe gold deposits hosted in quartz veins and alteration halos due tohydrothermal 1047298uid in1047297ltration have been published (eg Andrada dePalomera et al 2012 Boiron et al 1991 Cepedal et al 2013Esmaeily et al 2012 Garofalo et al 2002 Phillips and Powell 2009)Intensive host-rock alteration around the quartz veins shows distinctmineralogical changes that are indicative of metasomatic processesdue to hydrothermal 1047298uids The amount of precipitation of nativeelements and the type of hydrothermal alteration minerals are stronglydependent on the physicalndashchemical nature of the mineralising 1047298uidsand the host-rock composition In several gold deposit the mineral as-semblages occurring in the quartz veins and in the associated alteredwall-rocks have been described (eg Botros 2004 Callaghan 2001Deksissa and Koeberl 2005 Miur 2002) On the contrary the chemicalfeatures of the1047298uids associated withthe gold deposition and rock alter-ation are not yet fully understood (Klein et al 2002 Yang et al 2006Su et al 2008)
The study of 1047298uid inclusions in minerals from hydrothermal veins isvery importantto infer thecompositionof the1047298uids that have depositedgold and other associated metals The 1047298uid inclusions contain low-salinity mixed aqueousndashcarbonic 1047298uids where H2O and CO2 are themajor molecular components CH4 is a common minor componentand N2 is present in trace (Groves et al 2003 and references thereinRidley and Diamond 2000) The CO2 concentration is always greaterthan 5 mol the relative amounts of H2O CO2 and CH4 may vary as aconsequence of phase separation (boiling) duringpressure 1047298uctuations(Spooner et al 1987) The aqueous component of the 1047298uids contains1ndash15 wt NaCl equivalent (Ridley and Diamond 2000) Other typesof 1047298uids are H2O-poor carbonic 1047298uids and low- to moderate-salinityaqueous 1047298uids Pure carbonic 1047298uids or pure aqueous low-salinity 1047298uidsare rare (Ridley and Diamond 2000) However there is no scienti1047297cconsensus regarding the origin of Au-carrying 1047298uids In the orogenicgold deposits the distinction between magmatic and metamorphic ori-gin for 1047298uids is dif 1047297cult due to the close association between magmaticand metamorphic rocks and the strong structural control Furthermorein such a complex situation 1047298uids from different sources may exten-sively mix along their pathways (Ridley and Diamond 2000)
TheHondurasregion (CentralAmerica) is a well-knownmetallogenicprovince which is representedby severalareas of hydrothermally altered
Journal of Geochemical Exploration 158 (2015) 243ndash256
Corresponding authorE-mail address emmasalviolimarianiuniprit (E Salvioli-Mariani)
httpdxdoiorg101016jgexplo201508003
0375-6742copy 2015 Elsevier BV All rights reserved
Contents lists available at ScienceDirect
Journal of Geochemical Exploration
j o u r n a l h o m e p a g e w w w e l s e v i e r c o m l o c a t e j g e o e x p
7172019 Salvioli et al 2015
httpslidepdfcomreaderfullsalvioli-et-al-2015 214
metamorphic rocks that are related to the Late CretaceousndashEarly Tertiarymagmatic systems extending from Guatemala to Costa Rica (eg Robertsand Irving 1957 Samson et al 2008 Sundblad et al 1991Williams-Jones et al 2010) However with the exception of gold de-posits in the Rosario Mining District (San Juancito Mts Carpenter1954) and Minas de Oro District (Central Highlands Drobe and Cann2000) very little is known about the genesis of the gold deposits in thisregion Recent investigations in CentralndashEastern Honduras (Bersani
et al 2009 Mattioli et al 2014) were focused on the gold deposits inthe Canan area (Lepaguare District Olancho Department) In thislocation gold mineralizations are hosted in metamorphic rocks fromsub-greenschist to granulite facies Gold is found in both quartz veinsand disseminated (with sulphides) in the altered host-rock Particularlythe quartz of the veins is rich in1047298uid inclusions thatwere trapped duringhydrothermal growth or because of the healing of the fractures
In this paper we report a detailed 1047298uid inclusions study of the Au-quartz veins from Canan that integrates and completes the work of Bersani et al (2009) Our purpose is to contribute to the knowledge of the physico-chemical characteristics of the Au-mineralising 1047298uids andthe conditions of transport and deposition of gold in orogenicenvironments
2 General setting
21 Geodynamic and geological background
The geodynamic evolution of Honduras is the result of the complexinteraction along a triple junction among the North American platethe Cocos plate and the Caribbean plate (eg Guzman-Speziale 2001Mann and Burke 1984 1988 Rogers and Mann 2007 Silva-Romo2008) This interaction is responsible for the Central American subduc-tionsystem which consists of a north-eastwards slabsubduction underthe Caribbean andthe North American plates The subduction is obliqueto the plate boundary and both transpressional and transtensional tec-tonics seem to be active (Alvarez-Gogravemez et al 2008)
The Caribbean plate includes minor crustal blocks like the Chortisblock which has traditionally been referred to the Precambrianndash
Paleozoic continental nucleus of Northern Central America (Rogerset al 2007 Fig 1) The Chortis block is separated from the NorthAmerican plate by the MotaguandashPolochic sinistral transform fault(northern side) and from the Cocos plate by the Middle AmericanTrench (Fig 1) Recent studies (eg Rogers and Mann 2007 Rogerset al 2007) show that the Chortis block can be divided into differenttectonic terranes Its Paleozoic metamorphic basement consists of well-foliated graphitic and sericitic schists (Cacaguapa SchistsCarpenter 1954 Horne et al 1976) that extensively crop out in thestudy area (Fig 1A) This Paleozoic basement is overlain by a fairlythick sequence of Jurassic to Cretaceous sedimentary rocks which arecomprised of three main units Agua Fria andAtima formations belong-ing to the Yojoa Group and Valle de Angeles Formation ( Mills et al1967 Rogers et al 2007) During the Upper CretaceousndashLower Tertiary
(Ratschbacher et al 2009) the Paleozoic basement and its Mesozoicsedimentary cover were intruded by granodiorite plutons which cropout in the south and in the north-northwest sectors of the investigatedarea (Fig 1A)
The Canan area is located in the Lepaguare District between thesouthern margin of the Lepaguare Valley and Rio Guayape about100 km north-east of Tegucigalpa (Fig 1) The Lepaguare valley repre-sents an important boundary between extensional and strikendashslipstructures mainly related to the Guayape fault system which is one of the major tectonic structures within the Chortis block of the CaribbeanPlate In particular the Canan mining area is located between the LaRosandashCampamento and JuticalpandashRio Jalaacuten fault systems (Fig 1A)which represent different strands of the main Guayape fault systemand have main left lateral transtensional kinematics The main gold
mineralisation occurs just where the northern shear zone (Dos Bocasndash
Quebrada Los Mochos) cuts the NndashS striking faults at Dos Bocas(Fig 1B)
22 Canan ore deposit
The Canan ore deposit roughly corresponds to the extent of thequartz veins and hydrothermally altered host-rocks A summary of themain rock types and mineral assemblages of the different zones of the
Canan ore deposit as well as those of the unaltered metamorphichost-rocks is reported in Table 1The quartz veinsare hosted in theCacaguapa Schists and have a var-
iable thickness ranging from 2 to 30 cm with an average of 15 cm atthe intersections of the two fracture systems the thickness of thequartz-veins signi1047297cantly increases up to 1 m The veins exhibit a varie-ty of textures including massive ribboned banded and stock-workswith anastomizing gashes and dilations Quartz is always the mainphase of the veins ranging from 90 to 100 vol and two types of tex-tures can occur locally even in the same vein (Table 1) Quartz crystalsoften enclose sulphides sulphosalts Fe-oxidesndashhydroxides and nativeelements such as gold silver bismuth and arsenic Gold is rare in thequartz veins occurs as inclusions in yellow small (2ndash10 μ m) grains of pyriteand 1047297llssmallcracksin a complex association with pyritendashchalco-pyrite The quartz crystals of the veins are often rich in 1047298uid inclusions
The hydrothermally altered zones extend from the veins outwardsfrom few centimetres to 15 m in thickness depending on the host-rock and vein width Starting from the unaltered metamorphic host-rock we distinguished three main alteration zones of the wall-rockswhich graded into each other and represented different stages of thesame alteration process due to variation of the 1047298uidrock ratio (Robb2010 Table 1) The distal zone is marked by the presence of chlorite(clinochlore type) The intermediate zone is volumetrically the largestoneand is characterised by thedominantpresence of muscovite Theas-sociation of quartz + muscovite + pyrite is prevailing chalcopyrite ar-senopyrite galena sphalerite Fe-oxidesndashhydroxides phosphatessulphosalts and native elements occur in variable amounts Native ele-ments are represented by gold silver and Platinum Group ElementsThis zone smoothly grades into a proximal zone with a progressive in-
crease in clayminerals and vuggy silicaClayminerals mainly kaolinitereplace aluminosilicates such as feldspars Sulphides hematite goe-thite chlorite and rutile can be also present in the proximal zonewhere partly limonitized disseminated or veinlet-type pyrite is themain ore mineral The presence of goethite and limonite support a lateinteraction with meteoric water
23 Gold mineralisation
The grain size of gold is generally from 2 μ m to 1 mm in diameterBased on morphology grain-size 1047297neness and composition we wereable to distinguish three types of gold Type-1 gold refers to grainswith a rounded shape (ovoid spherical elongated) and striatedsurfaces and is 20ndash50 μ m (rarely up to 1 mm) in size This type of
gold occurs in the intermediate zone Small grains (100 μ m to 1 mm)of Ag and other native elements (PGEs) are rarely associated withType-1 gold Type-2 gold is 5ndash10 μ m in size occurs as euhedralndashsubhedral grains and is directly attached to (or included in) pyrite andarsenopyrite This type of gold is generally present in the quartz-veinsType-3 gold occurs as sub-microscopic (b2 μ m) euhedral grains oftenintimately associated in aggregates (10ndash20 μ m in size) It also formsdense clusters on the surface of Type-1 gold Type-3 gold contains Agup to ~15 wt
3 Methods
The studied samples are from surface trenches (10ndash50 m in length2ndash3 m in depth) and underground channels (up to 10 m in length)
around the quartz veins All the samples were collected underneath
244 E Salvioli-Mariani et al Journal of Geochemical Exploration 158 (2015) 243ndash 256
7172019 Salvioli et al 2015
httpslidepdfcomreaderfullsalvioli-et-al-2015 314
the soil cap For each trench and channel the length of the sampled in-tervals (1 to 3 m) was adjusted to obtain a complete section from the
quartz vein to the unaltered rock across the hydrothermally alteredzones
31 Analytical methods
Micro-thermometric measurements on 1047298uid inclusions wereperformed using a Linkam THMSG 600 freezingheating stageequipped with a TMS94 temperature control unit and an LNP1freezing control system (Dipartimento di Fisica e Scienze dellaTerra Universitagrave di Parma) The stage calibration was performedwith CO2 and H2O triple points and the melting temperatures of 1047297ve syntheticstandards (40 70 135 200and 398 degC) theestimatedprecision of the data is plusmn 04 degC After freezing the heating rate was
maintained at 5 degCmin up to room temperature and then it was
increased to 10 degCmin up to approximately 150 degC and reduced to2 degCmin until total homogenisation
The micro-Raman measurements on the carbonic phase were per-formedusing a Jobin-Yvon Horiba LabRam spectrometer (Dipartimentodi Fisica e Scienze della TerraUniversitagrave di Parma) equipped with a HendashNe laser (6328 nm emission line) and a doubled NdYAG laser(4731 nm emission line) The spectral resolution was between 2 and3 cmminus1 depending on thesource The confocal hole was adjusted to ob-tain a spatial(lateral and depth) resolution of 1ndash2 μ mMost ofthe spec-tra were obtained using a 50times objective (NA 075) Moreover the100times objective (NA 090) wasalso used forinclusions very near theex-ternal surface The calibration was performed using the 5207 cmminus1
Raman line of silicon The uncertainty of the Raman peak position ob-tained by GaussndashLorentzian deconvolution was less than 05 cmminus1 Awide spectral range (100ndash3600 cmminus1) was scanned for each inclusionHowever the 1047297nal acquisitions were made between 1100 and
1800 cmminus1
for the study of CO2 and graphite and between 2500 and
Fig 1 (A) Geological map of the Lepaguare District Inset tectonic sketch of the Caribbean region T Tegucigalpa MPF MotaguandashPolochic Fault system (B) Geological map of the inves-tigated Canan area showing the geometry of the main quartz veins (see A for its location in the Lepaguare District)
245E Salvioli-Mariani et al Journal of Geochemical Exploration 158 (2015) 243ndash 256
7172019 Salvioli et al 2015
httpslidepdfcomreaderfullsalvioli-et-al-2015 414
3300cmminus1 for methane with a laser excitation wavelength of 6328 nmWater wasdetermined by a laser excitation wavelength of 4731 nm be-tween 2500 and 3400 cmminus1 The acquisition timefor each spectral win-dowwas 120ndash240s with two accumulations The power on the samplesurface was nearly 1 mW
32 Calculation methods
Equilibrium calculations of 1047298uid inclusion physico-chemical con-ditions were performed using COH (version 6ndash08 Huizenga 2005)and HSC chemistry 71 (Roine 2009) COH software calculatesoxygen fugacity by the composition of carbonic 1047298uid (expressed as
molar fraction of CO2) obtained by Raman spectroscopy by the tem-perature and pressure of entrapment of the 1047298uid inclusions HSCsoftware estimates the pH and log f O2 of the mineralising 1047298uid(ldquoequilibrium compositionsrdquo module) Starting from the molar con-centration of the components (in our case H2O CO2 CH4 Na+ Clminus)the GIBBS or SOLGASMIX solvers calculate the values of pH and log f O2 (equilibrium at the speci1047297c isobaricndashisothermal conditions)using the Gibbs free energy minimization method (Roine 2009)
The activityof dissolved species for the AundashSndashCndashClndashH2O system werecalculated using The Geochemists Workbenchreg 7 (GWB) software(Bethke and Yeakel 2008) and data from the UNITHERM thermo-dynamic database version 44 (Shvarov 2008) extracted for tem-perature and pressure conditions estimated from 1047298uid inclusionsusing the K2GWB software (Cleverley and Bastrakov 2005)
4 Results
41 Fluid inclusions
The 1047298uid inclusions investigated in this paper are trapped in quartzcrystals of the mineralising veins of Dos Bocas which is representativeof the entire Canan gold 1047297eld The 1047298uid inclusions are quite abundantand range from a few microns up to 25 μ m in size and can be dividedinto four types on the basis of their composition and textural features(Table 2 Figs 2ndash4)
Type 1 mdash two phases are present at room temperature namely anaqueous liquid and a vapour phase (Fig 2A and B) The vapour to liquidratio is in the range 01ndash02 and the gas bubble often moves at room
temperature The inclusions are irregular to ellipsoidal or have a nega-tive crystal shape varying in size from a few microns to 18 μ m Inmost cases they constitute trails cross-cutting grain boundaries (S in-clusions Fig 2F)
Type 2 mdash this typeconsists of aqueous two-phase inclusions with anH2O-rich liquid and a CO2ndashCH4-bearing 1047298uid at room temperature(Fig 2C D and E) It occurs as an association of L-rich and V-rich inclu-sions which have VL ratios of 02ndash04 and 05ndash07 respectively(Table 2) The bubble comprises a CO2ndashCH4-bearing 1047298uid The carbonic1047298uid (see Sections 42 and 43) is primarily constituted by one phaseliquid and vapour phases rarely occur together Type 2 1047298uid inclusionsare the most abundantTheir morphologyis negative crystalor elongat-ed and irregular Their size varies from 5 to 24μ m Moreover they occurin clusters insidethe quartz crystals or near their boundaries suggesting
Table 1
Principal petrographic features key minerals assemblages and Au grade of the main rock-type units of the Canan ore deposit
Rock type Main petrographic features Key mineral assemblage Au grade
Quartz veins Type (1) Coarse-grained quartzWhite to light grey quartzCockscomb vuggy cavitiesElongated quartz grains
Qz Py Hem Gth Au Ag Low to very low
Type (2) Fine- to medium-grained quartzMilky smoky-grey to clear quartz
Static recrystallization of quartz120deg triple junctions
Qz Py Hem Gth Au Ag Low to very low
Hydrothermally alteredwall-rocks
Proximal zone Clays replace aluminosilicate phases Qz Py Ccp Apy Hem Gth Ilt Dck PrlAlu Dsp Kln
Low to medium
Intermediate zone Fine-grained muscovite replaces aluminosilicatephases
Qz Ms Py Ccp Apy Hem Gth Kln AuAg
High to very high
Distal zone Chlorite replaces biotite and muscovite Chl Qz Ilt Low To MediumUnaltered metamorphic
host-rocksGraphitic schists Very 1047297ne- to medium-grained
Bedding by graphite layeringDynamic recrystallization
Qz Bt Chl Ms Gr Absent
Sericitic schists Very 1047297ne- to medium-grainedLepidoblastic texturesWell-expressed foliation
Fsp Qz Ms Absent
Ag silverAlu alunite Apy arsenopyriteAu gold Bt biotite Ccp chalcopyrite Chlchlorite Dckdickite Dsp diaspore Fspfeldspar Gr graphite Gthgoethite HemhematiteKln kaolinite Iltillite Ms muscovite Prl pyrophyllite Py pyrite Qz quartz
Table 2
Summary of the petrographic features of the studied 1047298uid inclusions
Type A bundance Setting Origin B ubble vol Petrographic features
1 Common Trails S 10ndash20 Aqueous inclusions containing both liquid and vapour phases irregular toellipsoidal and negative crystal shape
2 Very common Clusters isolated trails P PS 25ndash40 L-rich50ndash70 V-rich
Aqueous two-phase inclusions with an H2O-rich liquid containing a CO2ndashCH4-bearing1047298uid negative crystal shape to elongated or irregular
3 Relatively common Clusters trails PS S N80 (carb) CO2ndashCH4-rich inclusions containing liquid plus vapour phases a thin 1047297lm of liquid H2Omay be present
4 Relat ively rare Clusters trails PS S Inclusions containing a dark phase with a lath-shape associated to variable amount of liquid phase
P primary 1047298uid inclusions PS pseudosecondary 1047298uid inclusions S secondary 1047298uid inclusions V vapour phase L liquid phase
246 E Salvioli-Mariani et al Journal of Geochemical Exploration 158 (2015) 243ndash 256
7172019 Salvioli et al 2015
httpslidepdfcomreaderfullsalvioli-et-al-2015 514
growth bands of the quartz crystals (P inclusions) or in trails withinsingle quartz crystals (P or PS inclusions)
Type 3 mdash CO2ndashCH4-rich inclusions that contain liquid and vapourphases comprise this type (Fig 3) The CO2ndashCH4 1047298uid occupies morethan 80 vol of the inclusion Sometimes the inclusion has a smallamount of liquid H2O close to walls or in the acute angles of the cavity
Where notobservedwater most likely forms a thin1047297lm along the inclu-sion walls The inclusion size varies between 4 and 24 μ m They occur inclusters or trails within the quartz crystals (PS and S inclusions)
Type4 mdash this type contains 1047298uidinclusions with an opaque solid anda variable amount of liquid (Fig 4) The opaque solid has a lath shapeand variable size In some inclusions the opaque solid is small (approx-imately 2 μ m about 20ndash30 vol) and surrounded by liquid (Fig 4A B)Rarely it occurs in two-phase inclusions (L + V) where it is in contactwith the bubble the VL ratio is 05ndash07 In most of the inclusions thetrapped opaque solid is anomalously large (70ndash90 vol) compared tothe host inclusions and has a very small amount of liquid on one side(Fig 4C D) They generally occur in clusters and are associated withType 2 and 3 inclusions
Some inclusions are naturally decrepitated and are star-shaped or
surrounded by a halo of tiny inclusions
The quartz crystals do not show growth zone de1047297ned by 1047298uid inclu-sions but some trails of 1047298uid inclusions although discontinuous cansuggest crystal growth According to Bodnar et al (1985) some petro-graphic features of our 1047298uid inclusions can be explained by boiling(i) the association of L-rich and V-rich inclusions (Type 2) where theL-rich inclusions have the liquidvapour ratio apparently variable (bub-
ble 25ndash40 vol) and the V-rich inclusions are a little larger (Fig 2C E)(ii) the occurrence of all V-rich inclusions as planes or trails (Type 3)and (iii) the absence of one-phase liquid inclusions
The relative timing of the 1047298uid inclusions in the quartz crystals isoften unclear because differenttypes of 1047298uidinclusionsare closely asso-ciated and a con1047297dent identi1047297cation of their origin is dif 1047297cult Due to theseveral phases of inclusion entrapment the earlier 1047298uid inclusions maybe modi1047297ed and the hydrothermal orogenic systems appear extremelycomplex Therefore we did a careful selection of the 1047298uid inclusionsfor the microthermometric evaluations
42 Microthermometry
Microthermometricexperiments were performed on more than 250
1047298uid inclusions We have performed the experiments mainly on 1047298uid
Fig 2 Optical microphotographs of Type 1 and 2 1047298uid inclusions (A B) Type 1 S aqueous-rich inclusions very small inclusions in transgranular trails (F) (C D E) Type 2 two-phase in-clusions forming associations of L-rich and V-rich inclusions Bar 10 μ m
247E Salvioli-Mariani et al Journal of Geochemical Exploration 158 (2015) 243ndash 256
7172019 Salvioli et al 2015
httpslidepdfcomreaderfullsalvioli-et-al-2015 614
inclusion assemblages with variable phase ratios (Type 2) These areconsidered the 1047298uid inclusions that have trapped the hydrothermal1047298uids carrying Au The microthermometric data are summarised inTable 3
421 Type 1 inclusions
The prevalent small size of Type 1 inclusions makes the observationof phase transformations during heating dif 1047297cult Approximately 55
inclusions have been measured The 1047297rst phase variation is suggestedby a dotted appearance due to the 1047297rst melting (eutectic temperatureTe) occurring in the range minus234 to minus119 degC The determined temper-aturessuggest theexistence of dissolvedNaCl andorKCl componentsinwater The remaining solid phase always has a clear appearance andmelts primarily from minus 44 to minus15 degC (ice melting temperatureTmice) On the basis of the ice melting temperature the total salin-ity calculated with the software package of Bakker and Brown
Fig 3 Optical microphotographs of Type 3 1047298uid inclusions (A B) Type 3b inclusions showing retrograde condensationduring microthermometric experiments(C D) Type 3c inclusionssuggesting a liquidndashliquid immiscibility Bar 10 μ m
Fig 4 Optical microphotographs of Type 4 1047298uid inclusions containing graphite with different size and variable LV ratios Bar 10 μ m
248 E Salvioli-Mariani et al Journal of Geochemical Exploration 158 (2015) 243ndash 256
7172019 Salvioli et al 2015
httpslidepdfcomreaderfullsalvioli-et-al-2015 714
(2003) and the equation of Zhang and Frantz (1987) is mainly inthe range 22ndash56 wt NaCl equivalent (rarely b 2 or N 56)(Fig 5B)
The total homogenisation temperature (Thtot) to liquid state occurspredominantly in the range 240ndash336 degC (with median and mode at290 degC Table 3 and Fig 5A)
422 Type 2 inclusions
Analyses were performedon more than 170 inclusions According totheir petrographic features L-rich and V-rich inclusions show differentbehaviour during freezing experiments The L-rich inclusions hereafterreferred to as Type 2a have higher freezing temperatures (minus 50 tominus379 degC) whereas the V-rich inclusions hereafter Type 2b have
Table 3
Summary of the microthermometric data of the studied 1047298uid inclusions
Type Te Tmice Tmcla Tmcarb Thcarb Thtot Salinity XCH4
1 minus234 divide minus 119 20
minus44 divide minus 15 34
240 divide 336 (L)[290 290]55
22 divide 56[32 27]
34
2a minus257 divide minus 111 27
minus76 divide minus 1582
56 divide 13482
250 divide 338 (L)[300 280]60
09 divide 48[35 37]82
005 divide 02011
2b minus282 divide minus 1169
minus71 divide minus 129
60 divide 1869
minus649 divide minus 583 23
180 divide 200 (L) 239 divide minus 100 (V) 293 divide 334 (L)299 divide 334 (V)10
1 divide 62 019 divide 0689
3a minus589 divide minus 583 182 divide 189 (V) 022 divide 10 27 3b minus636 divide minus 627 98 divide 125 (V)
3c minus981 divide minus 733 (V) or liquid immiscibilityminus893 divide minus 719
4 minus250 divide minus 197 minus07 divide minus 04 72 minus635
Temperature in degC Te = eutectic temperature Tmice = ice melting temperature Tmcla = clathrate melting temperature Tmcarb = melting temperature of the carbonic phase Thcarb =
homogenisation of the carbonic phase Thtot = total homogenisation temperature (L) = homogenisation to liquid phase (V) = homogenisation to vapour phase Salinity as wt NaClequivalent XCH4 = molar fraction of methane in the carbonic phase determined by Raman spectrometry In square brackets median and mode values respectively in italics number of measurements
Fig 5 Bar diagrams of microthermometric data (A C E) total homogenisation temperature Th tot (B D) total salinity as NaCl equivalent
249E Salvioli-Mariani et al Journal of Geochemical Exploration 158 (2015) 243ndash 256
7172019 Salvioli et al 2015
httpslidepdfcomreaderfullsalvioli-et-al-2015 814
signi1047297cantly lower freezing temperatures (minus90 to minus 121 degC) and thenucleation of a carbonic vapour bubble on cooling occurs also at verylow temperatures
In Type 2a inclusions the 1047297rst melting temperature (Te) primarilyoccurs between minus 253 and minus111 degC (Table 3) values compatiblewith H2OndashNaCl H2OndashKCl and H2OndashNaClndashKCl systems Due to the for-mation of clathrate upon cooling the ice melting temperature has be-come more dif 1047297cult to measure in practice Most Type 2a inclusions
exhibit ice melting temperatures very similar to those obtained fromType 1 inclusions(in therange minus76 to minus15degC Table 3)In a few inclu-sions ofType 2bit was possibleto obtainTe and Tmice (minus282 to minus116and minus 71 to minus 12 degC respectively Table 3)
In Type 2b inclusions a carbonic vapour bubble appears on coolingat two different temperature intervals ie 10 to 16 degC and minus 121 tominus84 degC Melting of the carbonic phase (Tmcarb) occurs mainly fromminus649 to minus 583 degC suggesting CO2 with other non-condensablegases most likely CH4 in variable proportions Due to the small size of the inclusions the detection of the homogenisation of the carbonicphase (as well as the temperature of homogenisation Thcarb) has beenquite dif 1047297cult to obtain Usually homogenisation to the vapour phaseoccurs at temperature Thcarb from minus 239 to minus10 degC (Table 3) andonly in two cases to liquid phase at higher temperature(Thcarb between18 and 20 degC)
In larger inclusions (approximately20 μ m) we were able to measurethe melting temperature of clathrate we employed the method of Collins (1979) using repeated cooling-heating cycles in proximity of the decomposition temperature of clathrate During microthermometricexperiments the clathrate crystals occur as (i) small crystals around thegaseous bubble (ii) colourless crystals in the aqueous phase (making thedetermination of Tmice dif 1047297cult) and (iii) irregular shape and motion of the gaseous bubble The decomposition temperature of clathrates(Tmcla) in the Type 2a inclusions varies mainly from 56 to 134 degC(Table 3) Where detectable Tmcla in Type 2b inclusions is comparableor higher (60ndash186 degC Table 3) At low pressure CH4 clathrate melts attemperatures higher than 15 degC whereas CO2 clathrate melts at lowertemperatures (b10 degC Seitz and Pasteris 1990 Diamond 2003)
The salinity of Type 2 inclusions was calculated using the melting
temperature of clathrates with the software package of Bakker andBrown (2003) and the equations of Duan et al (1992ab) the resultsare comparable with the values obtained for Type 1 inclusions althoughthey extend towards lower values (09ndash48 and 1ndash62 wt NaClequivalent Fig 5D and Table 3) The composition of the carbonic1047298uid is dif 1047297cult to obtain due to the formation of clathrate duringmicrothermometric experiments
Themost frequent values for Thtot (Table 3) are 250ndash338 degC (medianand mode at 300 degC and 280 degC respectively Type 2a Fig 5C) 293ndash334 degC (to liquid phase Type 2b) and 299ndash334 degC (to vapour phaseType 2b Fig 5E)
423 Type 3 inclusions
Only25 inclusions of the Type 3 havebeeninvestigated Most Type 3
inclusions freeze at very low temperatures below minus 85 degC and down tominus136 degC the extremely low water content rarely allows observation of the changes induced by freezing The carbonic phase melts primarily inthe range minus 636 to minus 583 degC (Table 3) similarly to Type 2b inclusionssuggesting a variable proportion of CO2 with other non-condensablegasesmost likely CH4 The melting temperature (Tmcarb) rarely reacheslower values down to minus 699 degC suggesting high contents of CH4 Onlyone determination gave Tmcarb = minus 569 degC
Thehomogenisation of the carbonic phase to vapour phase occurs atdifferenttemperatures (Table 3)(i) 182ndash189 degC forthe inclusions withthe highest Tmcarb (minus589 to minus 583 degC hereafter 3a) and (ii) 98ndash125 degC for the inclusions melting at lower temperatures (minus636 tominus627 degC hereafter 3b Fig 3A B) The homogenisation temperatureto vapour phase of Type 3b inclusions suggests that Tmcarb should be
greater than approximately minus 62 degC (cf Ridley and Hagemann 1999
Thiery et al 1994 Van den Kerkhof and Thiery 2001) This behaviouris the consequence of retrograde condensation (ie the condensationof liquid under isothermal conditions on lowering pressure) which in-creases the temperature of homogenisation (to the gas phase) of the1047298uid inclusions (with a given composition) to values higher than thecritical temperature (Thiery et al 1994 Van den Kerkhof 1988 Vanden Kerkhof and Thiery 2001)
A further subgroup of Type 3 inclusions (hereafter 3c Table 3 and
Fig 3C D) has a varied behaviour at very low temperatures (minus
981to minus733 degC) they apparently homogenise to thevapourphaseand like-ly to another liquid supporting a case of liquidndashliquidndashgas immiscibility(Thiery et al 1994) At room temperature these inclusions have twophases of similar density (Fig 3C D) In some inclusions a meniscusoccurs in the bubble at temperature from minus 893 to minus 719 degC (whichgradually disappears at approximately minus63 to minus 60 degC) and thecarbonic phase appears darker or takes on a bumpy surface
424 Type 4 inclusions
In rare cases it was possible to obtain data during microthermometricexperiments The obtained temperatures (Tmcarb ~ minus 635 degC Te fromminus250 to minus197 degC Tmice from minus07 to minus04 degC and Tmcla 72 degCTable 3) are fully comparable with those of Type 2 and Type 3 inclusions
43 Micro-Raman spectroscopy
To estimate the entrapment conditions we must know both thecomposition and density of the trapped 1047298uid However as statedabove they are dif 1047297cult to obtain for the occurrence of clathrates Toovercome this problem we determinedthe composition of the carbonicphase using micro-Raman spectroscopy
431 CO 2ndashCH 4 1047298uids
For Raman analysis of the carbonic phase we selected approximate-ly 50 inclusions of Type 2 and 3
The Raman spectra of these inclusions are characterised by (i) theRaman active stretchingmodeν1 at 1278ndash1282 cmminus1 and the overtoneof thebending modeν2 (2ν2)at1380ndash1385 cmminus1 typicalof CO2 (Fig6)
and known asthe Fermi diad (Garrabos et al 1980) and(ii) theisolatedC-H stretching band (ν1) of CH4 at 2907ndash2913 cmminus1 (Fig 6 Burke2001) In the spectral area of reduced sulphur species the backgroundsometimes shows a small hump which might be considered as a smallpeak (insetin Fig6C) It occurs atabout 2610cmminus1 suggestingthe pres-ence of a very small amount of H2S associated to the carbonic vapourphase The detection limit is estimated at 1 mol for H2S
According to the literature (Kawakami et al 2003 Van den Kerkhof and Olsen 1990 Wang et al 2011) the changes of frequency in theRaman spectrare1047298ect variations in pressure1047298uid density and tempera-ture The separation between the two bands (Δν) represents a bettermeasure of CO2 density than the peak positions or the ratio of thepeak positions (Kawakami et al 2003 Wang et al 2011) The mea-sured Δν in our 1047298uid inclusions is 1035ndash104 cmminus1 On the basis of
the equation from Wang et al (2011) valid for the entire range of den-sities(with CH4 le 10 mol) the calculatedCO2 density of the investigat-ed 1047298uid inclusions is in the range 034ndash056 gcm3
Similarly the position of the ν1 band is also in1047298uenced by pressureand temperature variations for CH4 Unfortunately we were unable toobtain reliable density values because the equations proposed in the lit-erature have been calibrated using a 51453 nm laser (Lin et al 2007)and are valid for pure or almost pure CH4 (b10 mol of other compo-nents such as CO2) and CH4ndashH2O systems (Lu et al 2007) which areconditions signi1047297cantly different from those of our systems
On the basis of the microthermometric data we infer that the car-bonic components are present in variable proportions and their molefractions have been determined from Raman spectra according toBurke (2001) That study provides a simple formula that considers
CO2 and CH4 peak areas (both CO2 peaks must be considered) CO2
250 E Salvioli-Mariani et al Journal of Geochemical Exploration 158 (2015) 243ndash 256
7172019 Salvioli et al 2015
httpslidepdfcomreaderfullsalvioli-et-al-2015 914
and CH4 Ramanscattering ef 1047297ciencies andCO2 and CH4 instrumental ef-1047297ciencies for the speci1047297c laser wavelength (6328 nm) The CH4 molefraction (XCH4) varies between 005ndash020 in Type 2a 019ndash068 inType 2b and 022ndash10 in Type 3 inclusions (Table 3)
432 Carbonaceous material
Type 4 inclusions are peculiar because they contain a black solidphase with a lath shape and variable proportions of aqueous liquidphase Based on Raman spectra the solid phase is identi1047297ed as graphite25 Raman spectra were acquired for both solid and liquid phases
Raman spectra of the carbonaceous material are very sensitive tochanges in the order degree The1047297rst order bands of the Raman spectraof carbonaceous material are characterised by the G band at approxi-mately 1580 cmminus1 typical of crystalline or ordered graphite the Dband at approximately 1350 cmminus1 and the Dprime band at approximately1620 cmminus1 typical of disordered or defect bearing carbonaceous mate-rial (Aoya et al 2010 Luque et al 1998 Thomsen and Reich 2000Vidano et al 1981) Carbonaceous materials also exhibit a strong
Raman band in the range 2500ndash
2800 cmminus1
which corresponds to the
overtone of the D band This band appears in the second-order Ramanspectra and is called the Gprime band (Pimenta et al 2007) The decreasein the order degree of graphite is also evident by the development of an asymmetry andbandbroadening in the second-order peak and a de-crease in resolution among its constituent bands (Pasteris and Chou1998) If the position of the G band is not affected by the wavelengthof thelaser the Raman frequency of theD band increases with theexci-tation energy (Kawashima and Katagiri 1995 Matthews et al 1999
Vidano et al 1981) Moreover the ratio of the integrated intensity of the D and G bands (IDIG) decreases with increasing laser energyWith our equipment (λ = 6328 nm) the D band is expected at ap-
proximately 1330 cmminus1 The spectra acquired on Type 4 inclusions(Fig 7A B) have frequencies in the range 1332ndash1336 cmminus1 and1578ndash1581 cmminus1 forD and G bands respectivelyThe Dprime bandis alwayspresent as a shoulder on the high-frequency side of the G peak in therange 1613ndash1620 cmminus1 In the region of second-order bands an unre-solved doublet or a large band at approximately 2664ndash2709 cmminus1 oc-curs The D band is broad with low intensity when compared to the Gband and with a very low IDIG ratio (016ndash030) The degree of crystal-linity is represented by the length of ordered crystals along the a
Fig 6 Ramanspectra ofthe carbonicphase inexample Type 2a(A)Type2b (B)andType3 (C) 1047298uid inclusions The intensity scale of the inset is unchanged
Fig 7 Raman spectraof graphite in Type4 1047298uidinclusions (A B) compared with those of
graphite from wall-rock (C)
251E Salvioli-Mariani et al Journal of Geochemical Exploration 158 (2015) 243ndash 256
7172019 Salvioli et al 2015
httpslidepdfcomreaderfullsalvioli-et-al-2015 1014
crystallographic direction designated as L a (Pasteris and Chou 1998)The IDIG ratio and L a are negatively correlated and the most disorderedgraphite is characterised by the highest IDIG and the lowest L a values(Pasteris and Chou 1998) According to the general formula proposedby Pimenta et al (2007) which can be applied to any laser line we ob-tained the crystallite size L a in the range 1300ndash2400 Aring The calculatedparameters and the widths of the D and Gprime bands suggest a fairly gooddegree of graphite crystallinity which is comparable to that of naturally
or laboratory-produced graphite (Luque et al 1998 Pasteris and Chou1998 Perraki et al 2006 Satish-Kumar 2005 Wopenka and Pasteris1993) The Raman spectra of trapped graphite are all similar ( Fig 7AB) suggesting that the precipitation of graphite occurred from the hy-drothermal 1047298uid
The liquid portion associated with trapped graphite contains CO2CH4 and liquid H2O The typical peaks of CO2 (1280ndash1281 and1383ndash1384 cmminus1) and of CH4 (2910ndash2913 cmminus1) were observedusing the 6328 nm laser (Fig 8A) Moreover the peak for liquid H2Oat 3250ndash3252 cmminus1 was detected with the 4731 nm laser (Fig 8B)
Because of thepresenceof graphite in thehost rocks (quartz-sericiticand graphitic schists) for comparison we acquired 6 Raman spectra onthis carbonaceous materials They are completely different from thoseobtained for the graphite in the 1047298uid inclusions (Fig 7C) The D band(1329ndash1334 cmminus1) has a higherintensitythan that ofgraphitein thein-clusions and sometimes reaches the same intensity as the G band at1580ndash1583 cmminus1 Therefore the IDIG ratios are higher (095ndash208)and L a is lower (200ndash400 Aring) supporting the presence of fairly disor-dered graphite The shape of the spectra and the calculated parametersof graphite from the host rock of Canan are comparable to those of thegraphite from metapelites of chlorite facies (Luque et al 1998Wopenka and Pasteris 1993)
5 Discussion
Four types of 1047298uid inclusions have been found in the quartz crystalsfrom the mineralising veins of Dos Bocas a representative example of
gold deposit at Canan Some 1047298uidinclusions are along fractures crossingone or more crystals (Type 1 S inclusions)The most important1047298uid in-clusions constitute discontinuous trails which can suggest crystalgrowth zones (Type 2) The 1047298uid inclusion associations formed by L-richand V-richinclusions (Type 2 P andPS inclusions) andthe presenceof trails entirely constituted by V-rich inclusions(Type 3 PS andS inclu-sions) suggest that the hydrothermal 1047298uid suffered 1047298uid immiscibility(boiling) The trapped 1047298uid consists of an aqueous solution (H2Ondash
NaClndash
KCl with 09ndash
48 wt NaCl equivalent) plus a CO2ndash
CH4 1047298
uid(80ndash90 mol CO2) As shown by Bowers and Helgeson (1983) a pres-sure drop moves the H2O-carbonic phase solvus towards higher tem-perature which causes a decrease of carbonic gas solubility and theexsolution of CO2 (and CH4) gas from the water-rich 1047298uid according tothe Henrys law In geological environments such as Canan where thetectonics aredominatedby strikendashslip fault systems thefracture forma-tion after deformation causes a rapid and immediate reduction in pres-sure The occurrence of some inclusions naturally decrepitated can beexplained by pressure drop The presence of Type 3b 1047298uid inclusionswhich exhibit retrograde condensation further supports the occurrenceof such a pressure drop
Because of 1047298uid immiscibility the total homogenisation temperaturecan be considered as the trapping temperature Isochores have been re-constructed for Type 2 1047298uid inclusions combining the results frommicrothermometry and Raman analyses using the software package of Bakker and Brown (2003) and the equations of Bakker (1999) andDuan et al (1992b) Trapping pressures of 05ndash14 kbar were obtainedThe coexistence of different types of 1047298uid inclusions and their similarvalues of Th suggest that they can be related to the same hydrothermalprocess which wasresponsiblefor the gold mineralisation at CananThedifferentamounts of water andcarbonic1047298uids inthe inclusions is due tothe 1047298uid immiscibility where the H2O-rich 1047298uid is in Type 2a inclusionsand the CO2ndashCH4-rich 1047298uid in Types 2b and 3 inclusions Finally Type 4inclusions would represent the inclusions (both Type 2 and 3) wherethe conditions for graphite precipitation have been achieved
The graphite of the1047298uid inclusions (Type 4) is similar to that precip-itated from hydrothermal1047298uids This indicates that graphite depositionoccurred before or contemporaneously of the entrapment of the 1047298uid
The degree of crystallinity of graphite in the 1047298uid inclusions is higherthan that observed in the graphite from the host quartz-sericitic andgraphitic schists (Fig 7) Nonetheless this does not exclude the pres-ence of a metamorphic component in the mineralising 1047298uids
Equilibrium of graphite in the hydrothermal1047298uid allows the evalua-tion of oxygen fugacity The calculated atomic ratio XO [O(O + H)] isinthe range 032ndash041 (Fig 9) which is typical of slightly reduced 1047298uids(Cesare 1995 Huizenga 2011) Considering temperatures of 300 degCand pressures of 14 10 and 05 kbar (Tt and Pt respectively) graphitesaturation conditions (aC = 1) and the composition of the carbonicphase as inferred by Raman spectroscopy the calculated f O2 is aboutminus342 log unit (ie about 16 log unit above theQFM buffer) This resultis consistent with that obtained using the HSC chemistry software log f O2 asymp minus376 plusmn 25 which permitted us to calculate also the activity
of dissolved hydrogen ions at equilibrium condition between the con-stituents H2OCO2 CH4 Na+ andClminuspH=29plusmn04Itcanbeobservedthat our estimated pH value is low but this range of acidity is not un-common in1047298uid inclusions (egBenison 2013) including gold deposits(Boiron et al 1999 Pokrovski et al 2014)
According to Roedder (1984)thepHin 1047298uid inclusions can be calcu-lated or determined In the latter case the opening of the 1047298uid inclu-sions implies the loss of the trapped gases It follows that the pH isdetermined on a 1047298uid other than the original and which has undergonebasi1047297cation due to the loss of gas
The composition of Type 2 inclusions plotted in the ternary diagramCOH falls within the stability 1047297eld of graphite (towards the CO2 vertexFig 9) and the 1047298uid associated with graphite in Type 4 inclusions isalso constituted by H2OndashCO2ndashCH4 These features support precipitation
of graphite by the reaction CH4 + CO2rarr
2 C + 2 H2O The decrease of
Fig 8 Raman spectraof the1047298uid portion of Type 4 1047298uid inclusions (A)CO2 and CH4 have
been obtained by 6328 nm laser (B) H2O by 4731 nm laser
252 E Salvioli-Mariani et al Journal of Geochemical Exploration 158 (2015) 243ndash 256
7172019 Salvioli et al 2015
httpslidepdfcomreaderfullsalvioli-et-al-2015 1114
temperature andor the increase of pressure move the reaction towardsthe products In our case a combination of cooling and decompressionacted on the system so that the variation of temperature and pressurecannot be responsible for the precipitation of graphite According toHuizenga (2011) the precipitation of graphite is in1047298uenced by XO
value and oxygen fugacity the best conditions for precipitation areXO = 033 and QFM-2 b log f O2 b QFM + 1 Small variations from
these values prevent the precipitation or cause consumption of earlyprecipitated graphite XO values and f O2 of our Type 2 1047298uid inclusions(see above) agree with the Huizenga (2011) data and indicate thatsome 1047298uid inclusions were able to precipitate graphite
The H2S content and the oxygen fugacity of the hydrothermal 1047298uidsaffect the solubility of gold In H 2S-rich 1047298uids Au(HS)2
minus andAu(HS)deg are the dominant Au-complexes and gold has high solubil-ity (Au N 100 ppb) whereas in H2S-poor 1047298uids the gold solubilitydecreases and AuCl2
minus is the dominant stable complex (Gammonsand Williams-Jones 1997) When the partial pressure of H 2S is1047297xed by the magnetitendashpyrite pair the Au bisulphide complex isstable at T b 450 degC and the chloride complex at higher temperature(Mikucki 1998) At high oxygen fugacity H2S is oxidised and thusthe mobility of gold as bisulphide decreases considerably ( Gammons
and Williams-Jones 1997) Experimental studies at temperatures of 350ndash500 degC and pressures of 05ndash1 kbar have shown that Au(HS)2
minus isthe dominant Au complex in near neutral to weakly acidic solutions inthe presence of the K-feldsparndashmuscovitendashquartz mineral associationand at pyritendashpyrrhotitendashmagnetite buffer conditions (Tagirov et al2005)
Many of the conditions employed in the experiments mentionedabove match those of the Canan ore deposit 1047298uid inclusions indicatethe presence of low salinity and low temperature (T b 400 degC) hydro-thermal 1047298uids and XRD data (Mattioli et al 2014) show that the wall-rocks contain the K-feldsparndashmuscovitendashquartzndashpyritendashpyrrothitendashmagnetite association (Table 1) However the hydrothermal 1047298uids atCanan seem to be extremely acidic (pH = 29) which makes Au(HS)degmore stable than Au(HS)2
minus and themost abundant complex in thesolu-
tions (cf also Heinrich et al 2004 Pokrovski et al 2014) Hence we
infer that the gold of Canan was transported by hydrothermal 1047298uids asAu(HS)deg complex
Activity diagrams are a powerful graphical tool for depicting the sta-bility of dissolved species and solid and gas phases with respect to thecomposition of the coexisting solution Calculations on Au speciationwere performed under the mean conditions estimated by the analysisof the 1047298uid inclusions and the results plotted in log f O2-pH diagrams(Fig 10) The decrease in solubility of the Aundashsulphide complexes can
be ascribed both to the fracturation-induced pressure drop andthe con-centration of sulphur in solution According to Mattioli et al (2014) thegold deposit of Canan was formed by the hydrothermal 1047298uid activityalong fractures produced by tectonics Opening and lateral expansionof the fractures produce a pressure drop on the 1047298uids themselves andboiling of the dissolved gases The 1047298uid composition affects the depthof boiling which is an ef 1047297cient mechanism for gold precipitation(Hedenquist et al 1992 Pokrovski et al 2014 Robb 2010 Sibson1987) Boiling produced the exsolution of H2S which in turn caused adecrease in the solubility of theAundashsulphide complexes and the precip-itation of gold (Fig 10) In the case of the Canan deposit boiling repre-sents only the initial phase of gold deposition In fact the main bodyof thegoldmineof Canan is located in metamorphic rocks cutby quartzveins where hydrothermal 1047298uids altered the primary mineralogy andchanged their composition and ability to carry gold in solution In theore deposit Au coexists with sulphides and in particular small grainsof pure gold are surrounded by pyriteand other sulphides This suggeststhat gold was deposited by reactions involving 1047298uids containing Au-Scomplexes and the wall-rock containing chalcophile elements particu-larly Fe a process known as ldquosulphidationrdquo (Williams-Jones et al 2009and references therein Robb 2010) At Canan Fe is abundant in freshwall-rocksfor thepresence of biotiteand chloriteThese minerals disap-pear in the vicinity of quartz veins of the ore deposit where the highestconcentration of gold and sulphides are observed (Mattioli et al 2014)During the alteration of biotite and chlorite Fe is released into the hy-drothermal 1047298uids and likely produces the following reaction with theAundashsulphide complexes
AuethHSTHORN∘ethaqTHORN thorn 05Fe2thornharr05FeS2ethPyriteTHORN thorn H
thorn thorn Au∘ethGoldTHORN eth1THORN
Under equilibrium conditions and assumingP = 1400barT = 300 degCand the water activity H2O = 1 the resulting log K is 53151 (ΔGdeg-R = minus 5833 kJ molminus1) The high value of the equilibrium constant Kand the highly negative value of ΔGdegR indicate that the reaction has aspontaneous tendency towards the products According to Robb (2010)these reactions occur in dynamic systems where kinetics predominatesover equilibrium conditions Therefore it is very unlikely that reaction(1) occurs under equilibrium conditions in an open natural system Be-cause of the continuous supply of Au(HS)deg from the hydrothermal 1047298uidsand Fe2+ from the alteration of biotite and chlorite (within the zones of 1047298uid-rock interaction) reaction (1) is imbalanced and pushed towardsthe products by favouring the deposition of gold and sulphides This isin agreement with Pokrovski et al (2014) who state that the interactionof sulphur-rich hydrothermal 1047298uids and Fe2+-rich wall rocks(sulphidation) is one of the main processes leading to the precipitationof gold
Additionally the activity of sulphur in the 1047298uids is responsible forthe solubilisation and transport of gold At Canan the activity of Sought to be at least 10minus2 Above this value the composition of hydro-thermal 1047298uid plots in the stability 1047297eld of Au(HS)deg (Fig 10) Withlower concentrations of S (and lower pressure) the transportof gold oc-curs as chloride (Fig 10L M and N) If iron is no longer available aftercomplete alteration of biotite and chlorite the deposition of goldcould be represented by the reaction
AuethHSTHORN∘ethaqTHORN thorn 05H2ethgTHORNharrH2SethgTHORN thorn Au∘ethGoldTHORN eth2THORN
where log K = 69130 (ΔGdegR = minus 7586 kJ molminus1) at T = 300 degC and
P = 1400 bar indicates once again a spontaneous tendency towards
Fig 9 Ternary CndashOndashH diagramshowing thecarbon saturatedsurface (solid line) at 300degCand1400 barcalculated by Perple_Xsoftware(J Connollywwwperplexethzch) Dashedlines represent the compositional triangle H2OndashCO2ndashCH4 dotted 1047297eld Type 2a inclusionsstriped 1047297eld Type 2b inclusions Lines of constant XO 035 and 040 (dot-dashed lines) arealso shownTheopencircles andthenumbers initalics indicate f O2
1047298uid relative toQFM buff-er in log10 units (log f O2
1047298uidndashlog f O2
QFM) for 1047298uids in equilibrium with graphite
253E Salvioli-Mariani et al Journal of Geochemical Exploration 158 (2015) 243ndash 256
7172019 Salvioli et al 2015
httpslidepdfcomreaderfullsalvioli-et-al-2015 1214
theproducts andthe presence of H2 agrees with the reducing conditions(log f O2 asymp minus376) found in the hydrothermal 1047298uids of Canan Reaction(2) would be effective during boiling andor decompression (cf Boyle1969 Pokrovski et al 2014) Similarly to reaction (1) the dynamicsystem conditions (the continuous supply of Au(HS)deg and loss of H2S)favour the kinetic of the reaction (2) and con1047297rm the statements of Robb (2010) and Sibson (1987) on the ef 1047297ciency of this process forgold deposition Finally the kinetics of reaction (1) is further increasedby the alteration of feldspar and muscovite in kaolinite and diaspore (cfMattioli et al 2014) The mineral alterations subtract H+ from the solu-
tion (Drever 1997) favouring the precipitation of Au
6 Concluding remarks
The quartz veins associated with gold mineralisations from DosBocas (Canan area Lepaguare District east-central Honduras) are richin 1047298uid inclusions of four main types Type 1 mdash S two-phaseaqueous-rich inclusions Type 2 mdash P to PS aqueous-rich inclusionswith an H2O-rich liquid and a CO2ndashCH4-bearing liquid Type 3 mdash PSto S CO2ndashCH4-rich inclusions with a very small amount of waterand Type 4 mdash graphite-bearing aqueousndashcarbonic 1047298uid
The association of L-rich and V-rich inclusions (Type 2) and the oc-currence of trails containing only V-rich inclusions (Type 3) support a
1047298uid immiscibility (boiling)of the hydrothermal1047298uidThe hydrothermal
trapped 1047298uid is constituted by H2O + alkali chloride + CO2 plusmn CH4 Thecalculated salinity varies from 09 to 48 wt NaCl equivalent
The immiscibility of 1047298uids can be related to a pressure decrease dueto both the opening of fractures and upward 1047298ow of 1047298uids At Canan astrikendashslip fault systemis responsible for the fracturing of the metamor-phic wall-rocks Thisgeological setting with the mineralogicalpetrolog-ical and geochemical features supports an orogenic character of theinvestigated gold deposits
In some 1047298uid inclusions the occurrence of graphite with typical fea-tures of graphite precipitated from hydrothermal 1047298uids suggests that
the deposition of graphite was prior or concomitant with the entrap-ment of the 1047298uid Moreover the occurrence of graphite associated towater andcarbonic1047298uidssupports the presence of a metamorphic com-ponent in the mineralising 1047298uid
Microthermometric and spectroscopic data from 1047298uid inclusionssuggest that the gold mineralisations at Canan formed at T = 300 degCunderP=500ndash1400 barsThecalculated oxygenfugacityand pH valuesof the hydrothermal 1047298uids are approximately minus 376 plusmn 25 log unit(1 log unit above the QFM buffer) and 29 plusmn 04 respectively
The hydrothermal 1047298uids contained sulphur (activity of S ge 10minus2)assuggested by the association of gold with sulphides including pyriteand chalcopyrite For the above chemical and physical conditions themost abundant sulphur specie carrying gold in solution is the Au(HS)degcomplex Several causes are responsible for the precipitation of gold in
the Canan area 1 mdash boiling following the pressure drop caused by
Fig 10 Activity diagrams for the system AundashCndashClndashSndashH2O at 300 degC Au and H2O activity 10minus7 (~10 ppb) and 100 respectively Cl 10minus098 and C buffered by graphite (see ldquoCalculationmethodsrdquo) Variable values of pressure are considered 1400 bar (A B C and D) 1000 bar (E F G and H) 500 bar (I L M and N) Activities of total dissolved S are 10minus1 (A E and I)10minus2 (B F and L) 10minus3 (C G and M) and buffered by pyrite (D H and N) Green 1047297eld represents the mean composition of the 1047298uid inclusions (pH = 29 plusmn 04 log f O2 = minus 376 plusmn25) Red lines limit the 1047297elds of Au species dashed black lines the S species and dashed blue lines the carbon species The thickness of the red lines corresponds to an uncertainty of log [Au] = plusmn01 or log [H2O] = plusmn02
254 E Salvioli-Mariani et al Journal of Geochemical Exploration 158 (2015) 243ndash 256
7172019 Salvioli et al 2015
httpslidepdfcomreaderfullsalvioli-et-al-2015 1314
tectonic andor hydrothermal 1047298uids activity 2 mdash sulphidation triggeredby the liberation of metal cations during the alteration of ma1047297c min-erals of the wall-rocks 3 mdash hydrothermal alteration of feldspars andphyllosilicates of the wall-rocks
Acknowledgements
The authors wish to thank M Menichetti for providing samples of
the quartz veins and the Goldlake Group for the permission to publishthe results of this study Special thanks are due to John Ridley for theuseful and encouraging suggestions which have noticeably improvedthequality of this paperSincere thanksare dueto BJStacey forimprov-ing the English
References
Alvarez-Gogravemez JA Meijer PT Martigravenez-Digraveaz JJ Capote R2008 Constraintsfrom1047297nite element modeling on the active tectonics of northern Central America andthe Middle America Trench Tectonics 27 TC1008 httpdxdoiorg1010292007TC002162
Andrada de Palomera P van Ruitenbeek FJA van der Meer FK Fernaacutendez R 2012Geochemical indicators of gold-rich zones in the La Jose1047297na epithermal depositDeseado Massif Argentina Ore Geol Rev 45 61ndash80
Aoya M Kouketsu Y Endo S Shimizu H Mizukami T Nakamura D Wallis S 2010Extending the applicability of the Raman carbonaceous-material geothermometer
using data from contact metamorphic rocks J Metamorph Geol 28 895ndash914Bakker RJ 1999 Adaptation of the Bowers and Helgeson (1983) equation of state to the
H2OndashCO2ndashCH4ndashN2ndashNaCl system Chem Geol 154 225ndash236Bakker RJ Brown PE 2003 Computer modelling in 1047298uid inclusion research In
Samson I Anderson A Marshall D (Eds) Fluid Inclusions Analysis and interpreta-tion Mineralogical Association of Canada Short Course Series 32 pp 175ndash212
Benison KC 2013 Acid saline 1047298uid inclusions examples from modern and Permianextreme lake systems Geo1047298uids 13 579ndash593
Bersani D Salvioli-Mariani E Mattioli M Menichetti M Lottici PP 2009 Raman andmicro-thermometric investigation of the 1047298uid inclusions in quartz in a gold-richformation from Lepaguare mining district Spectrochim Acta A 73 443ndash449
Bethke CM Yeakel S 2008 The Geochemists Workbenchreg mdash Release 7 GWB Essen-tials Guide mdash Hydrogeology Program University of Illinois (100 pp)
Bodnar RJ Reynolds TJ Kuehn CA 1985 Fluid-inclusion systematics in epithermalsystems In Berger BR Bethke PM (Eds) Geology and Geochemistry of Epithermal Systems Reviews in Economic Geology 2 pp 73ndash97
Boiron MC Cathelineau M Essarraj S Lespinasse M Sellier E 1991 Characterizationof the relationships between deformation 1047298uid migration and Au deposition in
quartz veins methodology and modelling Proceedings Gold 91 AA BalkemaPublishers Brazil pp 637ndash643Boiron MC Moissette A Cathelineau M Banks D Monnin C Dubessy J 1999
Detailed determination of palaeo1047298uid chemistry an integrated study of sulphate-volatile rich brines and aquo-carbonic 1047298uids in quartz veins from Ouro Fino(Brazil) Chem Geol 154 179ndash192
Botros NS 2004 A new classi1047297cation of the gold deposits of Egypt Ore Geol Rev 251ndash37
Bowers TS Helgeson HW 1983 Calculation of the thermodynamic and geochemicalconsequences of nonideal mixing in the system H2OndashCO2ndashNaCl on phase relationsin geological systems equation of state for H 2OndashCO2ndashNaCl 1047298uids at high pressuresand temperatures Geochim Cosmochim Acta 47 1247ndash1275
Boyle RW 1969 Hydrothermal transport and deposition of gold Econ Geol 64112ndash115
Burke EAJ 2001 Raman microspectrometry of 1047298uid inclusions Lithos 55 139ndash158Callaghan T 2001 Geology and host-rock alteration of the Henty and Mount Julia gold
deposits western Tasmania Econ Geol 96 (5) 1073ndash1088Carpenter RH 1954 Geology and ore deposits of the Rosario mining district and San
Juancito Mountains Honduras Central America Geol Soc Am Bull 65 23ndash28
Cepedal A Fuertes-Fuente M Martiacuten-Izard A Garciacutea-Nieto J Boiron MC 2013 Anintrusion-related gold deposit (IRGD) in the NW of Spain the Linares deposit igne-ous rocks veins and related alterations ore features and 1047298uids involved
J Geochem Explor 124 101ndash126Cesare B 1995 Graphite precipitation in CndashOndashH 1047298uid inclusions closed system compo-
sitional and density changes and thermobarometric implications Contrib MineralPetrol 122 25ndash33
Cleverley JS Bastrakov EN 2005 K2GWB Utility for Generating Thermodynamic DataFiles for the GeochemistsWorkbenchregat 0ndash1000 degC and 1ndash5000 bar from UT2K andthe UNITHERM Database
Collins PLF 1979 Gas hydrates in CO2-bearing 1047298uid inclusions and the use of freezingdata for estimation of salinity Econ Geol 74 1435ndash1444
Deksissa DJ Koeberl C 2005 Geochemistry alteration and genesis of gold mineraliza-tion in the Okote area southern Ethiopia Geochem J 38 307ndash331
Diamond LW 2003 Introduction to gas-bearing aqueous 1047298uid inclusions In Samson IAnderson A Marshall D (Eds) Fluid Inclusions Analysis and interpretation Miner-alogical Association of Canada Short Course Series 32 pp 101ndash158
Drever JI 1997 The Geochemistry of Natural Water Prentice-Hall Upper Saddle RiverNew Jersey
Drobe J Cann RM 2000 CundashAu skarn mineralization Minas de Oro District HondurasCentral America Explor Min Geol 9 51ndash63
Duan Z MoslashllerN WeareJK 1992a An equation of state for theCH4ndashCO2ndashH2O systemI Pure systems from 0 to 1000 degC and 0 to 8000 bar Geochim Cosmochim Acta 562605ndash2617
Duan Z MoslashllerN Weare JK 1992b Anequationof statefor the CH4ndashCO2ndashH2O systemII Mixtures from 50 to 1000 degC and 0 to 1000 bar Geochim Cosmochim Acta 562619ndash2631
Esmaeily D Afshooni SZ Mirnejad H Rashidnejad-e-Omran N 2012 Mass changesduring hydrothermal alteration associated with gold mineralization in the Astanehgranitoid rocks western Iran Geochem Explor Environ Anal 12 161ndash175
Gammons GH Williams-Jones AE 1997 Chemical mobility of Gold in the porphyryndash
epithermal environment Econ Geol 92 45ndash59Garofalo P Matthaumli SK Heinrich C 2002 Three dimensional geometry ore
distribution and time-integrated mass transfer through the quartzndashtourma-linendashgold vein network of the Sigma deposit (Abitibi belt mdash Canada) Geo1047298uids2 217ndash232
Garrabos Y Tufeu R Le Neindre B 1980 Rayleigh and Raman scattering near the crit-ical point of carbon dioxide J Chem Phys 72 (8) 4637ndash4651
Groves DI Goldfarb RJ Robert F Hart CJR 2003 Gold deposits in metamorphicbelts overview of current understanding outstanding problems future researchand exploration signi1047297cance Econ Geol 98 1ndash29
Guzman-Speziale M 2001 Active seismic deformation in the grabens of northern Cen-tral America and its relationship to the relative motion of the North AmericandashCarib-bean plate boundary Tectonophysics 337 39ndash51
Hedenquist JF Reyes AG Simmons SF Taguchi S 1992 The thermal and geochemi-cal structure of geothermal and epithermal systems a framework for interpreting1047298uid inclusion data Eur J Mineral 4 989ndash1015
Heinrich CA Driesner TStefaacutensson ASeward TM 2004 Magmatic vapor contractionand the transport of gold from the porphyry environment to epithermal ore deposits
Geology 32 761ndash764Horne G Clark G Pushkar P 1976 Pre-Cretaceous rocks of northwestern Honduras
basement terrane in Sierra de Omoa AAPG Bull 60 566ndash583Huizenga J-M 2005 COH an Excel Spreadsheet for composition calculations in the Cndash
OndashH 1047298uid system Comput Geosci 31 797ndash800Huizenga J-M 2011 Thermodynamic modelling of a cooling CndashOndashH 1047298uid-graphite sys-
tem implications for hydrothermal graphite precipitation Miner Deposita 46 23ndash33KawakamiY YamamotoJ Kagi H2003 Micro-Ramandensimeterfor CO2 inclusionsin
mantle-derived minerals Appl Spectrom 57 (11) 1333ndash1339Kawashima Y Katagiri G 1995 Fundamentals overtones and combinations in the
Raman spectrum of graphite Phys Rev B 52 10053ndash10059Klein EL Koppe JC Moura CAV 2002 Geology and geochemistry of the Caxis gold
deposit and geochronology of thegold-hosting Caxias Microtonalite Sao Luis Cratonnorthern Brazil J S Am Earth Sci 14 837ndash849
Lin F Bodnar RJ Becker SP 2007 Experimentaldetermination of the RamanCH4 sym-metric stretching (ν1) band position from 1ndash650 bar and 03ndash22 degC application to1047298uid inclusion studies Geochim Cosmochim Acta 71 3746ndash3756
Lu W Chou I-M Burruss RC Song Y 2007 An uni1047297ed equation for calculating meth-ane vapor pressures in the CH4ndashH2O system with measured Raman shifts GeochimCosmochim Acta 71 3969ndash3978
Luque FJ Pasteris JD Wopenka B Rodas M Barrenechea JF 1998 Natural 1047298uid-deposited graphite mineralogical characteristics and mechanisms of formationAm J Sci 298 471ndash498
Mann P Burke K 1984 Neotectonics of the Caribbean Rev Geophys 22 309ndash362Mann P Burke K 1988 Cenozoic rift formation in the northern Caribbean Geology 12
732ndash736MatthewsMJ Pimenta MA Dresselhaus GDresselhaus MS Endo M1999 Originof
the dispersive effects of the Raman D band in carbon materials Phys Rev B 59R6585ndashR6588
Mattioli M Menichetti M Renzulli A Toscani L Salvioli-Mariani E Suarez P 2014Genesis of the hydrothermal gold deposits in the Canan area Lepaguare DistrictHonduras Int J Earth Sci 103 901ndash928
Mikucki EJ 1998 Hydrothermal transport and depositional processes in Archean lode-gold systems a review Ore Geol Rev 13 307ndash321
Mills RA Hugh KE Feray DE Swolfs HC 1967 Mesozoic stratigraphy of HondurasAAPG Bull 51 1711ndash1786
Miur TL 2002 The Hemlo gold deposit Ontario Canada principal deposit characteris-
tics and constraints on mineralization Ore Geol Rev 21 1ndash
66Pasteris JD Chou I-M 1998 Fluid-deposited graphitic inclusions in quartz comparisonbetween KTB (German Continental Deep-Drilling) core samples and arti1047297cially re-equilibrated natural inclusions Geochim Cosmochim Acta 62 109ndash122
Perraki M Proyer A Mposkos E Kaindl R Hoinkes G 2006 Raman micro-spectroscopy on diamond graphite and other carbon polymorphs from theultrahigh-pressure metamorphic Kimi Complex of the Rhodope Metamorphic Prov-ince NE Greece Earth Planet Sci Lett 24 672ndash685
Phillips GN Powell R 2009 Formation of gold deposits review and evaluation of thecontinuum model Earth-Sci Rev 94 1ndash12
Pimenta MA Dresselhaus G Dresselhaus MS Canccedilado LG Jorio A Saito R 2007Studying disorder in graphite-based systems by Raman spectroscopy Phys ChemChem Phys 9 1276ndash1291
Pokrovski GS Akin1047297ev NN Borisova AY Zotov AV Kouzmanov K 2014 Gold spe-ciation and transport in geological 1047298uids insights from experiments and physicalndashchemical modelling Geol Soc Lond Spec Publ httpdxdoiorg101144SP4024(Online First)
Ratschbacher L Franz L Min M Bachmenn R Martens U Stanek K Stubner KNelson BK Herrmann U Weber B Loacutepez-Martiacutenez M Jonckheere R Sperner
255E Salvioli-Mariani et al Journal of Geochemical Exploration 158 (2015) 243ndash 256
7172019 Salvioli et al 2015
httpslidepdfcomreaderfullsalvioli-et-al-2015 1414
B Tichomirowa M McWilliams MO Gordon M Meschede M Bock P 2009 TheNorth AmericanndashCaribbean plate boundary in MeacutexicondashGuatemalandashHonduras In
James KH Lorente MA Pindell JL (Eds) The Origin and Evolution of the Caribbe-an Plate Geological Society London Special Publications 328 pp 219ndash293
Ridley JR Diamond LW 2000 Fluid chemistry of orogenic lode-gold deposits and im-plications for genetic models In Hagemann S Brown PE (Eds) Gold in 2000 Re-views in Economic Geology 13 pp 141ndash162
Ridley J Hagemann SG 1999 Interpretation of post-entrapment 1047298uid-inclusion re-equilibration at the Three Mile Hill Marvel Loch and Grif 1047297ns Find high-temperature lode-gold deposits Yilgran Craton Western Australia Chem Geol154 257ndash278
Robb L 2010 Introduction to Ore-forming Processes Blackwell Publishing Malden USARoberts RJ Irving EM 1957 Mineral deposits of Central America U S Geol Surv Bull1034 205
Roedder E 1984 Fluid inclusions Reviews in Mineralogy 12 Mineralogical Society of America Washington DC
Rogers RD Mann P 2007 Transtensional deformation of the western CaribbeanndashNorthAmerica plate boundary zone In Mann P (Ed) Geologic and Tectonic Developmentof the Caribbean Plate in Northern Central America Geological Society of AmericaSpecial Paper 428 pp 37ndash64
Rogers RD Mann P Emmet PA 2007 Tectonic terranes of the Chortis block based onintegration of regional aeromagnetic and geologic data In Mann P (Ed) Geologicand Tectonic Development of the Caribbean Plate in Northern Central America Geo-logical Society of America Special Paper 428 pp 65ndash88
Roine A 2009 HSC Chemistryreg 70 Users Guide ndash Volume frac12 ndash Chemical Reaction andEquilibrium Software With Extensive Thermochemical Database and Flowsheet Sim-ulation Outotec Information Center Finland
Samson IM Williams-Jones A-E Ault KM Gagnon JE 2008 Source of 1047298uids formingdistal ZnndashPbndashAg skarns evidence from laser ablation-inductively coupled plasma-mass spectrometry analysis of 1047298uid inclusions from El Mochito Honduras Geology
36 947ndash950Satish-Kumar M 2005 Graphite-bearing CO2-1047298uid inclusions in granulites insights on
graphite precipitation and carbon isotope evolution Geochim Cosmochim Acta 69(15) 3841ndash3856
Seitz JF Pasteris JD 1990 Theoretical and practical aspect of differential partitioning of gases by clathrate hydrates in 1047298uid inclusions Geochim Cosmochim Acta 54631ndash639
Shvarov YV 2008 HCh new potentialities for the thermodynamic simulation of geo-chemical systems offered by Windows Geochem Int 46 834ndash839
Sibson RH 1987 Earthquake rupturing as a mineralizing agent in hydrothermal sys-tems Geology 15 701ndash704
Silva-Romo G 2008 GuayapendashPapalutla fault system a continuous Cretaceous structurefrom southern Mexicoto theChortis BlockTectonicimplicationsGeology 3675ndash78
Spooner ETC Bray CJ Wood PC Burrows DR Callan NJ 1987 Aundashquartz vein andCundashAundashAgndashMondashanhydrite mineralization HollingerndashMcIntyre Mine Timmins
Ontario δ13C values (McIntyre) Fluid inclusion gas geochemistry pressure (depth)estimation and H2OndashCO2 phase separation as a precipitation and dilation mecha-nism Ont Geol Surv Misc Pap 136 35ndash56
Su W Xi B Xia B Zhang X Hu R 2008 Visible gold in arsenian pyrite at theShuiyindong Carlin-type gold deposit Guizhou China implications for the environ-ment and processes of ore formation Ore Geol Rev 33 667ndash679
Sundblad K Cumming GL Krstic D 1991 Lead isotope evidence for the formation of epithermalgold quartzveins in theChortis BlockNicaragua Econ Geol 86 944ndash959
Tagirov BR Salvi S Schott J Baranova NN 2005 Experimental study of goldndash
hydrosulphide complexing in aqueous solutions at 350ndash500 degC 500 and 1000 barsusing mineral buffers Geochim Cosmochim Acta 69 (8) 2119ndash2132
ThieryR Vanden Kerkhof AM Dubessy J 1994 vX properties of CH4ndash
CO2 and CO2ndash
N21047298uid inclusions modelling for T b 31 degC and P b 400 bars Eur J Mineral 6 753ndash771
Thomsen C Reich S 2000 Double resonant Raman scattering in graphite Phys RevLett 85 5214ndash5217
Van den Kerkhof AM 1988 The System CO2ndashCH4ndashN2 in Fluid Inclusions TheoreticalModelling and Geochemical Applications (PhD Thesis Amsterdam)
Vanden Kerkhof AM OlsenSN 1990 A natural example of superdense CO2 inclusionsmicrothermometry and Raman analysis Geochim Cosmochim Acta 54 895ndash901
Van den Kerkhof AM Thiery R 2001 Carbonic inclusions Lithos 55 49ndash68Vidano RP Ischbach DB Willis LJ Loehr TM 1981 Observation of Raman band
shifting with excitation wavelength for carbons and graphites Solid State Commun39 341ndash344
Wang X Chou I-M Hu W Burruss RC Sun Q Song Y 2011 Raman spectroscopymeasurements of CO2 density experimental calibration with high-pressure opticalcell (HPOC) and fused silica capillary capsule (FSCC) with application to 1047298uid inclu-sion observations Geochim Cosmochim Acta 75 4080ndash4093
Williams-Jones AE Bowell RJ Migdisov AA 2009 Gold in solution Elements 5281ndash287
Williams-Jones AE Samson IM Ault KM Gagnon JE Fryer BJ 2010 The genesis of
distal zinc skarns evidence from the Mochito deposit Honduras Econ Geol 1051411ndash1440
Wopenka B Pasteris JD 1993 Structural characterization of kerogens to granulite-facies graphite applicability of Raman microprobe spectroscopy Am Mineral 78533ndash557
Yang F Mao J Wang Y Bierlein F 2006 Geology and geochemistry of the Bulongquartzndashbarite vein-type gold deposit in the Xinjiang Uygur Autonomous RegionChina Ore Geol Rev 29 52ndash76
Zhang YG Frantz JD 1987 Determination of the homogenization temperatures anddensities of supercritical 1047298uids in the system NaClndashKClndashCaCl2ndashH2O using synthetic1047298uid inclusions Chem Geol 64 335ndash350
256 E Salvioli-Mariani et al Journal of Geochemical Exploration 158 (2015) 243ndash 256
7172019 Salvioli et al 2015
httpslidepdfcomreaderfullsalvioli-et-al-2015 214
metamorphic rocks that are related to the Late CretaceousndashEarly Tertiarymagmatic systems extending from Guatemala to Costa Rica (eg Robertsand Irving 1957 Samson et al 2008 Sundblad et al 1991Williams-Jones et al 2010) However with the exception of gold de-posits in the Rosario Mining District (San Juancito Mts Carpenter1954) and Minas de Oro District (Central Highlands Drobe and Cann2000) very little is known about the genesis of the gold deposits in thisregion Recent investigations in CentralndashEastern Honduras (Bersani
et al 2009 Mattioli et al 2014) were focused on the gold deposits inthe Canan area (Lepaguare District Olancho Department) In thislocation gold mineralizations are hosted in metamorphic rocks fromsub-greenschist to granulite facies Gold is found in both quartz veinsand disseminated (with sulphides) in the altered host-rock Particularlythe quartz of the veins is rich in1047298uid inclusions thatwere trapped duringhydrothermal growth or because of the healing of the fractures
In this paper we report a detailed 1047298uid inclusions study of the Au-quartz veins from Canan that integrates and completes the work of Bersani et al (2009) Our purpose is to contribute to the knowledge of the physico-chemical characteristics of the Au-mineralising 1047298uids andthe conditions of transport and deposition of gold in orogenicenvironments
2 General setting
21 Geodynamic and geological background
The geodynamic evolution of Honduras is the result of the complexinteraction along a triple junction among the North American platethe Cocos plate and the Caribbean plate (eg Guzman-Speziale 2001Mann and Burke 1984 1988 Rogers and Mann 2007 Silva-Romo2008) This interaction is responsible for the Central American subduc-tionsystem which consists of a north-eastwards slabsubduction underthe Caribbean andthe North American plates The subduction is obliqueto the plate boundary and both transpressional and transtensional tec-tonics seem to be active (Alvarez-Gogravemez et al 2008)
The Caribbean plate includes minor crustal blocks like the Chortisblock which has traditionally been referred to the Precambrianndash
Paleozoic continental nucleus of Northern Central America (Rogerset al 2007 Fig 1) The Chortis block is separated from the NorthAmerican plate by the MotaguandashPolochic sinistral transform fault(northern side) and from the Cocos plate by the Middle AmericanTrench (Fig 1) Recent studies (eg Rogers and Mann 2007 Rogerset al 2007) show that the Chortis block can be divided into differenttectonic terranes Its Paleozoic metamorphic basement consists of well-foliated graphitic and sericitic schists (Cacaguapa SchistsCarpenter 1954 Horne et al 1976) that extensively crop out in thestudy area (Fig 1A) This Paleozoic basement is overlain by a fairlythick sequence of Jurassic to Cretaceous sedimentary rocks which arecomprised of three main units Agua Fria andAtima formations belong-ing to the Yojoa Group and Valle de Angeles Formation ( Mills et al1967 Rogers et al 2007) During the Upper CretaceousndashLower Tertiary
(Ratschbacher et al 2009) the Paleozoic basement and its Mesozoicsedimentary cover were intruded by granodiorite plutons which cropout in the south and in the north-northwest sectors of the investigatedarea (Fig 1A)
The Canan area is located in the Lepaguare District between thesouthern margin of the Lepaguare Valley and Rio Guayape about100 km north-east of Tegucigalpa (Fig 1) The Lepaguare valley repre-sents an important boundary between extensional and strikendashslipstructures mainly related to the Guayape fault system which is one of the major tectonic structures within the Chortis block of the CaribbeanPlate In particular the Canan mining area is located between the LaRosandashCampamento and JuticalpandashRio Jalaacuten fault systems (Fig 1A)which represent different strands of the main Guayape fault systemand have main left lateral transtensional kinematics The main gold
mineralisation occurs just where the northern shear zone (Dos Bocasndash
Quebrada Los Mochos) cuts the NndashS striking faults at Dos Bocas(Fig 1B)
22 Canan ore deposit
The Canan ore deposit roughly corresponds to the extent of thequartz veins and hydrothermally altered host-rocks A summary of themain rock types and mineral assemblages of the different zones of the
Canan ore deposit as well as those of the unaltered metamorphichost-rocks is reported in Table 1The quartz veinsare hosted in theCacaguapa Schists and have a var-
iable thickness ranging from 2 to 30 cm with an average of 15 cm atthe intersections of the two fracture systems the thickness of thequartz-veins signi1047297cantly increases up to 1 m The veins exhibit a varie-ty of textures including massive ribboned banded and stock-workswith anastomizing gashes and dilations Quartz is always the mainphase of the veins ranging from 90 to 100 vol and two types of tex-tures can occur locally even in the same vein (Table 1) Quartz crystalsoften enclose sulphides sulphosalts Fe-oxidesndashhydroxides and nativeelements such as gold silver bismuth and arsenic Gold is rare in thequartz veins occurs as inclusions in yellow small (2ndash10 μ m) grains of pyriteand 1047297llssmallcracksin a complex association with pyritendashchalco-pyrite The quartz crystals of the veins are often rich in 1047298uid inclusions
The hydrothermally altered zones extend from the veins outwardsfrom few centimetres to 15 m in thickness depending on the host-rock and vein width Starting from the unaltered metamorphic host-rock we distinguished three main alteration zones of the wall-rockswhich graded into each other and represented different stages of thesame alteration process due to variation of the 1047298uidrock ratio (Robb2010 Table 1) The distal zone is marked by the presence of chlorite(clinochlore type) The intermediate zone is volumetrically the largestoneand is characterised by thedominantpresence of muscovite Theas-sociation of quartz + muscovite + pyrite is prevailing chalcopyrite ar-senopyrite galena sphalerite Fe-oxidesndashhydroxides phosphatessulphosalts and native elements occur in variable amounts Native ele-ments are represented by gold silver and Platinum Group ElementsThis zone smoothly grades into a proximal zone with a progressive in-
crease in clayminerals and vuggy silicaClayminerals mainly kaolinitereplace aluminosilicates such as feldspars Sulphides hematite goe-thite chlorite and rutile can be also present in the proximal zonewhere partly limonitized disseminated or veinlet-type pyrite is themain ore mineral The presence of goethite and limonite support a lateinteraction with meteoric water
23 Gold mineralisation
The grain size of gold is generally from 2 μ m to 1 mm in diameterBased on morphology grain-size 1047297neness and composition we wereable to distinguish three types of gold Type-1 gold refers to grainswith a rounded shape (ovoid spherical elongated) and striatedsurfaces and is 20ndash50 μ m (rarely up to 1 mm) in size This type of
gold occurs in the intermediate zone Small grains (100 μ m to 1 mm)of Ag and other native elements (PGEs) are rarely associated withType-1 gold Type-2 gold is 5ndash10 μ m in size occurs as euhedralndashsubhedral grains and is directly attached to (or included in) pyrite andarsenopyrite This type of gold is generally present in the quartz-veinsType-3 gold occurs as sub-microscopic (b2 μ m) euhedral grains oftenintimately associated in aggregates (10ndash20 μ m in size) It also formsdense clusters on the surface of Type-1 gold Type-3 gold contains Agup to ~15 wt
3 Methods
The studied samples are from surface trenches (10ndash50 m in length2ndash3 m in depth) and underground channels (up to 10 m in length)
around the quartz veins All the samples were collected underneath
244 E Salvioli-Mariani et al Journal of Geochemical Exploration 158 (2015) 243ndash 256
7172019 Salvioli et al 2015
httpslidepdfcomreaderfullsalvioli-et-al-2015 314
the soil cap For each trench and channel the length of the sampled in-tervals (1 to 3 m) was adjusted to obtain a complete section from the
quartz vein to the unaltered rock across the hydrothermally alteredzones
31 Analytical methods
Micro-thermometric measurements on 1047298uid inclusions wereperformed using a Linkam THMSG 600 freezingheating stageequipped with a TMS94 temperature control unit and an LNP1freezing control system (Dipartimento di Fisica e Scienze dellaTerra Universitagrave di Parma) The stage calibration was performedwith CO2 and H2O triple points and the melting temperatures of 1047297ve syntheticstandards (40 70 135 200and 398 degC) theestimatedprecision of the data is plusmn 04 degC After freezing the heating rate was
maintained at 5 degCmin up to room temperature and then it was
increased to 10 degCmin up to approximately 150 degC and reduced to2 degCmin until total homogenisation
The micro-Raman measurements on the carbonic phase were per-formedusing a Jobin-Yvon Horiba LabRam spectrometer (Dipartimentodi Fisica e Scienze della TerraUniversitagrave di Parma) equipped with a HendashNe laser (6328 nm emission line) and a doubled NdYAG laser(4731 nm emission line) The spectral resolution was between 2 and3 cmminus1 depending on thesource The confocal hole was adjusted to ob-tain a spatial(lateral and depth) resolution of 1ndash2 μ mMost ofthe spec-tra were obtained using a 50times objective (NA 075) Moreover the100times objective (NA 090) wasalso used forinclusions very near theex-ternal surface The calibration was performed using the 5207 cmminus1
Raman line of silicon The uncertainty of the Raman peak position ob-tained by GaussndashLorentzian deconvolution was less than 05 cmminus1 Awide spectral range (100ndash3600 cmminus1) was scanned for each inclusionHowever the 1047297nal acquisitions were made between 1100 and
1800 cmminus1
for the study of CO2 and graphite and between 2500 and
Fig 1 (A) Geological map of the Lepaguare District Inset tectonic sketch of the Caribbean region T Tegucigalpa MPF MotaguandashPolochic Fault system (B) Geological map of the inves-tigated Canan area showing the geometry of the main quartz veins (see A for its location in the Lepaguare District)
245E Salvioli-Mariani et al Journal of Geochemical Exploration 158 (2015) 243ndash 256
7172019 Salvioli et al 2015
httpslidepdfcomreaderfullsalvioli-et-al-2015 414
3300cmminus1 for methane with a laser excitation wavelength of 6328 nmWater wasdetermined by a laser excitation wavelength of 4731 nm be-tween 2500 and 3400 cmminus1 The acquisition timefor each spectral win-dowwas 120ndash240s with two accumulations The power on the samplesurface was nearly 1 mW
32 Calculation methods
Equilibrium calculations of 1047298uid inclusion physico-chemical con-ditions were performed using COH (version 6ndash08 Huizenga 2005)and HSC chemistry 71 (Roine 2009) COH software calculatesoxygen fugacity by the composition of carbonic 1047298uid (expressed as
molar fraction of CO2) obtained by Raman spectroscopy by the tem-perature and pressure of entrapment of the 1047298uid inclusions HSCsoftware estimates the pH and log f O2 of the mineralising 1047298uid(ldquoequilibrium compositionsrdquo module) Starting from the molar con-centration of the components (in our case H2O CO2 CH4 Na+ Clminus)the GIBBS or SOLGASMIX solvers calculate the values of pH and log f O2 (equilibrium at the speci1047297c isobaricndashisothermal conditions)using the Gibbs free energy minimization method (Roine 2009)
The activityof dissolved species for the AundashSndashCndashClndashH2O system werecalculated using The Geochemists Workbenchreg 7 (GWB) software(Bethke and Yeakel 2008) and data from the UNITHERM thermo-dynamic database version 44 (Shvarov 2008) extracted for tem-perature and pressure conditions estimated from 1047298uid inclusionsusing the K2GWB software (Cleverley and Bastrakov 2005)
4 Results
41 Fluid inclusions
The 1047298uid inclusions investigated in this paper are trapped in quartzcrystals of the mineralising veins of Dos Bocas which is representativeof the entire Canan gold 1047297eld The 1047298uid inclusions are quite abundantand range from a few microns up to 25 μ m in size and can be dividedinto four types on the basis of their composition and textural features(Table 2 Figs 2ndash4)
Type 1 mdash two phases are present at room temperature namely anaqueous liquid and a vapour phase (Fig 2A and B) The vapour to liquidratio is in the range 01ndash02 and the gas bubble often moves at room
temperature The inclusions are irregular to ellipsoidal or have a nega-tive crystal shape varying in size from a few microns to 18 μ m Inmost cases they constitute trails cross-cutting grain boundaries (S in-clusions Fig 2F)
Type 2 mdash this typeconsists of aqueous two-phase inclusions with anH2O-rich liquid and a CO2ndashCH4-bearing 1047298uid at room temperature(Fig 2C D and E) It occurs as an association of L-rich and V-rich inclu-sions which have VL ratios of 02ndash04 and 05ndash07 respectively(Table 2) The bubble comprises a CO2ndashCH4-bearing 1047298uid The carbonic1047298uid (see Sections 42 and 43) is primarily constituted by one phaseliquid and vapour phases rarely occur together Type 2 1047298uid inclusionsare the most abundantTheir morphologyis negative crystalor elongat-ed and irregular Their size varies from 5 to 24μ m Moreover they occurin clusters insidethe quartz crystals or near their boundaries suggesting
Table 1
Principal petrographic features key minerals assemblages and Au grade of the main rock-type units of the Canan ore deposit
Rock type Main petrographic features Key mineral assemblage Au grade
Quartz veins Type (1) Coarse-grained quartzWhite to light grey quartzCockscomb vuggy cavitiesElongated quartz grains
Qz Py Hem Gth Au Ag Low to very low
Type (2) Fine- to medium-grained quartzMilky smoky-grey to clear quartz
Static recrystallization of quartz120deg triple junctions
Qz Py Hem Gth Au Ag Low to very low
Hydrothermally alteredwall-rocks
Proximal zone Clays replace aluminosilicate phases Qz Py Ccp Apy Hem Gth Ilt Dck PrlAlu Dsp Kln
Low to medium
Intermediate zone Fine-grained muscovite replaces aluminosilicatephases
Qz Ms Py Ccp Apy Hem Gth Kln AuAg
High to very high
Distal zone Chlorite replaces biotite and muscovite Chl Qz Ilt Low To MediumUnaltered metamorphic
host-rocksGraphitic schists Very 1047297ne- to medium-grained
Bedding by graphite layeringDynamic recrystallization
Qz Bt Chl Ms Gr Absent
Sericitic schists Very 1047297ne- to medium-grainedLepidoblastic texturesWell-expressed foliation
Fsp Qz Ms Absent
Ag silverAlu alunite Apy arsenopyriteAu gold Bt biotite Ccp chalcopyrite Chlchlorite Dckdickite Dsp diaspore Fspfeldspar Gr graphite Gthgoethite HemhematiteKln kaolinite Iltillite Ms muscovite Prl pyrophyllite Py pyrite Qz quartz
Table 2
Summary of the petrographic features of the studied 1047298uid inclusions
Type A bundance Setting Origin B ubble vol Petrographic features
1 Common Trails S 10ndash20 Aqueous inclusions containing both liquid and vapour phases irregular toellipsoidal and negative crystal shape
2 Very common Clusters isolated trails P PS 25ndash40 L-rich50ndash70 V-rich
Aqueous two-phase inclusions with an H2O-rich liquid containing a CO2ndashCH4-bearing1047298uid negative crystal shape to elongated or irregular
3 Relatively common Clusters trails PS S N80 (carb) CO2ndashCH4-rich inclusions containing liquid plus vapour phases a thin 1047297lm of liquid H2Omay be present
4 Relat ively rare Clusters trails PS S Inclusions containing a dark phase with a lath-shape associated to variable amount of liquid phase
P primary 1047298uid inclusions PS pseudosecondary 1047298uid inclusions S secondary 1047298uid inclusions V vapour phase L liquid phase
246 E Salvioli-Mariani et al Journal of Geochemical Exploration 158 (2015) 243ndash 256
7172019 Salvioli et al 2015
httpslidepdfcomreaderfullsalvioli-et-al-2015 514
growth bands of the quartz crystals (P inclusions) or in trails withinsingle quartz crystals (P or PS inclusions)
Type 3 mdash CO2ndashCH4-rich inclusions that contain liquid and vapourphases comprise this type (Fig 3) The CO2ndashCH4 1047298uid occupies morethan 80 vol of the inclusion Sometimes the inclusion has a smallamount of liquid H2O close to walls or in the acute angles of the cavity
Where notobservedwater most likely forms a thin1047297lm along the inclu-sion walls The inclusion size varies between 4 and 24 μ m They occur inclusters or trails within the quartz crystals (PS and S inclusions)
Type4 mdash this type contains 1047298uidinclusions with an opaque solid anda variable amount of liquid (Fig 4) The opaque solid has a lath shapeand variable size In some inclusions the opaque solid is small (approx-imately 2 μ m about 20ndash30 vol) and surrounded by liquid (Fig 4A B)Rarely it occurs in two-phase inclusions (L + V) where it is in contactwith the bubble the VL ratio is 05ndash07 In most of the inclusions thetrapped opaque solid is anomalously large (70ndash90 vol) compared tothe host inclusions and has a very small amount of liquid on one side(Fig 4C D) They generally occur in clusters and are associated withType 2 and 3 inclusions
Some inclusions are naturally decrepitated and are star-shaped or
surrounded by a halo of tiny inclusions
The quartz crystals do not show growth zone de1047297ned by 1047298uid inclu-sions but some trails of 1047298uid inclusions although discontinuous cansuggest crystal growth According to Bodnar et al (1985) some petro-graphic features of our 1047298uid inclusions can be explained by boiling(i) the association of L-rich and V-rich inclusions (Type 2) where theL-rich inclusions have the liquidvapour ratio apparently variable (bub-
ble 25ndash40 vol) and the V-rich inclusions are a little larger (Fig 2C E)(ii) the occurrence of all V-rich inclusions as planes or trails (Type 3)and (iii) the absence of one-phase liquid inclusions
The relative timing of the 1047298uid inclusions in the quartz crystals isoften unclear because differenttypes of 1047298uidinclusionsare closely asso-ciated and a con1047297dent identi1047297cation of their origin is dif 1047297cult Due to theseveral phases of inclusion entrapment the earlier 1047298uid inclusions maybe modi1047297ed and the hydrothermal orogenic systems appear extremelycomplex Therefore we did a careful selection of the 1047298uid inclusionsfor the microthermometric evaluations
42 Microthermometry
Microthermometricexperiments were performed on more than 250
1047298uid inclusions We have performed the experiments mainly on 1047298uid
Fig 2 Optical microphotographs of Type 1 and 2 1047298uid inclusions (A B) Type 1 S aqueous-rich inclusions very small inclusions in transgranular trails (F) (C D E) Type 2 two-phase in-clusions forming associations of L-rich and V-rich inclusions Bar 10 μ m
247E Salvioli-Mariani et al Journal of Geochemical Exploration 158 (2015) 243ndash 256
7172019 Salvioli et al 2015
httpslidepdfcomreaderfullsalvioli-et-al-2015 614
inclusion assemblages with variable phase ratios (Type 2) These areconsidered the 1047298uid inclusions that have trapped the hydrothermal1047298uids carrying Au The microthermometric data are summarised inTable 3
421 Type 1 inclusions
The prevalent small size of Type 1 inclusions makes the observationof phase transformations during heating dif 1047297cult Approximately 55
inclusions have been measured The 1047297rst phase variation is suggestedby a dotted appearance due to the 1047297rst melting (eutectic temperatureTe) occurring in the range minus234 to minus119 degC The determined temper-aturessuggest theexistence of dissolvedNaCl andorKCl componentsinwater The remaining solid phase always has a clear appearance andmelts primarily from minus 44 to minus15 degC (ice melting temperatureTmice) On the basis of the ice melting temperature the total salin-ity calculated with the software package of Bakker and Brown
Fig 3 Optical microphotographs of Type 3 1047298uid inclusions (A B) Type 3b inclusions showing retrograde condensationduring microthermometric experiments(C D) Type 3c inclusionssuggesting a liquidndashliquid immiscibility Bar 10 μ m
Fig 4 Optical microphotographs of Type 4 1047298uid inclusions containing graphite with different size and variable LV ratios Bar 10 μ m
248 E Salvioli-Mariani et al Journal of Geochemical Exploration 158 (2015) 243ndash 256
7172019 Salvioli et al 2015
httpslidepdfcomreaderfullsalvioli-et-al-2015 714
(2003) and the equation of Zhang and Frantz (1987) is mainly inthe range 22ndash56 wt NaCl equivalent (rarely b 2 or N 56)(Fig 5B)
The total homogenisation temperature (Thtot) to liquid state occurspredominantly in the range 240ndash336 degC (with median and mode at290 degC Table 3 and Fig 5A)
422 Type 2 inclusions
Analyses were performedon more than 170 inclusions According totheir petrographic features L-rich and V-rich inclusions show differentbehaviour during freezing experiments The L-rich inclusions hereafterreferred to as Type 2a have higher freezing temperatures (minus 50 tominus379 degC) whereas the V-rich inclusions hereafter Type 2b have
Table 3
Summary of the microthermometric data of the studied 1047298uid inclusions
Type Te Tmice Tmcla Tmcarb Thcarb Thtot Salinity XCH4
1 minus234 divide minus 119 20
minus44 divide minus 15 34
240 divide 336 (L)[290 290]55
22 divide 56[32 27]
34
2a minus257 divide minus 111 27
minus76 divide minus 1582
56 divide 13482
250 divide 338 (L)[300 280]60
09 divide 48[35 37]82
005 divide 02011
2b minus282 divide minus 1169
minus71 divide minus 129
60 divide 1869
minus649 divide minus 583 23
180 divide 200 (L) 239 divide minus 100 (V) 293 divide 334 (L)299 divide 334 (V)10
1 divide 62 019 divide 0689
3a minus589 divide minus 583 182 divide 189 (V) 022 divide 10 27 3b minus636 divide minus 627 98 divide 125 (V)
3c minus981 divide minus 733 (V) or liquid immiscibilityminus893 divide minus 719
4 minus250 divide minus 197 minus07 divide minus 04 72 minus635
Temperature in degC Te = eutectic temperature Tmice = ice melting temperature Tmcla = clathrate melting temperature Tmcarb = melting temperature of the carbonic phase Thcarb =
homogenisation of the carbonic phase Thtot = total homogenisation temperature (L) = homogenisation to liquid phase (V) = homogenisation to vapour phase Salinity as wt NaClequivalent XCH4 = molar fraction of methane in the carbonic phase determined by Raman spectrometry In square brackets median and mode values respectively in italics number of measurements
Fig 5 Bar diagrams of microthermometric data (A C E) total homogenisation temperature Th tot (B D) total salinity as NaCl equivalent
249E Salvioli-Mariani et al Journal of Geochemical Exploration 158 (2015) 243ndash 256
7172019 Salvioli et al 2015
httpslidepdfcomreaderfullsalvioli-et-al-2015 814
signi1047297cantly lower freezing temperatures (minus90 to minus 121 degC) and thenucleation of a carbonic vapour bubble on cooling occurs also at verylow temperatures
In Type 2a inclusions the 1047297rst melting temperature (Te) primarilyoccurs between minus 253 and minus111 degC (Table 3) values compatiblewith H2OndashNaCl H2OndashKCl and H2OndashNaClndashKCl systems Due to the for-mation of clathrate upon cooling the ice melting temperature has be-come more dif 1047297cult to measure in practice Most Type 2a inclusions
exhibit ice melting temperatures very similar to those obtained fromType 1 inclusions(in therange minus76 to minus15degC Table 3)In a few inclu-sions ofType 2bit was possibleto obtainTe and Tmice (minus282 to minus116and minus 71 to minus 12 degC respectively Table 3)
In Type 2b inclusions a carbonic vapour bubble appears on coolingat two different temperature intervals ie 10 to 16 degC and minus 121 tominus84 degC Melting of the carbonic phase (Tmcarb) occurs mainly fromminus649 to minus 583 degC suggesting CO2 with other non-condensablegases most likely CH4 in variable proportions Due to the small size of the inclusions the detection of the homogenisation of the carbonicphase (as well as the temperature of homogenisation Thcarb) has beenquite dif 1047297cult to obtain Usually homogenisation to the vapour phaseoccurs at temperature Thcarb from minus 239 to minus10 degC (Table 3) andonly in two cases to liquid phase at higher temperature(Thcarb between18 and 20 degC)
In larger inclusions (approximately20 μ m) we were able to measurethe melting temperature of clathrate we employed the method of Collins (1979) using repeated cooling-heating cycles in proximity of the decomposition temperature of clathrate During microthermometricexperiments the clathrate crystals occur as (i) small crystals around thegaseous bubble (ii) colourless crystals in the aqueous phase (making thedetermination of Tmice dif 1047297cult) and (iii) irregular shape and motion of the gaseous bubble The decomposition temperature of clathrates(Tmcla) in the Type 2a inclusions varies mainly from 56 to 134 degC(Table 3) Where detectable Tmcla in Type 2b inclusions is comparableor higher (60ndash186 degC Table 3) At low pressure CH4 clathrate melts attemperatures higher than 15 degC whereas CO2 clathrate melts at lowertemperatures (b10 degC Seitz and Pasteris 1990 Diamond 2003)
The salinity of Type 2 inclusions was calculated using the melting
temperature of clathrates with the software package of Bakker andBrown (2003) and the equations of Duan et al (1992ab) the resultsare comparable with the values obtained for Type 1 inclusions althoughthey extend towards lower values (09ndash48 and 1ndash62 wt NaClequivalent Fig 5D and Table 3) The composition of the carbonic1047298uid is dif 1047297cult to obtain due to the formation of clathrate duringmicrothermometric experiments
Themost frequent values for Thtot (Table 3) are 250ndash338 degC (medianand mode at 300 degC and 280 degC respectively Type 2a Fig 5C) 293ndash334 degC (to liquid phase Type 2b) and 299ndash334 degC (to vapour phaseType 2b Fig 5E)
423 Type 3 inclusions
Only25 inclusions of the Type 3 havebeeninvestigated Most Type 3
inclusions freeze at very low temperatures below minus 85 degC and down tominus136 degC the extremely low water content rarely allows observation of the changes induced by freezing The carbonic phase melts primarily inthe range minus 636 to minus 583 degC (Table 3) similarly to Type 2b inclusionssuggesting a variable proportion of CO2 with other non-condensablegasesmost likely CH4 The melting temperature (Tmcarb) rarely reacheslower values down to minus 699 degC suggesting high contents of CH4 Onlyone determination gave Tmcarb = minus 569 degC
Thehomogenisation of the carbonic phase to vapour phase occurs atdifferenttemperatures (Table 3)(i) 182ndash189 degC forthe inclusions withthe highest Tmcarb (minus589 to minus 583 degC hereafter 3a) and (ii) 98ndash125 degC for the inclusions melting at lower temperatures (minus636 tominus627 degC hereafter 3b Fig 3A B) The homogenisation temperatureto vapour phase of Type 3b inclusions suggests that Tmcarb should be
greater than approximately minus 62 degC (cf Ridley and Hagemann 1999
Thiery et al 1994 Van den Kerkhof and Thiery 2001) This behaviouris the consequence of retrograde condensation (ie the condensationof liquid under isothermal conditions on lowering pressure) which in-creases the temperature of homogenisation (to the gas phase) of the1047298uid inclusions (with a given composition) to values higher than thecritical temperature (Thiery et al 1994 Van den Kerkhof 1988 Vanden Kerkhof and Thiery 2001)
A further subgroup of Type 3 inclusions (hereafter 3c Table 3 and
Fig 3C D) has a varied behaviour at very low temperatures (minus
981to minus733 degC) they apparently homogenise to thevapourphaseand like-ly to another liquid supporting a case of liquidndashliquidndashgas immiscibility(Thiery et al 1994) At room temperature these inclusions have twophases of similar density (Fig 3C D) In some inclusions a meniscusoccurs in the bubble at temperature from minus 893 to minus 719 degC (whichgradually disappears at approximately minus63 to minus 60 degC) and thecarbonic phase appears darker or takes on a bumpy surface
424 Type 4 inclusions
In rare cases it was possible to obtain data during microthermometricexperiments The obtained temperatures (Tmcarb ~ minus 635 degC Te fromminus250 to minus197 degC Tmice from minus07 to minus04 degC and Tmcla 72 degCTable 3) are fully comparable with those of Type 2 and Type 3 inclusions
43 Micro-Raman spectroscopy
To estimate the entrapment conditions we must know both thecomposition and density of the trapped 1047298uid However as statedabove they are dif 1047297cult to obtain for the occurrence of clathrates Toovercome this problem we determinedthe composition of the carbonicphase using micro-Raman spectroscopy
431 CO 2ndashCH 4 1047298uids
For Raman analysis of the carbonic phase we selected approximate-ly 50 inclusions of Type 2 and 3
The Raman spectra of these inclusions are characterised by (i) theRaman active stretchingmodeν1 at 1278ndash1282 cmminus1 and the overtoneof thebending modeν2 (2ν2)at1380ndash1385 cmminus1 typicalof CO2 (Fig6)
and known asthe Fermi diad (Garrabos et al 1980) and(ii) theisolatedC-H stretching band (ν1) of CH4 at 2907ndash2913 cmminus1 (Fig 6 Burke2001) In the spectral area of reduced sulphur species the backgroundsometimes shows a small hump which might be considered as a smallpeak (insetin Fig6C) It occurs atabout 2610cmminus1 suggestingthe pres-ence of a very small amount of H2S associated to the carbonic vapourphase The detection limit is estimated at 1 mol for H2S
According to the literature (Kawakami et al 2003 Van den Kerkhof and Olsen 1990 Wang et al 2011) the changes of frequency in theRaman spectrare1047298ect variations in pressure1047298uid density and tempera-ture The separation between the two bands (Δν) represents a bettermeasure of CO2 density than the peak positions or the ratio of thepeak positions (Kawakami et al 2003 Wang et al 2011) The mea-sured Δν in our 1047298uid inclusions is 1035ndash104 cmminus1 On the basis of
the equation from Wang et al (2011) valid for the entire range of den-sities(with CH4 le 10 mol) the calculatedCO2 density of the investigat-ed 1047298uid inclusions is in the range 034ndash056 gcm3
Similarly the position of the ν1 band is also in1047298uenced by pressureand temperature variations for CH4 Unfortunately we were unable toobtain reliable density values because the equations proposed in the lit-erature have been calibrated using a 51453 nm laser (Lin et al 2007)and are valid for pure or almost pure CH4 (b10 mol of other compo-nents such as CO2) and CH4ndashH2O systems (Lu et al 2007) which areconditions signi1047297cantly different from those of our systems
On the basis of the microthermometric data we infer that the car-bonic components are present in variable proportions and their molefractions have been determined from Raman spectra according toBurke (2001) That study provides a simple formula that considers
CO2 and CH4 peak areas (both CO2 peaks must be considered) CO2
250 E Salvioli-Mariani et al Journal of Geochemical Exploration 158 (2015) 243ndash 256
7172019 Salvioli et al 2015
httpslidepdfcomreaderfullsalvioli-et-al-2015 914
and CH4 Ramanscattering ef 1047297ciencies andCO2 and CH4 instrumental ef-1047297ciencies for the speci1047297c laser wavelength (6328 nm) The CH4 molefraction (XCH4) varies between 005ndash020 in Type 2a 019ndash068 inType 2b and 022ndash10 in Type 3 inclusions (Table 3)
432 Carbonaceous material
Type 4 inclusions are peculiar because they contain a black solidphase with a lath shape and variable proportions of aqueous liquidphase Based on Raman spectra the solid phase is identi1047297ed as graphite25 Raman spectra were acquired for both solid and liquid phases
Raman spectra of the carbonaceous material are very sensitive tochanges in the order degree The1047297rst order bands of the Raman spectraof carbonaceous material are characterised by the G band at approxi-mately 1580 cmminus1 typical of crystalline or ordered graphite the Dband at approximately 1350 cmminus1 and the Dprime band at approximately1620 cmminus1 typical of disordered or defect bearing carbonaceous mate-rial (Aoya et al 2010 Luque et al 1998 Thomsen and Reich 2000Vidano et al 1981) Carbonaceous materials also exhibit a strong
Raman band in the range 2500ndash
2800 cmminus1
which corresponds to the
overtone of the D band This band appears in the second-order Ramanspectra and is called the Gprime band (Pimenta et al 2007) The decreasein the order degree of graphite is also evident by the development of an asymmetry andbandbroadening in the second-order peak and a de-crease in resolution among its constituent bands (Pasteris and Chou1998) If the position of the G band is not affected by the wavelengthof thelaser the Raman frequency of theD band increases with theexci-tation energy (Kawashima and Katagiri 1995 Matthews et al 1999
Vidano et al 1981) Moreover the ratio of the integrated intensity of the D and G bands (IDIG) decreases with increasing laser energyWith our equipment (λ = 6328 nm) the D band is expected at ap-
proximately 1330 cmminus1 The spectra acquired on Type 4 inclusions(Fig 7A B) have frequencies in the range 1332ndash1336 cmminus1 and1578ndash1581 cmminus1 forD and G bands respectivelyThe Dprime bandis alwayspresent as a shoulder on the high-frequency side of the G peak in therange 1613ndash1620 cmminus1 In the region of second-order bands an unre-solved doublet or a large band at approximately 2664ndash2709 cmminus1 oc-curs The D band is broad with low intensity when compared to the Gband and with a very low IDIG ratio (016ndash030) The degree of crystal-linity is represented by the length of ordered crystals along the a
Fig 6 Ramanspectra ofthe carbonicphase inexample Type 2a(A)Type2b (B)andType3 (C) 1047298uid inclusions The intensity scale of the inset is unchanged
Fig 7 Raman spectraof graphite in Type4 1047298uidinclusions (A B) compared with those of
graphite from wall-rock (C)
251E Salvioli-Mariani et al Journal of Geochemical Exploration 158 (2015) 243ndash 256
7172019 Salvioli et al 2015
httpslidepdfcomreaderfullsalvioli-et-al-2015 1014
crystallographic direction designated as L a (Pasteris and Chou 1998)The IDIG ratio and L a are negatively correlated and the most disorderedgraphite is characterised by the highest IDIG and the lowest L a values(Pasteris and Chou 1998) According to the general formula proposedby Pimenta et al (2007) which can be applied to any laser line we ob-tained the crystallite size L a in the range 1300ndash2400 Aring The calculatedparameters and the widths of the D and Gprime bands suggest a fairly gooddegree of graphite crystallinity which is comparable to that of naturally
or laboratory-produced graphite (Luque et al 1998 Pasteris and Chou1998 Perraki et al 2006 Satish-Kumar 2005 Wopenka and Pasteris1993) The Raman spectra of trapped graphite are all similar ( Fig 7AB) suggesting that the precipitation of graphite occurred from the hy-drothermal 1047298uid
The liquid portion associated with trapped graphite contains CO2CH4 and liquid H2O The typical peaks of CO2 (1280ndash1281 and1383ndash1384 cmminus1) and of CH4 (2910ndash2913 cmminus1) were observedusing the 6328 nm laser (Fig 8A) Moreover the peak for liquid H2Oat 3250ndash3252 cmminus1 was detected with the 4731 nm laser (Fig 8B)
Because of thepresenceof graphite in thehost rocks (quartz-sericiticand graphitic schists) for comparison we acquired 6 Raman spectra onthis carbonaceous materials They are completely different from thoseobtained for the graphite in the 1047298uid inclusions (Fig 7C) The D band(1329ndash1334 cmminus1) has a higherintensitythan that ofgraphitein thein-clusions and sometimes reaches the same intensity as the G band at1580ndash1583 cmminus1 Therefore the IDIG ratios are higher (095ndash208)and L a is lower (200ndash400 Aring) supporting the presence of fairly disor-dered graphite The shape of the spectra and the calculated parametersof graphite from the host rock of Canan are comparable to those of thegraphite from metapelites of chlorite facies (Luque et al 1998Wopenka and Pasteris 1993)
5 Discussion
Four types of 1047298uid inclusions have been found in the quartz crystalsfrom the mineralising veins of Dos Bocas a representative example of
gold deposit at Canan Some 1047298uidinclusions are along fractures crossingone or more crystals (Type 1 S inclusions)The most important1047298uid in-clusions constitute discontinuous trails which can suggest crystalgrowth zones (Type 2) The 1047298uid inclusion associations formed by L-richand V-richinclusions (Type 2 P andPS inclusions) andthe presenceof trails entirely constituted by V-rich inclusions(Type 3 PS andS inclu-sions) suggest that the hydrothermal 1047298uid suffered 1047298uid immiscibility(boiling) The trapped 1047298uid consists of an aqueous solution (H2Ondash
NaClndash
KCl with 09ndash
48 wt NaCl equivalent) plus a CO2ndash
CH4 1047298
uid(80ndash90 mol CO2) As shown by Bowers and Helgeson (1983) a pres-sure drop moves the H2O-carbonic phase solvus towards higher tem-perature which causes a decrease of carbonic gas solubility and theexsolution of CO2 (and CH4) gas from the water-rich 1047298uid according tothe Henrys law In geological environments such as Canan where thetectonics aredominatedby strikendashslip fault systems thefracture forma-tion after deformation causes a rapid and immediate reduction in pres-sure The occurrence of some inclusions naturally decrepitated can beexplained by pressure drop The presence of Type 3b 1047298uid inclusionswhich exhibit retrograde condensation further supports the occurrenceof such a pressure drop
Because of 1047298uid immiscibility the total homogenisation temperaturecan be considered as the trapping temperature Isochores have been re-constructed for Type 2 1047298uid inclusions combining the results frommicrothermometry and Raman analyses using the software package of Bakker and Brown (2003) and the equations of Bakker (1999) andDuan et al (1992b) Trapping pressures of 05ndash14 kbar were obtainedThe coexistence of different types of 1047298uid inclusions and their similarvalues of Th suggest that they can be related to the same hydrothermalprocess which wasresponsiblefor the gold mineralisation at CananThedifferentamounts of water andcarbonic1047298uids inthe inclusions is due tothe 1047298uid immiscibility where the H2O-rich 1047298uid is in Type 2a inclusionsand the CO2ndashCH4-rich 1047298uid in Types 2b and 3 inclusions Finally Type 4inclusions would represent the inclusions (both Type 2 and 3) wherethe conditions for graphite precipitation have been achieved
The graphite of the1047298uid inclusions (Type 4) is similar to that precip-itated from hydrothermal1047298uids This indicates that graphite depositionoccurred before or contemporaneously of the entrapment of the 1047298uid
The degree of crystallinity of graphite in the 1047298uid inclusions is higherthan that observed in the graphite from the host quartz-sericitic andgraphitic schists (Fig 7) Nonetheless this does not exclude the pres-ence of a metamorphic component in the mineralising 1047298uids
Equilibrium of graphite in the hydrothermal1047298uid allows the evalua-tion of oxygen fugacity The calculated atomic ratio XO [O(O + H)] isinthe range 032ndash041 (Fig 9) which is typical of slightly reduced 1047298uids(Cesare 1995 Huizenga 2011) Considering temperatures of 300 degCand pressures of 14 10 and 05 kbar (Tt and Pt respectively) graphitesaturation conditions (aC = 1) and the composition of the carbonicphase as inferred by Raman spectroscopy the calculated f O2 is aboutminus342 log unit (ie about 16 log unit above theQFM buffer) This resultis consistent with that obtained using the HSC chemistry software log f O2 asymp minus376 plusmn 25 which permitted us to calculate also the activity
of dissolved hydrogen ions at equilibrium condition between the con-stituents H2OCO2 CH4 Na+ andClminuspH=29plusmn04Itcanbeobservedthat our estimated pH value is low but this range of acidity is not un-common in1047298uid inclusions (egBenison 2013) including gold deposits(Boiron et al 1999 Pokrovski et al 2014)
According to Roedder (1984)thepHin 1047298uid inclusions can be calcu-lated or determined In the latter case the opening of the 1047298uid inclu-sions implies the loss of the trapped gases It follows that the pH isdetermined on a 1047298uid other than the original and which has undergonebasi1047297cation due to the loss of gas
The composition of Type 2 inclusions plotted in the ternary diagramCOH falls within the stability 1047297eld of graphite (towards the CO2 vertexFig 9) and the 1047298uid associated with graphite in Type 4 inclusions isalso constituted by H2OndashCO2ndashCH4 These features support precipitation
of graphite by the reaction CH4 + CO2rarr
2 C + 2 H2O The decrease of
Fig 8 Raman spectraof the1047298uid portion of Type 4 1047298uid inclusions (A)CO2 and CH4 have
been obtained by 6328 nm laser (B) H2O by 4731 nm laser
252 E Salvioli-Mariani et al Journal of Geochemical Exploration 158 (2015) 243ndash 256
7172019 Salvioli et al 2015
httpslidepdfcomreaderfullsalvioli-et-al-2015 1114
temperature andor the increase of pressure move the reaction towardsthe products In our case a combination of cooling and decompressionacted on the system so that the variation of temperature and pressurecannot be responsible for the precipitation of graphite According toHuizenga (2011) the precipitation of graphite is in1047298uenced by XO
value and oxygen fugacity the best conditions for precipitation areXO = 033 and QFM-2 b log f O2 b QFM + 1 Small variations from
these values prevent the precipitation or cause consumption of earlyprecipitated graphite XO values and f O2 of our Type 2 1047298uid inclusions(see above) agree with the Huizenga (2011) data and indicate thatsome 1047298uid inclusions were able to precipitate graphite
The H2S content and the oxygen fugacity of the hydrothermal 1047298uidsaffect the solubility of gold In H 2S-rich 1047298uids Au(HS)2
minus andAu(HS)deg are the dominant Au-complexes and gold has high solubil-ity (Au N 100 ppb) whereas in H2S-poor 1047298uids the gold solubilitydecreases and AuCl2
minus is the dominant stable complex (Gammonsand Williams-Jones 1997) When the partial pressure of H 2S is1047297xed by the magnetitendashpyrite pair the Au bisulphide complex isstable at T b 450 degC and the chloride complex at higher temperature(Mikucki 1998) At high oxygen fugacity H2S is oxidised and thusthe mobility of gold as bisulphide decreases considerably ( Gammons
and Williams-Jones 1997) Experimental studies at temperatures of 350ndash500 degC and pressures of 05ndash1 kbar have shown that Au(HS)2
minus isthe dominant Au complex in near neutral to weakly acidic solutions inthe presence of the K-feldsparndashmuscovitendashquartz mineral associationand at pyritendashpyrrhotitendashmagnetite buffer conditions (Tagirov et al2005)
Many of the conditions employed in the experiments mentionedabove match those of the Canan ore deposit 1047298uid inclusions indicatethe presence of low salinity and low temperature (T b 400 degC) hydro-thermal 1047298uids and XRD data (Mattioli et al 2014) show that the wall-rocks contain the K-feldsparndashmuscovitendashquartzndashpyritendashpyrrothitendashmagnetite association (Table 1) However the hydrothermal 1047298uids atCanan seem to be extremely acidic (pH = 29) which makes Au(HS)degmore stable than Au(HS)2
minus and themost abundant complex in thesolu-
tions (cf also Heinrich et al 2004 Pokrovski et al 2014) Hence we
infer that the gold of Canan was transported by hydrothermal 1047298uids asAu(HS)deg complex
Activity diagrams are a powerful graphical tool for depicting the sta-bility of dissolved species and solid and gas phases with respect to thecomposition of the coexisting solution Calculations on Au speciationwere performed under the mean conditions estimated by the analysisof the 1047298uid inclusions and the results plotted in log f O2-pH diagrams(Fig 10) The decrease in solubility of the Aundashsulphide complexes can
be ascribed both to the fracturation-induced pressure drop andthe con-centration of sulphur in solution According to Mattioli et al (2014) thegold deposit of Canan was formed by the hydrothermal 1047298uid activityalong fractures produced by tectonics Opening and lateral expansionof the fractures produce a pressure drop on the 1047298uids themselves andboiling of the dissolved gases The 1047298uid composition affects the depthof boiling which is an ef 1047297cient mechanism for gold precipitation(Hedenquist et al 1992 Pokrovski et al 2014 Robb 2010 Sibson1987) Boiling produced the exsolution of H2S which in turn caused adecrease in the solubility of theAundashsulphide complexes and the precip-itation of gold (Fig 10) In the case of the Canan deposit boiling repre-sents only the initial phase of gold deposition In fact the main bodyof thegoldmineof Canan is located in metamorphic rocks cutby quartzveins where hydrothermal 1047298uids altered the primary mineralogy andchanged their composition and ability to carry gold in solution In theore deposit Au coexists with sulphides and in particular small grainsof pure gold are surrounded by pyriteand other sulphides This suggeststhat gold was deposited by reactions involving 1047298uids containing Au-Scomplexes and the wall-rock containing chalcophile elements particu-larly Fe a process known as ldquosulphidationrdquo (Williams-Jones et al 2009and references therein Robb 2010) At Canan Fe is abundant in freshwall-rocksfor thepresence of biotiteand chloriteThese minerals disap-pear in the vicinity of quartz veins of the ore deposit where the highestconcentration of gold and sulphides are observed (Mattioli et al 2014)During the alteration of biotite and chlorite Fe is released into the hy-drothermal 1047298uids and likely produces the following reaction with theAundashsulphide complexes
AuethHSTHORN∘ethaqTHORN thorn 05Fe2thornharr05FeS2ethPyriteTHORN thorn H
thorn thorn Au∘ethGoldTHORN eth1THORN
Under equilibrium conditions and assumingP = 1400barT = 300 degCand the water activity H2O = 1 the resulting log K is 53151 (ΔGdeg-R = minus 5833 kJ molminus1) The high value of the equilibrium constant Kand the highly negative value of ΔGdegR indicate that the reaction has aspontaneous tendency towards the products According to Robb (2010)these reactions occur in dynamic systems where kinetics predominatesover equilibrium conditions Therefore it is very unlikely that reaction(1) occurs under equilibrium conditions in an open natural system Be-cause of the continuous supply of Au(HS)deg from the hydrothermal 1047298uidsand Fe2+ from the alteration of biotite and chlorite (within the zones of 1047298uid-rock interaction) reaction (1) is imbalanced and pushed towardsthe products by favouring the deposition of gold and sulphides This isin agreement with Pokrovski et al (2014) who state that the interactionof sulphur-rich hydrothermal 1047298uids and Fe2+-rich wall rocks(sulphidation) is one of the main processes leading to the precipitationof gold
Additionally the activity of sulphur in the 1047298uids is responsible forthe solubilisation and transport of gold At Canan the activity of Sought to be at least 10minus2 Above this value the composition of hydro-thermal 1047298uid plots in the stability 1047297eld of Au(HS)deg (Fig 10) Withlower concentrations of S (and lower pressure) the transportof gold oc-curs as chloride (Fig 10L M and N) If iron is no longer available aftercomplete alteration of biotite and chlorite the deposition of goldcould be represented by the reaction
AuethHSTHORN∘ethaqTHORN thorn 05H2ethgTHORNharrH2SethgTHORN thorn Au∘ethGoldTHORN eth2THORN
where log K = 69130 (ΔGdegR = minus 7586 kJ molminus1) at T = 300 degC and
P = 1400 bar indicates once again a spontaneous tendency towards
Fig 9 Ternary CndashOndashH diagramshowing thecarbon saturatedsurface (solid line) at 300degCand1400 barcalculated by Perple_Xsoftware(J Connollywwwperplexethzch) Dashedlines represent the compositional triangle H2OndashCO2ndashCH4 dotted 1047297eld Type 2a inclusionsstriped 1047297eld Type 2b inclusions Lines of constant XO 035 and 040 (dot-dashed lines) arealso shownTheopencircles andthenumbers initalics indicate f O2
1047298uid relative toQFM buff-er in log10 units (log f O2
1047298uidndashlog f O2
QFM) for 1047298uids in equilibrium with graphite
253E Salvioli-Mariani et al Journal of Geochemical Exploration 158 (2015) 243ndash 256
7172019 Salvioli et al 2015
httpslidepdfcomreaderfullsalvioli-et-al-2015 1214
theproducts andthe presence of H2 agrees with the reducing conditions(log f O2 asymp minus376) found in the hydrothermal 1047298uids of Canan Reaction(2) would be effective during boiling andor decompression (cf Boyle1969 Pokrovski et al 2014) Similarly to reaction (1) the dynamicsystem conditions (the continuous supply of Au(HS)deg and loss of H2S)favour the kinetic of the reaction (2) and con1047297rm the statements of Robb (2010) and Sibson (1987) on the ef 1047297ciency of this process forgold deposition Finally the kinetics of reaction (1) is further increasedby the alteration of feldspar and muscovite in kaolinite and diaspore (cfMattioli et al 2014) The mineral alterations subtract H+ from the solu-
tion (Drever 1997) favouring the precipitation of Au
6 Concluding remarks
The quartz veins associated with gold mineralisations from DosBocas (Canan area Lepaguare District east-central Honduras) are richin 1047298uid inclusions of four main types Type 1 mdash S two-phaseaqueous-rich inclusions Type 2 mdash P to PS aqueous-rich inclusionswith an H2O-rich liquid and a CO2ndashCH4-bearing liquid Type 3 mdash PSto S CO2ndashCH4-rich inclusions with a very small amount of waterand Type 4 mdash graphite-bearing aqueousndashcarbonic 1047298uid
The association of L-rich and V-rich inclusions (Type 2) and the oc-currence of trails containing only V-rich inclusions (Type 3) support a
1047298uid immiscibility (boiling)of the hydrothermal1047298uidThe hydrothermal
trapped 1047298uid is constituted by H2O + alkali chloride + CO2 plusmn CH4 Thecalculated salinity varies from 09 to 48 wt NaCl equivalent
The immiscibility of 1047298uids can be related to a pressure decrease dueto both the opening of fractures and upward 1047298ow of 1047298uids At Canan astrikendashslip fault systemis responsible for the fracturing of the metamor-phic wall-rocks Thisgeological setting with the mineralogicalpetrolog-ical and geochemical features supports an orogenic character of theinvestigated gold deposits
In some 1047298uid inclusions the occurrence of graphite with typical fea-tures of graphite precipitated from hydrothermal 1047298uids suggests that
the deposition of graphite was prior or concomitant with the entrap-ment of the 1047298uid Moreover the occurrence of graphite associated towater andcarbonic1047298uidssupports the presence of a metamorphic com-ponent in the mineralising 1047298uid
Microthermometric and spectroscopic data from 1047298uid inclusionssuggest that the gold mineralisations at Canan formed at T = 300 degCunderP=500ndash1400 barsThecalculated oxygenfugacityand pH valuesof the hydrothermal 1047298uids are approximately minus 376 plusmn 25 log unit(1 log unit above the QFM buffer) and 29 plusmn 04 respectively
The hydrothermal 1047298uids contained sulphur (activity of S ge 10minus2)assuggested by the association of gold with sulphides including pyriteand chalcopyrite For the above chemical and physical conditions themost abundant sulphur specie carrying gold in solution is the Au(HS)degcomplex Several causes are responsible for the precipitation of gold in
the Canan area 1 mdash boiling following the pressure drop caused by
Fig 10 Activity diagrams for the system AundashCndashClndashSndashH2O at 300 degC Au and H2O activity 10minus7 (~10 ppb) and 100 respectively Cl 10minus098 and C buffered by graphite (see ldquoCalculationmethodsrdquo) Variable values of pressure are considered 1400 bar (A B C and D) 1000 bar (E F G and H) 500 bar (I L M and N) Activities of total dissolved S are 10minus1 (A E and I)10minus2 (B F and L) 10minus3 (C G and M) and buffered by pyrite (D H and N) Green 1047297eld represents the mean composition of the 1047298uid inclusions (pH = 29 plusmn 04 log f O2 = minus 376 plusmn25) Red lines limit the 1047297elds of Au species dashed black lines the S species and dashed blue lines the carbon species The thickness of the red lines corresponds to an uncertainty of log [Au] = plusmn01 or log [H2O] = plusmn02
254 E Salvioli-Mariani et al Journal of Geochemical Exploration 158 (2015) 243ndash 256
7172019 Salvioli et al 2015
httpslidepdfcomreaderfullsalvioli-et-al-2015 1314
tectonic andor hydrothermal 1047298uids activity 2 mdash sulphidation triggeredby the liberation of metal cations during the alteration of ma1047297c min-erals of the wall-rocks 3 mdash hydrothermal alteration of feldspars andphyllosilicates of the wall-rocks
Acknowledgements
The authors wish to thank M Menichetti for providing samples of
the quartz veins and the Goldlake Group for the permission to publishthe results of this study Special thanks are due to John Ridley for theuseful and encouraging suggestions which have noticeably improvedthequality of this paperSincere thanksare dueto BJStacey forimprov-ing the English
References
Alvarez-Gogravemez JA Meijer PT Martigravenez-Digraveaz JJ Capote R2008 Constraintsfrom1047297nite element modeling on the active tectonics of northern Central America andthe Middle America Trench Tectonics 27 TC1008 httpdxdoiorg1010292007TC002162
Andrada de Palomera P van Ruitenbeek FJA van der Meer FK Fernaacutendez R 2012Geochemical indicators of gold-rich zones in the La Jose1047297na epithermal depositDeseado Massif Argentina Ore Geol Rev 45 61ndash80
Aoya M Kouketsu Y Endo S Shimizu H Mizukami T Nakamura D Wallis S 2010Extending the applicability of the Raman carbonaceous-material geothermometer
using data from contact metamorphic rocks J Metamorph Geol 28 895ndash914Bakker RJ 1999 Adaptation of the Bowers and Helgeson (1983) equation of state to the
H2OndashCO2ndashCH4ndashN2ndashNaCl system Chem Geol 154 225ndash236Bakker RJ Brown PE 2003 Computer modelling in 1047298uid inclusion research In
Samson I Anderson A Marshall D (Eds) Fluid Inclusions Analysis and interpreta-tion Mineralogical Association of Canada Short Course Series 32 pp 175ndash212
Benison KC 2013 Acid saline 1047298uid inclusions examples from modern and Permianextreme lake systems Geo1047298uids 13 579ndash593
Bersani D Salvioli-Mariani E Mattioli M Menichetti M Lottici PP 2009 Raman andmicro-thermometric investigation of the 1047298uid inclusions in quartz in a gold-richformation from Lepaguare mining district Spectrochim Acta A 73 443ndash449
Bethke CM Yeakel S 2008 The Geochemists Workbenchreg mdash Release 7 GWB Essen-tials Guide mdash Hydrogeology Program University of Illinois (100 pp)
Bodnar RJ Reynolds TJ Kuehn CA 1985 Fluid-inclusion systematics in epithermalsystems In Berger BR Bethke PM (Eds) Geology and Geochemistry of Epithermal Systems Reviews in Economic Geology 2 pp 73ndash97
Boiron MC Cathelineau M Essarraj S Lespinasse M Sellier E 1991 Characterizationof the relationships between deformation 1047298uid migration and Au deposition in
quartz veins methodology and modelling Proceedings Gold 91 AA BalkemaPublishers Brazil pp 637ndash643Boiron MC Moissette A Cathelineau M Banks D Monnin C Dubessy J 1999
Detailed determination of palaeo1047298uid chemistry an integrated study of sulphate-volatile rich brines and aquo-carbonic 1047298uids in quartz veins from Ouro Fino(Brazil) Chem Geol 154 179ndash192
Botros NS 2004 A new classi1047297cation of the gold deposits of Egypt Ore Geol Rev 251ndash37
Bowers TS Helgeson HW 1983 Calculation of the thermodynamic and geochemicalconsequences of nonideal mixing in the system H2OndashCO2ndashNaCl on phase relationsin geological systems equation of state for H 2OndashCO2ndashNaCl 1047298uids at high pressuresand temperatures Geochim Cosmochim Acta 47 1247ndash1275
Boyle RW 1969 Hydrothermal transport and deposition of gold Econ Geol 64112ndash115
Burke EAJ 2001 Raman microspectrometry of 1047298uid inclusions Lithos 55 139ndash158Callaghan T 2001 Geology and host-rock alteration of the Henty and Mount Julia gold
deposits western Tasmania Econ Geol 96 (5) 1073ndash1088Carpenter RH 1954 Geology and ore deposits of the Rosario mining district and San
Juancito Mountains Honduras Central America Geol Soc Am Bull 65 23ndash28
Cepedal A Fuertes-Fuente M Martiacuten-Izard A Garciacutea-Nieto J Boiron MC 2013 Anintrusion-related gold deposit (IRGD) in the NW of Spain the Linares deposit igne-ous rocks veins and related alterations ore features and 1047298uids involved
J Geochem Explor 124 101ndash126Cesare B 1995 Graphite precipitation in CndashOndashH 1047298uid inclusions closed system compo-
sitional and density changes and thermobarometric implications Contrib MineralPetrol 122 25ndash33
Cleverley JS Bastrakov EN 2005 K2GWB Utility for Generating Thermodynamic DataFiles for the GeochemistsWorkbenchregat 0ndash1000 degC and 1ndash5000 bar from UT2K andthe UNITHERM Database
Collins PLF 1979 Gas hydrates in CO2-bearing 1047298uid inclusions and the use of freezingdata for estimation of salinity Econ Geol 74 1435ndash1444
Deksissa DJ Koeberl C 2005 Geochemistry alteration and genesis of gold mineraliza-tion in the Okote area southern Ethiopia Geochem J 38 307ndash331
Diamond LW 2003 Introduction to gas-bearing aqueous 1047298uid inclusions In Samson IAnderson A Marshall D (Eds) Fluid Inclusions Analysis and interpretation Miner-alogical Association of Canada Short Course Series 32 pp 101ndash158
Drever JI 1997 The Geochemistry of Natural Water Prentice-Hall Upper Saddle RiverNew Jersey
Drobe J Cann RM 2000 CundashAu skarn mineralization Minas de Oro District HondurasCentral America Explor Min Geol 9 51ndash63
Duan Z MoslashllerN WeareJK 1992a An equation of state for theCH4ndashCO2ndashH2O systemI Pure systems from 0 to 1000 degC and 0 to 8000 bar Geochim Cosmochim Acta 562605ndash2617
Duan Z MoslashllerN Weare JK 1992b Anequationof statefor the CH4ndashCO2ndashH2O systemII Mixtures from 50 to 1000 degC and 0 to 1000 bar Geochim Cosmochim Acta 562619ndash2631
Esmaeily D Afshooni SZ Mirnejad H Rashidnejad-e-Omran N 2012 Mass changesduring hydrothermal alteration associated with gold mineralization in the Astanehgranitoid rocks western Iran Geochem Explor Environ Anal 12 161ndash175
Gammons GH Williams-Jones AE 1997 Chemical mobility of Gold in the porphyryndash
epithermal environment Econ Geol 92 45ndash59Garofalo P Matthaumli SK Heinrich C 2002 Three dimensional geometry ore
distribution and time-integrated mass transfer through the quartzndashtourma-linendashgold vein network of the Sigma deposit (Abitibi belt mdash Canada) Geo1047298uids2 217ndash232
Garrabos Y Tufeu R Le Neindre B 1980 Rayleigh and Raman scattering near the crit-ical point of carbon dioxide J Chem Phys 72 (8) 4637ndash4651
Groves DI Goldfarb RJ Robert F Hart CJR 2003 Gold deposits in metamorphicbelts overview of current understanding outstanding problems future researchand exploration signi1047297cance Econ Geol 98 1ndash29
Guzman-Speziale M 2001 Active seismic deformation in the grabens of northern Cen-tral America and its relationship to the relative motion of the North AmericandashCarib-bean plate boundary Tectonophysics 337 39ndash51
Hedenquist JF Reyes AG Simmons SF Taguchi S 1992 The thermal and geochemi-cal structure of geothermal and epithermal systems a framework for interpreting1047298uid inclusion data Eur J Mineral 4 989ndash1015
Heinrich CA Driesner TStefaacutensson ASeward TM 2004 Magmatic vapor contractionand the transport of gold from the porphyry environment to epithermal ore deposits
Geology 32 761ndash764Horne G Clark G Pushkar P 1976 Pre-Cretaceous rocks of northwestern Honduras
basement terrane in Sierra de Omoa AAPG Bull 60 566ndash583Huizenga J-M 2005 COH an Excel Spreadsheet for composition calculations in the Cndash
OndashH 1047298uid system Comput Geosci 31 797ndash800Huizenga J-M 2011 Thermodynamic modelling of a cooling CndashOndashH 1047298uid-graphite sys-
tem implications for hydrothermal graphite precipitation Miner Deposita 46 23ndash33KawakamiY YamamotoJ Kagi H2003 Micro-Ramandensimeterfor CO2 inclusionsin
mantle-derived minerals Appl Spectrom 57 (11) 1333ndash1339Kawashima Y Katagiri G 1995 Fundamentals overtones and combinations in the
Raman spectrum of graphite Phys Rev B 52 10053ndash10059Klein EL Koppe JC Moura CAV 2002 Geology and geochemistry of the Caxis gold
deposit and geochronology of thegold-hosting Caxias Microtonalite Sao Luis Cratonnorthern Brazil J S Am Earth Sci 14 837ndash849
Lin F Bodnar RJ Becker SP 2007 Experimentaldetermination of the RamanCH4 sym-metric stretching (ν1) band position from 1ndash650 bar and 03ndash22 degC application to1047298uid inclusion studies Geochim Cosmochim Acta 71 3746ndash3756
Lu W Chou I-M Burruss RC Song Y 2007 An uni1047297ed equation for calculating meth-ane vapor pressures in the CH4ndashH2O system with measured Raman shifts GeochimCosmochim Acta 71 3969ndash3978
Luque FJ Pasteris JD Wopenka B Rodas M Barrenechea JF 1998 Natural 1047298uid-deposited graphite mineralogical characteristics and mechanisms of formationAm J Sci 298 471ndash498
Mann P Burke K 1984 Neotectonics of the Caribbean Rev Geophys 22 309ndash362Mann P Burke K 1988 Cenozoic rift formation in the northern Caribbean Geology 12
732ndash736MatthewsMJ Pimenta MA Dresselhaus GDresselhaus MS Endo M1999 Originof
the dispersive effects of the Raman D band in carbon materials Phys Rev B 59R6585ndashR6588
Mattioli M Menichetti M Renzulli A Toscani L Salvioli-Mariani E Suarez P 2014Genesis of the hydrothermal gold deposits in the Canan area Lepaguare DistrictHonduras Int J Earth Sci 103 901ndash928
Mikucki EJ 1998 Hydrothermal transport and depositional processes in Archean lode-gold systems a review Ore Geol Rev 13 307ndash321
Mills RA Hugh KE Feray DE Swolfs HC 1967 Mesozoic stratigraphy of HondurasAAPG Bull 51 1711ndash1786
Miur TL 2002 The Hemlo gold deposit Ontario Canada principal deposit characteris-
tics and constraints on mineralization Ore Geol Rev 21 1ndash
66Pasteris JD Chou I-M 1998 Fluid-deposited graphitic inclusions in quartz comparisonbetween KTB (German Continental Deep-Drilling) core samples and arti1047297cially re-equilibrated natural inclusions Geochim Cosmochim Acta 62 109ndash122
Perraki M Proyer A Mposkos E Kaindl R Hoinkes G 2006 Raman micro-spectroscopy on diamond graphite and other carbon polymorphs from theultrahigh-pressure metamorphic Kimi Complex of the Rhodope Metamorphic Prov-ince NE Greece Earth Planet Sci Lett 24 672ndash685
Phillips GN Powell R 2009 Formation of gold deposits review and evaluation of thecontinuum model Earth-Sci Rev 94 1ndash12
Pimenta MA Dresselhaus G Dresselhaus MS Canccedilado LG Jorio A Saito R 2007Studying disorder in graphite-based systems by Raman spectroscopy Phys ChemChem Phys 9 1276ndash1291
Pokrovski GS Akin1047297ev NN Borisova AY Zotov AV Kouzmanov K 2014 Gold spe-ciation and transport in geological 1047298uids insights from experiments and physicalndashchemical modelling Geol Soc Lond Spec Publ httpdxdoiorg101144SP4024(Online First)
Ratschbacher L Franz L Min M Bachmenn R Martens U Stanek K Stubner KNelson BK Herrmann U Weber B Loacutepez-Martiacutenez M Jonckheere R Sperner
255E Salvioli-Mariani et al Journal of Geochemical Exploration 158 (2015) 243ndash 256
7172019 Salvioli et al 2015
httpslidepdfcomreaderfullsalvioli-et-al-2015 1414
B Tichomirowa M McWilliams MO Gordon M Meschede M Bock P 2009 TheNorth AmericanndashCaribbean plate boundary in MeacutexicondashGuatemalandashHonduras In
James KH Lorente MA Pindell JL (Eds) The Origin and Evolution of the Caribbe-an Plate Geological Society London Special Publications 328 pp 219ndash293
Ridley JR Diamond LW 2000 Fluid chemistry of orogenic lode-gold deposits and im-plications for genetic models In Hagemann S Brown PE (Eds) Gold in 2000 Re-views in Economic Geology 13 pp 141ndash162
Ridley J Hagemann SG 1999 Interpretation of post-entrapment 1047298uid-inclusion re-equilibration at the Three Mile Hill Marvel Loch and Grif 1047297ns Find high-temperature lode-gold deposits Yilgran Craton Western Australia Chem Geol154 257ndash278
Robb L 2010 Introduction to Ore-forming Processes Blackwell Publishing Malden USARoberts RJ Irving EM 1957 Mineral deposits of Central America U S Geol Surv Bull1034 205
Roedder E 1984 Fluid inclusions Reviews in Mineralogy 12 Mineralogical Society of America Washington DC
Rogers RD Mann P 2007 Transtensional deformation of the western CaribbeanndashNorthAmerica plate boundary zone In Mann P (Ed) Geologic and Tectonic Developmentof the Caribbean Plate in Northern Central America Geological Society of AmericaSpecial Paper 428 pp 37ndash64
Rogers RD Mann P Emmet PA 2007 Tectonic terranes of the Chortis block based onintegration of regional aeromagnetic and geologic data In Mann P (Ed) Geologicand Tectonic Development of the Caribbean Plate in Northern Central America Geo-logical Society of America Special Paper 428 pp 65ndash88
Roine A 2009 HSC Chemistryreg 70 Users Guide ndash Volume frac12 ndash Chemical Reaction andEquilibrium Software With Extensive Thermochemical Database and Flowsheet Sim-ulation Outotec Information Center Finland
Samson IM Williams-Jones A-E Ault KM Gagnon JE 2008 Source of 1047298uids formingdistal ZnndashPbndashAg skarns evidence from laser ablation-inductively coupled plasma-mass spectrometry analysis of 1047298uid inclusions from El Mochito Honduras Geology
36 947ndash950Satish-Kumar M 2005 Graphite-bearing CO2-1047298uid inclusions in granulites insights on
graphite precipitation and carbon isotope evolution Geochim Cosmochim Acta 69(15) 3841ndash3856
Seitz JF Pasteris JD 1990 Theoretical and practical aspect of differential partitioning of gases by clathrate hydrates in 1047298uid inclusions Geochim Cosmochim Acta 54631ndash639
Shvarov YV 2008 HCh new potentialities for the thermodynamic simulation of geo-chemical systems offered by Windows Geochem Int 46 834ndash839
Sibson RH 1987 Earthquake rupturing as a mineralizing agent in hydrothermal sys-tems Geology 15 701ndash704
Silva-Romo G 2008 GuayapendashPapalutla fault system a continuous Cretaceous structurefrom southern Mexicoto theChortis BlockTectonicimplicationsGeology 3675ndash78
Spooner ETC Bray CJ Wood PC Burrows DR Callan NJ 1987 Aundashquartz vein andCundashAundashAgndashMondashanhydrite mineralization HollingerndashMcIntyre Mine Timmins
Ontario δ13C values (McIntyre) Fluid inclusion gas geochemistry pressure (depth)estimation and H2OndashCO2 phase separation as a precipitation and dilation mecha-nism Ont Geol Surv Misc Pap 136 35ndash56
Su W Xi B Xia B Zhang X Hu R 2008 Visible gold in arsenian pyrite at theShuiyindong Carlin-type gold deposit Guizhou China implications for the environ-ment and processes of ore formation Ore Geol Rev 33 667ndash679
Sundblad K Cumming GL Krstic D 1991 Lead isotope evidence for the formation of epithermalgold quartzveins in theChortis BlockNicaragua Econ Geol 86 944ndash959
Tagirov BR Salvi S Schott J Baranova NN 2005 Experimental study of goldndash
hydrosulphide complexing in aqueous solutions at 350ndash500 degC 500 and 1000 barsusing mineral buffers Geochim Cosmochim Acta 69 (8) 2119ndash2132
ThieryR Vanden Kerkhof AM Dubessy J 1994 vX properties of CH4ndash
CO2 and CO2ndash
N21047298uid inclusions modelling for T b 31 degC and P b 400 bars Eur J Mineral 6 753ndash771
Thomsen C Reich S 2000 Double resonant Raman scattering in graphite Phys RevLett 85 5214ndash5217
Van den Kerkhof AM 1988 The System CO2ndashCH4ndashN2 in Fluid Inclusions TheoreticalModelling and Geochemical Applications (PhD Thesis Amsterdam)
Vanden Kerkhof AM OlsenSN 1990 A natural example of superdense CO2 inclusionsmicrothermometry and Raman analysis Geochim Cosmochim Acta 54 895ndash901
Van den Kerkhof AM Thiery R 2001 Carbonic inclusions Lithos 55 49ndash68Vidano RP Ischbach DB Willis LJ Loehr TM 1981 Observation of Raman band
shifting with excitation wavelength for carbons and graphites Solid State Commun39 341ndash344
Wang X Chou I-M Hu W Burruss RC Sun Q Song Y 2011 Raman spectroscopymeasurements of CO2 density experimental calibration with high-pressure opticalcell (HPOC) and fused silica capillary capsule (FSCC) with application to 1047298uid inclu-sion observations Geochim Cosmochim Acta 75 4080ndash4093
Williams-Jones AE Bowell RJ Migdisov AA 2009 Gold in solution Elements 5281ndash287
Williams-Jones AE Samson IM Ault KM Gagnon JE Fryer BJ 2010 The genesis of
distal zinc skarns evidence from the Mochito deposit Honduras Econ Geol 1051411ndash1440
Wopenka B Pasteris JD 1993 Structural characterization of kerogens to granulite-facies graphite applicability of Raman microprobe spectroscopy Am Mineral 78533ndash557
Yang F Mao J Wang Y Bierlein F 2006 Geology and geochemistry of the Bulongquartzndashbarite vein-type gold deposit in the Xinjiang Uygur Autonomous RegionChina Ore Geol Rev 29 52ndash76
Zhang YG Frantz JD 1987 Determination of the homogenization temperatures anddensities of supercritical 1047298uids in the system NaClndashKClndashCaCl2ndashH2O using synthetic1047298uid inclusions Chem Geol 64 335ndash350
256 E Salvioli-Mariani et al Journal of Geochemical Exploration 158 (2015) 243ndash 256
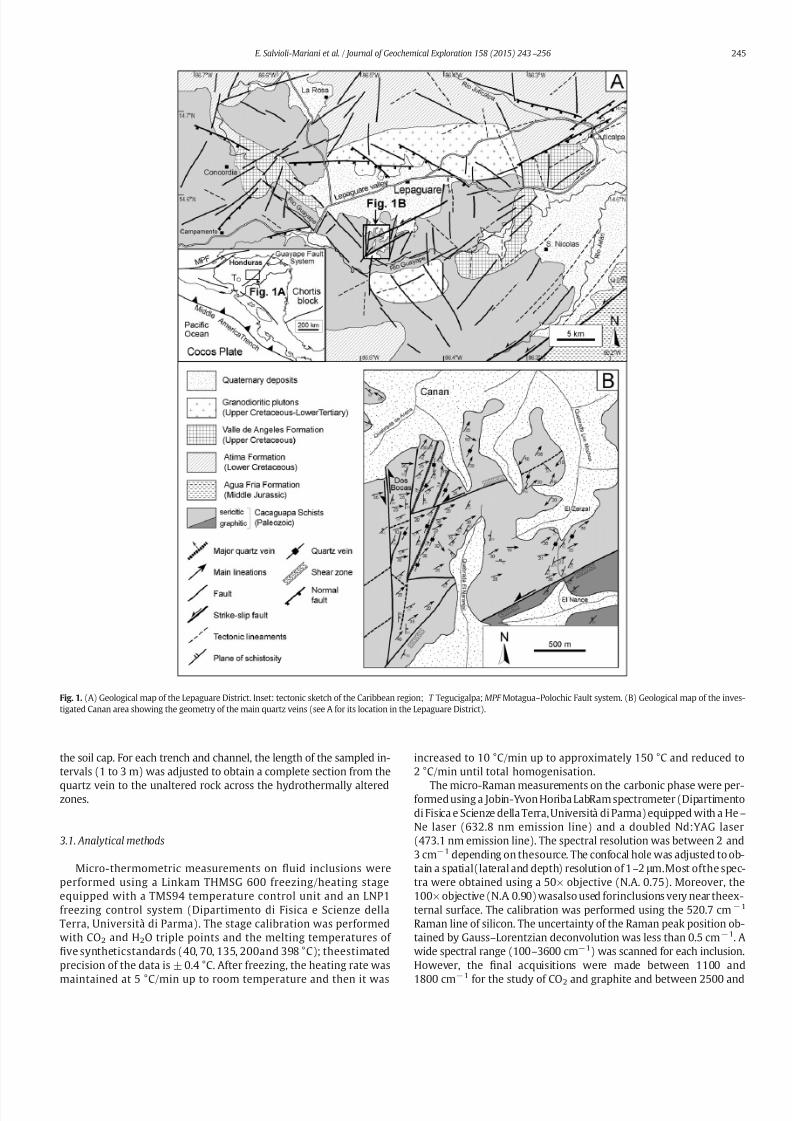
7172019 Salvioli et al 2015
httpslidepdfcomreaderfullsalvioli-et-al-2015 314
the soil cap For each trench and channel the length of the sampled in-tervals (1 to 3 m) was adjusted to obtain a complete section from the
quartz vein to the unaltered rock across the hydrothermally alteredzones
31 Analytical methods
Micro-thermometric measurements on 1047298uid inclusions wereperformed using a Linkam THMSG 600 freezingheating stageequipped with a TMS94 temperature control unit and an LNP1freezing control system (Dipartimento di Fisica e Scienze dellaTerra Universitagrave di Parma) The stage calibration was performedwith CO2 and H2O triple points and the melting temperatures of 1047297ve syntheticstandards (40 70 135 200and 398 degC) theestimatedprecision of the data is plusmn 04 degC After freezing the heating rate was
maintained at 5 degCmin up to room temperature and then it was
increased to 10 degCmin up to approximately 150 degC and reduced to2 degCmin until total homogenisation
The micro-Raman measurements on the carbonic phase were per-formedusing a Jobin-Yvon Horiba LabRam spectrometer (Dipartimentodi Fisica e Scienze della TerraUniversitagrave di Parma) equipped with a HendashNe laser (6328 nm emission line) and a doubled NdYAG laser(4731 nm emission line) The spectral resolution was between 2 and3 cmminus1 depending on thesource The confocal hole was adjusted to ob-tain a spatial(lateral and depth) resolution of 1ndash2 μ mMost ofthe spec-tra were obtained using a 50times objective (NA 075) Moreover the100times objective (NA 090) wasalso used forinclusions very near theex-ternal surface The calibration was performed using the 5207 cmminus1
Raman line of silicon The uncertainty of the Raman peak position ob-tained by GaussndashLorentzian deconvolution was less than 05 cmminus1 Awide spectral range (100ndash3600 cmminus1) was scanned for each inclusionHowever the 1047297nal acquisitions were made between 1100 and
1800 cmminus1
for the study of CO2 and graphite and between 2500 and
Fig 1 (A) Geological map of the Lepaguare District Inset tectonic sketch of the Caribbean region T Tegucigalpa MPF MotaguandashPolochic Fault system (B) Geological map of the inves-tigated Canan area showing the geometry of the main quartz veins (see A for its location in the Lepaguare District)
245E Salvioli-Mariani et al Journal of Geochemical Exploration 158 (2015) 243ndash 256
7172019 Salvioli et al 2015
httpslidepdfcomreaderfullsalvioli-et-al-2015 414
3300cmminus1 for methane with a laser excitation wavelength of 6328 nmWater wasdetermined by a laser excitation wavelength of 4731 nm be-tween 2500 and 3400 cmminus1 The acquisition timefor each spectral win-dowwas 120ndash240s with two accumulations The power on the samplesurface was nearly 1 mW
32 Calculation methods
Equilibrium calculations of 1047298uid inclusion physico-chemical con-ditions were performed using COH (version 6ndash08 Huizenga 2005)and HSC chemistry 71 (Roine 2009) COH software calculatesoxygen fugacity by the composition of carbonic 1047298uid (expressed as
molar fraction of CO2) obtained by Raman spectroscopy by the tem-perature and pressure of entrapment of the 1047298uid inclusions HSCsoftware estimates the pH and log f O2 of the mineralising 1047298uid(ldquoequilibrium compositionsrdquo module) Starting from the molar con-centration of the components (in our case H2O CO2 CH4 Na+ Clminus)the GIBBS or SOLGASMIX solvers calculate the values of pH and log f O2 (equilibrium at the speci1047297c isobaricndashisothermal conditions)using the Gibbs free energy minimization method (Roine 2009)
The activityof dissolved species for the AundashSndashCndashClndashH2O system werecalculated using The Geochemists Workbenchreg 7 (GWB) software(Bethke and Yeakel 2008) and data from the UNITHERM thermo-dynamic database version 44 (Shvarov 2008) extracted for tem-perature and pressure conditions estimated from 1047298uid inclusionsusing the K2GWB software (Cleverley and Bastrakov 2005)
4 Results
41 Fluid inclusions
The 1047298uid inclusions investigated in this paper are trapped in quartzcrystals of the mineralising veins of Dos Bocas which is representativeof the entire Canan gold 1047297eld The 1047298uid inclusions are quite abundantand range from a few microns up to 25 μ m in size and can be dividedinto four types on the basis of their composition and textural features(Table 2 Figs 2ndash4)
Type 1 mdash two phases are present at room temperature namely anaqueous liquid and a vapour phase (Fig 2A and B) The vapour to liquidratio is in the range 01ndash02 and the gas bubble often moves at room
temperature The inclusions are irregular to ellipsoidal or have a nega-tive crystal shape varying in size from a few microns to 18 μ m Inmost cases they constitute trails cross-cutting grain boundaries (S in-clusions Fig 2F)
Type 2 mdash this typeconsists of aqueous two-phase inclusions with anH2O-rich liquid and a CO2ndashCH4-bearing 1047298uid at room temperature(Fig 2C D and E) It occurs as an association of L-rich and V-rich inclu-sions which have VL ratios of 02ndash04 and 05ndash07 respectively(Table 2) The bubble comprises a CO2ndashCH4-bearing 1047298uid The carbonic1047298uid (see Sections 42 and 43) is primarily constituted by one phaseliquid and vapour phases rarely occur together Type 2 1047298uid inclusionsare the most abundantTheir morphologyis negative crystalor elongat-ed and irregular Their size varies from 5 to 24μ m Moreover they occurin clusters insidethe quartz crystals or near their boundaries suggesting
Table 1
Principal petrographic features key minerals assemblages and Au grade of the main rock-type units of the Canan ore deposit
Rock type Main petrographic features Key mineral assemblage Au grade
Quartz veins Type (1) Coarse-grained quartzWhite to light grey quartzCockscomb vuggy cavitiesElongated quartz grains
Qz Py Hem Gth Au Ag Low to very low
Type (2) Fine- to medium-grained quartzMilky smoky-grey to clear quartz
Static recrystallization of quartz120deg triple junctions
Qz Py Hem Gth Au Ag Low to very low
Hydrothermally alteredwall-rocks
Proximal zone Clays replace aluminosilicate phases Qz Py Ccp Apy Hem Gth Ilt Dck PrlAlu Dsp Kln
Low to medium
Intermediate zone Fine-grained muscovite replaces aluminosilicatephases
Qz Ms Py Ccp Apy Hem Gth Kln AuAg
High to very high
Distal zone Chlorite replaces biotite and muscovite Chl Qz Ilt Low To MediumUnaltered metamorphic
host-rocksGraphitic schists Very 1047297ne- to medium-grained
Bedding by graphite layeringDynamic recrystallization
Qz Bt Chl Ms Gr Absent
Sericitic schists Very 1047297ne- to medium-grainedLepidoblastic texturesWell-expressed foliation
Fsp Qz Ms Absent
Ag silverAlu alunite Apy arsenopyriteAu gold Bt biotite Ccp chalcopyrite Chlchlorite Dckdickite Dsp diaspore Fspfeldspar Gr graphite Gthgoethite HemhematiteKln kaolinite Iltillite Ms muscovite Prl pyrophyllite Py pyrite Qz quartz
Table 2
Summary of the petrographic features of the studied 1047298uid inclusions
Type A bundance Setting Origin B ubble vol Petrographic features
1 Common Trails S 10ndash20 Aqueous inclusions containing both liquid and vapour phases irregular toellipsoidal and negative crystal shape
2 Very common Clusters isolated trails P PS 25ndash40 L-rich50ndash70 V-rich
Aqueous two-phase inclusions with an H2O-rich liquid containing a CO2ndashCH4-bearing1047298uid negative crystal shape to elongated or irregular
3 Relatively common Clusters trails PS S N80 (carb) CO2ndashCH4-rich inclusions containing liquid plus vapour phases a thin 1047297lm of liquid H2Omay be present
4 Relat ively rare Clusters trails PS S Inclusions containing a dark phase with a lath-shape associated to variable amount of liquid phase
P primary 1047298uid inclusions PS pseudosecondary 1047298uid inclusions S secondary 1047298uid inclusions V vapour phase L liquid phase
246 E Salvioli-Mariani et al Journal of Geochemical Exploration 158 (2015) 243ndash 256
7172019 Salvioli et al 2015
httpslidepdfcomreaderfullsalvioli-et-al-2015 514
growth bands of the quartz crystals (P inclusions) or in trails withinsingle quartz crystals (P or PS inclusions)
Type 3 mdash CO2ndashCH4-rich inclusions that contain liquid and vapourphases comprise this type (Fig 3) The CO2ndashCH4 1047298uid occupies morethan 80 vol of the inclusion Sometimes the inclusion has a smallamount of liquid H2O close to walls or in the acute angles of the cavity
Where notobservedwater most likely forms a thin1047297lm along the inclu-sion walls The inclusion size varies between 4 and 24 μ m They occur inclusters or trails within the quartz crystals (PS and S inclusions)
Type4 mdash this type contains 1047298uidinclusions with an opaque solid anda variable amount of liquid (Fig 4) The opaque solid has a lath shapeand variable size In some inclusions the opaque solid is small (approx-imately 2 μ m about 20ndash30 vol) and surrounded by liquid (Fig 4A B)Rarely it occurs in two-phase inclusions (L + V) where it is in contactwith the bubble the VL ratio is 05ndash07 In most of the inclusions thetrapped opaque solid is anomalously large (70ndash90 vol) compared tothe host inclusions and has a very small amount of liquid on one side(Fig 4C D) They generally occur in clusters and are associated withType 2 and 3 inclusions
Some inclusions are naturally decrepitated and are star-shaped or
surrounded by a halo of tiny inclusions
The quartz crystals do not show growth zone de1047297ned by 1047298uid inclu-sions but some trails of 1047298uid inclusions although discontinuous cansuggest crystal growth According to Bodnar et al (1985) some petro-graphic features of our 1047298uid inclusions can be explained by boiling(i) the association of L-rich and V-rich inclusions (Type 2) where theL-rich inclusions have the liquidvapour ratio apparently variable (bub-
ble 25ndash40 vol) and the V-rich inclusions are a little larger (Fig 2C E)(ii) the occurrence of all V-rich inclusions as planes or trails (Type 3)and (iii) the absence of one-phase liquid inclusions
The relative timing of the 1047298uid inclusions in the quartz crystals isoften unclear because differenttypes of 1047298uidinclusionsare closely asso-ciated and a con1047297dent identi1047297cation of their origin is dif 1047297cult Due to theseveral phases of inclusion entrapment the earlier 1047298uid inclusions maybe modi1047297ed and the hydrothermal orogenic systems appear extremelycomplex Therefore we did a careful selection of the 1047298uid inclusionsfor the microthermometric evaluations
42 Microthermometry
Microthermometricexperiments were performed on more than 250
1047298uid inclusions We have performed the experiments mainly on 1047298uid
Fig 2 Optical microphotographs of Type 1 and 2 1047298uid inclusions (A B) Type 1 S aqueous-rich inclusions very small inclusions in transgranular trails (F) (C D E) Type 2 two-phase in-clusions forming associations of L-rich and V-rich inclusions Bar 10 μ m
247E Salvioli-Mariani et al Journal of Geochemical Exploration 158 (2015) 243ndash 256
7172019 Salvioli et al 2015
httpslidepdfcomreaderfullsalvioli-et-al-2015 614
inclusion assemblages with variable phase ratios (Type 2) These areconsidered the 1047298uid inclusions that have trapped the hydrothermal1047298uids carrying Au The microthermometric data are summarised inTable 3
421 Type 1 inclusions
The prevalent small size of Type 1 inclusions makes the observationof phase transformations during heating dif 1047297cult Approximately 55
inclusions have been measured The 1047297rst phase variation is suggestedby a dotted appearance due to the 1047297rst melting (eutectic temperatureTe) occurring in the range minus234 to minus119 degC The determined temper-aturessuggest theexistence of dissolvedNaCl andorKCl componentsinwater The remaining solid phase always has a clear appearance andmelts primarily from minus 44 to minus15 degC (ice melting temperatureTmice) On the basis of the ice melting temperature the total salin-ity calculated with the software package of Bakker and Brown
Fig 3 Optical microphotographs of Type 3 1047298uid inclusions (A B) Type 3b inclusions showing retrograde condensationduring microthermometric experiments(C D) Type 3c inclusionssuggesting a liquidndashliquid immiscibility Bar 10 μ m
Fig 4 Optical microphotographs of Type 4 1047298uid inclusions containing graphite with different size and variable LV ratios Bar 10 μ m
248 E Salvioli-Mariani et al Journal of Geochemical Exploration 158 (2015) 243ndash 256
7172019 Salvioli et al 2015
httpslidepdfcomreaderfullsalvioli-et-al-2015 714
(2003) and the equation of Zhang and Frantz (1987) is mainly inthe range 22ndash56 wt NaCl equivalent (rarely b 2 or N 56)(Fig 5B)
The total homogenisation temperature (Thtot) to liquid state occurspredominantly in the range 240ndash336 degC (with median and mode at290 degC Table 3 and Fig 5A)
422 Type 2 inclusions
Analyses were performedon more than 170 inclusions According totheir petrographic features L-rich and V-rich inclusions show differentbehaviour during freezing experiments The L-rich inclusions hereafterreferred to as Type 2a have higher freezing temperatures (minus 50 tominus379 degC) whereas the V-rich inclusions hereafter Type 2b have
Table 3
Summary of the microthermometric data of the studied 1047298uid inclusions
Type Te Tmice Tmcla Tmcarb Thcarb Thtot Salinity XCH4
1 minus234 divide minus 119 20
minus44 divide minus 15 34
240 divide 336 (L)[290 290]55
22 divide 56[32 27]
34
2a minus257 divide minus 111 27
minus76 divide minus 1582
56 divide 13482
250 divide 338 (L)[300 280]60
09 divide 48[35 37]82
005 divide 02011
2b minus282 divide minus 1169
minus71 divide minus 129
60 divide 1869
minus649 divide minus 583 23
180 divide 200 (L) 239 divide minus 100 (V) 293 divide 334 (L)299 divide 334 (V)10
1 divide 62 019 divide 0689
3a minus589 divide minus 583 182 divide 189 (V) 022 divide 10 27 3b minus636 divide minus 627 98 divide 125 (V)
3c minus981 divide minus 733 (V) or liquid immiscibilityminus893 divide minus 719
4 minus250 divide minus 197 minus07 divide minus 04 72 minus635
Temperature in degC Te = eutectic temperature Tmice = ice melting temperature Tmcla = clathrate melting temperature Tmcarb = melting temperature of the carbonic phase Thcarb =
homogenisation of the carbonic phase Thtot = total homogenisation temperature (L) = homogenisation to liquid phase (V) = homogenisation to vapour phase Salinity as wt NaClequivalent XCH4 = molar fraction of methane in the carbonic phase determined by Raman spectrometry In square brackets median and mode values respectively in italics number of measurements
Fig 5 Bar diagrams of microthermometric data (A C E) total homogenisation temperature Th tot (B D) total salinity as NaCl equivalent
249E Salvioli-Mariani et al Journal of Geochemical Exploration 158 (2015) 243ndash 256
7172019 Salvioli et al 2015
httpslidepdfcomreaderfullsalvioli-et-al-2015 814
signi1047297cantly lower freezing temperatures (minus90 to minus 121 degC) and thenucleation of a carbonic vapour bubble on cooling occurs also at verylow temperatures
In Type 2a inclusions the 1047297rst melting temperature (Te) primarilyoccurs between minus 253 and minus111 degC (Table 3) values compatiblewith H2OndashNaCl H2OndashKCl and H2OndashNaClndashKCl systems Due to the for-mation of clathrate upon cooling the ice melting temperature has be-come more dif 1047297cult to measure in practice Most Type 2a inclusions
exhibit ice melting temperatures very similar to those obtained fromType 1 inclusions(in therange minus76 to minus15degC Table 3)In a few inclu-sions ofType 2bit was possibleto obtainTe and Tmice (minus282 to minus116and minus 71 to minus 12 degC respectively Table 3)
In Type 2b inclusions a carbonic vapour bubble appears on coolingat two different temperature intervals ie 10 to 16 degC and minus 121 tominus84 degC Melting of the carbonic phase (Tmcarb) occurs mainly fromminus649 to minus 583 degC suggesting CO2 with other non-condensablegases most likely CH4 in variable proportions Due to the small size of the inclusions the detection of the homogenisation of the carbonicphase (as well as the temperature of homogenisation Thcarb) has beenquite dif 1047297cult to obtain Usually homogenisation to the vapour phaseoccurs at temperature Thcarb from minus 239 to minus10 degC (Table 3) andonly in two cases to liquid phase at higher temperature(Thcarb between18 and 20 degC)
In larger inclusions (approximately20 μ m) we were able to measurethe melting temperature of clathrate we employed the method of Collins (1979) using repeated cooling-heating cycles in proximity of the decomposition temperature of clathrate During microthermometricexperiments the clathrate crystals occur as (i) small crystals around thegaseous bubble (ii) colourless crystals in the aqueous phase (making thedetermination of Tmice dif 1047297cult) and (iii) irregular shape and motion of the gaseous bubble The decomposition temperature of clathrates(Tmcla) in the Type 2a inclusions varies mainly from 56 to 134 degC(Table 3) Where detectable Tmcla in Type 2b inclusions is comparableor higher (60ndash186 degC Table 3) At low pressure CH4 clathrate melts attemperatures higher than 15 degC whereas CO2 clathrate melts at lowertemperatures (b10 degC Seitz and Pasteris 1990 Diamond 2003)
The salinity of Type 2 inclusions was calculated using the melting
temperature of clathrates with the software package of Bakker andBrown (2003) and the equations of Duan et al (1992ab) the resultsare comparable with the values obtained for Type 1 inclusions althoughthey extend towards lower values (09ndash48 and 1ndash62 wt NaClequivalent Fig 5D and Table 3) The composition of the carbonic1047298uid is dif 1047297cult to obtain due to the formation of clathrate duringmicrothermometric experiments
Themost frequent values for Thtot (Table 3) are 250ndash338 degC (medianand mode at 300 degC and 280 degC respectively Type 2a Fig 5C) 293ndash334 degC (to liquid phase Type 2b) and 299ndash334 degC (to vapour phaseType 2b Fig 5E)
423 Type 3 inclusions
Only25 inclusions of the Type 3 havebeeninvestigated Most Type 3
inclusions freeze at very low temperatures below minus 85 degC and down tominus136 degC the extremely low water content rarely allows observation of the changes induced by freezing The carbonic phase melts primarily inthe range minus 636 to minus 583 degC (Table 3) similarly to Type 2b inclusionssuggesting a variable proportion of CO2 with other non-condensablegasesmost likely CH4 The melting temperature (Tmcarb) rarely reacheslower values down to minus 699 degC suggesting high contents of CH4 Onlyone determination gave Tmcarb = minus 569 degC
Thehomogenisation of the carbonic phase to vapour phase occurs atdifferenttemperatures (Table 3)(i) 182ndash189 degC forthe inclusions withthe highest Tmcarb (minus589 to minus 583 degC hereafter 3a) and (ii) 98ndash125 degC for the inclusions melting at lower temperatures (minus636 tominus627 degC hereafter 3b Fig 3A B) The homogenisation temperatureto vapour phase of Type 3b inclusions suggests that Tmcarb should be
greater than approximately minus 62 degC (cf Ridley and Hagemann 1999
Thiery et al 1994 Van den Kerkhof and Thiery 2001) This behaviouris the consequence of retrograde condensation (ie the condensationof liquid under isothermal conditions on lowering pressure) which in-creases the temperature of homogenisation (to the gas phase) of the1047298uid inclusions (with a given composition) to values higher than thecritical temperature (Thiery et al 1994 Van den Kerkhof 1988 Vanden Kerkhof and Thiery 2001)
A further subgroup of Type 3 inclusions (hereafter 3c Table 3 and
Fig 3C D) has a varied behaviour at very low temperatures (minus
981to minus733 degC) they apparently homogenise to thevapourphaseand like-ly to another liquid supporting a case of liquidndashliquidndashgas immiscibility(Thiery et al 1994) At room temperature these inclusions have twophases of similar density (Fig 3C D) In some inclusions a meniscusoccurs in the bubble at temperature from minus 893 to minus 719 degC (whichgradually disappears at approximately minus63 to minus 60 degC) and thecarbonic phase appears darker or takes on a bumpy surface
424 Type 4 inclusions
In rare cases it was possible to obtain data during microthermometricexperiments The obtained temperatures (Tmcarb ~ minus 635 degC Te fromminus250 to minus197 degC Tmice from minus07 to minus04 degC and Tmcla 72 degCTable 3) are fully comparable with those of Type 2 and Type 3 inclusions
43 Micro-Raman spectroscopy
To estimate the entrapment conditions we must know both thecomposition and density of the trapped 1047298uid However as statedabove they are dif 1047297cult to obtain for the occurrence of clathrates Toovercome this problem we determinedthe composition of the carbonicphase using micro-Raman spectroscopy
431 CO 2ndashCH 4 1047298uids
For Raman analysis of the carbonic phase we selected approximate-ly 50 inclusions of Type 2 and 3
The Raman spectra of these inclusions are characterised by (i) theRaman active stretchingmodeν1 at 1278ndash1282 cmminus1 and the overtoneof thebending modeν2 (2ν2)at1380ndash1385 cmminus1 typicalof CO2 (Fig6)
and known asthe Fermi diad (Garrabos et al 1980) and(ii) theisolatedC-H stretching band (ν1) of CH4 at 2907ndash2913 cmminus1 (Fig 6 Burke2001) In the spectral area of reduced sulphur species the backgroundsometimes shows a small hump which might be considered as a smallpeak (insetin Fig6C) It occurs atabout 2610cmminus1 suggestingthe pres-ence of a very small amount of H2S associated to the carbonic vapourphase The detection limit is estimated at 1 mol for H2S
According to the literature (Kawakami et al 2003 Van den Kerkhof and Olsen 1990 Wang et al 2011) the changes of frequency in theRaman spectrare1047298ect variations in pressure1047298uid density and tempera-ture The separation between the two bands (Δν) represents a bettermeasure of CO2 density than the peak positions or the ratio of thepeak positions (Kawakami et al 2003 Wang et al 2011) The mea-sured Δν in our 1047298uid inclusions is 1035ndash104 cmminus1 On the basis of
the equation from Wang et al (2011) valid for the entire range of den-sities(with CH4 le 10 mol) the calculatedCO2 density of the investigat-ed 1047298uid inclusions is in the range 034ndash056 gcm3
Similarly the position of the ν1 band is also in1047298uenced by pressureand temperature variations for CH4 Unfortunately we were unable toobtain reliable density values because the equations proposed in the lit-erature have been calibrated using a 51453 nm laser (Lin et al 2007)and are valid for pure or almost pure CH4 (b10 mol of other compo-nents such as CO2) and CH4ndashH2O systems (Lu et al 2007) which areconditions signi1047297cantly different from those of our systems
On the basis of the microthermometric data we infer that the car-bonic components are present in variable proportions and their molefractions have been determined from Raman spectra according toBurke (2001) That study provides a simple formula that considers
CO2 and CH4 peak areas (both CO2 peaks must be considered) CO2
250 E Salvioli-Mariani et al Journal of Geochemical Exploration 158 (2015) 243ndash 256
7172019 Salvioli et al 2015
httpslidepdfcomreaderfullsalvioli-et-al-2015 914
and CH4 Ramanscattering ef 1047297ciencies andCO2 and CH4 instrumental ef-1047297ciencies for the speci1047297c laser wavelength (6328 nm) The CH4 molefraction (XCH4) varies between 005ndash020 in Type 2a 019ndash068 inType 2b and 022ndash10 in Type 3 inclusions (Table 3)
432 Carbonaceous material
Type 4 inclusions are peculiar because they contain a black solidphase with a lath shape and variable proportions of aqueous liquidphase Based on Raman spectra the solid phase is identi1047297ed as graphite25 Raman spectra were acquired for both solid and liquid phases
Raman spectra of the carbonaceous material are very sensitive tochanges in the order degree The1047297rst order bands of the Raman spectraof carbonaceous material are characterised by the G band at approxi-mately 1580 cmminus1 typical of crystalline or ordered graphite the Dband at approximately 1350 cmminus1 and the Dprime band at approximately1620 cmminus1 typical of disordered or defect bearing carbonaceous mate-rial (Aoya et al 2010 Luque et al 1998 Thomsen and Reich 2000Vidano et al 1981) Carbonaceous materials also exhibit a strong
Raman band in the range 2500ndash
2800 cmminus1
which corresponds to the
overtone of the D band This band appears in the second-order Ramanspectra and is called the Gprime band (Pimenta et al 2007) The decreasein the order degree of graphite is also evident by the development of an asymmetry andbandbroadening in the second-order peak and a de-crease in resolution among its constituent bands (Pasteris and Chou1998) If the position of the G band is not affected by the wavelengthof thelaser the Raman frequency of theD band increases with theexci-tation energy (Kawashima and Katagiri 1995 Matthews et al 1999
Vidano et al 1981) Moreover the ratio of the integrated intensity of the D and G bands (IDIG) decreases with increasing laser energyWith our equipment (λ = 6328 nm) the D band is expected at ap-
proximately 1330 cmminus1 The spectra acquired on Type 4 inclusions(Fig 7A B) have frequencies in the range 1332ndash1336 cmminus1 and1578ndash1581 cmminus1 forD and G bands respectivelyThe Dprime bandis alwayspresent as a shoulder on the high-frequency side of the G peak in therange 1613ndash1620 cmminus1 In the region of second-order bands an unre-solved doublet or a large band at approximately 2664ndash2709 cmminus1 oc-curs The D band is broad with low intensity when compared to the Gband and with a very low IDIG ratio (016ndash030) The degree of crystal-linity is represented by the length of ordered crystals along the a
Fig 6 Ramanspectra ofthe carbonicphase inexample Type 2a(A)Type2b (B)andType3 (C) 1047298uid inclusions The intensity scale of the inset is unchanged
Fig 7 Raman spectraof graphite in Type4 1047298uidinclusions (A B) compared with those of
graphite from wall-rock (C)
251E Salvioli-Mariani et al Journal of Geochemical Exploration 158 (2015) 243ndash 256
7172019 Salvioli et al 2015
httpslidepdfcomreaderfullsalvioli-et-al-2015 1014
crystallographic direction designated as L a (Pasteris and Chou 1998)The IDIG ratio and L a are negatively correlated and the most disorderedgraphite is characterised by the highest IDIG and the lowest L a values(Pasteris and Chou 1998) According to the general formula proposedby Pimenta et al (2007) which can be applied to any laser line we ob-tained the crystallite size L a in the range 1300ndash2400 Aring The calculatedparameters and the widths of the D and Gprime bands suggest a fairly gooddegree of graphite crystallinity which is comparable to that of naturally
or laboratory-produced graphite (Luque et al 1998 Pasteris and Chou1998 Perraki et al 2006 Satish-Kumar 2005 Wopenka and Pasteris1993) The Raman spectra of trapped graphite are all similar ( Fig 7AB) suggesting that the precipitation of graphite occurred from the hy-drothermal 1047298uid
The liquid portion associated with trapped graphite contains CO2CH4 and liquid H2O The typical peaks of CO2 (1280ndash1281 and1383ndash1384 cmminus1) and of CH4 (2910ndash2913 cmminus1) were observedusing the 6328 nm laser (Fig 8A) Moreover the peak for liquid H2Oat 3250ndash3252 cmminus1 was detected with the 4731 nm laser (Fig 8B)
Because of thepresenceof graphite in thehost rocks (quartz-sericiticand graphitic schists) for comparison we acquired 6 Raman spectra onthis carbonaceous materials They are completely different from thoseobtained for the graphite in the 1047298uid inclusions (Fig 7C) The D band(1329ndash1334 cmminus1) has a higherintensitythan that ofgraphitein thein-clusions and sometimes reaches the same intensity as the G band at1580ndash1583 cmminus1 Therefore the IDIG ratios are higher (095ndash208)and L a is lower (200ndash400 Aring) supporting the presence of fairly disor-dered graphite The shape of the spectra and the calculated parametersof graphite from the host rock of Canan are comparable to those of thegraphite from metapelites of chlorite facies (Luque et al 1998Wopenka and Pasteris 1993)
5 Discussion
Four types of 1047298uid inclusions have been found in the quartz crystalsfrom the mineralising veins of Dos Bocas a representative example of
gold deposit at Canan Some 1047298uidinclusions are along fractures crossingone or more crystals (Type 1 S inclusions)The most important1047298uid in-clusions constitute discontinuous trails which can suggest crystalgrowth zones (Type 2) The 1047298uid inclusion associations formed by L-richand V-richinclusions (Type 2 P andPS inclusions) andthe presenceof trails entirely constituted by V-rich inclusions(Type 3 PS andS inclu-sions) suggest that the hydrothermal 1047298uid suffered 1047298uid immiscibility(boiling) The trapped 1047298uid consists of an aqueous solution (H2Ondash
NaClndash
KCl with 09ndash
48 wt NaCl equivalent) plus a CO2ndash
CH4 1047298
uid(80ndash90 mol CO2) As shown by Bowers and Helgeson (1983) a pres-sure drop moves the H2O-carbonic phase solvus towards higher tem-perature which causes a decrease of carbonic gas solubility and theexsolution of CO2 (and CH4) gas from the water-rich 1047298uid according tothe Henrys law In geological environments such as Canan where thetectonics aredominatedby strikendashslip fault systems thefracture forma-tion after deformation causes a rapid and immediate reduction in pres-sure The occurrence of some inclusions naturally decrepitated can beexplained by pressure drop The presence of Type 3b 1047298uid inclusionswhich exhibit retrograde condensation further supports the occurrenceof such a pressure drop
Because of 1047298uid immiscibility the total homogenisation temperaturecan be considered as the trapping temperature Isochores have been re-constructed for Type 2 1047298uid inclusions combining the results frommicrothermometry and Raman analyses using the software package of Bakker and Brown (2003) and the equations of Bakker (1999) andDuan et al (1992b) Trapping pressures of 05ndash14 kbar were obtainedThe coexistence of different types of 1047298uid inclusions and their similarvalues of Th suggest that they can be related to the same hydrothermalprocess which wasresponsiblefor the gold mineralisation at CananThedifferentamounts of water andcarbonic1047298uids inthe inclusions is due tothe 1047298uid immiscibility where the H2O-rich 1047298uid is in Type 2a inclusionsand the CO2ndashCH4-rich 1047298uid in Types 2b and 3 inclusions Finally Type 4inclusions would represent the inclusions (both Type 2 and 3) wherethe conditions for graphite precipitation have been achieved
The graphite of the1047298uid inclusions (Type 4) is similar to that precip-itated from hydrothermal1047298uids This indicates that graphite depositionoccurred before or contemporaneously of the entrapment of the 1047298uid
The degree of crystallinity of graphite in the 1047298uid inclusions is higherthan that observed in the graphite from the host quartz-sericitic andgraphitic schists (Fig 7) Nonetheless this does not exclude the pres-ence of a metamorphic component in the mineralising 1047298uids
Equilibrium of graphite in the hydrothermal1047298uid allows the evalua-tion of oxygen fugacity The calculated atomic ratio XO [O(O + H)] isinthe range 032ndash041 (Fig 9) which is typical of slightly reduced 1047298uids(Cesare 1995 Huizenga 2011) Considering temperatures of 300 degCand pressures of 14 10 and 05 kbar (Tt and Pt respectively) graphitesaturation conditions (aC = 1) and the composition of the carbonicphase as inferred by Raman spectroscopy the calculated f O2 is aboutminus342 log unit (ie about 16 log unit above theQFM buffer) This resultis consistent with that obtained using the HSC chemistry software log f O2 asymp minus376 plusmn 25 which permitted us to calculate also the activity
of dissolved hydrogen ions at equilibrium condition between the con-stituents H2OCO2 CH4 Na+ andClminuspH=29plusmn04Itcanbeobservedthat our estimated pH value is low but this range of acidity is not un-common in1047298uid inclusions (egBenison 2013) including gold deposits(Boiron et al 1999 Pokrovski et al 2014)
According to Roedder (1984)thepHin 1047298uid inclusions can be calcu-lated or determined In the latter case the opening of the 1047298uid inclu-sions implies the loss of the trapped gases It follows that the pH isdetermined on a 1047298uid other than the original and which has undergonebasi1047297cation due to the loss of gas
The composition of Type 2 inclusions plotted in the ternary diagramCOH falls within the stability 1047297eld of graphite (towards the CO2 vertexFig 9) and the 1047298uid associated with graphite in Type 4 inclusions isalso constituted by H2OndashCO2ndashCH4 These features support precipitation
of graphite by the reaction CH4 + CO2rarr
2 C + 2 H2O The decrease of
Fig 8 Raman spectraof the1047298uid portion of Type 4 1047298uid inclusions (A)CO2 and CH4 have
been obtained by 6328 nm laser (B) H2O by 4731 nm laser
252 E Salvioli-Mariani et al Journal of Geochemical Exploration 158 (2015) 243ndash 256
7172019 Salvioli et al 2015
httpslidepdfcomreaderfullsalvioli-et-al-2015 1114
temperature andor the increase of pressure move the reaction towardsthe products In our case a combination of cooling and decompressionacted on the system so that the variation of temperature and pressurecannot be responsible for the precipitation of graphite According toHuizenga (2011) the precipitation of graphite is in1047298uenced by XO
value and oxygen fugacity the best conditions for precipitation areXO = 033 and QFM-2 b log f O2 b QFM + 1 Small variations from
these values prevent the precipitation or cause consumption of earlyprecipitated graphite XO values and f O2 of our Type 2 1047298uid inclusions(see above) agree with the Huizenga (2011) data and indicate thatsome 1047298uid inclusions were able to precipitate graphite
The H2S content and the oxygen fugacity of the hydrothermal 1047298uidsaffect the solubility of gold In H 2S-rich 1047298uids Au(HS)2
minus andAu(HS)deg are the dominant Au-complexes and gold has high solubil-ity (Au N 100 ppb) whereas in H2S-poor 1047298uids the gold solubilitydecreases and AuCl2
minus is the dominant stable complex (Gammonsand Williams-Jones 1997) When the partial pressure of H 2S is1047297xed by the magnetitendashpyrite pair the Au bisulphide complex isstable at T b 450 degC and the chloride complex at higher temperature(Mikucki 1998) At high oxygen fugacity H2S is oxidised and thusthe mobility of gold as bisulphide decreases considerably ( Gammons
and Williams-Jones 1997) Experimental studies at temperatures of 350ndash500 degC and pressures of 05ndash1 kbar have shown that Au(HS)2
minus isthe dominant Au complex in near neutral to weakly acidic solutions inthe presence of the K-feldsparndashmuscovitendashquartz mineral associationand at pyritendashpyrrhotitendashmagnetite buffer conditions (Tagirov et al2005)
Many of the conditions employed in the experiments mentionedabove match those of the Canan ore deposit 1047298uid inclusions indicatethe presence of low salinity and low temperature (T b 400 degC) hydro-thermal 1047298uids and XRD data (Mattioli et al 2014) show that the wall-rocks contain the K-feldsparndashmuscovitendashquartzndashpyritendashpyrrothitendashmagnetite association (Table 1) However the hydrothermal 1047298uids atCanan seem to be extremely acidic (pH = 29) which makes Au(HS)degmore stable than Au(HS)2
minus and themost abundant complex in thesolu-
tions (cf also Heinrich et al 2004 Pokrovski et al 2014) Hence we
infer that the gold of Canan was transported by hydrothermal 1047298uids asAu(HS)deg complex
Activity diagrams are a powerful graphical tool for depicting the sta-bility of dissolved species and solid and gas phases with respect to thecomposition of the coexisting solution Calculations on Au speciationwere performed under the mean conditions estimated by the analysisof the 1047298uid inclusions and the results plotted in log f O2-pH diagrams(Fig 10) The decrease in solubility of the Aundashsulphide complexes can
be ascribed both to the fracturation-induced pressure drop andthe con-centration of sulphur in solution According to Mattioli et al (2014) thegold deposit of Canan was formed by the hydrothermal 1047298uid activityalong fractures produced by tectonics Opening and lateral expansionof the fractures produce a pressure drop on the 1047298uids themselves andboiling of the dissolved gases The 1047298uid composition affects the depthof boiling which is an ef 1047297cient mechanism for gold precipitation(Hedenquist et al 1992 Pokrovski et al 2014 Robb 2010 Sibson1987) Boiling produced the exsolution of H2S which in turn caused adecrease in the solubility of theAundashsulphide complexes and the precip-itation of gold (Fig 10) In the case of the Canan deposit boiling repre-sents only the initial phase of gold deposition In fact the main bodyof thegoldmineof Canan is located in metamorphic rocks cutby quartzveins where hydrothermal 1047298uids altered the primary mineralogy andchanged their composition and ability to carry gold in solution In theore deposit Au coexists with sulphides and in particular small grainsof pure gold are surrounded by pyriteand other sulphides This suggeststhat gold was deposited by reactions involving 1047298uids containing Au-Scomplexes and the wall-rock containing chalcophile elements particu-larly Fe a process known as ldquosulphidationrdquo (Williams-Jones et al 2009and references therein Robb 2010) At Canan Fe is abundant in freshwall-rocksfor thepresence of biotiteand chloriteThese minerals disap-pear in the vicinity of quartz veins of the ore deposit where the highestconcentration of gold and sulphides are observed (Mattioli et al 2014)During the alteration of biotite and chlorite Fe is released into the hy-drothermal 1047298uids and likely produces the following reaction with theAundashsulphide complexes
AuethHSTHORN∘ethaqTHORN thorn 05Fe2thornharr05FeS2ethPyriteTHORN thorn H
thorn thorn Au∘ethGoldTHORN eth1THORN
Under equilibrium conditions and assumingP = 1400barT = 300 degCand the water activity H2O = 1 the resulting log K is 53151 (ΔGdeg-R = minus 5833 kJ molminus1) The high value of the equilibrium constant Kand the highly negative value of ΔGdegR indicate that the reaction has aspontaneous tendency towards the products According to Robb (2010)these reactions occur in dynamic systems where kinetics predominatesover equilibrium conditions Therefore it is very unlikely that reaction(1) occurs under equilibrium conditions in an open natural system Be-cause of the continuous supply of Au(HS)deg from the hydrothermal 1047298uidsand Fe2+ from the alteration of biotite and chlorite (within the zones of 1047298uid-rock interaction) reaction (1) is imbalanced and pushed towardsthe products by favouring the deposition of gold and sulphides This isin agreement with Pokrovski et al (2014) who state that the interactionof sulphur-rich hydrothermal 1047298uids and Fe2+-rich wall rocks(sulphidation) is one of the main processes leading to the precipitationof gold
Additionally the activity of sulphur in the 1047298uids is responsible forthe solubilisation and transport of gold At Canan the activity of Sought to be at least 10minus2 Above this value the composition of hydro-thermal 1047298uid plots in the stability 1047297eld of Au(HS)deg (Fig 10) Withlower concentrations of S (and lower pressure) the transportof gold oc-curs as chloride (Fig 10L M and N) If iron is no longer available aftercomplete alteration of biotite and chlorite the deposition of goldcould be represented by the reaction
AuethHSTHORN∘ethaqTHORN thorn 05H2ethgTHORNharrH2SethgTHORN thorn Au∘ethGoldTHORN eth2THORN
where log K = 69130 (ΔGdegR = minus 7586 kJ molminus1) at T = 300 degC and
P = 1400 bar indicates once again a spontaneous tendency towards
Fig 9 Ternary CndashOndashH diagramshowing thecarbon saturatedsurface (solid line) at 300degCand1400 barcalculated by Perple_Xsoftware(J Connollywwwperplexethzch) Dashedlines represent the compositional triangle H2OndashCO2ndashCH4 dotted 1047297eld Type 2a inclusionsstriped 1047297eld Type 2b inclusions Lines of constant XO 035 and 040 (dot-dashed lines) arealso shownTheopencircles andthenumbers initalics indicate f O2
1047298uid relative toQFM buff-er in log10 units (log f O2
1047298uidndashlog f O2
QFM) for 1047298uids in equilibrium with graphite
253E Salvioli-Mariani et al Journal of Geochemical Exploration 158 (2015) 243ndash 256
7172019 Salvioli et al 2015
httpslidepdfcomreaderfullsalvioli-et-al-2015 1214
theproducts andthe presence of H2 agrees with the reducing conditions(log f O2 asymp minus376) found in the hydrothermal 1047298uids of Canan Reaction(2) would be effective during boiling andor decompression (cf Boyle1969 Pokrovski et al 2014) Similarly to reaction (1) the dynamicsystem conditions (the continuous supply of Au(HS)deg and loss of H2S)favour the kinetic of the reaction (2) and con1047297rm the statements of Robb (2010) and Sibson (1987) on the ef 1047297ciency of this process forgold deposition Finally the kinetics of reaction (1) is further increasedby the alteration of feldspar and muscovite in kaolinite and diaspore (cfMattioli et al 2014) The mineral alterations subtract H+ from the solu-
tion (Drever 1997) favouring the precipitation of Au
6 Concluding remarks
The quartz veins associated with gold mineralisations from DosBocas (Canan area Lepaguare District east-central Honduras) are richin 1047298uid inclusions of four main types Type 1 mdash S two-phaseaqueous-rich inclusions Type 2 mdash P to PS aqueous-rich inclusionswith an H2O-rich liquid and a CO2ndashCH4-bearing liquid Type 3 mdash PSto S CO2ndashCH4-rich inclusions with a very small amount of waterand Type 4 mdash graphite-bearing aqueousndashcarbonic 1047298uid
The association of L-rich and V-rich inclusions (Type 2) and the oc-currence of trails containing only V-rich inclusions (Type 3) support a
1047298uid immiscibility (boiling)of the hydrothermal1047298uidThe hydrothermal
trapped 1047298uid is constituted by H2O + alkali chloride + CO2 plusmn CH4 Thecalculated salinity varies from 09 to 48 wt NaCl equivalent
The immiscibility of 1047298uids can be related to a pressure decrease dueto both the opening of fractures and upward 1047298ow of 1047298uids At Canan astrikendashslip fault systemis responsible for the fracturing of the metamor-phic wall-rocks Thisgeological setting with the mineralogicalpetrolog-ical and geochemical features supports an orogenic character of theinvestigated gold deposits
In some 1047298uid inclusions the occurrence of graphite with typical fea-tures of graphite precipitated from hydrothermal 1047298uids suggests that
the deposition of graphite was prior or concomitant with the entrap-ment of the 1047298uid Moreover the occurrence of graphite associated towater andcarbonic1047298uidssupports the presence of a metamorphic com-ponent in the mineralising 1047298uid
Microthermometric and spectroscopic data from 1047298uid inclusionssuggest that the gold mineralisations at Canan formed at T = 300 degCunderP=500ndash1400 barsThecalculated oxygenfugacityand pH valuesof the hydrothermal 1047298uids are approximately minus 376 plusmn 25 log unit(1 log unit above the QFM buffer) and 29 plusmn 04 respectively
The hydrothermal 1047298uids contained sulphur (activity of S ge 10minus2)assuggested by the association of gold with sulphides including pyriteand chalcopyrite For the above chemical and physical conditions themost abundant sulphur specie carrying gold in solution is the Au(HS)degcomplex Several causes are responsible for the precipitation of gold in
the Canan area 1 mdash boiling following the pressure drop caused by
Fig 10 Activity diagrams for the system AundashCndashClndashSndashH2O at 300 degC Au and H2O activity 10minus7 (~10 ppb) and 100 respectively Cl 10minus098 and C buffered by graphite (see ldquoCalculationmethodsrdquo) Variable values of pressure are considered 1400 bar (A B C and D) 1000 bar (E F G and H) 500 bar (I L M and N) Activities of total dissolved S are 10minus1 (A E and I)10minus2 (B F and L) 10minus3 (C G and M) and buffered by pyrite (D H and N) Green 1047297eld represents the mean composition of the 1047298uid inclusions (pH = 29 plusmn 04 log f O2 = minus 376 plusmn25) Red lines limit the 1047297elds of Au species dashed black lines the S species and dashed blue lines the carbon species The thickness of the red lines corresponds to an uncertainty of log [Au] = plusmn01 or log [H2O] = plusmn02
254 E Salvioli-Mariani et al Journal of Geochemical Exploration 158 (2015) 243ndash 256
7172019 Salvioli et al 2015
httpslidepdfcomreaderfullsalvioli-et-al-2015 1314
tectonic andor hydrothermal 1047298uids activity 2 mdash sulphidation triggeredby the liberation of metal cations during the alteration of ma1047297c min-erals of the wall-rocks 3 mdash hydrothermal alteration of feldspars andphyllosilicates of the wall-rocks
Acknowledgements
The authors wish to thank M Menichetti for providing samples of
the quartz veins and the Goldlake Group for the permission to publishthe results of this study Special thanks are due to John Ridley for theuseful and encouraging suggestions which have noticeably improvedthequality of this paperSincere thanksare dueto BJStacey forimprov-ing the English
References
Alvarez-Gogravemez JA Meijer PT Martigravenez-Digraveaz JJ Capote R2008 Constraintsfrom1047297nite element modeling on the active tectonics of northern Central America andthe Middle America Trench Tectonics 27 TC1008 httpdxdoiorg1010292007TC002162
Andrada de Palomera P van Ruitenbeek FJA van der Meer FK Fernaacutendez R 2012Geochemical indicators of gold-rich zones in the La Jose1047297na epithermal depositDeseado Massif Argentina Ore Geol Rev 45 61ndash80
Aoya M Kouketsu Y Endo S Shimizu H Mizukami T Nakamura D Wallis S 2010Extending the applicability of the Raman carbonaceous-material geothermometer
using data from contact metamorphic rocks J Metamorph Geol 28 895ndash914Bakker RJ 1999 Adaptation of the Bowers and Helgeson (1983) equation of state to the
H2OndashCO2ndashCH4ndashN2ndashNaCl system Chem Geol 154 225ndash236Bakker RJ Brown PE 2003 Computer modelling in 1047298uid inclusion research In
Samson I Anderson A Marshall D (Eds) Fluid Inclusions Analysis and interpreta-tion Mineralogical Association of Canada Short Course Series 32 pp 175ndash212
Benison KC 2013 Acid saline 1047298uid inclusions examples from modern and Permianextreme lake systems Geo1047298uids 13 579ndash593
Bersani D Salvioli-Mariani E Mattioli M Menichetti M Lottici PP 2009 Raman andmicro-thermometric investigation of the 1047298uid inclusions in quartz in a gold-richformation from Lepaguare mining district Spectrochim Acta A 73 443ndash449
Bethke CM Yeakel S 2008 The Geochemists Workbenchreg mdash Release 7 GWB Essen-tials Guide mdash Hydrogeology Program University of Illinois (100 pp)
Bodnar RJ Reynolds TJ Kuehn CA 1985 Fluid-inclusion systematics in epithermalsystems In Berger BR Bethke PM (Eds) Geology and Geochemistry of Epithermal Systems Reviews in Economic Geology 2 pp 73ndash97
Boiron MC Cathelineau M Essarraj S Lespinasse M Sellier E 1991 Characterizationof the relationships between deformation 1047298uid migration and Au deposition in
quartz veins methodology and modelling Proceedings Gold 91 AA BalkemaPublishers Brazil pp 637ndash643Boiron MC Moissette A Cathelineau M Banks D Monnin C Dubessy J 1999
Detailed determination of palaeo1047298uid chemistry an integrated study of sulphate-volatile rich brines and aquo-carbonic 1047298uids in quartz veins from Ouro Fino(Brazil) Chem Geol 154 179ndash192
Botros NS 2004 A new classi1047297cation of the gold deposits of Egypt Ore Geol Rev 251ndash37
Bowers TS Helgeson HW 1983 Calculation of the thermodynamic and geochemicalconsequences of nonideal mixing in the system H2OndashCO2ndashNaCl on phase relationsin geological systems equation of state for H 2OndashCO2ndashNaCl 1047298uids at high pressuresand temperatures Geochim Cosmochim Acta 47 1247ndash1275
Boyle RW 1969 Hydrothermal transport and deposition of gold Econ Geol 64112ndash115
Burke EAJ 2001 Raman microspectrometry of 1047298uid inclusions Lithos 55 139ndash158Callaghan T 2001 Geology and host-rock alteration of the Henty and Mount Julia gold
deposits western Tasmania Econ Geol 96 (5) 1073ndash1088Carpenter RH 1954 Geology and ore deposits of the Rosario mining district and San
Juancito Mountains Honduras Central America Geol Soc Am Bull 65 23ndash28
Cepedal A Fuertes-Fuente M Martiacuten-Izard A Garciacutea-Nieto J Boiron MC 2013 Anintrusion-related gold deposit (IRGD) in the NW of Spain the Linares deposit igne-ous rocks veins and related alterations ore features and 1047298uids involved
J Geochem Explor 124 101ndash126Cesare B 1995 Graphite precipitation in CndashOndashH 1047298uid inclusions closed system compo-
sitional and density changes and thermobarometric implications Contrib MineralPetrol 122 25ndash33
Cleverley JS Bastrakov EN 2005 K2GWB Utility for Generating Thermodynamic DataFiles for the GeochemistsWorkbenchregat 0ndash1000 degC and 1ndash5000 bar from UT2K andthe UNITHERM Database
Collins PLF 1979 Gas hydrates in CO2-bearing 1047298uid inclusions and the use of freezingdata for estimation of salinity Econ Geol 74 1435ndash1444
Deksissa DJ Koeberl C 2005 Geochemistry alteration and genesis of gold mineraliza-tion in the Okote area southern Ethiopia Geochem J 38 307ndash331
Diamond LW 2003 Introduction to gas-bearing aqueous 1047298uid inclusions In Samson IAnderson A Marshall D (Eds) Fluid Inclusions Analysis and interpretation Miner-alogical Association of Canada Short Course Series 32 pp 101ndash158
Drever JI 1997 The Geochemistry of Natural Water Prentice-Hall Upper Saddle RiverNew Jersey
Drobe J Cann RM 2000 CundashAu skarn mineralization Minas de Oro District HondurasCentral America Explor Min Geol 9 51ndash63
Duan Z MoslashllerN WeareJK 1992a An equation of state for theCH4ndashCO2ndashH2O systemI Pure systems from 0 to 1000 degC and 0 to 8000 bar Geochim Cosmochim Acta 562605ndash2617
Duan Z MoslashllerN Weare JK 1992b Anequationof statefor the CH4ndashCO2ndashH2O systemII Mixtures from 50 to 1000 degC and 0 to 1000 bar Geochim Cosmochim Acta 562619ndash2631
Esmaeily D Afshooni SZ Mirnejad H Rashidnejad-e-Omran N 2012 Mass changesduring hydrothermal alteration associated with gold mineralization in the Astanehgranitoid rocks western Iran Geochem Explor Environ Anal 12 161ndash175
Gammons GH Williams-Jones AE 1997 Chemical mobility of Gold in the porphyryndash
epithermal environment Econ Geol 92 45ndash59Garofalo P Matthaumli SK Heinrich C 2002 Three dimensional geometry ore
distribution and time-integrated mass transfer through the quartzndashtourma-linendashgold vein network of the Sigma deposit (Abitibi belt mdash Canada) Geo1047298uids2 217ndash232
Garrabos Y Tufeu R Le Neindre B 1980 Rayleigh and Raman scattering near the crit-ical point of carbon dioxide J Chem Phys 72 (8) 4637ndash4651
Groves DI Goldfarb RJ Robert F Hart CJR 2003 Gold deposits in metamorphicbelts overview of current understanding outstanding problems future researchand exploration signi1047297cance Econ Geol 98 1ndash29
Guzman-Speziale M 2001 Active seismic deformation in the grabens of northern Cen-tral America and its relationship to the relative motion of the North AmericandashCarib-bean plate boundary Tectonophysics 337 39ndash51
Hedenquist JF Reyes AG Simmons SF Taguchi S 1992 The thermal and geochemi-cal structure of geothermal and epithermal systems a framework for interpreting1047298uid inclusion data Eur J Mineral 4 989ndash1015
Heinrich CA Driesner TStefaacutensson ASeward TM 2004 Magmatic vapor contractionand the transport of gold from the porphyry environment to epithermal ore deposits
Geology 32 761ndash764Horne G Clark G Pushkar P 1976 Pre-Cretaceous rocks of northwestern Honduras
basement terrane in Sierra de Omoa AAPG Bull 60 566ndash583Huizenga J-M 2005 COH an Excel Spreadsheet for composition calculations in the Cndash
OndashH 1047298uid system Comput Geosci 31 797ndash800Huizenga J-M 2011 Thermodynamic modelling of a cooling CndashOndashH 1047298uid-graphite sys-
tem implications for hydrothermal graphite precipitation Miner Deposita 46 23ndash33KawakamiY YamamotoJ Kagi H2003 Micro-Ramandensimeterfor CO2 inclusionsin
mantle-derived minerals Appl Spectrom 57 (11) 1333ndash1339Kawashima Y Katagiri G 1995 Fundamentals overtones and combinations in the
Raman spectrum of graphite Phys Rev B 52 10053ndash10059Klein EL Koppe JC Moura CAV 2002 Geology and geochemistry of the Caxis gold
deposit and geochronology of thegold-hosting Caxias Microtonalite Sao Luis Cratonnorthern Brazil J S Am Earth Sci 14 837ndash849
Lin F Bodnar RJ Becker SP 2007 Experimentaldetermination of the RamanCH4 sym-metric stretching (ν1) band position from 1ndash650 bar and 03ndash22 degC application to1047298uid inclusion studies Geochim Cosmochim Acta 71 3746ndash3756
Lu W Chou I-M Burruss RC Song Y 2007 An uni1047297ed equation for calculating meth-ane vapor pressures in the CH4ndashH2O system with measured Raman shifts GeochimCosmochim Acta 71 3969ndash3978
Luque FJ Pasteris JD Wopenka B Rodas M Barrenechea JF 1998 Natural 1047298uid-deposited graphite mineralogical characteristics and mechanisms of formationAm J Sci 298 471ndash498
Mann P Burke K 1984 Neotectonics of the Caribbean Rev Geophys 22 309ndash362Mann P Burke K 1988 Cenozoic rift formation in the northern Caribbean Geology 12
732ndash736MatthewsMJ Pimenta MA Dresselhaus GDresselhaus MS Endo M1999 Originof
the dispersive effects of the Raman D band in carbon materials Phys Rev B 59R6585ndashR6588
Mattioli M Menichetti M Renzulli A Toscani L Salvioli-Mariani E Suarez P 2014Genesis of the hydrothermal gold deposits in the Canan area Lepaguare DistrictHonduras Int J Earth Sci 103 901ndash928
Mikucki EJ 1998 Hydrothermal transport and depositional processes in Archean lode-gold systems a review Ore Geol Rev 13 307ndash321
Mills RA Hugh KE Feray DE Swolfs HC 1967 Mesozoic stratigraphy of HondurasAAPG Bull 51 1711ndash1786
Miur TL 2002 The Hemlo gold deposit Ontario Canada principal deposit characteris-
tics and constraints on mineralization Ore Geol Rev 21 1ndash
66Pasteris JD Chou I-M 1998 Fluid-deposited graphitic inclusions in quartz comparisonbetween KTB (German Continental Deep-Drilling) core samples and arti1047297cially re-equilibrated natural inclusions Geochim Cosmochim Acta 62 109ndash122
Perraki M Proyer A Mposkos E Kaindl R Hoinkes G 2006 Raman micro-spectroscopy on diamond graphite and other carbon polymorphs from theultrahigh-pressure metamorphic Kimi Complex of the Rhodope Metamorphic Prov-ince NE Greece Earth Planet Sci Lett 24 672ndash685
Phillips GN Powell R 2009 Formation of gold deposits review and evaluation of thecontinuum model Earth-Sci Rev 94 1ndash12
Pimenta MA Dresselhaus G Dresselhaus MS Canccedilado LG Jorio A Saito R 2007Studying disorder in graphite-based systems by Raman spectroscopy Phys ChemChem Phys 9 1276ndash1291
Pokrovski GS Akin1047297ev NN Borisova AY Zotov AV Kouzmanov K 2014 Gold spe-ciation and transport in geological 1047298uids insights from experiments and physicalndashchemical modelling Geol Soc Lond Spec Publ httpdxdoiorg101144SP4024(Online First)
Ratschbacher L Franz L Min M Bachmenn R Martens U Stanek K Stubner KNelson BK Herrmann U Weber B Loacutepez-Martiacutenez M Jonckheere R Sperner
255E Salvioli-Mariani et al Journal of Geochemical Exploration 158 (2015) 243ndash 256
7172019 Salvioli et al 2015
httpslidepdfcomreaderfullsalvioli-et-al-2015 1414
B Tichomirowa M McWilliams MO Gordon M Meschede M Bock P 2009 TheNorth AmericanndashCaribbean plate boundary in MeacutexicondashGuatemalandashHonduras In
James KH Lorente MA Pindell JL (Eds) The Origin and Evolution of the Caribbe-an Plate Geological Society London Special Publications 328 pp 219ndash293
Ridley JR Diamond LW 2000 Fluid chemistry of orogenic lode-gold deposits and im-plications for genetic models In Hagemann S Brown PE (Eds) Gold in 2000 Re-views in Economic Geology 13 pp 141ndash162
Ridley J Hagemann SG 1999 Interpretation of post-entrapment 1047298uid-inclusion re-equilibration at the Three Mile Hill Marvel Loch and Grif 1047297ns Find high-temperature lode-gold deposits Yilgran Craton Western Australia Chem Geol154 257ndash278
Robb L 2010 Introduction to Ore-forming Processes Blackwell Publishing Malden USARoberts RJ Irving EM 1957 Mineral deposits of Central America U S Geol Surv Bull1034 205
Roedder E 1984 Fluid inclusions Reviews in Mineralogy 12 Mineralogical Society of America Washington DC
Rogers RD Mann P 2007 Transtensional deformation of the western CaribbeanndashNorthAmerica plate boundary zone In Mann P (Ed) Geologic and Tectonic Developmentof the Caribbean Plate in Northern Central America Geological Society of AmericaSpecial Paper 428 pp 37ndash64
Rogers RD Mann P Emmet PA 2007 Tectonic terranes of the Chortis block based onintegration of regional aeromagnetic and geologic data In Mann P (Ed) Geologicand Tectonic Development of the Caribbean Plate in Northern Central America Geo-logical Society of America Special Paper 428 pp 65ndash88
Roine A 2009 HSC Chemistryreg 70 Users Guide ndash Volume frac12 ndash Chemical Reaction andEquilibrium Software With Extensive Thermochemical Database and Flowsheet Sim-ulation Outotec Information Center Finland
Samson IM Williams-Jones A-E Ault KM Gagnon JE 2008 Source of 1047298uids formingdistal ZnndashPbndashAg skarns evidence from laser ablation-inductively coupled plasma-mass spectrometry analysis of 1047298uid inclusions from El Mochito Honduras Geology
36 947ndash950Satish-Kumar M 2005 Graphite-bearing CO2-1047298uid inclusions in granulites insights on
graphite precipitation and carbon isotope evolution Geochim Cosmochim Acta 69(15) 3841ndash3856
Seitz JF Pasteris JD 1990 Theoretical and practical aspect of differential partitioning of gases by clathrate hydrates in 1047298uid inclusions Geochim Cosmochim Acta 54631ndash639
Shvarov YV 2008 HCh new potentialities for the thermodynamic simulation of geo-chemical systems offered by Windows Geochem Int 46 834ndash839
Sibson RH 1987 Earthquake rupturing as a mineralizing agent in hydrothermal sys-tems Geology 15 701ndash704
Silva-Romo G 2008 GuayapendashPapalutla fault system a continuous Cretaceous structurefrom southern Mexicoto theChortis BlockTectonicimplicationsGeology 3675ndash78
Spooner ETC Bray CJ Wood PC Burrows DR Callan NJ 1987 Aundashquartz vein andCundashAundashAgndashMondashanhydrite mineralization HollingerndashMcIntyre Mine Timmins
Ontario δ13C values (McIntyre) Fluid inclusion gas geochemistry pressure (depth)estimation and H2OndashCO2 phase separation as a precipitation and dilation mecha-nism Ont Geol Surv Misc Pap 136 35ndash56
Su W Xi B Xia B Zhang X Hu R 2008 Visible gold in arsenian pyrite at theShuiyindong Carlin-type gold deposit Guizhou China implications for the environ-ment and processes of ore formation Ore Geol Rev 33 667ndash679
Sundblad K Cumming GL Krstic D 1991 Lead isotope evidence for the formation of epithermalgold quartzveins in theChortis BlockNicaragua Econ Geol 86 944ndash959
Tagirov BR Salvi S Schott J Baranova NN 2005 Experimental study of goldndash
hydrosulphide complexing in aqueous solutions at 350ndash500 degC 500 and 1000 barsusing mineral buffers Geochim Cosmochim Acta 69 (8) 2119ndash2132
ThieryR Vanden Kerkhof AM Dubessy J 1994 vX properties of CH4ndash
CO2 and CO2ndash
N21047298uid inclusions modelling for T b 31 degC and P b 400 bars Eur J Mineral 6 753ndash771
Thomsen C Reich S 2000 Double resonant Raman scattering in graphite Phys RevLett 85 5214ndash5217
Van den Kerkhof AM 1988 The System CO2ndashCH4ndashN2 in Fluid Inclusions TheoreticalModelling and Geochemical Applications (PhD Thesis Amsterdam)
Vanden Kerkhof AM OlsenSN 1990 A natural example of superdense CO2 inclusionsmicrothermometry and Raman analysis Geochim Cosmochim Acta 54 895ndash901
Van den Kerkhof AM Thiery R 2001 Carbonic inclusions Lithos 55 49ndash68Vidano RP Ischbach DB Willis LJ Loehr TM 1981 Observation of Raman band
shifting with excitation wavelength for carbons and graphites Solid State Commun39 341ndash344
Wang X Chou I-M Hu W Burruss RC Sun Q Song Y 2011 Raman spectroscopymeasurements of CO2 density experimental calibration with high-pressure opticalcell (HPOC) and fused silica capillary capsule (FSCC) with application to 1047298uid inclu-sion observations Geochim Cosmochim Acta 75 4080ndash4093
Williams-Jones AE Bowell RJ Migdisov AA 2009 Gold in solution Elements 5281ndash287
Williams-Jones AE Samson IM Ault KM Gagnon JE Fryer BJ 2010 The genesis of
distal zinc skarns evidence from the Mochito deposit Honduras Econ Geol 1051411ndash1440
Wopenka B Pasteris JD 1993 Structural characterization of kerogens to granulite-facies graphite applicability of Raman microprobe spectroscopy Am Mineral 78533ndash557
Yang F Mao J Wang Y Bierlein F 2006 Geology and geochemistry of the Bulongquartzndashbarite vein-type gold deposit in the Xinjiang Uygur Autonomous RegionChina Ore Geol Rev 29 52ndash76
Zhang YG Frantz JD 1987 Determination of the homogenization temperatures anddensities of supercritical 1047298uids in the system NaClndashKClndashCaCl2ndashH2O using synthetic1047298uid inclusions Chem Geol 64 335ndash350
256 E Salvioli-Mariani et al Journal of Geochemical Exploration 158 (2015) 243ndash 256
7172019 Salvioli et al 2015
httpslidepdfcomreaderfullsalvioli-et-al-2015 414
3300cmminus1 for methane with a laser excitation wavelength of 6328 nmWater wasdetermined by a laser excitation wavelength of 4731 nm be-tween 2500 and 3400 cmminus1 The acquisition timefor each spectral win-dowwas 120ndash240s with two accumulations The power on the samplesurface was nearly 1 mW
32 Calculation methods
Equilibrium calculations of 1047298uid inclusion physico-chemical con-ditions were performed using COH (version 6ndash08 Huizenga 2005)and HSC chemistry 71 (Roine 2009) COH software calculatesoxygen fugacity by the composition of carbonic 1047298uid (expressed as
molar fraction of CO2) obtained by Raman spectroscopy by the tem-perature and pressure of entrapment of the 1047298uid inclusions HSCsoftware estimates the pH and log f O2 of the mineralising 1047298uid(ldquoequilibrium compositionsrdquo module) Starting from the molar con-centration of the components (in our case H2O CO2 CH4 Na+ Clminus)the GIBBS or SOLGASMIX solvers calculate the values of pH and log f O2 (equilibrium at the speci1047297c isobaricndashisothermal conditions)using the Gibbs free energy minimization method (Roine 2009)
The activityof dissolved species for the AundashSndashCndashClndashH2O system werecalculated using The Geochemists Workbenchreg 7 (GWB) software(Bethke and Yeakel 2008) and data from the UNITHERM thermo-dynamic database version 44 (Shvarov 2008) extracted for tem-perature and pressure conditions estimated from 1047298uid inclusionsusing the K2GWB software (Cleverley and Bastrakov 2005)
4 Results
41 Fluid inclusions
The 1047298uid inclusions investigated in this paper are trapped in quartzcrystals of the mineralising veins of Dos Bocas which is representativeof the entire Canan gold 1047297eld The 1047298uid inclusions are quite abundantand range from a few microns up to 25 μ m in size and can be dividedinto four types on the basis of their composition and textural features(Table 2 Figs 2ndash4)
Type 1 mdash two phases are present at room temperature namely anaqueous liquid and a vapour phase (Fig 2A and B) The vapour to liquidratio is in the range 01ndash02 and the gas bubble often moves at room
temperature The inclusions are irregular to ellipsoidal or have a nega-tive crystal shape varying in size from a few microns to 18 μ m Inmost cases they constitute trails cross-cutting grain boundaries (S in-clusions Fig 2F)
Type 2 mdash this typeconsists of aqueous two-phase inclusions with anH2O-rich liquid and a CO2ndashCH4-bearing 1047298uid at room temperature(Fig 2C D and E) It occurs as an association of L-rich and V-rich inclu-sions which have VL ratios of 02ndash04 and 05ndash07 respectively(Table 2) The bubble comprises a CO2ndashCH4-bearing 1047298uid The carbonic1047298uid (see Sections 42 and 43) is primarily constituted by one phaseliquid and vapour phases rarely occur together Type 2 1047298uid inclusionsare the most abundantTheir morphologyis negative crystalor elongat-ed and irregular Their size varies from 5 to 24μ m Moreover they occurin clusters insidethe quartz crystals or near their boundaries suggesting
Table 1
Principal petrographic features key minerals assemblages and Au grade of the main rock-type units of the Canan ore deposit
Rock type Main petrographic features Key mineral assemblage Au grade
Quartz veins Type (1) Coarse-grained quartzWhite to light grey quartzCockscomb vuggy cavitiesElongated quartz grains
Qz Py Hem Gth Au Ag Low to very low
Type (2) Fine- to medium-grained quartzMilky smoky-grey to clear quartz
Static recrystallization of quartz120deg triple junctions
Qz Py Hem Gth Au Ag Low to very low
Hydrothermally alteredwall-rocks
Proximal zone Clays replace aluminosilicate phases Qz Py Ccp Apy Hem Gth Ilt Dck PrlAlu Dsp Kln
Low to medium
Intermediate zone Fine-grained muscovite replaces aluminosilicatephases
Qz Ms Py Ccp Apy Hem Gth Kln AuAg
High to very high
Distal zone Chlorite replaces biotite and muscovite Chl Qz Ilt Low To MediumUnaltered metamorphic
host-rocksGraphitic schists Very 1047297ne- to medium-grained
Bedding by graphite layeringDynamic recrystallization
Qz Bt Chl Ms Gr Absent
Sericitic schists Very 1047297ne- to medium-grainedLepidoblastic texturesWell-expressed foliation
Fsp Qz Ms Absent
Ag silverAlu alunite Apy arsenopyriteAu gold Bt biotite Ccp chalcopyrite Chlchlorite Dckdickite Dsp diaspore Fspfeldspar Gr graphite Gthgoethite HemhematiteKln kaolinite Iltillite Ms muscovite Prl pyrophyllite Py pyrite Qz quartz
Table 2
Summary of the petrographic features of the studied 1047298uid inclusions
Type A bundance Setting Origin B ubble vol Petrographic features
1 Common Trails S 10ndash20 Aqueous inclusions containing both liquid and vapour phases irregular toellipsoidal and negative crystal shape
2 Very common Clusters isolated trails P PS 25ndash40 L-rich50ndash70 V-rich
Aqueous two-phase inclusions with an H2O-rich liquid containing a CO2ndashCH4-bearing1047298uid negative crystal shape to elongated or irregular
3 Relatively common Clusters trails PS S N80 (carb) CO2ndashCH4-rich inclusions containing liquid plus vapour phases a thin 1047297lm of liquid H2Omay be present
4 Relat ively rare Clusters trails PS S Inclusions containing a dark phase with a lath-shape associated to variable amount of liquid phase
P primary 1047298uid inclusions PS pseudosecondary 1047298uid inclusions S secondary 1047298uid inclusions V vapour phase L liquid phase
246 E Salvioli-Mariani et al Journal of Geochemical Exploration 158 (2015) 243ndash 256
7172019 Salvioli et al 2015
httpslidepdfcomreaderfullsalvioli-et-al-2015 514
growth bands of the quartz crystals (P inclusions) or in trails withinsingle quartz crystals (P or PS inclusions)
Type 3 mdash CO2ndashCH4-rich inclusions that contain liquid and vapourphases comprise this type (Fig 3) The CO2ndashCH4 1047298uid occupies morethan 80 vol of the inclusion Sometimes the inclusion has a smallamount of liquid H2O close to walls or in the acute angles of the cavity
Where notobservedwater most likely forms a thin1047297lm along the inclu-sion walls The inclusion size varies between 4 and 24 μ m They occur inclusters or trails within the quartz crystals (PS and S inclusions)
Type4 mdash this type contains 1047298uidinclusions with an opaque solid anda variable amount of liquid (Fig 4) The opaque solid has a lath shapeand variable size In some inclusions the opaque solid is small (approx-imately 2 μ m about 20ndash30 vol) and surrounded by liquid (Fig 4A B)Rarely it occurs in two-phase inclusions (L + V) where it is in contactwith the bubble the VL ratio is 05ndash07 In most of the inclusions thetrapped opaque solid is anomalously large (70ndash90 vol) compared tothe host inclusions and has a very small amount of liquid on one side(Fig 4C D) They generally occur in clusters and are associated withType 2 and 3 inclusions
Some inclusions are naturally decrepitated and are star-shaped or
surrounded by a halo of tiny inclusions
The quartz crystals do not show growth zone de1047297ned by 1047298uid inclu-sions but some trails of 1047298uid inclusions although discontinuous cansuggest crystal growth According to Bodnar et al (1985) some petro-graphic features of our 1047298uid inclusions can be explained by boiling(i) the association of L-rich and V-rich inclusions (Type 2) where theL-rich inclusions have the liquidvapour ratio apparently variable (bub-
ble 25ndash40 vol) and the V-rich inclusions are a little larger (Fig 2C E)(ii) the occurrence of all V-rich inclusions as planes or trails (Type 3)and (iii) the absence of one-phase liquid inclusions
The relative timing of the 1047298uid inclusions in the quartz crystals isoften unclear because differenttypes of 1047298uidinclusionsare closely asso-ciated and a con1047297dent identi1047297cation of their origin is dif 1047297cult Due to theseveral phases of inclusion entrapment the earlier 1047298uid inclusions maybe modi1047297ed and the hydrothermal orogenic systems appear extremelycomplex Therefore we did a careful selection of the 1047298uid inclusionsfor the microthermometric evaluations
42 Microthermometry
Microthermometricexperiments were performed on more than 250
1047298uid inclusions We have performed the experiments mainly on 1047298uid
Fig 2 Optical microphotographs of Type 1 and 2 1047298uid inclusions (A B) Type 1 S aqueous-rich inclusions very small inclusions in transgranular trails (F) (C D E) Type 2 two-phase in-clusions forming associations of L-rich and V-rich inclusions Bar 10 μ m
247E Salvioli-Mariani et al Journal of Geochemical Exploration 158 (2015) 243ndash 256
7172019 Salvioli et al 2015
httpslidepdfcomreaderfullsalvioli-et-al-2015 614
inclusion assemblages with variable phase ratios (Type 2) These areconsidered the 1047298uid inclusions that have trapped the hydrothermal1047298uids carrying Au The microthermometric data are summarised inTable 3
421 Type 1 inclusions
The prevalent small size of Type 1 inclusions makes the observationof phase transformations during heating dif 1047297cult Approximately 55
inclusions have been measured The 1047297rst phase variation is suggestedby a dotted appearance due to the 1047297rst melting (eutectic temperatureTe) occurring in the range minus234 to minus119 degC The determined temper-aturessuggest theexistence of dissolvedNaCl andorKCl componentsinwater The remaining solid phase always has a clear appearance andmelts primarily from minus 44 to minus15 degC (ice melting temperatureTmice) On the basis of the ice melting temperature the total salin-ity calculated with the software package of Bakker and Brown
Fig 3 Optical microphotographs of Type 3 1047298uid inclusions (A B) Type 3b inclusions showing retrograde condensationduring microthermometric experiments(C D) Type 3c inclusionssuggesting a liquidndashliquid immiscibility Bar 10 μ m
Fig 4 Optical microphotographs of Type 4 1047298uid inclusions containing graphite with different size and variable LV ratios Bar 10 μ m
248 E Salvioli-Mariani et al Journal of Geochemical Exploration 158 (2015) 243ndash 256
7172019 Salvioli et al 2015
httpslidepdfcomreaderfullsalvioli-et-al-2015 714
(2003) and the equation of Zhang and Frantz (1987) is mainly inthe range 22ndash56 wt NaCl equivalent (rarely b 2 or N 56)(Fig 5B)
The total homogenisation temperature (Thtot) to liquid state occurspredominantly in the range 240ndash336 degC (with median and mode at290 degC Table 3 and Fig 5A)
422 Type 2 inclusions
Analyses were performedon more than 170 inclusions According totheir petrographic features L-rich and V-rich inclusions show differentbehaviour during freezing experiments The L-rich inclusions hereafterreferred to as Type 2a have higher freezing temperatures (minus 50 tominus379 degC) whereas the V-rich inclusions hereafter Type 2b have
Table 3
Summary of the microthermometric data of the studied 1047298uid inclusions
Type Te Tmice Tmcla Tmcarb Thcarb Thtot Salinity XCH4
1 minus234 divide minus 119 20
minus44 divide minus 15 34
240 divide 336 (L)[290 290]55
22 divide 56[32 27]
34
2a minus257 divide minus 111 27
minus76 divide minus 1582
56 divide 13482
250 divide 338 (L)[300 280]60
09 divide 48[35 37]82
005 divide 02011
2b minus282 divide minus 1169
minus71 divide minus 129
60 divide 1869
minus649 divide minus 583 23
180 divide 200 (L) 239 divide minus 100 (V) 293 divide 334 (L)299 divide 334 (V)10
1 divide 62 019 divide 0689
3a minus589 divide minus 583 182 divide 189 (V) 022 divide 10 27 3b minus636 divide minus 627 98 divide 125 (V)
3c minus981 divide minus 733 (V) or liquid immiscibilityminus893 divide minus 719
4 minus250 divide minus 197 minus07 divide minus 04 72 minus635
Temperature in degC Te = eutectic temperature Tmice = ice melting temperature Tmcla = clathrate melting temperature Tmcarb = melting temperature of the carbonic phase Thcarb =
homogenisation of the carbonic phase Thtot = total homogenisation temperature (L) = homogenisation to liquid phase (V) = homogenisation to vapour phase Salinity as wt NaClequivalent XCH4 = molar fraction of methane in the carbonic phase determined by Raman spectrometry In square brackets median and mode values respectively in italics number of measurements
Fig 5 Bar diagrams of microthermometric data (A C E) total homogenisation temperature Th tot (B D) total salinity as NaCl equivalent
249E Salvioli-Mariani et al Journal of Geochemical Exploration 158 (2015) 243ndash 256
7172019 Salvioli et al 2015
httpslidepdfcomreaderfullsalvioli-et-al-2015 814
signi1047297cantly lower freezing temperatures (minus90 to minus 121 degC) and thenucleation of a carbonic vapour bubble on cooling occurs also at verylow temperatures
In Type 2a inclusions the 1047297rst melting temperature (Te) primarilyoccurs between minus 253 and minus111 degC (Table 3) values compatiblewith H2OndashNaCl H2OndashKCl and H2OndashNaClndashKCl systems Due to the for-mation of clathrate upon cooling the ice melting temperature has be-come more dif 1047297cult to measure in practice Most Type 2a inclusions
exhibit ice melting temperatures very similar to those obtained fromType 1 inclusions(in therange minus76 to minus15degC Table 3)In a few inclu-sions ofType 2bit was possibleto obtainTe and Tmice (minus282 to minus116and minus 71 to minus 12 degC respectively Table 3)
In Type 2b inclusions a carbonic vapour bubble appears on coolingat two different temperature intervals ie 10 to 16 degC and minus 121 tominus84 degC Melting of the carbonic phase (Tmcarb) occurs mainly fromminus649 to minus 583 degC suggesting CO2 with other non-condensablegases most likely CH4 in variable proportions Due to the small size of the inclusions the detection of the homogenisation of the carbonicphase (as well as the temperature of homogenisation Thcarb) has beenquite dif 1047297cult to obtain Usually homogenisation to the vapour phaseoccurs at temperature Thcarb from minus 239 to minus10 degC (Table 3) andonly in two cases to liquid phase at higher temperature(Thcarb between18 and 20 degC)
In larger inclusions (approximately20 μ m) we were able to measurethe melting temperature of clathrate we employed the method of Collins (1979) using repeated cooling-heating cycles in proximity of the decomposition temperature of clathrate During microthermometricexperiments the clathrate crystals occur as (i) small crystals around thegaseous bubble (ii) colourless crystals in the aqueous phase (making thedetermination of Tmice dif 1047297cult) and (iii) irregular shape and motion of the gaseous bubble The decomposition temperature of clathrates(Tmcla) in the Type 2a inclusions varies mainly from 56 to 134 degC(Table 3) Where detectable Tmcla in Type 2b inclusions is comparableor higher (60ndash186 degC Table 3) At low pressure CH4 clathrate melts attemperatures higher than 15 degC whereas CO2 clathrate melts at lowertemperatures (b10 degC Seitz and Pasteris 1990 Diamond 2003)
The salinity of Type 2 inclusions was calculated using the melting
temperature of clathrates with the software package of Bakker andBrown (2003) and the equations of Duan et al (1992ab) the resultsare comparable with the values obtained for Type 1 inclusions althoughthey extend towards lower values (09ndash48 and 1ndash62 wt NaClequivalent Fig 5D and Table 3) The composition of the carbonic1047298uid is dif 1047297cult to obtain due to the formation of clathrate duringmicrothermometric experiments
Themost frequent values for Thtot (Table 3) are 250ndash338 degC (medianand mode at 300 degC and 280 degC respectively Type 2a Fig 5C) 293ndash334 degC (to liquid phase Type 2b) and 299ndash334 degC (to vapour phaseType 2b Fig 5E)
423 Type 3 inclusions
Only25 inclusions of the Type 3 havebeeninvestigated Most Type 3
inclusions freeze at very low temperatures below minus 85 degC and down tominus136 degC the extremely low water content rarely allows observation of the changes induced by freezing The carbonic phase melts primarily inthe range minus 636 to minus 583 degC (Table 3) similarly to Type 2b inclusionssuggesting a variable proportion of CO2 with other non-condensablegasesmost likely CH4 The melting temperature (Tmcarb) rarely reacheslower values down to minus 699 degC suggesting high contents of CH4 Onlyone determination gave Tmcarb = minus 569 degC
Thehomogenisation of the carbonic phase to vapour phase occurs atdifferenttemperatures (Table 3)(i) 182ndash189 degC forthe inclusions withthe highest Tmcarb (minus589 to minus 583 degC hereafter 3a) and (ii) 98ndash125 degC for the inclusions melting at lower temperatures (minus636 tominus627 degC hereafter 3b Fig 3A B) The homogenisation temperatureto vapour phase of Type 3b inclusions suggests that Tmcarb should be
greater than approximately minus 62 degC (cf Ridley and Hagemann 1999
Thiery et al 1994 Van den Kerkhof and Thiery 2001) This behaviouris the consequence of retrograde condensation (ie the condensationof liquid under isothermal conditions on lowering pressure) which in-creases the temperature of homogenisation (to the gas phase) of the1047298uid inclusions (with a given composition) to values higher than thecritical temperature (Thiery et al 1994 Van den Kerkhof 1988 Vanden Kerkhof and Thiery 2001)
A further subgroup of Type 3 inclusions (hereafter 3c Table 3 and
Fig 3C D) has a varied behaviour at very low temperatures (minus
981to minus733 degC) they apparently homogenise to thevapourphaseand like-ly to another liquid supporting a case of liquidndashliquidndashgas immiscibility(Thiery et al 1994) At room temperature these inclusions have twophases of similar density (Fig 3C D) In some inclusions a meniscusoccurs in the bubble at temperature from minus 893 to minus 719 degC (whichgradually disappears at approximately minus63 to minus 60 degC) and thecarbonic phase appears darker or takes on a bumpy surface
424 Type 4 inclusions
In rare cases it was possible to obtain data during microthermometricexperiments The obtained temperatures (Tmcarb ~ minus 635 degC Te fromminus250 to minus197 degC Tmice from minus07 to minus04 degC and Tmcla 72 degCTable 3) are fully comparable with those of Type 2 and Type 3 inclusions
43 Micro-Raman spectroscopy
To estimate the entrapment conditions we must know both thecomposition and density of the trapped 1047298uid However as statedabove they are dif 1047297cult to obtain for the occurrence of clathrates Toovercome this problem we determinedthe composition of the carbonicphase using micro-Raman spectroscopy
431 CO 2ndashCH 4 1047298uids
For Raman analysis of the carbonic phase we selected approximate-ly 50 inclusions of Type 2 and 3
The Raman spectra of these inclusions are characterised by (i) theRaman active stretchingmodeν1 at 1278ndash1282 cmminus1 and the overtoneof thebending modeν2 (2ν2)at1380ndash1385 cmminus1 typicalof CO2 (Fig6)
and known asthe Fermi diad (Garrabos et al 1980) and(ii) theisolatedC-H stretching band (ν1) of CH4 at 2907ndash2913 cmminus1 (Fig 6 Burke2001) In the spectral area of reduced sulphur species the backgroundsometimes shows a small hump which might be considered as a smallpeak (insetin Fig6C) It occurs atabout 2610cmminus1 suggestingthe pres-ence of a very small amount of H2S associated to the carbonic vapourphase The detection limit is estimated at 1 mol for H2S
According to the literature (Kawakami et al 2003 Van den Kerkhof and Olsen 1990 Wang et al 2011) the changes of frequency in theRaman spectrare1047298ect variations in pressure1047298uid density and tempera-ture The separation between the two bands (Δν) represents a bettermeasure of CO2 density than the peak positions or the ratio of thepeak positions (Kawakami et al 2003 Wang et al 2011) The mea-sured Δν in our 1047298uid inclusions is 1035ndash104 cmminus1 On the basis of
the equation from Wang et al (2011) valid for the entire range of den-sities(with CH4 le 10 mol) the calculatedCO2 density of the investigat-ed 1047298uid inclusions is in the range 034ndash056 gcm3
Similarly the position of the ν1 band is also in1047298uenced by pressureand temperature variations for CH4 Unfortunately we were unable toobtain reliable density values because the equations proposed in the lit-erature have been calibrated using a 51453 nm laser (Lin et al 2007)and are valid for pure or almost pure CH4 (b10 mol of other compo-nents such as CO2) and CH4ndashH2O systems (Lu et al 2007) which areconditions signi1047297cantly different from those of our systems
On the basis of the microthermometric data we infer that the car-bonic components are present in variable proportions and their molefractions have been determined from Raman spectra according toBurke (2001) That study provides a simple formula that considers
CO2 and CH4 peak areas (both CO2 peaks must be considered) CO2
250 E Salvioli-Mariani et al Journal of Geochemical Exploration 158 (2015) 243ndash 256
7172019 Salvioli et al 2015
httpslidepdfcomreaderfullsalvioli-et-al-2015 914
and CH4 Ramanscattering ef 1047297ciencies andCO2 and CH4 instrumental ef-1047297ciencies for the speci1047297c laser wavelength (6328 nm) The CH4 molefraction (XCH4) varies between 005ndash020 in Type 2a 019ndash068 inType 2b and 022ndash10 in Type 3 inclusions (Table 3)
432 Carbonaceous material
Type 4 inclusions are peculiar because they contain a black solidphase with a lath shape and variable proportions of aqueous liquidphase Based on Raman spectra the solid phase is identi1047297ed as graphite25 Raman spectra were acquired for both solid and liquid phases
Raman spectra of the carbonaceous material are very sensitive tochanges in the order degree The1047297rst order bands of the Raman spectraof carbonaceous material are characterised by the G band at approxi-mately 1580 cmminus1 typical of crystalline or ordered graphite the Dband at approximately 1350 cmminus1 and the Dprime band at approximately1620 cmminus1 typical of disordered or defect bearing carbonaceous mate-rial (Aoya et al 2010 Luque et al 1998 Thomsen and Reich 2000Vidano et al 1981) Carbonaceous materials also exhibit a strong
Raman band in the range 2500ndash
2800 cmminus1
which corresponds to the
overtone of the D band This band appears in the second-order Ramanspectra and is called the Gprime band (Pimenta et al 2007) The decreasein the order degree of graphite is also evident by the development of an asymmetry andbandbroadening in the second-order peak and a de-crease in resolution among its constituent bands (Pasteris and Chou1998) If the position of the G band is not affected by the wavelengthof thelaser the Raman frequency of theD band increases with theexci-tation energy (Kawashima and Katagiri 1995 Matthews et al 1999
Vidano et al 1981) Moreover the ratio of the integrated intensity of the D and G bands (IDIG) decreases with increasing laser energyWith our equipment (λ = 6328 nm) the D band is expected at ap-
proximately 1330 cmminus1 The spectra acquired on Type 4 inclusions(Fig 7A B) have frequencies in the range 1332ndash1336 cmminus1 and1578ndash1581 cmminus1 forD and G bands respectivelyThe Dprime bandis alwayspresent as a shoulder on the high-frequency side of the G peak in therange 1613ndash1620 cmminus1 In the region of second-order bands an unre-solved doublet or a large band at approximately 2664ndash2709 cmminus1 oc-curs The D band is broad with low intensity when compared to the Gband and with a very low IDIG ratio (016ndash030) The degree of crystal-linity is represented by the length of ordered crystals along the a
Fig 6 Ramanspectra ofthe carbonicphase inexample Type 2a(A)Type2b (B)andType3 (C) 1047298uid inclusions The intensity scale of the inset is unchanged
Fig 7 Raman spectraof graphite in Type4 1047298uidinclusions (A B) compared with those of
graphite from wall-rock (C)
251E Salvioli-Mariani et al Journal of Geochemical Exploration 158 (2015) 243ndash 256
7172019 Salvioli et al 2015
httpslidepdfcomreaderfullsalvioli-et-al-2015 1014
crystallographic direction designated as L a (Pasteris and Chou 1998)The IDIG ratio and L a are negatively correlated and the most disorderedgraphite is characterised by the highest IDIG and the lowest L a values(Pasteris and Chou 1998) According to the general formula proposedby Pimenta et al (2007) which can be applied to any laser line we ob-tained the crystallite size L a in the range 1300ndash2400 Aring The calculatedparameters and the widths of the D and Gprime bands suggest a fairly gooddegree of graphite crystallinity which is comparable to that of naturally
or laboratory-produced graphite (Luque et al 1998 Pasteris and Chou1998 Perraki et al 2006 Satish-Kumar 2005 Wopenka and Pasteris1993) The Raman spectra of trapped graphite are all similar ( Fig 7AB) suggesting that the precipitation of graphite occurred from the hy-drothermal 1047298uid
The liquid portion associated with trapped graphite contains CO2CH4 and liquid H2O The typical peaks of CO2 (1280ndash1281 and1383ndash1384 cmminus1) and of CH4 (2910ndash2913 cmminus1) were observedusing the 6328 nm laser (Fig 8A) Moreover the peak for liquid H2Oat 3250ndash3252 cmminus1 was detected with the 4731 nm laser (Fig 8B)
Because of thepresenceof graphite in thehost rocks (quartz-sericiticand graphitic schists) for comparison we acquired 6 Raman spectra onthis carbonaceous materials They are completely different from thoseobtained for the graphite in the 1047298uid inclusions (Fig 7C) The D band(1329ndash1334 cmminus1) has a higherintensitythan that ofgraphitein thein-clusions and sometimes reaches the same intensity as the G band at1580ndash1583 cmminus1 Therefore the IDIG ratios are higher (095ndash208)and L a is lower (200ndash400 Aring) supporting the presence of fairly disor-dered graphite The shape of the spectra and the calculated parametersof graphite from the host rock of Canan are comparable to those of thegraphite from metapelites of chlorite facies (Luque et al 1998Wopenka and Pasteris 1993)
5 Discussion
Four types of 1047298uid inclusions have been found in the quartz crystalsfrom the mineralising veins of Dos Bocas a representative example of
gold deposit at Canan Some 1047298uidinclusions are along fractures crossingone or more crystals (Type 1 S inclusions)The most important1047298uid in-clusions constitute discontinuous trails which can suggest crystalgrowth zones (Type 2) The 1047298uid inclusion associations formed by L-richand V-richinclusions (Type 2 P andPS inclusions) andthe presenceof trails entirely constituted by V-rich inclusions(Type 3 PS andS inclu-sions) suggest that the hydrothermal 1047298uid suffered 1047298uid immiscibility(boiling) The trapped 1047298uid consists of an aqueous solution (H2Ondash
NaClndash
KCl with 09ndash
48 wt NaCl equivalent) plus a CO2ndash
CH4 1047298
uid(80ndash90 mol CO2) As shown by Bowers and Helgeson (1983) a pres-sure drop moves the H2O-carbonic phase solvus towards higher tem-perature which causes a decrease of carbonic gas solubility and theexsolution of CO2 (and CH4) gas from the water-rich 1047298uid according tothe Henrys law In geological environments such as Canan where thetectonics aredominatedby strikendashslip fault systems thefracture forma-tion after deformation causes a rapid and immediate reduction in pres-sure The occurrence of some inclusions naturally decrepitated can beexplained by pressure drop The presence of Type 3b 1047298uid inclusionswhich exhibit retrograde condensation further supports the occurrenceof such a pressure drop
Because of 1047298uid immiscibility the total homogenisation temperaturecan be considered as the trapping temperature Isochores have been re-constructed for Type 2 1047298uid inclusions combining the results frommicrothermometry and Raman analyses using the software package of Bakker and Brown (2003) and the equations of Bakker (1999) andDuan et al (1992b) Trapping pressures of 05ndash14 kbar were obtainedThe coexistence of different types of 1047298uid inclusions and their similarvalues of Th suggest that they can be related to the same hydrothermalprocess which wasresponsiblefor the gold mineralisation at CananThedifferentamounts of water andcarbonic1047298uids inthe inclusions is due tothe 1047298uid immiscibility where the H2O-rich 1047298uid is in Type 2a inclusionsand the CO2ndashCH4-rich 1047298uid in Types 2b and 3 inclusions Finally Type 4inclusions would represent the inclusions (both Type 2 and 3) wherethe conditions for graphite precipitation have been achieved
The graphite of the1047298uid inclusions (Type 4) is similar to that precip-itated from hydrothermal1047298uids This indicates that graphite depositionoccurred before or contemporaneously of the entrapment of the 1047298uid
The degree of crystallinity of graphite in the 1047298uid inclusions is higherthan that observed in the graphite from the host quartz-sericitic andgraphitic schists (Fig 7) Nonetheless this does not exclude the pres-ence of a metamorphic component in the mineralising 1047298uids
Equilibrium of graphite in the hydrothermal1047298uid allows the evalua-tion of oxygen fugacity The calculated atomic ratio XO [O(O + H)] isinthe range 032ndash041 (Fig 9) which is typical of slightly reduced 1047298uids(Cesare 1995 Huizenga 2011) Considering temperatures of 300 degCand pressures of 14 10 and 05 kbar (Tt and Pt respectively) graphitesaturation conditions (aC = 1) and the composition of the carbonicphase as inferred by Raman spectroscopy the calculated f O2 is aboutminus342 log unit (ie about 16 log unit above theQFM buffer) This resultis consistent with that obtained using the HSC chemistry software log f O2 asymp minus376 plusmn 25 which permitted us to calculate also the activity
of dissolved hydrogen ions at equilibrium condition between the con-stituents H2OCO2 CH4 Na+ andClminuspH=29plusmn04Itcanbeobservedthat our estimated pH value is low but this range of acidity is not un-common in1047298uid inclusions (egBenison 2013) including gold deposits(Boiron et al 1999 Pokrovski et al 2014)
According to Roedder (1984)thepHin 1047298uid inclusions can be calcu-lated or determined In the latter case the opening of the 1047298uid inclu-sions implies the loss of the trapped gases It follows that the pH isdetermined on a 1047298uid other than the original and which has undergonebasi1047297cation due to the loss of gas
The composition of Type 2 inclusions plotted in the ternary diagramCOH falls within the stability 1047297eld of graphite (towards the CO2 vertexFig 9) and the 1047298uid associated with graphite in Type 4 inclusions isalso constituted by H2OndashCO2ndashCH4 These features support precipitation
of graphite by the reaction CH4 + CO2rarr
2 C + 2 H2O The decrease of
Fig 8 Raman spectraof the1047298uid portion of Type 4 1047298uid inclusions (A)CO2 and CH4 have
been obtained by 6328 nm laser (B) H2O by 4731 nm laser
252 E Salvioli-Mariani et al Journal of Geochemical Exploration 158 (2015) 243ndash 256
7172019 Salvioli et al 2015
httpslidepdfcomreaderfullsalvioli-et-al-2015 1114
temperature andor the increase of pressure move the reaction towardsthe products In our case a combination of cooling and decompressionacted on the system so that the variation of temperature and pressurecannot be responsible for the precipitation of graphite According toHuizenga (2011) the precipitation of graphite is in1047298uenced by XO
value and oxygen fugacity the best conditions for precipitation areXO = 033 and QFM-2 b log f O2 b QFM + 1 Small variations from
these values prevent the precipitation or cause consumption of earlyprecipitated graphite XO values and f O2 of our Type 2 1047298uid inclusions(see above) agree with the Huizenga (2011) data and indicate thatsome 1047298uid inclusions were able to precipitate graphite
The H2S content and the oxygen fugacity of the hydrothermal 1047298uidsaffect the solubility of gold In H 2S-rich 1047298uids Au(HS)2
minus andAu(HS)deg are the dominant Au-complexes and gold has high solubil-ity (Au N 100 ppb) whereas in H2S-poor 1047298uids the gold solubilitydecreases and AuCl2
minus is the dominant stable complex (Gammonsand Williams-Jones 1997) When the partial pressure of H 2S is1047297xed by the magnetitendashpyrite pair the Au bisulphide complex isstable at T b 450 degC and the chloride complex at higher temperature(Mikucki 1998) At high oxygen fugacity H2S is oxidised and thusthe mobility of gold as bisulphide decreases considerably ( Gammons
and Williams-Jones 1997) Experimental studies at temperatures of 350ndash500 degC and pressures of 05ndash1 kbar have shown that Au(HS)2
minus isthe dominant Au complex in near neutral to weakly acidic solutions inthe presence of the K-feldsparndashmuscovitendashquartz mineral associationand at pyritendashpyrrhotitendashmagnetite buffer conditions (Tagirov et al2005)
Many of the conditions employed in the experiments mentionedabove match those of the Canan ore deposit 1047298uid inclusions indicatethe presence of low salinity and low temperature (T b 400 degC) hydro-thermal 1047298uids and XRD data (Mattioli et al 2014) show that the wall-rocks contain the K-feldsparndashmuscovitendashquartzndashpyritendashpyrrothitendashmagnetite association (Table 1) However the hydrothermal 1047298uids atCanan seem to be extremely acidic (pH = 29) which makes Au(HS)degmore stable than Au(HS)2
minus and themost abundant complex in thesolu-
tions (cf also Heinrich et al 2004 Pokrovski et al 2014) Hence we
infer that the gold of Canan was transported by hydrothermal 1047298uids asAu(HS)deg complex
Activity diagrams are a powerful graphical tool for depicting the sta-bility of dissolved species and solid and gas phases with respect to thecomposition of the coexisting solution Calculations on Au speciationwere performed under the mean conditions estimated by the analysisof the 1047298uid inclusions and the results plotted in log f O2-pH diagrams(Fig 10) The decrease in solubility of the Aundashsulphide complexes can
be ascribed both to the fracturation-induced pressure drop andthe con-centration of sulphur in solution According to Mattioli et al (2014) thegold deposit of Canan was formed by the hydrothermal 1047298uid activityalong fractures produced by tectonics Opening and lateral expansionof the fractures produce a pressure drop on the 1047298uids themselves andboiling of the dissolved gases The 1047298uid composition affects the depthof boiling which is an ef 1047297cient mechanism for gold precipitation(Hedenquist et al 1992 Pokrovski et al 2014 Robb 2010 Sibson1987) Boiling produced the exsolution of H2S which in turn caused adecrease in the solubility of theAundashsulphide complexes and the precip-itation of gold (Fig 10) In the case of the Canan deposit boiling repre-sents only the initial phase of gold deposition In fact the main bodyof thegoldmineof Canan is located in metamorphic rocks cutby quartzveins where hydrothermal 1047298uids altered the primary mineralogy andchanged their composition and ability to carry gold in solution In theore deposit Au coexists with sulphides and in particular small grainsof pure gold are surrounded by pyriteand other sulphides This suggeststhat gold was deposited by reactions involving 1047298uids containing Au-Scomplexes and the wall-rock containing chalcophile elements particu-larly Fe a process known as ldquosulphidationrdquo (Williams-Jones et al 2009and references therein Robb 2010) At Canan Fe is abundant in freshwall-rocksfor thepresence of biotiteand chloriteThese minerals disap-pear in the vicinity of quartz veins of the ore deposit where the highestconcentration of gold and sulphides are observed (Mattioli et al 2014)During the alteration of biotite and chlorite Fe is released into the hy-drothermal 1047298uids and likely produces the following reaction with theAundashsulphide complexes
AuethHSTHORN∘ethaqTHORN thorn 05Fe2thornharr05FeS2ethPyriteTHORN thorn H
thorn thorn Au∘ethGoldTHORN eth1THORN
Under equilibrium conditions and assumingP = 1400barT = 300 degCand the water activity H2O = 1 the resulting log K is 53151 (ΔGdeg-R = minus 5833 kJ molminus1) The high value of the equilibrium constant Kand the highly negative value of ΔGdegR indicate that the reaction has aspontaneous tendency towards the products According to Robb (2010)these reactions occur in dynamic systems where kinetics predominatesover equilibrium conditions Therefore it is very unlikely that reaction(1) occurs under equilibrium conditions in an open natural system Be-cause of the continuous supply of Au(HS)deg from the hydrothermal 1047298uidsand Fe2+ from the alteration of biotite and chlorite (within the zones of 1047298uid-rock interaction) reaction (1) is imbalanced and pushed towardsthe products by favouring the deposition of gold and sulphides This isin agreement with Pokrovski et al (2014) who state that the interactionof sulphur-rich hydrothermal 1047298uids and Fe2+-rich wall rocks(sulphidation) is one of the main processes leading to the precipitationof gold
Additionally the activity of sulphur in the 1047298uids is responsible forthe solubilisation and transport of gold At Canan the activity of Sought to be at least 10minus2 Above this value the composition of hydro-thermal 1047298uid plots in the stability 1047297eld of Au(HS)deg (Fig 10) Withlower concentrations of S (and lower pressure) the transportof gold oc-curs as chloride (Fig 10L M and N) If iron is no longer available aftercomplete alteration of biotite and chlorite the deposition of goldcould be represented by the reaction
AuethHSTHORN∘ethaqTHORN thorn 05H2ethgTHORNharrH2SethgTHORN thorn Au∘ethGoldTHORN eth2THORN
where log K = 69130 (ΔGdegR = minus 7586 kJ molminus1) at T = 300 degC and
P = 1400 bar indicates once again a spontaneous tendency towards
Fig 9 Ternary CndashOndashH diagramshowing thecarbon saturatedsurface (solid line) at 300degCand1400 barcalculated by Perple_Xsoftware(J Connollywwwperplexethzch) Dashedlines represent the compositional triangle H2OndashCO2ndashCH4 dotted 1047297eld Type 2a inclusionsstriped 1047297eld Type 2b inclusions Lines of constant XO 035 and 040 (dot-dashed lines) arealso shownTheopencircles andthenumbers initalics indicate f O2
1047298uid relative toQFM buff-er in log10 units (log f O2
1047298uidndashlog f O2
QFM) for 1047298uids in equilibrium with graphite
253E Salvioli-Mariani et al Journal of Geochemical Exploration 158 (2015) 243ndash 256
7172019 Salvioli et al 2015
httpslidepdfcomreaderfullsalvioli-et-al-2015 1214
theproducts andthe presence of H2 agrees with the reducing conditions(log f O2 asymp minus376) found in the hydrothermal 1047298uids of Canan Reaction(2) would be effective during boiling andor decompression (cf Boyle1969 Pokrovski et al 2014) Similarly to reaction (1) the dynamicsystem conditions (the continuous supply of Au(HS)deg and loss of H2S)favour the kinetic of the reaction (2) and con1047297rm the statements of Robb (2010) and Sibson (1987) on the ef 1047297ciency of this process forgold deposition Finally the kinetics of reaction (1) is further increasedby the alteration of feldspar and muscovite in kaolinite and diaspore (cfMattioli et al 2014) The mineral alterations subtract H+ from the solu-
tion (Drever 1997) favouring the precipitation of Au
6 Concluding remarks
The quartz veins associated with gold mineralisations from DosBocas (Canan area Lepaguare District east-central Honduras) are richin 1047298uid inclusions of four main types Type 1 mdash S two-phaseaqueous-rich inclusions Type 2 mdash P to PS aqueous-rich inclusionswith an H2O-rich liquid and a CO2ndashCH4-bearing liquid Type 3 mdash PSto S CO2ndashCH4-rich inclusions with a very small amount of waterand Type 4 mdash graphite-bearing aqueousndashcarbonic 1047298uid
The association of L-rich and V-rich inclusions (Type 2) and the oc-currence of trails containing only V-rich inclusions (Type 3) support a
1047298uid immiscibility (boiling)of the hydrothermal1047298uidThe hydrothermal
trapped 1047298uid is constituted by H2O + alkali chloride + CO2 plusmn CH4 Thecalculated salinity varies from 09 to 48 wt NaCl equivalent
The immiscibility of 1047298uids can be related to a pressure decrease dueto both the opening of fractures and upward 1047298ow of 1047298uids At Canan astrikendashslip fault systemis responsible for the fracturing of the metamor-phic wall-rocks Thisgeological setting with the mineralogicalpetrolog-ical and geochemical features supports an orogenic character of theinvestigated gold deposits
In some 1047298uid inclusions the occurrence of graphite with typical fea-tures of graphite precipitated from hydrothermal 1047298uids suggests that
the deposition of graphite was prior or concomitant with the entrap-ment of the 1047298uid Moreover the occurrence of graphite associated towater andcarbonic1047298uidssupports the presence of a metamorphic com-ponent in the mineralising 1047298uid
Microthermometric and spectroscopic data from 1047298uid inclusionssuggest that the gold mineralisations at Canan formed at T = 300 degCunderP=500ndash1400 barsThecalculated oxygenfugacityand pH valuesof the hydrothermal 1047298uids are approximately minus 376 plusmn 25 log unit(1 log unit above the QFM buffer) and 29 plusmn 04 respectively
The hydrothermal 1047298uids contained sulphur (activity of S ge 10minus2)assuggested by the association of gold with sulphides including pyriteand chalcopyrite For the above chemical and physical conditions themost abundant sulphur specie carrying gold in solution is the Au(HS)degcomplex Several causes are responsible for the precipitation of gold in
the Canan area 1 mdash boiling following the pressure drop caused by
Fig 10 Activity diagrams for the system AundashCndashClndashSndashH2O at 300 degC Au and H2O activity 10minus7 (~10 ppb) and 100 respectively Cl 10minus098 and C buffered by graphite (see ldquoCalculationmethodsrdquo) Variable values of pressure are considered 1400 bar (A B C and D) 1000 bar (E F G and H) 500 bar (I L M and N) Activities of total dissolved S are 10minus1 (A E and I)10minus2 (B F and L) 10minus3 (C G and M) and buffered by pyrite (D H and N) Green 1047297eld represents the mean composition of the 1047298uid inclusions (pH = 29 plusmn 04 log f O2 = minus 376 plusmn25) Red lines limit the 1047297elds of Au species dashed black lines the S species and dashed blue lines the carbon species The thickness of the red lines corresponds to an uncertainty of log [Au] = plusmn01 or log [H2O] = plusmn02
254 E Salvioli-Mariani et al Journal of Geochemical Exploration 158 (2015) 243ndash 256
7172019 Salvioli et al 2015
httpslidepdfcomreaderfullsalvioli-et-al-2015 1314
tectonic andor hydrothermal 1047298uids activity 2 mdash sulphidation triggeredby the liberation of metal cations during the alteration of ma1047297c min-erals of the wall-rocks 3 mdash hydrothermal alteration of feldspars andphyllosilicates of the wall-rocks
Acknowledgements
The authors wish to thank M Menichetti for providing samples of
the quartz veins and the Goldlake Group for the permission to publishthe results of this study Special thanks are due to John Ridley for theuseful and encouraging suggestions which have noticeably improvedthequality of this paperSincere thanksare dueto BJStacey forimprov-ing the English
References
Alvarez-Gogravemez JA Meijer PT Martigravenez-Digraveaz JJ Capote R2008 Constraintsfrom1047297nite element modeling on the active tectonics of northern Central America andthe Middle America Trench Tectonics 27 TC1008 httpdxdoiorg1010292007TC002162
Andrada de Palomera P van Ruitenbeek FJA van der Meer FK Fernaacutendez R 2012Geochemical indicators of gold-rich zones in the La Jose1047297na epithermal depositDeseado Massif Argentina Ore Geol Rev 45 61ndash80
Aoya M Kouketsu Y Endo S Shimizu H Mizukami T Nakamura D Wallis S 2010Extending the applicability of the Raman carbonaceous-material geothermometer
using data from contact metamorphic rocks J Metamorph Geol 28 895ndash914Bakker RJ 1999 Adaptation of the Bowers and Helgeson (1983) equation of state to the
H2OndashCO2ndashCH4ndashN2ndashNaCl system Chem Geol 154 225ndash236Bakker RJ Brown PE 2003 Computer modelling in 1047298uid inclusion research In
Samson I Anderson A Marshall D (Eds) Fluid Inclusions Analysis and interpreta-tion Mineralogical Association of Canada Short Course Series 32 pp 175ndash212
Benison KC 2013 Acid saline 1047298uid inclusions examples from modern and Permianextreme lake systems Geo1047298uids 13 579ndash593
Bersani D Salvioli-Mariani E Mattioli M Menichetti M Lottici PP 2009 Raman andmicro-thermometric investigation of the 1047298uid inclusions in quartz in a gold-richformation from Lepaguare mining district Spectrochim Acta A 73 443ndash449
Bethke CM Yeakel S 2008 The Geochemists Workbenchreg mdash Release 7 GWB Essen-tials Guide mdash Hydrogeology Program University of Illinois (100 pp)
Bodnar RJ Reynolds TJ Kuehn CA 1985 Fluid-inclusion systematics in epithermalsystems In Berger BR Bethke PM (Eds) Geology and Geochemistry of Epithermal Systems Reviews in Economic Geology 2 pp 73ndash97
Boiron MC Cathelineau M Essarraj S Lespinasse M Sellier E 1991 Characterizationof the relationships between deformation 1047298uid migration and Au deposition in
quartz veins methodology and modelling Proceedings Gold 91 AA BalkemaPublishers Brazil pp 637ndash643Boiron MC Moissette A Cathelineau M Banks D Monnin C Dubessy J 1999
Detailed determination of palaeo1047298uid chemistry an integrated study of sulphate-volatile rich brines and aquo-carbonic 1047298uids in quartz veins from Ouro Fino(Brazil) Chem Geol 154 179ndash192
Botros NS 2004 A new classi1047297cation of the gold deposits of Egypt Ore Geol Rev 251ndash37
Bowers TS Helgeson HW 1983 Calculation of the thermodynamic and geochemicalconsequences of nonideal mixing in the system H2OndashCO2ndashNaCl on phase relationsin geological systems equation of state for H 2OndashCO2ndashNaCl 1047298uids at high pressuresand temperatures Geochim Cosmochim Acta 47 1247ndash1275
Boyle RW 1969 Hydrothermal transport and deposition of gold Econ Geol 64112ndash115
Burke EAJ 2001 Raman microspectrometry of 1047298uid inclusions Lithos 55 139ndash158Callaghan T 2001 Geology and host-rock alteration of the Henty and Mount Julia gold
deposits western Tasmania Econ Geol 96 (5) 1073ndash1088Carpenter RH 1954 Geology and ore deposits of the Rosario mining district and San
Juancito Mountains Honduras Central America Geol Soc Am Bull 65 23ndash28
Cepedal A Fuertes-Fuente M Martiacuten-Izard A Garciacutea-Nieto J Boiron MC 2013 Anintrusion-related gold deposit (IRGD) in the NW of Spain the Linares deposit igne-ous rocks veins and related alterations ore features and 1047298uids involved
J Geochem Explor 124 101ndash126Cesare B 1995 Graphite precipitation in CndashOndashH 1047298uid inclusions closed system compo-
sitional and density changes and thermobarometric implications Contrib MineralPetrol 122 25ndash33
Cleverley JS Bastrakov EN 2005 K2GWB Utility for Generating Thermodynamic DataFiles for the GeochemistsWorkbenchregat 0ndash1000 degC and 1ndash5000 bar from UT2K andthe UNITHERM Database
Collins PLF 1979 Gas hydrates in CO2-bearing 1047298uid inclusions and the use of freezingdata for estimation of salinity Econ Geol 74 1435ndash1444
Deksissa DJ Koeberl C 2005 Geochemistry alteration and genesis of gold mineraliza-tion in the Okote area southern Ethiopia Geochem J 38 307ndash331
Diamond LW 2003 Introduction to gas-bearing aqueous 1047298uid inclusions In Samson IAnderson A Marshall D (Eds) Fluid Inclusions Analysis and interpretation Miner-alogical Association of Canada Short Course Series 32 pp 101ndash158
Drever JI 1997 The Geochemistry of Natural Water Prentice-Hall Upper Saddle RiverNew Jersey
Drobe J Cann RM 2000 CundashAu skarn mineralization Minas de Oro District HondurasCentral America Explor Min Geol 9 51ndash63
Duan Z MoslashllerN WeareJK 1992a An equation of state for theCH4ndashCO2ndashH2O systemI Pure systems from 0 to 1000 degC and 0 to 8000 bar Geochim Cosmochim Acta 562605ndash2617
Duan Z MoslashllerN Weare JK 1992b Anequationof statefor the CH4ndashCO2ndashH2O systemII Mixtures from 50 to 1000 degC and 0 to 1000 bar Geochim Cosmochim Acta 562619ndash2631
Esmaeily D Afshooni SZ Mirnejad H Rashidnejad-e-Omran N 2012 Mass changesduring hydrothermal alteration associated with gold mineralization in the Astanehgranitoid rocks western Iran Geochem Explor Environ Anal 12 161ndash175
Gammons GH Williams-Jones AE 1997 Chemical mobility of Gold in the porphyryndash
epithermal environment Econ Geol 92 45ndash59Garofalo P Matthaumli SK Heinrich C 2002 Three dimensional geometry ore
distribution and time-integrated mass transfer through the quartzndashtourma-linendashgold vein network of the Sigma deposit (Abitibi belt mdash Canada) Geo1047298uids2 217ndash232
Garrabos Y Tufeu R Le Neindre B 1980 Rayleigh and Raman scattering near the crit-ical point of carbon dioxide J Chem Phys 72 (8) 4637ndash4651
Groves DI Goldfarb RJ Robert F Hart CJR 2003 Gold deposits in metamorphicbelts overview of current understanding outstanding problems future researchand exploration signi1047297cance Econ Geol 98 1ndash29
Guzman-Speziale M 2001 Active seismic deformation in the grabens of northern Cen-tral America and its relationship to the relative motion of the North AmericandashCarib-bean plate boundary Tectonophysics 337 39ndash51
Hedenquist JF Reyes AG Simmons SF Taguchi S 1992 The thermal and geochemi-cal structure of geothermal and epithermal systems a framework for interpreting1047298uid inclusion data Eur J Mineral 4 989ndash1015
Heinrich CA Driesner TStefaacutensson ASeward TM 2004 Magmatic vapor contractionand the transport of gold from the porphyry environment to epithermal ore deposits
Geology 32 761ndash764Horne G Clark G Pushkar P 1976 Pre-Cretaceous rocks of northwestern Honduras
basement terrane in Sierra de Omoa AAPG Bull 60 566ndash583Huizenga J-M 2005 COH an Excel Spreadsheet for composition calculations in the Cndash
OndashH 1047298uid system Comput Geosci 31 797ndash800Huizenga J-M 2011 Thermodynamic modelling of a cooling CndashOndashH 1047298uid-graphite sys-
tem implications for hydrothermal graphite precipitation Miner Deposita 46 23ndash33KawakamiY YamamotoJ Kagi H2003 Micro-Ramandensimeterfor CO2 inclusionsin
mantle-derived minerals Appl Spectrom 57 (11) 1333ndash1339Kawashima Y Katagiri G 1995 Fundamentals overtones and combinations in the
Raman spectrum of graphite Phys Rev B 52 10053ndash10059Klein EL Koppe JC Moura CAV 2002 Geology and geochemistry of the Caxis gold
deposit and geochronology of thegold-hosting Caxias Microtonalite Sao Luis Cratonnorthern Brazil J S Am Earth Sci 14 837ndash849
Lin F Bodnar RJ Becker SP 2007 Experimentaldetermination of the RamanCH4 sym-metric stretching (ν1) band position from 1ndash650 bar and 03ndash22 degC application to1047298uid inclusion studies Geochim Cosmochim Acta 71 3746ndash3756
Lu W Chou I-M Burruss RC Song Y 2007 An uni1047297ed equation for calculating meth-ane vapor pressures in the CH4ndashH2O system with measured Raman shifts GeochimCosmochim Acta 71 3969ndash3978
Luque FJ Pasteris JD Wopenka B Rodas M Barrenechea JF 1998 Natural 1047298uid-deposited graphite mineralogical characteristics and mechanisms of formationAm J Sci 298 471ndash498
Mann P Burke K 1984 Neotectonics of the Caribbean Rev Geophys 22 309ndash362Mann P Burke K 1988 Cenozoic rift formation in the northern Caribbean Geology 12
732ndash736MatthewsMJ Pimenta MA Dresselhaus GDresselhaus MS Endo M1999 Originof
the dispersive effects of the Raman D band in carbon materials Phys Rev B 59R6585ndashR6588
Mattioli M Menichetti M Renzulli A Toscani L Salvioli-Mariani E Suarez P 2014Genesis of the hydrothermal gold deposits in the Canan area Lepaguare DistrictHonduras Int J Earth Sci 103 901ndash928
Mikucki EJ 1998 Hydrothermal transport and depositional processes in Archean lode-gold systems a review Ore Geol Rev 13 307ndash321
Mills RA Hugh KE Feray DE Swolfs HC 1967 Mesozoic stratigraphy of HondurasAAPG Bull 51 1711ndash1786
Miur TL 2002 The Hemlo gold deposit Ontario Canada principal deposit characteris-
tics and constraints on mineralization Ore Geol Rev 21 1ndash
66Pasteris JD Chou I-M 1998 Fluid-deposited graphitic inclusions in quartz comparisonbetween KTB (German Continental Deep-Drilling) core samples and arti1047297cially re-equilibrated natural inclusions Geochim Cosmochim Acta 62 109ndash122
Perraki M Proyer A Mposkos E Kaindl R Hoinkes G 2006 Raman micro-spectroscopy on diamond graphite and other carbon polymorphs from theultrahigh-pressure metamorphic Kimi Complex of the Rhodope Metamorphic Prov-ince NE Greece Earth Planet Sci Lett 24 672ndash685
Phillips GN Powell R 2009 Formation of gold deposits review and evaluation of thecontinuum model Earth-Sci Rev 94 1ndash12
Pimenta MA Dresselhaus G Dresselhaus MS Canccedilado LG Jorio A Saito R 2007Studying disorder in graphite-based systems by Raman spectroscopy Phys ChemChem Phys 9 1276ndash1291
Pokrovski GS Akin1047297ev NN Borisova AY Zotov AV Kouzmanov K 2014 Gold spe-ciation and transport in geological 1047298uids insights from experiments and physicalndashchemical modelling Geol Soc Lond Spec Publ httpdxdoiorg101144SP4024(Online First)
Ratschbacher L Franz L Min M Bachmenn R Martens U Stanek K Stubner KNelson BK Herrmann U Weber B Loacutepez-Martiacutenez M Jonckheere R Sperner
255E Salvioli-Mariani et al Journal of Geochemical Exploration 158 (2015) 243ndash 256
7172019 Salvioli et al 2015
httpslidepdfcomreaderfullsalvioli-et-al-2015 1414
B Tichomirowa M McWilliams MO Gordon M Meschede M Bock P 2009 TheNorth AmericanndashCaribbean plate boundary in MeacutexicondashGuatemalandashHonduras In
James KH Lorente MA Pindell JL (Eds) The Origin and Evolution of the Caribbe-an Plate Geological Society London Special Publications 328 pp 219ndash293
Ridley JR Diamond LW 2000 Fluid chemistry of orogenic lode-gold deposits and im-plications for genetic models In Hagemann S Brown PE (Eds) Gold in 2000 Re-views in Economic Geology 13 pp 141ndash162
Ridley J Hagemann SG 1999 Interpretation of post-entrapment 1047298uid-inclusion re-equilibration at the Three Mile Hill Marvel Loch and Grif 1047297ns Find high-temperature lode-gold deposits Yilgran Craton Western Australia Chem Geol154 257ndash278
Robb L 2010 Introduction to Ore-forming Processes Blackwell Publishing Malden USARoberts RJ Irving EM 1957 Mineral deposits of Central America U S Geol Surv Bull1034 205
Roedder E 1984 Fluid inclusions Reviews in Mineralogy 12 Mineralogical Society of America Washington DC
Rogers RD Mann P 2007 Transtensional deformation of the western CaribbeanndashNorthAmerica plate boundary zone In Mann P (Ed) Geologic and Tectonic Developmentof the Caribbean Plate in Northern Central America Geological Society of AmericaSpecial Paper 428 pp 37ndash64
Rogers RD Mann P Emmet PA 2007 Tectonic terranes of the Chortis block based onintegration of regional aeromagnetic and geologic data In Mann P (Ed) Geologicand Tectonic Development of the Caribbean Plate in Northern Central America Geo-logical Society of America Special Paper 428 pp 65ndash88
Roine A 2009 HSC Chemistryreg 70 Users Guide ndash Volume frac12 ndash Chemical Reaction andEquilibrium Software With Extensive Thermochemical Database and Flowsheet Sim-ulation Outotec Information Center Finland
Samson IM Williams-Jones A-E Ault KM Gagnon JE 2008 Source of 1047298uids formingdistal ZnndashPbndashAg skarns evidence from laser ablation-inductively coupled plasma-mass spectrometry analysis of 1047298uid inclusions from El Mochito Honduras Geology
36 947ndash950Satish-Kumar M 2005 Graphite-bearing CO2-1047298uid inclusions in granulites insights on
graphite precipitation and carbon isotope evolution Geochim Cosmochim Acta 69(15) 3841ndash3856
Seitz JF Pasteris JD 1990 Theoretical and practical aspect of differential partitioning of gases by clathrate hydrates in 1047298uid inclusions Geochim Cosmochim Acta 54631ndash639
Shvarov YV 2008 HCh new potentialities for the thermodynamic simulation of geo-chemical systems offered by Windows Geochem Int 46 834ndash839
Sibson RH 1987 Earthquake rupturing as a mineralizing agent in hydrothermal sys-tems Geology 15 701ndash704
Silva-Romo G 2008 GuayapendashPapalutla fault system a continuous Cretaceous structurefrom southern Mexicoto theChortis BlockTectonicimplicationsGeology 3675ndash78
Spooner ETC Bray CJ Wood PC Burrows DR Callan NJ 1987 Aundashquartz vein andCundashAundashAgndashMondashanhydrite mineralization HollingerndashMcIntyre Mine Timmins
Ontario δ13C values (McIntyre) Fluid inclusion gas geochemistry pressure (depth)estimation and H2OndashCO2 phase separation as a precipitation and dilation mecha-nism Ont Geol Surv Misc Pap 136 35ndash56
Su W Xi B Xia B Zhang X Hu R 2008 Visible gold in arsenian pyrite at theShuiyindong Carlin-type gold deposit Guizhou China implications for the environ-ment and processes of ore formation Ore Geol Rev 33 667ndash679
Sundblad K Cumming GL Krstic D 1991 Lead isotope evidence for the formation of epithermalgold quartzveins in theChortis BlockNicaragua Econ Geol 86 944ndash959
Tagirov BR Salvi S Schott J Baranova NN 2005 Experimental study of goldndash
hydrosulphide complexing in aqueous solutions at 350ndash500 degC 500 and 1000 barsusing mineral buffers Geochim Cosmochim Acta 69 (8) 2119ndash2132
ThieryR Vanden Kerkhof AM Dubessy J 1994 vX properties of CH4ndash
CO2 and CO2ndash
N21047298uid inclusions modelling for T b 31 degC and P b 400 bars Eur J Mineral 6 753ndash771
Thomsen C Reich S 2000 Double resonant Raman scattering in graphite Phys RevLett 85 5214ndash5217
Van den Kerkhof AM 1988 The System CO2ndashCH4ndashN2 in Fluid Inclusions TheoreticalModelling and Geochemical Applications (PhD Thesis Amsterdam)
Vanden Kerkhof AM OlsenSN 1990 A natural example of superdense CO2 inclusionsmicrothermometry and Raman analysis Geochim Cosmochim Acta 54 895ndash901
Van den Kerkhof AM Thiery R 2001 Carbonic inclusions Lithos 55 49ndash68Vidano RP Ischbach DB Willis LJ Loehr TM 1981 Observation of Raman band
shifting with excitation wavelength for carbons and graphites Solid State Commun39 341ndash344
Wang X Chou I-M Hu W Burruss RC Sun Q Song Y 2011 Raman spectroscopymeasurements of CO2 density experimental calibration with high-pressure opticalcell (HPOC) and fused silica capillary capsule (FSCC) with application to 1047298uid inclu-sion observations Geochim Cosmochim Acta 75 4080ndash4093
Williams-Jones AE Bowell RJ Migdisov AA 2009 Gold in solution Elements 5281ndash287
Williams-Jones AE Samson IM Ault KM Gagnon JE Fryer BJ 2010 The genesis of
distal zinc skarns evidence from the Mochito deposit Honduras Econ Geol 1051411ndash1440
Wopenka B Pasteris JD 1993 Structural characterization of kerogens to granulite-facies graphite applicability of Raman microprobe spectroscopy Am Mineral 78533ndash557
Yang F Mao J Wang Y Bierlein F 2006 Geology and geochemistry of the Bulongquartzndashbarite vein-type gold deposit in the Xinjiang Uygur Autonomous RegionChina Ore Geol Rev 29 52ndash76
Zhang YG Frantz JD 1987 Determination of the homogenization temperatures anddensities of supercritical 1047298uids in the system NaClndashKClndashCaCl2ndashH2O using synthetic1047298uid inclusions Chem Geol 64 335ndash350
256 E Salvioli-Mariani et al Journal of Geochemical Exploration 158 (2015) 243ndash 256
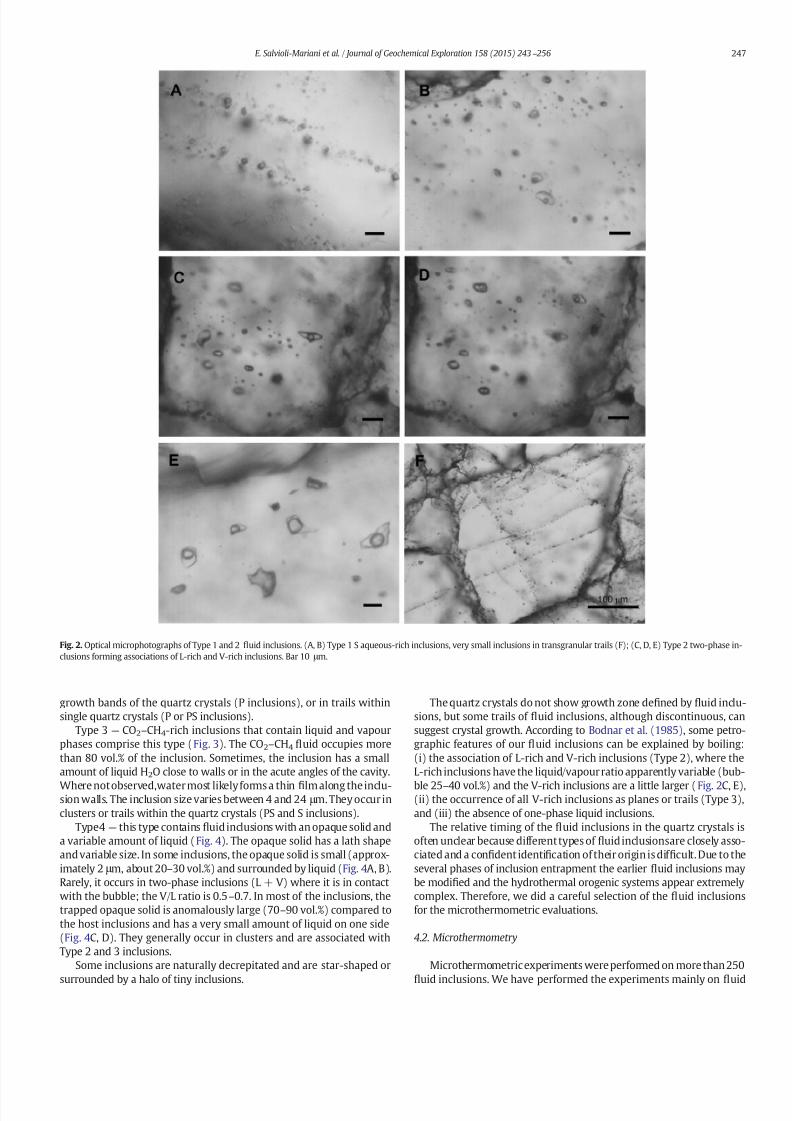
7172019 Salvioli et al 2015
httpslidepdfcomreaderfullsalvioli-et-al-2015 514
growth bands of the quartz crystals (P inclusions) or in trails withinsingle quartz crystals (P or PS inclusions)
Type 3 mdash CO2ndashCH4-rich inclusions that contain liquid and vapourphases comprise this type (Fig 3) The CO2ndashCH4 1047298uid occupies morethan 80 vol of the inclusion Sometimes the inclusion has a smallamount of liquid H2O close to walls or in the acute angles of the cavity
Where notobservedwater most likely forms a thin1047297lm along the inclu-sion walls The inclusion size varies between 4 and 24 μ m They occur inclusters or trails within the quartz crystals (PS and S inclusions)
Type4 mdash this type contains 1047298uidinclusions with an opaque solid anda variable amount of liquid (Fig 4) The opaque solid has a lath shapeand variable size In some inclusions the opaque solid is small (approx-imately 2 μ m about 20ndash30 vol) and surrounded by liquid (Fig 4A B)Rarely it occurs in two-phase inclusions (L + V) where it is in contactwith the bubble the VL ratio is 05ndash07 In most of the inclusions thetrapped opaque solid is anomalously large (70ndash90 vol) compared tothe host inclusions and has a very small amount of liquid on one side(Fig 4C D) They generally occur in clusters and are associated withType 2 and 3 inclusions
Some inclusions are naturally decrepitated and are star-shaped or
surrounded by a halo of tiny inclusions
The quartz crystals do not show growth zone de1047297ned by 1047298uid inclu-sions but some trails of 1047298uid inclusions although discontinuous cansuggest crystal growth According to Bodnar et al (1985) some petro-graphic features of our 1047298uid inclusions can be explained by boiling(i) the association of L-rich and V-rich inclusions (Type 2) where theL-rich inclusions have the liquidvapour ratio apparently variable (bub-
ble 25ndash40 vol) and the V-rich inclusions are a little larger (Fig 2C E)(ii) the occurrence of all V-rich inclusions as planes or trails (Type 3)and (iii) the absence of one-phase liquid inclusions
The relative timing of the 1047298uid inclusions in the quartz crystals isoften unclear because differenttypes of 1047298uidinclusionsare closely asso-ciated and a con1047297dent identi1047297cation of their origin is dif 1047297cult Due to theseveral phases of inclusion entrapment the earlier 1047298uid inclusions maybe modi1047297ed and the hydrothermal orogenic systems appear extremelycomplex Therefore we did a careful selection of the 1047298uid inclusionsfor the microthermometric evaluations
42 Microthermometry
Microthermometricexperiments were performed on more than 250
1047298uid inclusions We have performed the experiments mainly on 1047298uid
Fig 2 Optical microphotographs of Type 1 and 2 1047298uid inclusions (A B) Type 1 S aqueous-rich inclusions very small inclusions in transgranular trails (F) (C D E) Type 2 two-phase in-clusions forming associations of L-rich and V-rich inclusions Bar 10 μ m
247E Salvioli-Mariani et al Journal of Geochemical Exploration 158 (2015) 243ndash 256
7172019 Salvioli et al 2015
httpslidepdfcomreaderfullsalvioli-et-al-2015 614
inclusion assemblages with variable phase ratios (Type 2) These areconsidered the 1047298uid inclusions that have trapped the hydrothermal1047298uids carrying Au The microthermometric data are summarised inTable 3
421 Type 1 inclusions
The prevalent small size of Type 1 inclusions makes the observationof phase transformations during heating dif 1047297cult Approximately 55
inclusions have been measured The 1047297rst phase variation is suggestedby a dotted appearance due to the 1047297rst melting (eutectic temperatureTe) occurring in the range minus234 to minus119 degC The determined temper-aturessuggest theexistence of dissolvedNaCl andorKCl componentsinwater The remaining solid phase always has a clear appearance andmelts primarily from minus 44 to minus15 degC (ice melting temperatureTmice) On the basis of the ice melting temperature the total salin-ity calculated with the software package of Bakker and Brown
Fig 3 Optical microphotographs of Type 3 1047298uid inclusions (A B) Type 3b inclusions showing retrograde condensationduring microthermometric experiments(C D) Type 3c inclusionssuggesting a liquidndashliquid immiscibility Bar 10 μ m
Fig 4 Optical microphotographs of Type 4 1047298uid inclusions containing graphite with different size and variable LV ratios Bar 10 μ m
248 E Salvioli-Mariani et al Journal of Geochemical Exploration 158 (2015) 243ndash 256
7172019 Salvioli et al 2015
httpslidepdfcomreaderfullsalvioli-et-al-2015 714
(2003) and the equation of Zhang and Frantz (1987) is mainly inthe range 22ndash56 wt NaCl equivalent (rarely b 2 or N 56)(Fig 5B)
The total homogenisation temperature (Thtot) to liquid state occurspredominantly in the range 240ndash336 degC (with median and mode at290 degC Table 3 and Fig 5A)
422 Type 2 inclusions
Analyses were performedon more than 170 inclusions According totheir petrographic features L-rich and V-rich inclusions show differentbehaviour during freezing experiments The L-rich inclusions hereafterreferred to as Type 2a have higher freezing temperatures (minus 50 tominus379 degC) whereas the V-rich inclusions hereafter Type 2b have
Table 3
Summary of the microthermometric data of the studied 1047298uid inclusions
Type Te Tmice Tmcla Tmcarb Thcarb Thtot Salinity XCH4
1 minus234 divide minus 119 20
minus44 divide minus 15 34
240 divide 336 (L)[290 290]55
22 divide 56[32 27]
34
2a minus257 divide minus 111 27
minus76 divide minus 1582
56 divide 13482
250 divide 338 (L)[300 280]60
09 divide 48[35 37]82
005 divide 02011
2b minus282 divide minus 1169
minus71 divide minus 129
60 divide 1869
minus649 divide minus 583 23
180 divide 200 (L) 239 divide minus 100 (V) 293 divide 334 (L)299 divide 334 (V)10
1 divide 62 019 divide 0689
3a minus589 divide minus 583 182 divide 189 (V) 022 divide 10 27 3b minus636 divide minus 627 98 divide 125 (V)
3c minus981 divide minus 733 (V) or liquid immiscibilityminus893 divide minus 719
4 minus250 divide minus 197 minus07 divide minus 04 72 minus635
Temperature in degC Te = eutectic temperature Tmice = ice melting temperature Tmcla = clathrate melting temperature Tmcarb = melting temperature of the carbonic phase Thcarb =
homogenisation of the carbonic phase Thtot = total homogenisation temperature (L) = homogenisation to liquid phase (V) = homogenisation to vapour phase Salinity as wt NaClequivalent XCH4 = molar fraction of methane in the carbonic phase determined by Raman spectrometry In square brackets median and mode values respectively in italics number of measurements
Fig 5 Bar diagrams of microthermometric data (A C E) total homogenisation temperature Th tot (B D) total salinity as NaCl equivalent
249E Salvioli-Mariani et al Journal of Geochemical Exploration 158 (2015) 243ndash 256
7172019 Salvioli et al 2015
httpslidepdfcomreaderfullsalvioli-et-al-2015 814
signi1047297cantly lower freezing temperatures (minus90 to minus 121 degC) and thenucleation of a carbonic vapour bubble on cooling occurs also at verylow temperatures
In Type 2a inclusions the 1047297rst melting temperature (Te) primarilyoccurs between minus 253 and minus111 degC (Table 3) values compatiblewith H2OndashNaCl H2OndashKCl and H2OndashNaClndashKCl systems Due to the for-mation of clathrate upon cooling the ice melting temperature has be-come more dif 1047297cult to measure in practice Most Type 2a inclusions
exhibit ice melting temperatures very similar to those obtained fromType 1 inclusions(in therange minus76 to minus15degC Table 3)In a few inclu-sions ofType 2bit was possibleto obtainTe and Tmice (minus282 to minus116and minus 71 to minus 12 degC respectively Table 3)
In Type 2b inclusions a carbonic vapour bubble appears on coolingat two different temperature intervals ie 10 to 16 degC and minus 121 tominus84 degC Melting of the carbonic phase (Tmcarb) occurs mainly fromminus649 to minus 583 degC suggesting CO2 with other non-condensablegases most likely CH4 in variable proportions Due to the small size of the inclusions the detection of the homogenisation of the carbonicphase (as well as the temperature of homogenisation Thcarb) has beenquite dif 1047297cult to obtain Usually homogenisation to the vapour phaseoccurs at temperature Thcarb from minus 239 to minus10 degC (Table 3) andonly in two cases to liquid phase at higher temperature(Thcarb between18 and 20 degC)
In larger inclusions (approximately20 μ m) we were able to measurethe melting temperature of clathrate we employed the method of Collins (1979) using repeated cooling-heating cycles in proximity of the decomposition temperature of clathrate During microthermometricexperiments the clathrate crystals occur as (i) small crystals around thegaseous bubble (ii) colourless crystals in the aqueous phase (making thedetermination of Tmice dif 1047297cult) and (iii) irregular shape and motion of the gaseous bubble The decomposition temperature of clathrates(Tmcla) in the Type 2a inclusions varies mainly from 56 to 134 degC(Table 3) Where detectable Tmcla in Type 2b inclusions is comparableor higher (60ndash186 degC Table 3) At low pressure CH4 clathrate melts attemperatures higher than 15 degC whereas CO2 clathrate melts at lowertemperatures (b10 degC Seitz and Pasteris 1990 Diamond 2003)
The salinity of Type 2 inclusions was calculated using the melting
temperature of clathrates with the software package of Bakker andBrown (2003) and the equations of Duan et al (1992ab) the resultsare comparable with the values obtained for Type 1 inclusions althoughthey extend towards lower values (09ndash48 and 1ndash62 wt NaClequivalent Fig 5D and Table 3) The composition of the carbonic1047298uid is dif 1047297cult to obtain due to the formation of clathrate duringmicrothermometric experiments
Themost frequent values for Thtot (Table 3) are 250ndash338 degC (medianand mode at 300 degC and 280 degC respectively Type 2a Fig 5C) 293ndash334 degC (to liquid phase Type 2b) and 299ndash334 degC (to vapour phaseType 2b Fig 5E)
423 Type 3 inclusions
Only25 inclusions of the Type 3 havebeeninvestigated Most Type 3
inclusions freeze at very low temperatures below minus 85 degC and down tominus136 degC the extremely low water content rarely allows observation of the changes induced by freezing The carbonic phase melts primarily inthe range minus 636 to minus 583 degC (Table 3) similarly to Type 2b inclusionssuggesting a variable proportion of CO2 with other non-condensablegasesmost likely CH4 The melting temperature (Tmcarb) rarely reacheslower values down to minus 699 degC suggesting high contents of CH4 Onlyone determination gave Tmcarb = minus 569 degC
Thehomogenisation of the carbonic phase to vapour phase occurs atdifferenttemperatures (Table 3)(i) 182ndash189 degC forthe inclusions withthe highest Tmcarb (minus589 to minus 583 degC hereafter 3a) and (ii) 98ndash125 degC for the inclusions melting at lower temperatures (minus636 tominus627 degC hereafter 3b Fig 3A B) The homogenisation temperatureto vapour phase of Type 3b inclusions suggests that Tmcarb should be
greater than approximately minus 62 degC (cf Ridley and Hagemann 1999
Thiery et al 1994 Van den Kerkhof and Thiery 2001) This behaviouris the consequence of retrograde condensation (ie the condensationof liquid under isothermal conditions on lowering pressure) which in-creases the temperature of homogenisation (to the gas phase) of the1047298uid inclusions (with a given composition) to values higher than thecritical temperature (Thiery et al 1994 Van den Kerkhof 1988 Vanden Kerkhof and Thiery 2001)
A further subgroup of Type 3 inclusions (hereafter 3c Table 3 and
Fig 3C D) has a varied behaviour at very low temperatures (minus
981to minus733 degC) they apparently homogenise to thevapourphaseand like-ly to another liquid supporting a case of liquidndashliquidndashgas immiscibility(Thiery et al 1994) At room temperature these inclusions have twophases of similar density (Fig 3C D) In some inclusions a meniscusoccurs in the bubble at temperature from minus 893 to minus 719 degC (whichgradually disappears at approximately minus63 to minus 60 degC) and thecarbonic phase appears darker or takes on a bumpy surface
424 Type 4 inclusions
In rare cases it was possible to obtain data during microthermometricexperiments The obtained temperatures (Tmcarb ~ minus 635 degC Te fromminus250 to minus197 degC Tmice from minus07 to minus04 degC and Tmcla 72 degCTable 3) are fully comparable with those of Type 2 and Type 3 inclusions
43 Micro-Raman spectroscopy
To estimate the entrapment conditions we must know both thecomposition and density of the trapped 1047298uid However as statedabove they are dif 1047297cult to obtain for the occurrence of clathrates Toovercome this problem we determinedthe composition of the carbonicphase using micro-Raman spectroscopy
431 CO 2ndashCH 4 1047298uids
For Raman analysis of the carbonic phase we selected approximate-ly 50 inclusions of Type 2 and 3
The Raman spectra of these inclusions are characterised by (i) theRaman active stretchingmodeν1 at 1278ndash1282 cmminus1 and the overtoneof thebending modeν2 (2ν2)at1380ndash1385 cmminus1 typicalof CO2 (Fig6)
and known asthe Fermi diad (Garrabos et al 1980) and(ii) theisolatedC-H stretching band (ν1) of CH4 at 2907ndash2913 cmminus1 (Fig 6 Burke2001) In the spectral area of reduced sulphur species the backgroundsometimes shows a small hump which might be considered as a smallpeak (insetin Fig6C) It occurs atabout 2610cmminus1 suggestingthe pres-ence of a very small amount of H2S associated to the carbonic vapourphase The detection limit is estimated at 1 mol for H2S
According to the literature (Kawakami et al 2003 Van den Kerkhof and Olsen 1990 Wang et al 2011) the changes of frequency in theRaman spectrare1047298ect variations in pressure1047298uid density and tempera-ture The separation between the two bands (Δν) represents a bettermeasure of CO2 density than the peak positions or the ratio of thepeak positions (Kawakami et al 2003 Wang et al 2011) The mea-sured Δν in our 1047298uid inclusions is 1035ndash104 cmminus1 On the basis of
the equation from Wang et al (2011) valid for the entire range of den-sities(with CH4 le 10 mol) the calculatedCO2 density of the investigat-ed 1047298uid inclusions is in the range 034ndash056 gcm3
Similarly the position of the ν1 band is also in1047298uenced by pressureand temperature variations for CH4 Unfortunately we were unable toobtain reliable density values because the equations proposed in the lit-erature have been calibrated using a 51453 nm laser (Lin et al 2007)and are valid for pure or almost pure CH4 (b10 mol of other compo-nents such as CO2) and CH4ndashH2O systems (Lu et al 2007) which areconditions signi1047297cantly different from those of our systems
On the basis of the microthermometric data we infer that the car-bonic components are present in variable proportions and their molefractions have been determined from Raman spectra according toBurke (2001) That study provides a simple formula that considers
CO2 and CH4 peak areas (both CO2 peaks must be considered) CO2
250 E Salvioli-Mariani et al Journal of Geochemical Exploration 158 (2015) 243ndash 256
7172019 Salvioli et al 2015
httpslidepdfcomreaderfullsalvioli-et-al-2015 914
and CH4 Ramanscattering ef 1047297ciencies andCO2 and CH4 instrumental ef-1047297ciencies for the speci1047297c laser wavelength (6328 nm) The CH4 molefraction (XCH4) varies between 005ndash020 in Type 2a 019ndash068 inType 2b and 022ndash10 in Type 3 inclusions (Table 3)
432 Carbonaceous material
Type 4 inclusions are peculiar because they contain a black solidphase with a lath shape and variable proportions of aqueous liquidphase Based on Raman spectra the solid phase is identi1047297ed as graphite25 Raman spectra were acquired for both solid and liquid phases
Raman spectra of the carbonaceous material are very sensitive tochanges in the order degree The1047297rst order bands of the Raman spectraof carbonaceous material are characterised by the G band at approxi-mately 1580 cmminus1 typical of crystalline or ordered graphite the Dband at approximately 1350 cmminus1 and the Dprime band at approximately1620 cmminus1 typical of disordered or defect bearing carbonaceous mate-rial (Aoya et al 2010 Luque et al 1998 Thomsen and Reich 2000Vidano et al 1981) Carbonaceous materials also exhibit a strong
Raman band in the range 2500ndash
2800 cmminus1
which corresponds to the
overtone of the D band This band appears in the second-order Ramanspectra and is called the Gprime band (Pimenta et al 2007) The decreasein the order degree of graphite is also evident by the development of an asymmetry andbandbroadening in the second-order peak and a de-crease in resolution among its constituent bands (Pasteris and Chou1998) If the position of the G band is not affected by the wavelengthof thelaser the Raman frequency of theD band increases with theexci-tation energy (Kawashima and Katagiri 1995 Matthews et al 1999
Vidano et al 1981) Moreover the ratio of the integrated intensity of the D and G bands (IDIG) decreases with increasing laser energyWith our equipment (λ = 6328 nm) the D band is expected at ap-
proximately 1330 cmminus1 The spectra acquired on Type 4 inclusions(Fig 7A B) have frequencies in the range 1332ndash1336 cmminus1 and1578ndash1581 cmminus1 forD and G bands respectivelyThe Dprime bandis alwayspresent as a shoulder on the high-frequency side of the G peak in therange 1613ndash1620 cmminus1 In the region of second-order bands an unre-solved doublet or a large band at approximately 2664ndash2709 cmminus1 oc-curs The D band is broad with low intensity when compared to the Gband and with a very low IDIG ratio (016ndash030) The degree of crystal-linity is represented by the length of ordered crystals along the a
Fig 6 Ramanspectra ofthe carbonicphase inexample Type 2a(A)Type2b (B)andType3 (C) 1047298uid inclusions The intensity scale of the inset is unchanged
Fig 7 Raman spectraof graphite in Type4 1047298uidinclusions (A B) compared with those of
graphite from wall-rock (C)
251E Salvioli-Mariani et al Journal of Geochemical Exploration 158 (2015) 243ndash 256
7172019 Salvioli et al 2015
httpslidepdfcomreaderfullsalvioli-et-al-2015 1014
crystallographic direction designated as L a (Pasteris and Chou 1998)The IDIG ratio and L a are negatively correlated and the most disorderedgraphite is characterised by the highest IDIG and the lowest L a values(Pasteris and Chou 1998) According to the general formula proposedby Pimenta et al (2007) which can be applied to any laser line we ob-tained the crystallite size L a in the range 1300ndash2400 Aring The calculatedparameters and the widths of the D and Gprime bands suggest a fairly gooddegree of graphite crystallinity which is comparable to that of naturally
or laboratory-produced graphite (Luque et al 1998 Pasteris and Chou1998 Perraki et al 2006 Satish-Kumar 2005 Wopenka and Pasteris1993) The Raman spectra of trapped graphite are all similar ( Fig 7AB) suggesting that the precipitation of graphite occurred from the hy-drothermal 1047298uid
The liquid portion associated with trapped graphite contains CO2CH4 and liquid H2O The typical peaks of CO2 (1280ndash1281 and1383ndash1384 cmminus1) and of CH4 (2910ndash2913 cmminus1) were observedusing the 6328 nm laser (Fig 8A) Moreover the peak for liquid H2Oat 3250ndash3252 cmminus1 was detected with the 4731 nm laser (Fig 8B)
Because of thepresenceof graphite in thehost rocks (quartz-sericiticand graphitic schists) for comparison we acquired 6 Raman spectra onthis carbonaceous materials They are completely different from thoseobtained for the graphite in the 1047298uid inclusions (Fig 7C) The D band(1329ndash1334 cmminus1) has a higherintensitythan that ofgraphitein thein-clusions and sometimes reaches the same intensity as the G band at1580ndash1583 cmminus1 Therefore the IDIG ratios are higher (095ndash208)and L a is lower (200ndash400 Aring) supporting the presence of fairly disor-dered graphite The shape of the spectra and the calculated parametersof graphite from the host rock of Canan are comparable to those of thegraphite from metapelites of chlorite facies (Luque et al 1998Wopenka and Pasteris 1993)
5 Discussion
Four types of 1047298uid inclusions have been found in the quartz crystalsfrom the mineralising veins of Dos Bocas a representative example of
gold deposit at Canan Some 1047298uidinclusions are along fractures crossingone or more crystals (Type 1 S inclusions)The most important1047298uid in-clusions constitute discontinuous trails which can suggest crystalgrowth zones (Type 2) The 1047298uid inclusion associations formed by L-richand V-richinclusions (Type 2 P andPS inclusions) andthe presenceof trails entirely constituted by V-rich inclusions(Type 3 PS andS inclu-sions) suggest that the hydrothermal 1047298uid suffered 1047298uid immiscibility(boiling) The trapped 1047298uid consists of an aqueous solution (H2Ondash
NaClndash
KCl with 09ndash
48 wt NaCl equivalent) plus a CO2ndash
CH4 1047298
uid(80ndash90 mol CO2) As shown by Bowers and Helgeson (1983) a pres-sure drop moves the H2O-carbonic phase solvus towards higher tem-perature which causes a decrease of carbonic gas solubility and theexsolution of CO2 (and CH4) gas from the water-rich 1047298uid according tothe Henrys law In geological environments such as Canan where thetectonics aredominatedby strikendashslip fault systems thefracture forma-tion after deformation causes a rapid and immediate reduction in pres-sure The occurrence of some inclusions naturally decrepitated can beexplained by pressure drop The presence of Type 3b 1047298uid inclusionswhich exhibit retrograde condensation further supports the occurrenceof such a pressure drop
Because of 1047298uid immiscibility the total homogenisation temperaturecan be considered as the trapping temperature Isochores have been re-constructed for Type 2 1047298uid inclusions combining the results frommicrothermometry and Raman analyses using the software package of Bakker and Brown (2003) and the equations of Bakker (1999) andDuan et al (1992b) Trapping pressures of 05ndash14 kbar were obtainedThe coexistence of different types of 1047298uid inclusions and their similarvalues of Th suggest that they can be related to the same hydrothermalprocess which wasresponsiblefor the gold mineralisation at CananThedifferentamounts of water andcarbonic1047298uids inthe inclusions is due tothe 1047298uid immiscibility where the H2O-rich 1047298uid is in Type 2a inclusionsand the CO2ndashCH4-rich 1047298uid in Types 2b and 3 inclusions Finally Type 4inclusions would represent the inclusions (both Type 2 and 3) wherethe conditions for graphite precipitation have been achieved
The graphite of the1047298uid inclusions (Type 4) is similar to that precip-itated from hydrothermal1047298uids This indicates that graphite depositionoccurred before or contemporaneously of the entrapment of the 1047298uid
The degree of crystallinity of graphite in the 1047298uid inclusions is higherthan that observed in the graphite from the host quartz-sericitic andgraphitic schists (Fig 7) Nonetheless this does not exclude the pres-ence of a metamorphic component in the mineralising 1047298uids
Equilibrium of graphite in the hydrothermal1047298uid allows the evalua-tion of oxygen fugacity The calculated atomic ratio XO [O(O + H)] isinthe range 032ndash041 (Fig 9) which is typical of slightly reduced 1047298uids(Cesare 1995 Huizenga 2011) Considering temperatures of 300 degCand pressures of 14 10 and 05 kbar (Tt and Pt respectively) graphitesaturation conditions (aC = 1) and the composition of the carbonicphase as inferred by Raman spectroscopy the calculated f O2 is aboutminus342 log unit (ie about 16 log unit above theQFM buffer) This resultis consistent with that obtained using the HSC chemistry software log f O2 asymp minus376 plusmn 25 which permitted us to calculate also the activity
of dissolved hydrogen ions at equilibrium condition between the con-stituents H2OCO2 CH4 Na+ andClminuspH=29plusmn04Itcanbeobservedthat our estimated pH value is low but this range of acidity is not un-common in1047298uid inclusions (egBenison 2013) including gold deposits(Boiron et al 1999 Pokrovski et al 2014)
According to Roedder (1984)thepHin 1047298uid inclusions can be calcu-lated or determined In the latter case the opening of the 1047298uid inclu-sions implies the loss of the trapped gases It follows that the pH isdetermined on a 1047298uid other than the original and which has undergonebasi1047297cation due to the loss of gas
The composition of Type 2 inclusions plotted in the ternary diagramCOH falls within the stability 1047297eld of graphite (towards the CO2 vertexFig 9) and the 1047298uid associated with graphite in Type 4 inclusions isalso constituted by H2OndashCO2ndashCH4 These features support precipitation
of graphite by the reaction CH4 + CO2rarr
2 C + 2 H2O The decrease of
Fig 8 Raman spectraof the1047298uid portion of Type 4 1047298uid inclusions (A)CO2 and CH4 have
been obtained by 6328 nm laser (B) H2O by 4731 nm laser
252 E Salvioli-Mariani et al Journal of Geochemical Exploration 158 (2015) 243ndash 256
7172019 Salvioli et al 2015
httpslidepdfcomreaderfullsalvioli-et-al-2015 1114
temperature andor the increase of pressure move the reaction towardsthe products In our case a combination of cooling and decompressionacted on the system so that the variation of temperature and pressurecannot be responsible for the precipitation of graphite According toHuizenga (2011) the precipitation of graphite is in1047298uenced by XO
value and oxygen fugacity the best conditions for precipitation areXO = 033 and QFM-2 b log f O2 b QFM + 1 Small variations from
these values prevent the precipitation or cause consumption of earlyprecipitated graphite XO values and f O2 of our Type 2 1047298uid inclusions(see above) agree with the Huizenga (2011) data and indicate thatsome 1047298uid inclusions were able to precipitate graphite
The H2S content and the oxygen fugacity of the hydrothermal 1047298uidsaffect the solubility of gold In H 2S-rich 1047298uids Au(HS)2
minus andAu(HS)deg are the dominant Au-complexes and gold has high solubil-ity (Au N 100 ppb) whereas in H2S-poor 1047298uids the gold solubilitydecreases and AuCl2
minus is the dominant stable complex (Gammonsand Williams-Jones 1997) When the partial pressure of H 2S is1047297xed by the magnetitendashpyrite pair the Au bisulphide complex isstable at T b 450 degC and the chloride complex at higher temperature(Mikucki 1998) At high oxygen fugacity H2S is oxidised and thusthe mobility of gold as bisulphide decreases considerably ( Gammons
and Williams-Jones 1997) Experimental studies at temperatures of 350ndash500 degC and pressures of 05ndash1 kbar have shown that Au(HS)2
minus isthe dominant Au complex in near neutral to weakly acidic solutions inthe presence of the K-feldsparndashmuscovitendashquartz mineral associationand at pyritendashpyrrhotitendashmagnetite buffer conditions (Tagirov et al2005)
Many of the conditions employed in the experiments mentionedabove match those of the Canan ore deposit 1047298uid inclusions indicatethe presence of low salinity and low temperature (T b 400 degC) hydro-thermal 1047298uids and XRD data (Mattioli et al 2014) show that the wall-rocks contain the K-feldsparndashmuscovitendashquartzndashpyritendashpyrrothitendashmagnetite association (Table 1) However the hydrothermal 1047298uids atCanan seem to be extremely acidic (pH = 29) which makes Au(HS)degmore stable than Au(HS)2
minus and themost abundant complex in thesolu-
tions (cf also Heinrich et al 2004 Pokrovski et al 2014) Hence we
infer that the gold of Canan was transported by hydrothermal 1047298uids asAu(HS)deg complex
Activity diagrams are a powerful graphical tool for depicting the sta-bility of dissolved species and solid and gas phases with respect to thecomposition of the coexisting solution Calculations on Au speciationwere performed under the mean conditions estimated by the analysisof the 1047298uid inclusions and the results plotted in log f O2-pH diagrams(Fig 10) The decrease in solubility of the Aundashsulphide complexes can
be ascribed both to the fracturation-induced pressure drop andthe con-centration of sulphur in solution According to Mattioli et al (2014) thegold deposit of Canan was formed by the hydrothermal 1047298uid activityalong fractures produced by tectonics Opening and lateral expansionof the fractures produce a pressure drop on the 1047298uids themselves andboiling of the dissolved gases The 1047298uid composition affects the depthof boiling which is an ef 1047297cient mechanism for gold precipitation(Hedenquist et al 1992 Pokrovski et al 2014 Robb 2010 Sibson1987) Boiling produced the exsolution of H2S which in turn caused adecrease in the solubility of theAundashsulphide complexes and the precip-itation of gold (Fig 10) In the case of the Canan deposit boiling repre-sents only the initial phase of gold deposition In fact the main bodyof thegoldmineof Canan is located in metamorphic rocks cutby quartzveins where hydrothermal 1047298uids altered the primary mineralogy andchanged their composition and ability to carry gold in solution In theore deposit Au coexists with sulphides and in particular small grainsof pure gold are surrounded by pyriteand other sulphides This suggeststhat gold was deposited by reactions involving 1047298uids containing Au-Scomplexes and the wall-rock containing chalcophile elements particu-larly Fe a process known as ldquosulphidationrdquo (Williams-Jones et al 2009and references therein Robb 2010) At Canan Fe is abundant in freshwall-rocksfor thepresence of biotiteand chloriteThese minerals disap-pear in the vicinity of quartz veins of the ore deposit where the highestconcentration of gold and sulphides are observed (Mattioli et al 2014)During the alteration of biotite and chlorite Fe is released into the hy-drothermal 1047298uids and likely produces the following reaction with theAundashsulphide complexes
AuethHSTHORN∘ethaqTHORN thorn 05Fe2thornharr05FeS2ethPyriteTHORN thorn H
thorn thorn Au∘ethGoldTHORN eth1THORN
Under equilibrium conditions and assumingP = 1400barT = 300 degCand the water activity H2O = 1 the resulting log K is 53151 (ΔGdeg-R = minus 5833 kJ molminus1) The high value of the equilibrium constant Kand the highly negative value of ΔGdegR indicate that the reaction has aspontaneous tendency towards the products According to Robb (2010)these reactions occur in dynamic systems where kinetics predominatesover equilibrium conditions Therefore it is very unlikely that reaction(1) occurs under equilibrium conditions in an open natural system Be-cause of the continuous supply of Au(HS)deg from the hydrothermal 1047298uidsand Fe2+ from the alteration of biotite and chlorite (within the zones of 1047298uid-rock interaction) reaction (1) is imbalanced and pushed towardsthe products by favouring the deposition of gold and sulphides This isin agreement with Pokrovski et al (2014) who state that the interactionof sulphur-rich hydrothermal 1047298uids and Fe2+-rich wall rocks(sulphidation) is one of the main processes leading to the precipitationof gold
Additionally the activity of sulphur in the 1047298uids is responsible forthe solubilisation and transport of gold At Canan the activity of Sought to be at least 10minus2 Above this value the composition of hydro-thermal 1047298uid plots in the stability 1047297eld of Au(HS)deg (Fig 10) Withlower concentrations of S (and lower pressure) the transportof gold oc-curs as chloride (Fig 10L M and N) If iron is no longer available aftercomplete alteration of biotite and chlorite the deposition of goldcould be represented by the reaction
AuethHSTHORN∘ethaqTHORN thorn 05H2ethgTHORNharrH2SethgTHORN thorn Au∘ethGoldTHORN eth2THORN
where log K = 69130 (ΔGdegR = minus 7586 kJ molminus1) at T = 300 degC and
P = 1400 bar indicates once again a spontaneous tendency towards
Fig 9 Ternary CndashOndashH diagramshowing thecarbon saturatedsurface (solid line) at 300degCand1400 barcalculated by Perple_Xsoftware(J Connollywwwperplexethzch) Dashedlines represent the compositional triangle H2OndashCO2ndashCH4 dotted 1047297eld Type 2a inclusionsstriped 1047297eld Type 2b inclusions Lines of constant XO 035 and 040 (dot-dashed lines) arealso shownTheopencircles andthenumbers initalics indicate f O2
1047298uid relative toQFM buff-er in log10 units (log f O2
1047298uidndashlog f O2
QFM) for 1047298uids in equilibrium with graphite
253E Salvioli-Mariani et al Journal of Geochemical Exploration 158 (2015) 243ndash 256
7172019 Salvioli et al 2015
httpslidepdfcomreaderfullsalvioli-et-al-2015 1214
theproducts andthe presence of H2 agrees with the reducing conditions(log f O2 asymp minus376) found in the hydrothermal 1047298uids of Canan Reaction(2) would be effective during boiling andor decompression (cf Boyle1969 Pokrovski et al 2014) Similarly to reaction (1) the dynamicsystem conditions (the continuous supply of Au(HS)deg and loss of H2S)favour the kinetic of the reaction (2) and con1047297rm the statements of Robb (2010) and Sibson (1987) on the ef 1047297ciency of this process forgold deposition Finally the kinetics of reaction (1) is further increasedby the alteration of feldspar and muscovite in kaolinite and diaspore (cfMattioli et al 2014) The mineral alterations subtract H+ from the solu-
tion (Drever 1997) favouring the precipitation of Au
6 Concluding remarks
The quartz veins associated with gold mineralisations from DosBocas (Canan area Lepaguare District east-central Honduras) are richin 1047298uid inclusions of four main types Type 1 mdash S two-phaseaqueous-rich inclusions Type 2 mdash P to PS aqueous-rich inclusionswith an H2O-rich liquid and a CO2ndashCH4-bearing liquid Type 3 mdash PSto S CO2ndashCH4-rich inclusions with a very small amount of waterand Type 4 mdash graphite-bearing aqueousndashcarbonic 1047298uid
The association of L-rich and V-rich inclusions (Type 2) and the oc-currence of trails containing only V-rich inclusions (Type 3) support a
1047298uid immiscibility (boiling)of the hydrothermal1047298uidThe hydrothermal
trapped 1047298uid is constituted by H2O + alkali chloride + CO2 plusmn CH4 Thecalculated salinity varies from 09 to 48 wt NaCl equivalent
The immiscibility of 1047298uids can be related to a pressure decrease dueto both the opening of fractures and upward 1047298ow of 1047298uids At Canan astrikendashslip fault systemis responsible for the fracturing of the metamor-phic wall-rocks Thisgeological setting with the mineralogicalpetrolog-ical and geochemical features supports an orogenic character of theinvestigated gold deposits
In some 1047298uid inclusions the occurrence of graphite with typical fea-tures of graphite precipitated from hydrothermal 1047298uids suggests that
the deposition of graphite was prior or concomitant with the entrap-ment of the 1047298uid Moreover the occurrence of graphite associated towater andcarbonic1047298uidssupports the presence of a metamorphic com-ponent in the mineralising 1047298uid
Microthermometric and spectroscopic data from 1047298uid inclusionssuggest that the gold mineralisations at Canan formed at T = 300 degCunderP=500ndash1400 barsThecalculated oxygenfugacityand pH valuesof the hydrothermal 1047298uids are approximately minus 376 plusmn 25 log unit(1 log unit above the QFM buffer) and 29 plusmn 04 respectively
The hydrothermal 1047298uids contained sulphur (activity of S ge 10minus2)assuggested by the association of gold with sulphides including pyriteand chalcopyrite For the above chemical and physical conditions themost abundant sulphur specie carrying gold in solution is the Au(HS)degcomplex Several causes are responsible for the precipitation of gold in
the Canan area 1 mdash boiling following the pressure drop caused by
Fig 10 Activity diagrams for the system AundashCndashClndashSndashH2O at 300 degC Au and H2O activity 10minus7 (~10 ppb) and 100 respectively Cl 10minus098 and C buffered by graphite (see ldquoCalculationmethodsrdquo) Variable values of pressure are considered 1400 bar (A B C and D) 1000 bar (E F G and H) 500 bar (I L M and N) Activities of total dissolved S are 10minus1 (A E and I)10minus2 (B F and L) 10minus3 (C G and M) and buffered by pyrite (D H and N) Green 1047297eld represents the mean composition of the 1047298uid inclusions (pH = 29 plusmn 04 log f O2 = minus 376 plusmn25) Red lines limit the 1047297elds of Au species dashed black lines the S species and dashed blue lines the carbon species The thickness of the red lines corresponds to an uncertainty of log [Au] = plusmn01 or log [H2O] = plusmn02
254 E Salvioli-Mariani et al Journal of Geochemical Exploration 158 (2015) 243ndash 256
7172019 Salvioli et al 2015
httpslidepdfcomreaderfullsalvioli-et-al-2015 1314
tectonic andor hydrothermal 1047298uids activity 2 mdash sulphidation triggeredby the liberation of metal cations during the alteration of ma1047297c min-erals of the wall-rocks 3 mdash hydrothermal alteration of feldspars andphyllosilicates of the wall-rocks
Acknowledgements
The authors wish to thank M Menichetti for providing samples of
the quartz veins and the Goldlake Group for the permission to publishthe results of this study Special thanks are due to John Ridley for theuseful and encouraging suggestions which have noticeably improvedthequality of this paperSincere thanksare dueto BJStacey forimprov-ing the English
References
Alvarez-Gogravemez JA Meijer PT Martigravenez-Digraveaz JJ Capote R2008 Constraintsfrom1047297nite element modeling on the active tectonics of northern Central America andthe Middle America Trench Tectonics 27 TC1008 httpdxdoiorg1010292007TC002162
Andrada de Palomera P van Ruitenbeek FJA van der Meer FK Fernaacutendez R 2012Geochemical indicators of gold-rich zones in the La Jose1047297na epithermal depositDeseado Massif Argentina Ore Geol Rev 45 61ndash80
Aoya M Kouketsu Y Endo S Shimizu H Mizukami T Nakamura D Wallis S 2010Extending the applicability of the Raman carbonaceous-material geothermometer
using data from contact metamorphic rocks J Metamorph Geol 28 895ndash914Bakker RJ 1999 Adaptation of the Bowers and Helgeson (1983) equation of state to the
H2OndashCO2ndashCH4ndashN2ndashNaCl system Chem Geol 154 225ndash236Bakker RJ Brown PE 2003 Computer modelling in 1047298uid inclusion research In
Samson I Anderson A Marshall D (Eds) Fluid Inclusions Analysis and interpreta-tion Mineralogical Association of Canada Short Course Series 32 pp 175ndash212
Benison KC 2013 Acid saline 1047298uid inclusions examples from modern and Permianextreme lake systems Geo1047298uids 13 579ndash593
Bersani D Salvioli-Mariani E Mattioli M Menichetti M Lottici PP 2009 Raman andmicro-thermometric investigation of the 1047298uid inclusions in quartz in a gold-richformation from Lepaguare mining district Spectrochim Acta A 73 443ndash449
Bethke CM Yeakel S 2008 The Geochemists Workbenchreg mdash Release 7 GWB Essen-tials Guide mdash Hydrogeology Program University of Illinois (100 pp)
Bodnar RJ Reynolds TJ Kuehn CA 1985 Fluid-inclusion systematics in epithermalsystems In Berger BR Bethke PM (Eds) Geology and Geochemistry of Epithermal Systems Reviews in Economic Geology 2 pp 73ndash97
Boiron MC Cathelineau M Essarraj S Lespinasse M Sellier E 1991 Characterizationof the relationships between deformation 1047298uid migration and Au deposition in
quartz veins methodology and modelling Proceedings Gold 91 AA BalkemaPublishers Brazil pp 637ndash643Boiron MC Moissette A Cathelineau M Banks D Monnin C Dubessy J 1999
Detailed determination of palaeo1047298uid chemistry an integrated study of sulphate-volatile rich brines and aquo-carbonic 1047298uids in quartz veins from Ouro Fino(Brazil) Chem Geol 154 179ndash192
Botros NS 2004 A new classi1047297cation of the gold deposits of Egypt Ore Geol Rev 251ndash37
Bowers TS Helgeson HW 1983 Calculation of the thermodynamic and geochemicalconsequences of nonideal mixing in the system H2OndashCO2ndashNaCl on phase relationsin geological systems equation of state for H 2OndashCO2ndashNaCl 1047298uids at high pressuresand temperatures Geochim Cosmochim Acta 47 1247ndash1275
Boyle RW 1969 Hydrothermal transport and deposition of gold Econ Geol 64112ndash115
Burke EAJ 2001 Raman microspectrometry of 1047298uid inclusions Lithos 55 139ndash158Callaghan T 2001 Geology and host-rock alteration of the Henty and Mount Julia gold
deposits western Tasmania Econ Geol 96 (5) 1073ndash1088Carpenter RH 1954 Geology and ore deposits of the Rosario mining district and San
Juancito Mountains Honduras Central America Geol Soc Am Bull 65 23ndash28
Cepedal A Fuertes-Fuente M Martiacuten-Izard A Garciacutea-Nieto J Boiron MC 2013 Anintrusion-related gold deposit (IRGD) in the NW of Spain the Linares deposit igne-ous rocks veins and related alterations ore features and 1047298uids involved
J Geochem Explor 124 101ndash126Cesare B 1995 Graphite precipitation in CndashOndashH 1047298uid inclusions closed system compo-
sitional and density changes and thermobarometric implications Contrib MineralPetrol 122 25ndash33
Cleverley JS Bastrakov EN 2005 K2GWB Utility for Generating Thermodynamic DataFiles for the GeochemistsWorkbenchregat 0ndash1000 degC and 1ndash5000 bar from UT2K andthe UNITHERM Database
Collins PLF 1979 Gas hydrates in CO2-bearing 1047298uid inclusions and the use of freezingdata for estimation of salinity Econ Geol 74 1435ndash1444
Deksissa DJ Koeberl C 2005 Geochemistry alteration and genesis of gold mineraliza-tion in the Okote area southern Ethiopia Geochem J 38 307ndash331
Diamond LW 2003 Introduction to gas-bearing aqueous 1047298uid inclusions In Samson IAnderson A Marshall D (Eds) Fluid Inclusions Analysis and interpretation Miner-alogical Association of Canada Short Course Series 32 pp 101ndash158
Drever JI 1997 The Geochemistry of Natural Water Prentice-Hall Upper Saddle RiverNew Jersey
Drobe J Cann RM 2000 CundashAu skarn mineralization Minas de Oro District HondurasCentral America Explor Min Geol 9 51ndash63
Duan Z MoslashllerN WeareJK 1992a An equation of state for theCH4ndashCO2ndashH2O systemI Pure systems from 0 to 1000 degC and 0 to 8000 bar Geochim Cosmochim Acta 562605ndash2617
Duan Z MoslashllerN Weare JK 1992b Anequationof statefor the CH4ndashCO2ndashH2O systemII Mixtures from 50 to 1000 degC and 0 to 1000 bar Geochim Cosmochim Acta 562619ndash2631
Esmaeily D Afshooni SZ Mirnejad H Rashidnejad-e-Omran N 2012 Mass changesduring hydrothermal alteration associated with gold mineralization in the Astanehgranitoid rocks western Iran Geochem Explor Environ Anal 12 161ndash175
Gammons GH Williams-Jones AE 1997 Chemical mobility of Gold in the porphyryndash
epithermal environment Econ Geol 92 45ndash59Garofalo P Matthaumli SK Heinrich C 2002 Three dimensional geometry ore
distribution and time-integrated mass transfer through the quartzndashtourma-linendashgold vein network of the Sigma deposit (Abitibi belt mdash Canada) Geo1047298uids2 217ndash232
Garrabos Y Tufeu R Le Neindre B 1980 Rayleigh and Raman scattering near the crit-ical point of carbon dioxide J Chem Phys 72 (8) 4637ndash4651
Groves DI Goldfarb RJ Robert F Hart CJR 2003 Gold deposits in metamorphicbelts overview of current understanding outstanding problems future researchand exploration signi1047297cance Econ Geol 98 1ndash29
Guzman-Speziale M 2001 Active seismic deformation in the grabens of northern Cen-tral America and its relationship to the relative motion of the North AmericandashCarib-bean plate boundary Tectonophysics 337 39ndash51
Hedenquist JF Reyes AG Simmons SF Taguchi S 1992 The thermal and geochemi-cal structure of geothermal and epithermal systems a framework for interpreting1047298uid inclusion data Eur J Mineral 4 989ndash1015
Heinrich CA Driesner TStefaacutensson ASeward TM 2004 Magmatic vapor contractionand the transport of gold from the porphyry environment to epithermal ore deposits
Geology 32 761ndash764Horne G Clark G Pushkar P 1976 Pre-Cretaceous rocks of northwestern Honduras
basement terrane in Sierra de Omoa AAPG Bull 60 566ndash583Huizenga J-M 2005 COH an Excel Spreadsheet for composition calculations in the Cndash
OndashH 1047298uid system Comput Geosci 31 797ndash800Huizenga J-M 2011 Thermodynamic modelling of a cooling CndashOndashH 1047298uid-graphite sys-
tem implications for hydrothermal graphite precipitation Miner Deposita 46 23ndash33KawakamiY YamamotoJ Kagi H2003 Micro-Ramandensimeterfor CO2 inclusionsin
mantle-derived minerals Appl Spectrom 57 (11) 1333ndash1339Kawashima Y Katagiri G 1995 Fundamentals overtones and combinations in the
Raman spectrum of graphite Phys Rev B 52 10053ndash10059Klein EL Koppe JC Moura CAV 2002 Geology and geochemistry of the Caxis gold
deposit and geochronology of thegold-hosting Caxias Microtonalite Sao Luis Cratonnorthern Brazil J S Am Earth Sci 14 837ndash849
Lin F Bodnar RJ Becker SP 2007 Experimentaldetermination of the RamanCH4 sym-metric stretching (ν1) band position from 1ndash650 bar and 03ndash22 degC application to1047298uid inclusion studies Geochim Cosmochim Acta 71 3746ndash3756
Lu W Chou I-M Burruss RC Song Y 2007 An uni1047297ed equation for calculating meth-ane vapor pressures in the CH4ndashH2O system with measured Raman shifts GeochimCosmochim Acta 71 3969ndash3978
Luque FJ Pasteris JD Wopenka B Rodas M Barrenechea JF 1998 Natural 1047298uid-deposited graphite mineralogical characteristics and mechanisms of formationAm J Sci 298 471ndash498
Mann P Burke K 1984 Neotectonics of the Caribbean Rev Geophys 22 309ndash362Mann P Burke K 1988 Cenozoic rift formation in the northern Caribbean Geology 12
732ndash736MatthewsMJ Pimenta MA Dresselhaus GDresselhaus MS Endo M1999 Originof
the dispersive effects of the Raman D band in carbon materials Phys Rev B 59R6585ndashR6588
Mattioli M Menichetti M Renzulli A Toscani L Salvioli-Mariani E Suarez P 2014Genesis of the hydrothermal gold deposits in the Canan area Lepaguare DistrictHonduras Int J Earth Sci 103 901ndash928
Mikucki EJ 1998 Hydrothermal transport and depositional processes in Archean lode-gold systems a review Ore Geol Rev 13 307ndash321
Mills RA Hugh KE Feray DE Swolfs HC 1967 Mesozoic stratigraphy of HondurasAAPG Bull 51 1711ndash1786
Miur TL 2002 The Hemlo gold deposit Ontario Canada principal deposit characteris-
tics and constraints on mineralization Ore Geol Rev 21 1ndash
66Pasteris JD Chou I-M 1998 Fluid-deposited graphitic inclusions in quartz comparisonbetween KTB (German Continental Deep-Drilling) core samples and arti1047297cially re-equilibrated natural inclusions Geochim Cosmochim Acta 62 109ndash122
Perraki M Proyer A Mposkos E Kaindl R Hoinkes G 2006 Raman micro-spectroscopy on diamond graphite and other carbon polymorphs from theultrahigh-pressure metamorphic Kimi Complex of the Rhodope Metamorphic Prov-ince NE Greece Earth Planet Sci Lett 24 672ndash685
Phillips GN Powell R 2009 Formation of gold deposits review and evaluation of thecontinuum model Earth-Sci Rev 94 1ndash12
Pimenta MA Dresselhaus G Dresselhaus MS Canccedilado LG Jorio A Saito R 2007Studying disorder in graphite-based systems by Raman spectroscopy Phys ChemChem Phys 9 1276ndash1291
Pokrovski GS Akin1047297ev NN Borisova AY Zotov AV Kouzmanov K 2014 Gold spe-ciation and transport in geological 1047298uids insights from experiments and physicalndashchemical modelling Geol Soc Lond Spec Publ httpdxdoiorg101144SP4024(Online First)
Ratschbacher L Franz L Min M Bachmenn R Martens U Stanek K Stubner KNelson BK Herrmann U Weber B Loacutepez-Martiacutenez M Jonckheere R Sperner
255E Salvioli-Mariani et al Journal of Geochemical Exploration 158 (2015) 243ndash 256
7172019 Salvioli et al 2015
httpslidepdfcomreaderfullsalvioli-et-al-2015 1414
B Tichomirowa M McWilliams MO Gordon M Meschede M Bock P 2009 TheNorth AmericanndashCaribbean plate boundary in MeacutexicondashGuatemalandashHonduras In
James KH Lorente MA Pindell JL (Eds) The Origin and Evolution of the Caribbe-an Plate Geological Society London Special Publications 328 pp 219ndash293
Ridley JR Diamond LW 2000 Fluid chemistry of orogenic lode-gold deposits and im-plications for genetic models In Hagemann S Brown PE (Eds) Gold in 2000 Re-views in Economic Geology 13 pp 141ndash162
Ridley J Hagemann SG 1999 Interpretation of post-entrapment 1047298uid-inclusion re-equilibration at the Three Mile Hill Marvel Loch and Grif 1047297ns Find high-temperature lode-gold deposits Yilgran Craton Western Australia Chem Geol154 257ndash278
Robb L 2010 Introduction to Ore-forming Processes Blackwell Publishing Malden USARoberts RJ Irving EM 1957 Mineral deposits of Central America U S Geol Surv Bull1034 205
Roedder E 1984 Fluid inclusions Reviews in Mineralogy 12 Mineralogical Society of America Washington DC
Rogers RD Mann P 2007 Transtensional deformation of the western CaribbeanndashNorthAmerica plate boundary zone In Mann P (Ed) Geologic and Tectonic Developmentof the Caribbean Plate in Northern Central America Geological Society of AmericaSpecial Paper 428 pp 37ndash64
Rogers RD Mann P Emmet PA 2007 Tectonic terranes of the Chortis block based onintegration of regional aeromagnetic and geologic data In Mann P (Ed) Geologicand Tectonic Development of the Caribbean Plate in Northern Central America Geo-logical Society of America Special Paper 428 pp 65ndash88
Roine A 2009 HSC Chemistryreg 70 Users Guide ndash Volume frac12 ndash Chemical Reaction andEquilibrium Software With Extensive Thermochemical Database and Flowsheet Sim-ulation Outotec Information Center Finland
Samson IM Williams-Jones A-E Ault KM Gagnon JE 2008 Source of 1047298uids formingdistal ZnndashPbndashAg skarns evidence from laser ablation-inductively coupled plasma-mass spectrometry analysis of 1047298uid inclusions from El Mochito Honduras Geology
36 947ndash950Satish-Kumar M 2005 Graphite-bearing CO2-1047298uid inclusions in granulites insights on
graphite precipitation and carbon isotope evolution Geochim Cosmochim Acta 69(15) 3841ndash3856
Seitz JF Pasteris JD 1990 Theoretical and practical aspect of differential partitioning of gases by clathrate hydrates in 1047298uid inclusions Geochim Cosmochim Acta 54631ndash639
Shvarov YV 2008 HCh new potentialities for the thermodynamic simulation of geo-chemical systems offered by Windows Geochem Int 46 834ndash839
Sibson RH 1987 Earthquake rupturing as a mineralizing agent in hydrothermal sys-tems Geology 15 701ndash704
Silva-Romo G 2008 GuayapendashPapalutla fault system a continuous Cretaceous structurefrom southern Mexicoto theChortis BlockTectonicimplicationsGeology 3675ndash78
Spooner ETC Bray CJ Wood PC Burrows DR Callan NJ 1987 Aundashquartz vein andCundashAundashAgndashMondashanhydrite mineralization HollingerndashMcIntyre Mine Timmins
Ontario δ13C values (McIntyre) Fluid inclusion gas geochemistry pressure (depth)estimation and H2OndashCO2 phase separation as a precipitation and dilation mecha-nism Ont Geol Surv Misc Pap 136 35ndash56
Su W Xi B Xia B Zhang X Hu R 2008 Visible gold in arsenian pyrite at theShuiyindong Carlin-type gold deposit Guizhou China implications for the environ-ment and processes of ore formation Ore Geol Rev 33 667ndash679
Sundblad K Cumming GL Krstic D 1991 Lead isotope evidence for the formation of epithermalgold quartzveins in theChortis BlockNicaragua Econ Geol 86 944ndash959
Tagirov BR Salvi S Schott J Baranova NN 2005 Experimental study of goldndash
hydrosulphide complexing in aqueous solutions at 350ndash500 degC 500 and 1000 barsusing mineral buffers Geochim Cosmochim Acta 69 (8) 2119ndash2132
ThieryR Vanden Kerkhof AM Dubessy J 1994 vX properties of CH4ndash
CO2 and CO2ndash
N21047298uid inclusions modelling for T b 31 degC and P b 400 bars Eur J Mineral 6 753ndash771
Thomsen C Reich S 2000 Double resonant Raman scattering in graphite Phys RevLett 85 5214ndash5217
Van den Kerkhof AM 1988 The System CO2ndashCH4ndashN2 in Fluid Inclusions TheoreticalModelling and Geochemical Applications (PhD Thesis Amsterdam)
Vanden Kerkhof AM OlsenSN 1990 A natural example of superdense CO2 inclusionsmicrothermometry and Raman analysis Geochim Cosmochim Acta 54 895ndash901
Van den Kerkhof AM Thiery R 2001 Carbonic inclusions Lithos 55 49ndash68Vidano RP Ischbach DB Willis LJ Loehr TM 1981 Observation of Raman band
shifting with excitation wavelength for carbons and graphites Solid State Commun39 341ndash344
Wang X Chou I-M Hu W Burruss RC Sun Q Song Y 2011 Raman spectroscopymeasurements of CO2 density experimental calibration with high-pressure opticalcell (HPOC) and fused silica capillary capsule (FSCC) with application to 1047298uid inclu-sion observations Geochim Cosmochim Acta 75 4080ndash4093
Williams-Jones AE Bowell RJ Migdisov AA 2009 Gold in solution Elements 5281ndash287
Williams-Jones AE Samson IM Ault KM Gagnon JE Fryer BJ 2010 The genesis of
distal zinc skarns evidence from the Mochito deposit Honduras Econ Geol 1051411ndash1440
Wopenka B Pasteris JD 1993 Structural characterization of kerogens to granulite-facies graphite applicability of Raman microprobe spectroscopy Am Mineral 78533ndash557
Yang F Mao J Wang Y Bierlein F 2006 Geology and geochemistry of the Bulongquartzndashbarite vein-type gold deposit in the Xinjiang Uygur Autonomous RegionChina Ore Geol Rev 29 52ndash76
Zhang YG Frantz JD 1987 Determination of the homogenization temperatures anddensities of supercritical 1047298uids in the system NaClndashKClndashCaCl2ndashH2O using synthetic1047298uid inclusions Chem Geol 64 335ndash350
256 E Salvioli-Mariani et al Journal of Geochemical Exploration 158 (2015) 243ndash 256
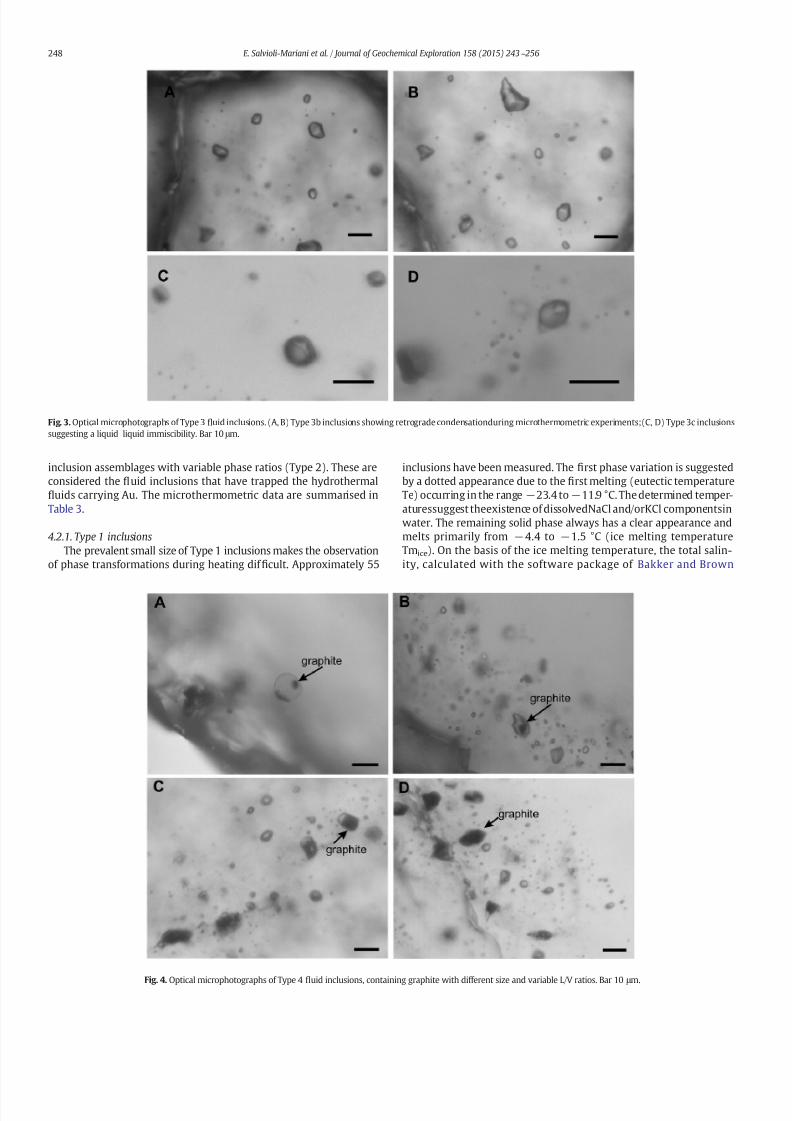
7172019 Salvioli et al 2015
httpslidepdfcomreaderfullsalvioli-et-al-2015 614
inclusion assemblages with variable phase ratios (Type 2) These areconsidered the 1047298uid inclusions that have trapped the hydrothermal1047298uids carrying Au The microthermometric data are summarised inTable 3
421 Type 1 inclusions
The prevalent small size of Type 1 inclusions makes the observationof phase transformations during heating dif 1047297cult Approximately 55
inclusions have been measured The 1047297rst phase variation is suggestedby a dotted appearance due to the 1047297rst melting (eutectic temperatureTe) occurring in the range minus234 to minus119 degC The determined temper-aturessuggest theexistence of dissolvedNaCl andorKCl componentsinwater The remaining solid phase always has a clear appearance andmelts primarily from minus 44 to minus15 degC (ice melting temperatureTmice) On the basis of the ice melting temperature the total salin-ity calculated with the software package of Bakker and Brown
Fig 3 Optical microphotographs of Type 3 1047298uid inclusions (A B) Type 3b inclusions showing retrograde condensationduring microthermometric experiments(C D) Type 3c inclusionssuggesting a liquidndashliquid immiscibility Bar 10 μ m
Fig 4 Optical microphotographs of Type 4 1047298uid inclusions containing graphite with different size and variable LV ratios Bar 10 μ m
248 E Salvioli-Mariani et al Journal of Geochemical Exploration 158 (2015) 243ndash 256
7172019 Salvioli et al 2015
httpslidepdfcomreaderfullsalvioli-et-al-2015 714
(2003) and the equation of Zhang and Frantz (1987) is mainly inthe range 22ndash56 wt NaCl equivalent (rarely b 2 or N 56)(Fig 5B)
The total homogenisation temperature (Thtot) to liquid state occurspredominantly in the range 240ndash336 degC (with median and mode at290 degC Table 3 and Fig 5A)
422 Type 2 inclusions
Analyses were performedon more than 170 inclusions According totheir petrographic features L-rich and V-rich inclusions show differentbehaviour during freezing experiments The L-rich inclusions hereafterreferred to as Type 2a have higher freezing temperatures (minus 50 tominus379 degC) whereas the V-rich inclusions hereafter Type 2b have
Table 3
Summary of the microthermometric data of the studied 1047298uid inclusions
Type Te Tmice Tmcla Tmcarb Thcarb Thtot Salinity XCH4
1 minus234 divide minus 119 20
minus44 divide minus 15 34
240 divide 336 (L)[290 290]55
22 divide 56[32 27]
34
2a minus257 divide minus 111 27
minus76 divide minus 1582
56 divide 13482
250 divide 338 (L)[300 280]60
09 divide 48[35 37]82
005 divide 02011
2b minus282 divide minus 1169
minus71 divide minus 129
60 divide 1869
minus649 divide minus 583 23
180 divide 200 (L) 239 divide minus 100 (V) 293 divide 334 (L)299 divide 334 (V)10
1 divide 62 019 divide 0689
3a minus589 divide minus 583 182 divide 189 (V) 022 divide 10 27 3b minus636 divide minus 627 98 divide 125 (V)
3c minus981 divide minus 733 (V) or liquid immiscibilityminus893 divide minus 719
4 minus250 divide minus 197 minus07 divide minus 04 72 minus635
Temperature in degC Te = eutectic temperature Tmice = ice melting temperature Tmcla = clathrate melting temperature Tmcarb = melting temperature of the carbonic phase Thcarb =
homogenisation of the carbonic phase Thtot = total homogenisation temperature (L) = homogenisation to liquid phase (V) = homogenisation to vapour phase Salinity as wt NaClequivalent XCH4 = molar fraction of methane in the carbonic phase determined by Raman spectrometry In square brackets median and mode values respectively in italics number of measurements
Fig 5 Bar diagrams of microthermometric data (A C E) total homogenisation temperature Th tot (B D) total salinity as NaCl equivalent
249E Salvioli-Mariani et al Journal of Geochemical Exploration 158 (2015) 243ndash 256
7172019 Salvioli et al 2015
httpslidepdfcomreaderfullsalvioli-et-al-2015 814
signi1047297cantly lower freezing temperatures (minus90 to minus 121 degC) and thenucleation of a carbonic vapour bubble on cooling occurs also at verylow temperatures
In Type 2a inclusions the 1047297rst melting temperature (Te) primarilyoccurs between minus 253 and minus111 degC (Table 3) values compatiblewith H2OndashNaCl H2OndashKCl and H2OndashNaClndashKCl systems Due to the for-mation of clathrate upon cooling the ice melting temperature has be-come more dif 1047297cult to measure in practice Most Type 2a inclusions
exhibit ice melting temperatures very similar to those obtained fromType 1 inclusions(in therange minus76 to minus15degC Table 3)In a few inclu-sions ofType 2bit was possibleto obtainTe and Tmice (minus282 to minus116and minus 71 to minus 12 degC respectively Table 3)
In Type 2b inclusions a carbonic vapour bubble appears on coolingat two different temperature intervals ie 10 to 16 degC and minus 121 tominus84 degC Melting of the carbonic phase (Tmcarb) occurs mainly fromminus649 to minus 583 degC suggesting CO2 with other non-condensablegases most likely CH4 in variable proportions Due to the small size of the inclusions the detection of the homogenisation of the carbonicphase (as well as the temperature of homogenisation Thcarb) has beenquite dif 1047297cult to obtain Usually homogenisation to the vapour phaseoccurs at temperature Thcarb from minus 239 to minus10 degC (Table 3) andonly in two cases to liquid phase at higher temperature(Thcarb between18 and 20 degC)
In larger inclusions (approximately20 μ m) we were able to measurethe melting temperature of clathrate we employed the method of Collins (1979) using repeated cooling-heating cycles in proximity of the decomposition temperature of clathrate During microthermometricexperiments the clathrate crystals occur as (i) small crystals around thegaseous bubble (ii) colourless crystals in the aqueous phase (making thedetermination of Tmice dif 1047297cult) and (iii) irregular shape and motion of the gaseous bubble The decomposition temperature of clathrates(Tmcla) in the Type 2a inclusions varies mainly from 56 to 134 degC(Table 3) Where detectable Tmcla in Type 2b inclusions is comparableor higher (60ndash186 degC Table 3) At low pressure CH4 clathrate melts attemperatures higher than 15 degC whereas CO2 clathrate melts at lowertemperatures (b10 degC Seitz and Pasteris 1990 Diamond 2003)
The salinity of Type 2 inclusions was calculated using the melting
temperature of clathrates with the software package of Bakker andBrown (2003) and the equations of Duan et al (1992ab) the resultsare comparable with the values obtained for Type 1 inclusions althoughthey extend towards lower values (09ndash48 and 1ndash62 wt NaClequivalent Fig 5D and Table 3) The composition of the carbonic1047298uid is dif 1047297cult to obtain due to the formation of clathrate duringmicrothermometric experiments
Themost frequent values for Thtot (Table 3) are 250ndash338 degC (medianand mode at 300 degC and 280 degC respectively Type 2a Fig 5C) 293ndash334 degC (to liquid phase Type 2b) and 299ndash334 degC (to vapour phaseType 2b Fig 5E)
423 Type 3 inclusions
Only25 inclusions of the Type 3 havebeeninvestigated Most Type 3
inclusions freeze at very low temperatures below minus 85 degC and down tominus136 degC the extremely low water content rarely allows observation of the changes induced by freezing The carbonic phase melts primarily inthe range minus 636 to minus 583 degC (Table 3) similarly to Type 2b inclusionssuggesting a variable proportion of CO2 with other non-condensablegasesmost likely CH4 The melting temperature (Tmcarb) rarely reacheslower values down to minus 699 degC suggesting high contents of CH4 Onlyone determination gave Tmcarb = minus 569 degC
Thehomogenisation of the carbonic phase to vapour phase occurs atdifferenttemperatures (Table 3)(i) 182ndash189 degC forthe inclusions withthe highest Tmcarb (minus589 to minus 583 degC hereafter 3a) and (ii) 98ndash125 degC for the inclusions melting at lower temperatures (minus636 tominus627 degC hereafter 3b Fig 3A B) The homogenisation temperatureto vapour phase of Type 3b inclusions suggests that Tmcarb should be
greater than approximately minus 62 degC (cf Ridley and Hagemann 1999
Thiery et al 1994 Van den Kerkhof and Thiery 2001) This behaviouris the consequence of retrograde condensation (ie the condensationof liquid under isothermal conditions on lowering pressure) which in-creases the temperature of homogenisation (to the gas phase) of the1047298uid inclusions (with a given composition) to values higher than thecritical temperature (Thiery et al 1994 Van den Kerkhof 1988 Vanden Kerkhof and Thiery 2001)
A further subgroup of Type 3 inclusions (hereafter 3c Table 3 and
Fig 3C D) has a varied behaviour at very low temperatures (minus
981to minus733 degC) they apparently homogenise to thevapourphaseand like-ly to another liquid supporting a case of liquidndashliquidndashgas immiscibility(Thiery et al 1994) At room temperature these inclusions have twophases of similar density (Fig 3C D) In some inclusions a meniscusoccurs in the bubble at temperature from minus 893 to minus 719 degC (whichgradually disappears at approximately minus63 to minus 60 degC) and thecarbonic phase appears darker or takes on a bumpy surface
424 Type 4 inclusions
In rare cases it was possible to obtain data during microthermometricexperiments The obtained temperatures (Tmcarb ~ minus 635 degC Te fromminus250 to minus197 degC Tmice from minus07 to minus04 degC and Tmcla 72 degCTable 3) are fully comparable with those of Type 2 and Type 3 inclusions
43 Micro-Raman spectroscopy
To estimate the entrapment conditions we must know both thecomposition and density of the trapped 1047298uid However as statedabove they are dif 1047297cult to obtain for the occurrence of clathrates Toovercome this problem we determinedthe composition of the carbonicphase using micro-Raman spectroscopy
431 CO 2ndashCH 4 1047298uids
For Raman analysis of the carbonic phase we selected approximate-ly 50 inclusions of Type 2 and 3
The Raman spectra of these inclusions are characterised by (i) theRaman active stretchingmodeν1 at 1278ndash1282 cmminus1 and the overtoneof thebending modeν2 (2ν2)at1380ndash1385 cmminus1 typicalof CO2 (Fig6)
and known asthe Fermi diad (Garrabos et al 1980) and(ii) theisolatedC-H stretching band (ν1) of CH4 at 2907ndash2913 cmminus1 (Fig 6 Burke2001) In the spectral area of reduced sulphur species the backgroundsometimes shows a small hump which might be considered as a smallpeak (insetin Fig6C) It occurs atabout 2610cmminus1 suggestingthe pres-ence of a very small amount of H2S associated to the carbonic vapourphase The detection limit is estimated at 1 mol for H2S
According to the literature (Kawakami et al 2003 Van den Kerkhof and Olsen 1990 Wang et al 2011) the changes of frequency in theRaman spectrare1047298ect variations in pressure1047298uid density and tempera-ture The separation between the two bands (Δν) represents a bettermeasure of CO2 density than the peak positions or the ratio of thepeak positions (Kawakami et al 2003 Wang et al 2011) The mea-sured Δν in our 1047298uid inclusions is 1035ndash104 cmminus1 On the basis of
the equation from Wang et al (2011) valid for the entire range of den-sities(with CH4 le 10 mol) the calculatedCO2 density of the investigat-ed 1047298uid inclusions is in the range 034ndash056 gcm3
Similarly the position of the ν1 band is also in1047298uenced by pressureand temperature variations for CH4 Unfortunately we were unable toobtain reliable density values because the equations proposed in the lit-erature have been calibrated using a 51453 nm laser (Lin et al 2007)and are valid for pure or almost pure CH4 (b10 mol of other compo-nents such as CO2) and CH4ndashH2O systems (Lu et al 2007) which areconditions signi1047297cantly different from those of our systems
On the basis of the microthermometric data we infer that the car-bonic components are present in variable proportions and their molefractions have been determined from Raman spectra according toBurke (2001) That study provides a simple formula that considers
CO2 and CH4 peak areas (both CO2 peaks must be considered) CO2
250 E Salvioli-Mariani et al Journal of Geochemical Exploration 158 (2015) 243ndash 256
7172019 Salvioli et al 2015
httpslidepdfcomreaderfullsalvioli-et-al-2015 914
and CH4 Ramanscattering ef 1047297ciencies andCO2 and CH4 instrumental ef-1047297ciencies for the speci1047297c laser wavelength (6328 nm) The CH4 molefraction (XCH4) varies between 005ndash020 in Type 2a 019ndash068 inType 2b and 022ndash10 in Type 3 inclusions (Table 3)
432 Carbonaceous material
Type 4 inclusions are peculiar because they contain a black solidphase with a lath shape and variable proportions of aqueous liquidphase Based on Raman spectra the solid phase is identi1047297ed as graphite25 Raman spectra were acquired for both solid and liquid phases
Raman spectra of the carbonaceous material are very sensitive tochanges in the order degree The1047297rst order bands of the Raman spectraof carbonaceous material are characterised by the G band at approxi-mately 1580 cmminus1 typical of crystalline or ordered graphite the Dband at approximately 1350 cmminus1 and the Dprime band at approximately1620 cmminus1 typical of disordered or defect bearing carbonaceous mate-rial (Aoya et al 2010 Luque et al 1998 Thomsen and Reich 2000Vidano et al 1981) Carbonaceous materials also exhibit a strong
Raman band in the range 2500ndash
2800 cmminus1
which corresponds to the
overtone of the D band This band appears in the second-order Ramanspectra and is called the Gprime band (Pimenta et al 2007) The decreasein the order degree of graphite is also evident by the development of an asymmetry andbandbroadening in the second-order peak and a de-crease in resolution among its constituent bands (Pasteris and Chou1998) If the position of the G band is not affected by the wavelengthof thelaser the Raman frequency of theD band increases with theexci-tation energy (Kawashima and Katagiri 1995 Matthews et al 1999
Vidano et al 1981) Moreover the ratio of the integrated intensity of the D and G bands (IDIG) decreases with increasing laser energyWith our equipment (λ = 6328 nm) the D band is expected at ap-
proximately 1330 cmminus1 The spectra acquired on Type 4 inclusions(Fig 7A B) have frequencies in the range 1332ndash1336 cmminus1 and1578ndash1581 cmminus1 forD and G bands respectivelyThe Dprime bandis alwayspresent as a shoulder on the high-frequency side of the G peak in therange 1613ndash1620 cmminus1 In the region of second-order bands an unre-solved doublet or a large band at approximately 2664ndash2709 cmminus1 oc-curs The D band is broad with low intensity when compared to the Gband and with a very low IDIG ratio (016ndash030) The degree of crystal-linity is represented by the length of ordered crystals along the a
Fig 6 Ramanspectra ofthe carbonicphase inexample Type 2a(A)Type2b (B)andType3 (C) 1047298uid inclusions The intensity scale of the inset is unchanged
Fig 7 Raman spectraof graphite in Type4 1047298uidinclusions (A B) compared with those of
graphite from wall-rock (C)
251E Salvioli-Mariani et al Journal of Geochemical Exploration 158 (2015) 243ndash 256
7172019 Salvioli et al 2015
httpslidepdfcomreaderfullsalvioli-et-al-2015 1014
crystallographic direction designated as L a (Pasteris and Chou 1998)The IDIG ratio and L a are negatively correlated and the most disorderedgraphite is characterised by the highest IDIG and the lowest L a values(Pasteris and Chou 1998) According to the general formula proposedby Pimenta et al (2007) which can be applied to any laser line we ob-tained the crystallite size L a in the range 1300ndash2400 Aring The calculatedparameters and the widths of the D and Gprime bands suggest a fairly gooddegree of graphite crystallinity which is comparable to that of naturally
or laboratory-produced graphite (Luque et al 1998 Pasteris and Chou1998 Perraki et al 2006 Satish-Kumar 2005 Wopenka and Pasteris1993) The Raman spectra of trapped graphite are all similar ( Fig 7AB) suggesting that the precipitation of graphite occurred from the hy-drothermal 1047298uid
The liquid portion associated with trapped graphite contains CO2CH4 and liquid H2O The typical peaks of CO2 (1280ndash1281 and1383ndash1384 cmminus1) and of CH4 (2910ndash2913 cmminus1) were observedusing the 6328 nm laser (Fig 8A) Moreover the peak for liquid H2Oat 3250ndash3252 cmminus1 was detected with the 4731 nm laser (Fig 8B)
Because of thepresenceof graphite in thehost rocks (quartz-sericiticand graphitic schists) for comparison we acquired 6 Raman spectra onthis carbonaceous materials They are completely different from thoseobtained for the graphite in the 1047298uid inclusions (Fig 7C) The D band(1329ndash1334 cmminus1) has a higherintensitythan that ofgraphitein thein-clusions and sometimes reaches the same intensity as the G band at1580ndash1583 cmminus1 Therefore the IDIG ratios are higher (095ndash208)and L a is lower (200ndash400 Aring) supporting the presence of fairly disor-dered graphite The shape of the spectra and the calculated parametersof graphite from the host rock of Canan are comparable to those of thegraphite from metapelites of chlorite facies (Luque et al 1998Wopenka and Pasteris 1993)
5 Discussion
Four types of 1047298uid inclusions have been found in the quartz crystalsfrom the mineralising veins of Dos Bocas a representative example of
gold deposit at Canan Some 1047298uidinclusions are along fractures crossingone or more crystals (Type 1 S inclusions)The most important1047298uid in-clusions constitute discontinuous trails which can suggest crystalgrowth zones (Type 2) The 1047298uid inclusion associations formed by L-richand V-richinclusions (Type 2 P andPS inclusions) andthe presenceof trails entirely constituted by V-rich inclusions(Type 3 PS andS inclu-sions) suggest that the hydrothermal 1047298uid suffered 1047298uid immiscibility(boiling) The trapped 1047298uid consists of an aqueous solution (H2Ondash
NaClndash
KCl with 09ndash
48 wt NaCl equivalent) plus a CO2ndash
CH4 1047298
uid(80ndash90 mol CO2) As shown by Bowers and Helgeson (1983) a pres-sure drop moves the H2O-carbonic phase solvus towards higher tem-perature which causes a decrease of carbonic gas solubility and theexsolution of CO2 (and CH4) gas from the water-rich 1047298uid according tothe Henrys law In geological environments such as Canan where thetectonics aredominatedby strikendashslip fault systems thefracture forma-tion after deformation causes a rapid and immediate reduction in pres-sure The occurrence of some inclusions naturally decrepitated can beexplained by pressure drop The presence of Type 3b 1047298uid inclusionswhich exhibit retrograde condensation further supports the occurrenceof such a pressure drop
Because of 1047298uid immiscibility the total homogenisation temperaturecan be considered as the trapping temperature Isochores have been re-constructed for Type 2 1047298uid inclusions combining the results frommicrothermometry and Raman analyses using the software package of Bakker and Brown (2003) and the equations of Bakker (1999) andDuan et al (1992b) Trapping pressures of 05ndash14 kbar were obtainedThe coexistence of different types of 1047298uid inclusions and their similarvalues of Th suggest that they can be related to the same hydrothermalprocess which wasresponsiblefor the gold mineralisation at CananThedifferentamounts of water andcarbonic1047298uids inthe inclusions is due tothe 1047298uid immiscibility where the H2O-rich 1047298uid is in Type 2a inclusionsand the CO2ndashCH4-rich 1047298uid in Types 2b and 3 inclusions Finally Type 4inclusions would represent the inclusions (both Type 2 and 3) wherethe conditions for graphite precipitation have been achieved
The graphite of the1047298uid inclusions (Type 4) is similar to that precip-itated from hydrothermal1047298uids This indicates that graphite depositionoccurred before or contemporaneously of the entrapment of the 1047298uid
The degree of crystallinity of graphite in the 1047298uid inclusions is higherthan that observed in the graphite from the host quartz-sericitic andgraphitic schists (Fig 7) Nonetheless this does not exclude the pres-ence of a metamorphic component in the mineralising 1047298uids
Equilibrium of graphite in the hydrothermal1047298uid allows the evalua-tion of oxygen fugacity The calculated atomic ratio XO [O(O + H)] isinthe range 032ndash041 (Fig 9) which is typical of slightly reduced 1047298uids(Cesare 1995 Huizenga 2011) Considering temperatures of 300 degCand pressures of 14 10 and 05 kbar (Tt and Pt respectively) graphitesaturation conditions (aC = 1) and the composition of the carbonicphase as inferred by Raman spectroscopy the calculated f O2 is aboutminus342 log unit (ie about 16 log unit above theQFM buffer) This resultis consistent with that obtained using the HSC chemistry software log f O2 asymp minus376 plusmn 25 which permitted us to calculate also the activity
of dissolved hydrogen ions at equilibrium condition between the con-stituents H2OCO2 CH4 Na+ andClminuspH=29plusmn04Itcanbeobservedthat our estimated pH value is low but this range of acidity is not un-common in1047298uid inclusions (egBenison 2013) including gold deposits(Boiron et al 1999 Pokrovski et al 2014)
According to Roedder (1984)thepHin 1047298uid inclusions can be calcu-lated or determined In the latter case the opening of the 1047298uid inclu-sions implies the loss of the trapped gases It follows that the pH isdetermined on a 1047298uid other than the original and which has undergonebasi1047297cation due to the loss of gas
The composition of Type 2 inclusions plotted in the ternary diagramCOH falls within the stability 1047297eld of graphite (towards the CO2 vertexFig 9) and the 1047298uid associated with graphite in Type 4 inclusions isalso constituted by H2OndashCO2ndashCH4 These features support precipitation
of graphite by the reaction CH4 + CO2rarr
2 C + 2 H2O The decrease of
Fig 8 Raman spectraof the1047298uid portion of Type 4 1047298uid inclusions (A)CO2 and CH4 have
been obtained by 6328 nm laser (B) H2O by 4731 nm laser
252 E Salvioli-Mariani et al Journal of Geochemical Exploration 158 (2015) 243ndash 256
7172019 Salvioli et al 2015
httpslidepdfcomreaderfullsalvioli-et-al-2015 1114
temperature andor the increase of pressure move the reaction towardsthe products In our case a combination of cooling and decompressionacted on the system so that the variation of temperature and pressurecannot be responsible for the precipitation of graphite According toHuizenga (2011) the precipitation of graphite is in1047298uenced by XO
value and oxygen fugacity the best conditions for precipitation areXO = 033 and QFM-2 b log f O2 b QFM + 1 Small variations from
these values prevent the precipitation or cause consumption of earlyprecipitated graphite XO values and f O2 of our Type 2 1047298uid inclusions(see above) agree with the Huizenga (2011) data and indicate thatsome 1047298uid inclusions were able to precipitate graphite
The H2S content and the oxygen fugacity of the hydrothermal 1047298uidsaffect the solubility of gold In H 2S-rich 1047298uids Au(HS)2
minus andAu(HS)deg are the dominant Au-complexes and gold has high solubil-ity (Au N 100 ppb) whereas in H2S-poor 1047298uids the gold solubilitydecreases and AuCl2
minus is the dominant stable complex (Gammonsand Williams-Jones 1997) When the partial pressure of H 2S is1047297xed by the magnetitendashpyrite pair the Au bisulphide complex isstable at T b 450 degC and the chloride complex at higher temperature(Mikucki 1998) At high oxygen fugacity H2S is oxidised and thusthe mobility of gold as bisulphide decreases considerably ( Gammons
and Williams-Jones 1997) Experimental studies at temperatures of 350ndash500 degC and pressures of 05ndash1 kbar have shown that Au(HS)2
minus isthe dominant Au complex in near neutral to weakly acidic solutions inthe presence of the K-feldsparndashmuscovitendashquartz mineral associationand at pyritendashpyrrhotitendashmagnetite buffer conditions (Tagirov et al2005)
Many of the conditions employed in the experiments mentionedabove match those of the Canan ore deposit 1047298uid inclusions indicatethe presence of low salinity and low temperature (T b 400 degC) hydro-thermal 1047298uids and XRD data (Mattioli et al 2014) show that the wall-rocks contain the K-feldsparndashmuscovitendashquartzndashpyritendashpyrrothitendashmagnetite association (Table 1) However the hydrothermal 1047298uids atCanan seem to be extremely acidic (pH = 29) which makes Au(HS)degmore stable than Au(HS)2
minus and themost abundant complex in thesolu-
tions (cf also Heinrich et al 2004 Pokrovski et al 2014) Hence we
infer that the gold of Canan was transported by hydrothermal 1047298uids asAu(HS)deg complex
Activity diagrams are a powerful graphical tool for depicting the sta-bility of dissolved species and solid and gas phases with respect to thecomposition of the coexisting solution Calculations on Au speciationwere performed under the mean conditions estimated by the analysisof the 1047298uid inclusions and the results plotted in log f O2-pH diagrams(Fig 10) The decrease in solubility of the Aundashsulphide complexes can
be ascribed both to the fracturation-induced pressure drop andthe con-centration of sulphur in solution According to Mattioli et al (2014) thegold deposit of Canan was formed by the hydrothermal 1047298uid activityalong fractures produced by tectonics Opening and lateral expansionof the fractures produce a pressure drop on the 1047298uids themselves andboiling of the dissolved gases The 1047298uid composition affects the depthof boiling which is an ef 1047297cient mechanism for gold precipitation(Hedenquist et al 1992 Pokrovski et al 2014 Robb 2010 Sibson1987) Boiling produced the exsolution of H2S which in turn caused adecrease in the solubility of theAundashsulphide complexes and the precip-itation of gold (Fig 10) In the case of the Canan deposit boiling repre-sents only the initial phase of gold deposition In fact the main bodyof thegoldmineof Canan is located in metamorphic rocks cutby quartzveins where hydrothermal 1047298uids altered the primary mineralogy andchanged their composition and ability to carry gold in solution In theore deposit Au coexists with sulphides and in particular small grainsof pure gold are surrounded by pyriteand other sulphides This suggeststhat gold was deposited by reactions involving 1047298uids containing Au-Scomplexes and the wall-rock containing chalcophile elements particu-larly Fe a process known as ldquosulphidationrdquo (Williams-Jones et al 2009and references therein Robb 2010) At Canan Fe is abundant in freshwall-rocksfor thepresence of biotiteand chloriteThese minerals disap-pear in the vicinity of quartz veins of the ore deposit where the highestconcentration of gold and sulphides are observed (Mattioli et al 2014)During the alteration of biotite and chlorite Fe is released into the hy-drothermal 1047298uids and likely produces the following reaction with theAundashsulphide complexes
AuethHSTHORN∘ethaqTHORN thorn 05Fe2thornharr05FeS2ethPyriteTHORN thorn H
thorn thorn Au∘ethGoldTHORN eth1THORN
Under equilibrium conditions and assumingP = 1400barT = 300 degCand the water activity H2O = 1 the resulting log K is 53151 (ΔGdeg-R = minus 5833 kJ molminus1) The high value of the equilibrium constant Kand the highly negative value of ΔGdegR indicate that the reaction has aspontaneous tendency towards the products According to Robb (2010)these reactions occur in dynamic systems where kinetics predominatesover equilibrium conditions Therefore it is very unlikely that reaction(1) occurs under equilibrium conditions in an open natural system Be-cause of the continuous supply of Au(HS)deg from the hydrothermal 1047298uidsand Fe2+ from the alteration of biotite and chlorite (within the zones of 1047298uid-rock interaction) reaction (1) is imbalanced and pushed towardsthe products by favouring the deposition of gold and sulphides This isin agreement with Pokrovski et al (2014) who state that the interactionof sulphur-rich hydrothermal 1047298uids and Fe2+-rich wall rocks(sulphidation) is one of the main processes leading to the precipitationof gold
Additionally the activity of sulphur in the 1047298uids is responsible forthe solubilisation and transport of gold At Canan the activity of Sought to be at least 10minus2 Above this value the composition of hydro-thermal 1047298uid plots in the stability 1047297eld of Au(HS)deg (Fig 10) Withlower concentrations of S (and lower pressure) the transportof gold oc-curs as chloride (Fig 10L M and N) If iron is no longer available aftercomplete alteration of biotite and chlorite the deposition of goldcould be represented by the reaction
AuethHSTHORN∘ethaqTHORN thorn 05H2ethgTHORNharrH2SethgTHORN thorn Au∘ethGoldTHORN eth2THORN
where log K = 69130 (ΔGdegR = minus 7586 kJ molminus1) at T = 300 degC and
P = 1400 bar indicates once again a spontaneous tendency towards
Fig 9 Ternary CndashOndashH diagramshowing thecarbon saturatedsurface (solid line) at 300degCand1400 barcalculated by Perple_Xsoftware(J Connollywwwperplexethzch) Dashedlines represent the compositional triangle H2OndashCO2ndashCH4 dotted 1047297eld Type 2a inclusionsstriped 1047297eld Type 2b inclusions Lines of constant XO 035 and 040 (dot-dashed lines) arealso shownTheopencircles andthenumbers initalics indicate f O2
1047298uid relative toQFM buff-er in log10 units (log f O2
1047298uidndashlog f O2
QFM) for 1047298uids in equilibrium with graphite
253E Salvioli-Mariani et al Journal of Geochemical Exploration 158 (2015) 243ndash 256
7172019 Salvioli et al 2015
httpslidepdfcomreaderfullsalvioli-et-al-2015 1214
theproducts andthe presence of H2 agrees with the reducing conditions(log f O2 asymp minus376) found in the hydrothermal 1047298uids of Canan Reaction(2) would be effective during boiling andor decompression (cf Boyle1969 Pokrovski et al 2014) Similarly to reaction (1) the dynamicsystem conditions (the continuous supply of Au(HS)deg and loss of H2S)favour the kinetic of the reaction (2) and con1047297rm the statements of Robb (2010) and Sibson (1987) on the ef 1047297ciency of this process forgold deposition Finally the kinetics of reaction (1) is further increasedby the alteration of feldspar and muscovite in kaolinite and diaspore (cfMattioli et al 2014) The mineral alterations subtract H+ from the solu-
tion (Drever 1997) favouring the precipitation of Au
6 Concluding remarks
The quartz veins associated with gold mineralisations from DosBocas (Canan area Lepaguare District east-central Honduras) are richin 1047298uid inclusions of four main types Type 1 mdash S two-phaseaqueous-rich inclusions Type 2 mdash P to PS aqueous-rich inclusionswith an H2O-rich liquid and a CO2ndashCH4-bearing liquid Type 3 mdash PSto S CO2ndashCH4-rich inclusions with a very small amount of waterand Type 4 mdash graphite-bearing aqueousndashcarbonic 1047298uid
The association of L-rich and V-rich inclusions (Type 2) and the oc-currence of trails containing only V-rich inclusions (Type 3) support a
1047298uid immiscibility (boiling)of the hydrothermal1047298uidThe hydrothermal
trapped 1047298uid is constituted by H2O + alkali chloride + CO2 plusmn CH4 Thecalculated salinity varies from 09 to 48 wt NaCl equivalent
The immiscibility of 1047298uids can be related to a pressure decrease dueto both the opening of fractures and upward 1047298ow of 1047298uids At Canan astrikendashslip fault systemis responsible for the fracturing of the metamor-phic wall-rocks Thisgeological setting with the mineralogicalpetrolog-ical and geochemical features supports an orogenic character of theinvestigated gold deposits
In some 1047298uid inclusions the occurrence of graphite with typical fea-tures of graphite precipitated from hydrothermal 1047298uids suggests that
the deposition of graphite was prior or concomitant with the entrap-ment of the 1047298uid Moreover the occurrence of graphite associated towater andcarbonic1047298uidssupports the presence of a metamorphic com-ponent in the mineralising 1047298uid
Microthermometric and spectroscopic data from 1047298uid inclusionssuggest that the gold mineralisations at Canan formed at T = 300 degCunderP=500ndash1400 barsThecalculated oxygenfugacityand pH valuesof the hydrothermal 1047298uids are approximately minus 376 plusmn 25 log unit(1 log unit above the QFM buffer) and 29 plusmn 04 respectively
The hydrothermal 1047298uids contained sulphur (activity of S ge 10minus2)assuggested by the association of gold with sulphides including pyriteand chalcopyrite For the above chemical and physical conditions themost abundant sulphur specie carrying gold in solution is the Au(HS)degcomplex Several causes are responsible for the precipitation of gold in
the Canan area 1 mdash boiling following the pressure drop caused by
Fig 10 Activity diagrams for the system AundashCndashClndashSndashH2O at 300 degC Au and H2O activity 10minus7 (~10 ppb) and 100 respectively Cl 10minus098 and C buffered by graphite (see ldquoCalculationmethodsrdquo) Variable values of pressure are considered 1400 bar (A B C and D) 1000 bar (E F G and H) 500 bar (I L M and N) Activities of total dissolved S are 10minus1 (A E and I)10minus2 (B F and L) 10minus3 (C G and M) and buffered by pyrite (D H and N) Green 1047297eld represents the mean composition of the 1047298uid inclusions (pH = 29 plusmn 04 log f O2 = minus 376 plusmn25) Red lines limit the 1047297elds of Au species dashed black lines the S species and dashed blue lines the carbon species The thickness of the red lines corresponds to an uncertainty of log [Au] = plusmn01 or log [H2O] = plusmn02
254 E Salvioli-Mariani et al Journal of Geochemical Exploration 158 (2015) 243ndash 256
7172019 Salvioli et al 2015
httpslidepdfcomreaderfullsalvioli-et-al-2015 1314
tectonic andor hydrothermal 1047298uids activity 2 mdash sulphidation triggeredby the liberation of metal cations during the alteration of ma1047297c min-erals of the wall-rocks 3 mdash hydrothermal alteration of feldspars andphyllosilicates of the wall-rocks
Acknowledgements
The authors wish to thank M Menichetti for providing samples of
the quartz veins and the Goldlake Group for the permission to publishthe results of this study Special thanks are due to John Ridley for theuseful and encouraging suggestions which have noticeably improvedthequality of this paperSincere thanksare dueto BJStacey forimprov-ing the English
References
Alvarez-Gogravemez JA Meijer PT Martigravenez-Digraveaz JJ Capote R2008 Constraintsfrom1047297nite element modeling on the active tectonics of northern Central America andthe Middle America Trench Tectonics 27 TC1008 httpdxdoiorg1010292007TC002162
Andrada de Palomera P van Ruitenbeek FJA van der Meer FK Fernaacutendez R 2012Geochemical indicators of gold-rich zones in the La Jose1047297na epithermal depositDeseado Massif Argentina Ore Geol Rev 45 61ndash80
Aoya M Kouketsu Y Endo S Shimizu H Mizukami T Nakamura D Wallis S 2010Extending the applicability of the Raman carbonaceous-material geothermometer
using data from contact metamorphic rocks J Metamorph Geol 28 895ndash914Bakker RJ 1999 Adaptation of the Bowers and Helgeson (1983) equation of state to the
H2OndashCO2ndashCH4ndashN2ndashNaCl system Chem Geol 154 225ndash236Bakker RJ Brown PE 2003 Computer modelling in 1047298uid inclusion research In
Samson I Anderson A Marshall D (Eds) Fluid Inclusions Analysis and interpreta-tion Mineralogical Association of Canada Short Course Series 32 pp 175ndash212
Benison KC 2013 Acid saline 1047298uid inclusions examples from modern and Permianextreme lake systems Geo1047298uids 13 579ndash593
Bersani D Salvioli-Mariani E Mattioli M Menichetti M Lottici PP 2009 Raman andmicro-thermometric investigation of the 1047298uid inclusions in quartz in a gold-richformation from Lepaguare mining district Spectrochim Acta A 73 443ndash449
Bethke CM Yeakel S 2008 The Geochemists Workbenchreg mdash Release 7 GWB Essen-tials Guide mdash Hydrogeology Program University of Illinois (100 pp)
Bodnar RJ Reynolds TJ Kuehn CA 1985 Fluid-inclusion systematics in epithermalsystems In Berger BR Bethke PM (Eds) Geology and Geochemistry of Epithermal Systems Reviews in Economic Geology 2 pp 73ndash97
Boiron MC Cathelineau M Essarraj S Lespinasse M Sellier E 1991 Characterizationof the relationships between deformation 1047298uid migration and Au deposition in
quartz veins methodology and modelling Proceedings Gold 91 AA BalkemaPublishers Brazil pp 637ndash643Boiron MC Moissette A Cathelineau M Banks D Monnin C Dubessy J 1999
Detailed determination of palaeo1047298uid chemistry an integrated study of sulphate-volatile rich brines and aquo-carbonic 1047298uids in quartz veins from Ouro Fino(Brazil) Chem Geol 154 179ndash192
Botros NS 2004 A new classi1047297cation of the gold deposits of Egypt Ore Geol Rev 251ndash37
Bowers TS Helgeson HW 1983 Calculation of the thermodynamic and geochemicalconsequences of nonideal mixing in the system H2OndashCO2ndashNaCl on phase relationsin geological systems equation of state for H 2OndashCO2ndashNaCl 1047298uids at high pressuresand temperatures Geochim Cosmochim Acta 47 1247ndash1275
Boyle RW 1969 Hydrothermal transport and deposition of gold Econ Geol 64112ndash115
Burke EAJ 2001 Raman microspectrometry of 1047298uid inclusions Lithos 55 139ndash158Callaghan T 2001 Geology and host-rock alteration of the Henty and Mount Julia gold
deposits western Tasmania Econ Geol 96 (5) 1073ndash1088Carpenter RH 1954 Geology and ore deposits of the Rosario mining district and San
Juancito Mountains Honduras Central America Geol Soc Am Bull 65 23ndash28
Cepedal A Fuertes-Fuente M Martiacuten-Izard A Garciacutea-Nieto J Boiron MC 2013 Anintrusion-related gold deposit (IRGD) in the NW of Spain the Linares deposit igne-ous rocks veins and related alterations ore features and 1047298uids involved
J Geochem Explor 124 101ndash126Cesare B 1995 Graphite precipitation in CndashOndashH 1047298uid inclusions closed system compo-
sitional and density changes and thermobarometric implications Contrib MineralPetrol 122 25ndash33
Cleverley JS Bastrakov EN 2005 K2GWB Utility for Generating Thermodynamic DataFiles for the GeochemistsWorkbenchregat 0ndash1000 degC and 1ndash5000 bar from UT2K andthe UNITHERM Database
Collins PLF 1979 Gas hydrates in CO2-bearing 1047298uid inclusions and the use of freezingdata for estimation of salinity Econ Geol 74 1435ndash1444
Deksissa DJ Koeberl C 2005 Geochemistry alteration and genesis of gold mineraliza-tion in the Okote area southern Ethiopia Geochem J 38 307ndash331
Diamond LW 2003 Introduction to gas-bearing aqueous 1047298uid inclusions In Samson IAnderson A Marshall D (Eds) Fluid Inclusions Analysis and interpretation Miner-alogical Association of Canada Short Course Series 32 pp 101ndash158
Drever JI 1997 The Geochemistry of Natural Water Prentice-Hall Upper Saddle RiverNew Jersey
Drobe J Cann RM 2000 CundashAu skarn mineralization Minas de Oro District HondurasCentral America Explor Min Geol 9 51ndash63
Duan Z MoslashllerN WeareJK 1992a An equation of state for theCH4ndashCO2ndashH2O systemI Pure systems from 0 to 1000 degC and 0 to 8000 bar Geochim Cosmochim Acta 562605ndash2617
Duan Z MoslashllerN Weare JK 1992b Anequationof statefor the CH4ndashCO2ndashH2O systemII Mixtures from 50 to 1000 degC and 0 to 1000 bar Geochim Cosmochim Acta 562619ndash2631
Esmaeily D Afshooni SZ Mirnejad H Rashidnejad-e-Omran N 2012 Mass changesduring hydrothermal alteration associated with gold mineralization in the Astanehgranitoid rocks western Iran Geochem Explor Environ Anal 12 161ndash175
Gammons GH Williams-Jones AE 1997 Chemical mobility of Gold in the porphyryndash
epithermal environment Econ Geol 92 45ndash59Garofalo P Matthaumli SK Heinrich C 2002 Three dimensional geometry ore
distribution and time-integrated mass transfer through the quartzndashtourma-linendashgold vein network of the Sigma deposit (Abitibi belt mdash Canada) Geo1047298uids2 217ndash232
Garrabos Y Tufeu R Le Neindre B 1980 Rayleigh and Raman scattering near the crit-ical point of carbon dioxide J Chem Phys 72 (8) 4637ndash4651
Groves DI Goldfarb RJ Robert F Hart CJR 2003 Gold deposits in metamorphicbelts overview of current understanding outstanding problems future researchand exploration signi1047297cance Econ Geol 98 1ndash29
Guzman-Speziale M 2001 Active seismic deformation in the grabens of northern Cen-tral America and its relationship to the relative motion of the North AmericandashCarib-bean plate boundary Tectonophysics 337 39ndash51
Hedenquist JF Reyes AG Simmons SF Taguchi S 1992 The thermal and geochemi-cal structure of geothermal and epithermal systems a framework for interpreting1047298uid inclusion data Eur J Mineral 4 989ndash1015
Heinrich CA Driesner TStefaacutensson ASeward TM 2004 Magmatic vapor contractionand the transport of gold from the porphyry environment to epithermal ore deposits
Geology 32 761ndash764Horne G Clark G Pushkar P 1976 Pre-Cretaceous rocks of northwestern Honduras
basement terrane in Sierra de Omoa AAPG Bull 60 566ndash583Huizenga J-M 2005 COH an Excel Spreadsheet for composition calculations in the Cndash
OndashH 1047298uid system Comput Geosci 31 797ndash800Huizenga J-M 2011 Thermodynamic modelling of a cooling CndashOndashH 1047298uid-graphite sys-
tem implications for hydrothermal graphite precipitation Miner Deposita 46 23ndash33KawakamiY YamamotoJ Kagi H2003 Micro-Ramandensimeterfor CO2 inclusionsin
mantle-derived minerals Appl Spectrom 57 (11) 1333ndash1339Kawashima Y Katagiri G 1995 Fundamentals overtones and combinations in the
Raman spectrum of graphite Phys Rev B 52 10053ndash10059Klein EL Koppe JC Moura CAV 2002 Geology and geochemistry of the Caxis gold
deposit and geochronology of thegold-hosting Caxias Microtonalite Sao Luis Cratonnorthern Brazil J S Am Earth Sci 14 837ndash849
Lin F Bodnar RJ Becker SP 2007 Experimentaldetermination of the RamanCH4 sym-metric stretching (ν1) band position from 1ndash650 bar and 03ndash22 degC application to1047298uid inclusion studies Geochim Cosmochim Acta 71 3746ndash3756
Lu W Chou I-M Burruss RC Song Y 2007 An uni1047297ed equation for calculating meth-ane vapor pressures in the CH4ndashH2O system with measured Raman shifts GeochimCosmochim Acta 71 3969ndash3978
Luque FJ Pasteris JD Wopenka B Rodas M Barrenechea JF 1998 Natural 1047298uid-deposited graphite mineralogical characteristics and mechanisms of formationAm J Sci 298 471ndash498
Mann P Burke K 1984 Neotectonics of the Caribbean Rev Geophys 22 309ndash362Mann P Burke K 1988 Cenozoic rift formation in the northern Caribbean Geology 12
732ndash736MatthewsMJ Pimenta MA Dresselhaus GDresselhaus MS Endo M1999 Originof
the dispersive effects of the Raman D band in carbon materials Phys Rev B 59R6585ndashR6588
Mattioli M Menichetti M Renzulli A Toscani L Salvioli-Mariani E Suarez P 2014Genesis of the hydrothermal gold deposits in the Canan area Lepaguare DistrictHonduras Int J Earth Sci 103 901ndash928
Mikucki EJ 1998 Hydrothermal transport and depositional processes in Archean lode-gold systems a review Ore Geol Rev 13 307ndash321
Mills RA Hugh KE Feray DE Swolfs HC 1967 Mesozoic stratigraphy of HondurasAAPG Bull 51 1711ndash1786
Miur TL 2002 The Hemlo gold deposit Ontario Canada principal deposit characteris-
tics and constraints on mineralization Ore Geol Rev 21 1ndash
66Pasteris JD Chou I-M 1998 Fluid-deposited graphitic inclusions in quartz comparisonbetween KTB (German Continental Deep-Drilling) core samples and arti1047297cially re-equilibrated natural inclusions Geochim Cosmochim Acta 62 109ndash122
Perraki M Proyer A Mposkos E Kaindl R Hoinkes G 2006 Raman micro-spectroscopy on diamond graphite and other carbon polymorphs from theultrahigh-pressure metamorphic Kimi Complex of the Rhodope Metamorphic Prov-ince NE Greece Earth Planet Sci Lett 24 672ndash685
Phillips GN Powell R 2009 Formation of gold deposits review and evaluation of thecontinuum model Earth-Sci Rev 94 1ndash12
Pimenta MA Dresselhaus G Dresselhaus MS Canccedilado LG Jorio A Saito R 2007Studying disorder in graphite-based systems by Raman spectroscopy Phys ChemChem Phys 9 1276ndash1291
Pokrovski GS Akin1047297ev NN Borisova AY Zotov AV Kouzmanov K 2014 Gold spe-ciation and transport in geological 1047298uids insights from experiments and physicalndashchemical modelling Geol Soc Lond Spec Publ httpdxdoiorg101144SP4024(Online First)
Ratschbacher L Franz L Min M Bachmenn R Martens U Stanek K Stubner KNelson BK Herrmann U Weber B Loacutepez-Martiacutenez M Jonckheere R Sperner
255E Salvioli-Mariani et al Journal of Geochemical Exploration 158 (2015) 243ndash 256
7172019 Salvioli et al 2015
httpslidepdfcomreaderfullsalvioli-et-al-2015 1414
B Tichomirowa M McWilliams MO Gordon M Meschede M Bock P 2009 TheNorth AmericanndashCaribbean plate boundary in MeacutexicondashGuatemalandashHonduras In
James KH Lorente MA Pindell JL (Eds) The Origin and Evolution of the Caribbe-an Plate Geological Society London Special Publications 328 pp 219ndash293
Ridley JR Diamond LW 2000 Fluid chemistry of orogenic lode-gold deposits and im-plications for genetic models In Hagemann S Brown PE (Eds) Gold in 2000 Re-views in Economic Geology 13 pp 141ndash162
Ridley J Hagemann SG 1999 Interpretation of post-entrapment 1047298uid-inclusion re-equilibration at the Three Mile Hill Marvel Loch and Grif 1047297ns Find high-temperature lode-gold deposits Yilgran Craton Western Australia Chem Geol154 257ndash278
Robb L 2010 Introduction to Ore-forming Processes Blackwell Publishing Malden USARoberts RJ Irving EM 1957 Mineral deposits of Central America U S Geol Surv Bull1034 205
Roedder E 1984 Fluid inclusions Reviews in Mineralogy 12 Mineralogical Society of America Washington DC
Rogers RD Mann P 2007 Transtensional deformation of the western CaribbeanndashNorthAmerica plate boundary zone In Mann P (Ed) Geologic and Tectonic Developmentof the Caribbean Plate in Northern Central America Geological Society of AmericaSpecial Paper 428 pp 37ndash64
Rogers RD Mann P Emmet PA 2007 Tectonic terranes of the Chortis block based onintegration of regional aeromagnetic and geologic data In Mann P (Ed) Geologicand Tectonic Development of the Caribbean Plate in Northern Central America Geo-logical Society of America Special Paper 428 pp 65ndash88
Roine A 2009 HSC Chemistryreg 70 Users Guide ndash Volume frac12 ndash Chemical Reaction andEquilibrium Software With Extensive Thermochemical Database and Flowsheet Sim-ulation Outotec Information Center Finland
Samson IM Williams-Jones A-E Ault KM Gagnon JE 2008 Source of 1047298uids formingdistal ZnndashPbndashAg skarns evidence from laser ablation-inductively coupled plasma-mass spectrometry analysis of 1047298uid inclusions from El Mochito Honduras Geology
36 947ndash950Satish-Kumar M 2005 Graphite-bearing CO2-1047298uid inclusions in granulites insights on
graphite precipitation and carbon isotope evolution Geochim Cosmochim Acta 69(15) 3841ndash3856
Seitz JF Pasteris JD 1990 Theoretical and practical aspect of differential partitioning of gases by clathrate hydrates in 1047298uid inclusions Geochim Cosmochim Acta 54631ndash639
Shvarov YV 2008 HCh new potentialities for the thermodynamic simulation of geo-chemical systems offered by Windows Geochem Int 46 834ndash839
Sibson RH 1987 Earthquake rupturing as a mineralizing agent in hydrothermal sys-tems Geology 15 701ndash704
Silva-Romo G 2008 GuayapendashPapalutla fault system a continuous Cretaceous structurefrom southern Mexicoto theChortis BlockTectonicimplicationsGeology 3675ndash78
Spooner ETC Bray CJ Wood PC Burrows DR Callan NJ 1987 Aundashquartz vein andCundashAundashAgndashMondashanhydrite mineralization HollingerndashMcIntyre Mine Timmins
Ontario δ13C values (McIntyre) Fluid inclusion gas geochemistry pressure (depth)estimation and H2OndashCO2 phase separation as a precipitation and dilation mecha-nism Ont Geol Surv Misc Pap 136 35ndash56
Su W Xi B Xia B Zhang X Hu R 2008 Visible gold in arsenian pyrite at theShuiyindong Carlin-type gold deposit Guizhou China implications for the environ-ment and processes of ore formation Ore Geol Rev 33 667ndash679
Sundblad K Cumming GL Krstic D 1991 Lead isotope evidence for the formation of epithermalgold quartzveins in theChortis BlockNicaragua Econ Geol 86 944ndash959
Tagirov BR Salvi S Schott J Baranova NN 2005 Experimental study of goldndash
hydrosulphide complexing in aqueous solutions at 350ndash500 degC 500 and 1000 barsusing mineral buffers Geochim Cosmochim Acta 69 (8) 2119ndash2132
ThieryR Vanden Kerkhof AM Dubessy J 1994 vX properties of CH4ndash
CO2 and CO2ndash
N21047298uid inclusions modelling for T b 31 degC and P b 400 bars Eur J Mineral 6 753ndash771
Thomsen C Reich S 2000 Double resonant Raman scattering in graphite Phys RevLett 85 5214ndash5217
Van den Kerkhof AM 1988 The System CO2ndashCH4ndashN2 in Fluid Inclusions TheoreticalModelling and Geochemical Applications (PhD Thesis Amsterdam)
Vanden Kerkhof AM OlsenSN 1990 A natural example of superdense CO2 inclusionsmicrothermometry and Raman analysis Geochim Cosmochim Acta 54 895ndash901
Van den Kerkhof AM Thiery R 2001 Carbonic inclusions Lithos 55 49ndash68Vidano RP Ischbach DB Willis LJ Loehr TM 1981 Observation of Raman band
shifting with excitation wavelength for carbons and graphites Solid State Commun39 341ndash344
Wang X Chou I-M Hu W Burruss RC Sun Q Song Y 2011 Raman spectroscopymeasurements of CO2 density experimental calibration with high-pressure opticalcell (HPOC) and fused silica capillary capsule (FSCC) with application to 1047298uid inclu-sion observations Geochim Cosmochim Acta 75 4080ndash4093
Williams-Jones AE Bowell RJ Migdisov AA 2009 Gold in solution Elements 5281ndash287
Williams-Jones AE Samson IM Ault KM Gagnon JE Fryer BJ 2010 The genesis of
distal zinc skarns evidence from the Mochito deposit Honduras Econ Geol 1051411ndash1440
Wopenka B Pasteris JD 1993 Structural characterization of kerogens to granulite-facies graphite applicability of Raman microprobe spectroscopy Am Mineral 78533ndash557
Yang F Mao J Wang Y Bierlein F 2006 Geology and geochemistry of the Bulongquartzndashbarite vein-type gold deposit in the Xinjiang Uygur Autonomous RegionChina Ore Geol Rev 29 52ndash76
Zhang YG Frantz JD 1987 Determination of the homogenization temperatures anddensities of supercritical 1047298uids in the system NaClndashKClndashCaCl2ndashH2O using synthetic1047298uid inclusions Chem Geol 64 335ndash350
256 E Salvioli-Mariani et al Journal of Geochemical Exploration 158 (2015) 243ndash 256
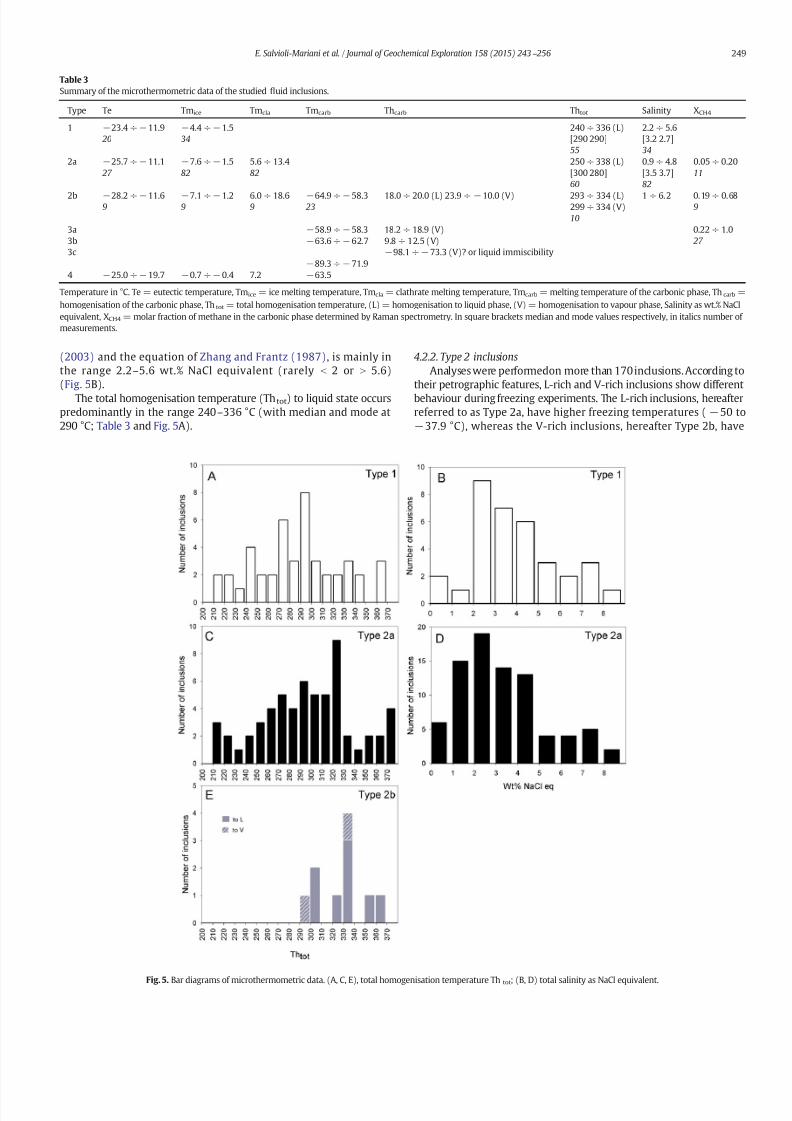
7172019 Salvioli et al 2015
httpslidepdfcomreaderfullsalvioli-et-al-2015 714
(2003) and the equation of Zhang and Frantz (1987) is mainly inthe range 22ndash56 wt NaCl equivalent (rarely b 2 or N 56)(Fig 5B)
The total homogenisation temperature (Thtot) to liquid state occurspredominantly in the range 240ndash336 degC (with median and mode at290 degC Table 3 and Fig 5A)
422 Type 2 inclusions
Analyses were performedon more than 170 inclusions According totheir petrographic features L-rich and V-rich inclusions show differentbehaviour during freezing experiments The L-rich inclusions hereafterreferred to as Type 2a have higher freezing temperatures (minus 50 tominus379 degC) whereas the V-rich inclusions hereafter Type 2b have
Table 3
Summary of the microthermometric data of the studied 1047298uid inclusions
Type Te Tmice Tmcla Tmcarb Thcarb Thtot Salinity XCH4
1 minus234 divide minus 119 20
minus44 divide minus 15 34
240 divide 336 (L)[290 290]55
22 divide 56[32 27]
34
2a minus257 divide minus 111 27
minus76 divide minus 1582
56 divide 13482
250 divide 338 (L)[300 280]60
09 divide 48[35 37]82
005 divide 02011
2b minus282 divide minus 1169
minus71 divide minus 129
60 divide 1869
minus649 divide minus 583 23
180 divide 200 (L) 239 divide minus 100 (V) 293 divide 334 (L)299 divide 334 (V)10
1 divide 62 019 divide 0689
3a minus589 divide minus 583 182 divide 189 (V) 022 divide 10 27 3b minus636 divide minus 627 98 divide 125 (V)
3c minus981 divide minus 733 (V) or liquid immiscibilityminus893 divide minus 719
4 minus250 divide minus 197 minus07 divide minus 04 72 minus635
Temperature in degC Te = eutectic temperature Tmice = ice melting temperature Tmcla = clathrate melting temperature Tmcarb = melting temperature of the carbonic phase Thcarb =
homogenisation of the carbonic phase Thtot = total homogenisation temperature (L) = homogenisation to liquid phase (V) = homogenisation to vapour phase Salinity as wt NaClequivalent XCH4 = molar fraction of methane in the carbonic phase determined by Raman spectrometry In square brackets median and mode values respectively in italics number of measurements
Fig 5 Bar diagrams of microthermometric data (A C E) total homogenisation temperature Th tot (B D) total salinity as NaCl equivalent
249E Salvioli-Mariani et al Journal of Geochemical Exploration 158 (2015) 243ndash 256
7172019 Salvioli et al 2015
httpslidepdfcomreaderfullsalvioli-et-al-2015 814
signi1047297cantly lower freezing temperatures (minus90 to minus 121 degC) and thenucleation of a carbonic vapour bubble on cooling occurs also at verylow temperatures
In Type 2a inclusions the 1047297rst melting temperature (Te) primarilyoccurs between minus 253 and minus111 degC (Table 3) values compatiblewith H2OndashNaCl H2OndashKCl and H2OndashNaClndashKCl systems Due to the for-mation of clathrate upon cooling the ice melting temperature has be-come more dif 1047297cult to measure in practice Most Type 2a inclusions
exhibit ice melting temperatures very similar to those obtained fromType 1 inclusions(in therange minus76 to minus15degC Table 3)In a few inclu-sions ofType 2bit was possibleto obtainTe and Tmice (minus282 to minus116and minus 71 to minus 12 degC respectively Table 3)
In Type 2b inclusions a carbonic vapour bubble appears on coolingat two different temperature intervals ie 10 to 16 degC and minus 121 tominus84 degC Melting of the carbonic phase (Tmcarb) occurs mainly fromminus649 to minus 583 degC suggesting CO2 with other non-condensablegases most likely CH4 in variable proportions Due to the small size of the inclusions the detection of the homogenisation of the carbonicphase (as well as the temperature of homogenisation Thcarb) has beenquite dif 1047297cult to obtain Usually homogenisation to the vapour phaseoccurs at temperature Thcarb from minus 239 to minus10 degC (Table 3) andonly in two cases to liquid phase at higher temperature(Thcarb between18 and 20 degC)
In larger inclusions (approximately20 μ m) we were able to measurethe melting temperature of clathrate we employed the method of Collins (1979) using repeated cooling-heating cycles in proximity of the decomposition temperature of clathrate During microthermometricexperiments the clathrate crystals occur as (i) small crystals around thegaseous bubble (ii) colourless crystals in the aqueous phase (making thedetermination of Tmice dif 1047297cult) and (iii) irregular shape and motion of the gaseous bubble The decomposition temperature of clathrates(Tmcla) in the Type 2a inclusions varies mainly from 56 to 134 degC(Table 3) Where detectable Tmcla in Type 2b inclusions is comparableor higher (60ndash186 degC Table 3) At low pressure CH4 clathrate melts attemperatures higher than 15 degC whereas CO2 clathrate melts at lowertemperatures (b10 degC Seitz and Pasteris 1990 Diamond 2003)
The salinity of Type 2 inclusions was calculated using the melting
temperature of clathrates with the software package of Bakker andBrown (2003) and the equations of Duan et al (1992ab) the resultsare comparable with the values obtained for Type 1 inclusions althoughthey extend towards lower values (09ndash48 and 1ndash62 wt NaClequivalent Fig 5D and Table 3) The composition of the carbonic1047298uid is dif 1047297cult to obtain due to the formation of clathrate duringmicrothermometric experiments
Themost frequent values for Thtot (Table 3) are 250ndash338 degC (medianand mode at 300 degC and 280 degC respectively Type 2a Fig 5C) 293ndash334 degC (to liquid phase Type 2b) and 299ndash334 degC (to vapour phaseType 2b Fig 5E)
423 Type 3 inclusions
Only25 inclusions of the Type 3 havebeeninvestigated Most Type 3
inclusions freeze at very low temperatures below minus 85 degC and down tominus136 degC the extremely low water content rarely allows observation of the changes induced by freezing The carbonic phase melts primarily inthe range minus 636 to minus 583 degC (Table 3) similarly to Type 2b inclusionssuggesting a variable proportion of CO2 with other non-condensablegasesmost likely CH4 The melting temperature (Tmcarb) rarely reacheslower values down to minus 699 degC suggesting high contents of CH4 Onlyone determination gave Tmcarb = minus 569 degC
Thehomogenisation of the carbonic phase to vapour phase occurs atdifferenttemperatures (Table 3)(i) 182ndash189 degC forthe inclusions withthe highest Tmcarb (minus589 to minus 583 degC hereafter 3a) and (ii) 98ndash125 degC for the inclusions melting at lower temperatures (minus636 tominus627 degC hereafter 3b Fig 3A B) The homogenisation temperatureto vapour phase of Type 3b inclusions suggests that Tmcarb should be
greater than approximately minus 62 degC (cf Ridley and Hagemann 1999
Thiery et al 1994 Van den Kerkhof and Thiery 2001) This behaviouris the consequence of retrograde condensation (ie the condensationof liquid under isothermal conditions on lowering pressure) which in-creases the temperature of homogenisation (to the gas phase) of the1047298uid inclusions (with a given composition) to values higher than thecritical temperature (Thiery et al 1994 Van den Kerkhof 1988 Vanden Kerkhof and Thiery 2001)
A further subgroup of Type 3 inclusions (hereafter 3c Table 3 and
Fig 3C D) has a varied behaviour at very low temperatures (minus
981to minus733 degC) they apparently homogenise to thevapourphaseand like-ly to another liquid supporting a case of liquidndashliquidndashgas immiscibility(Thiery et al 1994) At room temperature these inclusions have twophases of similar density (Fig 3C D) In some inclusions a meniscusoccurs in the bubble at temperature from minus 893 to minus 719 degC (whichgradually disappears at approximately minus63 to minus 60 degC) and thecarbonic phase appears darker or takes on a bumpy surface
424 Type 4 inclusions
In rare cases it was possible to obtain data during microthermometricexperiments The obtained temperatures (Tmcarb ~ minus 635 degC Te fromminus250 to minus197 degC Tmice from minus07 to minus04 degC and Tmcla 72 degCTable 3) are fully comparable with those of Type 2 and Type 3 inclusions
43 Micro-Raman spectroscopy
To estimate the entrapment conditions we must know both thecomposition and density of the trapped 1047298uid However as statedabove they are dif 1047297cult to obtain for the occurrence of clathrates Toovercome this problem we determinedthe composition of the carbonicphase using micro-Raman spectroscopy
431 CO 2ndashCH 4 1047298uids
For Raman analysis of the carbonic phase we selected approximate-ly 50 inclusions of Type 2 and 3
The Raman spectra of these inclusions are characterised by (i) theRaman active stretchingmodeν1 at 1278ndash1282 cmminus1 and the overtoneof thebending modeν2 (2ν2)at1380ndash1385 cmminus1 typicalof CO2 (Fig6)
and known asthe Fermi diad (Garrabos et al 1980) and(ii) theisolatedC-H stretching band (ν1) of CH4 at 2907ndash2913 cmminus1 (Fig 6 Burke2001) In the spectral area of reduced sulphur species the backgroundsometimes shows a small hump which might be considered as a smallpeak (insetin Fig6C) It occurs atabout 2610cmminus1 suggestingthe pres-ence of a very small amount of H2S associated to the carbonic vapourphase The detection limit is estimated at 1 mol for H2S
According to the literature (Kawakami et al 2003 Van den Kerkhof and Olsen 1990 Wang et al 2011) the changes of frequency in theRaman spectrare1047298ect variations in pressure1047298uid density and tempera-ture The separation between the two bands (Δν) represents a bettermeasure of CO2 density than the peak positions or the ratio of thepeak positions (Kawakami et al 2003 Wang et al 2011) The mea-sured Δν in our 1047298uid inclusions is 1035ndash104 cmminus1 On the basis of
the equation from Wang et al (2011) valid for the entire range of den-sities(with CH4 le 10 mol) the calculatedCO2 density of the investigat-ed 1047298uid inclusions is in the range 034ndash056 gcm3
Similarly the position of the ν1 band is also in1047298uenced by pressureand temperature variations for CH4 Unfortunately we were unable toobtain reliable density values because the equations proposed in the lit-erature have been calibrated using a 51453 nm laser (Lin et al 2007)and are valid for pure or almost pure CH4 (b10 mol of other compo-nents such as CO2) and CH4ndashH2O systems (Lu et al 2007) which areconditions signi1047297cantly different from those of our systems
On the basis of the microthermometric data we infer that the car-bonic components are present in variable proportions and their molefractions have been determined from Raman spectra according toBurke (2001) That study provides a simple formula that considers
CO2 and CH4 peak areas (both CO2 peaks must be considered) CO2
250 E Salvioli-Mariani et al Journal of Geochemical Exploration 158 (2015) 243ndash 256
7172019 Salvioli et al 2015
httpslidepdfcomreaderfullsalvioli-et-al-2015 914
and CH4 Ramanscattering ef 1047297ciencies andCO2 and CH4 instrumental ef-1047297ciencies for the speci1047297c laser wavelength (6328 nm) The CH4 molefraction (XCH4) varies between 005ndash020 in Type 2a 019ndash068 inType 2b and 022ndash10 in Type 3 inclusions (Table 3)
432 Carbonaceous material
Type 4 inclusions are peculiar because they contain a black solidphase with a lath shape and variable proportions of aqueous liquidphase Based on Raman spectra the solid phase is identi1047297ed as graphite25 Raman spectra were acquired for both solid and liquid phases
Raman spectra of the carbonaceous material are very sensitive tochanges in the order degree The1047297rst order bands of the Raman spectraof carbonaceous material are characterised by the G band at approxi-mately 1580 cmminus1 typical of crystalline or ordered graphite the Dband at approximately 1350 cmminus1 and the Dprime band at approximately1620 cmminus1 typical of disordered or defect bearing carbonaceous mate-rial (Aoya et al 2010 Luque et al 1998 Thomsen and Reich 2000Vidano et al 1981) Carbonaceous materials also exhibit a strong
Raman band in the range 2500ndash
2800 cmminus1
which corresponds to the
overtone of the D band This band appears in the second-order Ramanspectra and is called the Gprime band (Pimenta et al 2007) The decreasein the order degree of graphite is also evident by the development of an asymmetry andbandbroadening in the second-order peak and a de-crease in resolution among its constituent bands (Pasteris and Chou1998) If the position of the G band is not affected by the wavelengthof thelaser the Raman frequency of theD band increases with theexci-tation energy (Kawashima and Katagiri 1995 Matthews et al 1999
Vidano et al 1981) Moreover the ratio of the integrated intensity of the D and G bands (IDIG) decreases with increasing laser energyWith our equipment (λ = 6328 nm) the D band is expected at ap-
proximately 1330 cmminus1 The spectra acquired on Type 4 inclusions(Fig 7A B) have frequencies in the range 1332ndash1336 cmminus1 and1578ndash1581 cmminus1 forD and G bands respectivelyThe Dprime bandis alwayspresent as a shoulder on the high-frequency side of the G peak in therange 1613ndash1620 cmminus1 In the region of second-order bands an unre-solved doublet or a large band at approximately 2664ndash2709 cmminus1 oc-curs The D band is broad with low intensity when compared to the Gband and with a very low IDIG ratio (016ndash030) The degree of crystal-linity is represented by the length of ordered crystals along the a
Fig 6 Ramanspectra ofthe carbonicphase inexample Type 2a(A)Type2b (B)andType3 (C) 1047298uid inclusions The intensity scale of the inset is unchanged
Fig 7 Raman spectraof graphite in Type4 1047298uidinclusions (A B) compared with those of
graphite from wall-rock (C)
251E Salvioli-Mariani et al Journal of Geochemical Exploration 158 (2015) 243ndash 256
7172019 Salvioli et al 2015
httpslidepdfcomreaderfullsalvioli-et-al-2015 1014
crystallographic direction designated as L a (Pasteris and Chou 1998)The IDIG ratio and L a are negatively correlated and the most disorderedgraphite is characterised by the highest IDIG and the lowest L a values(Pasteris and Chou 1998) According to the general formula proposedby Pimenta et al (2007) which can be applied to any laser line we ob-tained the crystallite size L a in the range 1300ndash2400 Aring The calculatedparameters and the widths of the D and Gprime bands suggest a fairly gooddegree of graphite crystallinity which is comparable to that of naturally
or laboratory-produced graphite (Luque et al 1998 Pasteris and Chou1998 Perraki et al 2006 Satish-Kumar 2005 Wopenka and Pasteris1993) The Raman spectra of trapped graphite are all similar ( Fig 7AB) suggesting that the precipitation of graphite occurred from the hy-drothermal 1047298uid
The liquid portion associated with trapped graphite contains CO2CH4 and liquid H2O The typical peaks of CO2 (1280ndash1281 and1383ndash1384 cmminus1) and of CH4 (2910ndash2913 cmminus1) were observedusing the 6328 nm laser (Fig 8A) Moreover the peak for liquid H2Oat 3250ndash3252 cmminus1 was detected with the 4731 nm laser (Fig 8B)
Because of thepresenceof graphite in thehost rocks (quartz-sericiticand graphitic schists) for comparison we acquired 6 Raman spectra onthis carbonaceous materials They are completely different from thoseobtained for the graphite in the 1047298uid inclusions (Fig 7C) The D band(1329ndash1334 cmminus1) has a higherintensitythan that ofgraphitein thein-clusions and sometimes reaches the same intensity as the G band at1580ndash1583 cmminus1 Therefore the IDIG ratios are higher (095ndash208)and L a is lower (200ndash400 Aring) supporting the presence of fairly disor-dered graphite The shape of the spectra and the calculated parametersof graphite from the host rock of Canan are comparable to those of thegraphite from metapelites of chlorite facies (Luque et al 1998Wopenka and Pasteris 1993)
5 Discussion
Four types of 1047298uid inclusions have been found in the quartz crystalsfrom the mineralising veins of Dos Bocas a representative example of
gold deposit at Canan Some 1047298uidinclusions are along fractures crossingone or more crystals (Type 1 S inclusions)The most important1047298uid in-clusions constitute discontinuous trails which can suggest crystalgrowth zones (Type 2) The 1047298uid inclusion associations formed by L-richand V-richinclusions (Type 2 P andPS inclusions) andthe presenceof trails entirely constituted by V-rich inclusions(Type 3 PS andS inclu-sions) suggest that the hydrothermal 1047298uid suffered 1047298uid immiscibility(boiling) The trapped 1047298uid consists of an aqueous solution (H2Ondash
NaClndash
KCl with 09ndash
48 wt NaCl equivalent) plus a CO2ndash
CH4 1047298
uid(80ndash90 mol CO2) As shown by Bowers and Helgeson (1983) a pres-sure drop moves the H2O-carbonic phase solvus towards higher tem-perature which causes a decrease of carbonic gas solubility and theexsolution of CO2 (and CH4) gas from the water-rich 1047298uid according tothe Henrys law In geological environments such as Canan where thetectonics aredominatedby strikendashslip fault systems thefracture forma-tion after deformation causes a rapid and immediate reduction in pres-sure The occurrence of some inclusions naturally decrepitated can beexplained by pressure drop The presence of Type 3b 1047298uid inclusionswhich exhibit retrograde condensation further supports the occurrenceof such a pressure drop
Because of 1047298uid immiscibility the total homogenisation temperaturecan be considered as the trapping temperature Isochores have been re-constructed for Type 2 1047298uid inclusions combining the results frommicrothermometry and Raman analyses using the software package of Bakker and Brown (2003) and the equations of Bakker (1999) andDuan et al (1992b) Trapping pressures of 05ndash14 kbar were obtainedThe coexistence of different types of 1047298uid inclusions and their similarvalues of Th suggest that they can be related to the same hydrothermalprocess which wasresponsiblefor the gold mineralisation at CananThedifferentamounts of water andcarbonic1047298uids inthe inclusions is due tothe 1047298uid immiscibility where the H2O-rich 1047298uid is in Type 2a inclusionsand the CO2ndashCH4-rich 1047298uid in Types 2b and 3 inclusions Finally Type 4inclusions would represent the inclusions (both Type 2 and 3) wherethe conditions for graphite precipitation have been achieved
The graphite of the1047298uid inclusions (Type 4) is similar to that precip-itated from hydrothermal1047298uids This indicates that graphite depositionoccurred before or contemporaneously of the entrapment of the 1047298uid
The degree of crystallinity of graphite in the 1047298uid inclusions is higherthan that observed in the graphite from the host quartz-sericitic andgraphitic schists (Fig 7) Nonetheless this does not exclude the pres-ence of a metamorphic component in the mineralising 1047298uids
Equilibrium of graphite in the hydrothermal1047298uid allows the evalua-tion of oxygen fugacity The calculated atomic ratio XO [O(O + H)] isinthe range 032ndash041 (Fig 9) which is typical of slightly reduced 1047298uids(Cesare 1995 Huizenga 2011) Considering temperatures of 300 degCand pressures of 14 10 and 05 kbar (Tt and Pt respectively) graphitesaturation conditions (aC = 1) and the composition of the carbonicphase as inferred by Raman spectroscopy the calculated f O2 is aboutminus342 log unit (ie about 16 log unit above theQFM buffer) This resultis consistent with that obtained using the HSC chemistry software log f O2 asymp minus376 plusmn 25 which permitted us to calculate also the activity
of dissolved hydrogen ions at equilibrium condition between the con-stituents H2OCO2 CH4 Na+ andClminuspH=29plusmn04Itcanbeobservedthat our estimated pH value is low but this range of acidity is not un-common in1047298uid inclusions (egBenison 2013) including gold deposits(Boiron et al 1999 Pokrovski et al 2014)
According to Roedder (1984)thepHin 1047298uid inclusions can be calcu-lated or determined In the latter case the opening of the 1047298uid inclu-sions implies the loss of the trapped gases It follows that the pH isdetermined on a 1047298uid other than the original and which has undergonebasi1047297cation due to the loss of gas
The composition of Type 2 inclusions plotted in the ternary diagramCOH falls within the stability 1047297eld of graphite (towards the CO2 vertexFig 9) and the 1047298uid associated with graphite in Type 4 inclusions isalso constituted by H2OndashCO2ndashCH4 These features support precipitation
of graphite by the reaction CH4 + CO2rarr
2 C + 2 H2O The decrease of
Fig 8 Raman spectraof the1047298uid portion of Type 4 1047298uid inclusions (A)CO2 and CH4 have
been obtained by 6328 nm laser (B) H2O by 4731 nm laser
252 E Salvioli-Mariani et al Journal of Geochemical Exploration 158 (2015) 243ndash 256
7172019 Salvioli et al 2015
httpslidepdfcomreaderfullsalvioli-et-al-2015 1114
temperature andor the increase of pressure move the reaction towardsthe products In our case a combination of cooling and decompressionacted on the system so that the variation of temperature and pressurecannot be responsible for the precipitation of graphite According toHuizenga (2011) the precipitation of graphite is in1047298uenced by XO
value and oxygen fugacity the best conditions for precipitation areXO = 033 and QFM-2 b log f O2 b QFM + 1 Small variations from
these values prevent the precipitation or cause consumption of earlyprecipitated graphite XO values and f O2 of our Type 2 1047298uid inclusions(see above) agree with the Huizenga (2011) data and indicate thatsome 1047298uid inclusions were able to precipitate graphite
The H2S content and the oxygen fugacity of the hydrothermal 1047298uidsaffect the solubility of gold In H 2S-rich 1047298uids Au(HS)2
minus andAu(HS)deg are the dominant Au-complexes and gold has high solubil-ity (Au N 100 ppb) whereas in H2S-poor 1047298uids the gold solubilitydecreases and AuCl2
minus is the dominant stable complex (Gammonsand Williams-Jones 1997) When the partial pressure of H 2S is1047297xed by the magnetitendashpyrite pair the Au bisulphide complex isstable at T b 450 degC and the chloride complex at higher temperature(Mikucki 1998) At high oxygen fugacity H2S is oxidised and thusthe mobility of gold as bisulphide decreases considerably ( Gammons
and Williams-Jones 1997) Experimental studies at temperatures of 350ndash500 degC and pressures of 05ndash1 kbar have shown that Au(HS)2
minus isthe dominant Au complex in near neutral to weakly acidic solutions inthe presence of the K-feldsparndashmuscovitendashquartz mineral associationand at pyritendashpyrrhotitendashmagnetite buffer conditions (Tagirov et al2005)
Many of the conditions employed in the experiments mentionedabove match those of the Canan ore deposit 1047298uid inclusions indicatethe presence of low salinity and low temperature (T b 400 degC) hydro-thermal 1047298uids and XRD data (Mattioli et al 2014) show that the wall-rocks contain the K-feldsparndashmuscovitendashquartzndashpyritendashpyrrothitendashmagnetite association (Table 1) However the hydrothermal 1047298uids atCanan seem to be extremely acidic (pH = 29) which makes Au(HS)degmore stable than Au(HS)2
minus and themost abundant complex in thesolu-
tions (cf also Heinrich et al 2004 Pokrovski et al 2014) Hence we
infer that the gold of Canan was transported by hydrothermal 1047298uids asAu(HS)deg complex
Activity diagrams are a powerful graphical tool for depicting the sta-bility of dissolved species and solid and gas phases with respect to thecomposition of the coexisting solution Calculations on Au speciationwere performed under the mean conditions estimated by the analysisof the 1047298uid inclusions and the results plotted in log f O2-pH diagrams(Fig 10) The decrease in solubility of the Aundashsulphide complexes can
be ascribed both to the fracturation-induced pressure drop andthe con-centration of sulphur in solution According to Mattioli et al (2014) thegold deposit of Canan was formed by the hydrothermal 1047298uid activityalong fractures produced by tectonics Opening and lateral expansionof the fractures produce a pressure drop on the 1047298uids themselves andboiling of the dissolved gases The 1047298uid composition affects the depthof boiling which is an ef 1047297cient mechanism for gold precipitation(Hedenquist et al 1992 Pokrovski et al 2014 Robb 2010 Sibson1987) Boiling produced the exsolution of H2S which in turn caused adecrease in the solubility of theAundashsulphide complexes and the precip-itation of gold (Fig 10) In the case of the Canan deposit boiling repre-sents only the initial phase of gold deposition In fact the main bodyof thegoldmineof Canan is located in metamorphic rocks cutby quartzveins where hydrothermal 1047298uids altered the primary mineralogy andchanged their composition and ability to carry gold in solution In theore deposit Au coexists with sulphides and in particular small grainsof pure gold are surrounded by pyriteand other sulphides This suggeststhat gold was deposited by reactions involving 1047298uids containing Au-Scomplexes and the wall-rock containing chalcophile elements particu-larly Fe a process known as ldquosulphidationrdquo (Williams-Jones et al 2009and references therein Robb 2010) At Canan Fe is abundant in freshwall-rocksfor thepresence of biotiteand chloriteThese minerals disap-pear in the vicinity of quartz veins of the ore deposit where the highestconcentration of gold and sulphides are observed (Mattioli et al 2014)During the alteration of biotite and chlorite Fe is released into the hy-drothermal 1047298uids and likely produces the following reaction with theAundashsulphide complexes
AuethHSTHORN∘ethaqTHORN thorn 05Fe2thornharr05FeS2ethPyriteTHORN thorn H
thorn thorn Au∘ethGoldTHORN eth1THORN
Under equilibrium conditions and assumingP = 1400barT = 300 degCand the water activity H2O = 1 the resulting log K is 53151 (ΔGdeg-R = minus 5833 kJ molminus1) The high value of the equilibrium constant Kand the highly negative value of ΔGdegR indicate that the reaction has aspontaneous tendency towards the products According to Robb (2010)these reactions occur in dynamic systems where kinetics predominatesover equilibrium conditions Therefore it is very unlikely that reaction(1) occurs under equilibrium conditions in an open natural system Be-cause of the continuous supply of Au(HS)deg from the hydrothermal 1047298uidsand Fe2+ from the alteration of biotite and chlorite (within the zones of 1047298uid-rock interaction) reaction (1) is imbalanced and pushed towardsthe products by favouring the deposition of gold and sulphides This isin agreement with Pokrovski et al (2014) who state that the interactionof sulphur-rich hydrothermal 1047298uids and Fe2+-rich wall rocks(sulphidation) is one of the main processes leading to the precipitationof gold
Additionally the activity of sulphur in the 1047298uids is responsible forthe solubilisation and transport of gold At Canan the activity of Sought to be at least 10minus2 Above this value the composition of hydro-thermal 1047298uid plots in the stability 1047297eld of Au(HS)deg (Fig 10) Withlower concentrations of S (and lower pressure) the transportof gold oc-curs as chloride (Fig 10L M and N) If iron is no longer available aftercomplete alteration of biotite and chlorite the deposition of goldcould be represented by the reaction
AuethHSTHORN∘ethaqTHORN thorn 05H2ethgTHORNharrH2SethgTHORN thorn Au∘ethGoldTHORN eth2THORN
where log K = 69130 (ΔGdegR = minus 7586 kJ molminus1) at T = 300 degC and
P = 1400 bar indicates once again a spontaneous tendency towards
Fig 9 Ternary CndashOndashH diagramshowing thecarbon saturatedsurface (solid line) at 300degCand1400 barcalculated by Perple_Xsoftware(J Connollywwwperplexethzch) Dashedlines represent the compositional triangle H2OndashCO2ndashCH4 dotted 1047297eld Type 2a inclusionsstriped 1047297eld Type 2b inclusions Lines of constant XO 035 and 040 (dot-dashed lines) arealso shownTheopencircles andthenumbers initalics indicate f O2
1047298uid relative toQFM buff-er in log10 units (log f O2
1047298uidndashlog f O2
QFM) for 1047298uids in equilibrium with graphite
253E Salvioli-Mariani et al Journal of Geochemical Exploration 158 (2015) 243ndash 256
7172019 Salvioli et al 2015
httpslidepdfcomreaderfullsalvioli-et-al-2015 1214
theproducts andthe presence of H2 agrees with the reducing conditions(log f O2 asymp minus376) found in the hydrothermal 1047298uids of Canan Reaction(2) would be effective during boiling andor decompression (cf Boyle1969 Pokrovski et al 2014) Similarly to reaction (1) the dynamicsystem conditions (the continuous supply of Au(HS)deg and loss of H2S)favour the kinetic of the reaction (2) and con1047297rm the statements of Robb (2010) and Sibson (1987) on the ef 1047297ciency of this process forgold deposition Finally the kinetics of reaction (1) is further increasedby the alteration of feldspar and muscovite in kaolinite and diaspore (cfMattioli et al 2014) The mineral alterations subtract H+ from the solu-
tion (Drever 1997) favouring the precipitation of Au
6 Concluding remarks
The quartz veins associated with gold mineralisations from DosBocas (Canan area Lepaguare District east-central Honduras) are richin 1047298uid inclusions of four main types Type 1 mdash S two-phaseaqueous-rich inclusions Type 2 mdash P to PS aqueous-rich inclusionswith an H2O-rich liquid and a CO2ndashCH4-bearing liquid Type 3 mdash PSto S CO2ndashCH4-rich inclusions with a very small amount of waterand Type 4 mdash graphite-bearing aqueousndashcarbonic 1047298uid
The association of L-rich and V-rich inclusions (Type 2) and the oc-currence of trails containing only V-rich inclusions (Type 3) support a
1047298uid immiscibility (boiling)of the hydrothermal1047298uidThe hydrothermal
trapped 1047298uid is constituted by H2O + alkali chloride + CO2 plusmn CH4 Thecalculated salinity varies from 09 to 48 wt NaCl equivalent
The immiscibility of 1047298uids can be related to a pressure decrease dueto both the opening of fractures and upward 1047298ow of 1047298uids At Canan astrikendashslip fault systemis responsible for the fracturing of the metamor-phic wall-rocks Thisgeological setting with the mineralogicalpetrolog-ical and geochemical features supports an orogenic character of theinvestigated gold deposits
In some 1047298uid inclusions the occurrence of graphite with typical fea-tures of graphite precipitated from hydrothermal 1047298uids suggests that
the deposition of graphite was prior or concomitant with the entrap-ment of the 1047298uid Moreover the occurrence of graphite associated towater andcarbonic1047298uidssupports the presence of a metamorphic com-ponent in the mineralising 1047298uid
Microthermometric and spectroscopic data from 1047298uid inclusionssuggest that the gold mineralisations at Canan formed at T = 300 degCunderP=500ndash1400 barsThecalculated oxygenfugacityand pH valuesof the hydrothermal 1047298uids are approximately minus 376 plusmn 25 log unit(1 log unit above the QFM buffer) and 29 plusmn 04 respectively
The hydrothermal 1047298uids contained sulphur (activity of S ge 10minus2)assuggested by the association of gold with sulphides including pyriteand chalcopyrite For the above chemical and physical conditions themost abundant sulphur specie carrying gold in solution is the Au(HS)degcomplex Several causes are responsible for the precipitation of gold in
the Canan area 1 mdash boiling following the pressure drop caused by
Fig 10 Activity diagrams for the system AundashCndashClndashSndashH2O at 300 degC Au and H2O activity 10minus7 (~10 ppb) and 100 respectively Cl 10minus098 and C buffered by graphite (see ldquoCalculationmethodsrdquo) Variable values of pressure are considered 1400 bar (A B C and D) 1000 bar (E F G and H) 500 bar (I L M and N) Activities of total dissolved S are 10minus1 (A E and I)10minus2 (B F and L) 10minus3 (C G and M) and buffered by pyrite (D H and N) Green 1047297eld represents the mean composition of the 1047298uid inclusions (pH = 29 plusmn 04 log f O2 = minus 376 plusmn25) Red lines limit the 1047297elds of Au species dashed black lines the S species and dashed blue lines the carbon species The thickness of the red lines corresponds to an uncertainty of log [Au] = plusmn01 or log [H2O] = plusmn02
254 E Salvioli-Mariani et al Journal of Geochemical Exploration 158 (2015) 243ndash 256
7172019 Salvioli et al 2015
httpslidepdfcomreaderfullsalvioli-et-al-2015 1314
tectonic andor hydrothermal 1047298uids activity 2 mdash sulphidation triggeredby the liberation of metal cations during the alteration of ma1047297c min-erals of the wall-rocks 3 mdash hydrothermal alteration of feldspars andphyllosilicates of the wall-rocks
Acknowledgements
The authors wish to thank M Menichetti for providing samples of
the quartz veins and the Goldlake Group for the permission to publishthe results of this study Special thanks are due to John Ridley for theuseful and encouraging suggestions which have noticeably improvedthequality of this paperSincere thanksare dueto BJStacey forimprov-ing the English
References
Alvarez-Gogravemez JA Meijer PT Martigravenez-Digraveaz JJ Capote R2008 Constraintsfrom1047297nite element modeling on the active tectonics of northern Central America andthe Middle America Trench Tectonics 27 TC1008 httpdxdoiorg1010292007TC002162
Andrada de Palomera P van Ruitenbeek FJA van der Meer FK Fernaacutendez R 2012Geochemical indicators of gold-rich zones in the La Jose1047297na epithermal depositDeseado Massif Argentina Ore Geol Rev 45 61ndash80
Aoya M Kouketsu Y Endo S Shimizu H Mizukami T Nakamura D Wallis S 2010Extending the applicability of the Raman carbonaceous-material geothermometer
using data from contact metamorphic rocks J Metamorph Geol 28 895ndash914Bakker RJ 1999 Adaptation of the Bowers and Helgeson (1983) equation of state to the
H2OndashCO2ndashCH4ndashN2ndashNaCl system Chem Geol 154 225ndash236Bakker RJ Brown PE 2003 Computer modelling in 1047298uid inclusion research In
Samson I Anderson A Marshall D (Eds) Fluid Inclusions Analysis and interpreta-tion Mineralogical Association of Canada Short Course Series 32 pp 175ndash212
Benison KC 2013 Acid saline 1047298uid inclusions examples from modern and Permianextreme lake systems Geo1047298uids 13 579ndash593
Bersani D Salvioli-Mariani E Mattioli M Menichetti M Lottici PP 2009 Raman andmicro-thermometric investigation of the 1047298uid inclusions in quartz in a gold-richformation from Lepaguare mining district Spectrochim Acta A 73 443ndash449
Bethke CM Yeakel S 2008 The Geochemists Workbenchreg mdash Release 7 GWB Essen-tials Guide mdash Hydrogeology Program University of Illinois (100 pp)
Bodnar RJ Reynolds TJ Kuehn CA 1985 Fluid-inclusion systematics in epithermalsystems In Berger BR Bethke PM (Eds) Geology and Geochemistry of Epithermal Systems Reviews in Economic Geology 2 pp 73ndash97
Boiron MC Cathelineau M Essarraj S Lespinasse M Sellier E 1991 Characterizationof the relationships between deformation 1047298uid migration and Au deposition in
quartz veins methodology and modelling Proceedings Gold 91 AA BalkemaPublishers Brazil pp 637ndash643Boiron MC Moissette A Cathelineau M Banks D Monnin C Dubessy J 1999
Detailed determination of palaeo1047298uid chemistry an integrated study of sulphate-volatile rich brines and aquo-carbonic 1047298uids in quartz veins from Ouro Fino(Brazil) Chem Geol 154 179ndash192
Botros NS 2004 A new classi1047297cation of the gold deposits of Egypt Ore Geol Rev 251ndash37
Bowers TS Helgeson HW 1983 Calculation of the thermodynamic and geochemicalconsequences of nonideal mixing in the system H2OndashCO2ndashNaCl on phase relationsin geological systems equation of state for H 2OndashCO2ndashNaCl 1047298uids at high pressuresand temperatures Geochim Cosmochim Acta 47 1247ndash1275
Boyle RW 1969 Hydrothermal transport and deposition of gold Econ Geol 64112ndash115
Burke EAJ 2001 Raman microspectrometry of 1047298uid inclusions Lithos 55 139ndash158Callaghan T 2001 Geology and host-rock alteration of the Henty and Mount Julia gold
deposits western Tasmania Econ Geol 96 (5) 1073ndash1088Carpenter RH 1954 Geology and ore deposits of the Rosario mining district and San
Juancito Mountains Honduras Central America Geol Soc Am Bull 65 23ndash28
Cepedal A Fuertes-Fuente M Martiacuten-Izard A Garciacutea-Nieto J Boiron MC 2013 Anintrusion-related gold deposit (IRGD) in the NW of Spain the Linares deposit igne-ous rocks veins and related alterations ore features and 1047298uids involved
J Geochem Explor 124 101ndash126Cesare B 1995 Graphite precipitation in CndashOndashH 1047298uid inclusions closed system compo-
sitional and density changes and thermobarometric implications Contrib MineralPetrol 122 25ndash33
Cleverley JS Bastrakov EN 2005 K2GWB Utility for Generating Thermodynamic DataFiles for the GeochemistsWorkbenchregat 0ndash1000 degC and 1ndash5000 bar from UT2K andthe UNITHERM Database
Collins PLF 1979 Gas hydrates in CO2-bearing 1047298uid inclusions and the use of freezingdata for estimation of salinity Econ Geol 74 1435ndash1444
Deksissa DJ Koeberl C 2005 Geochemistry alteration and genesis of gold mineraliza-tion in the Okote area southern Ethiopia Geochem J 38 307ndash331
Diamond LW 2003 Introduction to gas-bearing aqueous 1047298uid inclusions In Samson IAnderson A Marshall D (Eds) Fluid Inclusions Analysis and interpretation Miner-alogical Association of Canada Short Course Series 32 pp 101ndash158
Drever JI 1997 The Geochemistry of Natural Water Prentice-Hall Upper Saddle RiverNew Jersey
Drobe J Cann RM 2000 CundashAu skarn mineralization Minas de Oro District HondurasCentral America Explor Min Geol 9 51ndash63
Duan Z MoslashllerN WeareJK 1992a An equation of state for theCH4ndashCO2ndashH2O systemI Pure systems from 0 to 1000 degC and 0 to 8000 bar Geochim Cosmochim Acta 562605ndash2617
Duan Z MoslashllerN Weare JK 1992b Anequationof statefor the CH4ndashCO2ndashH2O systemII Mixtures from 50 to 1000 degC and 0 to 1000 bar Geochim Cosmochim Acta 562619ndash2631
Esmaeily D Afshooni SZ Mirnejad H Rashidnejad-e-Omran N 2012 Mass changesduring hydrothermal alteration associated with gold mineralization in the Astanehgranitoid rocks western Iran Geochem Explor Environ Anal 12 161ndash175
Gammons GH Williams-Jones AE 1997 Chemical mobility of Gold in the porphyryndash
epithermal environment Econ Geol 92 45ndash59Garofalo P Matthaumli SK Heinrich C 2002 Three dimensional geometry ore
distribution and time-integrated mass transfer through the quartzndashtourma-linendashgold vein network of the Sigma deposit (Abitibi belt mdash Canada) Geo1047298uids2 217ndash232
Garrabos Y Tufeu R Le Neindre B 1980 Rayleigh and Raman scattering near the crit-ical point of carbon dioxide J Chem Phys 72 (8) 4637ndash4651
Groves DI Goldfarb RJ Robert F Hart CJR 2003 Gold deposits in metamorphicbelts overview of current understanding outstanding problems future researchand exploration signi1047297cance Econ Geol 98 1ndash29
Guzman-Speziale M 2001 Active seismic deformation in the grabens of northern Cen-tral America and its relationship to the relative motion of the North AmericandashCarib-bean plate boundary Tectonophysics 337 39ndash51
Hedenquist JF Reyes AG Simmons SF Taguchi S 1992 The thermal and geochemi-cal structure of geothermal and epithermal systems a framework for interpreting1047298uid inclusion data Eur J Mineral 4 989ndash1015
Heinrich CA Driesner TStefaacutensson ASeward TM 2004 Magmatic vapor contractionand the transport of gold from the porphyry environment to epithermal ore deposits
Geology 32 761ndash764Horne G Clark G Pushkar P 1976 Pre-Cretaceous rocks of northwestern Honduras
basement terrane in Sierra de Omoa AAPG Bull 60 566ndash583Huizenga J-M 2005 COH an Excel Spreadsheet for composition calculations in the Cndash
OndashH 1047298uid system Comput Geosci 31 797ndash800Huizenga J-M 2011 Thermodynamic modelling of a cooling CndashOndashH 1047298uid-graphite sys-
tem implications for hydrothermal graphite precipitation Miner Deposita 46 23ndash33KawakamiY YamamotoJ Kagi H2003 Micro-Ramandensimeterfor CO2 inclusionsin
mantle-derived minerals Appl Spectrom 57 (11) 1333ndash1339Kawashima Y Katagiri G 1995 Fundamentals overtones and combinations in the
Raman spectrum of graphite Phys Rev B 52 10053ndash10059Klein EL Koppe JC Moura CAV 2002 Geology and geochemistry of the Caxis gold
deposit and geochronology of thegold-hosting Caxias Microtonalite Sao Luis Cratonnorthern Brazil J S Am Earth Sci 14 837ndash849
Lin F Bodnar RJ Becker SP 2007 Experimentaldetermination of the RamanCH4 sym-metric stretching (ν1) band position from 1ndash650 bar and 03ndash22 degC application to1047298uid inclusion studies Geochim Cosmochim Acta 71 3746ndash3756
Lu W Chou I-M Burruss RC Song Y 2007 An uni1047297ed equation for calculating meth-ane vapor pressures in the CH4ndashH2O system with measured Raman shifts GeochimCosmochim Acta 71 3969ndash3978
Luque FJ Pasteris JD Wopenka B Rodas M Barrenechea JF 1998 Natural 1047298uid-deposited graphite mineralogical characteristics and mechanisms of formationAm J Sci 298 471ndash498
Mann P Burke K 1984 Neotectonics of the Caribbean Rev Geophys 22 309ndash362Mann P Burke K 1988 Cenozoic rift formation in the northern Caribbean Geology 12
732ndash736MatthewsMJ Pimenta MA Dresselhaus GDresselhaus MS Endo M1999 Originof
the dispersive effects of the Raman D band in carbon materials Phys Rev B 59R6585ndashR6588
Mattioli M Menichetti M Renzulli A Toscani L Salvioli-Mariani E Suarez P 2014Genesis of the hydrothermal gold deposits in the Canan area Lepaguare DistrictHonduras Int J Earth Sci 103 901ndash928
Mikucki EJ 1998 Hydrothermal transport and depositional processes in Archean lode-gold systems a review Ore Geol Rev 13 307ndash321
Mills RA Hugh KE Feray DE Swolfs HC 1967 Mesozoic stratigraphy of HondurasAAPG Bull 51 1711ndash1786
Miur TL 2002 The Hemlo gold deposit Ontario Canada principal deposit characteris-
tics and constraints on mineralization Ore Geol Rev 21 1ndash
66Pasteris JD Chou I-M 1998 Fluid-deposited graphitic inclusions in quartz comparisonbetween KTB (German Continental Deep-Drilling) core samples and arti1047297cially re-equilibrated natural inclusions Geochim Cosmochim Acta 62 109ndash122
Perraki M Proyer A Mposkos E Kaindl R Hoinkes G 2006 Raman micro-spectroscopy on diamond graphite and other carbon polymorphs from theultrahigh-pressure metamorphic Kimi Complex of the Rhodope Metamorphic Prov-ince NE Greece Earth Planet Sci Lett 24 672ndash685
Phillips GN Powell R 2009 Formation of gold deposits review and evaluation of thecontinuum model Earth-Sci Rev 94 1ndash12
Pimenta MA Dresselhaus G Dresselhaus MS Canccedilado LG Jorio A Saito R 2007Studying disorder in graphite-based systems by Raman spectroscopy Phys ChemChem Phys 9 1276ndash1291
Pokrovski GS Akin1047297ev NN Borisova AY Zotov AV Kouzmanov K 2014 Gold spe-ciation and transport in geological 1047298uids insights from experiments and physicalndashchemical modelling Geol Soc Lond Spec Publ httpdxdoiorg101144SP4024(Online First)
Ratschbacher L Franz L Min M Bachmenn R Martens U Stanek K Stubner KNelson BK Herrmann U Weber B Loacutepez-Martiacutenez M Jonckheere R Sperner
255E Salvioli-Mariani et al Journal of Geochemical Exploration 158 (2015) 243ndash 256
7172019 Salvioli et al 2015
httpslidepdfcomreaderfullsalvioli-et-al-2015 1414
B Tichomirowa M McWilliams MO Gordon M Meschede M Bock P 2009 TheNorth AmericanndashCaribbean plate boundary in MeacutexicondashGuatemalandashHonduras In
James KH Lorente MA Pindell JL (Eds) The Origin and Evolution of the Caribbe-an Plate Geological Society London Special Publications 328 pp 219ndash293
Ridley JR Diamond LW 2000 Fluid chemistry of orogenic lode-gold deposits and im-plications for genetic models In Hagemann S Brown PE (Eds) Gold in 2000 Re-views in Economic Geology 13 pp 141ndash162
Ridley J Hagemann SG 1999 Interpretation of post-entrapment 1047298uid-inclusion re-equilibration at the Three Mile Hill Marvel Loch and Grif 1047297ns Find high-temperature lode-gold deposits Yilgran Craton Western Australia Chem Geol154 257ndash278
Robb L 2010 Introduction to Ore-forming Processes Blackwell Publishing Malden USARoberts RJ Irving EM 1957 Mineral deposits of Central America U S Geol Surv Bull1034 205
Roedder E 1984 Fluid inclusions Reviews in Mineralogy 12 Mineralogical Society of America Washington DC
Rogers RD Mann P 2007 Transtensional deformation of the western CaribbeanndashNorthAmerica plate boundary zone In Mann P (Ed) Geologic and Tectonic Developmentof the Caribbean Plate in Northern Central America Geological Society of AmericaSpecial Paper 428 pp 37ndash64
Rogers RD Mann P Emmet PA 2007 Tectonic terranes of the Chortis block based onintegration of regional aeromagnetic and geologic data In Mann P (Ed) Geologicand Tectonic Development of the Caribbean Plate in Northern Central America Geo-logical Society of America Special Paper 428 pp 65ndash88
Roine A 2009 HSC Chemistryreg 70 Users Guide ndash Volume frac12 ndash Chemical Reaction andEquilibrium Software With Extensive Thermochemical Database and Flowsheet Sim-ulation Outotec Information Center Finland
Samson IM Williams-Jones A-E Ault KM Gagnon JE 2008 Source of 1047298uids formingdistal ZnndashPbndashAg skarns evidence from laser ablation-inductively coupled plasma-mass spectrometry analysis of 1047298uid inclusions from El Mochito Honduras Geology
36 947ndash950Satish-Kumar M 2005 Graphite-bearing CO2-1047298uid inclusions in granulites insights on
graphite precipitation and carbon isotope evolution Geochim Cosmochim Acta 69(15) 3841ndash3856
Seitz JF Pasteris JD 1990 Theoretical and practical aspect of differential partitioning of gases by clathrate hydrates in 1047298uid inclusions Geochim Cosmochim Acta 54631ndash639
Shvarov YV 2008 HCh new potentialities for the thermodynamic simulation of geo-chemical systems offered by Windows Geochem Int 46 834ndash839
Sibson RH 1987 Earthquake rupturing as a mineralizing agent in hydrothermal sys-tems Geology 15 701ndash704
Silva-Romo G 2008 GuayapendashPapalutla fault system a continuous Cretaceous structurefrom southern Mexicoto theChortis BlockTectonicimplicationsGeology 3675ndash78
Spooner ETC Bray CJ Wood PC Burrows DR Callan NJ 1987 Aundashquartz vein andCundashAundashAgndashMondashanhydrite mineralization HollingerndashMcIntyre Mine Timmins
Ontario δ13C values (McIntyre) Fluid inclusion gas geochemistry pressure (depth)estimation and H2OndashCO2 phase separation as a precipitation and dilation mecha-nism Ont Geol Surv Misc Pap 136 35ndash56
Su W Xi B Xia B Zhang X Hu R 2008 Visible gold in arsenian pyrite at theShuiyindong Carlin-type gold deposit Guizhou China implications for the environ-ment and processes of ore formation Ore Geol Rev 33 667ndash679
Sundblad K Cumming GL Krstic D 1991 Lead isotope evidence for the formation of epithermalgold quartzveins in theChortis BlockNicaragua Econ Geol 86 944ndash959
Tagirov BR Salvi S Schott J Baranova NN 2005 Experimental study of goldndash
hydrosulphide complexing in aqueous solutions at 350ndash500 degC 500 and 1000 barsusing mineral buffers Geochim Cosmochim Acta 69 (8) 2119ndash2132
ThieryR Vanden Kerkhof AM Dubessy J 1994 vX properties of CH4ndash
CO2 and CO2ndash
N21047298uid inclusions modelling for T b 31 degC and P b 400 bars Eur J Mineral 6 753ndash771
Thomsen C Reich S 2000 Double resonant Raman scattering in graphite Phys RevLett 85 5214ndash5217
Van den Kerkhof AM 1988 The System CO2ndashCH4ndashN2 in Fluid Inclusions TheoreticalModelling and Geochemical Applications (PhD Thesis Amsterdam)
Vanden Kerkhof AM OlsenSN 1990 A natural example of superdense CO2 inclusionsmicrothermometry and Raman analysis Geochim Cosmochim Acta 54 895ndash901
Van den Kerkhof AM Thiery R 2001 Carbonic inclusions Lithos 55 49ndash68Vidano RP Ischbach DB Willis LJ Loehr TM 1981 Observation of Raman band
shifting with excitation wavelength for carbons and graphites Solid State Commun39 341ndash344
Wang X Chou I-M Hu W Burruss RC Sun Q Song Y 2011 Raman spectroscopymeasurements of CO2 density experimental calibration with high-pressure opticalcell (HPOC) and fused silica capillary capsule (FSCC) with application to 1047298uid inclu-sion observations Geochim Cosmochim Acta 75 4080ndash4093
Williams-Jones AE Bowell RJ Migdisov AA 2009 Gold in solution Elements 5281ndash287
Williams-Jones AE Samson IM Ault KM Gagnon JE Fryer BJ 2010 The genesis of
distal zinc skarns evidence from the Mochito deposit Honduras Econ Geol 1051411ndash1440
Wopenka B Pasteris JD 1993 Structural characterization of kerogens to granulite-facies graphite applicability of Raman microprobe spectroscopy Am Mineral 78533ndash557
Yang F Mao J Wang Y Bierlein F 2006 Geology and geochemistry of the Bulongquartzndashbarite vein-type gold deposit in the Xinjiang Uygur Autonomous RegionChina Ore Geol Rev 29 52ndash76
Zhang YG Frantz JD 1987 Determination of the homogenization temperatures anddensities of supercritical 1047298uids in the system NaClndashKClndashCaCl2ndashH2O using synthetic1047298uid inclusions Chem Geol 64 335ndash350
256 E Salvioli-Mariani et al Journal of Geochemical Exploration 158 (2015) 243ndash 256
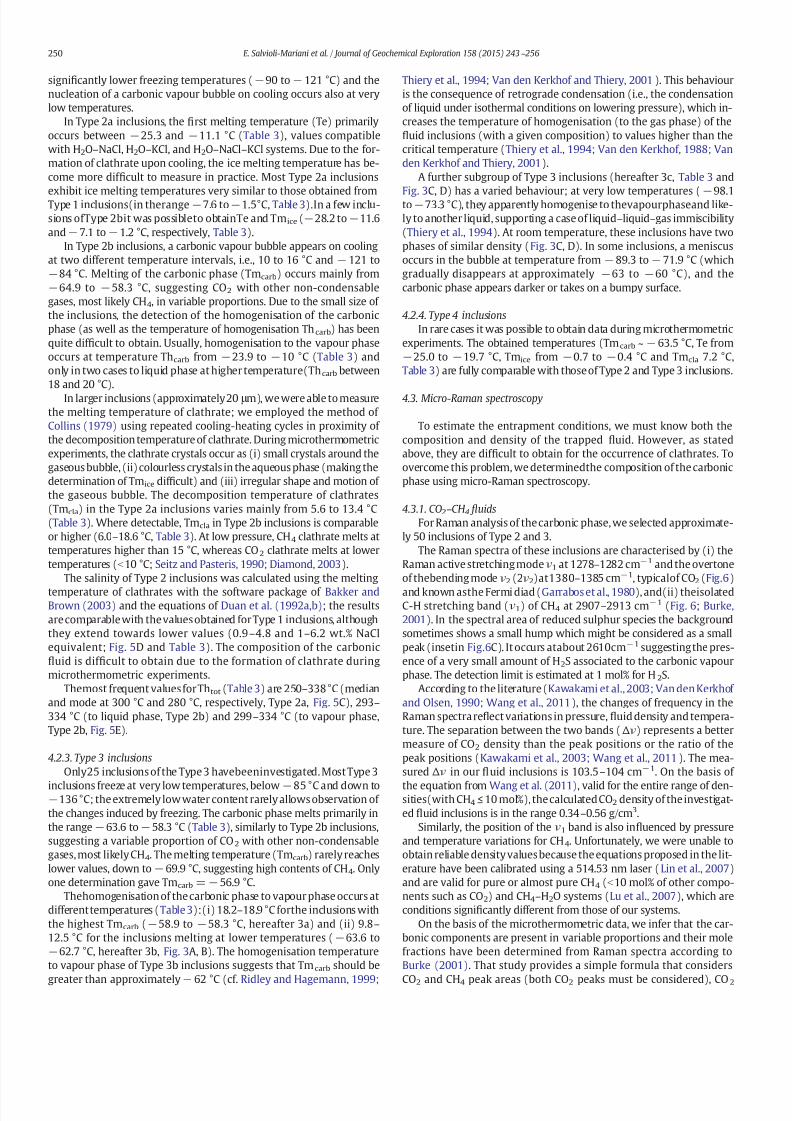
7172019 Salvioli et al 2015
httpslidepdfcomreaderfullsalvioli-et-al-2015 814
signi1047297cantly lower freezing temperatures (minus90 to minus 121 degC) and thenucleation of a carbonic vapour bubble on cooling occurs also at verylow temperatures
In Type 2a inclusions the 1047297rst melting temperature (Te) primarilyoccurs between minus 253 and minus111 degC (Table 3) values compatiblewith H2OndashNaCl H2OndashKCl and H2OndashNaClndashKCl systems Due to the for-mation of clathrate upon cooling the ice melting temperature has be-come more dif 1047297cult to measure in practice Most Type 2a inclusions
exhibit ice melting temperatures very similar to those obtained fromType 1 inclusions(in therange minus76 to minus15degC Table 3)In a few inclu-sions ofType 2bit was possibleto obtainTe and Tmice (minus282 to minus116and minus 71 to minus 12 degC respectively Table 3)
In Type 2b inclusions a carbonic vapour bubble appears on coolingat two different temperature intervals ie 10 to 16 degC and minus 121 tominus84 degC Melting of the carbonic phase (Tmcarb) occurs mainly fromminus649 to minus 583 degC suggesting CO2 with other non-condensablegases most likely CH4 in variable proportions Due to the small size of the inclusions the detection of the homogenisation of the carbonicphase (as well as the temperature of homogenisation Thcarb) has beenquite dif 1047297cult to obtain Usually homogenisation to the vapour phaseoccurs at temperature Thcarb from minus 239 to minus10 degC (Table 3) andonly in two cases to liquid phase at higher temperature(Thcarb between18 and 20 degC)
In larger inclusions (approximately20 μ m) we were able to measurethe melting temperature of clathrate we employed the method of Collins (1979) using repeated cooling-heating cycles in proximity of the decomposition temperature of clathrate During microthermometricexperiments the clathrate crystals occur as (i) small crystals around thegaseous bubble (ii) colourless crystals in the aqueous phase (making thedetermination of Tmice dif 1047297cult) and (iii) irregular shape and motion of the gaseous bubble The decomposition temperature of clathrates(Tmcla) in the Type 2a inclusions varies mainly from 56 to 134 degC(Table 3) Where detectable Tmcla in Type 2b inclusions is comparableor higher (60ndash186 degC Table 3) At low pressure CH4 clathrate melts attemperatures higher than 15 degC whereas CO2 clathrate melts at lowertemperatures (b10 degC Seitz and Pasteris 1990 Diamond 2003)
The salinity of Type 2 inclusions was calculated using the melting
temperature of clathrates with the software package of Bakker andBrown (2003) and the equations of Duan et al (1992ab) the resultsare comparable with the values obtained for Type 1 inclusions althoughthey extend towards lower values (09ndash48 and 1ndash62 wt NaClequivalent Fig 5D and Table 3) The composition of the carbonic1047298uid is dif 1047297cult to obtain due to the formation of clathrate duringmicrothermometric experiments
Themost frequent values for Thtot (Table 3) are 250ndash338 degC (medianand mode at 300 degC and 280 degC respectively Type 2a Fig 5C) 293ndash334 degC (to liquid phase Type 2b) and 299ndash334 degC (to vapour phaseType 2b Fig 5E)
423 Type 3 inclusions
Only25 inclusions of the Type 3 havebeeninvestigated Most Type 3
inclusions freeze at very low temperatures below minus 85 degC and down tominus136 degC the extremely low water content rarely allows observation of the changes induced by freezing The carbonic phase melts primarily inthe range minus 636 to minus 583 degC (Table 3) similarly to Type 2b inclusionssuggesting a variable proportion of CO2 with other non-condensablegasesmost likely CH4 The melting temperature (Tmcarb) rarely reacheslower values down to minus 699 degC suggesting high contents of CH4 Onlyone determination gave Tmcarb = minus 569 degC
Thehomogenisation of the carbonic phase to vapour phase occurs atdifferenttemperatures (Table 3)(i) 182ndash189 degC forthe inclusions withthe highest Tmcarb (minus589 to minus 583 degC hereafter 3a) and (ii) 98ndash125 degC for the inclusions melting at lower temperatures (minus636 tominus627 degC hereafter 3b Fig 3A B) The homogenisation temperatureto vapour phase of Type 3b inclusions suggests that Tmcarb should be
greater than approximately minus 62 degC (cf Ridley and Hagemann 1999
Thiery et al 1994 Van den Kerkhof and Thiery 2001) This behaviouris the consequence of retrograde condensation (ie the condensationof liquid under isothermal conditions on lowering pressure) which in-creases the temperature of homogenisation (to the gas phase) of the1047298uid inclusions (with a given composition) to values higher than thecritical temperature (Thiery et al 1994 Van den Kerkhof 1988 Vanden Kerkhof and Thiery 2001)
A further subgroup of Type 3 inclusions (hereafter 3c Table 3 and
Fig 3C D) has a varied behaviour at very low temperatures (minus
981to minus733 degC) they apparently homogenise to thevapourphaseand like-ly to another liquid supporting a case of liquidndashliquidndashgas immiscibility(Thiery et al 1994) At room temperature these inclusions have twophases of similar density (Fig 3C D) In some inclusions a meniscusoccurs in the bubble at temperature from minus 893 to minus 719 degC (whichgradually disappears at approximately minus63 to minus 60 degC) and thecarbonic phase appears darker or takes on a bumpy surface
424 Type 4 inclusions
In rare cases it was possible to obtain data during microthermometricexperiments The obtained temperatures (Tmcarb ~ minus 635 degC Te fromminus250 to minus197 degC Tmice from minus07 to minus04 degC and Tmcla 72 degCTable 3) are fully comparable with those of Type 2 and Type 3 inclusions
43 Micro-Raman spectroscopy
To estimate the entrapment conditions we must know both thecomposition and density of the trapped 1047298uid However as statedabove they are dif 1047297cult to obtain for the occurrence of clathrates Toovercome this problem we determinedthe composition of the carbonicphase using micro-Raman spectroscopy
431 CO 2ndashCH 4 1047298uids
For Raman analysis of the carbonic phase we selected approximate-ly 50 inclusions of Type 2 and 3
The Raman spectra of these inclusions are characterised by (i) theRaman active stretchingmodeν1 at 1278ndash1282 cmminus1 and the overtoneof thebending modeν2 (2ν2)at1380ndash1385 cmminus1 typicalof CO2 (Fig6)
and known asthe Fermi diad (Garrabos et al 1980) and(ii) theisolatedC-H stretching band (ν1) of CH4 at 2907ndash2913 cmminus1 (Fig 6 Burke2001) In the spectral area of reduced sulphur species the backgroundsometimes shows a small hump which might be considered as a smallpeak (insetin Fig6C) It occurs atabout 2610cmminus1 suggestingthe pres-ence of a very small amount of H2S associated to the carbonic vapourphase The detection limit is estimated at 1 mol for H2S
According to the literature (Kawakami et al 2003 Van den Kerkhof and Olsen 1990 Wang et al 2011) the changes of frequency in theRaman spectrare1047298ect variations in pressure1047298uid density and tempera-ture The separation between the two bands (Δν) represents a bettermeasure of CO2 density than the peak positions or the ratio of thepeak positions (Kawakami et al 2003 Wang et al 2011) The mea-sured Δν in our 1047298uid inclusions is 1035ndash104 cmminus1 On the basis of
the equation from Wang et al (2011) valid for the entire range of den-sities(with CH4 le 10 mol) the calculatedCO2 density of the investigat-ed 1047298uid inclusions is in the range 034ndash056 gcm3
Similarly the position of the ν1 band is also in1047298uenced by pressureand temperature variations for CH4 Unfortunately we were unable toobtain reliable density values because the equations proposed in the lit-erature have been calibrated using a 51453 nm laser (Lin et al 2007)and are valid for pure or almost pure CH4 (b10 mol of other compo-nents such as CO2) and CH4ndashH2O systems (Lu et al 2007) which areconditions signi1047297cantly different from those of our systems
On the basis of the microthermometric data we infer that the car-bonic components are present in variable proportions and their molefractions have been determined from Raman spectra according toBurke (2001) That study provides a simple formula that considers
CO2 and CH4 peak areas (both CO2 peaks must be considered) CO2
250 E Salvioli-Mariani et al Journal of Geochemical Exploration 158 (2015) 243ndash 256
7172019 Salvioli et al 2015
httpslidepdfcomreaderfullsalvioli-et-al-2015 914
and CH4 Ramanscattering ef 1047297ciencies andCO2 and CH4 instrumental ef-1047297ciencies for the speci1047297c laser wavelength (6328 nm) The CH4 molefraction (XCH4) varies between 005ndash020 in Type 2a 019ndash068 inType 2b and 022ndash10 in Type 3 inclusions (Table 3)
432 Carbonaceous material
Type 4 inclusions are peculiar because they contain a black solidphase with a lath shape and variable proportions of aqueous liquidphase Based on Raman spectra the solid phase is identi1047297ed as graphite25 Raman spectra were acquired for both solid and liquid phases
Raman spectra of the carbonaceous material are very sensitive tochanges in the order degree The1047297rst order bands of the Raman spectraof carbonaceous material are characterised by the G band at approxi-mately 1580 cmminus1 typical of crystalline or ordered graphite the Dband at approximately 1350 cmminus1 and the Dprime band at approximately1620 cmminus1 typical of disordered or defect bearing carbonaceous mate-rial (Aoya et al 2010 Luque et al 1998 Thomsen and Reich 2000Vidano et al 1981) Carbonaceous materials also exhibit a strong
Raman band in the range 2500ndash
2800 cmminus1
which corresponds to the
overtone of the D band This band appears in the second-order Ramanspectra and is called the Gprime band (Pimenta et al 2007) The decreasein the order degree of graphite is also evident by the development of an asymmetry andbandbroadening in the second-order peak and a de-crease in resolution among its constituent bands (Pasteris and Chou1998) If the position of the G band is not affected by the wavelengthof thelaser the Raman frequency of theD band increases with theexci-tation energy (Kawashima and Katagiri 1995 Matthews et al 1999
Vidano et al 1981) Moreover the ratio of the integrated intensity of the D and G bands (IDIG) decreases with increasing laser energyWith our equipment (λ = 6328 nm) the D band is expected at ap-
proximately 1330 cmminus1 The spectra acquired on Type 4 inclusions(Fig 7A B) have frequencies in the range 1332ndash1336 cmminus1 and1578ndash1581 cmminus1 forD and G bands respectivelyThe Dprime bandis alwayspresent as a shoulder on the high-frequency side of the G peak in therange 1613ndash1620 cmminus1 In the region of second-order bands an unre-solved doublet or a large band at approximately 2664ndash2709 cmminus1 oc-curs The D band is broad with low intensity when compared to the Gband and with a very low IDIG ratio (016ndash030) The degree of crystal-linity is represented by the length of ordered crystals along the a
Fig 6 Ramanspectra ofthe carbonicphase inexample Type 2a(A)Type2b (B)andType3 (C) 1047298uid inclusions The intensity scale of the inset is unchanged
Fig 7 Raman spectraof graphite in Type4 1047298uidinclusions (A B) compared with those of
graphite from wall-rock (C)
251E Salvioli-Mariani et al Journal of Geochemical Exploration 158 (2015) 243ndash 256
7172019 Salvioli et al 2015
httpslidepdfcomreaderfullsalvioli-et-al-2015 1014
crystallographic direction designated as L a (Pasteris and Chou 1998)The IDIG ratio and L a are negatively correlated and the most disorderedgraphite is characterised by the highest IDIG and the lowest L a values(Pasteris and Chou 1998) According to the general formula proposedby Pimenta et al (2007) which can be applied to any laser line we ob-tained the crystallite size L a in the range 1300ndash2400 Aring The calculatedparameters and the widths of the D and Gprime bands suggest a fairly gooddegree of graphite crystallinity which is comparable to that of naturally
or laboratory-produced graphite (Luque et al 1998 Pasteris and Chou1998 Perraki et al 2006 Satish-Kumar 2005 Wopenka and Pasteris1993) The Raman spectra of trapped graphite are all similar ( Fig 7AB) suggesting that the precipitation of graphite occurred from the hy-drothermal 1047298uid
The liquid portion associated with trapped graphite contains CO2CH4 and liquid H2O The typical peaks of CO2 (1280ndash1281 and1383ndash1384 cmminus1) and of CH4 (2910ndash2913 cmminus1) were observedusing the 6328 nm laser (Fig 8A) Moreover the peak for liquid H2Oat 3250ndash3252 cmminus1 was detected with the 4731 nm laser (Fig 8B)
Because of thepresenceof graphite in thehost rocks (quartz-sericiticand graphitic schists) for comparison we acquired 6 Raman spectra onthis carbonaceous materials They are completely different from thoseobtained for the graphite in the 1047298uid inclusions (Fig 7C) The D band(1329ndash1334 cmminus1) has a higherintensitythan that ofgraphitein thein-clusions and sometimes reaches the same intensity as the G band at1580ndash1583 cmminus1 Therefore the IDIG ratios are higher (095ndash208)and L a is lower (200ndash400 Aring) supporting the presence of fairly disor-dered graphite The shape of the spectra and the calculated parametersof graphite from the host rock of Canan are comparable to those of thegraphite from metapelites of chlorite facies (Luque et al 1998Wopenka and Pasteris 1993)
5 Discussion
Four types of 1047298uid inclusions have been found in the quartz crystalsfrom the mineralising veins of Dos Bocas a representative example of
gold deposit at Canan Some 1047298uidinclusions are along fractures crossingone or more crystals (Type 1 S inclusions)The most important1047298uid in-clusions constitute discontinuous trails which can suggest crystalgrowth zones (Type 2) The 1047298uid inclusion associations formed by L-richand V-richinclusions (Type 2 P andPS inclusions) andthe presenceof trails entirely constituted by V-rich inclusions(Type 3 PS andS inclu-sions) suggest that the hydrothermal 1047298uid suffered 1047298uid immiscibility(boiling) The trapped 1047298uid consists of an aqueous solution (H2Ondash
NaClndash
KCl with 09ndash
48 wt NaCl equivalent) plus a CO2ndash
CH4 1047298
uid(80ndash90 mol CO2) As shown by Bowers and Helgeson (1983) a pres-sure drop moves the H2O-carbonic phase solvus towards higher tem-perature which causes a decrease of carbonic gas solubility and theexsolution of CO2 (and CH4) gas from the water-rich 1047298uid according tothe Henrys law In geological environments such as Canan where thetectonics aredominatedby strikendashslip fault systems thefracture forma-tion after deformation causes a rapid and immediate reduction in pres-sure The occurrence of some inclusions naturally decrepitated can beexplained by pressure drop The presence of Type 3b 1047298uid inclusionswhich exhibit retrograde condensation further supports the occurrenceof such a pressure drop
Because of 1047298uid immiscibility the total homogenisation temperaturecan be considered as the trapping temperature Isochores have been re-constructed for Type 2 1047298uid inclusions combining the results frommicrothermometry and Raman analyses using the software package of Bakker and Brown (2003) and the equations of Bakker (1999) andDuan et al (1992b) Trapping pressures of 05ndash14 kbar were obtainedThe coexistence of different types of 1047298uid inclusions and their similarvalues of Th suggest that they can be related to the same hydrothermalprocess which wasresponsiblefor the gold mineralisation at CananThedifferentamounts of water andcarbonic1047298uids inthe inclusions is due tothe 1047298uid immiscibility where the H2O-rich 1047298uid is in Type 2a inclusionsand the CO2ndashCH4-rich 1047298uid in Types 2b and 3 inclusions Finally Type 4inclusions would represent the inclusions (both Type 2 and 3) wherethe conditions for graphite precipitation have been achieved
The graphite of the1047298uid inclusions (Type 4) is similar to that precip-itated from hydrothermal1047298uids This indicates that graphite depositionoccurred before or contemporaneously of the entrapment of the 1047298uid
The degree of crystallinity of graphite in the 1047298uid inclusions is higherthan that observed in the graphite from the host quartz-sericitic andgraphitic schists (Fig 7) Nonetheless this does not exclude the pres-ence of a metamorphic component in the mineralising 1047298uids
Equilibrium of graphite in the hydrothermal1047298uid allows the evalua-tion of oxygen fugacity The calculated atomic ratio XO [O(O + H)] isinthe range 032ndash041 (Fig 9) which is typical of slightly reduced 1047298uids(Cesare 1995 Huizenga 2011) Considering temperatures of 300 degCand pressures of 14 10 and 05 kbar (Tt and Pt respectively) graphitesaturation conditions (aC = 1) and the composition of the carbonicphase as inferred by Raman spectroscopy the calculated f O2 is aboutminus342 log unit (ie about 16 log unit above theQFM buffer) This resultis consistent with that obtained using the HSC chemistry software log f O2 asymp minus376 plusmn 25 which permitted us to calculate also the activity
of dissolved hydrogen ions at equilibrium condition between the con-stituents H2OCO2 CH4 Na+ andClminuspH=29plusmn04Itcanbeobservedthat our estimated pH value is low but this range of acidity is not un-common in1047298uid inclusions (egBenison 2013) including gold deposits(Boiron et al 1999 Pokrovski et al 2014)
According to Roedder (1984)thepHin 1047298uid inclusions can be calcu-lated or determined In the latter case the opening of the 1047298uid inclu-sions implies the loss of the trapped gases It follows that the pH isdetermined on a 1047298uid other than the original and which has undergonebasi1047297cation due to the loss of gas
The composition of Type 2 inclusions plotted in the ternary diagramCOH falls within the stability 1047297eld of graphite (towards the CO2 vertexFig 9) and the 1047298uid associated with graphite in Type 4 inclusions isalso constituted by H2OndashCO2ndashCH4 These features support precipitation
of graphite by the reaction CH4 + CO2rarr
2 C + 2 H2O The decrease of
Fig 8 Raman spectraof the1047298uid portion of Type 4 1047298uid inclusions (A)CO2 and CH4 have
been obtained by 6328 nm laser (B) H2O by 4731 nm laser
252 E Salvioli-Mariani et al Journal of Geochemical Exploration 158 (2015) 243ndash 256
7172019 Salvioli et al 2015
httpslidepdfcomreaderfullsalvioli-et-al-2015 1114
temperature andor the increase of pressure move the reaction towardsthe products In our case a combination of cooling and decompressionacted on the system so that the variation of temperature and pressurecannot be responsible for the precipitation of graphite According toHuizenga (2011) the precipitation of graphite is in1047298uenced by XO
value and oxygen fugacity the best conditions for precipitation areXO = 033 and QFM-2 b log f O2 b QFM + 1 Small variations from
these values prevent the precipitation or cause consumption of earlyprecipitated graphite XO values and f O2 of our Type 2 1047298uid inclusions(see above) agree with the Huizenga (2011) data and indicate thatsome 1047298uid inclusions were able to precipitate graphite
The H2S content and the oxygen fugacity of the hydrothermal 1047298uidsaffect the solubility of gold In H 2S-rich 1047298uids Au(HS)2
minus andAu(HS)deg are the dominant Au-complexes and gold has high solubil-ity (Au N 100 ppb) whereas in H2S-poor 1047298uids the gold solubilitydecreases and AuCl2
minus is the dominant stable complex (Gammonsand Williams-Jones 1997) When the partial pressure of H 2S is1047297xed by the magnetitendashpyrite pair the Au bisulphide complex isstable at T b 450 degC and the chloride complex at higher temperature(Mikucki 1998) At high oxygen fugacity H2S is oxidised and thusthe mobility of gold as bisulphide decreases considerably ( Gammons
and Williams-Jones 1997) Experimental studies at temperatures of 350ndash500 degC and pressures of 05ndash1 kbar have shown that Au(HS)2
minus isthe dominant Au complex in near neutral to weakly acidic solutions inthe presence of the K-feldsparndashmuscovitendashquartz mineral associationand at pyritendashpyrrhotitendashmagnetite buffer conditions (Tagirov et al2005)
Many of the conditions employed in the experiments mentionedabove match those of the Canan ore deposit 1047298uid inclusions indicatethe presence of low salinity and low temperature (T b 400 degC) hydro-thermal 1047298uids and XRD data (Mattioli et al 2014) show that the wall-rocks contain the K-feldsparndashmuscovitendashquartzndashpyritendashpyrrothitendashmagnetite association (Table 1) However the hydrothermal 1047298uids atCanan seem to be extremely acidic (pH = 29) which makes Au(HS)degmore stable than Au(HS)2
minus and themost abundant complex in thesolu-
tions (cf also Heinrich et al 2004 Pokrovski et al 2014) Hence we
infer that the gold of Canan was transported by hydrothermal 1047298uids asAu(HS)deg complex
Activity diagrams are a powerful graphical tool for depicting the sta-bility of dissolved species and solid and gas phases with respect to thecomposition of the coexisting solution Calculations on Au speciationwere performed under the mean conditions estimated by the analysisof the 1047298uid inclusions and the results plotted in log f O2-pH diagrams(Fig 10) The decrease in solubility of the Aundashsulphide complexes can
be ascribed both to the fracturation-induced pressure drop andthe con-centration of sulphur in solution According to Mattioli et al (2014) thegold deposit of Canan was formed by the hydrothermal 1047298uid activityalong fractures produced by tectonics Opening and lateral expansionof the fractures produce a pressure drop on the 1047298uids themselves andboiling of the dissolved gases The 1047298uid composition affects the depthof boiling which is an ef 1047297cient mechanism for gold precipitation(Hedenquist et al 1992 Pokrovski et al 2014 Robb 2010 Sibson1987) Boiling produced the exsolution of H2S which in turn caused adecrease in the solubility of theAundashsulphide complexes and the precip-itation of gold (Fig 10) In the case of the Canan deposit boiling repre-sents only the initial phase of gold deposition In fact the main bodyof thegoldmineof Canan is located in metamorphic rocks cutby quartzveins where hydrothermal 1047298uids altered the primary mineralogy andchanged their composition and ability to carry gold in solution In theore deposit Au coexists with sulphides and in particular small grainsof pure gold are surrounded by pyriteand other sulphides This suggeststhat gold was deposited by reactions involving 1047298uids containing Au-Scomplexes and the wall-rock containing chalcophile elements particu-larly Fe a process known as ldquosulphidationrdquo (Williams-Jones et al 2009and references therein Robb 2010) At Canan Fe is abundant in freshwall-rocksfor thepresence of biotiteand chloriteThese minerals disap-pear in the vicinity of quartz veins of the ore deposit where the highestconcentration of gold and sulphides are observed (Mattioli et al 2014)During the alteration of biotite and chlorite Fe is released into the hy-drothermal 1047298uids and likely produces the following reaction with theAundashsulphide complexes
AuethHSTHORN∘ethaqTHORN thorn 05Fe2thornharr05FeS2ethPyriteTHORN thorn H
thorn thorn Au∘ethGoldTHORN eth1THORN
Under equilibrium conditions and assumingP = 1400barT = 300 degCand the water activity H2O = 1 the resulting log K is 53151 (ΔGdeg-R = minus 5833 kJ molminus1) The high value of the equilibrium constant Kand the highly negative value of ΔGdegR indicate that the reaction has aspontaneous tendency towards the products According to Robb (2010)these reactions occur in dynamic systems where kinetics predominatesover equilibrium conditions Therefore it is very unlikely that reaction(1) occurs under equilibrium conditions in an open natural system Be-cause of the continuous supply of Au(HS)deg from the hydrothermal 1047298uidsand Fe2+ from the alteration of biotite and chlorite (within the zones of 1047298uid-rock interaction) reaction (1) is imbalanced and pushed towardsthe products by favouring the deposition of gold and sulphides This isin agreement with Pokrovski et al (2014) who state that the interactionof sulphur-rich hydrothermal 1047298uids and Fe2+-rich wall rocks(sulphidation) is one of the main processes leading to the precipitationof gold
Additionally the activity of sulphur in the 1047298uids is responsible forthe solubilisation and transport of gold At Canan the activity of Sought to be at least 10minus2 Above this value the composition of hydro-thermal 1047298uid plots in the stability 1047297eld of Au(HS)deg (Fig 10) Withlower concentrations of S (and lower pressure) the transportof gold oc-curs as chloride (Fig 10L M and N) If iron is no longer available aftercomplete alteration of biotite and chlorite the deposition of goldcould be represented by the reaction
AuethHSTHORN∘ethaqTHORN thorn 05H2ethgTHORNharrH2SethgTHORN thorn Au∘ethGoldTHORN eth2THORN
where log K = 69130 (ΔGdegR = minus 7586 kJ molminus1) at T = 300 degC and
P = 1400 bar indicates once again a spontaneous tendency towards
Fig 9 Ternary CndashOndashH diagramshowing thecarbon saturatedsurface (solid line) at 300degCand1400 barcalculated by Perple_Xsoftware(J Connollywwwperplexethzch) Dashedlines represent the compositional triangle H2OndashCO2ndashCH4 dotted 1047297eld Type 2a inclusionsstriped 1047297eld Type 2b inclusions Lines of constant XO 035 and 040 (dot-dashed lines) arealso shownTheopencircles andthenumbers initalics indicate f O2
1047298uid relative toQFM buff-er in log10 units (log f O2
1047298uidndashlog f O2
QFM) for 1047298uids in equilibrium with graphite
253E Salvioli-Mariani et al Journal of Geochemical Exploration 158 (2015) 243ndash 256
7172019 Salvioli et al 2015
httpslidepdfcomreaderfullsalvioli-et-al-2015 1214
theproducts andthe presence of H2 agrees with the reducing conditions(log f O2 asymp minus376) found in the hydrothermal 1047298uids of Canan Reaction(2) would be effective during boiling andor decompression (cf Boyle1969 Pokrovski et al 2014) Similarly to reaction (1) the dynamicsystem conditions (the continuous supply of Au(HS)deg and loss of H2S)favour the kinetic of the reaction (2) and con1047297rm the statements of Robb (2010) and Sibson (1987) on the ef 1047297ciency of this process forgold deposition Finally the kinetics of reaction (1) is further increasedby the alteration of feldspar and muscovite in kaolinite and diaspore (cfMattioli et al 2014) The mineral alterations subtract H+ from the solu-
tion (Drever 1997) favouring the precipitation of Au
6 Concluding remarks
The quartz veins associated with gold mineralisations from DosBocas (Canan area Lepaguare District east-central Honduras) are richin 1047298uid inclusions of four main types Type 1 mdash S two-phaseaqueous-rich inclusions Type 2 mdash P to PS aqueous-rich inclusionswith an H2O-rich liquid and a CO2ndashCH4-bearing liquid Type 3 mdash PSto S CO2ndashCH4-rich inclusions with a very small amount of waterand Type 4 mdash graphite-bearing aqueousndashcarbonic 1047298uid
The association of L-rich and V-rich inclusions (Type 2) and the oc-currence of trails containing only V-rich inclusions (Type 3) support a
1047298uid immiscibility (boiling)of the hydrothermal1047298uidThe hydrothermal
trapped 1047298uid is constituted by H2O + alkali chloride + CO2 plusmn CH4 Thecalculated salinity varies from 09 to 48 wt NaCl equivalent
The immiscibility of 1047298uids can be related to a pressure decrease dueto both the opening of fractures and upward 1047298ow of 1047298uids At Canan astrikendashslip fault systemis responsible for the fracturing of the metamor-phic wall-rocks Thisgeological setting with the mineralogicalpetrolog-ical and geochemical features supports an orogenic character of theinvestigated gold deposits
In some 1047298uid inclusions the occurrence of graphite with typical fea-tures of graphite precipitated from hydrothermal 1047298uids suggests that
the deposition of graphite was prior or concomitant with the entrap-ment of the 1047298uid Moreover the occurrence of graphite associated towater andcarbonic1047298uidssupports the presence of a metamorphic com-ponent in the mineralising 1047298uid
Microthermometric and spectroscopic data from 1047298uid inclusionssuggest that the gold mineralisations at Canan formed at T = 300 degCunderP=500ndash1400 barsThecalculated oxygenfugacityand pH valuesof the hydrothermal 1047298uids are approximately minus 376 plusmn 25 log unit(1 log unit above the QFM buffer) and 29 plusmn 04 respectively
The hydrothermal 1047298uids contained sulphur (activity of S ge 10minus2)assuggested by the association of gold with sulphides including pyriteand chalcopyrite For the above chemical and physical conditions themost abundant sulphur specie carrying gold in solution is the Au(HS)degcomplex Several causes are responsible for the precipitation of gold in
the Canan area 1 mdash boiling following the pressure drop caused by
Fig 10 Activity diagrams for the system AundashCndashClndashSndashH2O at 300 degC Au and H2O activity 10minus7 (~10 ppb) and 100 respectively Cl 10minus098 and C buffered by graphite (see ldquoCalculationmethodsrdquo) Variable values of pressure are considered 1400 bar (A B C and D) 1000 bar (E F G and H) 500 bar (I L M and N) Activities of total dissolved S are 10minus1 (A E and I)10minus2 (B F and L) 10minus3 (C G and M) and buffered by pyrite (D H and N) Green 1047297eld represents the mean composition of the 1047298uid inclusions (pH = 29 plusmn 04 log f O2 = minus 376 plusmn25) Red lines limit the 1047297elds of Au species dashed black lines the S species and dashed blue lines the carbon species The thickness of the red lines corresponds to an uncertainty of log [Au] = plusmn01 or log [H2O] = plusmn02
254 E Salvioli-Mariani et al Journal of Geochemical Exploration 158 (2015) 243ndash 256
7172019 Salvioli et al 2015
httpslidepdfcomreaderfullsalvioli-et-al-2015 1314
tectonic andor hydrothermal 1047298uids activity 2 mdash sulphidation triggeredby the liberation of metal cations during the alteration of ma1047297c min-erals of the wall-rocks 3 mdash hydrothermal alteration of feldspars andphyllosilicates of the wall-rocks
Acknowledgements
The authors wish to thank M Menichetti for providing samples of
the quartz veins and the Goldlake Group for the permission to publishthe results of this study Special thanks are due to John Ridley for theuseful and encouraging suggestions which have noticeably improvedthequality of this paperSincere thanksare dueto BJStacey forimprov-ing the English
References
Alvarez-Gogravemez JA Meijer PT Martigravenez-Digraveaz JJ Capote R2008 Constraintsfrom1047297nite element modeling on the active tectonics of northern Central America andthe Middle America Trench Tectonics 27 TC1008 httpdxdoiorg1010292007TC002162
Andrada de Palomera P van Ruitenbeek FJA van der Meer FK Fernaacutendez R 2012Geochemical indicators of gold-rich zones in the La Jose1047297na epithermal depositDeseado Massif Argentina Ore Geol Rev 45 61ndash80
Aoya M Kouketsu Y Endo S Shimizu H Mizukami T Nakamura D Wallis S 2010Extending the applicability of the Raman carbonaceous-material geothermometer
using data from contact metamorphic rocks J Metamorph Geol 28 895ndash914Bakker RJ 1999 Adaptation of the Bowers and Helgeson (1983) equation of state to the
H2OndashCO2ndashCH4ndashN2ndashNaCl system Chem Geol 154 225ndash236Bakker RJ Brown PE 2003 Computer modelling in 1047298uid inclusion research In
Samson I Anderson A Marshall D (Eds) Fluid Inclusions Analysis and interpreta-tion Mineralogical Association of Canada Short Course Series 32 pp 175ndash212
Benison KC 2013 Acid saline 1047298uid inclusions examples from modern and Permianextreme lake systems Geo1047298uids 13 579ndash593
Bersani D Salvioli-Mariani E Mattioli M Menichetti M Lottici PP 2009 Raman andmicro-thermometric investigation of the 1047298uid inclusions in quartz in a gold-richformation from Lepaguare mining district Spectrochim Acta A 73 443ndash449
Bethke CM Yeakel S 2008 The Geochemists Workbenchreg mdash Release 7 GWB Essen-tials Guide mdash Hydrogeology Program University of Illinois (100 pp)
Bodnar RJ Reynolds TJ Kuehn CA 1985 Fluid-inclusion systematics in epithermalsystems In Berger BR Bethke PM (Eds) Geology and Geochemistry of Epithermal Systems Reviews in Economic Geology 2 pp 73ndash97
Boiron MC Cathelineau M Essarraj S Lespinasse M Sellier E 1991 Characterizationof the relationships between deformation 1047298uid migration and Au deposition in
quartz veins methodology and modelling Proceedings Gold 91 AA BalkemaPublishers Brazil pp 637ndash643Boiron MC Moissette A Cathelineau M Banks D Monnin C Dubessy J 1999
Detailed determination of palaeo1047298uid chemistry an integrated study of sulphate-volatile rich brines and aquo-carbonic 1047298uids in quartz veins from Ouro Fino(Brazil) Chem Geol 154 179ndash192
Botros NS 2004 A new classi1047297cation of the gold deposits of Egypt Ore Geol Rev 251ndash37
Bowers TS Helgeson HW 1983 Calculation of the thermodynamic and geochemicalconsequences of nonideal mixing in the system H2OndashCO2ndashNaCl on phase relationsin geological systems equation of state for H 2OndashCO2ndashNaCl 1047298uids at high pressuresand temperatures Geochim Cosmochim Acta 47 1247ndash1275
Boyle RW 1969 Hydrothermal transport and deposition of gold Econ Geol 64112ndash115
Burke EAJ 2001 Raman microspectrometry of 1047298uid inclusions Lithos 55 139ndash158Callaghan T 2001 Geology and host-rock alteration of the Henty and Mount Julia gold
deposits western Tasmania Econ Geol 96 (5) 1073ndash1088Carpenter RH 1954 Geology and ore deposits of the Rosario mining district and San
Juancito Mountains Honduras Central America Geol Soc Am Bull 65 23ndash28
Cepedal A Fuertes-Fuente M Martiacuten-Izard A Garciacutea-Nieto J Boiron MC 2013 Anintrusion-related gold deposit (IRGD) in the NW of Spain the Linares deposit igne-ous rocks veins and related alterations ore features and 1047298uids involved
J Geochem Explor 124 101ndash126Cesare B 1995 Graphite precipitation in CndashOndashH 1047298uid inclusions closed system compo-
sitional and density changes and thermobarometric implications Contrib MineralPetrol 122 25ndash33
Cleverley JS Bastrakov EN 2005 K2GWB Utility for Generating Thermodynamic DataFiles for the GeochemistsWorkbenchregat 0ndash1000 degC and 1ndash5000 bar from UT2K andthe UNITHERM Database
Collins PLF 1979 Gas hydrates in CO2-bearing 1047298uid inclusions and the use of freezingdata for estimation of salinity Econ Geol 74 1435ndash1444
Deksissa DJ Koeberl C 2005 Geochemistry alteration and genesis of gold mineraliza-tion in the Okote area southern Ethiopia Geochem J 38 307ndash331
Diamond LW 2003 Introduction to gas-bearing aqueous 1047298uid inclusions In Samson IAnderson A Marshall D (Eds) Fluid Inclusions Analysis and interpretation Miner-alogical Association of Canada Short Course Series 32 pp 101ndash158
Drever JI 1997 The Geochemistry of Natural Water Prentice-Hall Upper Saddle RiverNew Jersey
Drobe J Cann RM 2000 CundashAu skarn mineralization Minas de Oro District HondurasCentral America Explor Min Geol 9 51ndash63
Duan Z MoslashllerN WeareJK 1992a An equation of state for theCH4ndashCO2ndashH2O systemI Pure systems from 0 to 1000 degC and 0 to 8000 bar Geochim Cosmochim Acta 562605ndash2617
Duan Z MoslashllerN Weare JK 1992b Anequationof statefor the CH4ndashCO2ndashH2O systemII Mixtures from 50 to 1000 degC and 0 to 1000 bar Geochim Cosmochim Acta 562619ndash2631
Esmaeily D Afshooni SZ Mirnejad H Rashidnejad-e-Omran N 2012 Mass changesduring hydrothermal alteration associated with gold mineralization in the Astanehgranitoid rocks western Iran Geochem Explor Environ Anal 12 161ndash175
Gammons GH Williams-Jones AE 1997 Chemical mobility of Gold in the porphyryndash
epithermal environment Econ Geol 92 45ndash59Garofalo P Matthaumli SK Heinrich C 2002 Three dimensional geometry ore
distribution and time-integrated mass transfer through the quartzndashtourma-linendashgold vein network of the Sigma deposit (Abitibi belt mdash Canada) Geo1047298uids2 217ndash232
Garrabos Y Tufeu R Le Neindre B 1980 Rayleigh and Raman scattering near the crit-ical point of carbon dioxide J Chem Phys 72 (8) 4637ndash4651
Groves DI Goldfarb RJ Robert F Hart CJR 2003 Gold deposits in metamorphicbelts overview of current understanding outstanding problems future researchand exploration signi1047297cance Econ Geol 98 1ndash29
Guzman-Speziale M 2001 Active seismic deformation in the grabens of northern Cen-tral America and its relationship to the relative motion of the North AmericandashCarib-bean plate boundary Tectonophysics 337 39ndash51
Hedenquist JF Reyes AG Simmons SF Taguchi S 1992 The thermal and geochemi-cal structure of geothermal and epithermal systems a framework for interpreting1047298uid inclusion data Eur J Mineral 4 989ndash1015
Heinrich CA Driesner TStefaacutensson ASeward TM 2004 Magmatic vapor contractionand the transport of gold from the porphyry environment to epithermal ore deposits
Geology 32 761ndash764Horne G Clark G Pushkar P 1976 Pre-Cretaceous rocks of northwestern Honduras
basement terrane in Sierra de Omoa AAPG Bull 60 566ndash583Huizenga J-M 2005 COH an Excel Spreadsheet for composition calculations in the Cndash
OndashH 1047298uid system Comput Geosci 31 797ndash800Huizenga J-M 2011 Thermodynamic modelling of a cooling CndashOndashH 1047298uid-graphite sys-
tem implications for hydrothermal graphite precipitation Miner Deposita 46 23ndash33KawakamiY YamamotoJ Kagi H2003 Micro-Ramandensimeterfor CO2 inclusionsin
mantle-derived minerals Appl Spectrom 57 (11) 1333ndash1339Kawashima Y Katagiri G 1995 Fundamentals overtones and combinations in the
Raman spectrum of graphite Phys Rev B 52 10053ndash10059Klein EL Koppe JC Moura CAV 2002 Geology and geochemistry of the Caxis gold
deposit and geochronology of thegold-hosting Caxias Microtonalite Sao Luis Cratonnorthern Brazil J S Am Earth Sci 14 837ndash849
Lin F Bodnar RJ Becker SP 2007 Experimentaldetermination of the RamanCH4 sym-metric stretching (ν1) band position from 1ndash650 bar and 03ndash22 degC application to1047298uid inclusion studies Geochim Cosmochim Acta 71 3746ndash3756
Lu W Chou I-M Burruss RC Song Y 2007 An uni1047297ed equation for calculating meth-ane vapor pressures in the CH4ndashH2O system with measured Raman shifts GeochimCosmochim Acta 71 3969ndash3978
Luque FJ Pasteris JD Wopenka B Rodas M Barrenechea JF 1998 Natural 1047298uid-deposited graphite mineralogical characteristics and mechanisms of formationAm J Sci 298 471ndash498
Mann P Burke K 1984 Neotectonics of the Caribbean Rev Geophys 22 309ndash362Mann P Burke K 1988 Cenozoic rift formation in the northern Caribbean Geology 12
732ndash736MatthewsMJ Pimenta MA Dresselhaus GDresselhaus MS Endo M1999 Originof
the dispersive effects of the Raman D band in carbon materials Phys Rev B 59R6585ndashR6588
Mattioli M Menichetti M Renzulli A Toscani L Salvioli-Mariani E Suarez P 2014Genesis of the hydrothermal gold deposits in the Canan area Lepaguare DistrictHonduras Int J Earth Sci 103 901ndash928
Mikucki EJ 1998 Hydrothermal transport and depositional processes in Archean lode-gold systems a review Ore Geol Rev 13 307ndash321
Mills RA Hugh KE Feray DE Swolfs HC 1967 Mesozoic stratigraphy of HondurasAAPG Bull 51 1711ndash1786
Miur TL 2002 The Hemlo gold deposit Ontario Canada principal deposit characteris-
tics and constraints on mineralization Ore Geol Rev 21 1ndash
66Pasteris JD Chou I-M 1998 Fluid-deposited graphitic inclusions in quartz comparisonbetween KTB (German Continental Deep-Drilling) core samples and arti1047297cially re-equilibrated natural inclusions Geochim Cosmochim Acta 62 109ndash122
Perraki M Proyer A Mposkos E Kaindl R Hoinkes G 2006 Raman micro-spectroscopy on diamond graphite and other carbon polymorphs from theultrahigh-pressure metamorphic Kimi Complex of the Rhodope Metamorphic Prov-ince NE Greece Earth Planet Sci Lett 24 672ndash685
Phillips GN Powell R 2009 Formation of gold deposits review and evaluation of thecontinuum model Earth-Sci Rev 94 1ndash12
Pimenta MA Dresselhaus G Dresselhaus MS Canccedilado LG Jorio A Saito R 2007Studying disorder in graphite-based systems by Raman spectroscopy Phys ChemChem Phys 9 1276ndash1291
Pokrovski GS Akin1047297ev NN Borisova AY Zotov AV Kouzmanov K 2014 Gold spe-ciation and transport in geological 1047298uids insights from experiments and physicalndashchemical modelling Geol Soc Lond Spec Publ httpdxdoiorg101144SP4024(Online First)
Ratschbacher L Franz L Min M Bachmenn R Martens U Stanek K Stubner KNelson BK Herrmann U Weber B Loacutepez-Martiacutenez M Jonckheere R Sperner
255E Salvioli-Mariani et al Journal of Geochemical Exploration 158 (2015) 243ndash 256
7172019 Salvioli et al 2015
httpslidepdfcomreaderfullsalvioli-et-al-2015 1414
B Tichomirowa M McWilliams MO Gordon M Meschede M Bock P 2009 TheNorth AmericanndashCaribbean plate boundary in MeacutexicondashGuatemalandashHonduras In
James KH Lorente MA Pindell JL (Eds) The Origin and Evolution of the Caribbe-an Plate Geological Society London Special Publications 328 pp 219ndash293
Ridley JR Diamond LW 2000 Fluid chemistry of orogenic lode-gold deposits and im-plications for genetic models In Hagemann S Brown PE (Eds) Gold in 2000 Re-views in Economic Geology 13 pp 141ndash162
Ridley J Hagemann SG 1999 Interpretation of post-entrapment 1047298uid-inclusion re-equilibration at the Three Mile Hill Marvel Loch and Grif 1047297ns Find high-temperature lode-gold deposits Yilgran Craton Western Australia Chem Geol154 257ndash278
Robb L 2010 Introduction to Ore-forming Processes Blackwell Publishing Malden USARoberts RJ Irving EM 1957 Mineral deposits of Central America U S Geol Surv Bull1034 205
Roedder E 1984 Fluid inclusions Reviews in Mineralogy 12 Mineralogical Society of America Washington DC
Rogers RD Mann P 2007 Transtensional deformation of the western CaribbeanndashNorthAmerica plate boundary zone In Mann P (Ed) Geologic and Tectonic Developmentof the Caribbean Plate in Northern Central America Geological Society of AmericaSpecial Paper 428 pp 37ndash64
Rogers RD Mann P Emmet PA 2007 Tectonic terranes of the Chortis block based onintegration of regional aeromagnetic and geologic data In Mann P (Ed) Geologicand Tectonic Development of the Caribbean Plate in Northern Central America Geo-logical Society of America Special Paper 428 pp 65ndash88
Roine A 2009 HSC Chemistryreg 70 Users Guide ndash Volume frac12 ndash Chemical Reaction andEquilibrium Software With Extensive Thermochemical Database and Flowsheet Sim-ulation Outotec Information Center Finland
Samson IM Williams-Jones A-E Ault KM Gagnon JE 2008 Source of 1047298uids formingdistal ZnndashPbndashAg skarns evidence from laser ablation-inductively coupled plasma-mass spectrometry analysis of 1047298uid inclusions from El Mochito Honduras Geology
36 947ndash950Satish-Kumar M 2005 Graphite-bearing CO2-1047298uid inclusions in granulites insights on
graphite precipitation and carbon isotope evolution Geochim Cosmochim Acta 69(15) 3841ndash3856
Seitz JF Pasteris JD 1990 Theoretical and practical aspect of differential partitioning of gases by clathrate hydrates in 1047298uid inclusions Geochim Cosmochim Acta 54631ndash639
Shvarov YV 2008 HCh new potentialities for the thermodynamic simulation of geo-chemical systems offered by Windows Geochem Int 46 834ndash839
Sibson RH 1987 Earthquake rupturing as a mineralizing agent in hydrothermal sys-tems Geology 15 701ndash704
Silva-Romo G 2008 GuayapendashPapalutla fault system a continuous Cretaceous structurefrom southern Mexicoto theChortis BlockTectonicimplicationsGeology 3675ndash78
Spooner ETC Bray CJ Wood PC Burrows DR Callan NJ 1987 Aundashquartz vein andCundashAundashAgndashMondashanhydrite mineralization HollingerndashMcIntyre Mine Timmins
Ontario δ13C values (McIntyre) Fluid inclusion gas geochemistry pressure (depth)estimation and H2OndashCO2 phase separation as a precipitation and dilation mecha-nism Ont Geol Surv Misc Pap 136 35ndash56
Su W Xi B Xia B Zhang X Hu R 2008 Visible gold in arsenian pyrite at theShuiyindong Carlin-type gold deposit Guizhou China implications for the environ-ment and processes of ore formation Ore Geol Rev 33 667ndash679
Sundblad K Cumming GL Krstic D 1991 Lead isotope evidence for the formation of epithermalgold quartzveins in theChortis BlockNicaragua Econ Geol 86 944ndash959
Tagirov BR Salvi S Schott J Baranova NN 2005 Experimental study of goldndash
hydrosulphide complexing in aqueous solutions at 350ndash500 degC 500 and 1000 barsusing mineral buffers Geochim Cosmochim Acta 69 (8) 2119ndash2132
ThieryR Vanden Kerkhof AM Dubessy J 1994 vX properties of CH4ndash
CO2 and CO2ndash
N21047298uid inclusions modelling for T b 31 degC and P b 400 bars Eur J Mineral 6 753ndash771
Thomsen C Reich S 2000 Double resonant Raman scattering in graphite Phys RevLett 85 5214ndash5217
Van den Kerkhof AM 1988 The System CO2ndashCH4ndashN2 in Fluid Inclusions TheoreticalModelling and Geochemical Applications (PhD Thesis Amsterdam)
Vanden Kerkhof AM OlsenSN 1990 A natural example of superdense CO2 inclusionsmicrothermometry and Raman analysis Geochim Cosmochim Acta 54 895ndash901
Van den Kerkhof AM Thiery R 2001 Carbonic inclusions Lithos 55 49ndash68Vidano RP Ischbach DB Willis LJ Loehr TM 1981 Observation of Raman band
shifting with excitation wavelength for carbons and graphites Solid State Commun39 341ndash344
Wang X Chou I-M Hu W Burruss RC Sun Q Song Y 2011 Raman spectroscopymeasurements of CO2 density experimental calibration with high-pressure opticalcell (HPOC) and fused silica capillary capsule (FSCC) with application to 1047298uid inclu-sion observations Geochim Cosmochim Acta 75 4080ndash4093
Williams-Jones AE Bowell RJ Migdisov AA 2009 Gold in solution Elements 5281ndash287
Williams-Jones AE Samson IM Ault KM Gagnon JE Fryer BJ 2010 The genesis of
distal zinc skarns evidence from the Mochito deposit Honduras Econ Geol 1051411ndash1440
Wopenka B Pasteris JD 1993 Structural characterization of kerogens to granulite-facies graphite applicability of Raman microprobe spectroscopy Am Mineral 78533ndash557
Yang F Mao J Wang Y Bierlein F 2006 Geology and geochemistry of the Bulongquartzndashbarite vein-type gold deposit in the Xinjiang Uygur Autonomous RegionChina Ore Geol Rev 29 52ndash76
Zhang YG Frantz JD 1987 Determination of the homogenization temperatures anddensities of supercritical 1047298uids in the system NaClndashKClndashCaCl2ndashH2O using synthetic1047298uid inclusions Chem Geol 64 335ndash350
256 E Salvioli-Mariani et al Journal of Geochemical Exploration 158 (2015) 243ndash 256
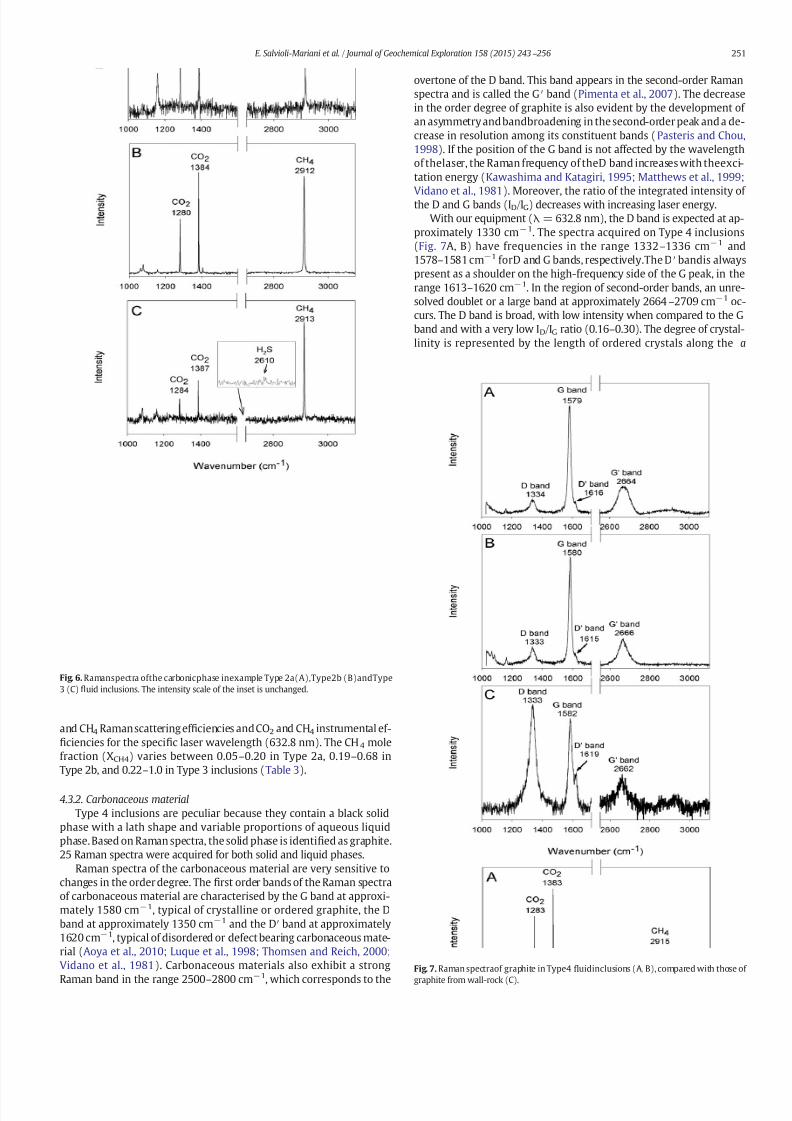
7172019 Salvioli et al 2015
httpslidepdfcomreaderfullsalvioli-et-al-2015 914
and CH4 Ramanscattering ef 1047297ciencies andCO2 and CH4 instrumental ef-1047297ciencies for the speci1047297c laser wavelength (6328 nm) The CH4 molefraction (XCH4) varies between 005ndash020 in Type 2a 019ndash068 inType 2b and 022ndash10 in Type 3 inclusions (Table 3)
432 Carbonaceous material
Type 4 inclusions are peculiar because they contain a black solidphase with a lath shape and variable proportions of aqueous liquidphase Based on Raman spectra the solid phase is identi1047297ed as graphite25 Raman spectra were acquired for both solid and liquid phases
Raman spectra of the carbonaceous material are very sensitive tochanges in the order degree The1047297rst order bands of the Raman spectraof carbonaceous material are characterised by the G band at approxi-mately 1580 cmminus1 typical of crystalline or ordered graphite the Dband at approximately 1350 cmminus1 and the Dprime band at approximately1620 cmminus1 typical of disordered or defect bearing carbonaceous mate-rial (Aoya et al 2010 Luque et al 1998 Thomsen and Reich 2000Vidano et al 1981) Carbonaceous materials also exhibit a strong
Raman band in the range 2500ndash
2800 cmminus1
which corresponds to the
overtone of the D band This band appears in the second-order Ramanspectra and is called the Gprime band (Pimenta et al 2007) The decreasein the order degree of graphite is also evident by the development of an asymmetry andbandbroadening in the second-order peak and a de-crease in resolution among its constituent bands (Pasteris and Chou1998) If the position of the G band is not affected by the wavelengthof thelaser the Raman frequency of theD band increases with theexci-tation energy (Kawashima and Katagiri 1995 Matthews et al 1999
Vidano et al 1981) Moreover the ratio of the integrated intensity of the D and G bands (IDIG) decreases with increasing laser energyWith our equipment (λ = 6328 nm) the D band is expected at ap-
proximately 1330 cmminus1 The spectra acquired on Type 4 inclusions(Fig 7A B) have frequencies in the range 1332ndash1336 cmminus1 and1578ndash1581 cmminus1 forD and G bands respectivelyThe Dprime bandis alwayspresent as a shoulder on the high-frequency side of the G peak in therange 1613ndash1620 cmminus1 In the region of second-order bands an unre-solved doublet or a large band at approximately 2664ndash2709 cmminus1 oc-curs The D band is broad with low intensity when compared to the Gband and with a very low IDIG ratio (016ndash030) The degree of crystal-linity is represented by the length of ordered crystals along the a
Fig 6 Ramanspectra ofthe carbonicphase inexample Type 2a(A)Type2b (B)andType3 (C) 1047298uid inclusions The intensity scale of the inset is unchanged
Fig 7 Raman spectraof graphite in Type4 1047298uidinclusions (A B) compared with those of
graphite from wall-rock (C)
251E Salvioli-Mariani et al Journal of Geochemical Exploration 158 (2015) 243ndash 256
7172019 Salvioli et al 2015
httpslidepdfcomreaderfullsalvioli-et-al-2015 1014
crystallographic direction designated as L a (Pasteris and Chou 1998)The IDIG ratio and L a are negatively correlated and the most disorderedgraphite is characterised by the highest IDIG and the lowest L a values(Pasteris and Chou 1998) According to the general formula proposedby Pimenta et al (2007) which can be applied to any laser line we ob-tained the crystallite size L a in the range 1300ndash2400 Aring The calculatedparameters and the widths of the D and Gprime bands suggest a fairly gooddegree of graphite crystallinity which is comparable to that of naturally
or laboratory-produced graphite (Luque et al 1998 Pasteris and Chou1998 Perraki et al 2006 Satish-Kumar 2005 Wopenka and Pasteris1993) The Raman spectra of trapped graphite are all similar ( Fig 7AB) suggesting that the precipitation of graphite occurred from the hy-drothermal 1047298uid
The liquid portion associated with trapped graphite contains CO2CH4 and liquid H2O The typical peaks of CO2 (1280ndash1281 and1383ndash1384 cmminus1) and of CH4 (2910ndash2913 cmminus1) were observedusing the 6328 nm laser (Fig 8A) Moreover the peak for liquid H2Oat 3250ndash3252 cmminus1 was detected with the 4731 nm laser (Fig 8B)
Because of thepresenceof graphite in thehost rocks (quartz-sericiticand graphitic schists) for comparison we acquired 6 Raman spectra onthis carbonaceous materials They are completely different from thoseobtained for the graphite in the 1047298uid inclusions (Fig 7C) The D band(1329ndash1334 cmminus1) has a higherintensitythan that ofgraphitein thein-clusions and sometimes reaches the same intensity as the G band at1580ndash1583 cmminus1 Therefore the IDIG ratios are higher (095ndash208)and L a is lower (200ndash400 Aring) supporting the presence of fairly disor-dered graphite The shape of the spectra and the calculated parametersof graphite from the host rock of Canan are comparable to those of thegraphite from metapelites of chlorite facies (Luque et al 1998Wopenka and Pasteris 1993)
5 Discussion
Four types of 1047298uid inclusions have been found in the quartz crystalsfrom the mineralising veins of Dos Bocas a representative example of
gold deposit at Canan Some 1047298uidinclusions are along fractures crossingone or more crystals (Type 1 S inclusions)The most important1047298uid in-clusions constitute discontinuous trails which can suggest crystalgrowth zones (Type 2) The 1047298uid inclusion associations formed by L-richand V-richinclusions (Type 2 P andPS inclusions) andthe presenceof trails entirely constituted by V-rich inclusions(Type 3 PS andS inclu-sions) suggest that the hydrothermal 1047298uid suffered 1047298uid immiscibility(boiling) The trapped 1047298uid consists of an aqueous solution (H2Ondash
NaClndash
KCl with 09ndash
48 wt NaCl equivalent) plus a CO2ndash
CH4 1047298
uid(80ndash90 mol CO2) As shown by Bowers and Helgeson (1983) a pres-sure drop moves the H2O-carbonic phase solvus towards higher tem-perature which causes a decrease of carbonic gas solubility and theexsolution of CO2 (and CH4) gas from the water-rich 1047298uid according tothe Henrys law In geological environments such as Canan where thetectonics aredominatedby strikendashslip fault systems thefracture forma-tion after deformation causes a rapid and immediate reduction in pres-sure The occurrence of some inclusions naturally decrepitated can beexplained by pressure drop The presence of Type 3b 1047298uid inclusionswhich exhibit retrograde condensation further supports the occurrenceof such a pressure drop
Because of 1047298uid immiscibility the total homogenisation temperaturecan be considered as the trapping temperature Isochores have been re-constructed for Type 2 1047298uid inclusions combining the results frommicrothermometry and Raman analyses using the software package of Bakker and Brown (2003) and the equations of Bakker (1999) andDuan et al (1992b) Trapping pressures of 05ndash14 kbar were obtainedThe coexistence of different types of 1047298uid inclusions and their similarvalues of Th suggest that they can be related to the same hydrothermalprocess which wasresponsiblefor the gold mineralisation at CananThedifferentamounts of water andcarbonic1047298uids inthe inclusions is due tothe 1047298uid immiscibility where the H2O-rich 1047298uid is in Type 2a inclusionsand the CO2ndashCH4-rich 1047298uid in Types 2b and 3 inclusions Finally Type 4inclusions would represent the inclusions (both Type 2 and 3) wherethe conditions for graphite precipitation have been achieved
The graphite of the1047298uid inclusions (Type 4) is similar to that precip-itated from hydrothermal1047298uids This indicates that graphite depositionoccurred before or contemporaneously of the entrapment of the 1047298uid
The degree of crystallinity of graphite in the 1047298uid inclusions is higherthan that observed in the graphite from the host quartz-sericitic andgraphitic schists (Fig 7) Nonetheless this does not exclude the pres-ence of a metamorphic component in the mineralising 1047298uids
Equilibrium of graphite in the hydrothermal1047298uid allows the evalua-tion of oxygen fugacity The calculated atomic ratio XO [O(O + H)] isinthe range 032ndash041 (Fig 9) which is typical of slightly reduced 1047298uids(Cesare 1995 Huizenga 2011) Considering temperatures of 300 degCand pressures of 14 10 and 05 kbar (Tt and Pt respectively) graphitesaturation conditions (aC = 1) and the composition of the carbonicphase as inferred by Raman spectroscopy the calculated f O2 is aboutminus342 log unit (ie about 16 log unit above theQFM buffer) This resultis consistent with that obtained using the HSC chemistry software log f O2 asymp minus376 plusmn 25 which permitted us to calculate also the activity
of dissolved hydrogen ions at equilibrium condition between the con-stituents H2OCO2 CH4 Na+ andClminuspH=29plusmn04Itcanbeobservedthat our estimated pH value is low but this range of acidity is not un-common in1047298uid inclusions (egBenison 2013) including gold deposits(Boiron et al 1999 Pokrovski et al 2014)
According to Roedder (1984)thepHin 1047298uid inclusions can be calcu-lated or determined In the latter case the opening of the 1047298uid inclu-sions implies the loss of the trapped gases It follows that the pH isdetermined on a 1047298uid other than the original and which has undergonebasi1047297cation due to the loss of gas
The composition of Type 2 inclusions plotted in the ternary diagramCOH falls within the stability 1047297eld of graphite (towards the CO2 vertexFig 9) and the 1047298uid associated with graphite in Type 4 inclusions isalso constituted by H2OndashCO2ndashCH4 These features support precipitation
of graphite by the reaction CH4 + CO2rarr
2 C + 2 H2O The decrease of
Fig 8 Raman spectraof the1047298uid portion of Type 4 1047298uid inclusions (A)CO2 and CH4 have
been obtained by 6328 nm laser (B) H2O by 4731 nm laser
252 E Salvioli-Mariani et al Journal of Geochemical Exploration 158 (2015) 243ndash 256
7172019 Salvioli et al 2015
httpslidepdfcomreaderfullsalvioli-et-al-2015 1114
temperature andor the increase of pressure move the reaction towardsthe products In our case a combination of cooling and decompressionacted on the system so that the variation of temperature and pressurecannot be responsible for the precipitation of graphite According toHuizenga (2011) the precipitation of graphite is in1047298uenced by XO
value and oxygen fugacity the best conditions for precipitation areXO = 033 and QFM-2 b log f O2 b QFM + 1 Small variations from
these values prevent the precipitation or cause consumption of earlyprecipitated graphite XO values and f O2 of our Type 2 1047298uid inclusions(see above) agree with the Huizenga (2011) data and indicate thatsome 1047298uid inclusions were able to precipitate graphite
The H2S content and the oxygen fugacity of the hydrothermal 1047298uidsaffect the solubility of gold In H 2S-rich 1047298uids Au(HS)2
minus andAu(HS)deg are the dominant Au-complexes and gold has high solubil-ity (Au N 100 ppb) whereas in H2S-poor 1047298uids the gold solubilitydecreases and AuCl2
minus is the dominant stable complex (Gammonsand Williams-Jones 1997) When the partial pressure of H 2S is1047297xed by the magnetitendashpyrite pair the Au bisulphide complex isstable at T b 450 degC and the chloride complex at higher temperature(Mikucki 1998) At high oxygen fugacity H2S is oxidised and thusthe mobility of gold as bisulphide decreases considerably ( Gammons
and Williams-Jones 1997) Experimental studies at temperatures of 350ndash500 degC and pressures of 05ndash1 kbar have shown that Au(HS)2
minus isthe dominant Au complex in near neutral to weakly acidic solutions inthe presence of the K-feldsparndashmuscovitendashquartz mineral associationand at pyritendashpyrrhotitendashmagnetite buffer conditions (Tagirov et al2005)
Many of the conditions employed in the experiments mentionedabove match those of the Canan ore deposit 1047298uid inclusions indicatethe presence of low salinity and low temperature (T b 400 degC) hydro-thermal 1047298uids and XRD data (Mattioli et al 2014) show that the wall-rocks contain the K-feldsparndashmuscovitendashquartzndashpyritendashpyrrothitendashmagnetite association (Table 1) However the hydrothermal 1047298uids atCanan seem to be extremely acidic (pH = 29) which makes Au(HS)degmore stable than Au(HS)2
minus and themost abundant complex in thesolu-
tions (cf also Heinrich et al 2004 Pokrovski et al 2014) Hence we
infer that the gold of Canan was transported by hydrothermal 1047298uids asAu(HS)deg complex
Activity diagrams are a powerful graphical tool for depicting the sta-bility of dissolved species and solid and gas phases with respect to thecomposition of the coexisting solution Calculations on Au speciationwere performed under the mean conditions estimated by the analysisof the 1047298uid inclusions and the results plotted in log f O2-pH diagrams(Fig 10) The decrease in solubility of the Aundashsulphide complexes can
be ascribed both to the fracturation-induced pressure drop andthe con-centration of sulphur in solution According to Mattioli et al (2014) thegold deposit of Canan was formed by the hydrothermal 1047298uid activityalong fractures produced by tectonics Opening and lateral expansionof the fractures produce a pressure drop on the 1047298uids themselves andboiling of the dissolved gases The 1047298uid composition affects the depthof boiling which is an ef 1047297cient mechanism for gold precipitation(Hedenquist et al 1992 Pokrovski et al 2014 Robb 2010 Sibson1987) Boiling produced the exsolution of H2S which in turn caused adecrease in the solubility of theAundashsulphide complexes and the precip-itation of gold (Fig 10) In the case of the Canan deposit boiling repre-sents only the initial phase of gold deposition In fact the main bodyof thegoldmineof Canan is located in metamorphic rocks cutby quartzveins where hydrothermal 1047298uids altered the primary mineralogy andchanged their composition and ability to carry gold in solution In theore deposit Au coexists with sulphides and in particular small grainsof pure gold are surrounded by pyriteand other sulphides This suggeststhat gold was deposited by reactions involving 1047298uids containing Au-Scomplexes and the wall-rock containing chalcophile elements particu-larly Fe a process known as ldquosulphidationrdquo (Williams-Jones et al 2009and references therein Robb 2010) At Canan Fe is abundant in freshwall-rocksfor thepresence of biotiteand chloriteThese minerals disap-pear in the vicinity of quartz veins of the ore deposit where the highestconcentration of gold and sulphides are observed (Mattioli et al 2014)During the alteration of biotite and chlorite Fe is released into the hy-drothermal 1047298uids and likely produces the following reaction with theAundashsulphide complexes
AuethHSTHORN∘ethaqTHORN thorn 05Fe2thornharr05FeS2ethPyriteTHORN thorn H
thorn thorn Au∘ethGoldTHORN eth1THORN
Under equilibrium conditions and assumingP = 1400barT = 300 degCand the water activity H2O = 1 the resulting log K is 53151 (ΔGdeg-R = minus 5833 kJ molminus1) The high value of the equilibrium constant Kand the highly negative value of ΔGdegR indicate that the reaction has aspontaneous tendency towards the products According to Robb (2010)these reactions occur in dynamic systems where kinetics predominatesover equilibrium conditions Therefore it is very unlikely that reaction(1) occurs under equilibrium conditions in an open natural system Be-cause of the continuous supply of Au(HS)deg from the hydrothermal 1047298uidsand Fe2+ from the alteration of biotite and chlorite (within the zones of 1047298uid-rock interaction) reaction (1) is imbalanced and pushed towardsthe products by favouring the deposition of gold and sulphides This isin agreement with Pokrovski et al (2014) who state that the interactionof sulphur-rich hydrothermal 1047298uids and Fe2+-rich wall rocks(sulphidation) is one of the main processes leading to the precipitationof gold
Additionally the activity of sulphur in the 1047298uids is responsible forthe solubilisation and transport of gold At Canan the activity of Sought to be at least 10minus2 Above this value the composition of hydro-thermal 1047298uid plots in the stability 1047297eld of Au(HS)deg (Fig 10) Withlower concentrations of S (and lower pressure) the transportof gold oc-curs as chloride (Fig 10L M and N) If iron is no longer available aftercomplete alteration of biotite and chlorite the deposition of goldcould be represented by the reaction
AuethHSTHORN∘ethaqTHORN thorn 05H2ethgTHORNharrH2SethgTHORN thorn Au∘ethGoldTHORN eth2THORN
where log K = 69130 (ΔGdegR = minus 7586 kJ molminus1) at T = 300 degC and
P = 1400 bar indicates once again a spontaneous tendency towards
Fig 9 Ternary CndashOndashH diagramshowing thecarbon saturatedsurface (solid line) at 300degCand1400 barcalculated by Perple_Xsoftware(J Connollywwwperplexethzch) Dashedlines represent the compositional triangle H2OndashCO2ndashCH4 dotted 1047297eld Type 2a inclusionsstriped 1047297eld Type 2b inclusions Lines of constant XO 035 and 040 (dot-dashed lines) arealso shownTheopencircles andthenumbers initalics indicate f O2
1047298uid relative toQFM buff-er in log10 units (log f O2
1047298uidndashlog f O2
QFM) for 1047298uids in equilibrium with graphite
253E Salvioli-Mariani et al Journal of Geochemical Exploration 158 (2015) 243ndash 256
7172019 Salvioli et al 2015
httpslidepdfcomreaderfullsalvioli-et-al-2015 1214
theproducts andthe presence of H2 agrees with the reducing conditions(log f O2 asymp minus376) found in the hydrothermal 1047298uids of Canan Reaction(2) would be effective during boiling andor decompression (cf Boyle1969 Pokrovski et al 2014) Similarly to reaction (1) the dynamicsystem conditions (the continuous supply of Au(HS)deg and loss of H2S)favour the kinetic of the reaction (2) and con1047297rm the statements of Robb (2010) and Sibson (1987) on the ef 1047297ciency of this process forgold deposition Finally the kinetics of reaction (1) is further increasedby the alteration of feldspar and muscovite in kaolinite and diaspore (cfMattioli et al 2014) The mineral alterations subtract H+ from the solu-
tion (Drever 1997) favouring the precipitation of Au
6 Concluding remarks
The quartz veins associated with gold mineralisations from DosBocas (Canan area Lepaguare District east-central Honduras) are richin 1047298uid inclusions of four main types Type 1 mdash S two-phaseaqueous-rich inclusions Type 2 mdash P to PS aqueous-rich inclusionswith an H2O-rich liquid and a CO2ndashCH4-bearing liquid Type 3 mdash PSto S CO2ndashCH4-rich inclusions with a very small amount of waterand Type 4 mdash graphite-bearing aqueousndashcarbonic 1047298uid
The association of L-rich and V-rich inclusions (Type 2) and the oc-currence of trails containing only V-rich inclusions (Type 3) support a
1047298uid immiscibility (boiling)of the hydrothermal1047298uidThe hydrothermal
trapped 1047298uid is constituted by H2O + alkali chloride + CO2 plusmn CH4 Thecalculated salinity varies from 09 to 48 wt NaCl equivalent
The immiscibility of 1047298uids can be related to a pressure decrease dueto both the opening of fractures and upward 1047298ow of 1047298uids At Canan astrikendashslip fault systemis responsible for the fracturing of the metamor-phic wall-rocks Thisgeological setting with the mineralogicalpetrolog-ical and geochemical features supports an orogenic character of theinvestigated gold deposits
In some 1047298uid inclusions the occurrence of graphite with typical fea-tures of graphite precipitated from hydrothermal 1047298uids suggests that
the deposition of graphite was prior or concomitant with the entrap-ment of the 1047298uid Moreover the occurrence of graphite associated towater andcarbonic1047298uidssupports the presence of a metamorphic com-ponent in the mineralising 1047298uid
Microthermometric and spectroscopic data from 1047298uid inclusionssuggest that the gold mineralisations at Canan formed at T = 300 degCunderP=500ndash1400 barsThecalculated oxygenfugacityand pH valuesof the hydrothermal 1047298uids are approximately minus 376 plusmn 25 log unit(1 log unit above the QFM buffer) and 29 plusmn 04 respectively
The hydrothermal 1047298uids contained sulphur (activity of S ge 10minus2)assuggested by the association of gold with sulphides including pyriteand chalcopyrite For the above chemical and physical conditions themost abundant sulphur specie carrying gold in solution is the Au(HS)degcomplex Several causes are responsible for the precipitation of gold in
the Canan area 1 mdash boiling following the pressure drop caused by
Fig 10 Activity diagrams for the system AundashCndashClndashSndashH2O at 300 degC Au and H2O activity 10minus7 (~10 ppb) and 100 respectively Cl 10minus098 and C buffered by graphite (see ldquoCalculationmethodsrdquo) Variable values of pressure are considered 1400 bar (A B C and D) 1000 bar (E F G and H) 500 bar (I L M and N) Activities of total dissolved S are 10minus1 (A E and I)10minus2 (B F and L) 10minus3 (C G and M) and buffered by pyrite (D H and N) Green 1047297eld represents the mean composition of the 1047298uid inclusions (pH = 29 plusmn 04 log f O2 = minus 376 plusmn25) Red lines limit the 1047297elds of Au species dashed black lines the S species and dashed blue lines the carbon species The thickness of the red lines corresponds to an uncertainty of log [Au] = plusmn01 or log [H2O] = plusmn02
254 E Salvioli-Mariani et al Journal of Geochemical Exploration 158 (2015) 243ndash 256
7172019 Salvioli et al 2015
httpslidepdfcomreaderfullsalvioli-et-al-2015 1314
tectonic andor hydrothermal 1047298uids activity 2 mdash sulphidation triggeredby the liberation of metal cations during the alteration of ma1047297c min-erals of the wall-rocks 3 mdash hydrothermal alteration of feldspars andphyllosilicates of the wall-rocks
Acknowledgements
The authors wish to thank M Menichetti for providing samples of
the quartz veins and the Goldlake Group for the permission to publishthe results of this study Special thanks are due to John Ridley for theuseful and encouraging suggestions which have noticeably improvedthequality of this paperSincere thanksare dueto BJStacey forimprov-ing the English
References
Alvarez-Gogravemez JA Meijer PT Martigravenez-Digraveaz JJ Capote R2008 Constraintsfrom1047297nite element modeling on the active tectonics of northern Central America andthe Middle America Trench Tectonics 27 TC1008 httpdxdoiorg1010292007TC002162
Andrada de Palomera P van Ruitenbeek FJA van der Meer FK Fernaacutendez R 2012Geochemical indicators of gold-rich zones in the La Jose1047297na epithermal depositDeseado Massif Argentina Ore Geol Rev 45 61ndash80
Aoya M Kouketsu Y Endo S Shimizu H Mizukami T Nakamura D Wallis S 2010Extending the applicability of the Raman carbonaceous-material geothermometer
using data from contact metamorphic rocks J Metamorph Geol 28 895ndash914Bakker RJ 1999 Adaptation of the Bowers and Helgeson (1983) equation of state to the
H2OndashCO2ndashCH4ndashN2ndashNaCl system Chem Geol 154 225ndash236Bakker RJ Brown PE 2003 Computer modelling in 1047298uid inclusion research In
Samson I Anderson A Marshall D (Eds) Fluid Inclusions Analysis and interpreta-tion Mineralogical Association of Canada Short Course Series 32 pp 175ndash212
Benison KC 2013 Acid saline 1047298uid inclusions examples from modern and Permianextreme lake systems Geo1047298uids 13 579ndash593
Bersani D Salvioli-Mariani E Mattioli M Menichetti M Lottici PP 2009 Raman andmicro-thermometric investigation of the 1047298uid inclusions in quartz in a gold-richformation from Lepaguare mining district Spectrochim Acta A 73 443ndash449
Bethke CM Yeakel S 2008 The Geochemists Workbenchreg mdash Release 7 GWB Essen-tials Guide mdash Hydrogeology Program University of Illinois (100 pp)
Bodnar RJ Reynolds TJ Kuehn CA 1985 Fluid-inclusion systematics in epithermalsystems In Berger BR Bethke PM (Eds) Geology and Geochemistry of Epithermal Systems Reviews in Economic Geology 2 pp 73ndash97
Boiron MC Cathelineau M Essarraj S Lespinasse M Sellier E 1991 Characterizationof the relationships between deformation 1047298uid migration and Au deposition in
quartz veins methodology and modelling Proceedings Gold 91 AA BalkemaPublishers Brazil pp 637ndash643Boiron MC Moissette A Cathelineau M Banks D Monnin C Dubessy J 1999
Detailed determination of palaeo1047298uid chemistry an integrated study of sulphate-volatile rich brines and aquo-carbonic 1047298uids in quartz veins from Ouro Fino(Brazil) Chem Geol 154 179ndash192
Botros NS 2004 A new classi1047297cation of the gold deposits of Egypt Ore Geol Rev 251ndash37
Bowers TS Helgeson HW 1983 Calculation of the thermodynamic and geochemicalconsequences of nonideal mixing in the system H2OndashCO2ndashNaCl on phase relationsin geological systems equation of state for H 2OndashCO2ndashNaCl 1047298uids at high pressuresand temperatures Geochim Cosmochim Acta 47 1247ndash1275
Boyle RW 1969 Hydrothermal transport and deposition of gold Econ Geol 64112ndash115
Burke EAJ 2001 Raman microspectrometry of 1047298uid inclusions Lithos 55 139ndash158Callaghan T 2001 Geology and host-rock alteration of the Henty and Mount Julia gold
deposits western Tasmania Econ Geol 96 (5) 1073ndash1088Carpenter RH 1954 Geology and ore deposits of the Rosario mining district and San
Juancito Mountains Honduras Central America Geol Soc Am Bull 65 23ndash28
Cepedal A Fuertes-Fuente M Martiacuten-Izard A Garciacutea-Nieto J Boiron MC 2013 Anintrusion-related gold deposit (IRGD) in the NW of Spain the Linares deposit igne-ous rocks veins and related alterations ore features and 1047298uids involved
J Geochem Explor 124 101ndash126Cesare B 1995 Graphite precipitation in CndashOndashH 1047298uid inclusions closed system compo-
sitional and density changes and thermobarometric implications Contrib MineralPetrol 122 25ndash33
Cleverley JS Bastrakov EN 2005 K2GWB Utility for Generating Thermodynamic DataFiles for the GeochemistsWorkbenchregat 0ndash1000 degC and 1ndash5000 bar from UT2K andthe UNITHERM Database
Collins PLF 1979 Gas hydrates in CO2-bearing 1047298uid inclusions and the use of freezingdata for estimation of salinity Econ Geol 74 1435ndash1444
Deksissa DJ Koeberl C 2005 Geochemistry alteration and genesis of gold mineraliza-tion in the Okote area southern Ethiopia Geochem J 38 307ndash331
Diamond LW 2003 Introduction to gas-bearing aqueous 1047298uid inclusions In Samson IAnderson A Marshall D (Eds) Fluid Inclusions Analysis and interpretation Miner-alogical Association of Canada Short Course Series 32 pp 101ndash158
Drever JI 1997 The Geochemistry of Natural Water Prentice-Hall Upper Saddle RiverNew Jersey
Drobe J Cann RM 2000 CundashAu skarn mineralization Minas de Oro District HondurasCentral America Explor Min Geol 9 51ndash63
Duan Z MoslashllerN WeareJK 1992a An equation of state for theCH4ndashCO2ndashH2O systemI Pure systems from 0 to 1000 degC and 0 to 8000 bar Geochim Cosmochim Acta 562605ndash2617
Duan Z MoslashllerN Weare JK 1992b Anequationof statefor the CH4ndashCO2ndashH2O systemII Mixtures from 50 to 1000 degC and 0 to 1000 bar Geochim Cosmochim Acta 562619ndash2631
Esmaeily D Afshooni SZ Mirnejad H Rashidnejad-e-Omran N 2012 Mass changesduring hydrothermal alteration associated with gold mineralization in the Astanehgranitoid rocks western Iran Geochem Explor Environ Anal 12 161ndash175
Gammons GH Williams-Jones AE 1997 Chemical mobility of Gold in the porphyryndash
epithermal environment Econ Geol 92 45ndash59Garofalo P Matthaumli SK Heinrich C 2002 Three dimensional geometry ore
distribution and time-integrated mass transfer through the quartzndashtourma-linendashgold vein network of the Sigma deposit (Abitibi belt mdash Canada) Geo1047298uids2 217ndash232
Garrabos Y Tufeu R Le Neindre B 1980 Rayleigh and Raman scattering near the crit-ical point of carbon dioxide J Chem Phys 72 (8) 4637ndash4651
Groves DI Goldfarb RJ Robert F Hart CJR 2003 Gold deposits in metamorphicbelts overview of current understanding outstanding problems future researchand exploration signi1047297cance Econ Geol 98 1ndash29
Guzman-Speziale M 2001 Active seismic deformation in the grabens of northern Cen-tral America and its relationship to the relative motion of the North AmericandashCarib-bean plate boundary Tectonophysics 337 39ndash51
Hedenquist JF Reyes AG Simmons SF Taguchi S 1992 The thermal and geochemi-cal structure of geothermal and epithermal systems a framework for interpreting1047298uid inclusion data Eur J Mineral 4 989ndash1015
Heinrich CA Driesner TStefaacutensson ASeward TM 2004 Magmatic vapor contractionand the transport of gold from the porphyry environment to epithermal ore deposits
Geology 32 761ndash764Horne G Clark G Pushkar P 1976 Pre-Cretaceous rocks of northwestern Honduras
basement terrane in Sierra de Omoa AAPG Bull 60 566ndash583Huizenga J-M 2005 COH an Excel Spreadsheet for composition calculations in the Cndash
OndashH 1047298uid system Comput Geosci 31 797ndash800Huizenga J-M 2011 Thermodynamic modelling of a cooling CndashOndashH 1047298uid-graphite sys-
tem implications for hydrothermal graphite precipitation Miner Deposita 46 23ndash33KawakamiY YamamotoJ Kagi H2003 Micro-Ramandensimeterfor CO2 inclusionsin
mantle-derived minerals Appl Spectrom 57 (11) 1333ndash1339Kawashima Y Katagiri G 1995 Fundamentals overtones and combinations in the
Raman spectrum of graphite Phys Rev B 52 10053ndash10059Klein EL Koppe JC Moura CAV 2002 Geology and geochemistry of the Caxis gold
deposit and geochronology of thegold-hosting Caxias Microtonalite Sao Luis Cratonnorthern Brazil J S Am Earth Sci 14 837ndash849
Lin F Bodnar RJ Becker SP 2007 Experimentaldetermination of the RamanCH4 sym-metric stretching (ν1) band position from 1ndash650 bar and 03ndash22 degC application to1047298uid inclusion studies Geochim Cosmochim Acta 71 3746ndash3756
Lu W Chou I-M Burruss RC Song Y 2007 An uni1047297ed equation for calculating meth-ane vapor pressures in the CH4ndashH2O system with measured Raman shifts GeochimCosmochim Acta 71 3969ndash3978
Luque FJ Pasteris JD Wopenka B Rodas M Barrenechea JF 1998 Natural 1047298uid-deposited graphite mineralogical characteristics and mechanisms of formationAm J Sci 298 471ndash498
Mann P Burke K 1984 Neotectonics of the Caribbean Rev Geophys 22 309ndash362Mann P Burke K 1988 Cenozoic rift formation in the northern Caribbean Geology 12
732ndash736MatthewsMJ Pimenta MA Dresselhaus GDresselhaus MS Endo M1999 Originof
the dispersive effects of the Raman D band in carbon materials Phys Rev B 59R6585ndashR6588
Mattioli M Menichetti M Renzulli A Toscani L Salvioli-Mariani E Suarez P 2014Genesis of the hydrothermal gold deposits in the Canan area Lepaguare DistrictHonduras Int J Earth Sci 103 901ndash928
Mikucki EJ 1998 Hydrothermal transport and depositional processes in Archean lode-gold systems a review Ore Geol Rev 13 307ndash321
Mills RA Hugh KE Feray DE Swolfs HC 1967 Mesozoic stratigraphy of HondurasAAPG Bull 51 1711ndash1786
Miur TL 2002 The Hemlo gold deposit Ontario Canada principal deposit characteris-
tics and constraints on mineralization Ore Geol Rev 21 1ndash
66Pasteris JD Chou I-M 1998 Fluid-deposited graphitic inclusions in quartz comparisonbetween KTB (German Continental Deep-Drilling) core samples and arti1047297cially re-equilibrated natural inclusions Geochim Cosmochim Acta 62 109ndash122
Perraki M Proyer A Mposkos E Kaindl R Hoinkes G 2006 Raman micro-spectroscopy on diamond graphite and other carbon polymorphs from theultrahigh-pressure metamorphic Kimi Complex of the Rhodope Metamorphic Prov-ince NE Greece Earth Planet Sci Lett 24 672ndash685
Phillips GN Powell R 2009 Formation of gold deposits review and evaluation of thecontinuum model Earth-Sci Rev 94 1ndash12
Pimenta MA Dresselhaus G Dresselhaus MS Canccedilado LG Jorio A Saito R 2007Studying disorder in graphite-based systems by Raman spectroscopy Phys ChemChem Phys 9 1276ndash1291
Pokrovski GS Akin1047297ev NN Borisova AY Zotov AV Kouzmanov K 2014 Gold spe-ciation and transport in geological 1047298uids insights from experiments and physicalndashchemical modelling Geol Soc Lond Spec Publ httpdxdoiorg101144SP4024(Online First)
Ratschbacher L Franz L Min M Bachmenn R Martens U Stanek K Stubner KNelson BK Herrmann U Weber B Loacutepez-Martiacutenez M Jonckheere R Sperner
255E Salvioli-Mariani et al Journal of Geochemical Exploration 158 (2015) 243ndash 256
7172019 Salvioli et al 2015
httpslidepdfcomreaderfullsalvioli-et-al-2015 1414
B Tichomirowa M McWilliams MO Gordon M Meschede M Bock P 2009 TheNorth AmericanndashCaribbean plate boundary in MeacutexicondashGuatemalandashHonduras In
James KH Lorente MA Pindell JL (Eds) The Origin and Evolution of the Caribbe-an Plate Geological Society London Special Publications 328 pp 219ndash293
Ridley JR Diamond LW 2000 Fluid chemistry of orogenic lode-gold deposits and im-plications for genetic models In Hagemann S Brown PE (Eds) Gold in 2000 Re-views in Economic Geology 13 pp 141ndash162
Ridley J Hagemann SG 1999 Interpretation of post-entrapment 1047298uid-inclusion re-equilibration at the Three Mile Hill Marvel Loch and Grif 1047297ns Find high-temperature lode-gold deposits Yilgran Craton Western Australia Chem Geol154 257ndash278
Robb L 2010 Introduction to Ore-forming Processes Blackwell Publishing Malden USARoberts RJ Irving EM 1957 Mineral deposits of Central America U S Geol Surv Bull1034 205
Roedder E 1984 Fluid inclusions Reviews in Mineralogy 12 Mineralogical Society of America Washington DC
Rogers RD Mann P 2007 Transtensional deformation of the western CaribbeanndashNorthAmerica plate boundary zone In Mann P (Ed) Geologic and Tectonic Developmentof the Caribbean Plate in Northern Central America Geological Society of AmericaSpecial Paper 428 pp 37ndash64
Rogers RD Mann P Emmet PA 2007 Tectonic terranes of the Chortis block based onintegration of regional aeromagnetic and geologic data In Mann P (Ed) Geologicand Tectonic Development of the Caribbean Plate in Northern Central America Geo-logical Society of America Special Paper 428 pp 65ndash88
Roine A 2009 HSC Chemistryreg 70 Users Guide ndash Volume frac12 ndash Chemical Reaction andEquilibrium Software With Extensive Thermochemical Database and Flowsheet Sim-ulation Outotec Information Center Finland
Samson IM Williams-Jones A-E Ault KM Gagnon JE 2008 Source of 1047298uids formingdistal ZnndashPbndashAg skarns evidence from laser ablation-inductively coupled plasma-mass spectrometry analysis of 1047298uid inclusions from El Mochito Honduras Geology
36 947ndash950Satish-Kumar M 2005 Graphite-bearing CO2-1047298uid inclusions in granulites insights on
graphite precipitation and carbon isotope evolution Geochim Cosmochim Acta 69(15) 3841ndash3856
Seitz JF Pasteris JD 1990 Theoretical and practical aspect of differential partitioning of gases by clathrate hydrates in 1047298uid inclusions Geochim Cosmochim Acta 54631ndash639
Shvarov YV 2008 HCh new potentialities for the thermodynamic simulation of geo-chemical systems offered by Windows Geochem Int 46 834ndash839
Sibson RH 1987 Earthquake rupturing as a mineralizing agent in hydrothermal sys-tems Geology 15 701ndash704
Silva-Romo G 2008 GuayapendashPapalutla fault system a continuous Cretaceous structurefrom southern Mexicoto theChortis BlockTectonicimplicationsGeology 3675ndash78
Spooner ETC Bray CJ Wood PC Burrows DR Callan NJ 1987 Aundashquartz vein andCundashAundashAgndashMondashanhydrite mineralization HollingerndashMcIntyre Mine Timmins
Ontario δ13C values (McIntyre) Fluid inclusion gas geochemistry pressure (depth)estimation and H2OndashCO2 phase separation as a precipitation and dilation mecha-nism Ont Geol Surv Misc Pap 136 35ndash56
Su W Xi B Xia B Zhang X Hu R 2008 Visible gold in arsenian pyrite at theShuiyindong Carlin-type gold deposit Guizhou China implications for the environ-ment and processes of ore formation Ore Geol Rev 33 667ndash679
Sundblad K Cumming GL Krstic D 1991 Lead isotope evidence for the formation of epithermalgold quartzveins in theChortis BlockNicaragua Econ Geol 86 944ndash959
Tagirov BR Salvi S Schott J Baranova NN 2005 Experimental study of goldndash
hydrosulphide complexing in aqueous solutions at 350ndash500 degC 500 and 1000 barsusing mineral buffers Geochim Cosmochim Acta 69 (8) 2119ndash2132
ThieryR Vanden Kerkhof AM Dubessy J 1994 vX properties of CH4ndash
CO2 and CO2ndash
N21047298uid inclusions modelling for T b 31 degC and P b 400 bars Eur J Mineral 6 753ndash771
Thomsen C Reich S 2000 Double resonant Raman scattering in graphite Phys RevLett 85 5214ndash5217
Van den Kerkhof AM 1988 The System CO2ndashCH4ndashN2 in Fluid Inclusions TheoreticalModelling and Geochemical Applications (PhD Thesis Amsterdam)
Vanden Kerkhof AM OlsenSN 1990 A natural example of superdense CO2 inclusionsmicrothermometry and Raman analysis Geochim Cosmochim Acta 54 895ndash901
Van den Kerkhof AM Thiery R 2001 Carbonic inclusions Lithos 55 49ndash68Vidano RP Ischbach DB Willis LJ Loehr TM 1981 Observation of Raman band
shifting with excitation wavelength for carbons and graphites Solid State Commun39 341ndash344
Wang X Chou I-M Hu W Burruss RC Sun Q Song Y 2011 Raman spectroscopymeasurements of CO2 density experimental calibration with high-pressure opticalcell (HPOC) and fused silica capillary capsule (FSCC) with application to 1047298uid inclu-sion observations Geochim Cosmochim Acta 75 4080ndash4093
Williams-Jones AE Bowell RJ Migdisov AA 2009 Gold in solution Elements 5281ndash287
Williams-Jones AE Samson IM Ault KM Gagnon JE Fryer BJ 2010 The genesis of
distal zinc skarns evidence from the Mochito deposit Honduras Econ Geol 1051411ndash1440
Wopenka B Pasteris JD 1993 Structural characterization of kerogens to granulite-facies graphite applicability of Raman microprobe spectroscopy Am Mineral 78533ndash557
Yang F Mao J Wang Y Bierlein F 2006 Geology and geochemistry of the Bulongquartzndashbarite vein-type gold deposit in the Xinjiang Uygur Autonomous RegionChina Ore Geol Rev 29 52ndash76
Zhang YG Frantz JD 1987 Determination of the homogenization temperatures anddensities of supercritical 1047298uids in the system NaClndashKClndashCaCl2ndashH2O using synthetic1047298uid inclusions Chem Geol 64 335ndash350
256 E Salvioli-Mariani et al Journal of Geochemical Exploration 158 (2015) 243ndash 256
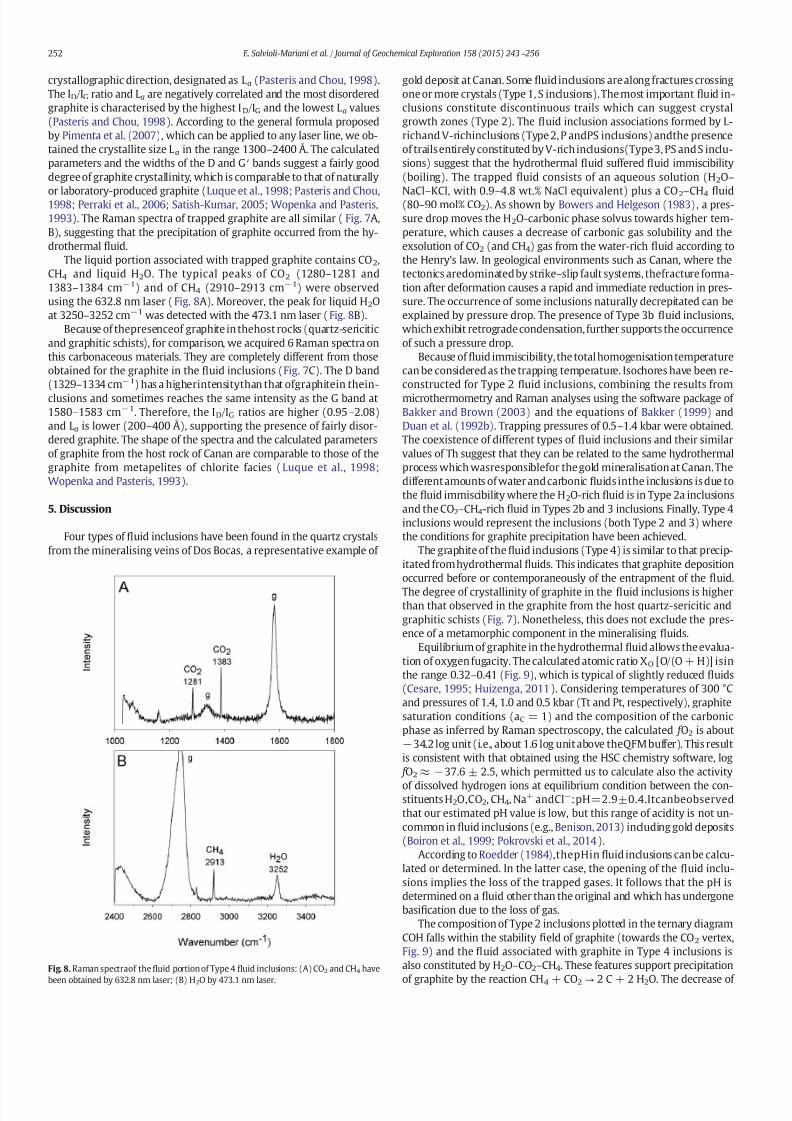
7172019 Salvioli et al 2015
httpslidepdfcomreaderfullsalvioli-et-al-2015 1014
crystallographic direction designated as L a (Pasteris and Chou 1998)The IDIG ratio and L a are negatively correlated and the most disorderedgraphite is characterised by the highest IDIG and the lowest L a values(Pasteris and Chou 1998) According to the general formula proposedby Pimenta et al (2007) which can be applied to any laser line we ob-tained the crystallite size L a in the range 1300ndash2400 Aring The calculatedparameters and the widths of the D and Gprime bands suggest a fairly gooddegree of graphite crystallinity which is comparable to that of naturally
or laboratory-produced graphite (Luque et al 1998 Pasteris and Chou1998 Perraki et al 2006 Satish-Kumar 2005 Wopenka and Pasteris1993) The Raman spectra of trapped graphite are all similar ( Fig 7AB) suggesting that the precipitation of graphite occurred from the hy-drothermal 1047298uid
The liquid portion associated with trapped graphite contains CO2CH4 and liquid H2O The typical peaks of CO2 (1280ndash1281 and1383ndash1384 cmminus1) and of CH4 (2910ndash2913 cmminus1) were observedusing the 6328 nm laser (Fig 8A) Moreover the peak for liquid H2Oat 3250ndash3252 cmminus1 was detected with the 4731 nm laser (Fig 8B)
Because of thepresenceof graphite in thehost rocks (quartz-sericiticand graphitic schists) for comparison we acquired 6 Raman spectra onthis carbonaceous materials They are completely different from thoseobtained for the graphite in the 1047298uid inclusions (Fig 7C) The D band(1329ndash1334 cmminus1) has a higherintensitythan that ofgraphitein thein-clusions and sometimes reaches the same intensity as the G band at1580ndash1583 cmminus1 Therefore the IDIG ratios are higher (095ndash208)and L a is lower (200ndash400 Aring) supporting the presence of fairly disor-dered graphite The shape of the spectra and the calculated parametersof graphite from the host rock of Canan are comparable to those of thegraphite from metapelites of chlorite facies (Luque et al 1998Wopenka and Pasteris 1993)
5 Discussion
Four types of 1047298uid inclusions have been found in the quartz crystalsfrom the mineralising veins of Dos Bocas a representative example of
gold deposit at Canan Some 1047298uidinclusions are along fractures crossingone or more crystals (Type 1 S inclusions)The most important1047298uid in-clusions constitute discontinuous trails which can suggest crystalgrowth zones (Type 2) The 1047298uid inclusion associations formed by L-richand V-richinclusions (Type 2 P andPS inclusions) andthe presenceof trails entirely constituted by V-rich inclusions(Type 3 PS andS inclu-sions) suggest that the hydrothermal 1047298uid suffered 1047298uid immiscibility(boiling) The trapped 1047298uid consists of an aqueous solution (H2Ondash
NaClndash
KCl with 09ndash
48 wt NaCl equivalent) plus a CO2ndash
CH4 1047298
uid(80ndash90 mol CO2) As shown by Bowers and Helgeson (1983) a pres-sure drop moves the H2O-carbonic phase solvus towards higher tem-perature which causes a decrease of carbonic gas solubility and theexsolution of CO2 (and CH4) gas from the water-rich 1047298uid according tothe Henrys law In geological environments such as Canan where thetectonics aredominatedby strikendashslip fault systems thefracture forma-tion after deformation causes a rapid and immediate reduction in pres-sure The occurrence of some inclusions naturally decrepitated can beexplained by pressure drop The presence of Type 3b 1047298uid inclusionswhich exhibit retrograde condensation further supports the occurrenceof such a pressure drop
Because of 1047298uid immiscibility the total homogenisation temperaturecan be considered as the trapping temperature Isochores have been re-constructed for Type 2 1047298uid inclusions combining the results frommicrothermometry and Raman analyses using the software package of Bakker and Brown (2003) and the equations of Bakker (1999) andDuan et al (1992b) Trapping pressures of 05ndash14 kbar were obtainedThe coexistence of different types of 1047298uid inclusions and their similarvalues of Th suggest that they can be related to the same hydrothermalprocess which wasresponsiblefor the gold mineralisation at CananThedifferentamounts of water andcarbonic1047298uids inthe inclusions is due tothe 1047298uid immiscibility where the H2O-rich 1047298uid is in Type 2a inclusionsand the CO2ndashCH4-rich 1047298uid in Types 2b and 3 inclusions Finally Type 4inclusions would represent the inclusions (both Type 2 and 3) wherethe conditions for graphite precipitation have been achieved
The graphite of the1047298uid inclusions (Type 4) is similar to that precip-itated from hydrothermal1047298uids This indicates that graphite depositionoccurred before or contemporaneously of the entrapment of the 1047298uid
The degree of crystallinity of graphite in the 1047298uid inclusions is higherthan that observed in the graphite from the host quartz-sericitic andgraphitic schists (Fig 7) Nonetheless this does not exclude the pres-ence of a metamorphic component in the mineralising 1047298uids
Equilibrium of graphite in the hydrothermal1047298uid allows the evalua-tion of oxygen fugacity The calculated atomic ratio XO [O(O + H)] isinthe range 032ndash041 (Fig 9) which is typical of slightly reduced 1047298uids(Cesare 1995 Huizenga 2011) Considering temperatures of 300 degCand pressures of 14 10 and 05 kbar (Tt and Pt respectively) graphitesaturation conditions (aC = 1) and the composition of the carbonicphase as inferred by Raman spectroscopy the calculated f O2 is aboutminus342 log unit (ie about 16 log unit above theQFM buffer) This resultis consistent with that obtained using the HSC chemistry software log f O2 asymp minus376 plusmn 25 which permitted us to calculate also the activity
of dissolved hydrogen ions at equilibrium condition between the con-stituents H2OCO2 CH4 Na+ andClminuspH=29plusmn04Itcanbeobservedthat our estimated pH value is low but this range of acidity is not un-common in1047298uid inclusions (egBenison 2013) including gold deposits(Boiron et al 1999 Pokrovski et al 2014)
According to Roedder (1984)thepHin 1047298uid inclusions can be calcu-lated or determined In the latter case the opening of the 1047298uid inclu-sions implies the loss of the trapped gases It follows that the pH isdetermined on a 1047298uid other than the original and which has undergonebasi1047297cation due to the loss of gas
The composition of Type 2 inclusions plotted in the ternary diagramCOH falls within the stability 1047297eld of graphite (towards the CO2 vertexFig 9) and the 1047298uid associated with graphite in Type 4 inclusions isalso constituted by H2OndashCO2ndashCH4 These features support precipitation
of graphite by the reaction CH4 + CO2rarr
2 C + 2 H2O The decrease of
Fig 8 Raman spectraof the1047298uid portion of Type 4 1047298uid inclusions (A)CO2 and CH4 have
been obtained by 6328 nm laser (B) H2O by 4731 nm laser
252 E Salvioli-Mariani et al Journal of Geochemical Exploration 158 (2015) 243ndash 256
7172019 Salvioli et al 2015
httpslidepdfcomreaderfullsalvioli-et-al-2015 1114
temperature andor the increase of pressure move the reaction towardsthe products In our case a combination of cooling and decompressionacted on the system so that the variation of temperature and pressurecannot be responsible for the precipitation of graphite According toHuizenga (2011) the precipitation of graphite is in1047298uenced by XO
value and oxygen fugacity the best conditions for precipitation areXO = 033 and QFM-2 b log f O2 b QFM + 1 Small variations from
these values prevent the precipitation or cause consumption of earlyprecipitated graphite XO values and f O2 of our Type 2 1047298uid inclusions(see above) agree with the Huizenga (2011) data and indicate thatsome 1047298uid inclusions were able to precipitate graphite
The H2S content and the oxygen fugacity of the hydrothermal 1047298uidsaffect the solubility of gold In H 2S-rich 1047298uids Au(HS)2
minus andAu(HS)deg are the dominant Au-complexes and gold has high solubil-ity (Au N 100 ppb) whereas in H2S-poor 1047298uids the gold solubilitydecreases and AuCl2
minus is the dominant stable complex (Gammonsand Williams-Jones 1997) When the partial pressure of H 2S is1047297xed by the magnetitendashpyrite pair the Au bisulphide complex isstable at T b 450 degC and the chloride complex at higher temperature(Mikucki 1998) At high oxygen fugacity H2S is oxidised and thusthe mobility of gold as bisulphide decreases considerably ( Gammons
and Williams-Jones 1997) Experimental studies at temperatures of 350ndash500 degC and pressures of 05ndash1 kbar have shown that Au(HS)2
minus isthe dominant Au complex in near neutral to weakly acidic solutions inthe presence of the K-feldsparndashmuscovitendashquartz mineral associationand at pyritendashpyrrhotitendashmagnetite buffer conditions (Tagirov et al2005)
Many of the conditions employed in the experiments mentionedabove match those of the Canan ore deposit 1047298uid inclusions indicatethe presence of low salinity and low temperature (T b 400 degC) hydro-thermal 1047298uids and XRD data (Mattioli et al 2014) show that the wall-rocks contain the K-feldsparndashmuscovitendashquartzndashpyritendashpyrrothitendashmagnetite association (Table 1) However the hydrothermal 1047298uids atCanan seem to be extremely acidic (pH = 29) which makes Au(HS)degmore stable than Au(HS)2
minus and themost abundant complex in thesolu-
tions (cf also Heinrich et al 2004 Pokrovski et al 2014) Hence we
infer that the gold of Canan was transported by hydrothermal 1047298uids asAu(HS)deg complex
Activity diagrams are a powerful graphical tool for depicting the sta-bility of dissolved species and solid and gas phases with respect to thecomposition of the coexisting solution Calculations on Au speciationwere performed under the mean conditions estimated by the analysisof the 1047298uid inclusions and the results plotted in log f O2-pH diagrams(Fig 10) The decrease in solubility of the Aundashsulphide complexes can
be ascribed both to the fracturation-induced pressure drop andthe con-centration of sulphur in solution According to Mattioli et al (2014) thegold deposit of Canan was formed by the hydrothermal 1047298uid activityalong fractures produced by tectonics Opening and lateral expansionof the fractures produce a pressure drop on the 1047298uids themselves andboiling of the dissolved gases The 1047298uid composition affects the depthof boiling which is an ef 1047297cient mechanism for gold precipitation(Hedenquist et al 1992 Pokrovski et al 2014 Robb 2010 Sibson1987) Boiling produced the exsolution of H2S which in turn caused adecrease in the solubility of theAundashsulphide complexes and the precip-itation of gold (Fig 10) In the case of the Canan deposit boiling repre-sents only the initial phase of gold deposition In fact the main bodyof thegoldmineof Canan is located in metamorphic rocks cutby quartzveins where hydrothermal 1047298uids altered the primary mineralogy andchanged their composition and ability to carry gold in solution In theore deposit Au coexists with sulphides and in particular small grainsof pure gold are surrounded by pyriteand other sulphides This suggeststhat gold was deposited by reactions involving 1047298uids containing Au-Scomplexes and the wall-rock containing chalcophile elements particu-larly Fe a process known as ldquosulphidationrdquo (Williams-Jones et al 2009and references therein Robb 2010) At Canan Fe is abundant in freshwall-rocksfor thepresence of biotiteand chloriteThese minerals disap-pear in the vicinity of quartz veins of the ore deposit where the highestconcentration of gold and sulphides are observed (Mattioli et al 2014)During the alteration of biotite and chlorite Fe is released into the hy-drothermal 1047298uids and likely produces the following reaction with theAundashsulphide complexes
AuethHSTHORN∘ethaqTHORN thorn 05Fe2thornharr05FeS2ethPyriteTHORN thorn H
thorn thorn Au∘ethGoldTHORN eth1THORN
Under equilibrium conditions and assumingP = 1400barT = 300 degCand the water activity H2O = 1 the resulting log K is 53151 (ΔGdeg-R = minus 5833 kJ molminus1) The high value of the equilibrium constant Kand the highly negative value of ΔGdegR indicate that the reaction has aspontaneous tendency towards the products According to Robb (2010)these reactions occur in dynamic systems where kinetics predominatesover equilibrium conditions Therefore it is very unlikely that reaction(1) occurs under equilibrium conditions in an open natural system Be-cause of the continuous supply of Au(HS)deg from the hydrothermal 1047298uidsand Fe2+ from the alteration of biotite and chlorite (within the zones of 1047298uid-rock interaction) reaction (1) is imbalanced and pushed towardsthe products by favouring the deposition of gold and sulphides This isin agreement with Pokrovski et al (2014) who state that the interactionof sulphur-rich hydrothermal 1047298uids and Fe2+-rich wall rocks(sulphidation) is one of the main processes leading to the precipitationof gold
Additionally the activity of sulphur in the 1047298uids is responsible forthe solubilisation and transport of gold At Canan the activity of Sought to be at least 10minus2 Above this value the composition of hydro-thermal 1047298uid plots in the stability 1047297eld of Au(HS)deg (Fig 10) Withlower concentrations of S (and lower pressure) the transportof gold oc-curs as chloride (Fig 10L M and N) If iron is no longer available aftercomplete alteration of biotite and chlorite the deposition of goldcould be represented by the reaction
AuethHSTHORN∘ethaqTHORN thorn 05H2ethgTHORNharrH2SethgTHORN thorn Au∘ethGoldTHORN eth2THORN
where log K = 69130 (ΔGdegR = minus 7586 kJ molminus1) at T = 300 degC and
P = 1400 bar indicates once again a spontaneous tendency towards
Fig 9 Ternary CndashOndashH diagramshowing thecarbon saturatedsurface (solid line) at 300degCand1400 barcalculated by Perple_Xsoftware(J Connollywwwperplexethzch) Dashedlines represent the compositional triangle H2OndashCO2ndashCH4 dotted 1047297eld Type 2a inclusionsstriped 1047297eld Type 2b inclusions Lines of constant XO 035 and 040 (dot-dashed lines) arealso shownTheopencircles andthenumbers initalics indicate f O2
1047298uid relative toQFM buff-er in log10 units (log f O2
1047298uidndashlog f O2
QFM) for 1047298uids in equilibrium with graphite
253E Salvioli-Mariani et al Journal of Geochemical Exploration 158 (2015) 243ndash 256
7172019 Salvioli et al 2015
httpslidepdfcomreaderfullsalvioli-et-al-2015 1214
theproducts andthe presence of H2 agrees with the reducing conditions(log f O2 asymp minus376) found in the hydrothermal 1047298uids of Canan Reaction(2) would be effective during boiling andor decompression (cf Boyle1969 Pokrovski et al 2014) Similarly to reaction (1) the dynamicsystem conditions (the continuous supply of Au(HS)deg and loss of H2S)favour the kinetic of the reaction (2) and con1047297rm the statements of Robb (2010) and Sibson (1987) on the ef 1047297ciency of this process forgold deposition Finally the kinetics of reaction (1) is further increasedby the alteration of feldspar and muscovite in kaolinite and diaspore (cfMattioli et al 2014) The mineral alterations subtract H+ from the solu-
tion (Drever 1997) favouring the precipitation of Au
6 Concluding remarks
The quartz veins associated with gold mineralisations from DosBocas (Canan area Lepaguare District east-central Honduras) are richin 1047298uid inclusions of four main types Type 1 mdash S two-phaseaqueous-rich inclusions Type 2 mdash P to PS aqueous-rich inclusionswith an H2O-rich liquid and a CO2ndashCH4-bearing liquid Type 3 mdash PSto S CO2ndashCH4-rich inclusions with a very small amount of waterand Type 4 mdash graphite-bearing aqueousndashcarbonic 1047298uid
The association of L-rich and V-rich inclusions (Type 2) and the oc-currence of trails containing only V-rich inclusions (Type 3) support a
1047298uid immiscibility (boiling)of the hydrothermal1047298uidThe hydrothermal
trapped 1047298uid is constituted by H2O + alkali chloride + CO2 plusmn CH4 Thecalculated salinity varies from 09 to 48 wt NaCl equivalent
The immiscibility of 1047298uids can be related to a pressure decrease dueto both the opening of fractures and upward 1047298ow of 1047298uids At Canan astrikendashslip fault systemis responsible for the fracturing of the metamor-phic wall-rocks Thisgeological setting with the mineralogicalpetrolog-ical and geochemical features supports an orogenic character of theinvestigated gold deposits
In some 1047298uid inclusions the occurrence of graphite with typical fea-tures of graphite precipitated from hydrothermal 1047298uids suggests that
the deposition of graphite was prior or concomitant with the entrap-ment of the 1047298uid Moreover the occurrence of graphite associated towater andcarbonic1047298uidssupports the presence of a metamorphic com-ponent in the mineralising 1047298uid
Microthermometric and spectroscopic data from 1047298uid inclusionssuggest that the gold mineralisations at Canan formed at T = 300 degCunderP=500ndash1400 barsThecalculated oxygenfugacityand pH valuesof the hydrothermal 1047298uids are approximately minus 376 plusmn 25 log unit(1 log unit above the QFM buffer) and 29 plusmn 04 respectively
The hydrothermal 1047298uids contained sulphur (activity of S ge 10minus2)assuggested by the association of gold with sulphides including pyriteand chalcopyrite For the above chemical and physical conditions themost abundant sulphur specie carrying gold in solution is the Au(HS)degcomplex Several causes are responsible for the precipitation of gold in
the Canan area 1 mdash boiling following the pressure drop caused by
Fig 10 Activity diagrams for the system AundashCndashClndashSndashH2O at 300 degC Au and H2O activity 10minus7 (~10 ppb) and 100 respectively Cl 10minus098 and C buffered by graphite (see ldquoCalculationmethodsrdquo) Variable values of pressure are considered 1400 bar (A B C and D) 1000 bar (E F G and H) 500 bar (I L M and N) Activities of total dissolved S are 10minus1 (A E and I)10minus2 (B F and L) 10minus3 (C G and M) and buffered by pyrite (D H and N) Green 1047297eld represents the mean composition of the 1047298uid inclusions (pH = 29 plusmn 04 log f O2 = minus 376 plusmn25) Red lines limit the 1047297elds of Au species dashed black lines the S species and dashed blue lines the carbon species The thickness of the red lines corresponds to an uncertainty of log [Au] = plusmn01 or log [H2O] = plusmn02
254 E Salvioli-Mariani et al Journal of Geochemical Exploration 158 (2015) 243ndash 256
7172019 Salvioli et al 2015
httpslidepdfcomreaderfullsalvioli-et-al-2015 1314
tectonic andor hydrothermal 1047298uids activity 2 mdash sulphidation triggeredby the liberation of metal cations during the alteration of ma1047297c min-erals of the wall-rocks 3 mdash hydrothermal alteration of feldspars andphyllosilicates of the wall-rocks
Acknowledgements
The authors wish to thank M Menichetti for providing samples of
the quartz veins and the Goldlake Group for the permission to publishthe results of this study Special thanks are due to John Ridley for theuseful and encouraging suggestions which have noticeably improvedthequality of this paperSincere thanksare dueto BJStacey forimprov-ing the English
References
Alvarez-Gogravemez JA Meijer PT Martigravenez-Digraveaz JJ Capote R2008 Constraintsfrom1047297nite element modeling on the active tectonics of northern Central America andthe Middle America Trench Tectonics 27 TC1008 httpdxdoiorg1010292007TC002162
Andrada de Palomera P van Ruitenbeek FJA van der Meer FK Fernaacutendez R 2012Geochemical indicators of gold-rich zones in the La Jose1047297na epithermal depositDeseado Massif Argentina Ore Geol Rev 45 61ndash80
Aoya M Kouketsu Y Endo S Shimizu H Mizukami T Nakamura D Wallis S 2010Extending the applicability of the Raman carbonaceous-material geothermometer
using data from contact metamorphic rocks J Metamorph Geol 28 895ndash914Bakker RJ 1999 Adaptation of the Bowers and Helgeson (1983) equation of state to the
H2OndashCO2ndashCH4ndashN2ndashNaCl system Chem Geol 154 225ndash236Bakker RJ Brown PE 2003 Computer modelling in 1047298uid inclusion research In
Samson I Anderson A Marshall D (Eds) Fluid Inclusions Analysis and interpreta-tion Mineralogical Association of Canada Short Course Series 32 pp 175ndash212
Benison KC 2013 Acid saline 1047298uid inclusions examples from modern and Permianextreme lake systems Geo1047298uids 13 579ndash593
Bersani D Salvioli-Mariani E Mattioli M Menichetti M Lottici PP 2009 Raman andmicro-thermometric investigation of the 1047298uid inclusions in quartz in a gold-richformation from Lepaguare mining district Spectrochim Acta A 73 443ndash449
Bethke CM Yeakel S 2008 The Geochemists Workbenchreg mdash Release 7 GWB Essen-tials Guide mdash Hydrogeology Program University of Illinois (100 pp)
Bodnar RJ Reynolds TJ Kuehn CA 1985 Fluid-inclusion systematics in epithermalsystems In Berger BR Bethke PM (Eds) Geology and Geochemistry of Epithermal Systems Reviews in Economic Geology 2 pp 73ndash97
Boiron MC Cathelineau M Essarraj S Lespinasse M Sellier E 1991 Characterizationof the relationships between deformation 1047298uid migration and Au deposition in
quartz veins methodology and modelling Proceedings Gold 91 AA BalkemaPublishers Brazil pp 637ndash643Boiron MC Moissette A Cathelineau M Banks D Monnin C Dubessy J 1999
Detailed determination of palaeo1047298uid chemistry an integrated study of sulphate-volatile rich brines and aquo-carbonic 1047298uids in quartz veins from Ouro Fino(Brazil) Chem Geol 154 179ndash192
Botros NS 2004 A new classi1047297cation of the gold deposits of Egypt Ore Geol Rev 251ndash37
Bowers TS Helgeson HW 1983 Calculation of the thermodynamic and geochemicalconsequences of nonideal mixing in the system H2OndashCO2ndashNaCl on phase relationsin geological systems equation of state for H 2OndashCO2ndashNaCl 1047298uids at high pressuresand temperatures Geochim Cosmochim Acta 47 1247ndash1275
Boyle RW 1969 Hydrothermal transport and deposition of gold Econ Geol 64112ndash115
Burke EAJ 2001 Raman microspectrometry of 1047298uid inclusions Lithos 55 139ndash158Callaghan T 2001 Geology and host-rock alteration of the Henty and Mount Julia gold
deposits western Tasmania Econ Geol 96 (5) 1073ndash1088Carpenter RH 1954 Geology and ore deposits of the Rosario mining district and San
Juancito Mountains Honduras Central America Geol Soc Am Bull 65 23ndash28
Cepedal A Fuertes-Fuente M Martiacuten-Izard A Garciacutea-Nieto J Boiron MC 2013 Anintrusion-related gold deposit (IRGD) in the NW of Spain the Linares deposit igne-ous rocks veins and related alterations ore features and 1047298uids involved
J Geochem Explor 124 101ndash126Cesare B 1995 Graphite precipitation in CndashOndashH 1047298uid inclusions closed system compo-
sitional and density changes and thermobarometric implications Contrib MineralPetrol 122 25ndash33
Cleverley JS Bastrakov EN 2005 K2GWB Utility for Generating Thermodynamic DataFiles for the GeochemistsWorkbenchregat 0ndash1000 degC and 1ndash5000 bar from UT2K andthe UNITHERM Database
Collins PLF 1979 Gas hydrates in CO2-bearing 1047298uid inclusions and the use of freezingdata for estimation of salinity Econ Geol 74 1435ndash1444
Deksissa DJ Koeberl C 2005 Geochemistry alteration and genesis of gold mineraliza-tion in the Okote area southern Ethiopia Geochem J 38 307ndash331
Diamond LW 2003 Introduction to gas-bearing aqueous 1047298uid inclusions In Samson IAnderson A Marshall D (Eds) Fluid Inclusions Analysis and interpretation Miner-alogical Association of Canada Short Course Series 32 pp 101ndash158
Drever JI 1997 The Geochemistry of Natural Water Prentice-Hall Upper Saddle RiverNew Jersey
Drobe J Cann RM 2000 CundashAu skarn mineralization Minas de Oro District HondurasCentral America Explor Min Geol 9 51ndash63
Duan Z MoslashllerN WeareJK 1992a An equation of state for theCH4ndashCO2ndashH2O systemI Pure systems from 0 to 1000 degC and 0 to 8000 bar Geochim Cosmochim Acta 562605ndash2617
Duan Z MoslashllerN Weare JK 1992b Anequationof statefor the CH4ndashCO2ndashH2O systemII Mixtures from 50 to 1000 degC and 0 to 1000 bar Geochim Cosmochim Acta 562619ndash2631
Esmaeily D Afshooni SZ Mirnejad H Rashidnejad-e-Omran N 2012 Mass changesduring hydrothermal alteration associated with gold mineralization in the Astanehgranitoid rocks western Iran Geochem Explor Environ Anal 12 161ndash175
Gammons GH Williams-Jones AE 1997 Chemical mobility of Gold in the porphyryndash
epithermal environment Econ Geol 92 45ndash59Garofalo P Matthaumli SK Heinrich C 2002 Three dimensional geometry ore
distribution and time-integrated mass transfer through the quartzndashtourma-linendashgold vein network of the Sigma deposit (Abitibi belt mdash Canada) Geo1047298uids2 217ndash232
Garrabos Y Tufeu R Le Neindre B 1980 Rayleigh and Raman scattering near the crit-ical point of carbon dioxide J Chem Phys 72 (8) 4637ndash4651
Groves DI Goldfarb RJ Robert F Hart CJR 2003 Gold deposits in metamorphicbelts overview of current understanding outstanding problems future researchand exploration signi1047297cance Econ Geol 98 1ndash29
Guzman-Speziale M 2001 Active seismic deformation in the grabens of northern Cen-tral America and its relationship to the relative motion of the North AmericandashCarib-bean plate boundary Tectonophysics 337 39ndash51
Hedenquist JF Reyes AG Simmons SF Taguchi S 1992 The thermal and geochemi-cal structure of geothermal and epithermal systems a framework for interpreting1047298uid inclusion data Eur J Mineral 4 989ndash1015
Heinrich CA Driesner TStefaacutensson ASeward TM 2004 Magmatic vapor contractionand the transport of gold from the porphyry environment to epithermal ore deposits
Geology 32 761ndash764Horne G Clark G Pushkar P 1976 Pre-Cretaceous rocks of northwestern Honduras
basement terrane in Sierra de Omoa AAPG Bull 60 566ndash583Huizenga J-M 2005 COH an Excel Spreadsheet for composition calculations in the Cndash
OndashH 1047298uid system Comput Geosci 31 797ndash800Huizenga J-M 2011 Thermodynamic modelling of a cooling CndashOndashH 1047298uid-graphite sys-
tem implications for hydrothermal graphite precipitation Miner Deposita 46 23ndash33KawakamiY YamamotoJ Kagi H2003 Micro-Ramandensimeterfor CO2 inclusionsin
mantle-derived minerals Appl Spectrom 57 (11) 1333ndash1339Kawashima Y Katagiri G 1995 Fundamentals overtones and combinations in the
Raman spectrum of graphite Phys Rev B 52 10053ndash10059Klein EL Koppe JC Moura CAV 2002 Geology and geochemistry of the Caxis gold
deposit and geochronology of thegold-hosting Caxias Microtonalite Sao Luis Cratonnorthern Brazil J S Am Earth Sci 14 837ndash849
Lin F Bodnar RJ Becker SP 2007 Experimentaldetermination of the RamanCH4 sym-metric stretching (ν1) band position from 1ndash650 bar and 03ndash22 degC application to1047298uid inclusion studies Geochim Cosmochim Acta 71 3746ndash3756
Lu W Chou I-M Burruss RC Song Y 2007 An uni1047297ed equation for calculating meth-ane vapor pressures in the CH4ndashH2O system with measured Raman shifts GeochimCosmochim Acta 71 3969ndash3978
Luque FJ Pasteris JD Wopenka B Rodas M Barrenechea JF 1998 Natural 1047298uid-deposited graphite mineralogical characteristics and mechanisms of formationAm J Sci 298 471ndash498
Mann P Burke K 1984 Neotectonics of the Caribbean Rev Geophys 22 309ndash362Mann P Burke K 1988 Cenozoic rift formation in the northern Caribbean Geology 12
732ndash736MatthewsMJ Pimenta MA Dresselhaus GDresselhaus MS Endo M1999 Originof
the dispersive effects of the Raman D band in carbon materials Phys Rev B 59R6585ndashR6588
Mattioli M Menichetti M Renzulli A Toscani L Salvioli-Mariani E Suarez P 2014Genesis of the hydrothermal gold deposits in the Canan area Lepaguare DistrictHonduras Int J Earth Sci 103 901ndash928
Mikucki EJ 1998 Hydrothermal transport and depositional processes in Archean lode-gold systems a review Ore Geol Rev 13 307ndash321
Mills RA Hugh KE Feray DE Swolfs HC 1967 Mesozoic stratigraphy of HondurasAAPG Bull 51 1711ndash1786
Miur TL 2002 The Hemlo gold deposit Ontario Canada principal deposit characteris-
tics and constraints on mineralization Ore Geol Rev 21 1ndash
66Pasteris JD Chou I-M 1998 Fluid-deposited graphitic inclusions in quartz comparisonbetween KTB (German Continental Deep-Drilling) core samples and arti1047297cially re-equilibrated natural inclusions Geochim Cosmochim Acta 62 109ndash122
Perraki M Proyer A Mposkos E Kaindl R Hoinkes G 2006 Raman micro-spectroscopy on diamond graphite and other carbon polymorphs from theultrahigh-pressure metamorphic Kimi Complex of the Rhodope Metamorphic Prov-ince NE Greece Earth Planet Sci Lett 24 672ndash685
Phillips GN Powell R 2009 Formation of gold deposits review and evaluation of thecontinuum model Earth-Sci Rev 94 1ndash12
Pimenta MA Dresselhaus G Dresselhaus MS Canccedilado LG Jorio A Saito R 2007Studying disorder in graphite-based systems by Raman spectroscopy Phys ChemChem Phys 9 1276ndash1291
Pokrovski GS Akin1047297ev NN Borisova AY Zotov AV Kouzmanov K 2014 Gold spe-ciation and transport in geological 1047298uids insights from experiments and physicalndashchemical modelling Geol Soc Lond Spec Publ httpdxdoiorg101144SP4024(Online First)
Ratschbacher L Franz L Min M Bachmenn R Martens U Stanek K Stubner KNelson BK Herrmann U Weber B Loacutepez-Martiacutenez M Jonckheere R Sperner
255E Salvioli-Mariani et al Journal of Geochemical Exploration 158 (2015) 243ndash 256
7172019 Salvioli et al 2015
httpslidepdfcomreaderfullsalvioli-et-al-2015 1414
B Tichomirowa M McWilliams MO Gordon M Meschede M Bock P 2009 TheNorth AmericanndashCaribbean plate boundary in MeacutexicondashGuatemalandashHonduras In
James KH Lorente MA Pindell JL (Eds) The Origin and Evolution of the Caribbe-an Plate Geological Society London Special Publications 328 pp 219ndash293
Ridley JR Diamond LW 2000 Fluid chemistry of orogenic lode-gold deposits and im-plications for genetic models In Hagemann S Brown PE (Eds) Gold in 2000 Re-views in Economic Geology 13 pp 141ndash162
Ridley J Hagemann SG 1999 Interpretation of post-entrapment 1047298uid-inclusion re-equilibration at the Three Mile Hill Marvel Loch and Grif 1047297ns Find high-temperature lode-gold deposits Yilgran Craton Western Australia Chem Geol154 257ndash278
Robb L 2010 Introduction to Ore-forming Processes Blackwell Publishing Malden USARoberts RJ Irving EM 1957 Mineral deposits of Central America U S Geol Surv Bull1034 205
Roedder E 1984 Fluid inclusions Reviews in Mineralogy 12 Mineralogical Society of America Washington DC
Rogers RD Mann P 2007 Transtensional deformation of the western CaribbeanndashNorthAmerica plate boundary zone In Mann P (Ed) Geologic and Tectonic Developmentof the Caribbean Plate in Northern Central America Geological Society of AmericaSpecial Paper 428 pp 37ndash64
Rogers RD Mann P Emmet PA 2007 Tectonic terranes of the Chortis block based onintegration of regional aeromagnetic and geologic data In Mann P (Ed) Geologicand Tectonic Development of the Caribbean Plate in Northern Central America Geo-logical Society of America Special Paper 428 pp 65ndash88
Roine A 2009 HSC Chemistryreg 70 Users Guide ndash Volume frac12 ndash Chemical Reaction andEquilibrium Software With Extensive Thermochemical Database and Flowsheet Sim-ulation Outotec Information Center Finland
Samson IM Williams-Jones A-E Ault KM Gagnon JE 2008 Source of 1047298uids formingdistal ZnndashPbndashAg skarns evidence from laser ablation-inductively coupled plasma-mass spectrometry analysis of 1047298uid inclusions from El Mochito Honduras Geology
36 947ndash950Satish-Kumar M 2005 Graphite-bearing CO2-1047298uid inclusions in granulites insights on
graphite precipitation and carbon isotope evolution Geochim Cosmochim Acta 69(15) 3841ndash3856
Seitz JF Pasteris JD 1990 Theoretical and practical aspect of differential partitioning of gases by clathrate hydrates in 1047298uid inclusions Geochim Cosmochim Acta 54631ndash639
Shvarov YV 2008 HCh new potentialities for the thermodynamic simulation of geo-chemical systems offered by Windows Geochem Int 46 834ndash839
Sibson RH 1987 Earthquake rupturing as a mineralizing agent in hydrothermal sys-tems Geology 15 701ndash704
Silva-Romo G 2008 GuayapendashPapalutla fault system a continuous Cretaceous structurefrom southern Mexicoto theChortis BlockTectonicimplicationsGeology 3675ndash78
Spooner ETC Bray CJ Wood PC Burrows DR Callan NJ 1987 Aundashquartz vein andCundashAundashAgndashMondashanhydrite mineralization HollingerndashMcIntyre Mine Timmins
Ontario δ13C values (McIntyre) Fluid inclusion gas geochemistry pressure (depth)estimation and H2OndashCO2 phase separation as a precipitation and dilation mecha-nism Ont Geol Surv Misc Pap 136 35ndash56
Su W Xi B Xia B Zhang X Hu R 2008 Visible gold in arsenian pyrite at theShuiyindong Carlin-type gold deposit Guizhou China implications for the environ-ment and processes of ore formation Ore Geol Rev 33 667ndash679
Sundblad K Cumming GL Krstic D 1991 Lead isotope evidence for the formation of epithermalgold quartzveins in theChortis BlockNicaragua Econ Geol 86 944ndash959
Tagirov BR Salvi S Schott J Baranova NN 2005 Experimental study of goldndash
hydrosulphide complexing in aqueous solutions at 350ndash500 degC 500 and 1000 barsusing mineral buffers Geochim Cosmochim Acta 69 (8) 2119ndash2132
ThieryR Vanden Kerkhof AM Dubessy J 1994 vX properties of CH4ndash
CO2 and CO2ndash
N21047298uid inclusions modelling for T b 31 degC and P b 400 bars Eur J Mineral 6 753ndash771
Thomsen C Reich S 2000 Double resonant Raman scattering in graphite Phys RevLett 85 5214ndash5217
Van den Kerkhof AM 1988 The System CO2ndashCH4ndashN2 in Fluid Inclusions TheoreticalModelling and Geochemical Applications (PhD Thesis Amsterdam)
Vanden Kerkhof AM OlsenSN 1990 A natural example of superdense CO2 inclusionsmicrothermometry and Raman analysis Geochim Cosmochim Acta 54 895ndash901
Van den Kerkhof AM Thiery R 2001 Carbonic inclusions Lithos 55 49ndash68Vidano RP Ischbach DB Willis LJ Loehr TM 1981 Observation of Raman band
shifting with excitation wavelength for carbons and graphites Solid State Commun39 341ndash344
Wang X Chou I-M Hu W Burruss RC Sun Q Song Y 2011 Raman spectroscopymeasurements of CO2 density experimental calibration with high-pressure opticalcell (HPOC) and fused silica capillary capsule (FSCC) with application to 1047298uid inclu-sion observations Geochim Cosmochim Acta 75 4080ndash4093
Williams-Jones AE Bowell RJ Migdisov AA 2009 Gold in solution Elements 5281ndash287
Williams-Jones AE Samson IM Ault KM Gagnon JE Fryer BJ 2010 The genesis of
distal zinc skarns evidence from the Mochito deposit Honduras Econ Geol 1051411ndash1440
Wopenka B Pasteris JD 1993 Structural characterization of kerogens to granulite-facies graphite applicability of Raman microprobe spectroscopy Am Mineral 78533ndash557
Yang F Mao J Wang Y Bierlein F 2006 Geology and geochemistry of the Bulongquartzndashbarite vein-type gold deposit in the Xinjiang Uygur Autonomous RegionChina Ore Geol Rev 29 52ndash76
Zhang YG Frantz JD 1987 Determination of the homogenization temperatures anddensities of supercritical 1047298uids in the system NaClndashKClndashCaCl2ndashH2O using synthetic1047298uid inclusions Chem Geol 64 335ndash350
256 E Salvioli-Mariani et al Journal of Geochemical Exploration 158 (2015) 243ndash 256
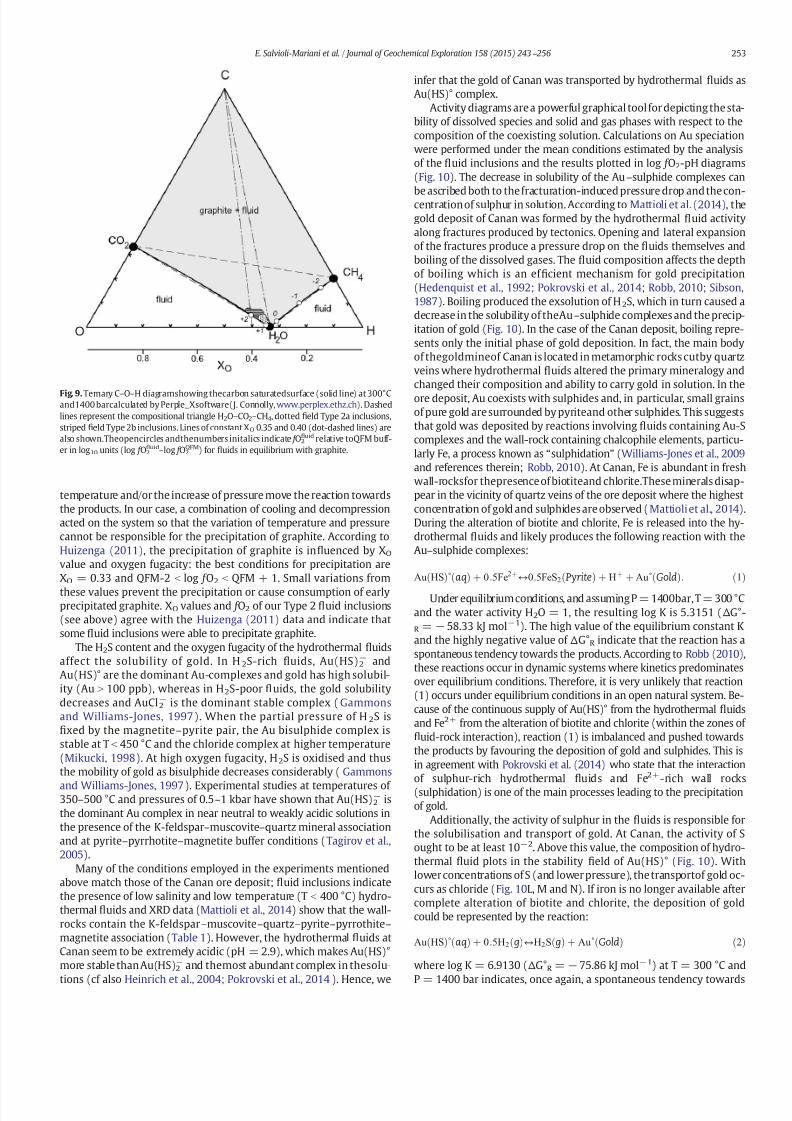
7172019 Salvioli et al 2015
httpslidepdfcomreaderfullsalvioli-et-al-2015 1114
temperature andor the increase of pressure move the reaction towardsthe products In our case a combination of cooling and decompressionacted on the system so that the variation of temperature and pressurecannot be responsible for the precipitation of graphite According toHuizenga (2011) the precipitation of graphite is in1047298uenced by XO
value and oxygen fugacity the best conditions for precipitation areXO = 033 and QFM-2 b log f O2 b QFM + 1 Small variations from
these values prevent the precipitation or cause consumption of earlyprecipitated graphite XO values and f O2 of our Type 2 1047298uid inclusions(see above) agree with the Huizenga (2011) data and indicate thatsome 1047298uid inclusions were able to precipitate graphite
The H2S content and the oxygen fugacity of the hydrothermal 1047298uidsaffect the solubility of gold In H 2S-rich 1047298uids Au(HS)2
minus andAu(HS)deg are the dominant Au-complexes and gold has high solubil-ity (Au N 100 ppb) whereas in H2S-poor 1047298uids the gold solubilitydecreases and AuCl2
minus is the dominant stable complex (Gammonsand Williams-Jones 1997) When the partial pressure of H 2S is1047297xed by the magnetitendashpyrite pair the Au bisulphide complex isstable at T b 450 degC and the chloride complex at higher temperature(Mikucki 1998) At high oxygen fugacity H2S is oxidised and thusthe mobility of gold as bisulphide decreases considerably ( Gammons
and Williams-Jones 1997) Experimental studies at temperatures of 350ndash500 degC and pressures of 05ndash1 kbar have shown that Au(HS)2
minus isthe dominant Au complex in near neutral to weakly acidic solutions inthe presence of the K-feldsparndashmuscovitendashquartz mineral associationand at pyritendashpyrrhotitendashmagnetite buffer conditions (Tagirov et al2005)
Many of the conditions employed in the experiments mentionedabove match those of the Canan ore deposit 1047298uid inclusions indicatethe presence of low salinity and low temperature (T b 400 degC) hydro-thermal 1047298uids and XRD data (Mattioli et al 2014) show that the wall-rocks contain the K-feldsparndashmuscovitendashquartzndashpyritendashpyrrothitendashmagnetite association (Table 1) However the hydrothermal 1047298uids atCanan seem to be extremely acidic (pH = 29) which makes Au(HS)degmore stable than Au(HS)2
minus and themost abundant complex in thesolu-
tions (cf also Heinrich et al 2004 Pokrovski et al 2014) Hence we
infer that the gold of Canan was transported by hydrothermal 1047298uids asAu(HS)deg complex
Activity diagrams are a powerful graphical tool for depicting the sta-bility of dissolved species and solid and gas phases with respect to thecomposition of the coexisting solution Calculations on Au speciationwere performed under the mean conditions estimated by the analysisof the 1047298uid inclusions and the results plotted in log f O2-pH diagrams(Fig 10) The decrease in solubility of the Aundashsulphide complexes can
be ascribed both to the fracturation-induced pressure drop andthe con-centration of sulphur in solution According to Mattioli et al (2014) thegold deposit of Canan was formed by the hydrothermal 1047298uid activityalong fractures produced by tectonics Opening and lateral expansionof the fractures produce a pressure drop on the 1047298uids themselves andboiling of the dissolved gases The 1047298uid composition affects the depthof boiling which is an ef 1047297cient mechanism for gold precipitation(Hedenquist et al 1992 Pokrovski et al 2014 Robb 2010 Sibson1987) Boiling produced the exsolution of H2S which in turn caused adecrease in the solubility of theAundashsulphide complexes and the precip-itation of gold (Fig 10) In the case of the Canan deposit boiling repre-sents only the initial phase of gold deposition In fact the main bodyof thegoldmineof Canan is located in metamorphic rocks cutby quartzveins where hydrothermal 1047298uids altered the primary mineralogy andchanged their composition and ability to carry gold in solution In theore deposit Au coexists with sulphides and in particular small grainsof pure gold are surrounded by pyriteand other sulphides This suggeststhat gold was deposited by reactions involving 1047298uids containing Au-Scomplexes and the wall-rock containing chalcophile elements particu-larly Fe a process known as ldquosulphidationrdquo (Williams-Jones et al 2009and references therein Robb 2010) At Canan Fe is abundant in freshwall-rocksfor thepresence of biotiteand chloriteThese minerals disap-pear in the vicinity of quartz veins of the ore deposit where the highestconcentration of gold and sulphides are observed (Mattioli et al 2014)During the alteration of biotite and chlorite Fe is released into the hy-drothermal 1047298uids and likely produces the following reaction with theAundashsulphide complexes
AuethHSTHORN∘ethaqTHORN thorn 05Fe2thornharr05FeS2ethPyriteTHORN thorn H
thorn thorn Au∘ethGoldTHORN eth1THORN
Under equilibrium conditions and assumingP = 1400barT = 300 degCand the water activity H2O = 1 the resulting log K is 53151 (ΔGdeg-R = minus 5833 kJ molminus1) The high value of the equilibrium constant Kand the highly negative value of ΔGdegR indicate that the reaction has aspontaneous tendency towards the products According to Robb (2010)these reactions occur in dynamic systems where kinetics predominatesover equilibrium conditions Therefore it is very unlikely that reaction(1) occurs under equilibrium conditions in an open natural system Be-cause of the continuous supply of Au(HS)deg from the hydrothermal 1047298uidsand Fe2+ from the alteration of biotite and chlorite (within the zones of 1047298uid-rock interaction) reaction (1) is imbalanced and pushed towardsthe products by favouring the deposition of gold and sulphides This isin agreement with Pokrovski et al (2014) who state that the interactionof sulphur-rich hydrothermal 1047298uids and Fe2+-rich wall rocks(sulphidation) is one of the main processes leading to the precipitationof gold
Additionally the activity of sulphur in the 1047298uids is responsible forthe solubilisation and transport of gold At Canan the activity of Sought to be at least 10minus2 Above this value the composition of hydro-thermal 1047298uid plots in the stability 1047297eld of Au(HS)deg (Fig 10) Withlower concentrations of S (and lower pressure) the transportof gold oc-curs as chloride (Fig 10L M and N) If iron is no longer available aftercomplete alteration of biotite and chlorite the deposition of goldcould be represented by the reaction
AuethHSTHORN∘ethaqTHORN thorn 05H2ethgTHORNharrH2SethgTHORN thorn Au∘ethGoldTHORN eth2THORN
where log K = 69130 (ΔGdegR = minus 7586 kJ molminus1) at T = 300 degC and
P = 1400 bar indicates once again a spontaneous tendency towards
Fig 9 Ternary CndashOndashH diagramshowing thecarbon saturatedsurface (solid line) at 300degCand1400 barcalculated by Perple_Xsoftware(J Connollywwwperplexethzch) Dashedlines represent the compositional triangle H2OndashCO2ndashCH4 dotted 1047297eld Type 2a inclusionsstriped 1047297eld Type 2b inclusions Lines of constant XO 035 and 040 (dot-dashed lines) arealso shownTheopencircles andthenumbers initalics indicate f O2
1047298uid relative toQFM buff-er in log10 units (log f O2
1047298uidndashlog f O2
QFM) for 1047298uids in equilibrium with graphite
253E Salvioli-Mariani et al Journal of Geochemical Exploration 158 (2015) 243ndash 256
7172019 Salvioli et al 2015
httpslidepdfcomreaderfullsalvioli-et-al-2015 1214
theproducts andthe presence of H2 agrees with the reducing conditions(log f O2 asymp minus376) found in the hydrothermal 1047298uids of Canan Reaction(2) would be effective during boiling andor decompression (cf Boyle1969 Pokrovski et al 2014) Similarly to reaction (1) the dynamicsystem conditions (the continuous supply of Au(HS)deg and loss of H2S)favour the kinetic of the reaction (2) and con1047297rm the statements of Robb (2010) and Sibson (1987) on the ef 1047297ciency of this process forgold deposition Finally the kinetics of reaction (1) is further increasedby the alteration of feldspar and muscovite in kaolinite and diaspore (cfMattioli et al 2014) The mineral alterations subtract H+ from the solu-
tion (Drever 1997) favouring the precipitation of Au
6 Concluding remarks
The quartz veins associated with gold mineralisations from DosBocas (Canan area Lepaguare District east-central Honduras) are richin 1047298uid inclusions of four main types Type 1 mdash S two-phaseaqueous-rich inclusions Type 2 mdash P to PS aqueous-rich inclusionswith an H2O-rich liquid and a CO2ndashCH4-bearing liquid Type 3 mdash PSto S CO2ndashCH4-rich inclusions with a very small amount of waterand Type 4 mdash graphite-bearing aqueousndashcarbonic 1047298uid
The association of L-rich and V-rich inclusions (Type 2) and the oc-currence of trails containing only V-rich inclusions (Type 3) support a
1047298uid immiscibility (boiling)of the hydrothermal1047298uidThe hydrothermal
trapped 1047298uid is constituted by H2O + alkali chloride + CO2 plusmn CH4 Thecalculated salinity varies from 09 to 48 wt NaCl equivalent
The immiscibility of 1047298uids can be related to a pressure decrease dueto both the opening of fractures and upward 1047298ow of 1047298uids At Canan astrikendashslip fault systemis responsible for the fracturing of the metamor-phic wall-rocks Thisgeological setting with the mineralogicalpetrolog-ical and geochemical features supports an orogenic character of theinvestigated gold deposits
In some 1047298uid inclusions the occurrence of graphite with typical fea-tures of graphite precipitated from hydrothermal 1047298uids suggests that
the deposition of graphite was prior or concomitant with the entrap-ment of the 1047298uid Moreover the occurrence of graphite associated towater andcarbonic1047298uidssupports the presence of a metamorphic com-ponent in the mineralising 1047298uid
Microthermometric and spectroscopic data from 1047298uid inclusionssuggest that the gold mineralisations at Canan formed at T = 300 degCunderP=500ndash1400 barsThecalculated oxygenfugacityand pH valuesof the hydrothermal 1047298uids are approximately minus 376 plusmn 25 log unit(1 log unit above the QFM buffer) and 29 plusmn 04 respectively
The hydrothermal 1047298uids contained sulphur (activity of S ge 10minus2)assuggested by the association of gold with sulphides including pyriteand chalcopyrite For the above chemical and physical conditions themost abundant sulphur specie carrying gold in solution is the Au(HS)degcomplex Several causes are responsible for the precipitation of gold in
the Canan area 1 mdash boiling following the pressure drop caused by
Fig 10 Activity diagrams for the system AundashCndashClndashSndashH2O at 300 degC Au and H2O activity 10minus7 (~10 ppb) and 100 respectively Cl 10minus098 and C buffered by graphite (see ldquoCalculationmethodsrdquo) Variable values of pressure are considered 1400 bar (A B C and D) 1000 bar (E F G and H) 500 bar (I L M and N) Activities of total dissolved S are 10minus1 (A E and I)10minus2 (B F and L) 10minus3 (C G and M) and buffered by pyrite (D H and N) Green 1047297eld represents the mean composition of the 1047298uid inclusions (pH = 29 plusmn 04 log f O2 = minus 376 plusmn25) Red lines limit the 1047297elds of Au species dashed black lines the S species and dashed blue lines the carbon species The thickness of the red lines corresponds to an uncertainty of log [Au] = plusmn01 or log [H2O] = plusmn02
254 E Salvioli-Mariani et al Journal of Geochemical Exploration 158 (2015) 243ndash 256
7172019 Salvioli et al 2015
httpslidepdfcomreaderfullsalvioli-et-al-2015 1314
tectonic andor hydrothermal 1047298uids activity 2 mdash sulphidation triggeredby the liberation of metal cations during the alteration of ma1047297c min-erals of the wall-rocks 3 mdash hydrothermal alteration of feldspars andphyllosilicates of the wall-rocks
Acknowledgements
The authors wish to thank M Menichetti for providing samples of
the quartz veins and the Goldlake Group for the permission to publishthe results of this study Special thanks are due to John Ridley for theuseful and encouraging suggestions which have noticeably improvedthequality of this paperSincere thanksare dueto BJStacey forimprov-ing the English
References
Alvarez-Gogravemez JA Meijer PT Martigravenez-Digraveaz JJ Capote R2008 Constraintsfrom1047297nite element modeling on the active tectonics of northern Central America andthe Middle America Trench Tectonics 27 TC1008 httpdxdoiorg1010292007TC002162
Andrada de Palomera P van Ruitenbeek FJA van der Meer FK Fernaacutendez R 2012Geochemical indicators of gold-rich zones in the La Jose1047297na epithermal depositDeseado Massif Argentina Ore Geol Rev 45 61ndash80
Aoya M Kouketsu Y Endo S Shimizu H Mizukami T Nakamura D Wallis S 2010Extending the applicability of the Raman carbonaceous-material geothermometer
using data from contact metamorphic rocks J Metamorph Geol 28 895ndash914Bakker RJ 1999 Adaptation of the Bowers and Helgeson (1983) equation of state to the
H2OndashCO2ndashCH4ndashN2ndashNaCl system Chem Geol 154 225ndash236Bakker RJ Brown PE 2003 Computer modelling in 1047298uid inclusion research In
Samson I Anderson A Marshall D (Eds) Fluid Inclusions Analysis and interpreta-tion Mineralogical Association of Canada Short Course Series 32 pp 175ndash212
Benison KC 2013 Acid saline 1047298uid inclusions examples from modern and Permianextreme lake systems Geo1047298uids 13 579ndash593
Bersani D Salvioli-Mariani E Mattioli M Menichetti M Lottici PP 2009 Raman andmicro-thermometric investigation of the 1047298uid inclusions in quartz in a gold-richformation from Lepaguare mining district Spectrochim Acta A 73 443ndash449
Bethke CM Yeakel S 2008 The Geochemists Workbenchreg mdash Release 7 GWB Essen-tials Guide mdash Hydrogeology Program University of Illinois (100 pp)
Bodnar RJ Reynolds TJ Kuehn CA 1985 Fluid-inclusion systematics in epithermalsystems In Berger BR Bethke PM (Eds) Geology and Geochemistry of Epithermal Systems Reviews in Economic Geology 2 pp 73ndash97
Boiron MC Cathelineau M Essarraj S Lespinasse M Sellier E 1991 Characterizationof the relationships between deformation 1047298uid migration and Au deposition in
quartz veins methodology and modelling Proceedings Gold 91 AA BalkemaPublishers Brazil pp 637ndash643Boiron MC Moissette A Cathelineau M Banks D Monnin C Dubessy J 1999
Detailed determination of palaeo1047298uid chemistry an integrated study of sulphate-volatile rich brines and aquo-carbonic 1047298uids in quartz veins from Ouro Fino(Brazil) Chem Geol 154 179ndash192
Botros NS 2004 A new classi1047297cation of the gold deposits of Egypt Ore Geol Rev 251ndash37
Bowers TS Helgeson HW 1983 Calculation of the thermodynamic and geochemicalconsequences of nonideal mixing in the system H2OndashCO2ndashNaCl on phase relationsin geological systems equation of state for H 2OndashCO2ndashNaCl 1047298uids at high pressuresand temperatures Geochim Cosmochim Acta 47 1247ndash1275
Boyle RW 1969 Hydrothermal transport and deposition of gold Econ Geol 64112ndash115
Burke EAJ 2001 Raman microspectrometry of 1047298uid inclusions Lithos 55 139ndash158Callaghan T 2001 Geology and host-rock alteration of the Henty and Mount Julia gold
deposits western Tasmania Econ Geol 96 (5) 1073ndash1088Carpenter RH 1954 Geology and ore deposits of the Rosario mining district and San
Juancito Mountains Honduras Central America Geol Soc Am Bull 65 23ndash28
Cepedal A Fuertes-Fuente M Martiacuten-Izard A Garciacutea-Nieto J Boiron MC 2013 Anintrusion-related gold deposit (IRGD) in the NW of Spain the Linares deposit igne-ous rocks veins and related alterations ore features and 1047298uids involved
J Geochem Explor 124 101ndash126Cesare B 1995 Graphite precipitation in CndashOndashH 1047298uid inclusions closed system compo-
sitional and density changes and thermobarometric implications Contrib MineralPetrol 122 25ndash33
Cleverley JS Bastrakov EN 2005 K2GWB Utility for Generating Thermodynamic DataFiles for the GeochemistsWorkbenchregat 0ndash1000 degC and 1ndash5000 bar from UT2K andthe UNITHERM Database
Collins PLF 1979 Gas hydrates in CO2-bearing 1047298uid inclusions and the use of freezingdata for estimation of salinity Econ Geol 74 1435ndash1444
Deksissa DJ Koeberl C 2005 Geochemistry alteration and genesis of gold mineraliza-tion in the Okote area southern Ethiopia Geochem J 38 307ndash331
Diamond LW 2003 Introduction to gas-bearing aqueous 1047298uid inclusions In Samson IAnderson A Marshall D (Eds) Fluid Inclusions Analysis and interpretation Miner-alogical Association of Canada Short Course Series 32 pp 101ndash158
Drever JI 1997 The Geochemistry of Natural Water Prentice-Hall Upper Saddle RiverNew Jersey
Drobe J Cann RM 2000 CundashAu skarn mineralization Minas de Oro District HondurasCentral America Explor Min Geol 9 51ndash63
Duan Z MoslashllerN WeareJK 1992a An equation of state for theCH4ndashCO2ndashH2O systemI Pure systems from 0 to 1000 degC and 0 to 8000 bar Geochim Cosmochim Acta 562605ndash2617
Duan Z MoslashllerN Weare JK 1992b Anequationof statefor the CH4ndashCO2ndashH2O systemII Mixtures from 50 to 1000 degC and 0 to 1000 bar Geochim Cosmochim Acta 562619ndash2631
Esmaeily D Afshooni SZ Mirnejad H Rashidnejad-e-Omran N 2012 Mass changesduring hydrothermal alteration associated with gold mineralization in the Astanehgranitoid rocks western Iran Geochem Explor Environ Anal 12 161ndash175
Gammons GH Williams-Jones AE 1997 Chemical mobility of Gold in the porphyryndash
epithermal environment Econ Geol 92 45ndash59Garofalo P Matthaumli SK Heinrich C 2002 Three dimensional geometry ore
distribution and time-integrated mass transfer through the quartzndashtourma-linendashgold vein network of the Sigma deposit (Abitibi belt mdash Canada) Geo1047298uids2 217ndash232
Garrabos Y Tufeu R Le Neindre B 1980 Rayleigh and Raman scattering near the crit-ical point of carbon dioxide J Chem Phys 72 (8) 4637ndash4651
Groves DI Goldfarb RJ Robert F Hart CJR 2003 Gold deposits in metamorphicbelts overview of current understanding outstanding problems future researchand exploration signi1047297cance Econ Geol 98 1ndash29
Guzman-Speziale M 2001 Active seismic deformation in the grabens of northern Cen-tral America and its relationship to the relative motion of the North AmericandashCarib-bean plate boundary Tectonophysics 337 39ndash51
Hedenquist JF Reyes AG Simmons SF Taguchi S 1992 The thermal and geochemi-cal structure of geothermal and epithermal systems a framework for interpreting1047298uid inclusion data Eur J Mineral 4 989ndash1015
Heinrich CA Driesner TStefaacutensson ASeward TM 2004 Magmatic vapor contractionand the transport of gold from the porphyry environment to epithermal ore deposits
Geology 32 761ndash764Horne G Clark G Pushkar P 1976 Pre-Cretaceous rocks of northwestern Honduras
basement terrane in Sierra de Omoa AAPG Bull 60 566ndash583Huizenga J-M 2005 COH an Excel Spreadsheet for composition calculations in the Cndash
OndashH 1047298uid system Comput Geosci 31 797ndash800Huizenga J-M 2011 Thermodynamic modelling of a cooling CndashOndashH 1047298uid-graphite sys-
tem implications for hydrothermal graphite precipitation Miner Deposita 46 23ndash33KawakamiY YamamotoJ Kagi H2003 Micro-Ramandensimeterfor CO2 inclusionsin
mantle-derived minerals Appl Spectrom 57 (11) 1333ndash1339Kawashima Y Katagiri G 1995 Fundamentals overtones and combinations in the
Raman spectrum of graphite Phys Rev B 52 10053ndash10059Klein EL Koppe JC Moura CAV 2002 Geology and geochemistry of the Caxis gold
deposit and geochronology of thegold-hosting Caxias Microtonalite Sao Luis Cratonnorthern Brazil J S Am Earth Sci 14 837ndash849
Lin F Bodnar RJ Becker SP 2007 Experimentaldetermination of the RamanCH4 sym-metric stretching (ν1) band position from 1ndash650 bar and 03ndash22 degC application to1047298uid inclusion studies Geochim Cosmochim Acta 71 3746ndash3756
Lu W Chou I-M Burruss RC Song Y 2007 An uni1047297ed equation for calculating meth-ane vapor pressures in the CH4ndashH2O system with measured Raman shifts GeochimCosmochim Acta 71 3969ndash3978
Luque FJ Pasteris JD Wopenka B Rodas M Barrenechea JF 1998 Natural 1047298uid-deposited graphite mineralogical characteristics and mechanisms of formationAm J Sci 298 471ndash498
Mann P Burke K 1984 Neotectonics of the Caribbean Rev Geophys 22 309ndash362Mann P Burke K 1988 Cenozoic rift formation in the northern Caribbean Geology 12
732ndash736MatthewsMJ Pimenta MA Dresselhaus GDresselhaus MS Endo M1999 Originof
the dispersive effects of the Raman D band in carbon materials Phys Rev B 59R6585ndashR6588
Mattioli M Menichetti M Renzulli A Toscani L Salvioli-Mariani E Suarez P 2014Genesis of the hydrothermal gold deposits in the Canan area Lepaguare DistrictHonduras Int J Earth Sci 103 901ndash928
Mikucki EJ 1998 Hydrothermal transport and depositional processes in Archean lode-gold systems a review Ore Geol Rev 13 307ndash321
Mills RA Hugh KE Feray DE Swolfs HC 1967 Mesozoic stratigraphy of HondurasAAPG Bull 51 1711ndash1786
Miur TL 2002 The Hemlo gold deposit Ontario Canada principal deposit characteris-
tics and constraints on mineralization Ore Geol Rev 21 1ndash
66Pasteris JD Chou I-M 1998 Fluid-deposited graphitic inclusions in quartz comparisonbetween KTB (German Continental Deep-Drilling) core samples and arti1047297cially re-equilibrated natural inclusions Geochim Cosmochim Acta 62 109ndash122
Perraki M Proyer A Mposkos E Kaindl R Hoinkes G 2006 Raman micro-spectroscopy on diamond graphite and other carbon polymorphs from theultrahigh-pressure metamorphic Kimi Complex of the Rhodope Metamorphic Prov-ince NE Greece Earth Planet Sci Lett 24 672ndash685
Phillips GN Powell R 2009 Formation of gold deposits review and evaluation of thecontinuum model Earth-Sci Rev 94 1ndash12
Pimenta MA Dresselhaus G Dresselhaus MS Canccedilado LG Jorio A Saito R 2007Studying disorder in graphite-based systems by Raman spectroscopy Phys ChemChem Phys 9 1276ndash1291
Pokrovski GS Akin1047297ev NN Borisova AY Zotov AV Kouzmanov K 2014 Gold spe-ciation and transport in geological 1047298uids insights from experiments and physicalndashchemical modelling Geol Soc Lond Spec Publ httpdxdoiorg101144SP4024(Online First)
Ratschbacher L Franz L Min M Bachmenn R Martens U Stanek K Stubner KNelson BK Herrmann U Weber B Loacutepez-Martiacutenez M Jonckheere R Sperner
255E Salvioli-Mariani et al Journal of Geochemical Exploration 158 (2015) 243ndash 256
7172019 Salvioli et al 2015
httpslidepdfcomreaderfullsalvioli-et-al-2015 1414
B Tichomirowa M McWilliams MO Gordon M Meschede M Bock P 2009 TheNorth AmericanndashCaribbean plate boundary in MeacutexicondashGuatemalandashHonduras In
James KH Lorente MA Pindell JL (Eds) The Origin and Evolution of the Caribbe-an Plate Geological Society London Special Publications 328 pp 219ndash293
Ridley JR Diamond LW 2000 Fluid chemistry of orogenic lode-gold deposits and im-plications for genetic models In Hagemann S Brown PE (Eds) Gold in 2000 Re-views in Economic Geology 13 pp 141ndash162
Ridley J Hagemann SG 1999 Interpretation of post-entrapment 1047298uid-inclusion re-equilibration at the Three Mile Hill Marvel Loch and Grif 1047297ns Find high-temperature lode-gold deposits Yilgran Craton Western Australia Chem Geol154 257ndash278
Robb L 2010 Introduction to Ore-forming Processes Blackwell Publishing Malden USARoberts RJ Irving EM 1957 Mineral deposits of Central America U S Geol Surv Bull1034 205
Roedder E 1984 Fluid inclusions Reviews in Mineralogy 12 Mineralogical Society of America Washington DC
Rogers RD Mann P 2007 Transtensional deformation of the western CaribbeanndashNorthAmerica plate boundary zone In Mann P (Ed) Geologic and Tectonic Developmentof the Caribbean Plate in Northern Central America Geological Society of AmericaSpecial Paper 428 pp 37ndash64
Rogers RD Mann P Emmet PA 2007 Tectonic terranes of the Chortis block based onintegration of regional aeromagnetic and geologic data In Mann P (Ed) Geologicand Tectonic Development of the Caribbean Plate in Northern Central America Geo-logical Society of America Special Paper 428 pp 65ndash88
Roine A 2009 HSC Chemistryreg 70 Users Guide ndash Volume frac12 ndash Chemical Reaction andEquilibrium Software With Extensive Thermochemical Database and Flowsheet Sim-ulation Outotec Information Center Finland
Samson IM Williams-Jones A-E Ault KM Gagnon JE 2008 Source of 1047298uids formingdistal ZnndashPbndashAg skarns evidence from laser ablation-inductively coupled plasma-mass spectrometry analysis of 1047298uid inclusions from El Mochito Honduras Geology
36 947ndash950Satish-Kumar M 2005 Graphite-bearing CO2-1047298uid inclusions in granulites insights on
graphite precipitation and carbon isotope evolution Geochim Cosmochim Acta 69(15) 3841ndash3856
Seitz JF Pasteris JD 1990 Theoretical and practical aspect of differential partitioning of gases by clathrate hydrates in 1047298uid inclusions Geochim Cosmochim Acta 54631ndash639
Shvarov YV 2008 HCh new potentialities for the thermodynamic simulation of geo-chemical systems offered by Windows Geochem Int 46 834ndash839
Sibson RH 1987 Earthquake rupturing as a mineralizing agent in hydrothermal sys-tems Geology 15 701ndash704
Silva-Romo G 2008 GuayapendashPapalutla fault system a continuous Cretaceous structurefrom southern Mexicoto theChortis BlockTectonicimplicationsGeology 3675ndash78
Spooner ETC Bray CJ Wood PC Burrows DR Callan NJ 1987 Aundashquartz vein andCundashAundashAgndashMondashanhydrite mineralization HollingerndashMcIntyre Mine Timmins
Ontario δ13C values (McIntyre) Fluid inclusion gas geochemistry pressure (depth)estimation and H2OndashCO2 phase separation as a precipitation and dilation mecha-nism Ont Geol Surv Misc Pap 136 35ndash56
Su W Xi B Xia B Zhang X Hu R 2008 Visible gold in arsenian pyrite at theShuiyindong Carlin-type gold deposit Guizhou China implications for the environ-ment and processes of ore formation Ore Geol Rev 33 667ndash679
Sundblad K Cumming GL Krstic D 1991 Lead isotope evidence for the formation of epithermalgold quartzveins in theChortis BlockNicaragua Econ Geol 86 944ndash959
Tagirov BR Salvi S Schott J Baranova NN 2005 Experimental study of goldndash
hydrosulphide complexing in aqueous solutions at 350ndash500 degC 500 and 1000 barsusing mineral buffers Geochim Cosmochim Acta 69 (8) 2119ndash2132
ThieryR Vanden Kerkhof AM Dubessy J 1994 vX properties of CH4ndash
CO2 and CO2ndash
N21047298uid inclusions modelling for T b 31 degC and P b 400 bars Eur J Mineral 6 753ndash771
Thomsen C Reich S 2000 Double resonant Raman scattering in graphite Phys RevLett 85 5214ndash5217
Van den Kerkhof AM 1988 The System CO2ndashCH4ndashN2 in Fluid Inclusions TheoreticalModelling and Geochemical Applications (PhD Thesis Amsterdam)
Vanden Kerkhof AM OlsenSN 1990 A natural example of superdense CO2 inclusionsmicrothermometry and Raman analysis Geochim Cosmochim Acta 54 895ndash901
Van den Kerkhof AM Thiery R 2001 Carbonic inclusions Lithos 55 49ndash68Vidano RP Ischbach DB Willis LJ Loehr TM 1981 Observation of Raman band
shifting with excitation wavelength for carbons and graphites Solid State Commun39 341ndash344
Wang X Chou I-M Hu W Burruss RC Sun Q Song Y 2011 Raman spectroscopymeasurements of CO2 density experimental calibration with high-pressure opticalcell (HPOC) and fused silica capillary capsule (FSCC) with application to 1047298uid inclu-sion observations Geochim Cosmochim Acta 75 4080ndash4093
Williams-Jones AE Bowell RJ Migdisov AA 2009 Gold in solution Elements 5281ndash287
Williams-Jones AE Samson IM Ault KM Gagnon JE Fryer BJ 2010 The genesis of
distal zinc skarns evidence from the Mochito deposit Honduras Econ Geol 1051411ndash1440
Wopenka B Pasteris JD 1993 Structural characterization of kerogens to granulite-facies graphite applicability of Raman microprobe spectroscopy Am Mineral 78533ndash557
Yang F Mao J Wang Y Bierlein F 2006 Geology and geochemistry of the Bulongquartzndashbarite vein-type gold deposit in the Xinjiang Uygur Autonomous RegionChina Ore Geol Rev 29 52ndash76
Zhang YG Frantz JD 1987 Determination of the homogenization temperatures anddensities of supercritical 1047298uids in the system NaClndashKClndashCaCl2ndashH2O using synthetic1047298uid inclusions Chem Geol 64 335ndash350
256 E Salvioli-Mariani et al Journal of Geochemical Exploration 158 (2015) 243ndash 256
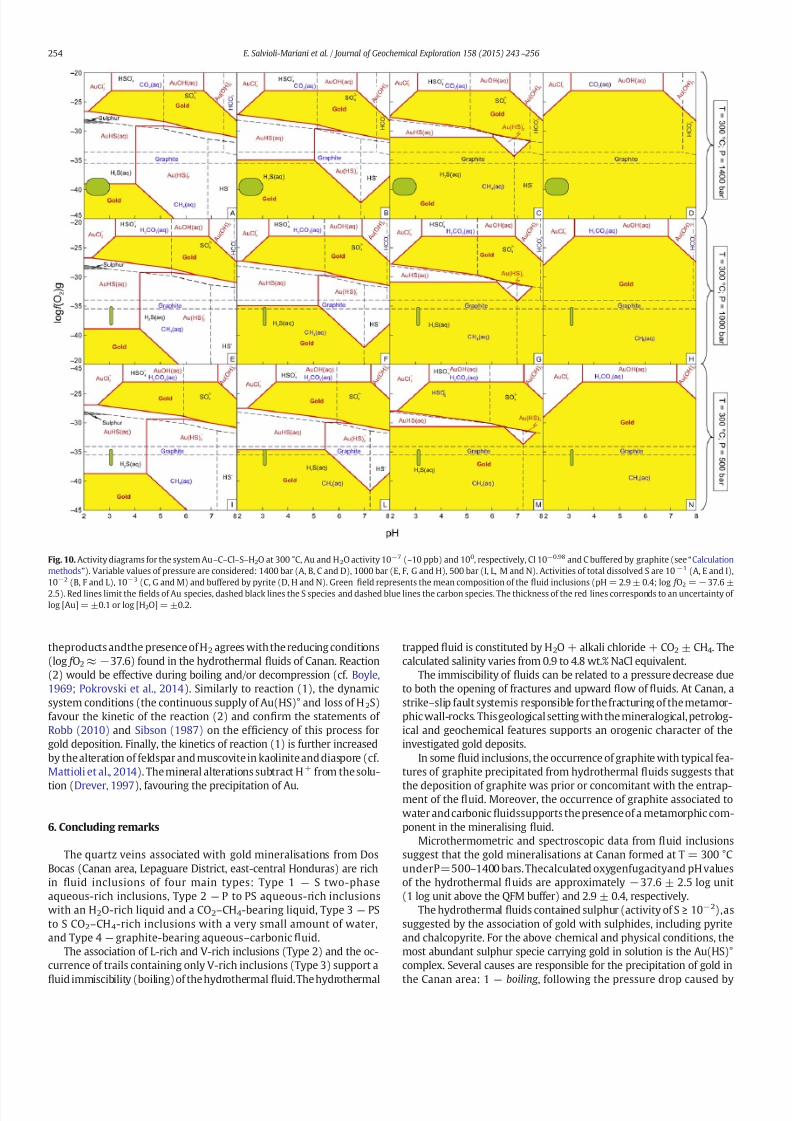
7172019 Salvioli et al 2015
httpslidepdfcomreaderfullsalvioli-et-al-2015 1214
theproducts andthe presence of H2 agrees with the reducing conditions(log f O2 asymp minus376) found in the hydrothermal 1047298uids of Canan Reaction(2) would be effective during boiling andor decompression (cf Boyle1969 Pokrovski et al 2014) Similarly to reaction (1) the dynamicsystem conditions (the continuous supply of Au(HS)deg and loss of H2S)favour the kinetic of the reaction (2) and con1047297rm the statements of Robb (2010) and Sibson (1987) on the ef 1047297ciency of this process forgold deposition Finally the kinetics of reaction (1) is further increasedby the alteration of feldspar and muscovite in kaolinite and diaspore (cfMattioli et al 2014) The mineral alterations subtract H+ from the solu-
tion (Drever 1997) favouring the precipitation of Au
6 Concluding remarks
The quartz veins associated with gold mineralisations from DosBocas (Canan area Lepaguare District east-central Honduras) are richin 1047298uid inclusions of four main types Type 1 mdash S two-phaseaqueous-rich inclusions Type 2 mdash P to PS aqueous-rich inclusionswith an H2O-rich liquid and a CO2ndashCH4-bearing liquid Type 3 mdash PSto S CO2ndashCH4-rich inclusions with a very small amount of waterand Type 4 mdash graphite-bearing aqueousndashcarbonic 1047298uid
The association of L-rich and V-rich inclusions (Type 2) and the oc-currence of trails containing only V-rich inclusions (Type 3) support a
1047298uid immiscibility (boiling)of the hydrothermal1047298uidThe hydrothermal
trapped 1047298uid is constituted by H2O + alkali chloride + CO2 plusmn CH4 Thecalculated salinity varies from 09 to 48 wt NaCl equivalent
The immiscibility of 1047298uids can be related to a pressure decrease dueto both the opening of fractures and upward 1047298ow of 1047298uids At Canan astrikendashslip fault systemis responsible for the fracturing of the metamor-phic wall-rocks Thisgeological setting with the mineralogicalpetrolog-ical and geochemical features supports an orogenic character of theinvestigated gold deposits
In some 1047298uid inclusions the occurrence of graphite with typical fea-tures of graphite precipitated from hydrothermal 1047298uids suggests that
the deposition of graphite was prior or concomitant with the entrap-ment of the 1047298uid Moreover the occurrence of graphite associated towater andcarbonic1047298uidssupports the presence of a metamorphic com-ponent in the mineralising 1047298uid
Microthermometric and spectroscopic data from 1047298uid inclusionssuggest that the gold mineralisations at Canan formed at T = 300 degCunderP=500ndash1400 barsThecalculated oxygenfugacityand pH valuesof the hydrothermal 1047298uids are approximately minus 376 plusmn 25 log unit(1 log unit above the QFM buffer) and 29 plusmn 04 respectively
The hydrothermal 1047298uids contained sulphur (activity of S ge 10minus2)assuggested by the association of gold with sulphides including pyriteand chalcopyrite For the above chemical and physical conditions themost abundant sulphur specie carrying gold in solution is the Au(HS)degcomplex Several causes are responsible for the precipitation of gold in
the Canan area 1 mdash boiling following the pressure drop caused by
Fig 10 Activity diagrams for the system AundashCndashClndashSndashH2O at 300 degC Au and H2O activity 10minus7 (~10 ppb) and 100 respectively Cl 10minus098 and C buffered by graphite (see ldquoCalculationmethodsrdquo) Variable values of pressure are considered 1400 bar (A B C and D) 1000 bar (E F G and H) 500 bar (I L M and N) Activities of total dissolved S are 10minus1 (A E and I)10minus2 (B F and L) 10minus3 (C G and M) and buffered by pyrite (D H and N) Green 1047297eld represents the mean composition of the 1047298uid inclusions (pH = 29 plusmn 04 log f O2 = minus 376 plusmn25) Red lines limit the 1047297elds of Au species dashed black lines the S species and dashed blue lines the carbon species The thickness of the red lines corresponds to an uncertainty of log [Au] = plusmn01 or log [H2O] = plusmn02
254 E Salvioli-Mariani et al Journal of Geochemical Exploration 158 (2015) 243ndash 256
7172019 Salvioli et al 2015
httpslidepdfcomreaderfullsalvioli-et-al-2015 1314
tectonic andor hydrothermal 1047298uids activity 2 mdash sulphidation triggeredby the liberation of metal cations during the alteration of ma1047297c min-erals of the wall-rocks 3 mdash hydrothermal alteration of feldspars andphyllosilicates of the wall-rocks
Acknowledgements
The authors wish to thank M Menichetti for providing samples of
the quartz veins and the Goldlake Group for the permission to publishthe results of this study Special thanks are due to John Ridley for theuseful and encouraging suggestions which have noticeably improvedthequality of this paperSincere thanksare dueto BJStacey forimprov-ing the English
References
Alvarez-Gogravemez JA Meijer PT Martigravenez-Digraveaz JJ Capote R2008 Constraintsfrom1047297nite element modeling on the active tectonics of northern Central America andthe Middle America Trench Tectonics 27 TC1008 httpdxdoiorg1010292007TC002162
Andrada de Palomera P van Ruitenbeek FJA van der Meer FK Fernaacutendez R 2012Geochemical indicators of gold-rich zones in the La Jose1047297na epithermal depositDeseado Massif Argentina Ore Geol Rev 45 61ndash80
Aoya M Kouketsu Y Endo S Shimizu H Mizukami T Nakamura D Wallis S 2010Extending the applicability of the Raman carbonaceous-material geothermometer
using data from contact metamorphic rocks J Metamorph Geol 28 895ndash914Bakker RJ 1999 Adaptation of the Bowers and Helgeson (1983) equation of state to the
H2OndashCO2ndashCH4ndashN2ndashNaCl system Chem Geol 154 225ndash236Bakker RJ Brown PE 2003 Computer modelling in 1047298uid inclusion research In
Samson I Anderson A Marshall D (Eds) Fluid Inclusions Analysis and interpreta-tion Mineralogical Association of Canada Short Course Series 32 pp 175ndash212
Benison KC 2013 Acid saline 1047298uid inclusions examples from modern and Permianextreme lake systems Geo1047298uids 13 579ndash593
Bersani D Salvioli-Mariani E Mattioli M Menichetti M Lottici PP 2009 Raman andmicro-thermometric investigation of the 1047298uid inclusions in quartz in a gold-richformation from Lepaguare mining district Spectrochim Acta A 73 443ndash449
Bethke CM Yeakel S 2008 The Geochemists Workbenchreg mdash Release 7 GWB Essen-tials Guide mdash Hydrogeology Program University of Illinois (100 pp)
Bodnar RJ Reynolds TJ Kuehn CA 1985 Fluid-inclusion systematics in epithermalsystems In Berger BR Bethke PM (Eds) Geology and Geochemistry of Epithermal Systems Reviews in Economic Geology 2 pp 73ndash97
Boiron MC Cathelineau M Essarraj S Lespinasse M Sellier E 1991 Characterizationof the relationships between deformation 1047298uid migration and Au deposition in
quartz veins methodology and modelling Proceedings Gold 91 AA BalkemaPublishers Brazil pp 637ndash643Boiron MC Moissette A Cathelineau M Banks D Monnin C Dubessy J 1999
Detailed determination of palaeo1047298uid chemistry an integrated study of sulphate-volatile rich brines and aquo-carbonic 1047298uids in quartz veins from Ouro Fino(Brazil) Chem Geol 154 179ndash192
Botros NS 2004 A new classi1047297cation of the gold deposits of Egypt Ore Geol Rev 251ndash37
Bowers TS Helgeson HW 1983 Calculation of the thermodynamic and geochemicalconsequences of nonideal mixing in the system H2OndashCO2ndashNaCl on phase relationsin geological systems equation of state for H 2OndashCO2ndashNaCl 1047298uids at high pressuresand temperatures Geochim Cosmochim Acta 47 1247ndash1275
Boyle RW 1969 Hydrothermal transport and deposition of gold Econ Geol 64112ndash115
Burke EAJ 2001 Raman microspectrometry of 1047298uid inclusions Lithos 55 139ndash158Callaghan T 2001 Geology and host-rock alteration of the Henty and Mount Julia gold
deposits western Tasmania Econ Geol 96 (5) 1073ndash1088Carpenter RH 1954 Geology and ore deposits of the Rosario mining district and San
Juancito Mountains Honduras Central America Geol Soc Am Bull 65 23ndash28
Cepedal A Fuertes-Fuente M Martiacuten-Izard A Garciacutea-Nieto J Boiron MC 2013 Anintrusion-related gold deposit (IRGD) in the NW of Spain the Linares deposit igne-ous rocks veins and related alterations ore features and 1047298uids involved
J Geochem Explor 124 101ndash126Cesare B 1995 Graphite precipitation in CndashOndashH 1047298uid inclusions closed system compo-
sitional and density changes and thermobarometric implications Contrib MineralPetrol 122 25ndash33
Cleverley JS Bastrakov EN 2005 K2GWB Utility for Generating Thermodynamic DataFiles for the GeochemistsWorkbenchregat 0ndash1000 degC and 1ndash5000 bar from UT2K andthe UNITHERM Database
Collins PLF 1979 Gas hydrates in CO2-bearing 1047298uid inclusions and the use of freezingdata for estimation of salinity Econ Geol 74 1435ndash1444
Deksissa DJ Koeberl C 2005 Geochemistry alteration and genesis of gold mineraliza-tion in the Okote area southern Ethiopia Geochem J 38 307ndash331
Diamond LW 2003 Introduction to gas-bearing aqueous 1047298uid inclusions In Samson IAnderson A Marshall D (Eds) Fluid Inclusions Analysis and interpretation Miner-alogical Association of Canada Short Course Series 32 pp 101ndash158
Drever JI 1997 The Geochemistry of Natural Water Prentice-Hall Upper Saddle RiverNew Jersey
Drobe J Cann RM 2000 CundashAu skarn mineralization Minas de Oro District HondurasCentral America Explor Min Geol 9 51ndash63
Duan Z MoslashllerN WeareJK 1992a An equation of state for theCH4ndashCO2ndashH2O systemI Pure systems from 0 to 1000 degC and 0 to 8000 bar Geochim Cosmochim Acta 562605ndash2617
Duan Z MoslashllerN Weare JK 1992b Anequationof statefor the CH4ndashCO2ndashH2O systemII Mixtures from 50 to 1000 degC and 0 to 1000 bar Geochim Cosmochim Acta 562619ndash2631
Esmaeily D Afshooni SZ Mirnejad H Rashidnejad-e-Omran N 2012 Mass changesduring hydrothermal alteration associated with gold mineralization in the Astanehgranitoid rocks western Iran Geochem Explor Environ Anal 12 161ndash175
Gammons GH Williams-Jones AE 1997 Chemical mobility of Gold in the porphyryndash
epithermal environment Econ Geol 92 45ndash59Garofalo P Matthaumli SK Heinrich C 2002 Three dimensional geometry ore
distribution and time-integrated mass transfer through the quartzndashtourma-linendashgold vein network of the Sigma deposit (Abitibi belt mdash Canada) Geo1047298uids2 217ndash232
Garrabos Y Tufeu R Le Neindre B 1980 Rayleigh and Raman scattering near the crit-ical point of carbon dioxide J Chem Phys 72 (8) 4637ndash4651
Groves DI Goldfarb RJ Robert F Hart CJR 2003 Gold deposits in metamorphicbelts overview of current understanding outstanding problems future researchand exploration signi1047297cance Econ Geol 98 1ndash29
Guzman-Speziale M 2001 Active seismic deformation in the grabens of northern Cen-tral America and its relationship to the relative motion of the North AmericandashCarib-bean plate boundary Tectonophysics 337 39ndash51
Hedenquist JF Reyes AG Simmons SF Taguchi S 1992 The thermal and geochemi-cal structure of geothermal and epithermal systems a framework for interpreting1047298uid inclusion data Eur J Mineral 4 989ndash1015
Heinrich CA Driesner TStefaacutensson ASeward TM 2004 Magmatic vapor contractionand the transport of gold from the porphyry environment to epithermal ore deposits
Geology 32 761ndash764Horne G Clark G Pushkar P 1976 Pre-Cretaceous rocks of northwestern Honduras
basement terrane in Sierra de Omoa AAPG Bull 60 566ndash583Huizenga J-M 2005 COH an Excel Spreadsheet for composition calculations in the Cndash
OndashH 1047298uid system Comput Geosci 31 797ndash800Huizenga J-M 2011 Thermodynamic modelling of a cooling CndashOndashH 1047298uid-graphite sys-
tem implications for hydrothermal graphite precipitation Miner Deposita 46 23ndash33KawakamiY YamamotoJ Kagi H2003 Micro-Ramandensimeterfor CO2 inclusionsin
mantle-derived minerals Appl Spectrom 57 (11) 1333ndash1339Kawashima Y Katagiri G 1995 Fundamentals overtones and combinations in the
Raman spectrum of graphite Phys Rev B 52 10053ndash10059Klein EL Koppe JC Moura CAV 2002 Geology and geochemistry of the Caxis gold
deposit and geochronology of thegold-hosting Caxias Microtonalite Sao Luis Cratonnorthern Brazil J S Am Earth Sci 14 837ndash849
Lin F Bodnar RJ Becker SP 2007 Experimentaldetermination of the RamanCH4 sym-metric stretching (ν1) band position from 1ndash650 bar and 03ndash22 degC application to1047298uid inclusion studies Geochim Cosmochim Acta 71 3746ndash3756
Lu W Chou I-M Burruss RC Song Y 2007 An uni1047297ed equation for calculating meth-ane vapor pressures in the CH4ndashH2O system with measured Raman shifts GeochimCosmochim Acta 71 3969ndash3978
Luque FJ Pasteris JD Wopenka B Rodas M Barrenechea JF 1998 Natural 1047298uid-deposited graphite mineralogical characteristics and mechanisms of formationAm J Sci 298 471ndash498
Mann P Burke K 1984 Neotectonics of the Caribbean Rev Geophys 22 309ndash362Mann P Burke K 1988 Cenozoic rift formation in the northern Caribbean Geology 12
732ndash736MatthewsMJ Pimenta MA Dresselhaus GDresselhaus MS Endo M1999 Originof
the dispersive effects of the Raman D band in carbon materials Phys Rev B 59R6585ndashR6588
Mattioli M Menichetti M Renzulli A Toscani L Salvioli-Mariani E Suarez P 2014Genesis of the hydrothermal gold deposits in the Canan area Lepaguare DistrictHonduras Int J Earth Sci 103 901ndash928
Mikucki EJ 1998 Hydrothermal transport and depositional processes in Archean lode-gold systems a review Ore Geol Rev 13 307ndash321
Mills RA Hugh KE Feray DE Swolfs HC 1967 Mesozoic stratigraphy of HondurasAAPG Bull 51 1711ndash1786
Miur TL 2002 The Hemlo gold deposit Ontario Canada principal deposit characteris-
tics and constraints on mineralization Ore Geol Rev 21 1ndash
66Pasteris JD Chou I-M 1998 Fluid-deposited graphitic inclusions in quartz comparisonbetween KTB (German Continental Deep-Drilling) core samples and arti1047297cially re-equilibrated natural inclusions Geochim Cosmochim Acta 62 109ndash122
Perraki M Proyer A Mposkos E Kaindl R Hoinkes G 2006 Raman micro-spectroscopy on diamond graphite and other carbon polymorphs from theultrahigh-pressure metamorphic Kimi Complex of the Rhodope Metamorphic Prov-ince NE Greece Earth Planet Sci Lett 24 672ndash685
Phillips GN Powell R 2009 Formation of gold deposits review and evaluation of thecontinuum model Earth-Sci Rev 94 1ndash12
Pimenta MA Dresselhaus G Dresselhaus MS Canccedilado LG Jorio A Saito R 2007Studying disorder in graphite-based systems by Raman spectroscopy Phys ChemChem Phys 9 1276ndash1291
Pokrovski GS Akin1047297ev NN Borisova AY Zotov AV Kouzmanov K 2014 Gold spe-ciation and transport in geological 1047298uids insights from experiments and physicalndashchemical modelling Geol Soc Lond Spec Publ httpdxdoiorg101144SP4024(Online First)
Ratschbacher L Franz L Min M Bachmenn R Martens U Stanek K Stubner KNelson BK Herrmann U Weber B Loacutepez-Martiacutenez M Jonckheere R Sperner
255E Salvioli-Mariani et al Journal of Geochemical Exploration 158 (2015) 243ndash 256
7172019 Salvioli et al 2015
httpslidepdfcomreaderfullsalvioli-et-al-2015 1414
B Tichomirowa M McWilliams MO Gordon M Meschede M Bock P 2009 TheNorth AmericanndashCaribbean plate boundary in MeacutexicondashGuatemalandashHonduras In
James KH Lorente MA Pindell JL (Eds) The Origin and Evolution of the Caribbe-an Plate Geological Society London Special Publications 328 pp 219ndash293
Ridley JR Diamond LW 2000 Fluid chemistry of orogenic lode-gold deposits and im-plications for genetic models In Hagemann S Brown PE (Eds) Gold in 2000 Re-views in Economic Geology 13 pp 141ndash162
Ridley J Hagemann SG 1999 Interpretation of post-entrapment 1047298uid-inclusion re-equilibration at the Three Mile Hill Marvel Loch and Grif 1047297ns Find high-temperature lode-gold deposits Yilgran Craton Western Australia Chem Geol154 257ndash278
Robb L 2010 Introduction to Ore-forming Processes Blackwell Publishing Malden USARoberts RJ Irving EM 1957 Mineral deposits of Central America U S Geol Surv Bull1034 205
Roedder E 1984 Fluid inclusions Reviews in Mineralogy 12 Mineralogical Society of America Washington DC
Rogers RD Mann P 2007 Transtensional deformation of the western CaribbeanndashNorthAmerica plate boundary zone In Mann P (Ed) Geologic and Tectonic Developmentof the Caribbean Plate in Northern Central America Geological Society of AmericaSpecial Paper 428 pp 37ndash64
Rogers RD Mann P Emmet PA 2007 Tectonic terranes of the Chortis block based onintegration of regional aeromagnetic and geologic data In Mann P (Ed) Geologicand Tectonic Development of the Caribbean Plate in Northern Central America Geo-logical Society of America Special Paper 428 pp 65ndash88
Roine A 2009 HSC Chemistryreg 70 Users Guide ndash Volume frac12 ndash Chemical Reaction andEquilibrium Software With Extensive Thermochemical Database and Flowsheet Sim-ulation Outotec Information Center Finland
Samson IM Williams-Jones A-E Ault KM Gagnon JE 2008 Source of 1047298uids formingdistal ZnndashPbndashAg skarns evidence from laser ablation-inductively coupled plasma-mass spectrometry analysis of 1047298uid inclusions from El Mochito Honduras Geology
36 947ndash950Satish-Kumar M 2005 Graphite-bearing CO2-1047298uid inclusions in granulites insights on
graphite precipitation and carbon isotope evolution Geochim Cosmochim Acta 69(15) 3841ndash3856
Seitz JF Pasteris JD 1990 Theoretical and practical aspect of differential partitioning of gases by clathrate hydrates in 1047298uid inclusions Geochim Cosmochim Acta 54631ndash639
Shvarov YV 2008 HCh new potentialities for the thermodynamic simulation of geo-chemical systems offered by Windows Geochem Int 46 834ndash839
Sibson RH 1987 Earthquake rupturing as a mineralizing agent in hydrothermal sys-tems Geology 15 701ndash704
Silva-Romo G 2008 GuayapendashPapalutla fault system a continuous Cretaceous structurefrom southern Mexicoto theChortis BlockTectonicimplicationsGeology 3675ndash78
Spooner ETC Bray CJ Wood PC Burrows DR Callan NJ 1987 Aundashquartz vein andCundashAundashAgndashMondashanhydrite mineralization HollingerndashMcIntyre Mine Timmins
Ontario δ13C values (McIntyre) Fluid inclusion gas geochemistry pressure (depth)estimation and H2OndashCO2 phase separation as a precipitation and dilation mecha-nism Ont Geol Surv Misc Pap 136 35ndash56
Su W Xi B Xia B Zhang X Hu R 2008 Visible gold in arsenian pyrite at theShuiyindong Carlin-type gold deposit Guizhou China implications for the environ-ment and processes of ore formation Ore Geol Rev 33 667ndash679
Sundblad K Cumming GL Krstic D 1991 Lead isotope evidence for the formation of epithermalgold quartzveins in theChortis BlockNicaragua Econ Geol 86 944ndash959
Tagirov BR Salvi S Schott J Baranova NN 2005 Experimental study of goldndash
hydrosulphide complexing in aqueous solutions at 350ndash500 degC 500 and 1000 barsusing mineral buffers Geochim Cosmochim Acta 69 (8) 2119ndash2132
ThieryR Vanden Kerkhof AM Dubessy J 1994 vX properties of CH4ndash
CO2 and CO2ndash
N21047298uid inclusions modelling for T b 31 degC and P b 400 bars Eur J Mineral 6 753ndash771
Thomsen C Reich S 2000 Double resonant Raman scattering in graphite Phys RevLett 85 5214ndash5217
Van den Kerkhof AM 1988 The System CO2ndashCH4ndashN2 in Fluid Inclusions TheoreticalModelling and Geochemical Applications (PhD Thesis Amsterdam)
Vanden Kerkhof AM OlsenSN 1990 A natural example of superdense CO2 inclusionsmicrothermometry and Raman analysis Geochim Cosmochim Acta 54 895ndash901
Van den Kerkhof AM Thiery R 2001 Carbonic inclusions Lithos 55 49ndash68Vidano RP Ischbach DB Willis LJ Loehr TM 1981 Observation of Raman band
shifting with excitation wavelength for carbons and graphites Solid State Commun39 341ndash344
Wang X Chou I-M Hu W Burruss RC Sun Q Song Y 2011 Raman spectroscopymeasurements of CO2 density experimental calibration with high-pressure opticalcell (HPOC) and fused silica capillary capsule (FSCC) with application to 1047298uid inclu-sion observations Geochim Cosmochim Acta 75 4080ndash4093
Williams-Jones AE Bowell RJ Migdisov AA 2009 Gold in solution Elements 5281ndash287
Williams-Jones AE Samson IM Ault KM Gagnon JE Fryer BJ 2010 The genesis of
distal zinc skarns evidence from the Mochito deposit Honduras Econ Geol 1051411ndash1440
Wopenka B Pasteris JD 1993 Structural characterization of kerogens to granulite-facies graphite applicability of Raman microprobe spectroscopy Am Mineral 78533ndash557
Yang F Mao J Wang Y Bierlein F 2006 Geology and geochemistry of the Bulongquartzndashbarite vein-type gold deposit in the Xinjiang Uygur Autonomous RegionChina Ore Geol Rev 29 52ndash76
Zhang YG Frantz JD 1987 Determination of the homogenization temperatures anddensities of supercritical 1047298uids in the system NaClndashKClndashCaCl2ndashH2O using synthetic1047298uid inclusions Chem Geol 64 335ndash350
256 E Salvioli-Mariani et al Journal of Geochemical Exploration 158 (2015) 243ndash 256
7172019 Salvioli et al 2015
httpslidepdfcomreaderfullsalvioli-et-al-2015 1414
B Tichomirowa M McWilliams MO Gordon M Meschede M Bock P 2009 TheNorth AmericanndashCaribbean plate boundary in MeacutexicondashGuatemalandashHonduras In
James KH Lorente MA Pindell JL (Eds) The Origin and Evolution of the Caribbe-an Plate Geological Society London Special Publications 328 pp 219ndash293
Ridley JR Diamond LW 2000 Fluid chemistry of orogenic lode-gold deposits and im-plications for genetic models In Hagemann S Brown PE (Eds) Gold in 2000 Re-views in Economic Geology 13 pp 141ndash162
Ridley J Hagemann SG 1999 Interpretation of post-entrapment 1047298uid-inclusion re-equilibration at the Three Mile Hill Marvel Loch and Grif 1047297ns Find high-temperature lode-gold deposits Yilgran Craton Western Australia Chem Geol154 257ndash278
Robb L 2010 Introduction to Ore-forming Processes Blackwell Publishing Malden USARoberts RJ Irving EM 1957 Mineral deposits of Central America U S Geol Surv Bull1034 205
Roedder E 1984 Fluid inclusions Reviews in Mineralogy 12 Mineralogical Society of America Washington DC
Rogers RD Mann P 2007 Transtensional deformation of the western CaribbeanndashNorthAmerica plate boundary zone In Mann P (Ed) Geologic and Tectonic Developmentof the Caribbean Plate in Northern Central America Geological Society of AmericaSpecial Paper 428 pp 37ndash64
Rogers RD Mann P Emmet PA 2007 Tectonic terranes of the Chortis block based onintegration of regional aeromagnetic and geologic data In Mann P (Ed) Geologicand Tectonic Development of the Caribbean Plate in Northern Central America Geo-logical Society of America Special Paper 428 pp 65ndash88
Roine A 2009 HSC Chemistryreg 70 Users Guide ndash Volume frac12 ndash Chemical Reaction andEquilibrium Software With Extensive Thermochemical Database and Flowsheet Sim-ulation Outotec Information Center Finland
Samson IM Williams-Jones A-E Ault KM Gagnon JE 2008 Source of 1047298uids formingdistal ZnndashPbndashAg skarns evidence from laser ablation-inductively coupled plasma-mass spectrometry analysis of 1047298uid inclusions from El Mochito Honduras Geology
36 947ndash950Satish-Kumar M 2005 Graphite-bearing CO2-1047298uid inclusions in granulites insights on
graphite precipitation and carbon isotope evolution Geochim Cosmochim Acta 69(15) 3841ndash3856
Seitz JF Pasteris JD 1990 Theoretical and practical aspect of differential partitioning of gases by clathrate hydrates in 1047298uid inclusions Geochim Cosmochim Acta 54631ndash639
Shvarov YV 2008 HCh new potentialities for the thermodynamic simulation of geo-chemical systems offered by Windows Geochem Int 46 834ndash839
Sibson RH 1987 Earthquake rupturing as a mineralizing agent in hydrothermal sys-tems Geology 15 701ndash704
Silva-Romo G 2008 GuayapendashPapalutla fault system a continuous Cretaceous structurefrom southern Mexicoto theChortis BlockTectonicimplicationsGeology 3675ndash78
Spooner ETC Bray CJ Wood PC Burrows DR Callan NJ 1987 Aundashquartz vein andCundashAundashAgndashMondashanhydrite mineralization HollingerndashMcIntyre Mine Timmins
Ontario δ13C values (McIntyre) Fluid inclusion gas geochemistry pressure (depth)estimation and H2OndashCO2 phase separation as a precipitation and dilation mecha-nism Ont Geol Surv Misc Pap 136 35ndash56
Su W Xi B Xia B Zhang X Hu R 2008 Visible gold in arsenian pyrite at theShuiyindong Carlin-type gold deposit Guizhou China implications for the environ-ment and processes of ore formation Ore Geol Rev 33 667ndash679
Sundblad K Cumming GL Krstic D 1991 Lead isotope evidence for the formation of epithermalgold quartzveins in theChortis BlockNicaragua Econ Geol 86 944ndash959
Tagirov BR Salvi S Schott J Baranova NN 2005 Experimental study of goldndash
hydrosulphide complexing in aqueous solutions at 350ndash500 degC 500 and 1000 barsusing mineral buffers Geochim Cosmochim Acta 69 (8) 2119ndash2132
ThieryR Vanden Kerkhof AM Dubessy J 1994 vX properties of CH4ndash
CO2 and CO2ndash
N21047298uid inclusions modelling for T b 31 degC and P b 400 bars Eur J Mineral 6 753ndash771
Thomsen C Reich S 2000 Double resonant Raman scattering in graphite Phys RevLett 85 5214ndash5217
Van den Kerkhof AM 1988 The System CO2ndashCH4ndashN2 in Fluid Inclusions TheoreticalModelling and Geochemical Applications (PhD Thesis Amsterdam)
Vanden Kerkhof AM OlsenSN 1990 A natural example of superdense CO2 inclusionsmicrothermometry and Raman analysis Geochim Cosmochim Acta 54 895ndash901
Van den Kerkhof AM Thiery R 2001 Carbonic inclusions Lithos 55 49ndash68Vidano RP Ischbach DB Willis LJ Loehr TM 1981 Observation of Raman band
shifting with excitation wavelength for carbons and graphites Solid State Commun39 341ndash344
Wang X Chou I-M Hu W Burruss RC Sun Q Song Y 2011 Raman spectroscopymeasurements of CO2 density experimental calibration with high-pressure opticalcell (HPOC) and fused silica capillary capsule (FSCC) with application to 1047298uid inclu-sion observations Geochim Cosmochim Acta 75 4080ndash4093
Williams-Jones AE Bowell RJ Migdisov AA 2009 Gold in solution Elements 5281ndash287
Williams-Jones AE Samson IM Ault KM Gagnon JE Fryer BJ 2010 The genesis of
distal zinc skarns evidence from the Mochito deposit Honduras Econ Geol 1051411ndash1440
Wopenka B Pasteris JD 1993 Structural characterization of kerogens to granulite-facies graphite applicability of Raman microprobe spectroscopy Am Mineral 78533ndash557
Yang F Mao J Wang Y Bierlein F 2006 Geology and geochemistry of the Bulongquartzndashbarite vein-type gold deposit in the Xinjiang Uygur Autonomous RegionChina Ore Geol Rev 29 52ndash76
Zhang YG Frantz JD 1987 Determination of the homogenization temperatures anddensities of supercritical 1047298uids in the system NaClndashKClndashCaCl2ndashH2O using synthetic1047298uid inclusions Chem Geol 64 335ndash350
256 E Salvioli-Mariani et al Journal of Geochemical Exploration 158 (2015) 243ndash 256