Embed Size (px)
Citation preview
SAN FRANCISCO COUNTY TRANSPORTATION AUTHORITY
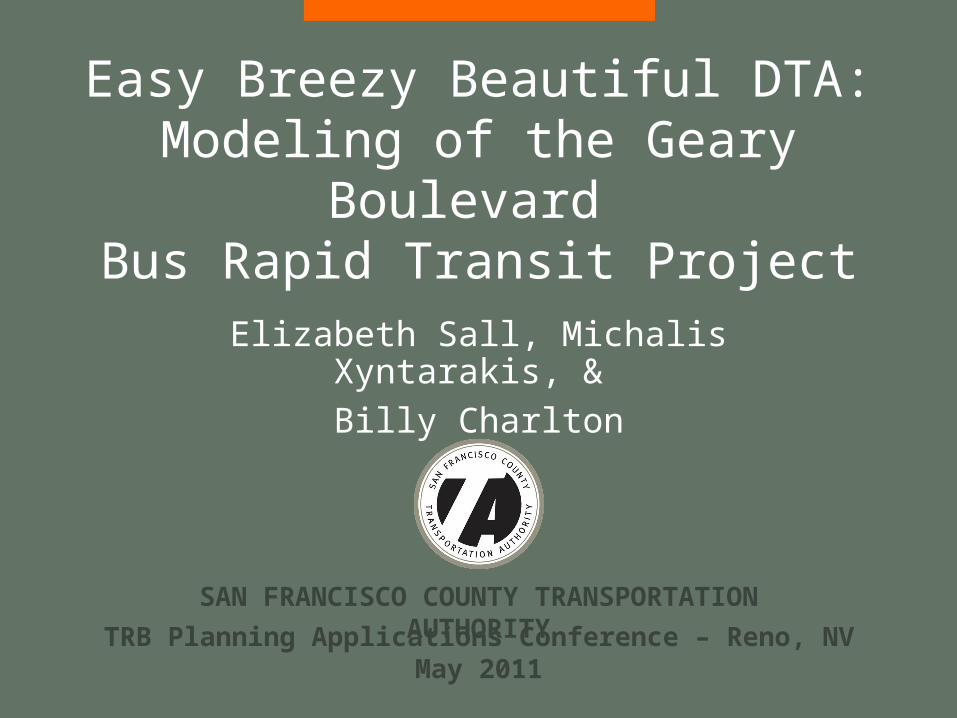
Easy Breezy Beautiful DTA:Modeling of the Geary
Boulevard Bus Rapid Transit Project
Elizabeth Sall, Michalis Xyntarakis, & Billy Charlton
TRB Planning Applications Conference – Reno, NVMay 2011
SAN FRANCISCO COUNTY TRANSPORTATION AUTHORITY
2
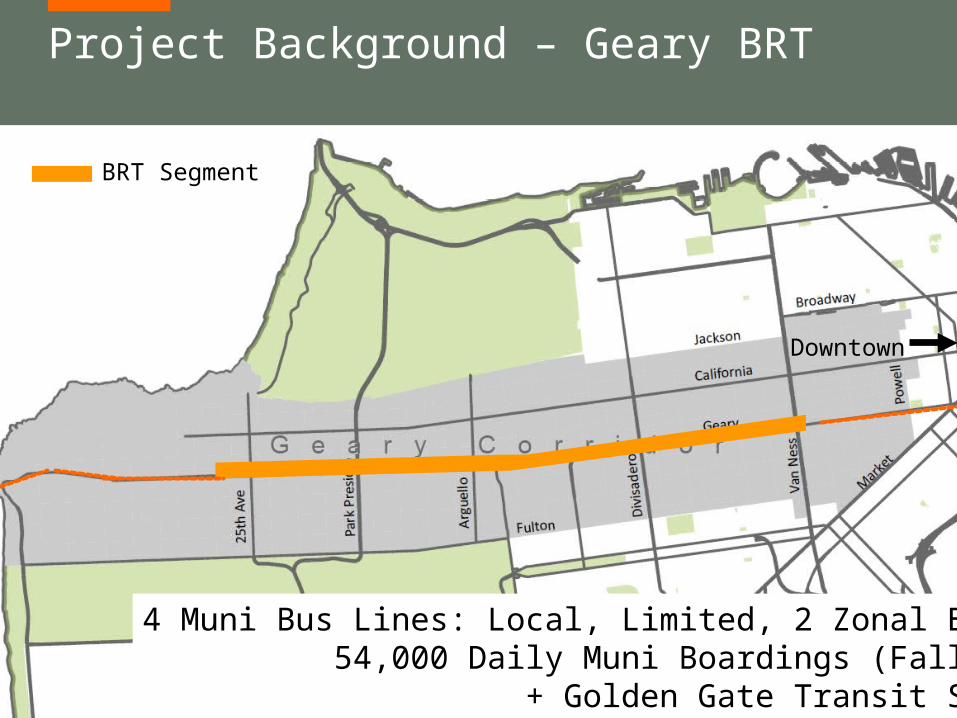
Project Background – Geary BRT
4 Muni Bus Lines: Local, Limited, 2 Zonal Express54,000 Daily Muni Boardings (Fall 2010)
+ Golden Gate Transit Service
BRT Segment
Downtown
SAN FRANCISCO COUNTY TRANSPORTATION AUTHORITY
3
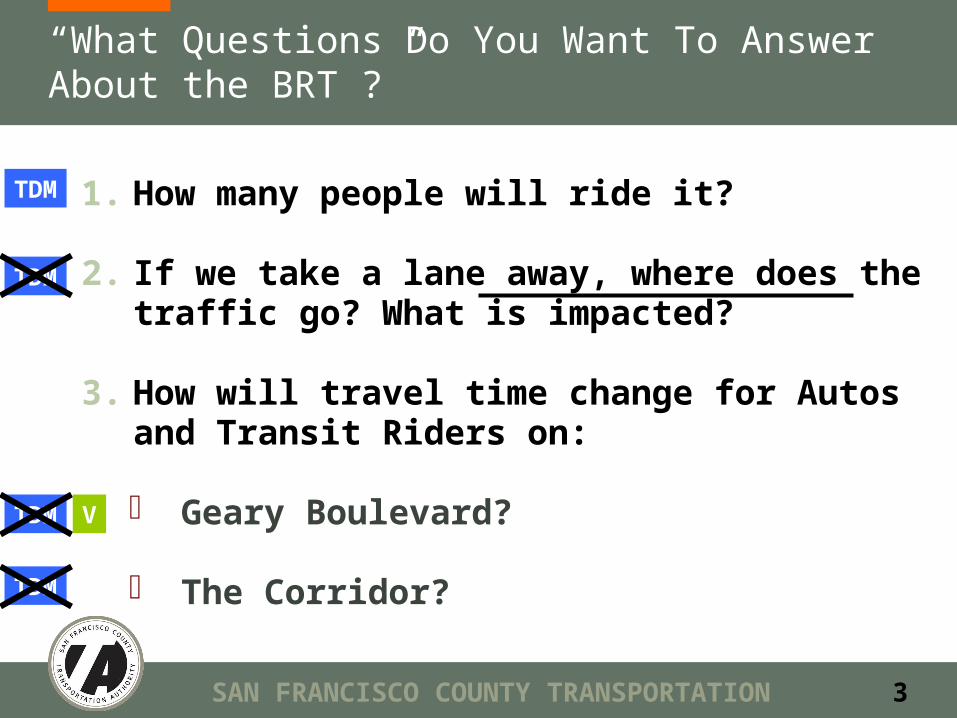
“What Questions Do You Want To Answer About the BRT ?”
1. How many people will ride it?
2. If we take a lane away, where does the traffic go? What is impacted?
3. How will travel time change for Autos and Transit Riders on:
Geary Boulevard?
The Corridor?
TDM
TDM
TDM V
TDM
SAN FRANCISCO COUNTY TRANSPORTATION AUTHORITY
4
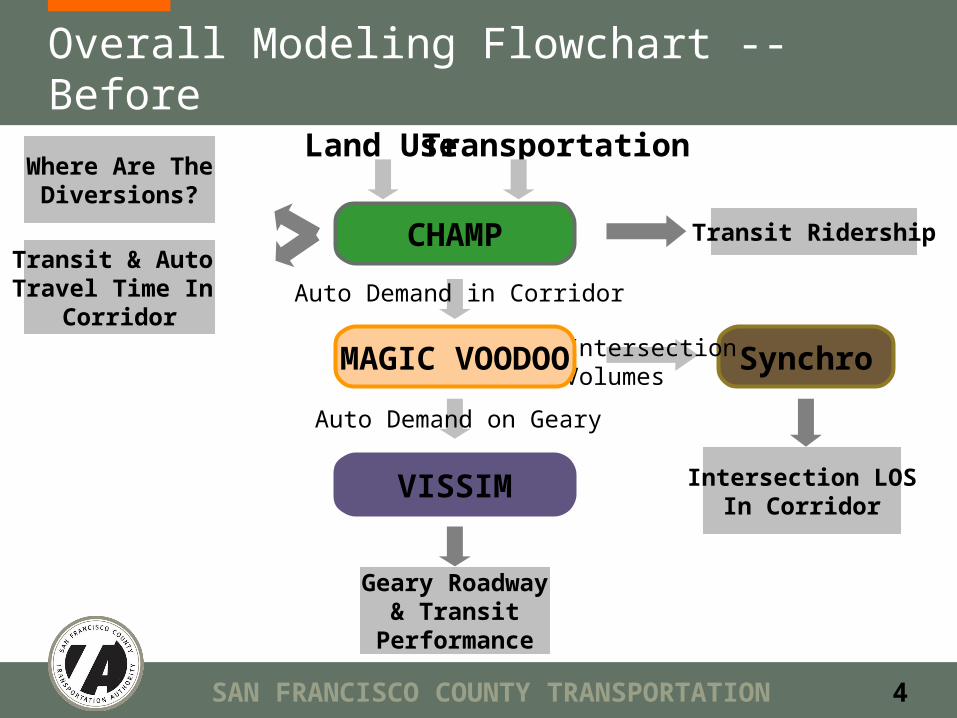
Overall Modeling Flowchart -- Before
CHAMP
Synchro
VISSIM
Auto Demand in Corridor
IntersectionVolumes
Land Use Transportation
Transit Ridership
Auto Demand on Geary
Intersection LOSIn Corridor
Geary Roadway& Transit
Performance
Where Are TheDiversions?
Transit & Auto Travel Time In
Corridor
MAGIC VOODOO
SAN FRANCISCO COUNTY TRANSPORTATION AUTHORITY
5
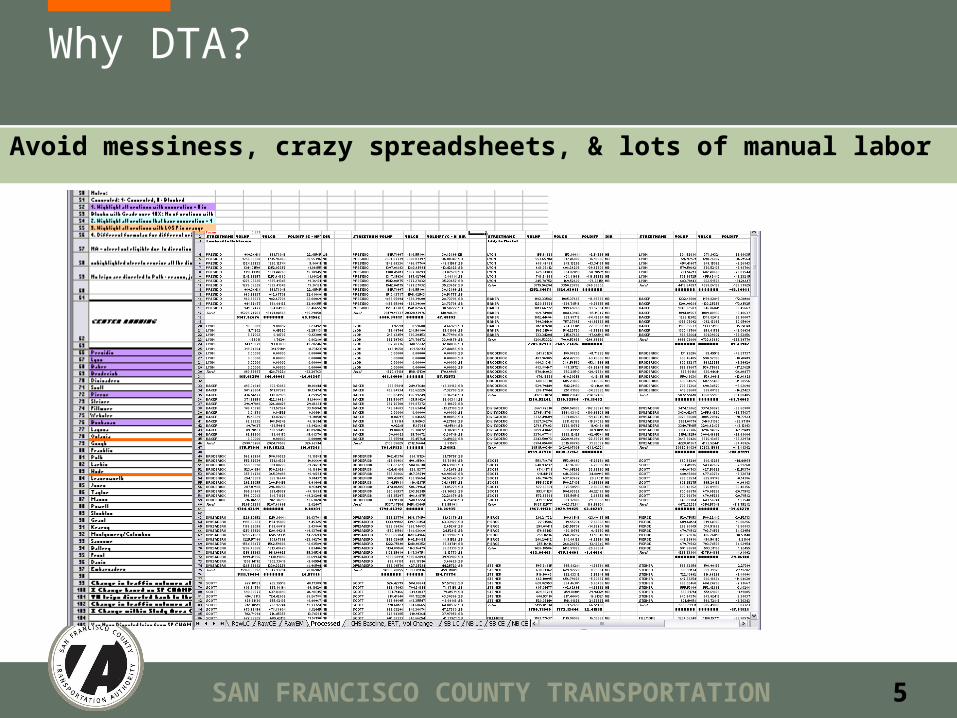
Why DTA?
Avoid messiness, crazy spreadsheets, & lots of manual labor
SAN FRANCISCO COUNTY TRANSPORTATION AUTHORITY
6
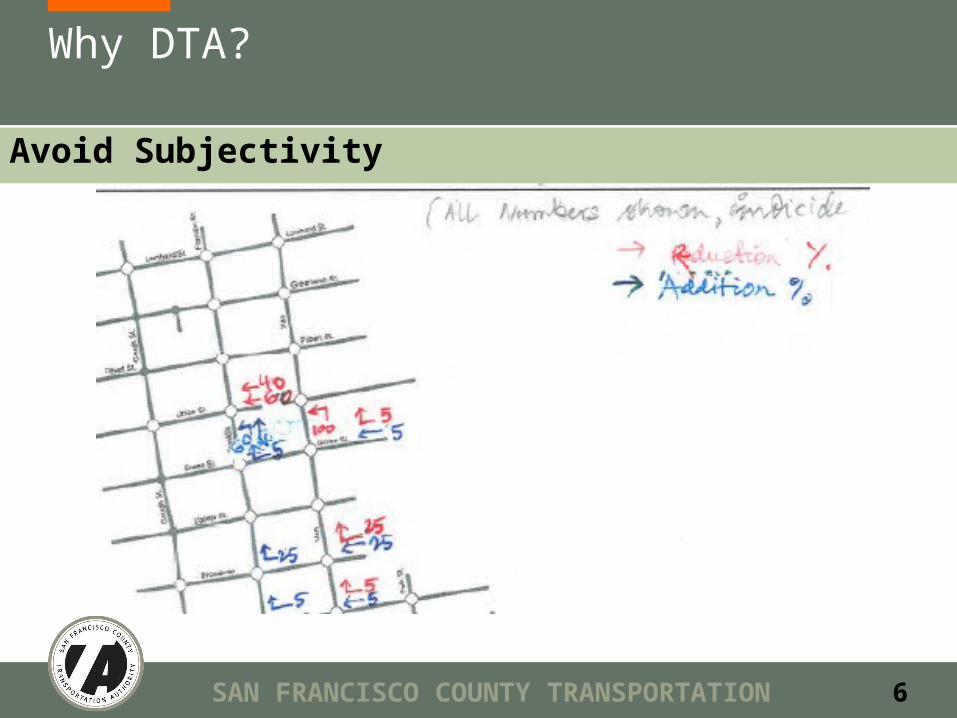
Why DTA?
Avoid Subjectivity
SAN FRANCISCO COUNTY TRANSPORTATION AUTHORITY
7
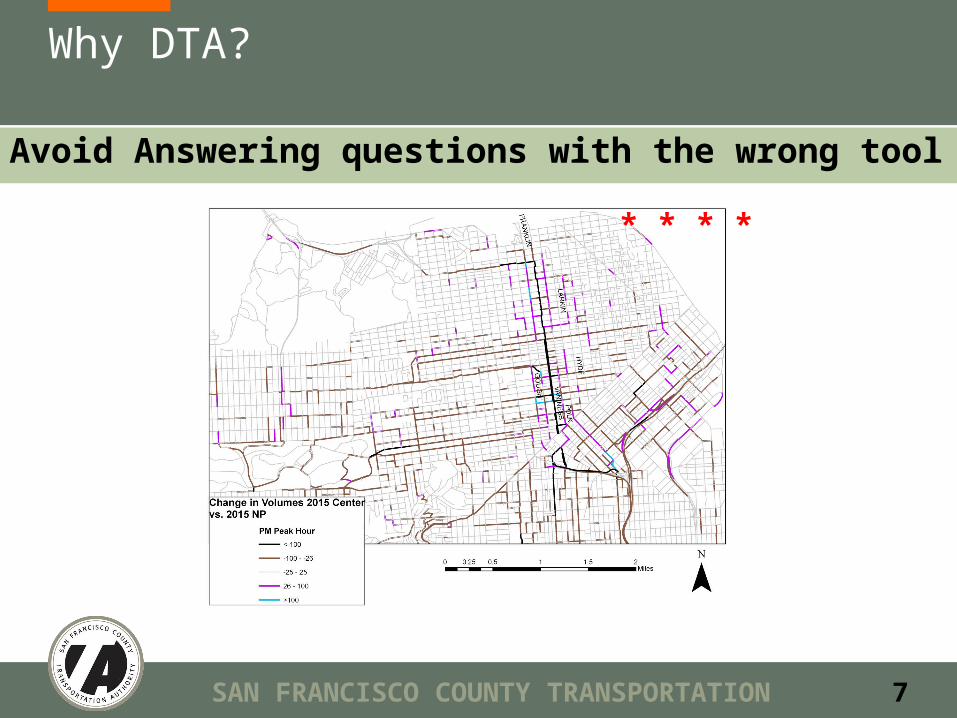
Why DTA?
Avoid Answering questions with the wrong tool
* * * *
SAN FRANCISCO COUNTY TRANSPORTATION AUTHORITY
8
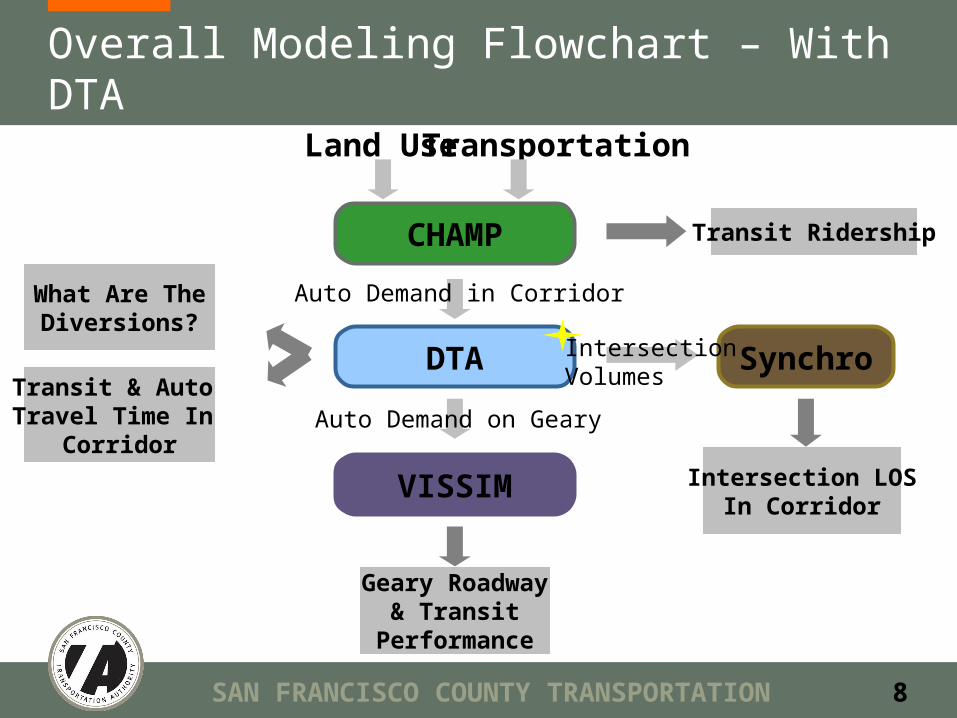
Overall Modeling Flowchart – With DTA
CHAMP
Synchro
VISSIM
DTA
Auto Demand in Corridor
IntersectionVolumes
Land Use Transportation
Transit Ridership
Auto Demand on Geary
Intersection LOSIn Corridor
Geary Roadway& Transit
Performance
What Are TheDiversions?
Transit & Auto Travel Time In
Corridor
SAN FRANCISCO COUNTY TRANSPORTATION AUTHORITY
9
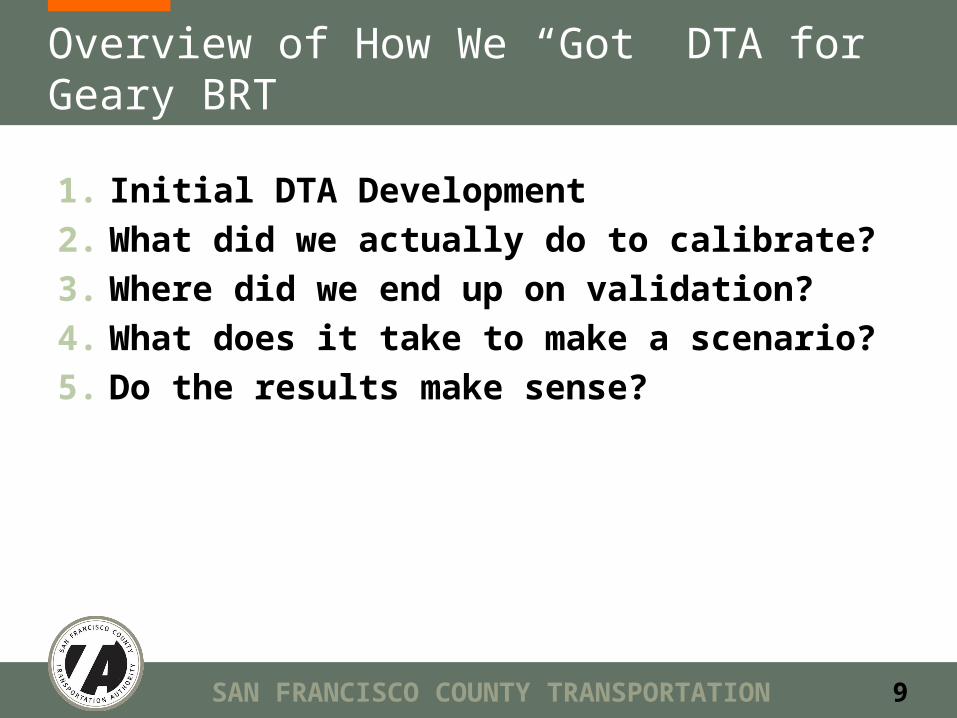
Overview of How We “Got” DTA for Geary BRT
1. Initial DTA Development 2. What did we actually do to calibrate?3. Where did we end up on validation?4. What does it take to make a scenario?5. Do the results make sense?
SAN FRANCISCO COUNTY TRANSPORTATION AUTHORITY
10
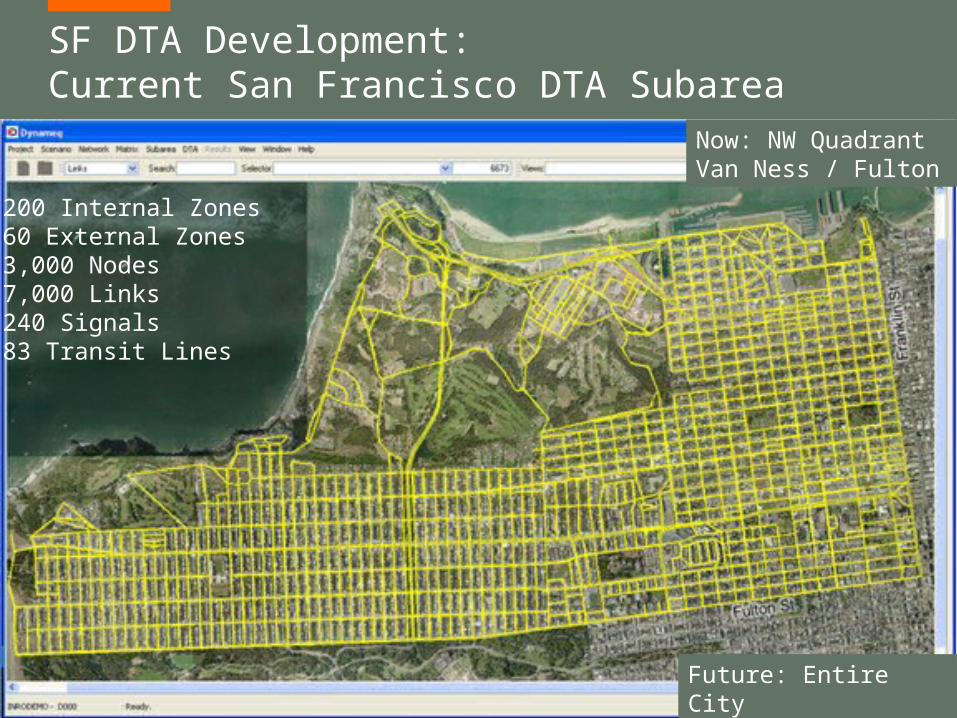
SF DTA Development:Current San Francisco DTA Subarea
200 Internal Zones60 External Zones3,000 Nodes7,000 Links240 Signals83 Transit Lines
Future: Entire City North of Cesar Chavez
Now: NW QuadrantVan Ness / Fulton
SAN FRANCISCO COUNTY TRANSPORTATION AUTHORITY
11
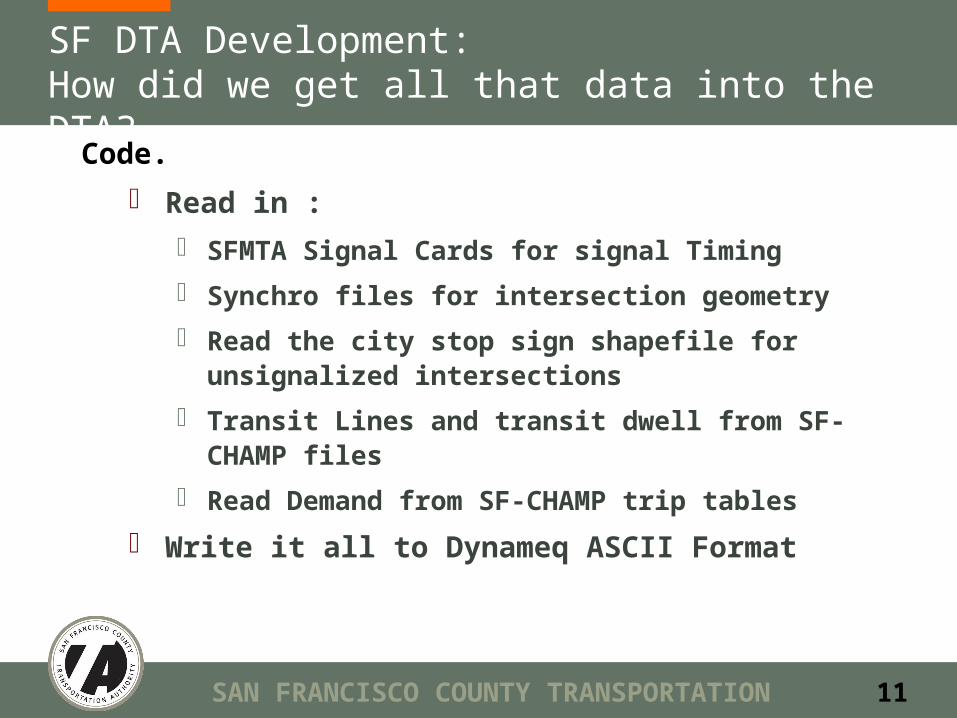
SF DTA Development:How did we get all that data into the DTA?
Code.
Read in :
SFMTA Signal Cards for signal Timing
Synchro files for intersection geometry
Read the city stop sign shapefile for unsignalized intersections
Transit Lines and transit dwell from SF-CHAMP files
Read Demand from SF-CHAMP trip tables
Write it all to Dynameq ASCII Format
SAN FRANCISCO COUNTY TRANSPORTATION AUTHORITY
12
Geary DTA Development – Calibration Steps
Becoming one with your model:Checked and double-checked network on
Geary and parallel routesAnalyzed vehicle paths at various
iterationsSelect links, select links, select linksModified freeflow speeds where justifiedModified traffic flow parameters where
justified
SAN FRANCISCO COUNTY TRANSPORTATION AUTHORITY
13
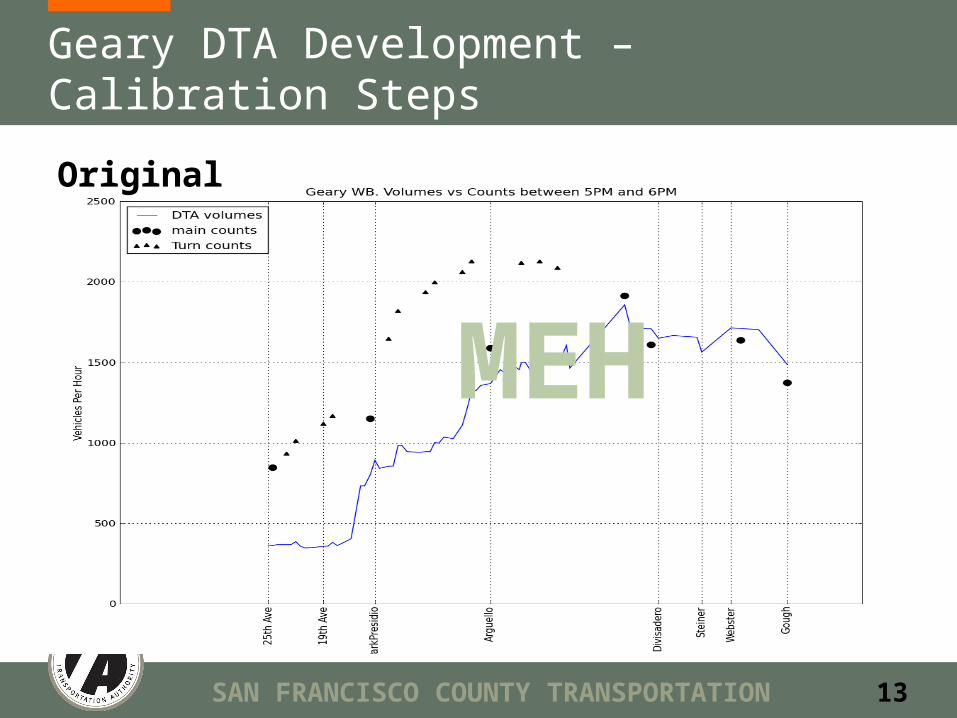
Geary DTA Development – Calibration Steps
MEH
Original
SAN FRANCISCO COUNTY TRANSPORTATION AUTHORITY
14
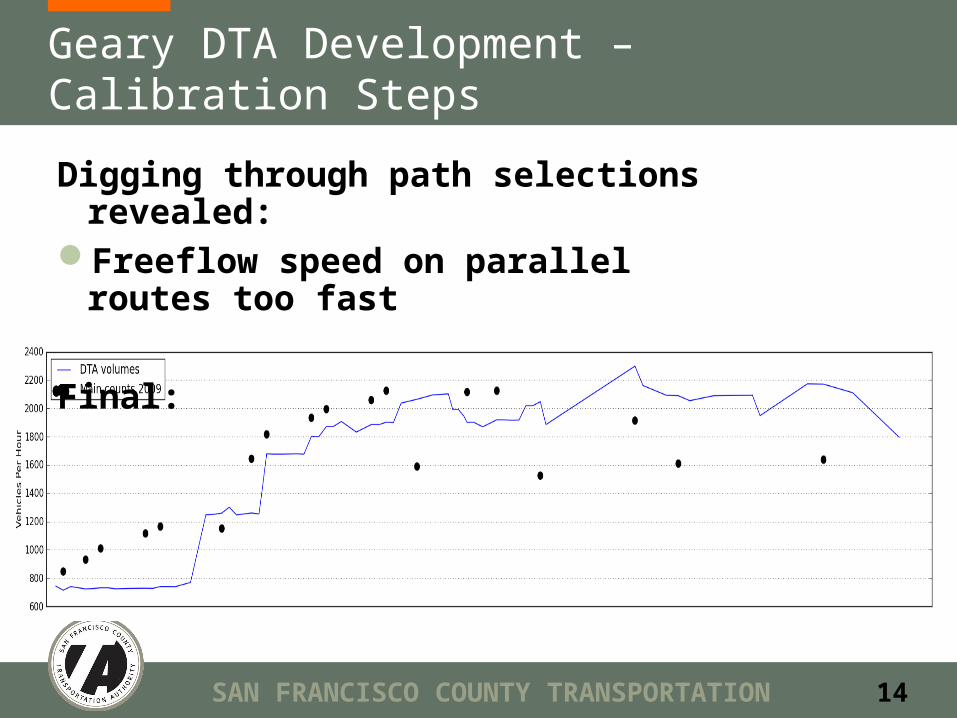
Geary DTA Development – Calibration Steps
Digging through path selections revealed:
Freeflow speed on parallel routes too fast
Final:
SAN FRANCISCO COUNTY TRANSPORTATION AUTHORITY
15
DTA Development - Validation
Targets:Volumes:
High daily volatility: pattern >> actual numbers
Segment speeds: within 2 mph on Geary within 2-4 mph on parallel routes
SAN FRANCISCO COUNTY TRANSPORTATION AUTHORITY
16
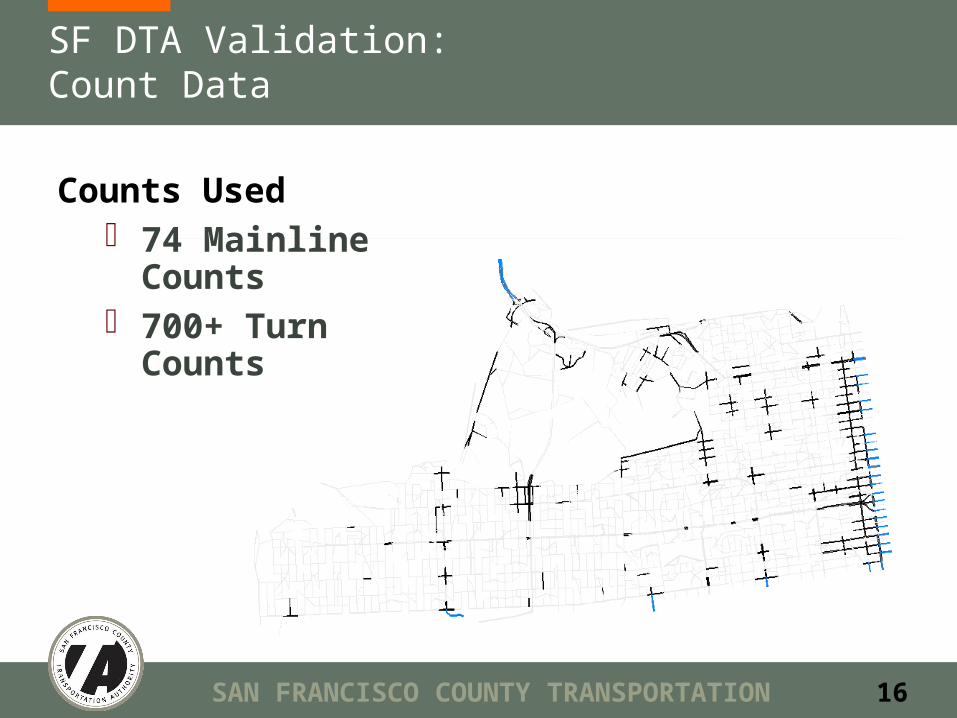
SF DTA Validation:Count Data
Counts Used 74 Mainline
Counts 700+ Turn
Counts
SAN FRANCISCO COUNTY TRANSPORTATION AUTHORITY
17
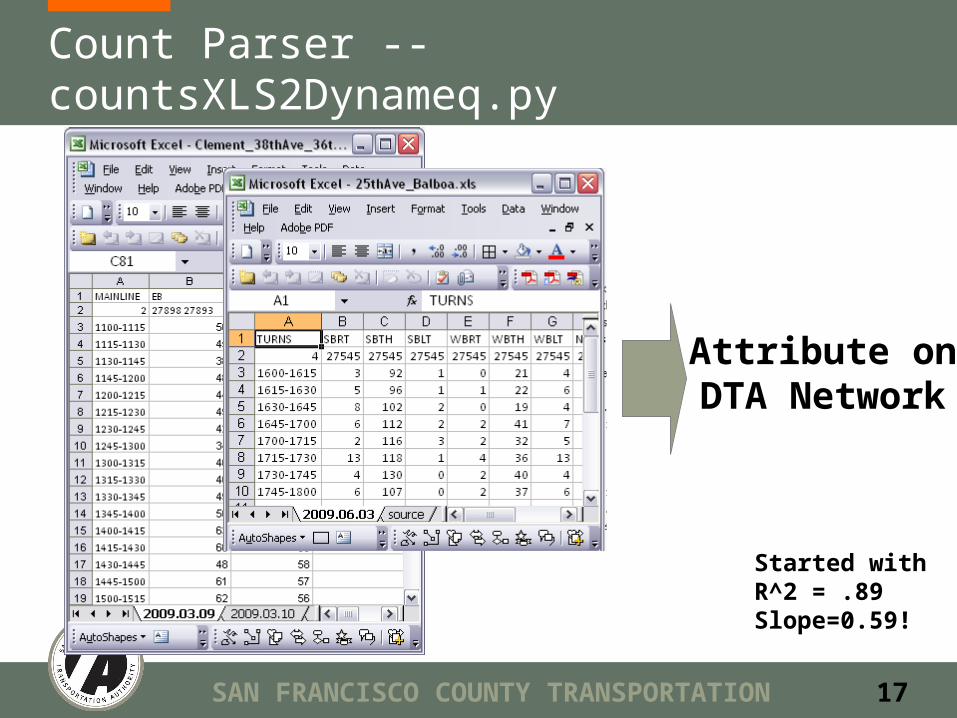
Count Parser -- countsXLS2Dynameq.py
Attribute onDTA Network
Started with R^2 = .89Slope=0.59!
SAN FRANCISCO COUNTY TRANSPORTATION AUTHORITY
18
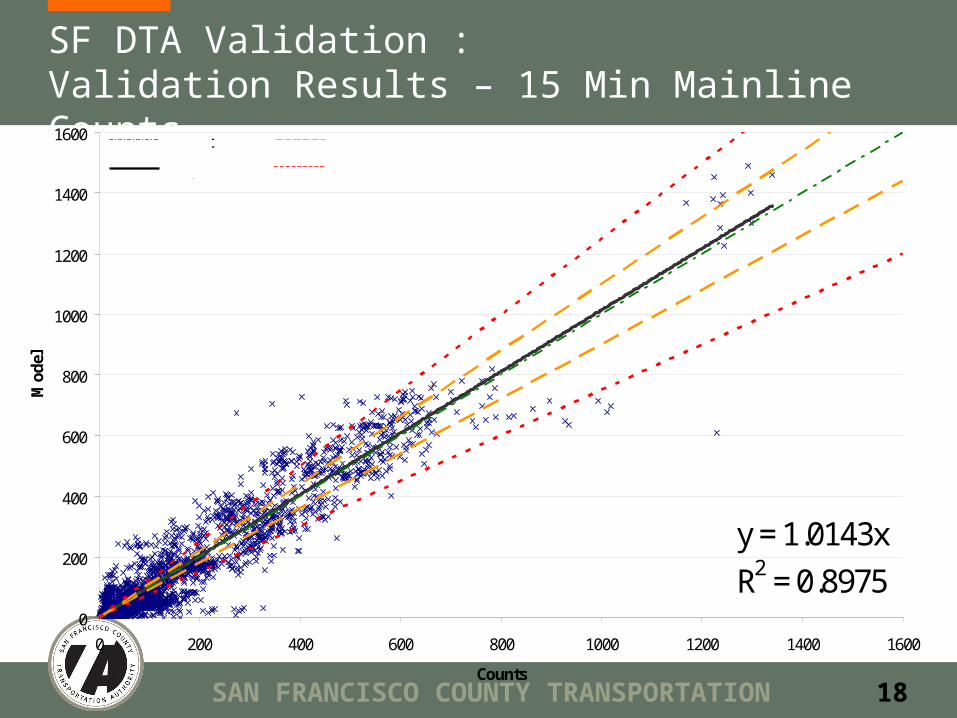
SF DTA Validation : Validation Results – 15 Min Mainline Counts
y = 1.0143xR2 = 0.8975
0
200
400
600
800
1000
1200
1400
1600
0 200 400 600 800 1000 1200 1400 1600
Counts
Mod
el
exact +/- 10%
+/- 25% regression
SAN FRANCISCO COUNTY TRANSPORTATION AUTHORITY
19
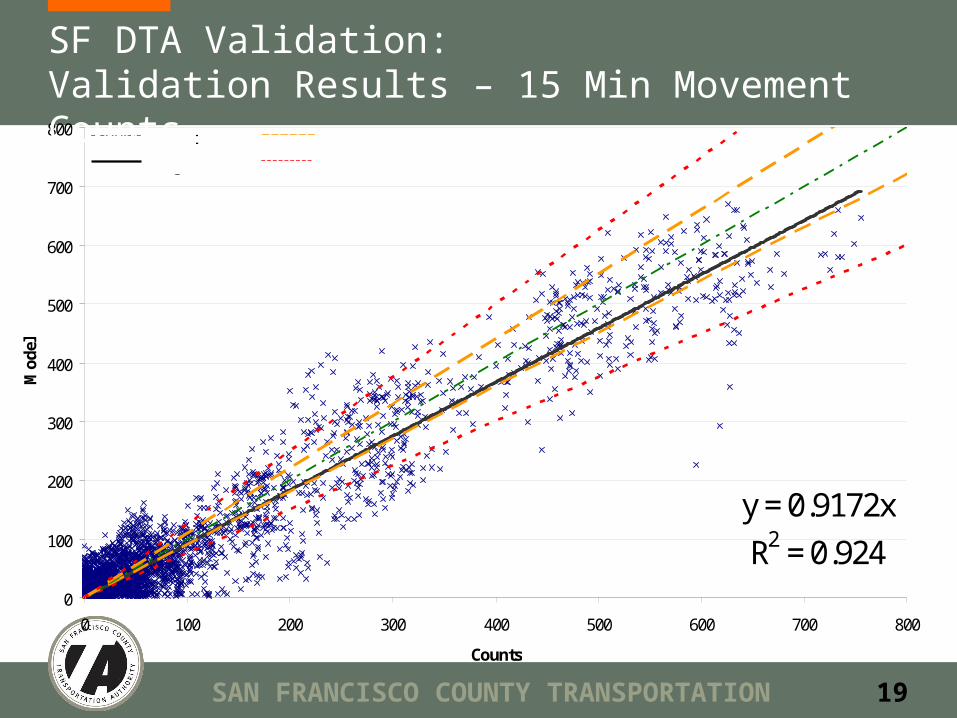
y = 0.9172xR2 = 0.924
0
100
200
300
400
500
600
700
800
0 100 200 300 400 500 600 700 800
Counts
Mod
el
exact +/- 10% +/- 25% regression
SF DTA Validation: Validation Results – 15 Min Movement Counts
SAN FRANCISCO COUNTY TRANSPORTATION AUTHORITY
20
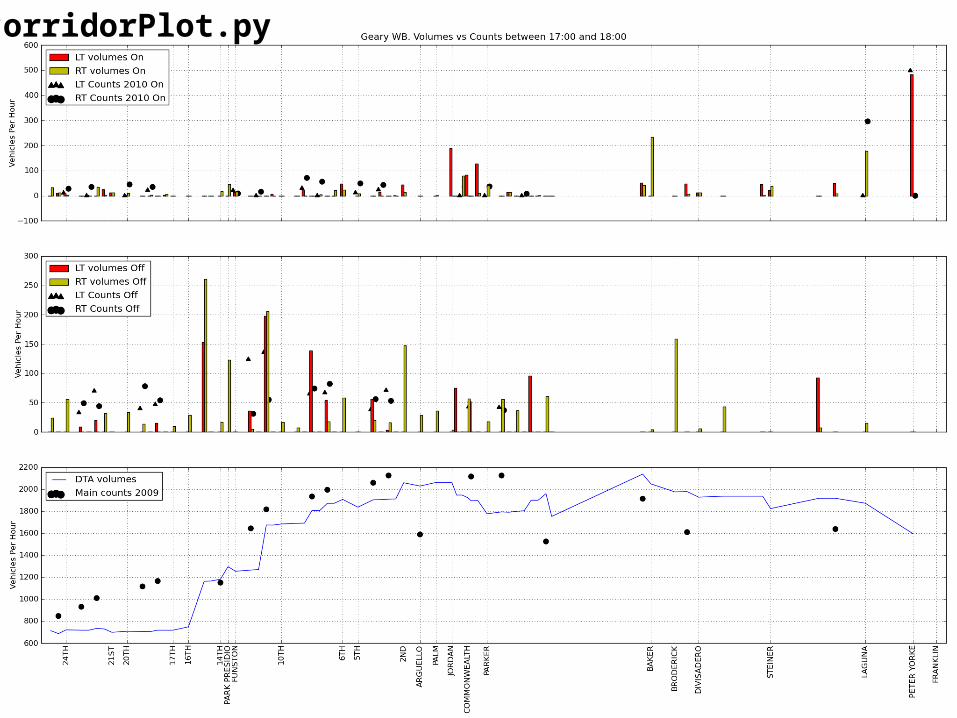
corridorPlot.py
SAN FRANCISCO COUNTY TRANSPORTATION AUTHORITY
21
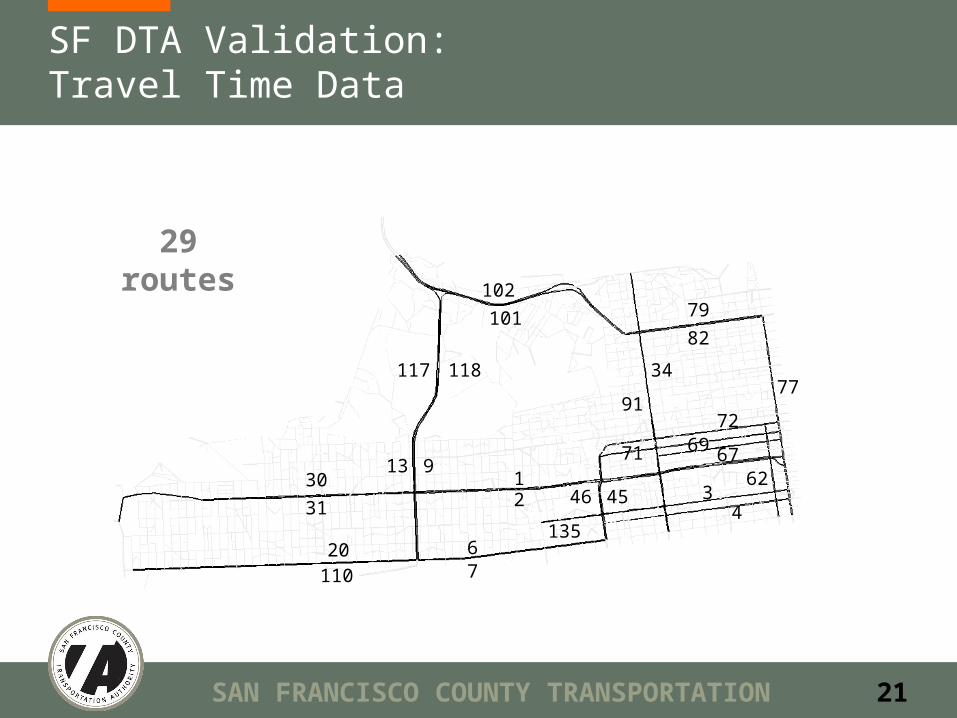
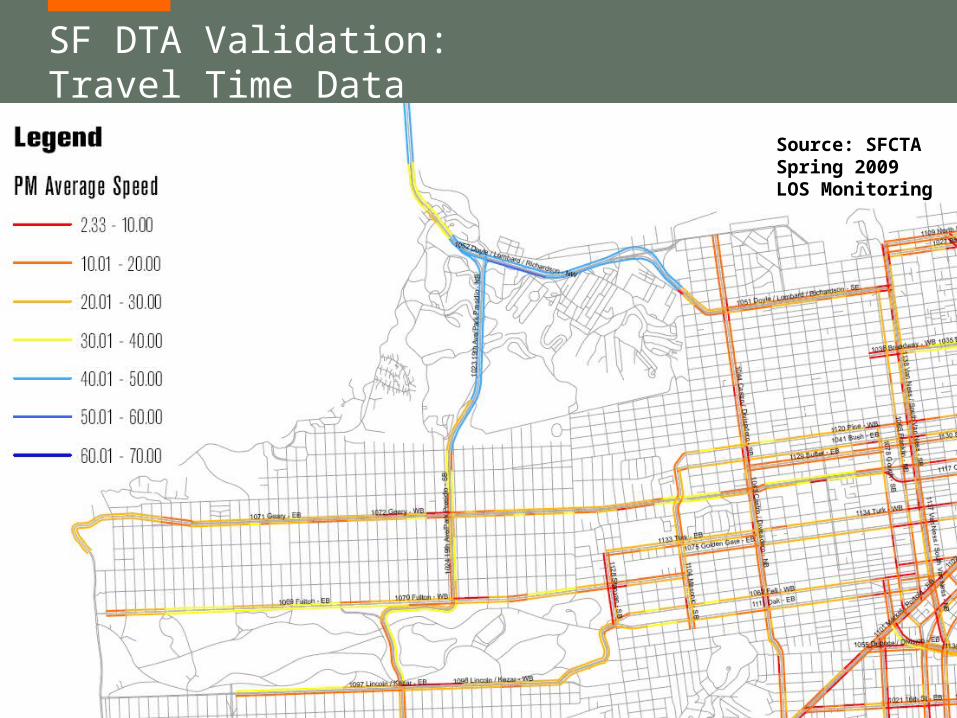
SF DTA Validation:Travel Time Data
29 routes
12 3
4
67
91330
31
20110
45
91
46
6971
72
77
79
82
34
6267
101
102
117 118
135
SAN FRANCISCO COUNTY TRANSPORTATION AUTHORITY
22
SF DTA Validation:Travel Time Data
Source: SFCTA Spring 2009 LOS Monitoring
SAN FRANCISCO COUNTY TRANSPORTATION AUTHORITY
23
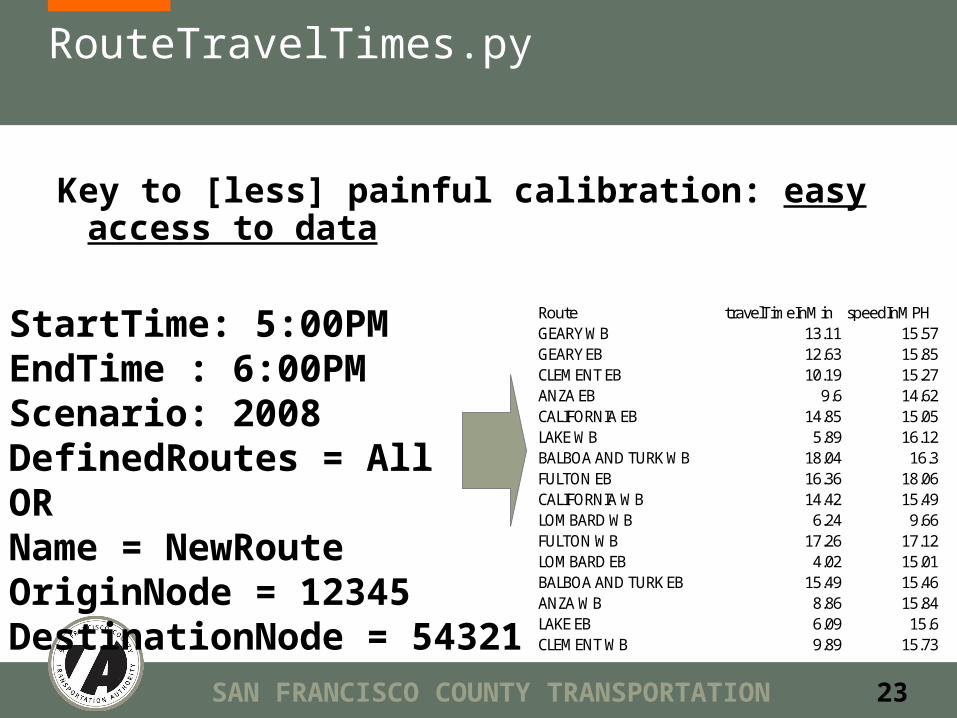
RouteTravelTimes.py
StartTime: 5:00PMEndTime : 6:00PMScenario: 2008DefinedRoutes = AllORName = NewRouteOriginNode = 12345DestinationNode = 54321
Route travelTimeInMin speedInMPHGEARY WB 13.11 15.57GEARY EB 12.63 15.85CLEMENT EB 10.19 15.27ANZA EB 9.6 14.62CALIFORNIA EB 14.85 15.05LAKE WB 5.89 16.12BALBOA AND TURK WB 18.04 16.3FULTON EB 16.36 18.06CALIFORNIA WB 14.42 15.49LOMBARD WB 6.24 9.66FULTON WB 17.26 17.12LOMBARD EB 4.02 15.01BALBOA AND TURK EB 15.49 15.46ANZA WB 8.86 15.84LAKE EB 6.09 15.6CLEMENT WB 9.89 15.73
Key to [less] painful calibration: easy access to data
SAN FRANCISCO COUNTY TRANSPORTATION AUTHORITY
24
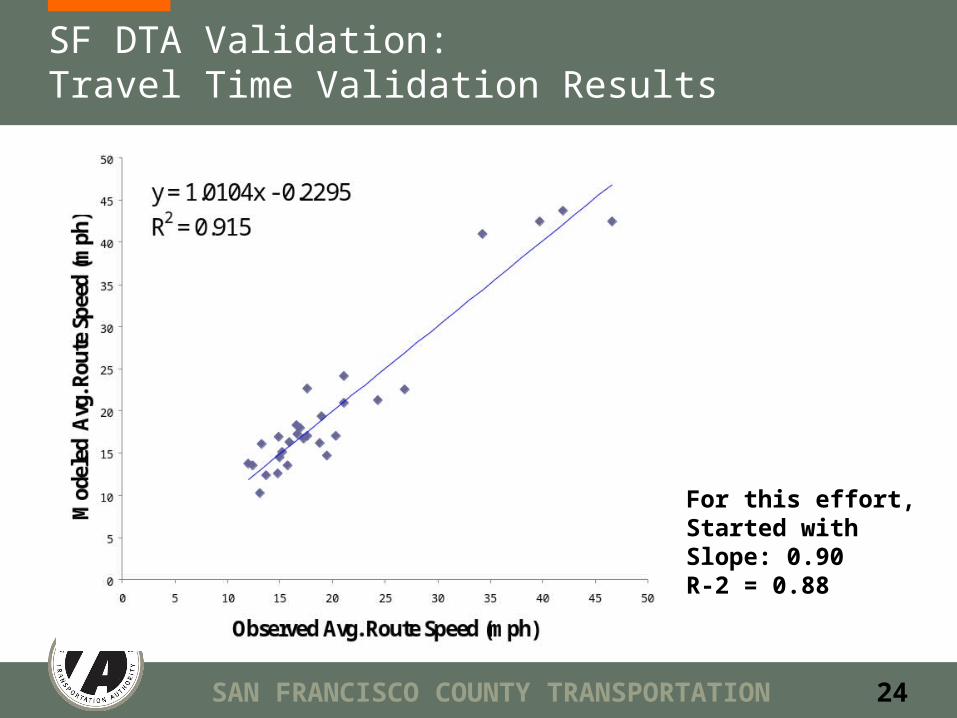
SF DTA Validation:Travel Time Validation Results
For this effort,Started withSlope: 0.90R-2 = 0.88
SAN FRANCISCO COUNTY TRANSPORTATION AUTHORITY
25
35 56 - 47 36 86 75 14 67 39
66 96 57 17 96 95 32 83 6 92
79 93 3 89 4 69 81 58 21 77
40 94 26 13 99 40 42 23 67 39
49 70 18 31 67 4 66 94 77 59
73 100 57 22 27 54 58 50 33 62
3 93 55 40 - 60 89 12 36 74
62 72 46 50 47 81 65 95 9 86
10 18 41 41 18 16 62 10 14 32
98 20 71 85 38 92 14 17 81 49
33 84 75 56 95 83 84 32 100 54
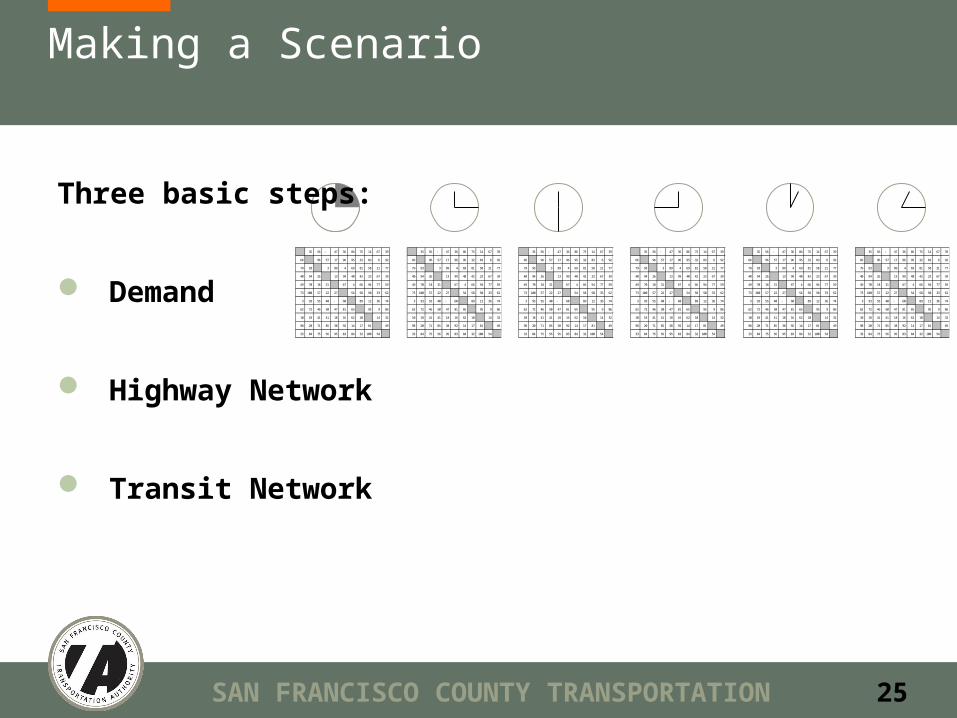
Making a Scenario
Three basic steps:
Demand
Highway Network
Transit Network
35 56 - 47 36 86 75 14 67 39
66 96 57 17 96 95 32 83 6 92
79 93 3 89 4 69 81 58 21 77
40 94 26 13 99 40 42 23 67 39
49 70 18 31 67 4 66 94 77 59
73 100 57 22 27 54 58 50 33 62
3 93 55 40 - 60 89 12 36 74
62 72 46 50 47 81 65 95 9 86
10 18 41 41 18 16 62 10 14 32
98 20 71 85 38 92 14 17 81 49
33 84 75 56 95 83 84 32 100 54
SAN FRANCISCO COUNTY TRANSPORTATION AUTHORITY
26
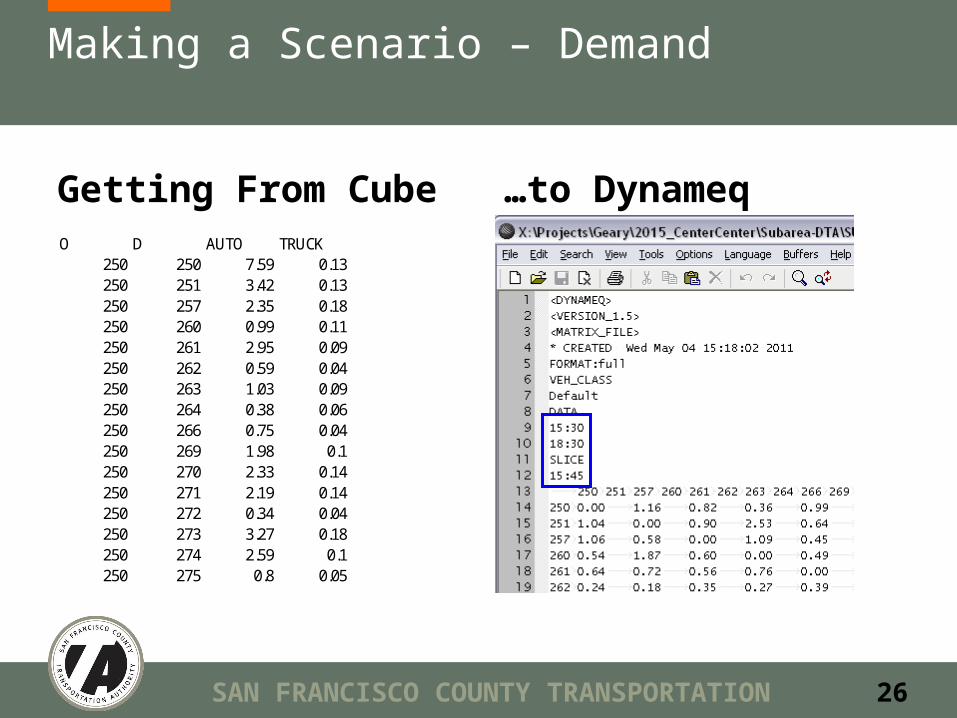
Making a Scenario – Demand
Getting From Cube …to DynameqO D AUTO TRUCK
250 250 7.59 0.13250 251 3.42 0.13250 257 2.35 0.18250 260 0.99 0.11250 261 2.95 0.09250 262 0.59 0.04250 263 1.03 0.09250 264 0.38 0.06250 266 0.75 0.04250 269 1.98 0.1250 270 2.33 0.14250 271 2.19 0.14250 272 0.34 0.04250 273 3.27 0.18250 274 2.59 0.1250 275 0.8 0.05
SAN FRANCISCO COUNTY TRANSPORTATION AUTHORITY
27
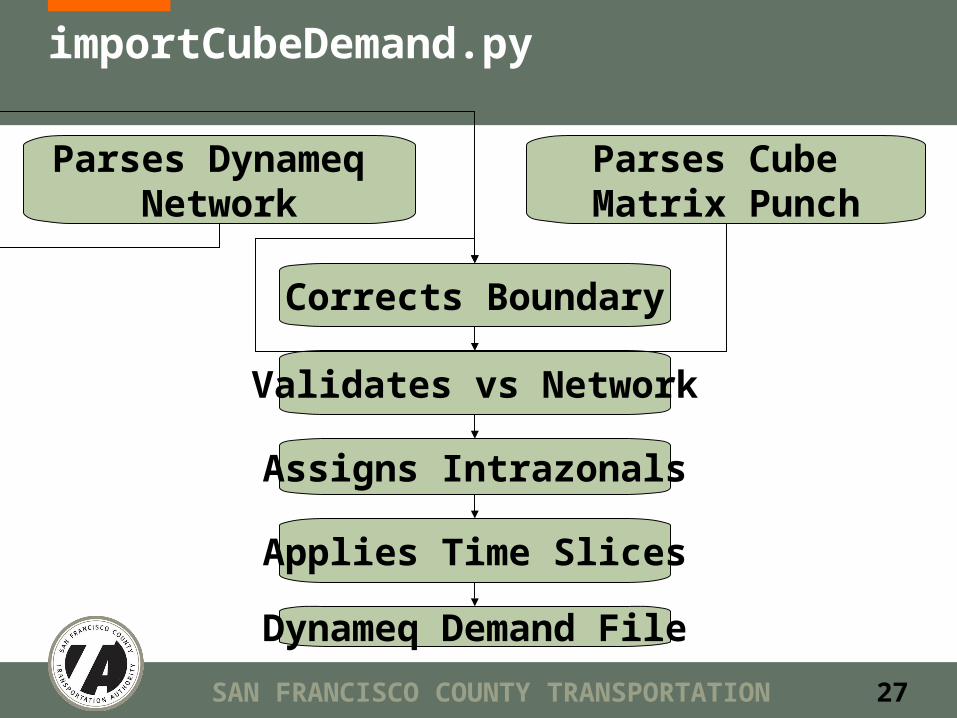
importCubeDemand.py
Parses Dynameq Network
Parses Cube Matrix Punch
Corrects Boundary
Validates vs Network
Assigns Intrazonals
Applies Time Slices
Dynameq Demand File
SAN FRANCISCO COUNTY TRANSPORTATION AUTHORITY
28
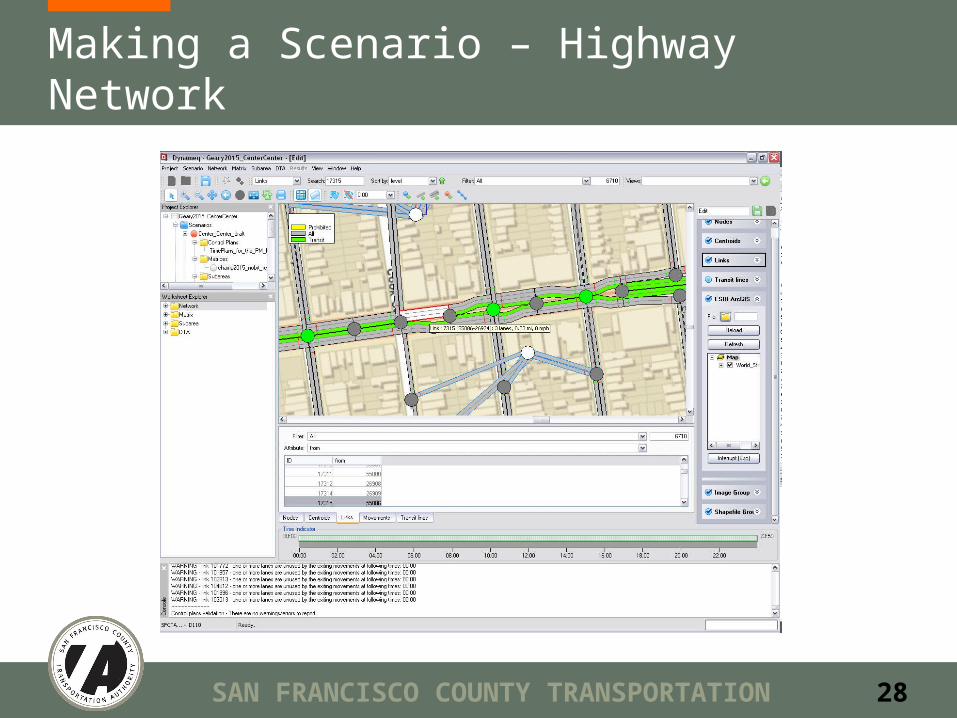
Making a Scenario – Highway Network
SAN FRANCISCO COUNTY TRANSPORTATION AUTHORITY
29
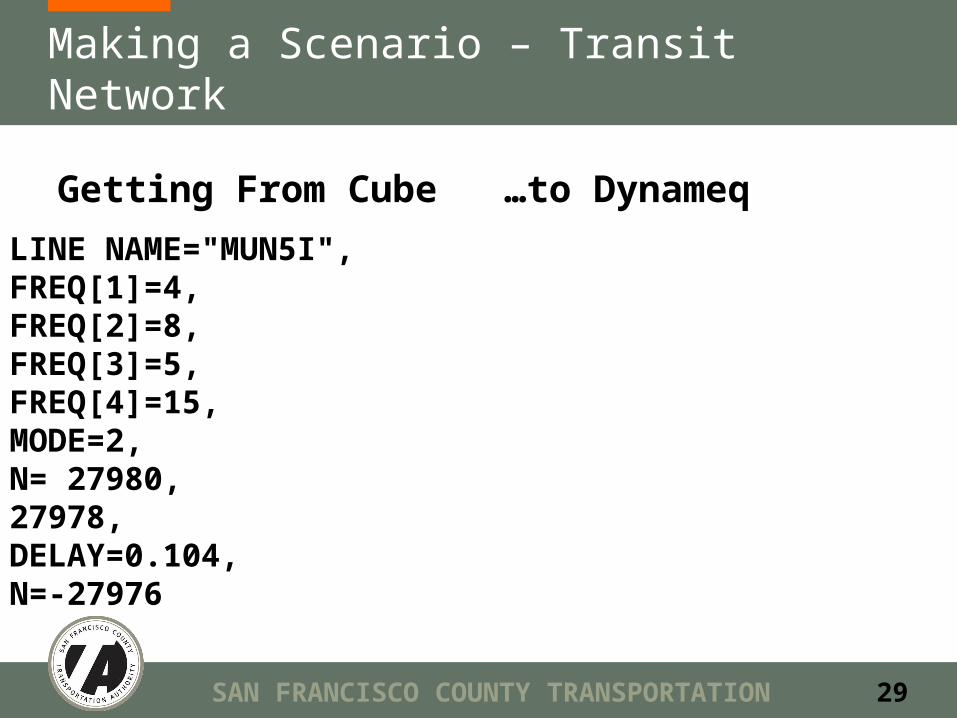
Making a Scenario – Transit Network
LINE NAME="MUN5I",FREQ[1]=4,FREQ[2]=8,FREQ[3]=5,FREQ[4]=15,MODE=2,N= 27980, 27978, DELAY=0.104, N=-27976
Getting From Cube …to Dynameq
SAN FRANCISCO COUNTY TRANSPORTATION AUTHORITY
30
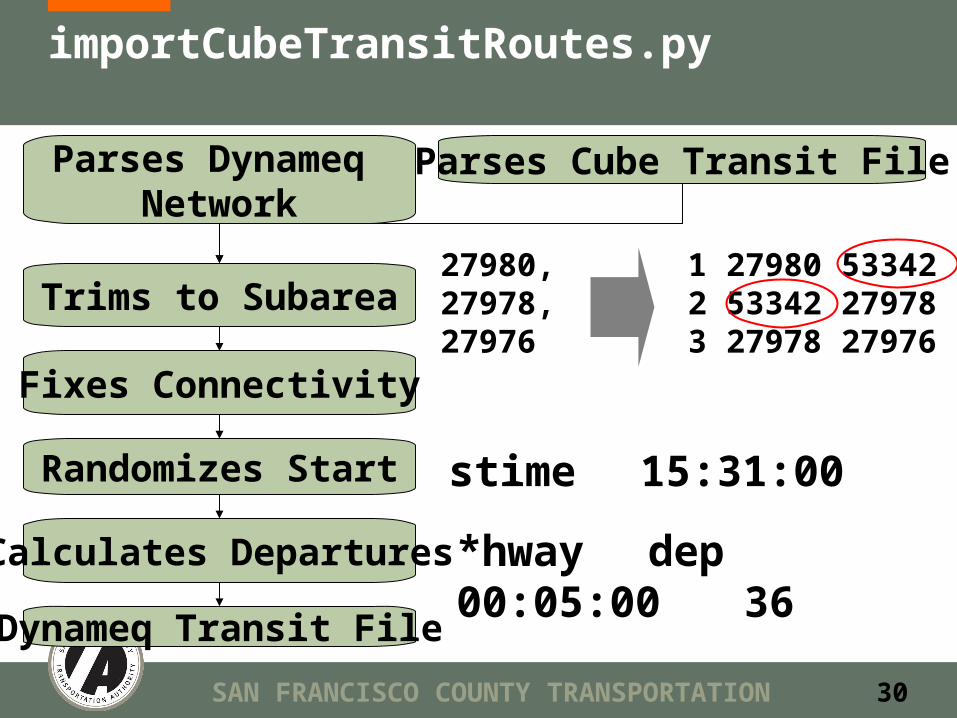
importCubeTransitRoutes.py
Parses Dynameq Network
Parses Cube Transit File
Trims to Subarea
Fixes Connectivity
Randomizes Start
Calculates Departures
Dynameq Transit File
stime 15:31:00
1 27980 53342 2 53342 27978 3 27978 27976
27980, 27978, 27976
*hway dep00:05:00 36
SAN FRANCISCO COUNTY TRANSPORTATION AUTHORITY
31
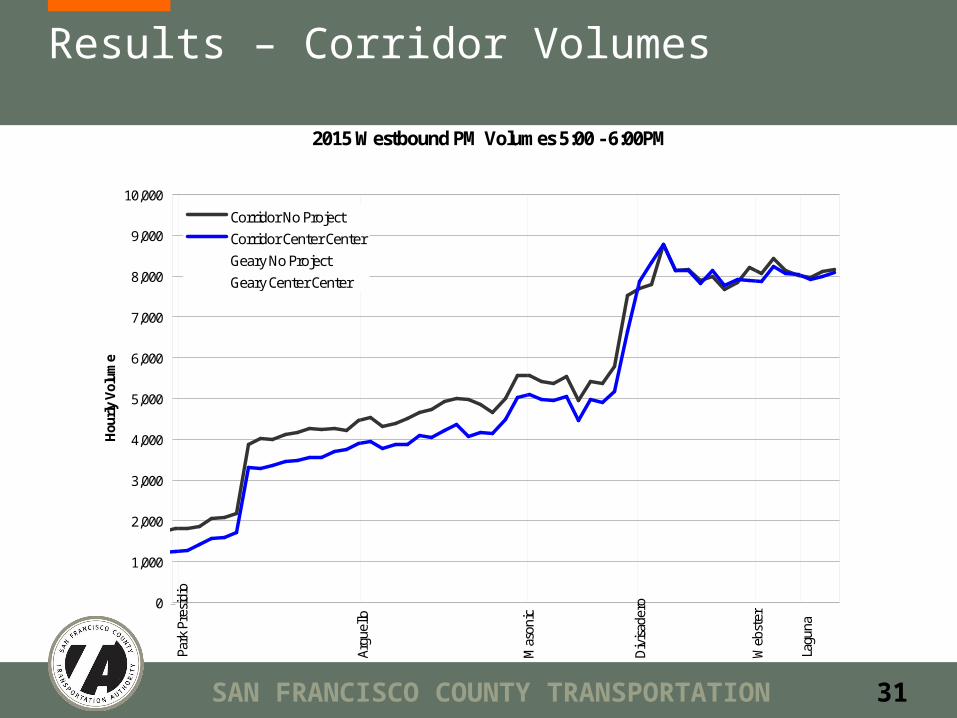
Results – Corridor Volumes
2015 Westbound PM Volumes 5:00 - 6:00PM
Lagu
na
Web
ster
Div
isad
ero
Mas
onic
Argu
ello
Park
Pre
sidi
o
0
1,000
2,000
3,000
4,000
5,000
6,000
7,000
8,000
9,000
10,000
5991700
Hou
rly V
olum
e
Corridor No ProjectCorridor Center CenterGeary No ProjectGeary Center Center
SAN FRANCISCO COUNTY TRANSPORTATION AUTHORITY
32
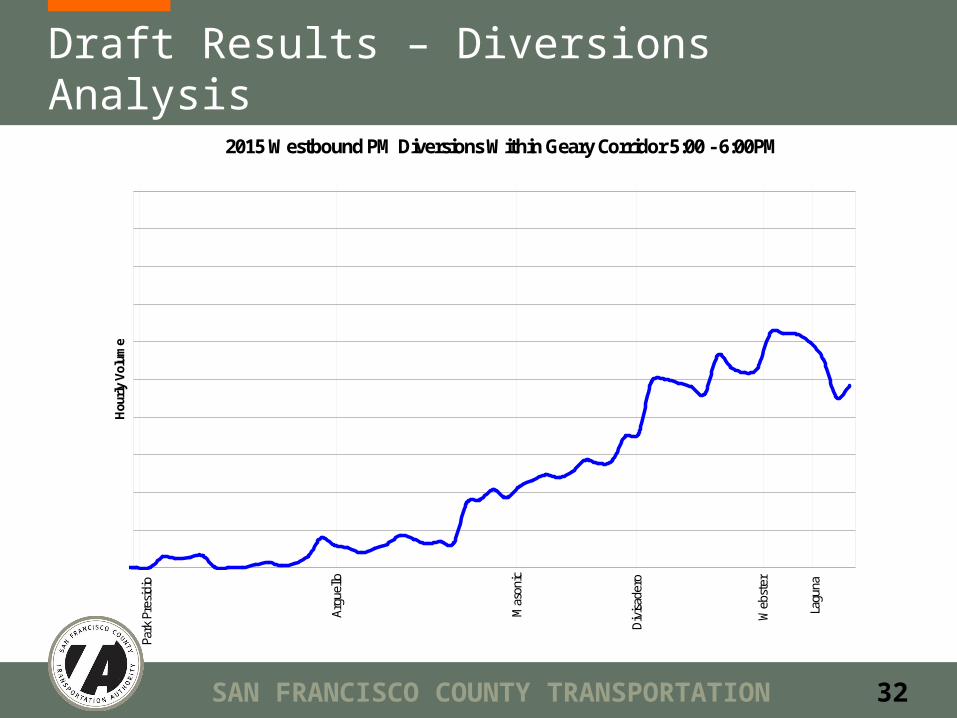
Draft Results – Diversions Analysis
2015 Westbound PM Diversions Within Geary Corridor 5:00 - 6:00PM
Lagu
na
Web
ster
Div
isad
ero
Mas
onic
Argu
ello
Park
Pre
sidi
o
5,991,700
Hou
rly V
olum
e
SAN FRANCISCO COUNTY TRANSPORTATION AUTHORITY
33
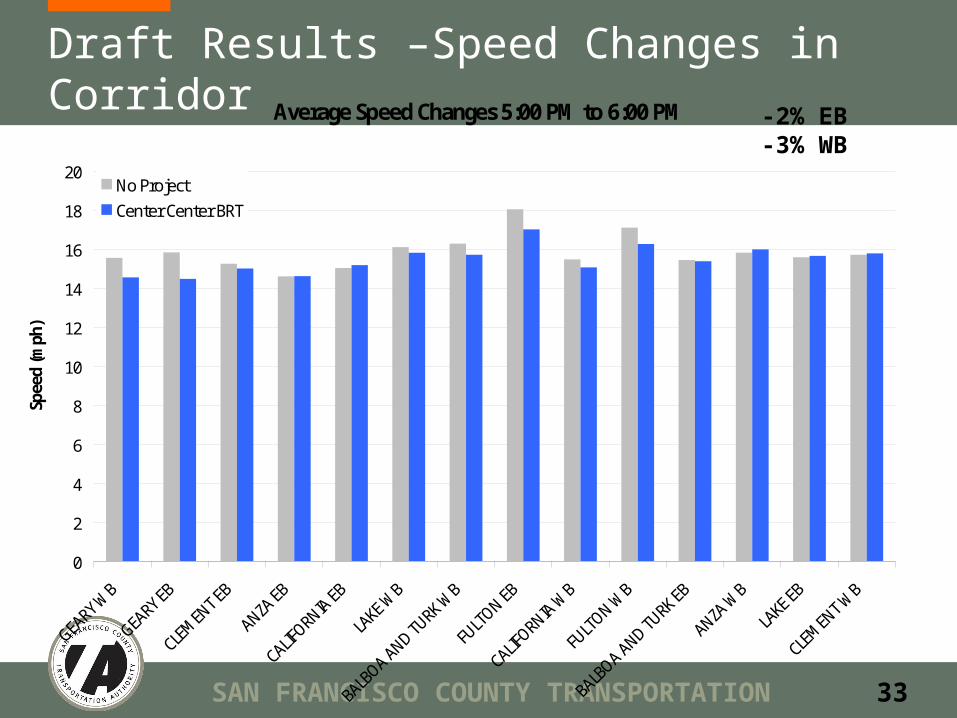
Draft Results –Speed Changes in Corridor Average Speed Changes 5:00 PM to 6:00 PM
0
2
4
6
8
10
12
14
16
18
20
GEARY WB
GEARY EB
CLEMENT EB
ANZA EB
CALIFORNIA EB
LAKE W
B
BALBOA AND TURK W
B
FULT
ON EB
CALIFORNIA W
B
FULT
ON WB
BALBOA AND TURK EB
ANZA W
B
LAKE EB
CLEMENT W
B
Spee
d (m
ph)
No ProjectCenter Center BRT
-2% EB-3% WB
SAN FRANCISCO COUNTY TRANSPORTATION AUTHORITY
34
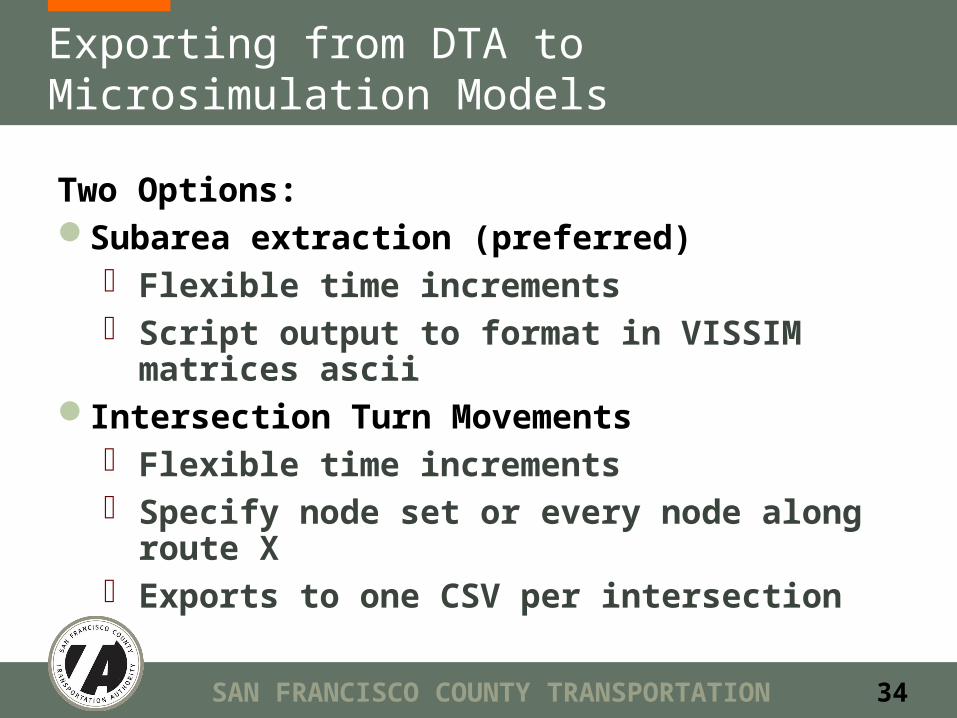
Exporting from DTA to Microsimulation Models
Two Options:Subarea extraction (preferred)
Flexible time increments Script output to format in VISSIM
matrices asciiIntersection Turn Movements
Flexible time increments Specify node set or every node along
route X Exports to one CSV per intersection
SAN FRANCISCO COUNTY TRANSPORTATION AUTHORITY
Questions?
Upcoming dta project website:http://code.google.com/p/dta/
Special Thanks: Zabe Bent, Dave Stanek, Eric Wolmerdorff, David Parisi & Michelle Bina
SAN FRANCISCO COUNTY TRANSPORTATION AUTHORITY
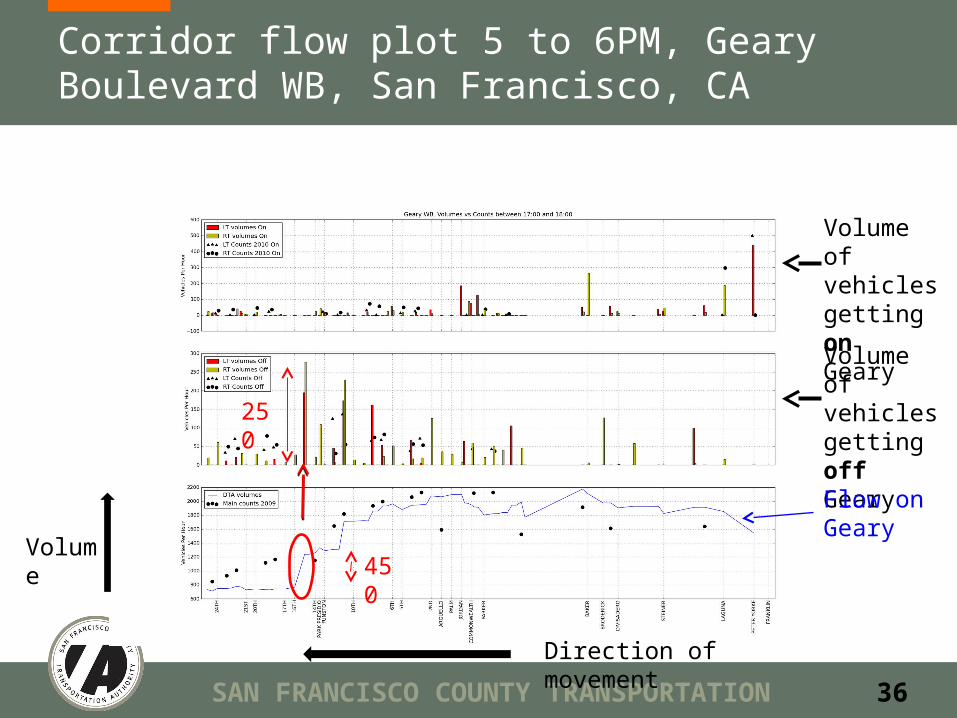
36
Corridor flow plot 5 to 6PM, Geary Boulevard WB, San Francisco, CA
450
250
Direction of movement
Volume of vehicles getting off Geary
Volume of vehicles getting on Geary
Flow on Geary
Volume
SAN FRANCISCO COUNTY TRANSPORTATION AUTHORITY
37
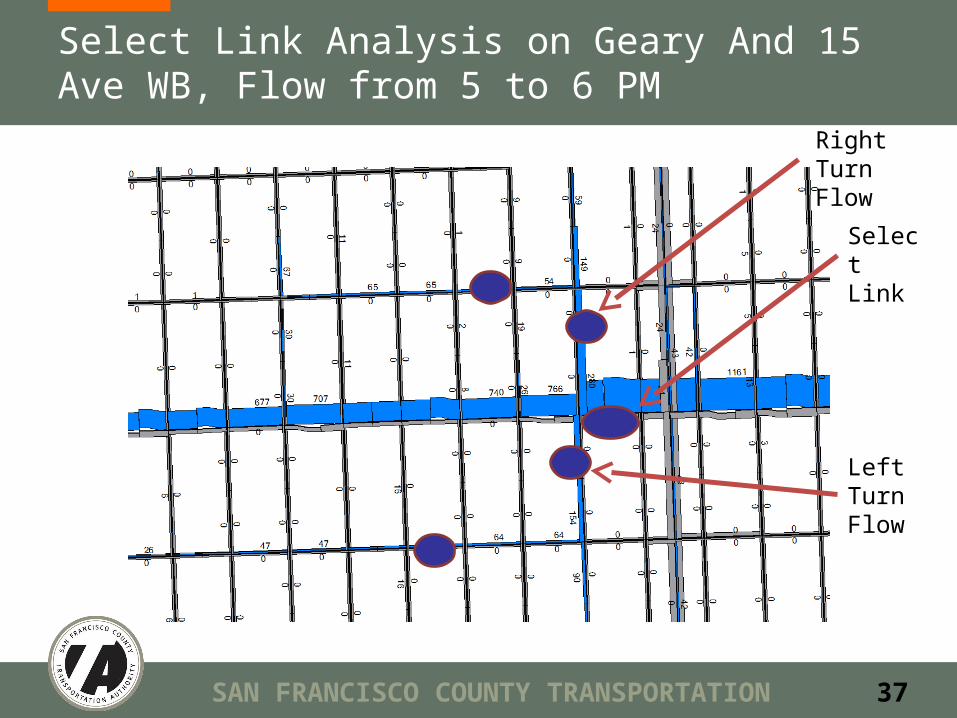
Select Link Analysis on Geary And 15 Ave WB, Flow from 5 to 6 PM
Select Link
Right Turn Flow
Left Turn Flow
SAN FRANCISCO COUNTY TRANSPORTATION AUTHORITY
38
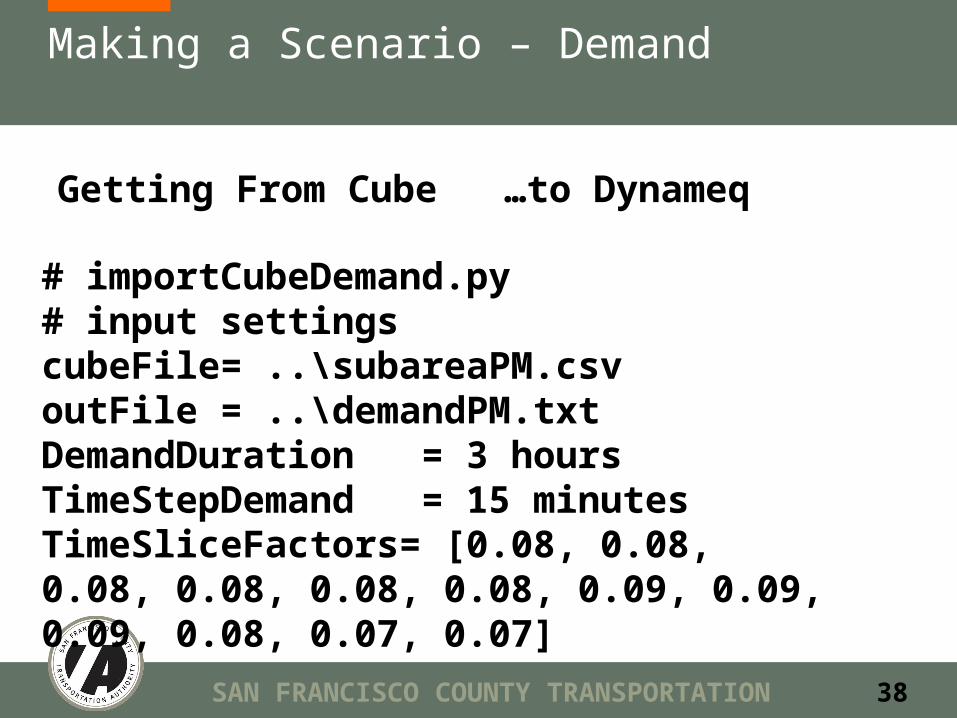
Making a Scenario – Demand
Getting From Cube …to Dynameq
# importCubeDemand.py# input settingscubeFile= ..\subareaPM.csvoutFile = ..\demandPM.txtDemandDuration = 3 hoursTimeStepDemand = 15 minutesTimeSliceFactors= [0.08, 0.08, 0.08, 0.08, 0.08, 0.08, 0.09, 0.09, 0.09, 0.08, 0.07, 0.07]
SAN FRANCISCO COUNTY TRANSPORTATION AUTHORITY
39
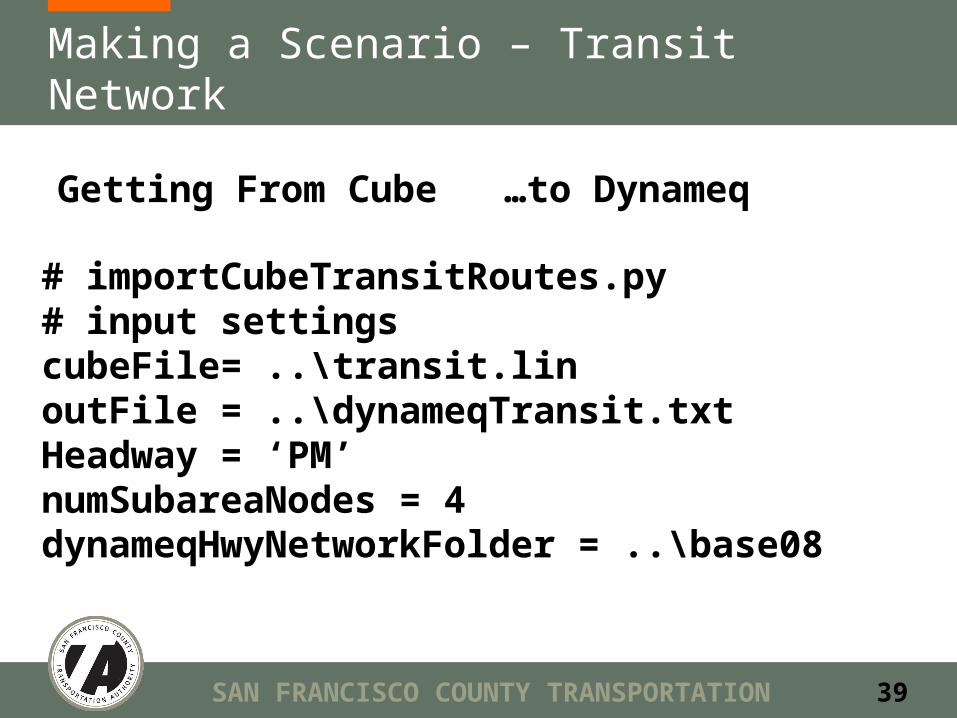
Making a Scenario – Transit Network
Getting From Cube …to Dynameq
# importCubeTransitRoutes.py# input settingscubeFile= ..\transit.linoutFile = ..\dynameqTransit.txtHeadway = ‘PM’numSubareaNodes = 4dynameqHwyNetworkFolder = ..\base08