Embed Size (px)
Citation preview
PERIOD ENDING: DECEMBER 31, 2015
Private Equity Review
San Mateo County Employees’ Retirement Association
VERUSINVESTMENTS.COM
SEATTLE 206‐622‐3700LOS ANGELES 310‐297‐1777
SAN FRANCISCO 415‐362‐3484
Past performance is no guarantee of future results. This document is provided for informational purposes only and is directed to institutional clients and eligible institutional counterparties only and is not intended for retail investors. Nothing herein constitutes investment, legal, accounting or tax advice, or a recommendation to buy, sell or hold a security or pursue a particular investment vehicle or any trading strategy. This document may include or imply estimates, outlooks, projections and other “forward‐looking statements.” No assurance can be given that future results described or implied by any forward looking information will be achieved. Investing entails risks, including possible loss of principal. Verus Advisory Inc. and Verus Investors, LLC (“Verus”) file a single form ADV under the United States Investment Advisors Act of 1940, as amended.
Table of Contents
2
Market Commentary 3
Private Equity Portfolio Overview
5
Private Equity Portfolio Performance
6
Private Equity Portfolio Diversification― PE Portfolio Diversification by Strategy― PE Portfolio Diversification by Geography― PE Portfolio Diversification by Industry― PE Portfolio Diversification by Vintage Year
7
Significant Events / Material Exceptions to Policy
11
Market Commentary
SamCERA 3June 7, 2016
Period Ending: December 31, 2015
Private Equity Market Recap
Buyouts
– Despite moderate volatility in both the U.S. public and debt markets in 2015, entry pricing multiples continued to expand and set new records in U.S. Buyouts at 10.3x EBITDA, a function of persistent capital overhang. Moderately decreasing trend in leverage (58% of the capital structure) has led to improvement in credit ratios (5.6x Debt / EBITDA) and lower risk. These two trends, increasing prices financed by more equity versus debt, points to a downward pressure on future U.S. Buyout returns.
– Relative to the U.S., European Buyout pricing is both more stable and attractive (9.15x EBITDA in Europe versus 10.26x in the U.S. in 2015). However, driven in part by record setting capital raised post‐GFC, European pricing levels have remained consistently high, approximately 2x EBITDA above 2006‐07 levels.
Venture Capital & Growth
– In Venture Capital and Growth, unicorns (privately held companies valued above $1 billion) continue to dominate the news cycles – more recently for some notable markdowns and down‐round valuations, but also for continued increase in value for others.
– On the tails of relatively open exit markets in 2014 (over $100B) and generally increasing portfolio valuations, VCs raised more capital in 2015 (over $80 billion). Innovative companies exhibiting technical and market success notwithstanding, we note that investment risks generally continue through exit and distribution of capital back to LPs.
Asia & Rest of the World
– Buyout funds have attracted increasing amounts of capital in Asia over the last three years, but Growth and Venture Capital funds continue to generally dominate private equity investments outside the U.S. and Europe.
– Market activity and investment dynamics vary widely from region to region and across countries. One notable regional highlight included increased exit activity in Asia for a second year in a row (close to $45 billion in 2015); and a notable lowlight, reduced fundraising activity in Latin America private equity ($76 billion), driven by macro and political dynamics.
June 7, 2016SamCERA 4
Market Commentary
— Nonetheless, capital overhang continues to persist outside the U.S and Europe as well ($160 billion in Asia and over $70B in Latin America and ROW), a function of LP demand for both high returns and diversification of such returns within private equity portfolios.
Secondary & Co‐Investments
– In secondary markets, transaction volume persists at near record levels ($40 billion), with pricing generally in the high‐80s, close to record levels post‐GFC.
– Continued maturing of the asset class has led to increased scrutiny of GPs by regulatory bodies, as well to LPs seeking ways to optimize future returns by reducing fees, both pre‐investment when negotiating terms and post‐investments via co‐investment activities.
Outlook
– Historically over the long‐term, private equity has generated higher returns relative to investments in public markets, with discrete fund commitments exhibiting high dispersion of returns.
– As the asset class matures and becomes more efficient, investors with more durable skills stand to benefit from the potential premium associated with private investments. We believe that these skills include prudence on the part of LPs in constructing portfolios, driven primarily by the selection of disciplined investment managers skilled in improving the operating metrics of privately held companies.
Sources: Preqin (2016 Global PE Report, Co‐Investment Outlook, Secondary Market Update), Pitchbook, Federal Reserve Economic Data, Bloomberg, Multiple Sources, available upon request.
June 7, 2016SamCERA 5
PE Portfolio Overview Period Ending: December 31, 2015
Portfolio Summary
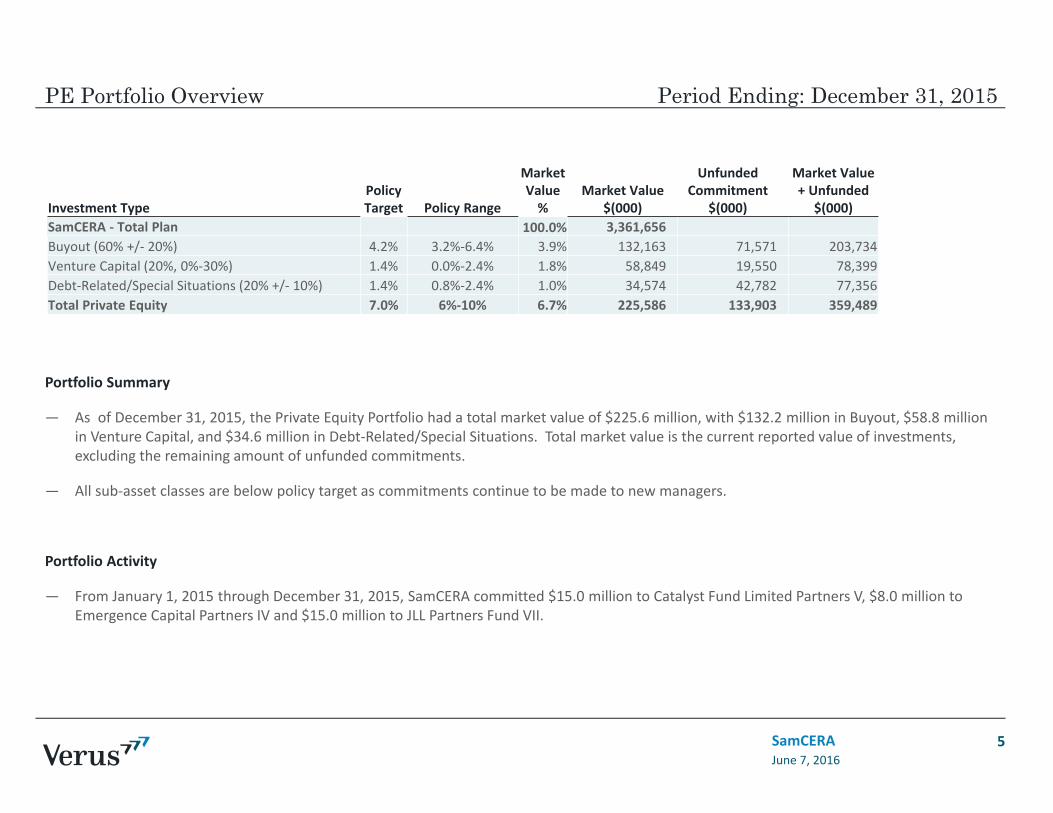
— As of December 31, 2015, the Private Equity Portfolio had a total market value of $225.6 million, with $132.2 million in Buyout, $58.8 million in Venture Capital, and $34.6 million in Debt‐Related/Special Situations. Total market value is the current reported value of investments, excluding the remaining amount of unfunded commitments.
— All sub‐asset classes are below policy target as commitments continue to be made to new managers.
Portfolio Activity
— From January 1, 2015 through December 31, 2015, SamCERA committed $15.0 million to Catalyst Fund Limited Partners V, $8.0 million to Emergence Capital Partners IV and $15.0 million to JLL Partners Fund VII.
Investment TypePolicy Target Policy Range
Market Value %
Market Value $(000)
Unfunded Commitment
$(000)
Market Value + Unfunded
$(000)SamCERA ‐ Total Plan 100.0% 3,361,656Buyout (60% +/‐ 20%) 4.2% 3.2%‐6.4% 3.9% 132,163 71,571 203,734Venture Capital (20%, 0%‐30%) 1.4% 0.0%‐2.4% 1.8% 58,849 19,550 78,399Debt‐Related/Special Situations (20% +/‐ 10%) 1.4% 0.8%‐2.4% 1.0% 34,574 42,782 77,356Total Private Equity 7.0% 6%‐10% 6.7% 225,586 133,903 359,489
PE Performance
June 7, 2016SamCERA 6
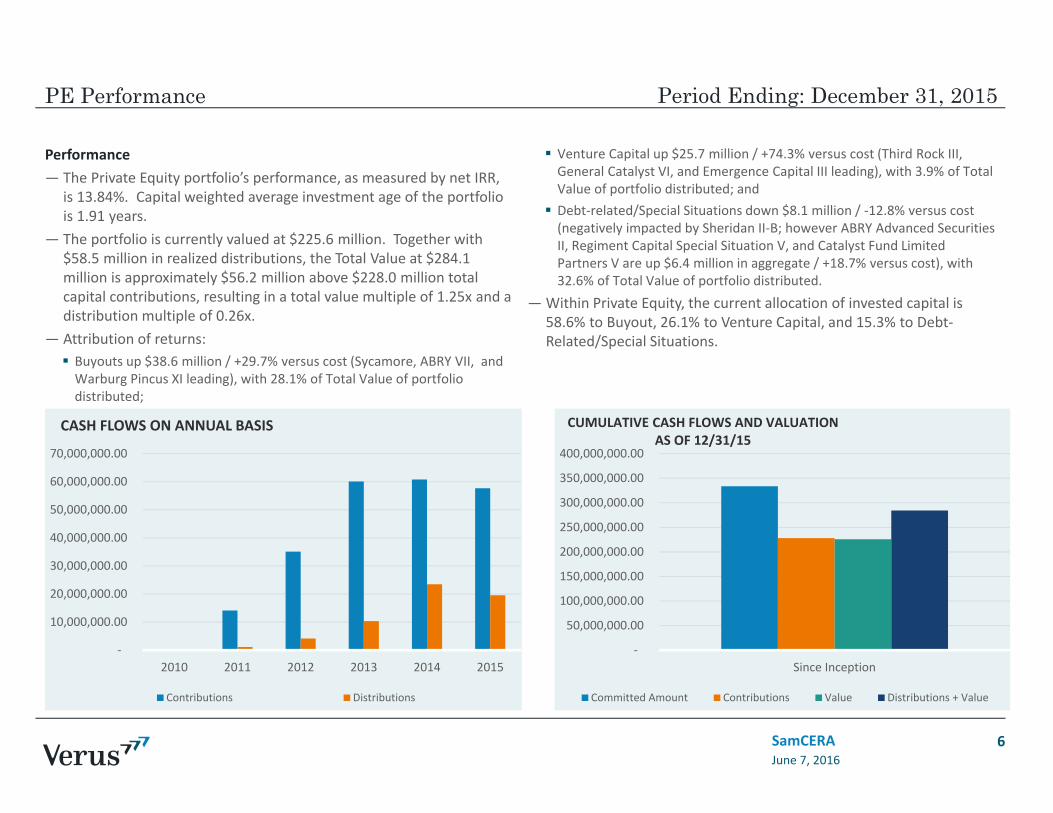
Performance— The Private Equity portfolio’s performance, as measured by net IRR,
is 13.84%. Capital weighted average investment age of the portfolio is 1.91 years.
— The portfolio is currently valued at $225.6 million. Together with $58.5 million in realized distributions, the Total Value at $284.1 million is approximately $56.2 million above $228.0 million total capital contributions, resulting in a total value multiple of 1.25x and a distribution multiple of 0.26x.
— Attribution of returns: Buyouts up $38.6 million / +29.7% versus cost (Sycamore, ABRY VII, and Warburg Pincus XI leading), with 28.1% of Total Value of portfolio distributed;
Venture Capital up $25.7 million / +74.3% versus cost (Third Rock III, General Catalyst VI, and Emergence Capital III leading), with 3.9% of Total Value of portfolio distributed; and Debt‐related/Special Situations down $8.1 million / ‐12.8% versus cost (negatively impacted by Sheridan II‐B; however ABRY Advanced Securities II, Regiment Capital Special Situation V, and Catalyst Fund Limited Partners V are up $6.4 million in aggregate / +18.7% versus cost), with 32.6% of Total Value of portfolio distributed.
— Within Private Equity, the current allocation of invested capital is 58.6% to Buyout, 26.1% to Venture Capital, and 15.3% to Debt‐Related/Special Situations.
Period Ending: December 31, 2015
‐
10,000,000.00
20,000,000.00
30,000,000.00
40,000,000.00
50,000,000.00
60,000,000.00
70,000,000.00
2010 2011 2012 2013 2014 2015
CASH FLOWS ON ANNUAL BASIS
Contributions Distributions
‐
50,000,000.00
100,000,000.00
150,000,000.00
200,000,000.00
250,000,000.00
300,000,000.00
350,000,000.00
400,000,000.00
Since Inception
CUMULATIVE CASH FLOWS AND VALUATIONAS OF 12/31/15
Committed Amount Contributions Value Distributions + Value
Portfolio DiversificationStrategy
June 7, 2016SamCERA 7
Period Ending: December 31, 2015
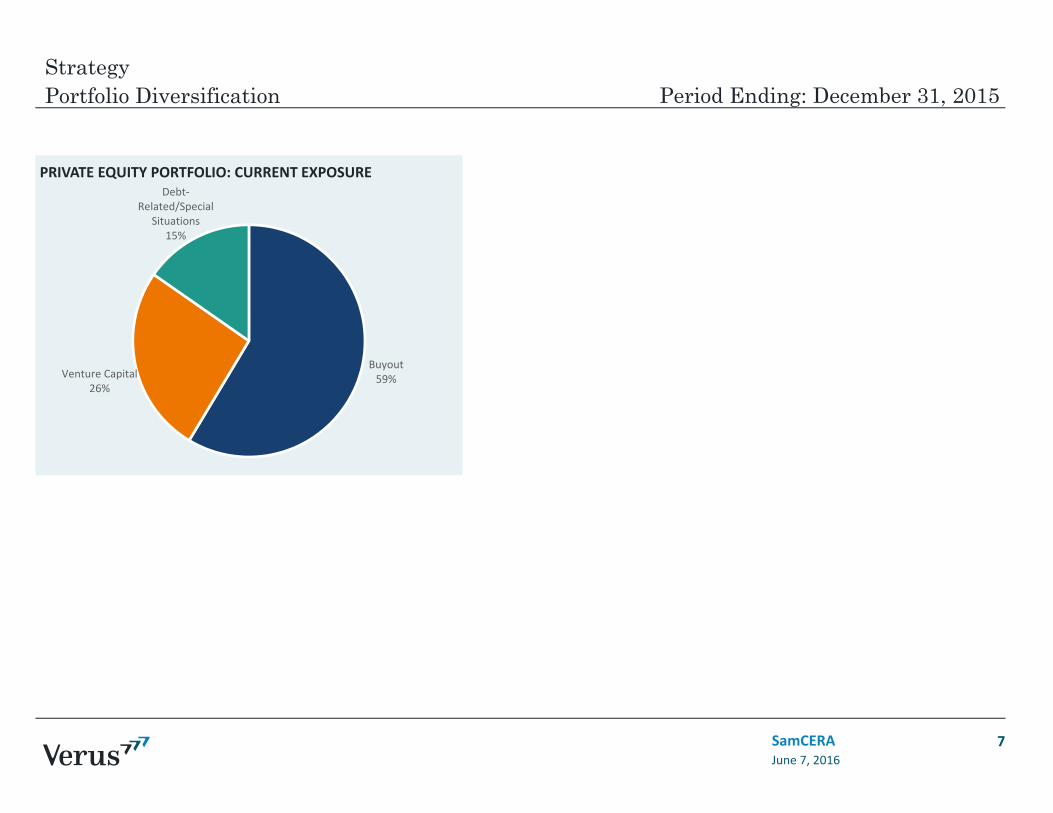
Buyout59%Venture Capital
26%
Debt‐Related/Special
Situations15%
PRIVATE EQUITY PORTFOLIO: CURRENT EXPOSURE
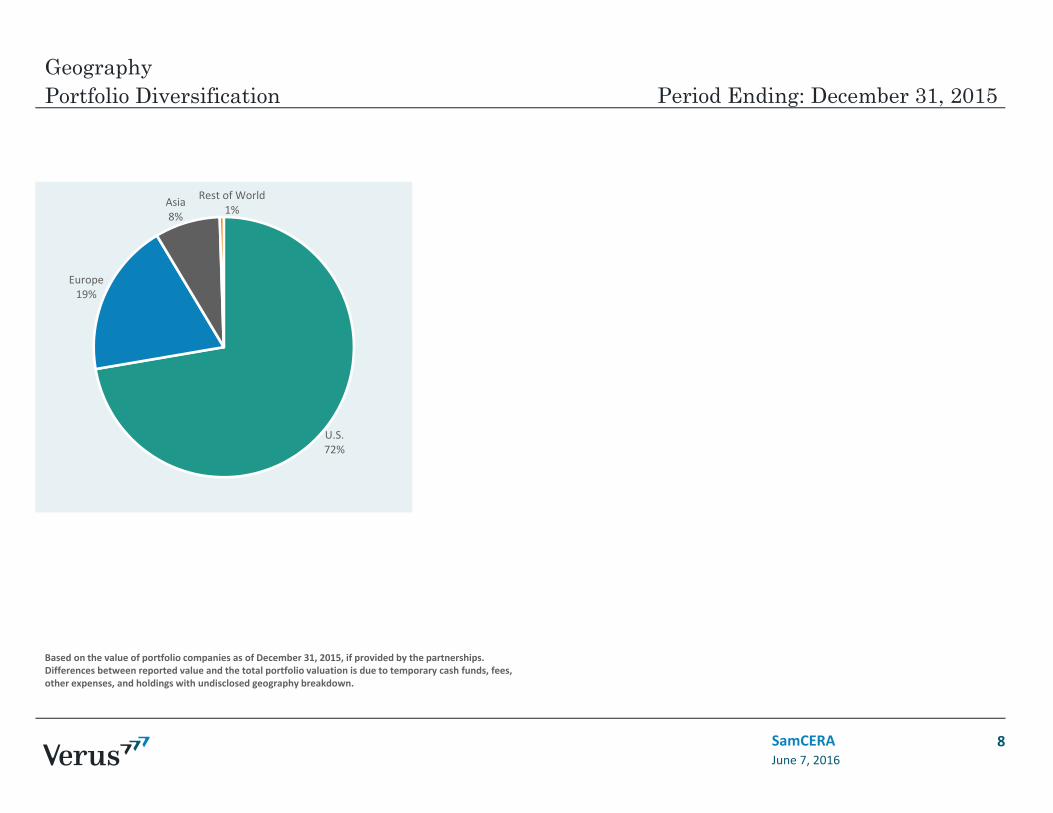
Portfolio DiversificationGeography
June 7, 2016SamCERA 8
Period Ending: December 31, 2015
Based on the value of portfolio companies as of December 31, 2015, if provided by the partnerships. Differences between reported value and the total portfolio valuation is due to temporary cash funds, fees, other expenses, and holdings with undisclosed geography breakdown.
U.S.72%
Europe19%
Asia8%
Rest of World1%
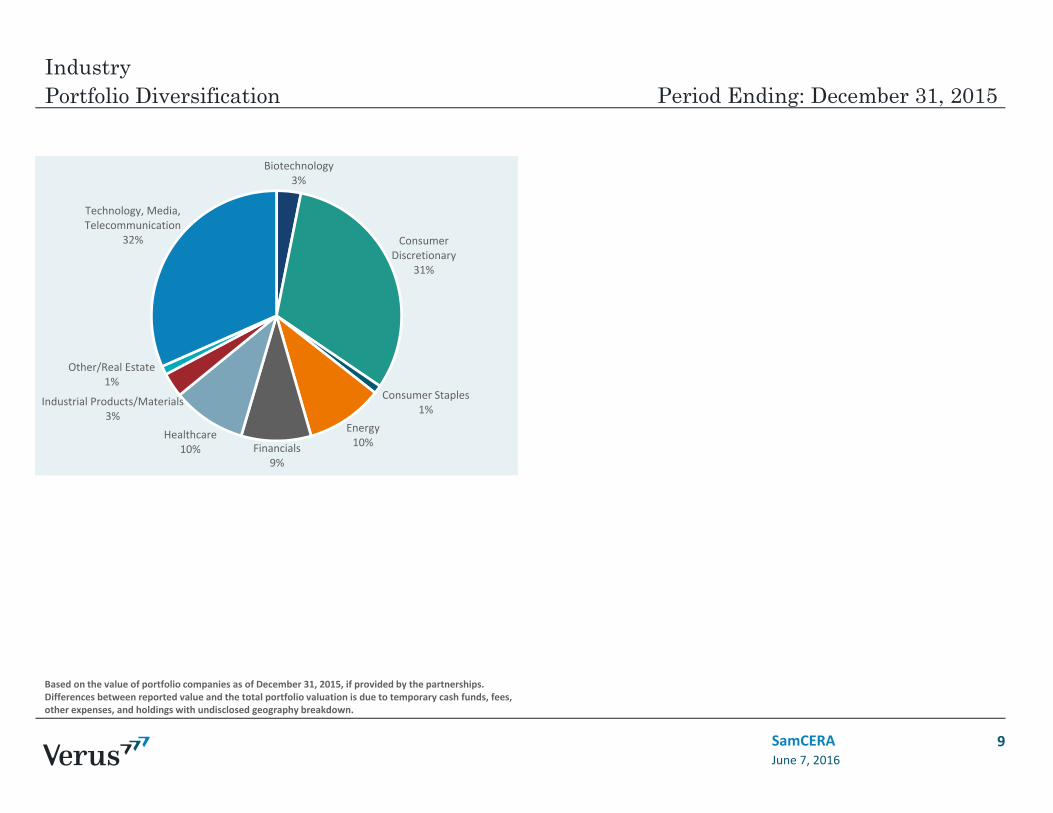
Portfolio DiversificationIndustry
June 7, 2016SamCERA 9
Period Ending: December 31, 2015
Based on the value of portfolio companies as of December 31, 2015, if provided by the partnerships. Differences between reported value and the total portfolio valuation is due to temporary cash funds, fees, other expenses, and holdings with undisclosed geography breakdown.
Biotechnology3%
Consumer Discretionary
31%
Consumer Staples1%
Energy10%Financials
9%
Healthcare10%
Industrial Products/Materials3%
Other/Real Estate1%
Technology, Media, Telecommunication
32%
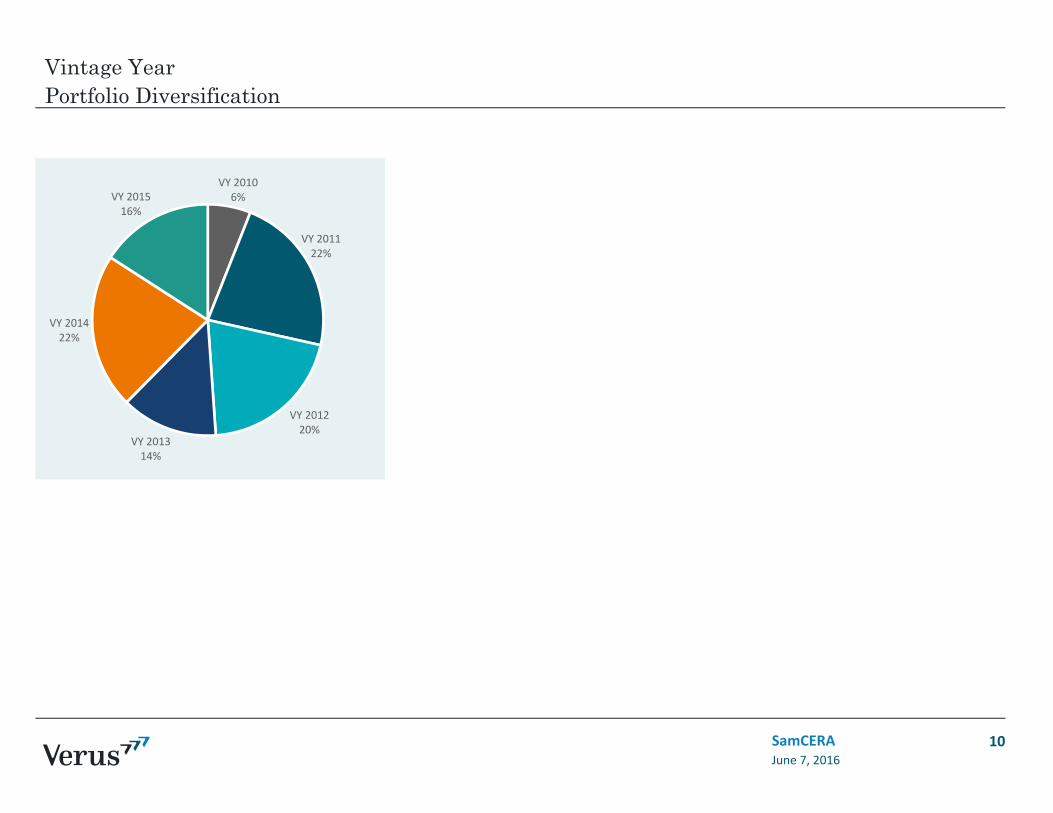
Portfolio DiversificationVintage Year
June 7, 2016SamCERA 10
VY 20106%
VY 201122%
VY 201220%
VY 201314%
VY 201422%
VY 201516%