Embed Size (px)
Citation preview
Michigan Department of Natural Resources
www.michigan.gov/dnr
SANDHILL CRANE STATUS IN MICHIGAN Barbara Avers, Ben Luukkonen, Kelsey Fisher
Michigan Department of Natural Resources Wildlife Division Report No. 3631
February 6, 2017
Wildlife Division
1
TABLE OF CONTENTS Introduction ........................................................................................................................................................ 1
Abundance and Distribution ............................................................................................................................... 2
USFWS Fall Sandhill Crane Survey ............................................................................................................... 2
Michigan Breeding Waterfowl Survey ............................................................................................................. 2
North American Breeding Bird Survey ............................................................................................................ 2
Michigan Breeding Bird Atlas ......................................................................................................................... 2
Phyllis Haehnle Memorial Audubon Sanctuary Counts ................................................................................... 3
Agricultural Damage Permits .......................................................................................................................... 3
Acknowledgements ........................................................................................................................................... 3
Literature Cited .................................................................................................................................................. 4
Table 1. ............................................................................................................................................................. 5
Table 2. ............................................................................................................................................................. 5
Figure 1. ............................................................................................................................................................ 6
Figure 2. ............................................................................................................................................................ 7
Figure 3. ............................................................................................................................................................ 7
Figure 4. ............................................................................................................................................................ 8
Figure 5. ............................................................................................................................................................ 9
Figure 6. .......................................................................................................................................................... 10
Figure 7. .......................................................................................................................................................... 10
Figure 8. .......................................................................................................................................................... 11
1
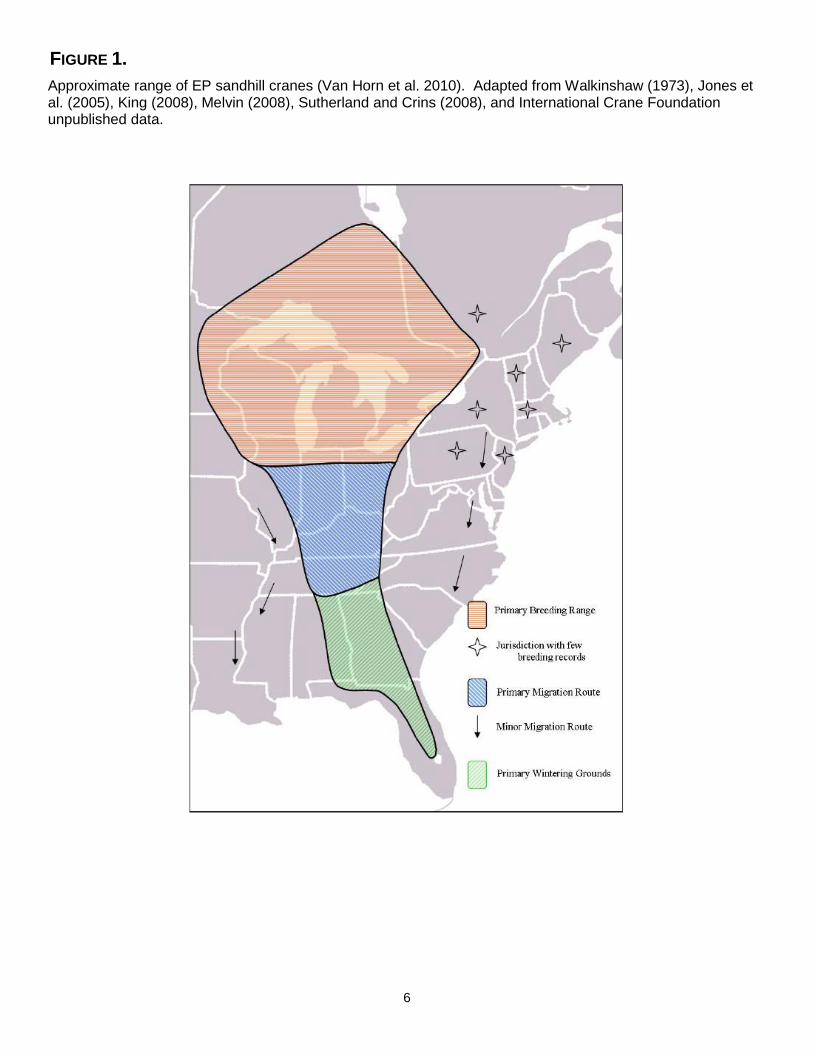
INTRODUCTION There are six subspecies of North American sandhill cranes: the lesser (Grus canadensis canadensis), greater (G. c. tabida), and Canadian (G. c. rowani) sandhill cranes are migratory, and the Mississippi (G. c. pulla), Florida (G. c. pratensis), and Cuban (G. c. nesiotes) sandhill cranes do not migrate (Van Horn et al. 2010). Greater sandhill cranes are divided into five geographic populations: Prairie, Rocky Mountain, Eastern, Colorado River Valley and Central Valley (Meine and Archibald 1996). The Eastern Population (EP) of sandhill cranes range extends from the southern parts of Ontario to central Florida (Figure 1). The primary EP breeding range extends across the Great Lakes region and includes Michigan, Wisconsin, Minnesota, and Ontario (Dubovsky 2016). Recent trends show expansion in all directions of the EP breeding range (Van Horn et al. 2010). Sandhill cranes prefer to nest in wetlands in an open landscape of grasslands and wetlands. Nests are typically built in wetlands over water and are built with surrounding vegetation (Tacha et al. 1992). Migrating EP cranes arrive in southern Michigan in early March from their wintering locations and nesting typically begins in late March in the southern Lower Peninsula but can extend into June (Hoffman 2011). Sandhill cranes are long lived (20+ years) and breed when they are about four to seven years old and lay clutches of two eggs. However, it is rare for fledging of more than one young. Young can typically fly at 67-75 days (Tacha et al. 1992). Recorded annual survival of sandhill cranes has ranged from 0.86-0.95 (Tacha et al. 1992, Drewien et al. 1995). EP sandhill cranes begin staging in late summer and early fall in preparation for fall migration. Historically, EP sandhill cranes wintered in southern Georgia and throughout Florida (Dubovsky 2016). Recent data collected from the annual Midwinter Waterfowl Survey indicated an increase in the number of sandhill cranes wintering further north than the historic range, with some wintering as far north as Kentucky and Tennessee (Dubovsky 2016) and southern Ontario on Lake Erie (Van Horn et al. 2010). Fronczak (2014) placed GPS transmitters on sandhill cranes and found wintering areas farther north than thought. He also discovered that cranes nesting in the Upper Peninsula and north-central Ontario migrated down the west side of Lake Michigan to and from staging areas in Indiana. The shift of wintering ranges may be due to the mild winters of recent years, which would allow more sandhill cranes to remain further north for the winter months (Van Horn et al. 2010). EP crane numbers have rebounded since the late 1800’s when sandhill cranes were thought to be extirpated from the region and have shown substantial population growth over the past 30-40 years (Van Horn et al. 2010, Dubovsky 2016). Several surveys and indices exist to monitor EP sandhill crane numbers, as well as numbers of sandhill cranes in Michigan. EP cranes are primarily monitored through the U.S. Fish and Wildlife Service’s (USFWS) Fall Sandhill Crane Survey, which includes several staging areas in Michigan. In addition, Michigan cranes have been counted during the Michigan Breeding Waterfowl Survey, the North American Breeding Bird Survey, the Michigan Breeding Bird Atlas, and a count at a bird sanctuary in southern Michigan. These indices are discussed below. Van Horn et al. (2010) recognize three primary social considerations related to sandhill cranes in the Mississippi and Atlantic Flyways: the desire for crane viewing opportunities, agricultural damage associated with cranes, and the potential for regulated crane hunting. Increasing sandhill crane numbers have resulted in increased human-crane conflicts, especially damage to agricultural crops by cranes (Van Horn et al. 2010). The Central Flyway has regulated hunting of mid-continent population sandhill cranes since 1961. In 2010, the Mississippi Flyway and Atlantic Flyway Councils endorsed the Management Plan for the EP of Sandhill Cranes which includes a harvest strategy with guidelines for harvest of EP cranes provided the 3-year average fall survey estimate is above 30,000 cranes, and provides for coordination of harvest among Mississippi and Atlantic Flyway states and provinces to ensure sustainable, science-based harvest (Van Horn et al. 2010). Since the management plan’s endorsement, two states have initiated EP sandhill crane hunting seasons; Kentucky in 2011 and Tennessee in 2013 (Dubovsky 2016).
2
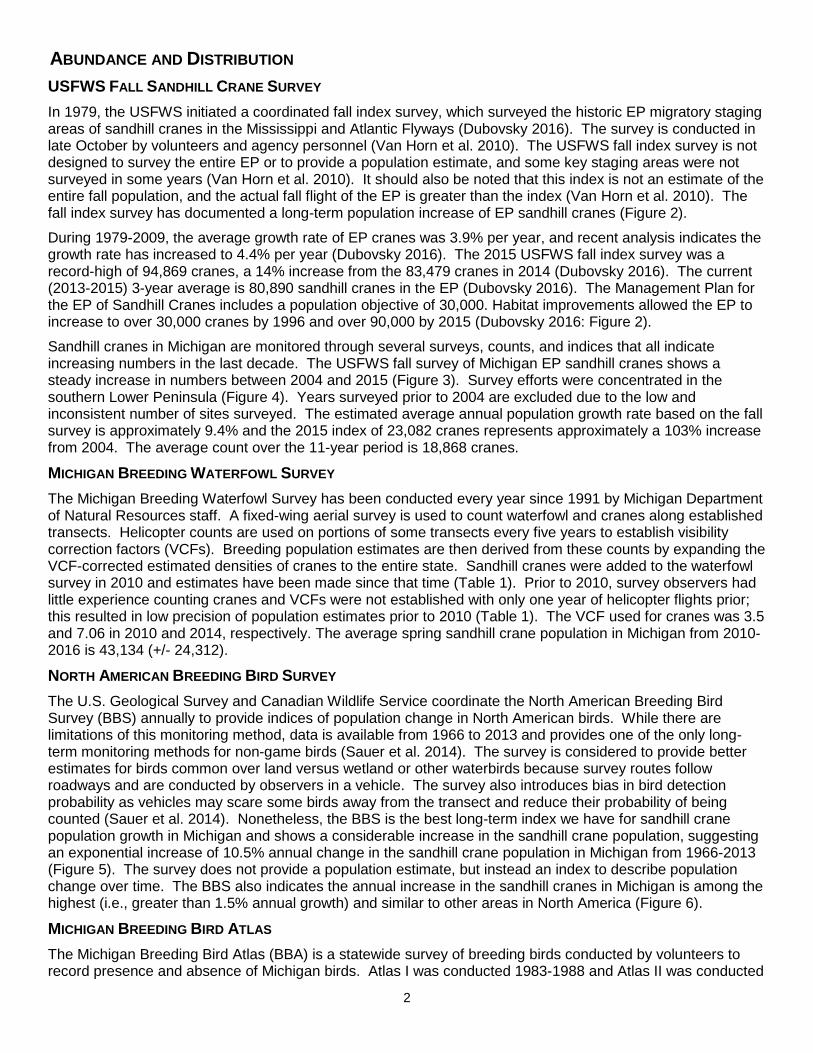
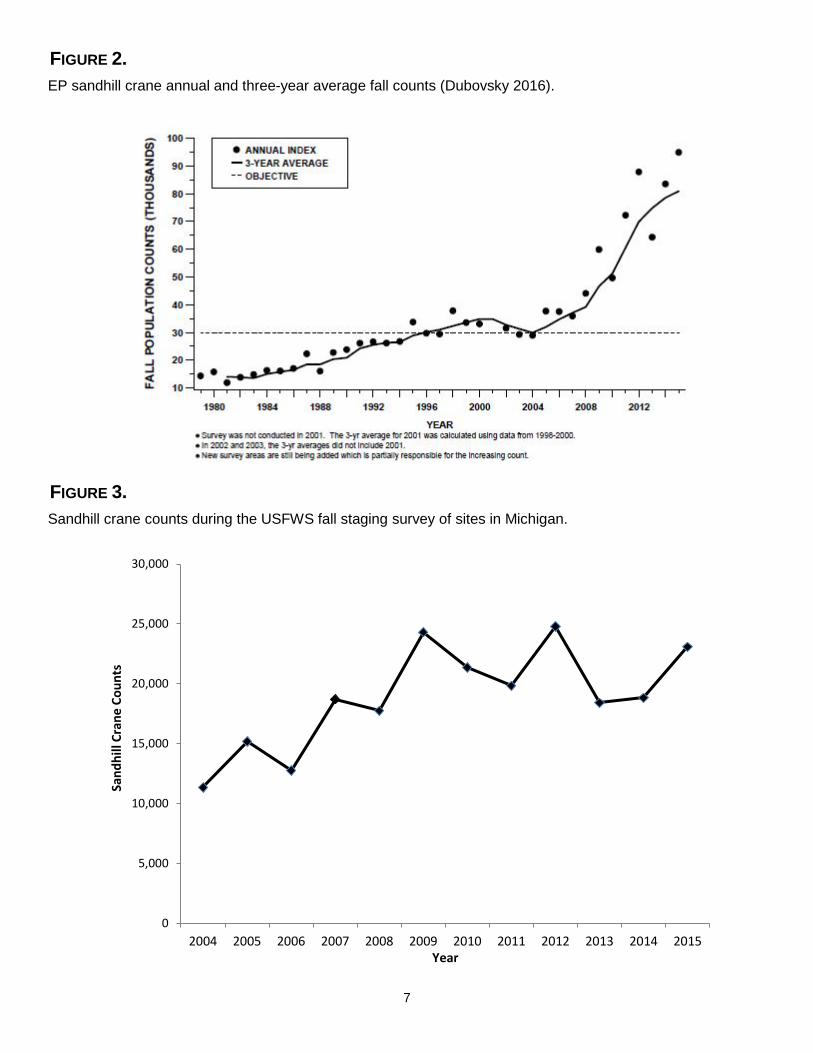
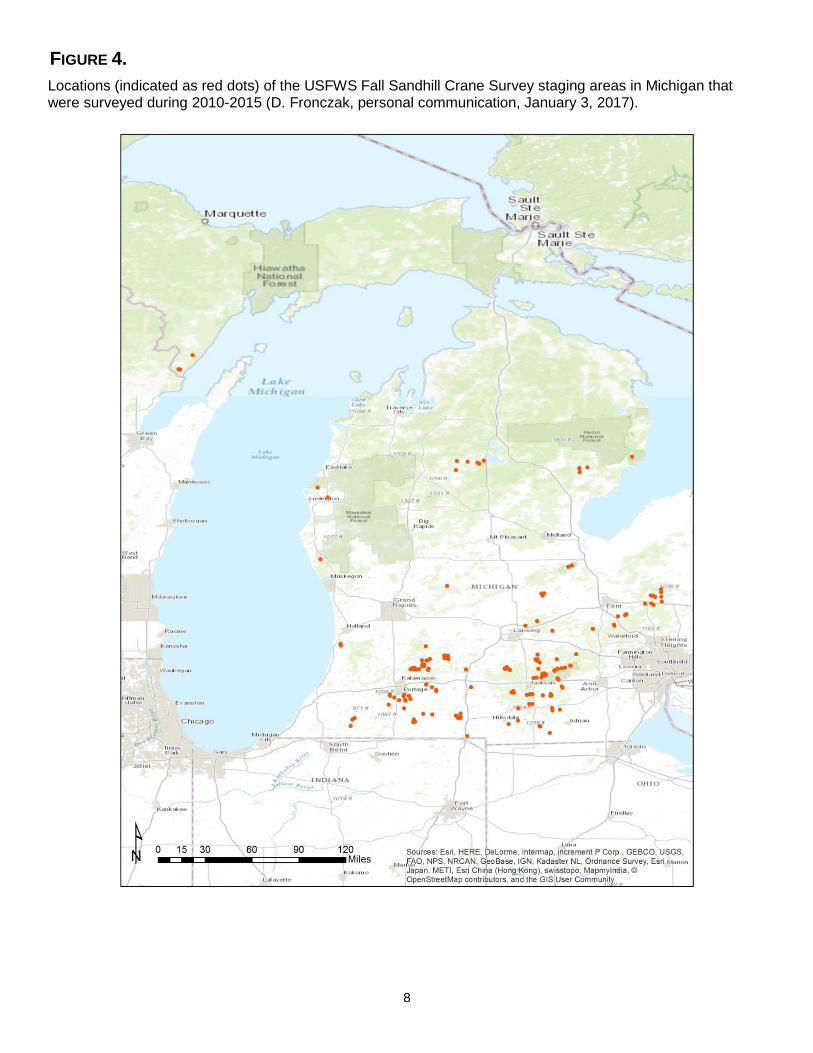
ABUNDANCE AND DISTRIBUTION USFWS FALL SANDHILL CRANE SURVEY In 1979, the USFWS initiated a coordinated fall index survey, which surveyed the historic EP migratory staging areas of sandhill cranes in the Mississippi and Atlantic Flyways (Dubovsky 2016). The survey is conducted in late October by volunteers and agency personnel (Van Horn et al. 2010). The USFWS fall index survey is not designed to survey the entire EP or to provide a population estimate, and some key staging areas were not surveyed in some years (Van Horn et al. 2010). It should also be noted that this index is not an estimate of the entire fall population, and the actual fall flight of the EP is greater than the index (Van Horn et al. 2010). The fall index survey has documented a long-term population increase of EP sandhill cranes (Figure 2). During 1979-2009, the average growth rate of EP cranes was 3.9% per year, and recent analysis indicates the growth rate has increased to 4.4% per year (Dubovsky 2016). The 2015 USFWS fall index survey was a record-high of 94,869 cranes, a 14% increase from the 83,479 cranes in 2014 (Dubovsky 2016). The current (2013-2015) 3-year average is 80,890 sandhill cranes in the EP (Dubovsky 2016). The Management Plan for the EP of Sandhill Cranes includes a population objective of 30,000. Habitat improvements allowed the EP to increase to over 30,000 cranes by 1996 and over 90,000 by 2015 (Dubovsky 2016: Figure 2). Sandhill cranes in Michigan are monitored through several surveys, counts, and indices that all indicate increasing numbers in the last decade. The USFWS fall survey of Michigan EP sandhill cranes shows a steady increase in numbers between 2004 and 2015 (Figure 3). Survey efforts were concentrated in the southern Lower Peninsula (Figure 4). Years surveyed prior to 2004 are excluded due to the low and inconsistent number of sites surveyed. The estimated average annual population growth rate based on the fall survey is approximately 9.4% and the 2015 index of 23,082 cranes represents approximately a 103% increase from 2004. The average count over the 11-year period is 18,868 cranes.
MICHIGAN BREEDING WATERFOWL SURVEY The Michigan Breeding Waterfowl Survey has been conducted every year since 1991 by Michigan Department of Natural Resources staff. A fixed-wing aerial survey is used to count waterfowl and cranes along established transects. Helicopter counts are used on portions of some transects every five years to establish visibility correction factors (VCFs). Breeding population estimates are then derived from these counts by expanding the VCF-corrected estimated densities of cranes to the entire state. Sandhill cranes were added to the waterfowl survey in 2010 and estimates have been made since that time (Table 1). Prior to 2010, survey observers had little experience counting cranes and VCFs were not established with only one year of helicopter flights prior; this resulted in low precision of population estimates prior to 2010 (Table 1). The VCF used for cranes was 3.5 and 7.06 in 2010 and 2014, respectively. The average spring sandhill crane population in Michigan from 2010-2016 is 43,134 (+/- 24,312).
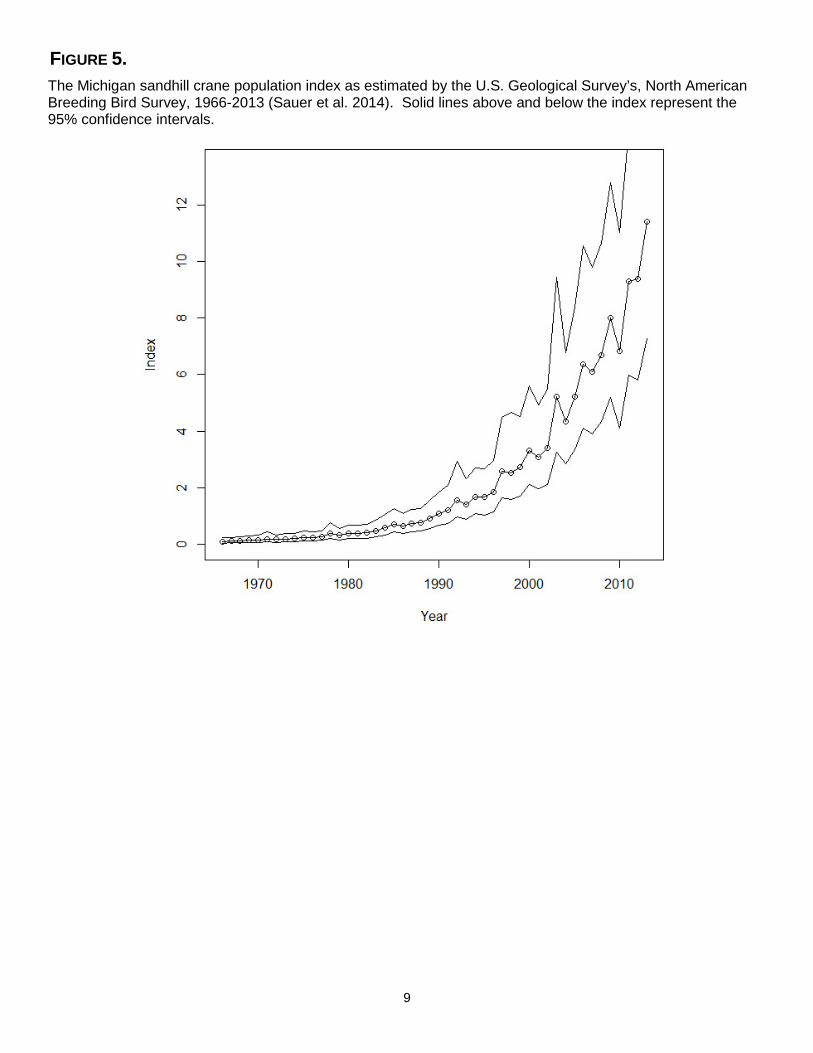
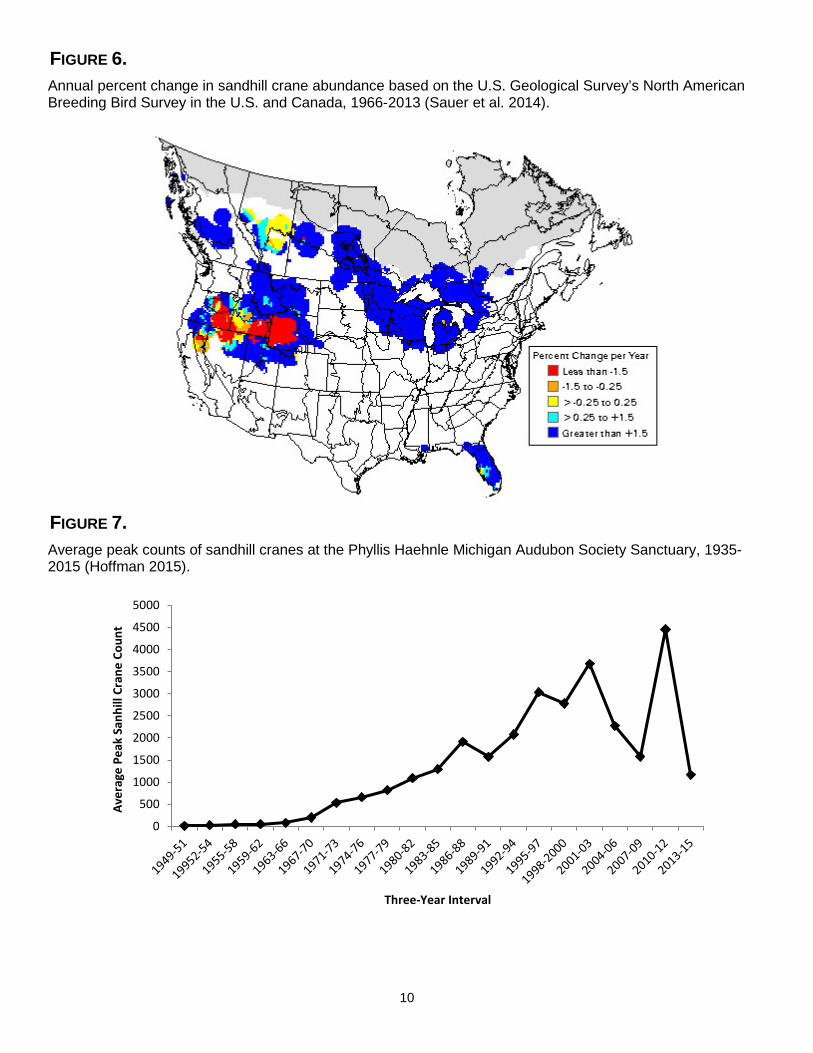
NORTH AMERICAN BREEDING BIRD SURVEY The U.S. Geological Survey and Canadian Wildlife Service coordinate the North American Breeding Bird Survey (BBS) annually to provide indices of population change in North American birds. While there are limitations of this monitoring method, data is available from 1966 to 2013 and provides one of the only long-term monitoring methods for non-game birds (Sauer et al. 2014). The survey is considered to provide better estimates for birds common over land versus wetland or other waterbirds because survey routes follow roadways and are conducted by observers in a vehicle. The survey also introduces bias in bird detection probability as vehicles may scare some birds away from the transect and reduce their probability of being counted (Sauer et al. 2014). Nonetheless, the BBS is the best long-term index we have for sandhill crane population growth in Michigan and shows a considerable increase in the sandhill crane population, suggesting an exponential increase of 10.5% annual change in the sandhill crane population in Michigan from 1966-2013 (Figure 5). The survey does not provide a population estimate, but instead an index to describe population change over time. The BBS also indicates the annual increase in the sandhill cranes in Michigan is among the highest (i.e., greater than 1.5% annual growth) and similar to other areas in North America (Figure 6).
MICHIGAN BREEDING BIRD ATLAS The Michigan Breeding Bird Atlas (BBA) is a statewide survey of breeding birds conducted by volunteers to record presence and absence of Michigan birds. Atlas I was conducted 1983-1988 and Atlas II was conducted
3
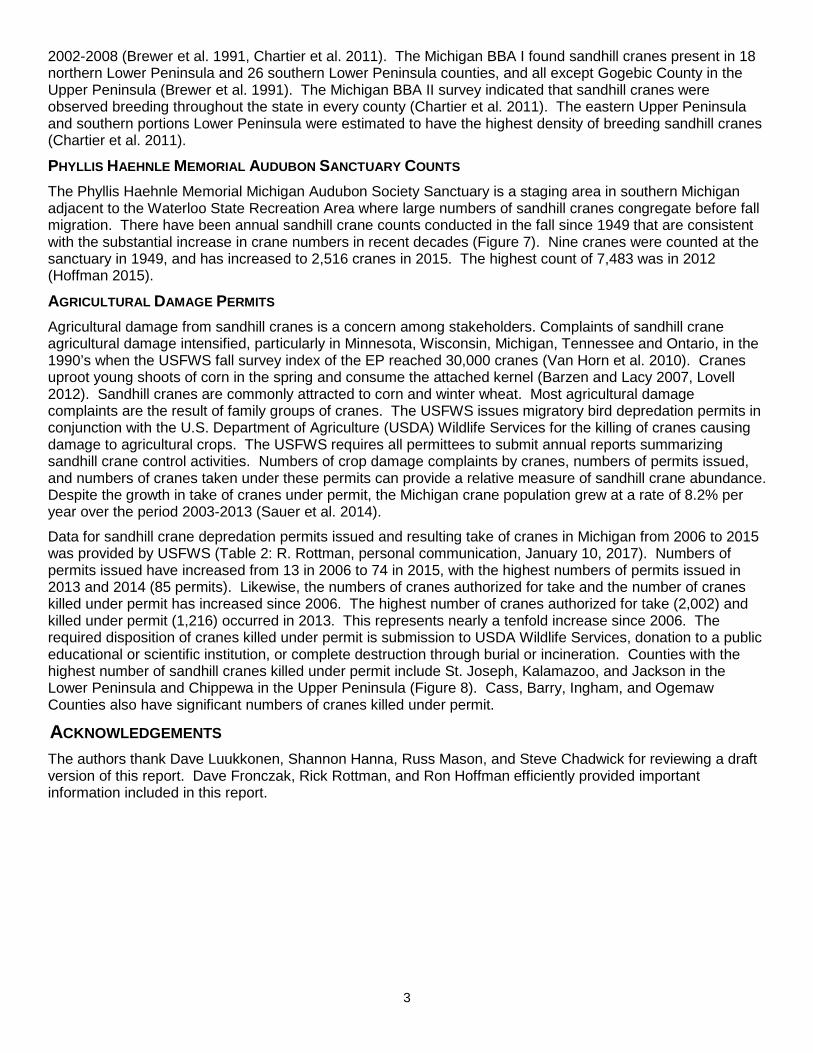
2002-2008 (Brewer et al. 1991, Chartier et al. 2011). The Michigan BBA I found sandhill cranes present in 18 northern Lower Peninsula and 26 southern Lower Peninsula counties, and all except Gogebic County in the Upper Peninsula (Brewer et al. 1991). The Michigan BBA II survey indicated that sandhill cranes were observed breeding throughout the state in every county (Chartier et al. 2011). The eastern Upper Peninsula and southern portions Lower Peninsula were estimated to have the highest density of breeding sandhill cranes (Chartier et al. 2011).
PHYLLIS HAEHNLE MEMORIAL AUDUBON SANCTUARY COUNTS The Phyllis Haehnle Memorial Michigan Audubon Society Sanctuary is a staging area in southern Michigan adjacent to the Waterloo State Recreation Area where large numbers of sandhill cranes congregate before fall migration. There have been annual sandhill crane counts conducted in the fall since 1949 that are consistent with the substantial increase in crane numbers in recent decades (Figure 7). Nine cranes were counted at the sanctuary in 1949, and has increased to 2,516 cranes in 2015. The highest count of 7,483 was in 2012 (Hoffman 2015).
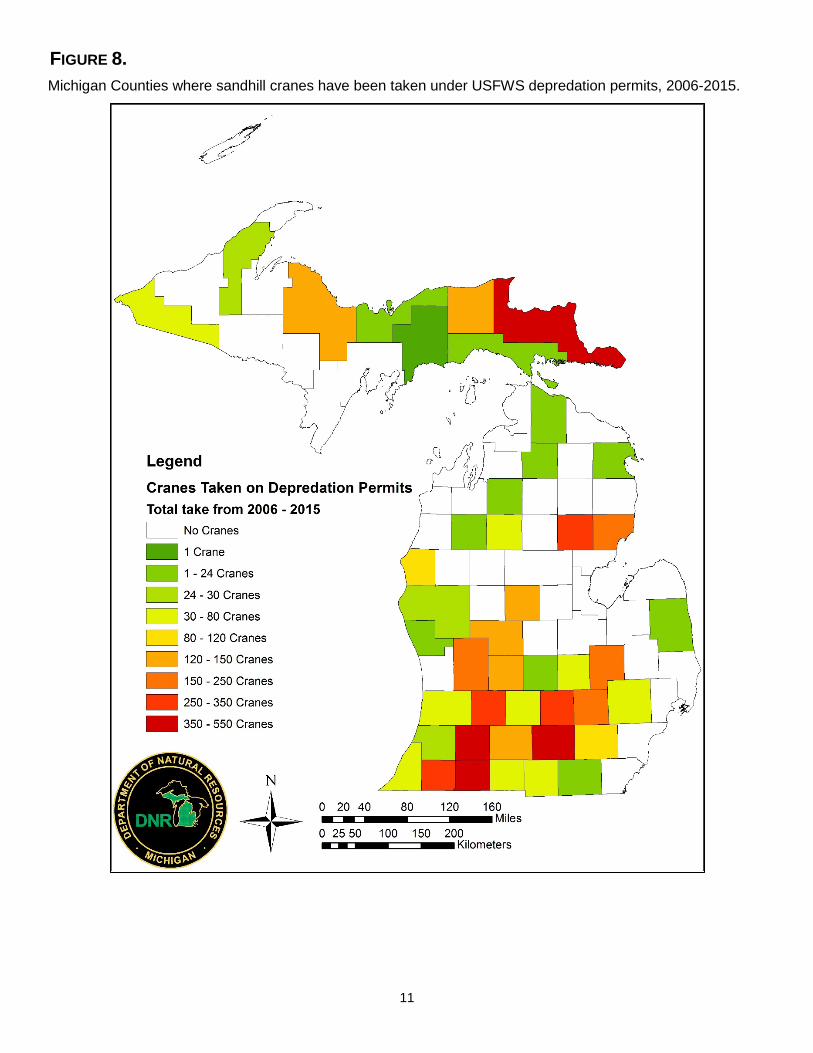
AGRICULTURAL DAMAGE PERMITS Agricultural damage from sandhill cranes is a concern among stakeholders. Complaints of sandhill crane agricultural damage intensified, particularly in Minnesota, Wisconsin, Michigan, Tennessee and Ontario, in the 1990’s when the USFWS fall survey index of the EP reached 30,000 cranes (Van Horn et al. 2010). Cranes uproot young shoots of corn in the spring and consume the attached kernel (Barzen and Lacy 2007, Lovell 2012). Sandhill cranes are commonly attracted to corn and winter wheat. Most agricultural damage complaints are the result of family groups of cranes. The USFWS issues migratory bird depredation permits in conjunction with the U.S. Department of Agriculture (USDA) Wildlife Services for the killing of cranes causing damage to agricultural crops. The USFWS requires all permittees to submit annual reports summarizing sandhill crane control activities. Numbers of crop damage complaints by cranes, numbers of permits issued, and numbers of cranes taken under these permits can provide a relative measure of sandhill crane abundance. Despite the growth in take of cranes under permit, the Michigan crane population grew at a rate of 8.2% per year over the period 2003-2013 (Sauer et al. 2014). Data for sandhill crane depredation permits issued and resulting take of cranes in Michigan from 2006 to 2015 was provided by USFWS (Table 2: R. Rottman, personal communication, January 10, 2017). Numbers of permits issued have increased from 13 in 2006 to 74 in 2015, with the highest numbers of permits issued in 2013 and 2014 (85 permits). Likewise, the numbers of cranes authorized for take and the number of cranes killed under permit has increased since 2006. The highest number of cranes authorized for take (2,002) and killed under permit (1,216) occurred in 2013. This represents nearly a tenfold increase since 2006. The required disposition of cranes killed under permit is submission to USDA Wildlife Services, donation to a public educational or scientific institution, or complete destruction through burial or incineration. Counties with the highest number of sandhill cranes killed under permit include St. Joseph, Kalamazoo, and Jackson in the Lower Peninsula and Chippewa in the Upper Peninsula (Figure 8). Cass, Barry, Ingham, and Ogemaw Counties also have significant numbers of cranes killed under permit.
ACKNOWLEDGEMENTS The authors thank Dave Luukkonen, Shannon Hanna, Russ Mason, and Steve Chadwick for reviewing a draft version of this report. Dave Fronczak, Rick Rottman, and Ron Hoffman efficiently provided important information included in this report.
4
LITERATURE CITED Barzen, J. and A. E. Lacy. 2007. Rethinking management strategies for solving crop damage caused by
birds. Presentation at 68th Midwest Fish and Wildlife Conference, Madison, WI. Brewer, R., G.A. McPeek, and R.J. Adams, Jr. 1991. The Atlas of Breeding Birds of Michigan. Michigan
State University Press. East Lansing, MI Chartier, A.T., J.J. Baldy, and J.M. Brenneman. 2011. The Second Michigan Breeding Bird Atlas, 2002-2008.
Kalamazoo Nature Center. Kalamazoo, MI. Dubovsky, J.A. 2016. Status and harvests of sandhill cranes: Mid-Continent, Rocky Mountain, Lower
Colorado River Valley and Eastern Populations. Administrative Report, U.S. Fish and Wildlife Service, Lakewood, Colorado.
Drewien, R.C., W.M. Brown, and W.L. Kendall. 1995. Recruitment in Rocky Mountain greater sandhill cranes and comparisons with other populations. Journal of Wildlife Management. 59(2):339-356.
Fronczak, D.L. 2014. Distribution, migration chronology, and survival rates of Eastern Population sandhill cranes. Doctoral dissertation, University of Minnesota.
Hoffman, R. 2011. Sandhill Crane (Grus canadensis). In A.T. Chartier, J.J. Baldy, and J.M. Brenneman, editors. The Second Michigan Breeding Bird Atlas. Kalamazoo Nature Center. Kalamazoo, Michigan, USA. www.mibirdatlas.org/Portals/12/MBA2010/SACRaccount.pdf .
Hoffman, R. 2015. Haehnle Sanctuary Sandhill Crane Count Data. Michigan Audubon Society. Unpublished data.
Jones, K.L., G.L. Krapu, D.A. Brandt, and M.V. Ashey. 2005. Population genetic structure in migratory sandhill cranes and the role of Pleistocene glaciations. Molecular Ecology, 14:2645-2657.
King, S.L. 2008. Migration patterns of sandhill cranes wintering in central and southwestern Louisiana. Presentation at the 11th North American Crane Workshop. Wisconsin Dells, Wisconsin.
Lovell, C.D. 2012. Sandhill Crane Ecology and Damage Management. In Living with wildlife in Wisconsin: solving nuisance, damage, health, and safety problems. University of Wisconsin-Extension and U.S. Department of Agriculture. Wildlifedamage.uwex.edu.
Meine, C.D. and G.W. Archibald (Eds.). 1996. The cranes: status, survey, and conservation action plan. IUCN, Gland, Switzerland, and Cambridge, U.K. 294pp. Northern Prairie Wildlife Research Center Online. http://www.npwrc.usgs.gov/resource/birds/cranes/index.htm.
Melvin, S. 2008. First breeding records and historical status of sandhill cranes in New England. Presentation at the 11th North American Crane Workshop. Wisconsin Dells, Wisconsin.
Sauer, J. R., J. E. Hines, J. E. Fallon, K. L. Pardieck, D. J. Ziolkowski, Jr., and W. A. Link. 2014. The North American Breeding Bird Survey, Results and Analysis 1966 - 2013. Version 01.30.2015 USGS Patuxent Wildlife Research Center, Laurel, MD.
Sutherland, D.A. and W.J. Crins. 2008. Sandhill Crane in 2007 Ontario Breeding Bird Atlas. Pages 208-209. Tacha, T.C., S.A. Nesbitt, and P.A. Vohs. 1992. Sandhill crane in A. Poole, P. Stettenheim, and F. Gill, eds.
The birds of North America Monograph 31. The Academy of Natural Sciences, Philadelphia and American Ornithologists' Union, Washington, D.C. 24 pp.
Van Horn, K., T. White, W. Akins, T. Cooper, K. Kelly, R. Urbanek, D. Holm, D. Sherman, D. Aborn, J. Suckow, K. Cleveland, and R. Brook. 2010. Management plan for the Eastern Population of sandhill cranes. Mississippi and Atlantic Flyway Councils.
Walkinshaw, L.H. 1973. Cranes of the World. Winchester Press, New York, New York. 370pp.
5
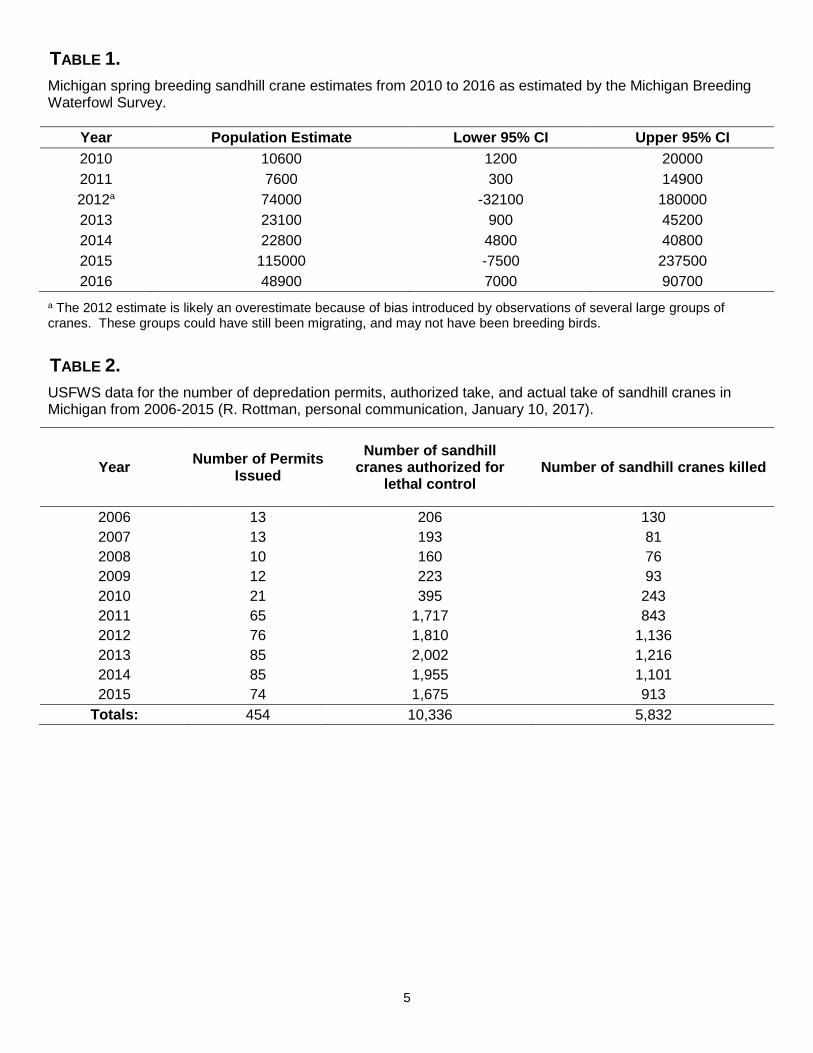
TABLE 1. Michigan spring breeding sandhill crane estimates from 2010 to 2016 as estimated by the Michigan Breeding Waterfowl Survey.
Year Population Estimate Lower 95% CI Upper 95% CI 2010 10600 1200 20000 2011 7600 300 14900 2012a 74000 -32100 180000 2013 23100 900 45200 2014 22800 4800 40800 2015 115000 -7500 237500 2016 48900 7000 90700
a The 2012 estimate is likely an overestimate because of bias introduced by observations of several large groups of cranes. These groups could have still been migrating, and may not have been breeding birds.
TABLE 2. USFWS data for the number of depredation permits, authorized take, and actual take of sandhill cranes in Michigan from 2006-2015 (R. Rottman, personal communication, January 10, 2017).
Year Number of Permits Issued
Number of sandhill cranes authorized for
lethal control Number of sandhill cranes killed
2006 13 206 130 2007 13 193 81 2008 10 160 76 2009 12 223 93 2010 21 395 243 2011 65 1,717 843 2012 76 1,810 1,136 2013 85 2,002 1,216 2014 85 1,955 1,101 2015 74 1,675 913
Totals: 454 10,336 5,832
6
FIGURE 1. Approximate range of EP sandhill cranes (Van Horn et al. 2010). Adapted from Walkinshaw (1973), Jones et al. (2005), King (2008), Melvin (2008), Sutherland and Crins (2008), and International Crane Foundation unpublished data.
7
FIGURE 2. EP sandhill crane annual and three-year average fall counts (Dubovsky 2016).
FIGURE 3. Sandhill crane counts during the USFWS fall staging survey of sites in Michigan.
0
5,000
10,000
15,000
20,000
25,000
30,000
2004 2005 2006 2007 2008 2009 2010 2011 2012 2013 2014 2015
Sand
hill
Cran
e Co
unts
Year
8
FIGURE 4. Locations (indicated as red dots) of the USFWS Fall Sandhill Crane Survey staging areas in Michigan that were surveyed during 2010-2015 (D. Fronczak, personal communication, January 3, 2017).
9
FIGURE 5. The Michigan sandhill crane population index as estimated by the U.S. Geological Survey’s, North American Breeding Bird Survey, 1966-2013 (Sauer et al. 2014). Solid lines above and below the index represent the 95% confidence intervals.
10
FIGURE 6. Annual percent change in sandhill crane abundance based on the U.S. Geological Survey’s North American Breeding Bird Survey in the U.S. and Canada, 1966-2013 (Sauer et al. 2014).
FIGURE 7. Average peak counts of sandhill cranes at the Phyllis Haehnle Michigan Audubon Society Sanctuary, 1935-2015 (Hoffman 2015).
0
500
1000
1500
2000
2500
3000
3500
4000
4500
5000
Aver
age
Peak
San
hill
Cran
e Co
unt
Three-Year Interval
11
FIGURE 8. Michigan Counties where sandhill cranes have been taken under USFWS depredation permits, 2006-2015.