Embed Size (px)
Citation preview

Sands Capital Funds plc
Unaudited Condensed Semi-Annual Financial Statements
For the period from 1 November 2017 to 30 April 2018
Registration Number: 484381
Sands Capital Funds plc
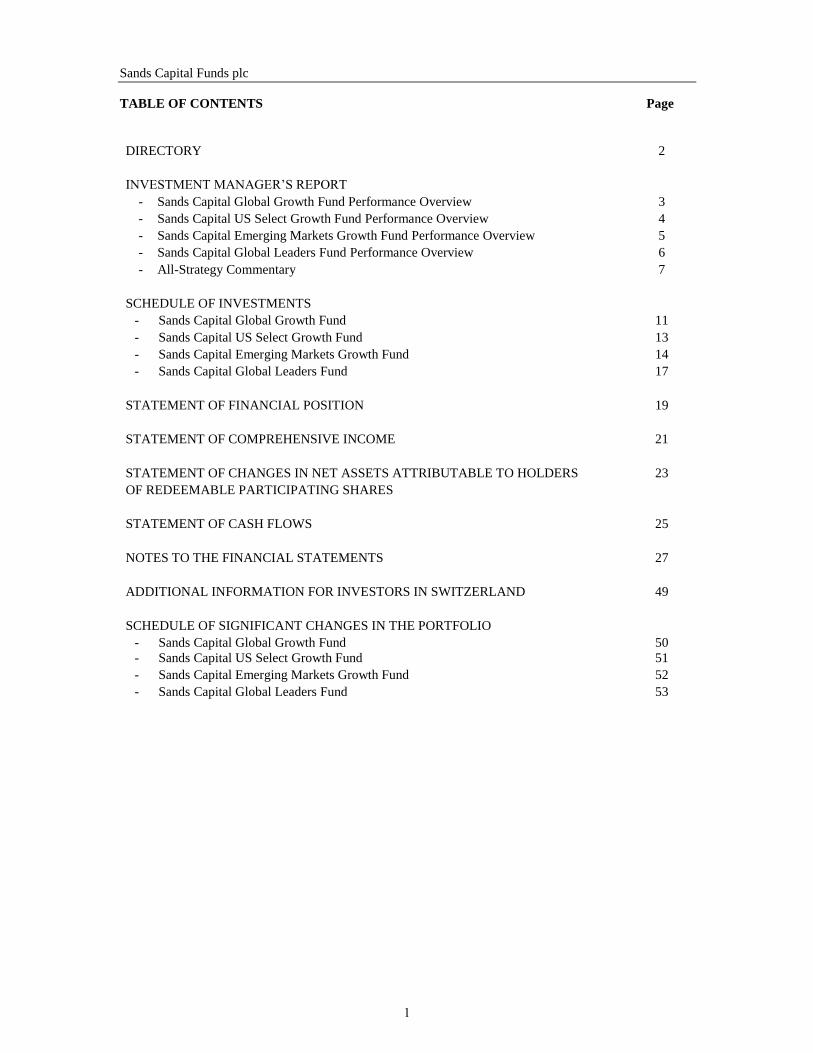
TABLE OF CONTENTS Page
DIRECTORY 2
INVESTMENT MANAGER’S REPORT
- Sands Capital Global Growth Fund Performance Overview 3
- Sands Capital US Select Growth Fund Performance Overview 4
- Sands Capital Emerging Markets Growth Fund Performance Overview 5
- Sands Capital Global Leaders Fund Performance Overview 6
- All-Strategy Commentary 7
SCHEDULE OF INVESTMENTS
- Sands Capital Global Growth Fund 11
- Sands Capital US Select Growth Fund 13
- Sands Capital Emerging Markets Growth Fund 14
- Sands Capital Global Leaders Fund 17
STATEMENT OF FINANCIAL POSITION 19
STATEMENT OF COMPREHENSIVE INCOME 21
STATEMENT OF CHANGES IN NET ASSETS ATTRIBUTABLE TO HOLDERS 23
OF REDEEMABLE PARTICIPATING SHARES
STATEMENT OF CASH FLOWS 25
NOTES TO THE FINANCIAL STATEMENTS 27
ADDITIONAL INFORMATION FOR INVESTORS IN SWITZERLAND 49
SCHEDULE OF SIGNIFICANT CHANGES IN THE PORTFOLIO
- Sands Capital Global Growth Fund 50
- Sands Capital US Select Growth Fund 51
- Sands Capital Emerging Markets Growth Fund 52
- Sands Capital Global Leaders Fund 53
1
Sands Capital Funds plc
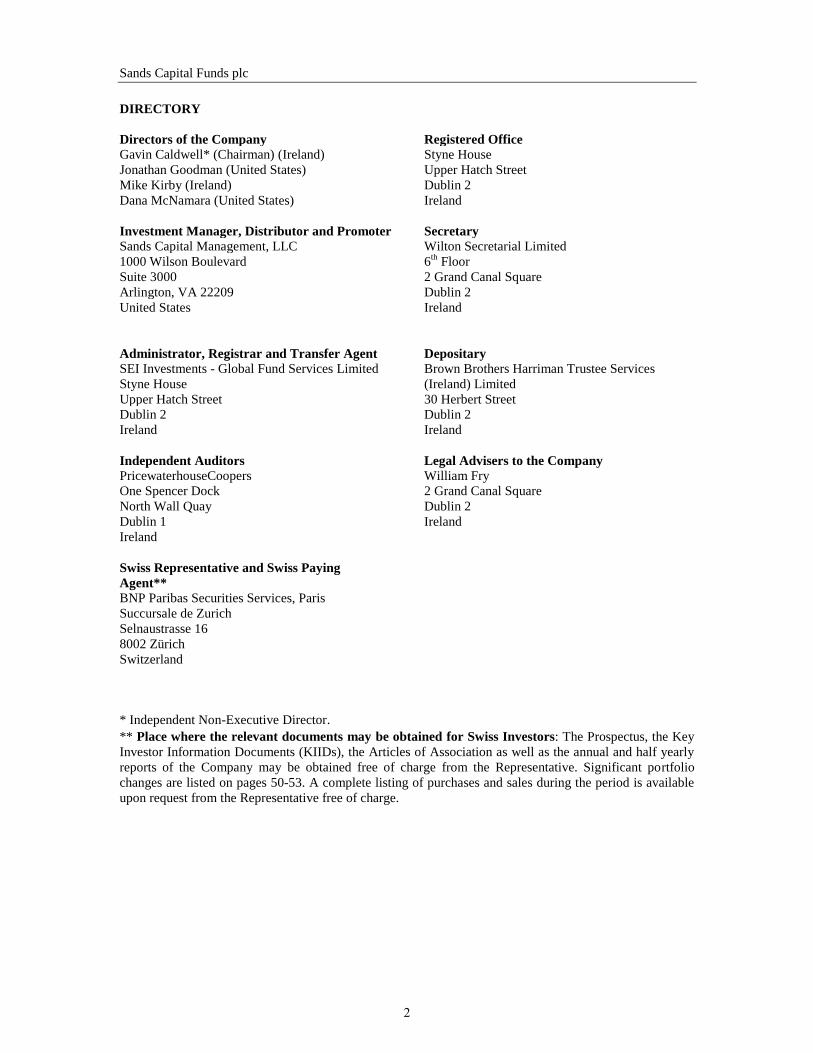
DIRECTORY
Directors of the Company Registered Office
Gavin Caldwell* (Chairman) (Ireland) Styne House
Jonathan Goodman (United States) Upper Hatch Street
Mike Kirby (Ireland) Dublin 2
Dana McNamara (United States) Ireland
Investment Manager, Distributor and Promoter Secretary
Sands Capital Management, LLC Wilton Secretarial Limited
1000 Wilson Boulevard 6th
Floor
Suite 3000 2 Grand Canal Square
Arlington, VA 22209 Dublin 2
United States Ireland
Administrator, Registrar and Transfer Agent Depositary
SEI Investments - Global Fund Services Limited Brown Brothers Harriman Trustee Services
Styne House (Ireland) Limited
Upper Hatch Street 30 Herbert Street
Dublin 2 Dublin 2
Ireland Ireland
Independent Auditors Legal Advisers to the Company PricewaterhouseCoopers William Fry
One Spencer Dock 2 Grand Canal Square
North Wall Quay Dublin 2
Dublin 1 Ireland
Ireland
Swiss Representative and Swiss Paying
Agent**
BNP Paribas Securities Services, Paris
Succursale de Zurich
Selnaustrasse 16
8002 Zürich
Switzerland
* Independent Non-Executive Director. ** Place where the relevant documents may be obtained for Swiss Investors: The Prospectus, the Key
Investor Information Documents (KIIDs), the Articles of Association as well as the annual and half yearly
reports of the Company may be obtained free of charge from the Representative. Significant portfolio
changes are listed on pages 50-53. A complete listing of purchases and sales during the period is available
upon request from the Representative free of charge.
2
Sands Capital Funds plc
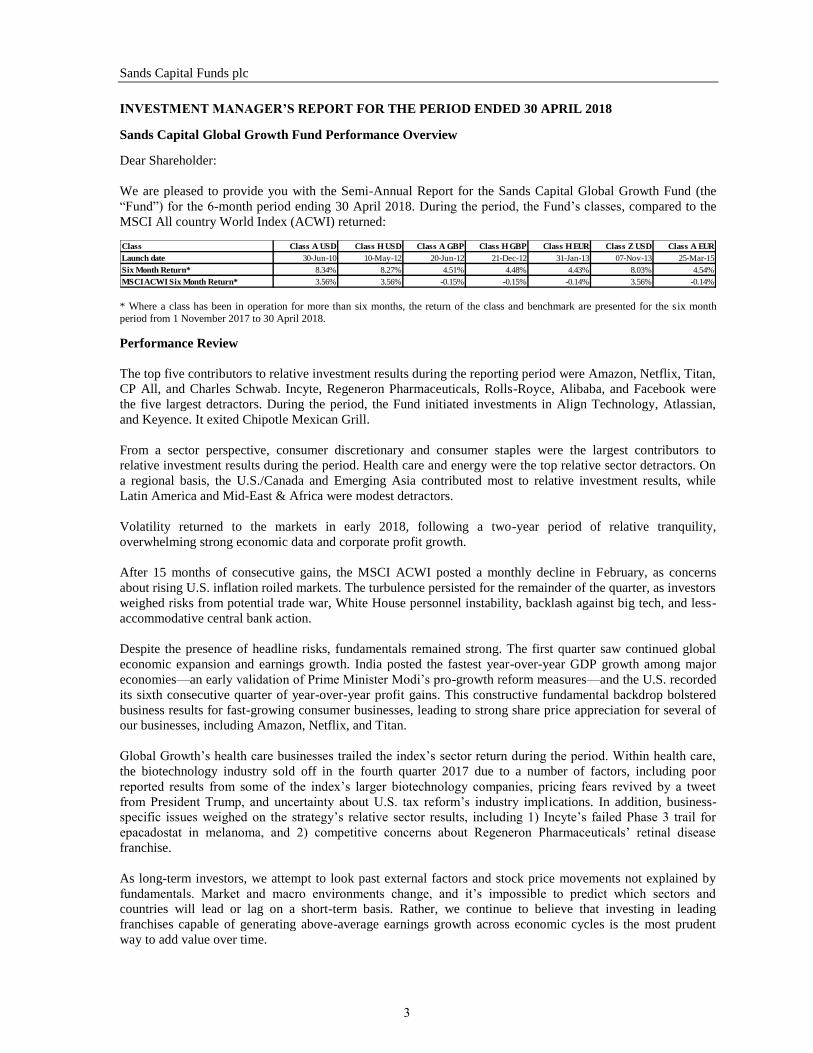
INVESTMENT MANAGER’S REPORT FOR THE PERIOD ENDED 30 APRIL 2018 Sands Capital Global Growth Fund Performance Overview Dear Shareholder:
We are pleased to provide you with the Semi-Annual Report for the Sands Capital Global Growth Fund (the
“Fund”) for the 6-month period ending 30 April 2018. During the period, the Fund’s classes, compared to the
MSCI All country World Index (ACWI) returned: Class Class A USD Class H USD Class A GBP Class H GBP Class H EUR Class Z USD Class A EUR
Launch date 30-Jun-10 10-May-12 20-Jun-12 21-Dec-12 31-Jan-13 07-Nov-13 25-Mar-15
Six Month Return* 8.34% 8.27% 4.51% 4.48% 4.43% 8.03% 4.54%
MSCI ACWI Six Month Return* 3.56% 3.56% -0.15% -0.15% -0.14% 3.56% -0.14%
* Where a class has been in operation for more than six months, the return of the class and benchmark are presented for the six month
period from 1 November 2017 to 30 April 2018. Performance Review
The top five contributors to relative investment results during the reporting period were Amazon, Netflix, Titan,
CP All, and Charles Schwab. Incyte, Regeneron Pharmaceuticals, Rolls-Royce, Alibaba, and Facebook were
the five largest detractors. During the period, the Fund initiated investments in Align Technology, Atlassian,
and Keyence. It exited Chipotle Mexican Grill.
From a sector perspective, consumer discretionary and consumer staples were the largest contributors to
relative investment results during the period. Health care and energy were the top relative sector detractors. On
a regional basis, the U.S./Canada and Emerging Asia contributed most to relative investment results, while
Latin America and Mid-East & Africa were modest detractors.
Volatility returned to the markets in early 2018, following a two-year period of relative tranquility,
overwhelming strong economic data and corporate profit growth.
After 15 months of consecutive gains, the MSCI ACWI posted a monthly decline in February, as concerns
about rising U.S. inflation roiled markets. The turbulence persisted for the remainder of the quarter, as investors
weighed risks from potential trade war, White House personnel instability, backlash against big tech, and less-
accommodative central bank action.
Despite the presence of headline risks, fundamentals remained strong. The first quarter saw continued global
economic expansion and earnings growth. India posted the fastest year-over-year GDP growth among major
economies—an early validation of Prime Minister Modi’s pro-growth reform measures—and the U.S. recorded
its sixth consecutive quarter of year-over-year profit gains. This constructive fundamental backdrop bolstered
business results for fast-growing consumer businesses, leading to strong share price appreciation for several of
our businesses, including Amazon, Netflix, and Titan.
Global Growth’s health care businesses trailed the index’s sector return during the period. Within health care,
the biotechnology industry sold off in the fourth quarter 2017 due to a number of factors, including poor
reported results from some of the index’s larger biotechnology companies, pricing fears revived by a tweet
from President Trump, and uncertainty about U.S. tax reform’s industry implications. In addition, business-
specific issues weighed on the strategy’s relative sector results, including 1) Incyte’s failed Phase 3 trail for
epacadostat in melanoma, and 2) competitive concerns about Regeneron Pharmaceuticals’ retinal disease
franchise.
As long-term investors, we attempt to look past external factors and stock price movements not explained by
fundamentals. Market and macro environments change, and it’s impossible to predict which sectors and
countries will lead or lag on a short-term basis. Rather, we continue to believe that investing in leading
franchises capable of generating above-average earnings growth across economic cycles is the most prudent
way to add value over time.
3
Sands Capital Funds plc
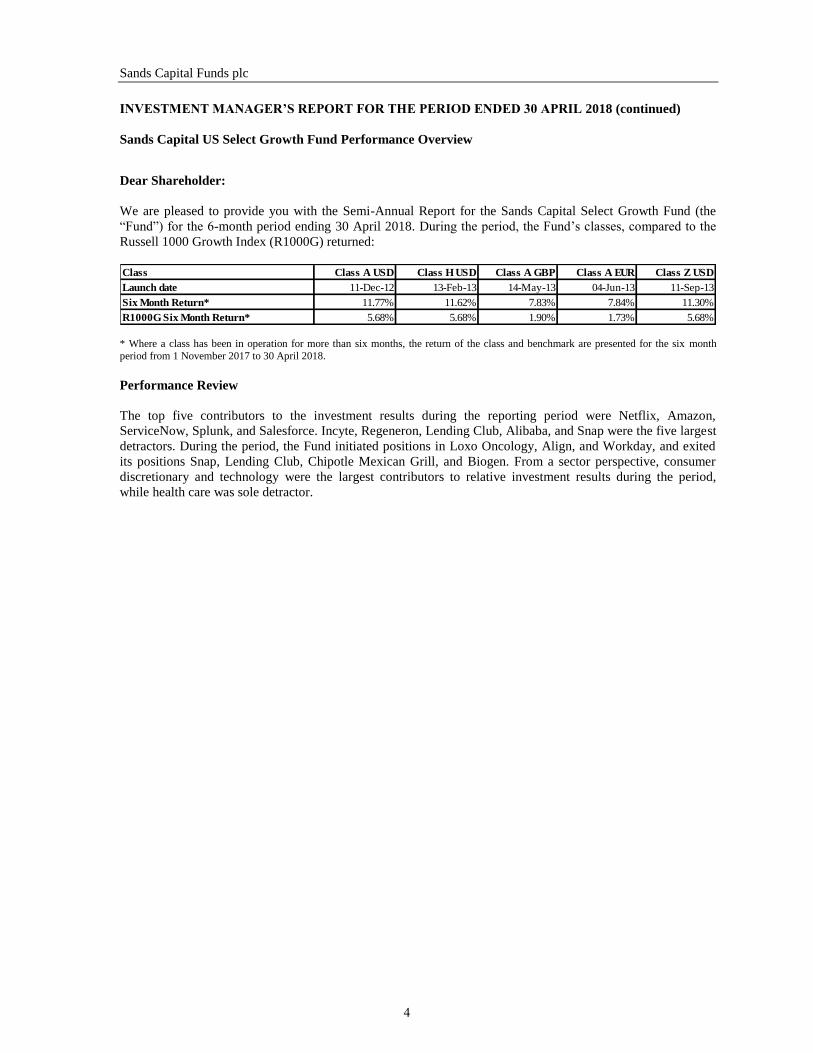
INVESTMENT MANAGER’S REPORT FOR THE PERIOD ENDED 30 APRIL 2018 (continued)
Sands Capital US Select Growth Fund Performance Overview
Dear Shareholder:
We are pleased to provide you with the Semi-Annual Report for the Sands Capital Select Growth Fund (the
“Fund”) for the 6-month period ending 30 April 2018. During the period, the Fund’s classes, compared to the
Russell 1000 Growth Index (R1000G) returned:
Class Class A USD Class H USD Class A GBP Class A EUR Class Z USD
Launch date 11-Dec-12 13-Feb-13 14-May-13 04-Jun-13 11-Sep-13
Six Month Return* 11.77% 11.62% 7.83% 7.84% 11.30%
R1000G Six Month Return* 5.68% 5.68% 1.90% 1.73% 5.68%
* Where a class has been in operation for more than six months, the return of the class and benchmark are presented for the six month
period from 1 November 2017 to 30 April 2018.
Performance Review
The top five contributors to the investment results during the reporting period were Netflix, Amazon,
ServiceNow, Splunk, and Salesforce. Incyte, Regeneron, Lending Club, Alibaba, and Snap were the five largest
detractors. During the period, the Fund initiated positions in Loxo Oncology, Align, and Workday, and exited
its positions Snap, Lending Club, Chipotle Mexican Grill, and Biogen. From a sector perspective, consumer
discretionary and technology were the largest contributors to relative investment results during the period,
while health care was sole detractor.
4
Sands Capital Funds plc
INVESTMENT MANAGER’S REPORT FOR THE PERIOD ENDED 30 APRIL 2018 (continued) Sands Capital Emerging Markets Growth Fund Performance Overview Dear Shareholder:
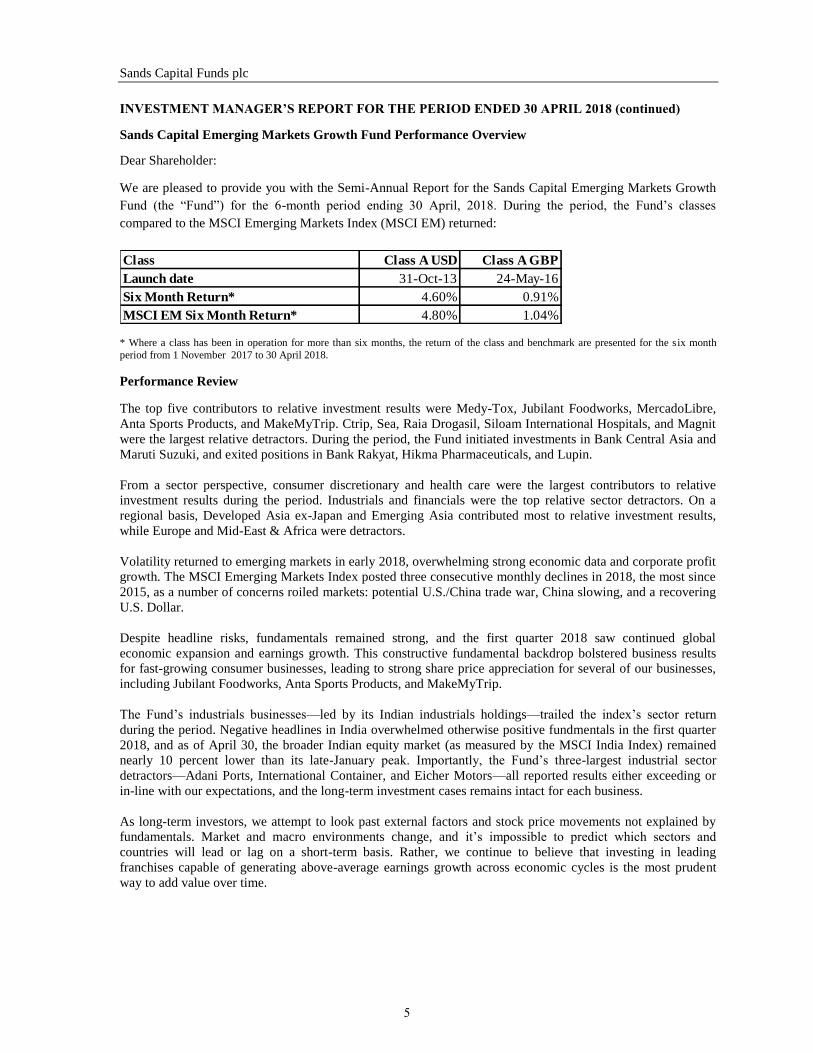
We are pleased to provide you with the Semi-Annual Report for the Sands Capital Emerging Markets Growth
Fund (the “Fund”) for the 6-month period ending 30 April, 2018. During the period, the Fund’s classes
compared to the MSCI Emerging Markets Index (MSCI EM) returned:
Class Class A USD Class A GBP
Launch date 31-Oct-13 24-May-16
Six Month Return* 4.60% 0.91%
MSCI EM Six Month Return* 4.80% 1.04%
* Where a class has been in operation for more than six months, the return of the class and benchmark are presented for the six month
period from 1 November 2017 to 30 April 2018.
Performance Review
The top five contributors to relative investment results were Medy-Tox, Jubilant Foodworks, MercadoLibre,
Anta Sports Products, and MakeMyTrip. Ctrip, Sea, Raia Drogasil, Siloam International Hospitals, and Magnit
were the largest relative detractors. During the period, the Fund initiated investments in Bank Central Asia and
Maruti Suzuki, and exited positions in Bank Rakyat, Hikma Pharmaceuticals, and Lupin.
From a sector perspective, consumer discretionary and health care were the largest contributors to relative
investment results during the period. Industrials and financials were the top relative sector detractors. On a
regional basis, Developed Asia ex-Japan and Emerging Asia contributed most to relative investment results,
while Europe and Mid-East & Africa were detractors.
Volatility returned to emerging markets in early 2018, overwhelming strong economic data and corporate profit
growth. The MSCI Emerging Markets Index posted three consecutive monthly declines in 2018, the most since
2015, as a number of concerns roiled markets: potential U.S./China trade war, China slowing, and a recovering
U.S. Dollar.
Despite headline risks, fundamentals remained strong, and the first quarter 2018 saw continued global
economic expansion and earnings growth. This constructive fundamental backdrop bolstered business results
for fast-growing consumer businesses, leading to strong share price appreciation for several of our businesses,
including Jubilant Foodworks, Anta Sports Products, and MakeMyTrip.
The Fund’s industrials businesses—led by its Indian industrials holdings—trailed the index’s sector return
during the period. Negative headlines in India overwhelmed otherwise positive fundmentals in the first quarter
2018, and as of April 30, the broader Indian equity market (as measured by the MSCI India Index) remained
nearly 10 percent lower than its late-January peak. Importantly, the Fund’s three-largest industrial sector
detractors—Adani Ports, International Container, and Eicher Motors—all reported results either exceeding or
in-line with our expectations, and the long-term investment cases remains intact for each business.
As long-term investors, we attempt to look past external factors and stock price movements not explained by
fundamentals. Market and macro environments change, and it’s impossible to predict which sectors and
countries will lead or lag on a short-term basis. Rather, we continue to believe that investing in leading
franchises capable of generating above-average earnings growth across economic cycles is the most prudent
way to add value over time.
5
Sands Capital Funds plc
INVESTMENT MANAGER’S REPORT FOR THE PERIOD ENDED 30 APRIL 2018 (continued)
Sands Capital Global Leaders Fund Performance Overview
Dear Shareholder:
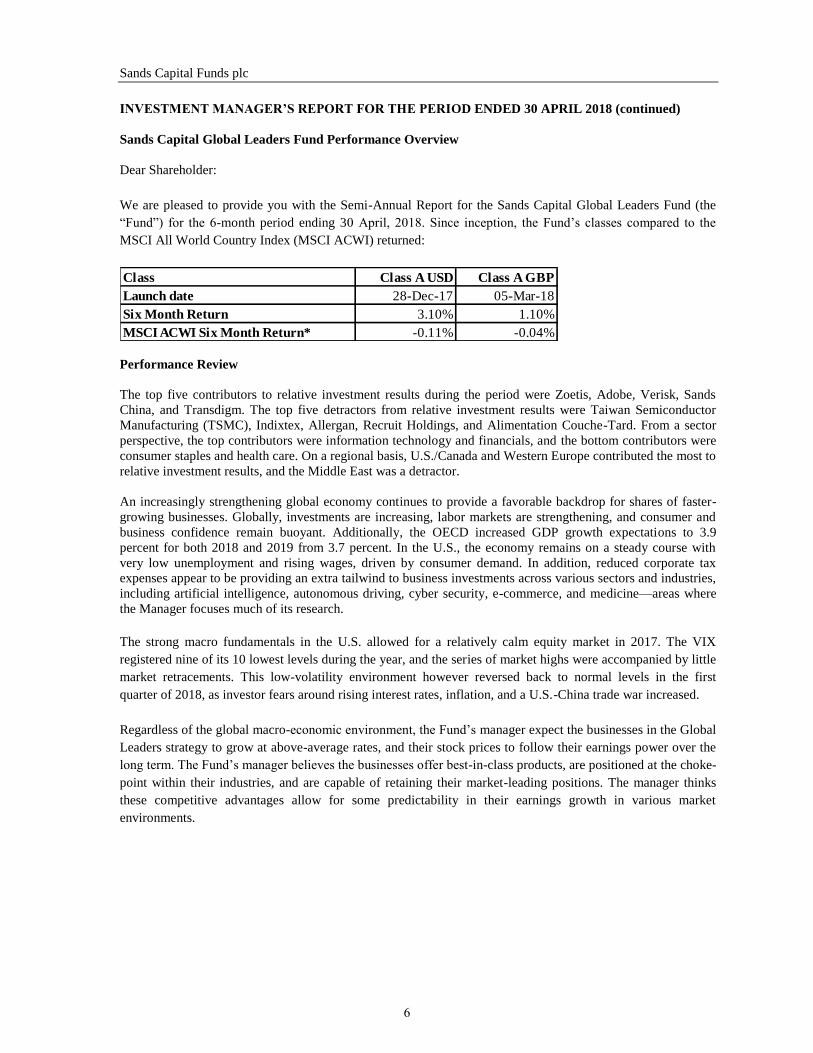
We are pleased to provide you with the Semi-Annual Report for the Sands Capital Global Leaders Fund (the
“Fund”) for the 6-month period ending 30 April, 2018. Since inception, the Fund’s classes compared to the
MSCI All World Country Index (MSCI ACWI) returned:
Class Class A USD Class A GBP
Launch date 28-Dec-17 05-Mar-18
Six Month Return 3.10% 1.10%
MSCI ACWI Six Month Return* -0.11% -0.04%
Performance Review
The top five contributors to relative investment results during the period were Zoetis, Adobe, Verisk, Sands
China, and Transdigm. The top five detractors from relative investment results were Taiwan Semiconductor
Manufacturing (TSMC), Indixtex, Allergan, Recruit Holdings, and Alimentation Couche-Tard. From a sector
perspective, the top contributors were information technology and financials, and the bottom contributors were
consumer staples and health care. On a regional basis, U.S./Canada and Western Europe contributed the most to
relative investment results, and the Middle East was a detractor.
An increasingly strengthening global economy continues to provide a favorable backdrop for shares of faster-
growing businesses. Globally, investments are increasing, labor markets are strengthening, and consumer and
business confidence remain buoyant. Additionally, the OECD increased GDP growth expectations to 3.9
percent for both 2018 and 2019 from 3.7 percent. In the U.S., the economy remains on a steady course with
very low unemployment and rising wages, driven by consumer demand. In addition, reduced corporate tax
expenses appear to be providing an extra tailwind to business investments across various sectors and industries,
including artificial intelligence, autonomous driving, cyber security, e-commerce, and medicine—areas where
the Manager focuses much of its research.
The strong macro fundamentals in the U.S. allowed for a relatively calm equity market in 2017. The VIX
registered nine of its 10 lowest levels during the year, and the series of market highs were accompanied by little
market retracements. This low-volatility environment however reversed back to normal levels in the first
quarter of 2018, as investor fears around rising interest rates, inflation, and a U.S.-China trade war increased.
Regardless of the global macro-economic environment, the Fund’s manager expect the businesses in the Global
Leaders strategy to grow at above-average rates, and their stock prices to follow their earnings power over the
long term. The Fund’s manager believes the businesses offer best-in-class products, are positioned at the choke-
point within their industries, and are capable of retaining their market-leading positions. The manager thinks
these competitive advantages allow for some predictability in their earnings growth in various market
environments.
6
Sands Capital Funds plc
INVESTMENT MANAGER’S REPORT FOR THE PERIOD ENDED 30 APRIL 2018 (continued)
All-Strategy Commentary: Seeking Insights, Not Information
Generating differentiated insights is a key to adding value for our clients over time. Insights enable us to build
conviction in great businesses and own them at large weights in our portfolios. In contrast to the abundance of
data readily available to all market participants, insights are like rare gems. They create opportunities in even
the most efficient markets. Our forecasted estimates often do not differ significantly from consensus forecasts
in the next year or two, but they often do over the longer term.
For example, we most recently purchased Align Technology, a U.S.-based company that is a global leader in
the malocclusion (misaligned teeth) market, in our Select Growth and Global Growth strategies. During our
nearly year-long research efforts, we gained insights and confidence on Align’s ability to execute on several
upside drivers both in the near and long term. In the next few years, we think that the U.S. adult market will
grow more than consensus expects. We also believe that the international market, which we estimate is twice
the size of the U.S. market, is underappreciated by analysts. Our insights into these two markets were driven by
our extensive conversations with orthodontists globally, and our experience and accumulated knowledge in
adjacent markets such as Botox and LASIK surgery. Our longer-term insight is in Align’s direct-to-consumer
business, which we expect will power the company’s profitability and growth over the next decade. As a result,
our estimates become increasingly higher than consensus as we look further out.
On-the-ground research is a primary input to our insight generation. The internet has made information
abundant and easily available. However, the need remains to understand the “why” behind the “what.” In our
view, this can only be achieved by seeing products and services firsthand, speaking to target consumers,
understanding local markets and context, and building relationships with experts and influencers.
We approach on-the-ground research differently than many of our peers, in our view. It is not enough simply to
have “boots on the ground.” For us, the number of boots, who’s wearing them, and what they do with the
information makes a difference. On most research trips, we send large groups that can include as many as ten
analysts. Though they all share the same experience, each analyst might see things differently based on her
domain expertise. Aided by that diversity of perspectives, the group can deliberate observations in real time,
develop greater context, and push for a deeper level of understanding, all while in the field. By the time the
group returns to our home office in Arlington, VA, it has already begun the process of formulating shared
views and informing the decision making on our businesses. The group’s observations—combined with the
broader team’s experience—enables faster information sharing and analysis through a wider lens. This sharing
powers our differentiated insights, which we believe ultimately leads to better outcomes.
We logged over 35 research trips in the first quarter alone, half of which were in the U.S. and the balance
overseas. Two of our most interesting trips were to China and India, where we conducted further research on
Alibaba’s new Hema stores and Eicher Motors’ motorcycles. In both cases, our on-the-ground work provided a
greater appreciation for the companies’ growth opportunities and strengthened our long-term investment cases.
Hema—Alibaba’s “New Retail”
Our most recent trip to China helped us to better appreciate the growth potential of Hema, one of Alibaba’s
newer businesses. Hema is the first online grocery service we have seen globally that can potentially address
the majority of the local population, scale quickly, and generate attractive unit economics. We think it will
become a meaningful long-term growth driver for Alibaba’s business.
7
Sands Capital Funds plc
INVESTMENT MANAGER’S REPORT FOR THE PERIOD ENDED 30 APRIL 2018 (continued)
Hema has massive potential in China’s online grocery market, which is expected to double to more than six
percent of total grocery sales by 2020. Our three biggest takeaways from the Hema research trip were:
1) Its optimized store format for large scale fulfillment is key to generating attractive unit economics.
2) Alibaba’s immense trove of consumer data positions it extremely well to rapidly grow its grocery business.
3) Alibaba is building a powerful ecosystem that extends beyond its own grocery delivery business.
Am I in the Right Place?
When visiting Hema grocery stores, we were surprised to walk into what appeared to be small distribution
centers. We observed wide aisles to accommodate foot traffic, blue-jacketed employees fulfilling online orders,
and a conveyor system suspended from the ceiling transporting products. We realized that Alibaba inverted the
grocery delivery model by creating a grocery store within a fulfillment center, as opposed to trying to fulfill
from a traditional store.
The result is a business model with better economics than either traditional grocery stores or large, centrally
located warehouses with vans for last mile delivery. Hema store layout allows for quick fulfillment of online
orders, and delivery is efficient, given the shorter distances and its low-cost, large motorcycle fleet.
We believe the operating margin of a mature Hema store is approximately twice that of a traditional store, and
sales per square meter are eight to 10 times higher. Additionally, Hema stores reach breakeven in
approximately one year—similar to a Starbucks’ store—and can generate twice the profit margin per dollar of
gross merchandise value as Alibaba’s core marketplace.
With the model and unit economics now proven, Alibaba is accelerating the number of store openings in 2018.
In three to five years, we think the number of Hema stores can reach approximately 2,000 and generate $80
billion to $120 billion in annual sales.
Know Thy Customer
Data analysis is paramount, and is helping to power Hema’s early success. Data analysis is a key competitive
advantage that helps keeps business giants—including Amazon, Alphabet, Tencent, Netflix, and Facebook—
dominant and far ahead of their competition. The amount of data they analyze on individual consumption
patterns and preferences is increasingly valuable as it becomes more accurate over time.
For Hema, Alibaba’s vast consumer data gives it the ability to predict, with a high degree of accuracy, which
items will be the most successful in each store’s territory. Though many Chinese ecommerce companies
analyze customer data, Alibaba’s approach is powerful with its proprietary data built on advanced algorithms
and technology, enabling better analysis and actionable insights. Its predictive inventory management combines
machine learning technology with Alibaba’s proprietary data on consumers within a two-mile radius of each
store. This advantage gives Hema the ability to connect to more people and attract them with products
customized to their wants and needs. As a result, it increases the chances of a transaction occurring—most
likely at a higher value than traditional grocery stores.
8
Sands Capital Funds plc
INVESTMENT MANAGER’S REPORT FOR THE PERIOD ENDED 30 APRIL 2018 (continued) A Strengthening Ecosystem
All transactions at Hema stores are exclusively executed through AliPay, which should strengthen Alibaba’s
ecosystem and augment the growth of its overall business. The digital payment system enhances Alibaba’s
“New Retail” strategy by reducing the friction associated with traditional payment methods, thereby increasing
the convenience factor. We expect to see some bottlenecks early on, as non-AliPay users initially shop at
Hema, but ultimately, we believe AliPay will increase customer loyalty and transaction values over the long
term. In the most recent quarter, the number of daily active users on AliPay doubled. With more consumers using
AliPay, we foresee Alibaba’s Hema stores and its other businesses, such as Taobao and Tmall, attracting new
customers who value the convenience and seamlessness of a shopping experience. Riding High with Royal Enfield India's rising middle-class consumers often turn to Eicher Motors’ Royal Enfield motorcycles to signal their
newfound wealth and status. With a 60+ year tradition in India, a long history of service in the Indian army and
police forces, and noticeably larger and more distinguished frames than India’s mass-market bikes, the Royal
Enfield brand embodies machismo, strength, and distinction.
Our visits to India suggest that Royal Enfield is fostering a strong culture and community around the bike,
reinforcing customer loyalty to the brand. In February, for example, we found a Royal Enfield riding club
within a dealership. Rather than visiting the dealership solely to buy a bike, Royal Enfield riders go often to
gather with other enthusiasts, hang out, and organize rides. With a bar, lounge, and motorcycle-themed décor,
the club conveyed the community fostered by the powerful brand. In India, this type of branding is unique to
Royal Enfield and distinguishes the company from mass-market two-wheeler original equipment manufacturers
(OEMs), whose products are often seen as commodities.
Our knowledge of the global motorcycle industry—gained by over a decade of owning a developed-market
motorcycle company—provided a strong framework to assess Eicher's strategy and predict where the company
may head in the future. For example, we have historically seen motorcycle OEMs increase brand attachment
and decrease ownership cycles via expansion of bike customization. If successful, this strategy can also have
important implications for bikes’ average selling prices, resale values, and company margins. After speaking
with Eicher management, we believe that the company will begin to pursue a similar product strategy in the
coming years.
Today, Royal Enfield bikes are mostly built to standard specs, with variation for any bike model largely limited
to paint styling and engine size. Eicher customers then typically take these “standard bikes” to third-party shops
to add customized parts and detailing. Thus, nearly all bike customization occurs outside the Eicher ecosystem.
In the 1990s, we saw a U.S. motorcycle business expand these customization capabilities in-house, improving
its ability to provide riders with a unique bike offering and riding experience. This effort contributed to rising
company margins and bike average selling prices, thanks to the relative profitability of custom parts versus the
bike itself, and most importantly, because customers were willing to pay a premium to have a bike fit their
unique style and preferences. Some of the key management behind this strategy is now employed by Eicher,
leading us to believe that the knowledge transfer will result in the development of similar offerings (and, we
hope, outcomes) at Royal Enfield.
Beyond driving earnings growth, bike customization—from handlebars, exhaust systems, and body color—can
also help expand the Royal Enfield brand aura. Already a status symbol on its own, riding a one-of-a-kind
Royal Enfield is a next-level type of aspiration that we think will be eagerly pursued by the its customer base.
9
Sands Capital Funds plc
INVESTMENT MANAGER’S REPORT FOR THE PERIOD ENDED 30 APRIL 2018 (continued)
Conclusion
Our extensive on-the-ground research—and our integrated approach to information collection and processing—
is a competitive advantage when evaluating businesses and their long-term potential, in our view. Physically
seeing a business’s products and services can provide a deeper level of understanding, building on our existing
domain knowledge. Innovative businesses such as Alibaba (Hema) and Eicher offer something unique to their
customers, and we developed better insights about each business’s commercialization potential after seeing
their operations firsthand. We apply the same approach to all of our businesses to gain differentiated insights,
which we believe will ultimately add value for our clients.
We thank you for your ongoing support of Sands Capital and invite any question that you may have.
Sincerely,
The Sands Capital Investment Team
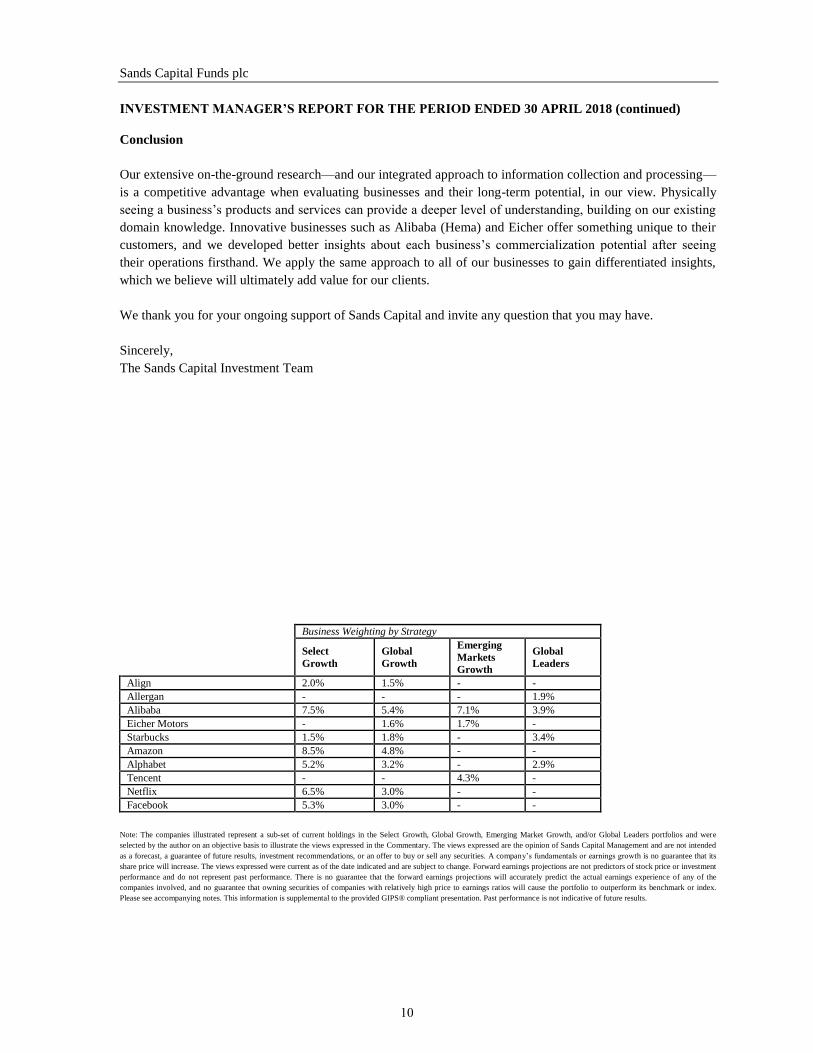
Business Weighting by Strategy
Select
Growth
Global
Growth
Emerging
Markets
Growth
Global
Leaders
Align 2.0% 1.5% - -
Allergan - - - 1.9%
Alibaba 7.5% 5.4% 7.1% 3.9%
Eicher Motors - 1.6% 1.7% -
Starbucks 1.5% 1.8% - 3.4%
Amazon 8.5% 4.8% - -
Alphabet 5.2% 3.2% - 2.9%
Tencent - - 4.3% -
Netflix 6.5% 3.0% - -
Facebook 5.3% 3.0% - -
Note: The companies illustrated represent a sub-set of current holdings in the Select Growth, Global Growth, Emerging Market Growth, and/or Global Leaders portfolios and were
selected by the author on an objective basis to illustrate the views expressed in the Commentary. The views expressed are the opinion of Sands Capital Management and are not intended
as a forecast, a guarantee of future results, investment recommendations, or an offer to buy or sell any securities. A company’s fundamentals or earnings growth is no guarantee that its
share price will increase. The views expressed were current as of the date indicated and are subject to change. Forward earnings projections are not predictors of stock price or investment
performance and do not represent past performance. There is no guarantee that the forward earnings projections will accurately predict the actual earnings experience of any of the
companies involved, and no guarantee that owning securities of companies with relatively high price to earnings ratios will cause the portfolio to outperform its benchmark or index.
Please see accompanying notes. This information is supplemental to the provided GIPS® compliant presentation. Past performance is not indicative of future results.
10
Sands Capital Funds plc
SCHEDULE OF INVESTMENTS
As at 30 April 2018
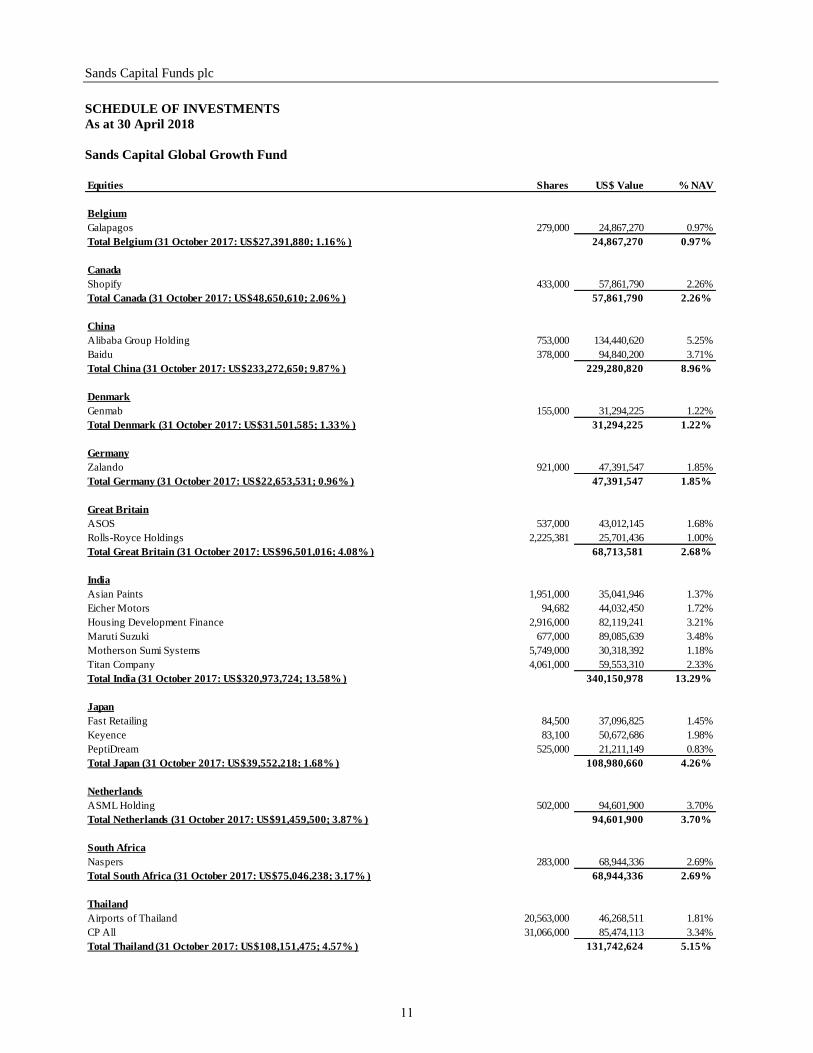
Sands Capital Global Growth Fund
Equities Shares US$ Value % NAV
Belgium
Galapagos 279,000 24,867,270 0.97%
Total Belgium (31 October 2017: US$27,391,880; 1.16% ) 24,867,270 0.97%
Canada
Shopify 433,000 57,861,790 2.26%
Total Canada (31 October 2017: US$48,650,610; 2.06% ) 57,861,790 2.26%
China
Alibaba Group Holding 753,000 134,440,620 5.25%
Baidu 378,000 94,840,200 3.71%
Total China (31 October 2017: US$233,272,650; 9.87% ) 229,280,820 8.96%
Denmark
Genmab 155,000 31,294,225 1.22%
Total Denmark (31 October 2017: US$31,501,585; 1.33% ) 31,294,225 1.22%
Germany
Zalando 921,000 47,391,547 1.85%
Total Germany (31 October 2017: US$22,653,531; 0.96% ) 47,391,547 1.85%
Great Britain
ASOS 537,000 43,012,145 1.68%
Rolls-Royce Holdings 2,225,381 25,701,436 1.00%
Total Great Britain (31 October 2017: US$96,501,016; 4.08% ) 68,713,581 2.68%
India
Asian Paints 1,951,000 35,041,946 1.37%
Eicher Motors 94,682 44,032,450 1.72%
Housing Development Finance 2,916,000 82,119,241 3.21%
Maruti Suzuki 677,000 89,085,639 3.48%
Motherson Sumi Systems 5,749,000 30,318,392 1.18%
Titan Company 4,061,000 59,553,310 2.33%
Total India (31 October 2017: US$320,973,724; 13.58% ) 340,150,978 13.29%
Japan
Fast Retailing 84,500 37,096,825 1.45%
Keyence 83,100 50,672,686 1.98%
PeptiDream 525,000 21,211,149 0.83%
Total Japan (31 October 2017: US$39,552,218; 1.68% ) 108,980,660 4.26%
Netherlands
ASML Holding 502,000 94,601,900 3.70%
Total Netherlands (31 October 2017: US$91,459,500; 3.87% ) 94,601,900 3.70%
South Africa
Naspers 283,000 68,944,336 2.69%
Total South Africa (31 October 2017: US$75,046,238; 3.17% ) 68,944,336 2.69%
Thailand
Airports of Thailand 20,563,000 46,268,511 1.81%
CP All 31,066,000 85,474,113 3.34%
Total Thailand (31 October 2017: US$108,151,475; 4.57% ) 131,742,624 5.15%
11
Sands Capital Funds plc
SCHEDULE OF INVESTMENTS
As at 30 April 2018
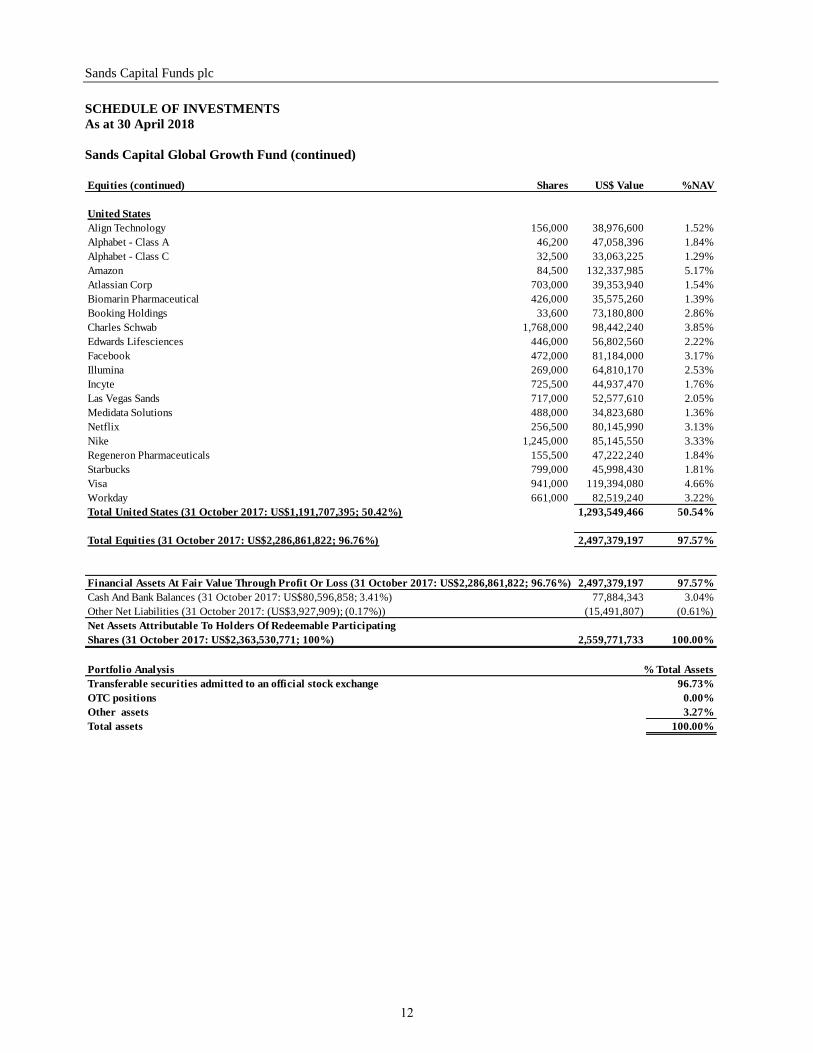
Sands Capital Global Growth Fund (continued)
Equities (continued) Shares US$ Value %NAV
United States
Align Technology 156,000 38,976,600 1.52%
Alphabet - Class A 46,200 47,058,396 1.84%
Alphabet - Class C 32,500 33,063,225 1.29%
Amazon 84,500 132,337,985 5.17%
Atlassian Corp 703,000 39,353,940 1.54%
Biomarin Pharmaceutical 426,000 35,575,260 1.39%
Booking Holdings 33,600 73,180,800 2.86%
Charles Schwab 1,768,000 98,442,240 3.85%
Edwards Lifesciences 446,000 56,802,560 2.22%
Facebook 472,000 81,184,000 3.17%
Illumina 269,000 64,810,170 2.53%
Incyte 725,500 44,937,470 1.76%
Las Vegas Sands 717,000 52,577,610 2.05%
Medidata Solutions 488,000 34,823,680 1.36%
Netflix 256,500 80,145,990 3.13%
Nike 1,245,000 85,145,550 3.33%
Regeneron Pharmaceuticals 155,500 47,222,240 1.84%
Starbucks 799,000 45,998,430 1.81%
Visa 941,000 119,394,080 4.66%
Workday 661,000 82,519,240 3.22%
Total United States (31 October 2017: US$1,191,707,395; 50.42%) 1,293,549,466 50.54%
Total Equities (31 October 2017: US$2,286,861,822; 96.76%) 2,497,379,197 97.57%
Financial Assets At Fair Value Through Profit Or Loss (31 October 2017: US$2,286,861,822; 96.76%) 2,497,379,197 97.57%
Cash And Bank Balances (31 October 2017: US$80,596,858; 3.41%) 77,884,343 3.04%
Other Net Liabilities (31 October 2017: (US$3,927,909); (0.17%)) (15,491,807) (0.61%)
Net Assets Attributable To Holders Of Redeemable Participating
Shares (31 October 2017: US$2,363,530,771; 100%) 2,559,771,733 100.00%
Portfolio Analysis % Total Assets
Transferable securities admitted to an official stock exchange 96.73%
OTC positions 0.00%
Other assets 3.27%
Total assets 100.00%
12
Sands Capital Funds plc
SCHEDULE OF INVESTMENTS
As at 30 April 2018
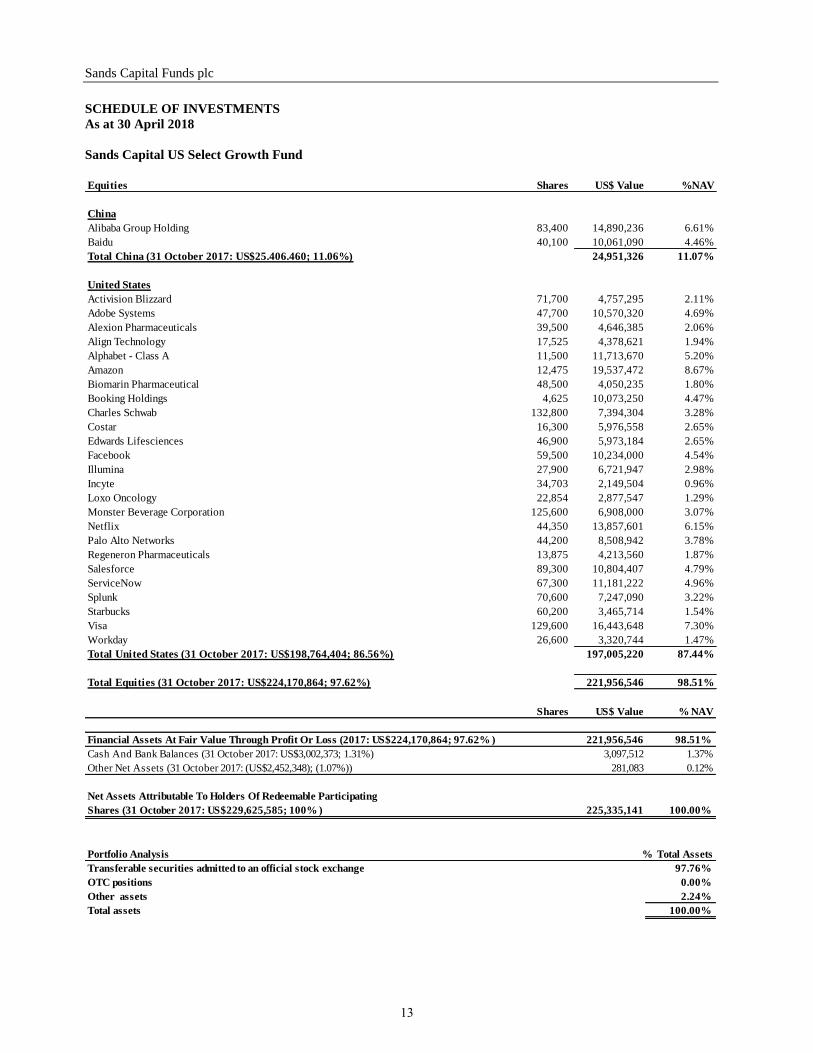
Sands Capital US Select Growth Fund
Equities Shares US$ Value %NAV
China
Alibaba Group Holding 83,400 14,890,236 6.61%
Baidu 40,100 10,061,090 4.46%
Total China (31 October 2017: US$25.406.460; 11.06%) 24,951,326 11.07%
United States
Activision Blizzard 71,700 4,757,295 2.11%
Adobe Systems 47,700 10,570,320 4.69%
Alexion Pharmaceuticals 39,500 4,646,385 2.06%
Align Technology 17,525 4,378,621 1.94%
Alphabet - Class A 11,500 11,713,670 5.20%
Amazon 12,475 19,537,472 8.67%
Biomarin Pharmaceutical 48,500 4,050,235 1.80%
Booking Holdings 4,625 10,073,250 4.47%
Charles Schwab 132,800 7,394,304 3.28%
Costar 16,300 5,976,558 2.65%
Edwards Lifesciences 46,900 5,973,184 2.65%
Facebook 59,500 10,234,000 4.54%
Illumina 27,900 6,721,947 2.98%
Incyte 34,703 2,149,504 0.96%
Loxo Oncology 22,854 2,877,547 1.29%
Monster Beverage Corporation 125,600 6,908,000 3.07%
Netflix 44,350 13,857,601 6.15%
Palo Alto Networks 44,200 8,508,942 3.78%
Regeneron Pharmaceuticals 13,875 4,213,560 1.87%
Salesforce 89,300 10,804,407 4.79%
ServiceNow 67,300 11,181,222 4.96%
Splunk 70,600 7,247,090 3.22%
Starbucks 60,200 3,465,714 1.54%
Visa 129,600 16,443,648 7.30%
Workday 26,600 3,320,744 1.47%
Total United States (31 October 2017: US$198,764,404; 86.56%) 197,005,220 87.44%
Total Equities (31 October 2017: US$224,170,864; 97.62%) 221,956,546 98.51%
Shares US$ Value % NAV
Financial Assets At Fair Value Through Profit Or Loss (2017: US$224,170,864; 97.62% ) 221,956,546 98.51%
Cash And Bank Balances (31 October 2017: US$3,002,373; 1.31%) 3,097,512 1.37%
Other Net Assets (31 October 2017: (US$2,452,348); (1.07%)) 281,083 0.12%
Net Assets Attributable To Holders Of Redeemable Participating
Shares (31 October 2017: US$229,625,585; 100% ) 225,335,141 100.00%
Portfolio Analysis % Total Assets
Transferable securities admitted to an official stock exchange 97.76%
OTC positions 0.00%
Other assets 2.24%
Total assets 100.00%
13
Sands Capital Funds plc
SCHEDULE OF INVESTMENTS
As at 30 April 2018
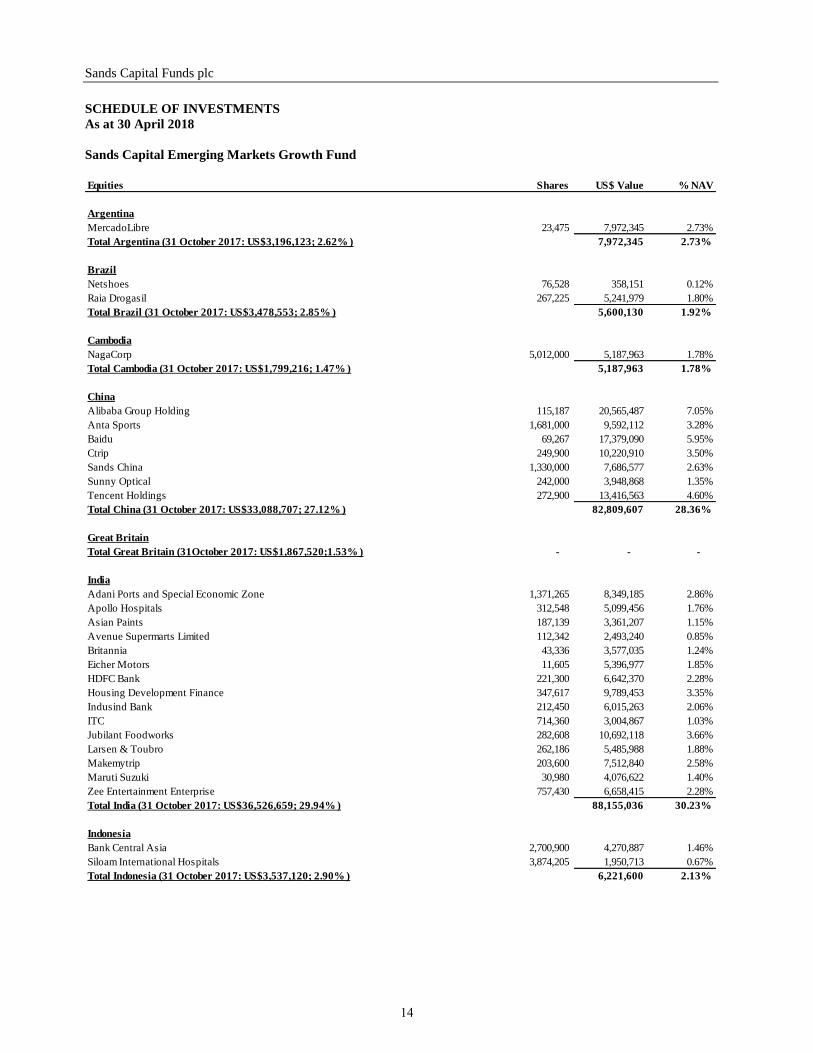
Sands Capital Emerging Markets Growth Fund
Equities Shares US$ Value % NAV
Argentina
MercadoLibre 23,475 7,972,345 2.73%
Total Argentina (31 October 2017: US$3,196,123; 2.62% ) 7,972,345 2.73%
Brazil
Netshoes 76,528 358,151 0.12%
Raia Drogasil 267,225 5,241,979 1.80%
Total Brazil (31 October 2017: US$3,478,553; 2.85% ) 5,600,130 1.92%
Cambodia
NagaCorp 5,012,000 5,187,963 1.78%
Total Cambodia (31 October 2017: US$1,799,216; 1.47% ) 5,187,963 1.78%
China
Alibaba Group Holding 115,187 20,565,487 7.05%
Anta Sports 1,681,000 9,592,112 3.28%
Baidu 69,267 17,379,090 5.95%
Ctrip 249,900 10,220,910 3.50%
Sands China 1,330,000 7,686,577 2.63%
Sunny Optical 242,000 3,948,868 1.35%
Tencent Holdings 272,900 13,416,563 4.60%
Total China (31 October 2017: US$33,088,707; 27.12% ) 82,809,607 28.36%
Great Britain
Total Great Britain (31October 2017: US$1,867,520;1.53% ) - - -
India
Adani Ports and Special Economic Zone 1,371,265 8,349,185 2.86%
Apollo Hospitals 312,548 5,099,456 1.76%
Asian Paints 187,139 3,361,207 1.15%
Avenue Supermarts Limited 112,342 2,493,240 0.85%
Britannia 43,336 3,577,035 1.24%
Eicher Motors 11,605 5,396,977 1.85%
HDFC Bank 221,300 6,642,370 2.28%
Housing Development Finance 347,617 9,789,453 3.35%
Indusind Bank 212,450 6,015,263 2.06%
ITC 714,360 3,004,867 1.03%
Jubilant Foodworks 282,608 10,692,118 3.66%
Larsen & Toubro 262,186 5,485,988 1.88%
Makemytrip 203,600 7,512,840 2.58%
Maruti Suzuki 30,980 4,076,622 1.40%
Zee Entertainment Enterprise 757,430 6,658,415 2.28%
Total India (31 October 2017: US$36,526,659; 29.94% ) 88,155,036 30.23%
Indonesia
Bank Central Asia 2,700,900 4,270,887 1.46%
Siloam International Hospitals 3,874,205 1,950,713 0.67%
Total Indonesia (31 October 2017: US$3,537,120; 2.90% ) 6,221,600 2.13%
14
Sands Capital Funds plc
SCHEDULE OF INVESTMENTS
As at 30 April 2018
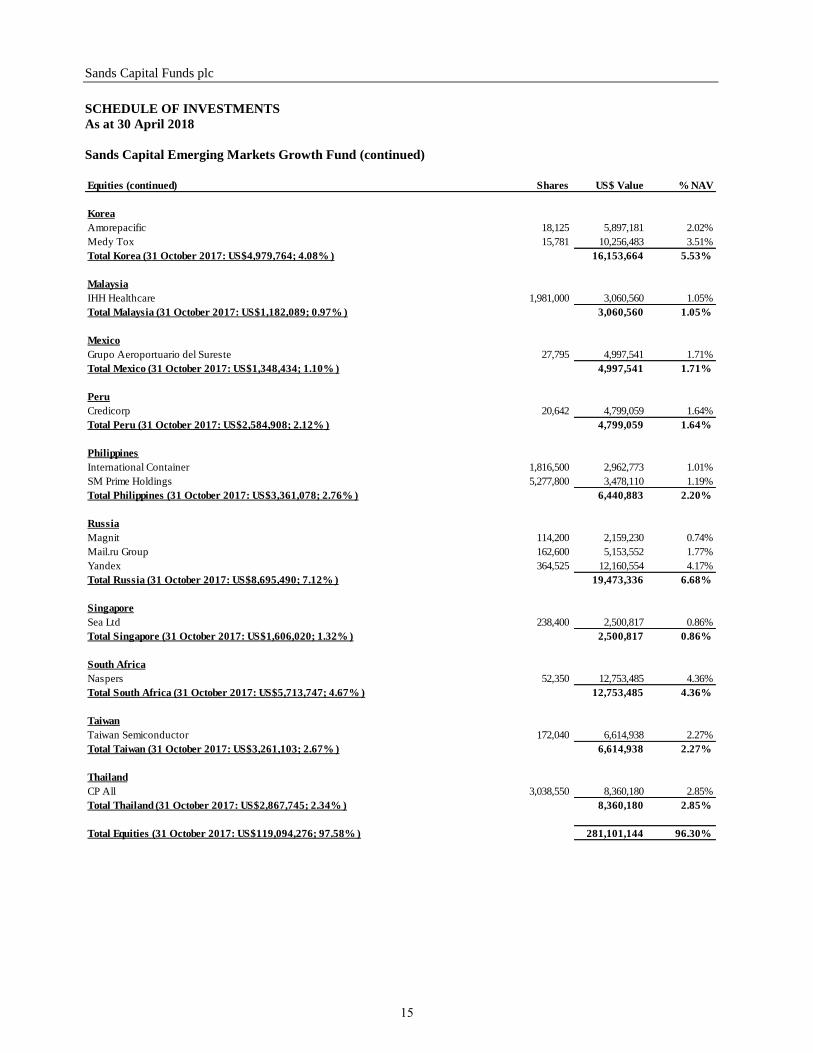
Sands Capital Emerging Markets Growth Fund (continued)
Equities (continued) Shares US$ Value % NAV
Korea
Amorepacific 18,125 5,897,181 2.02%
Medy Tox 15,781 10,256,483 3.51%
Total Korea (31 October 2017: US$4,979,764; 4.08% ) 16,153,664 5.53%
Malaysia
IHH Healthcare 1,981,000 3,060,560 1.05%
Total Malaysia (31 October 2017: US$1,182,089; 0.97% ) 3,060,560 1.05%
Mexico
Grupo Aeroportuario del Sureste 27,795 4,997,541 1.71%
Total Mexico (31 October 2017: US$1,348,434; 1.10% ) 4,997,541 1.71%
Peru
Credicorp 20,642 4,799,059 1.64%
Total Peru (31 October 2017: US$2,584,908; 2.12% ) 4,799,059 1.64%
Philippines
International Container 1,816,500 2,962,773 1.01%
SM Prime Holdings 5,277,800 3,478,110 1.19%
Total Philippines (31 October 2017: US$3,361,078; 2.76% ) 6,440,883 2.20%
Russia
Magnit 114,200 2,159,230 0.74%
Mail.ru Group 162,600 5,153,552 1.77%
Yandex 364,525 12,160,554 4.17%
Total Russia (31 October 2017: US$8,695,490; 7.12% ) 19,473,336 6.68%
Singapore
Sea Ltd 238,400 2,500,817 0.86%
Total Singapore (31 October 2017: US$1,606,020; 1.32% ) 2,500,817 0.86%
South Africa
Naspers 52,350 12,753,485 4.36%
Total South Africa (31 October 2017: US$5,713,747; 4.67% ) 12,753,485 4.36%
Taiwan
Taiwan Semiconductor 172,040 6,614,938 2.27%
Total Taiwan (31 October 2017: US$3,261,103; 2.67% ) 6,614,938 2.27%
Thailand
CP All 3,038,550 8,360,180 2.85%
Total Thailand (31 October 2017: US$2,867,745; 2.34% ) 8,360,180 2.85%
Total Equities (31 October 2017: US$119,094,276; 97.58% ) 281,101,144 96.30%
15
Sands Capital Funds plc
SCHEDULE OF INVESTMENTS
As at 30 April 2018
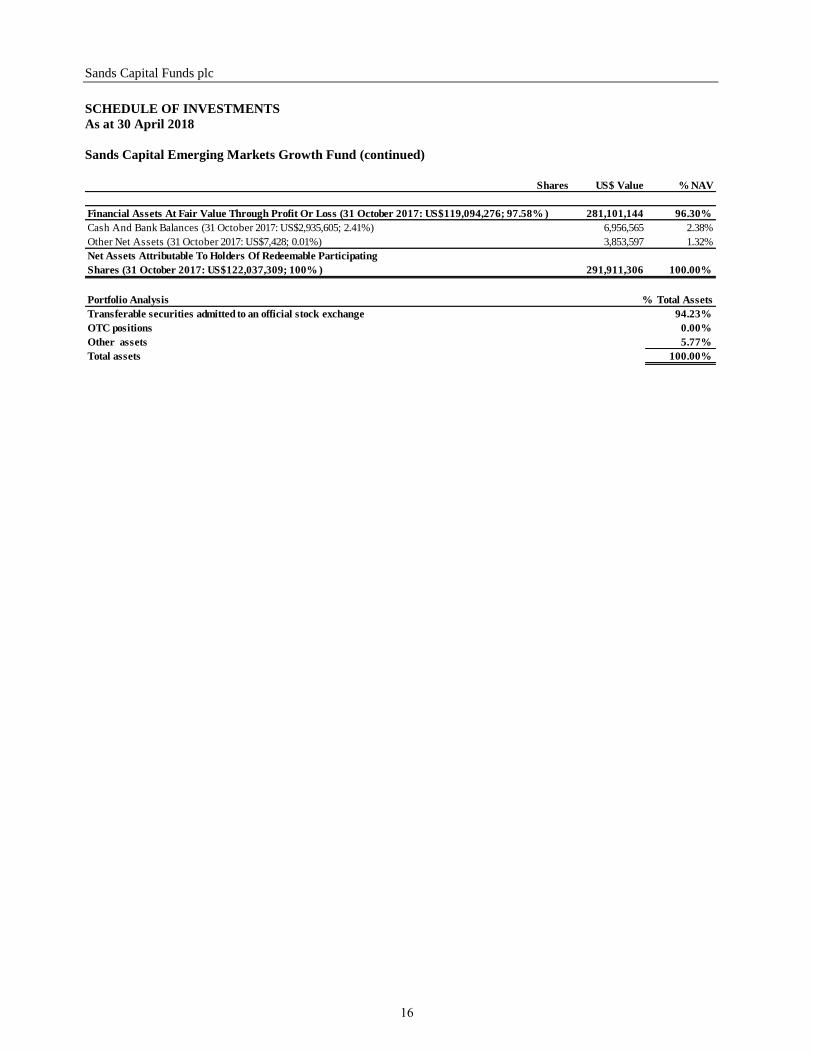
Sands Capital Emerging Markets Growth Fund (continued)
Shares US$ Value % NAV
Financial Assets At Fair Value Through Profit Or Loss (31 October 2017: US$119,094,276; 97.58% ) 281,101,144 96.30%
Cash And Bank Balances (31 October 2017: US$2,935,605; 2.41%) 6,956,565 2.38%
Other Net Assets (31 October 2017: US$7,428; 0.01%) 3,853,597 1.32%
Net Assets Attributable To Holders Of Redeemable Participating
Shares (31 October 2017: US$122,037,309; 100% ) 291,911,306 100.00%
Portfolio Analysis % Total Assets
Transferable securities admitted to an official stock exchange 94.23%
OTC positions 0.00%
Other assets 5.77%
Total assets 100.00%
16
Sands Capital Funds plc
SCHEDULE OF INVESTMENTS
As at 30 April 2018
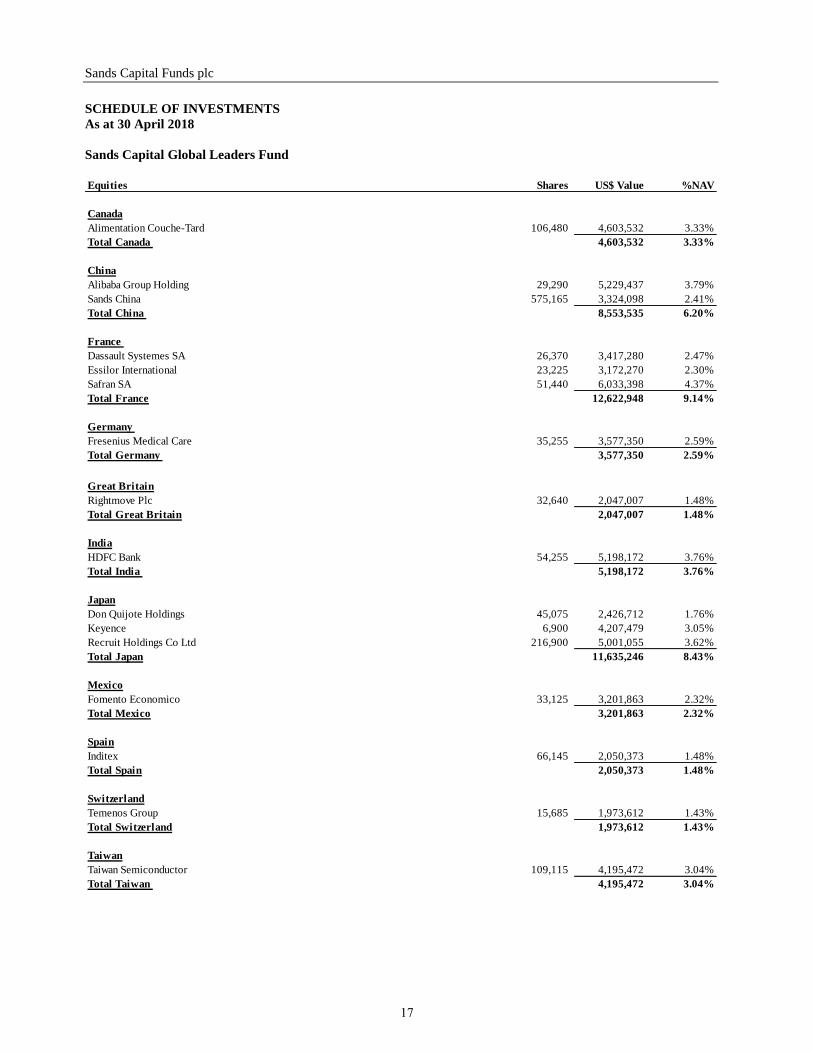
Sands Capital Global Leaders Fund
Equities Shares US$ Value %NAV
Canada
Alimentation Couche-Tard 106,480 4,603,532 3.33%
Total Canada 4,603,532 3.33%
China
Alibaba Group Holding 29,290 5,229,437 3.79%
Sands China 575,165 3,324,098 2.41%
Total China 8,553,535 6.20%
France
Dassault Systemes SA 26,370 3,417,280 2.47%
Essilor International 23,225 3,172,270 2.30%
Safran SA 51,440 6,033,398 4.37%
Total France 12,622,948 9.14%
Germany
Fresenius Medical Care 35,255 3,577,350 2.59%
Total Germany 3,577,350 2.59%
Great Britain
Rightmove Plc 32,640 2,047,007 1.48%
Total Great Britain 2,047,007 1.48%
India
HDFC Bank 54,255 5,198,172 3.76%
Total India 5,198,172 3.76%
Japan
Don Quijote Holdings 45,075 2,426,712 1.76%
Keyence 6,900 4,207,479 3.05%
Recruit Holdings Co Ltd 216,900 5,001,055 3.62%
Total Japan 11,635,246 8.43%
Mexico
Fomento Economico 33,125 3,201,863 2.32%
Total Mexico 3,201,863 2.32%
Spain
Inditex 66,145 2,050,373 1.48%
Total Spain 2,050,373 1.48%
Switzerland
Temenos Group 15,685 1,973,612 1.43%
Total Switzerland 1,973,612 1.43%
Taiwan
Taiwan Semiconductor 109,115 4,195,472 3.04%
Total Taiwan 4,195,472 3.04%
17
Sands Capital Funds plc
SCHEDULE OF INVESTMENTS
As at 30 April 2018
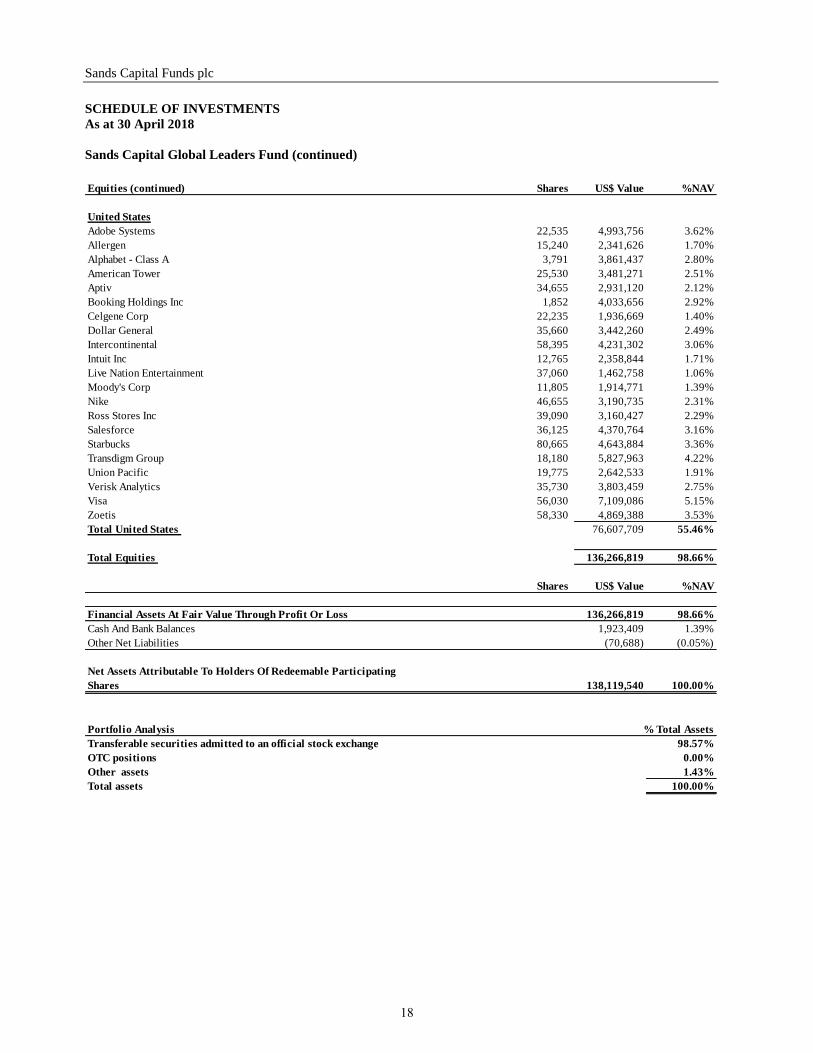
Sands Capital Global Leaders Fund (continued)
Equities (continued) Shares US$ Value %NAV
United States
Adobe Systems 22,535 4,993,756 3.62%
Allergen 15,240 2,341,626 1.70%
Alphabet - Class A 3,791 3,861,437 2.80%
American Tower 25,530 3,481,271 2.51%
Aptiv 34,655 2,931,120 2.12%
Booking Holdings Inc 1,852 4,033,656 2.92%
Celgene Corp 22,235 1,936,669 1.40%
Dollar General 35,660 3,442,260 2.49%
Intercontinental 58,395 4,231,302 3.06%
Intuit Inc 12,765 2,358,844 1.71%
Live Nation Entertainment 37,060 1,462,758 1.06%
Moody's Corp 11,805 1,914,771 1.39%
Nike 46,655 3,190,735 2.31%
Ross Stores Inc 39,090 3,160,427 2.29%
Salesforce 36,125 4,370,764 3.16%
Starbucks 80,665 4,643,884 3.36%
Transdigm Group 18,180 5,827,963 4.22%
Union Pacific 19,775 2,642,533 1.91%
Verisk Analytics 35,730 3,803,459 2.75%
Visa 56,030 7,109,086 5.15%
Zoetis 58,330 4,869,388 3.53%
Total United States 76,607,709 55.46%
Total Equities 136,266,819 98.66%
Shares US$ Value %NAV
Financial Assets At Fair Value Through Profit Or Loss 136,266,819 98.66%
Cash And Bank Balances 1,923,409 1.39%
Other Net Liabilities (70,688) (0.05%)
Net Assets Attributable To Holders Of Redeemable Participating
Shares 138,119,540 100.00%
Portfolio Analysis % Total Assets
Transferable securities admitted to an official stock exchange 98.57%
OTC positions 0.00%
Other assets 1.43%
Total assets 100.00%
18
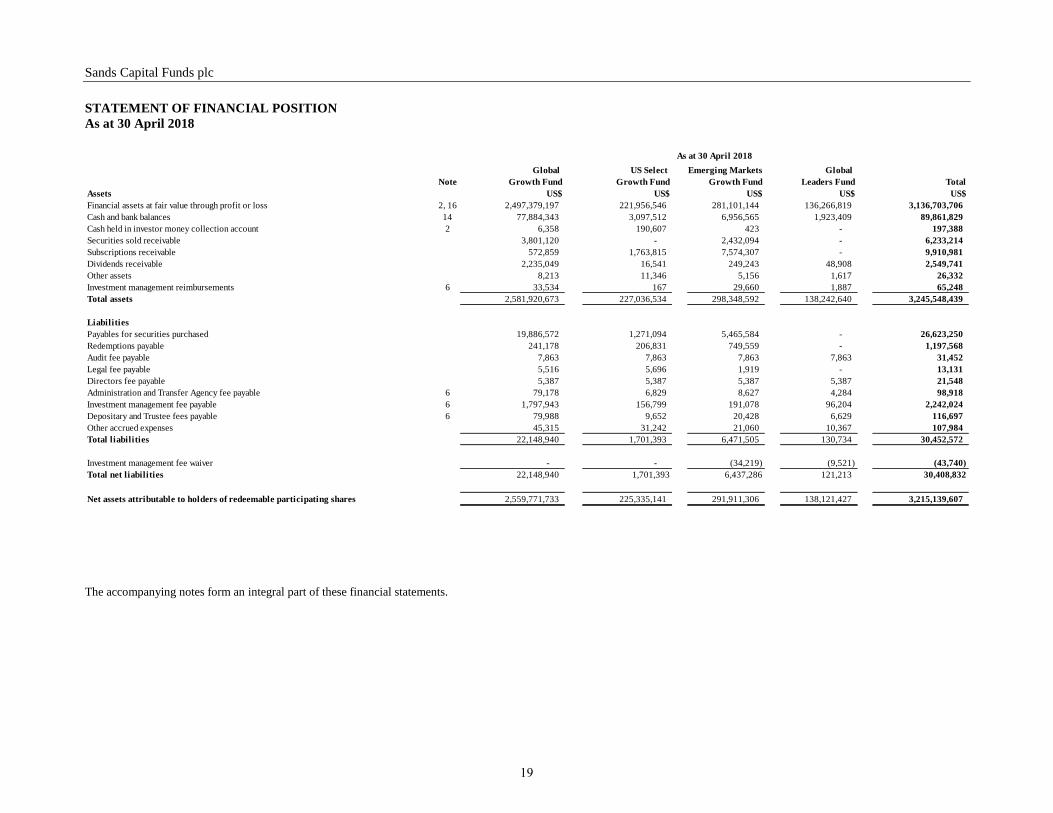
Sands Capital Funds plc
STATEMENT OF FINANCIAL POSITION
As at 30 April 2018
Global US Select Emerging Markets Global
Note Growth Fund Growth Fund Growth Fund Leaders Fund Total
Assets US$ US$ US$ US$ US$
Financial assets at fair value through profit or loss 2, 16 2,497,379,197 221,956,546 281,101,144 136,266,819 3,136,703,706
Cash and bank balances 14 77,884,343 3,097,512 6,956,565 1,923,409 89,861,829
Cash held in investor money collection account 2 6,358 190,607 423 - 197,388
Securities sold receivable 3,801,120 - 2,432,094 - 6,233,214
Subscriptions receivable 572,859 1,763,815 7,574,307 - 9,910,981
Dividends receivable 2,235,049 16,541 249,243 48,908 2,549,741
Other assets 8,213 11,346 5,156 1,617 26,332
Investment management reimbursements 6 33,534 167 29,660 1,887 65,248
Total assets 2,581,920,673 227,036,534 298,348,592 138,242,640 3,245,548,439
Liabilities
Payables for securities purchased 19,886,572 1,271,094 5,465,584 - 26,623,250
Redemptions payable 241,178 206,831 749,559 - 1,197,568
Audit fee payable 7,863 7,863 7,863 7,863 31,452
Legal fee payable 5,516 5,696 1,919 - 13,131
Directors fee payable 5,387 5,387 5,387 5,387 21,548
Administration and Transfer Agency fee payable 6 79,178 6,829 8,627 4,284 98,918
Investment management fee payable 6 1,797,943 156,799 191,078 96,204 2,242,024
Depositary and Trustee fees payable 6 79,988 9,652 20,428 6,629 116,697
Other accrued expenses 45,315 31,242 21,060 10,367 107,984
Total liabilities 22,148,940 1,701,393 6,471,505 130,734 30,452,572
Investment management fee waiver - - (34,219) (9,521) (43,740)
Total net liabilities 22,148,940 1,701,393 6,437,286 121,213 30,408,832
Net assets attributable to holders of redeemable participating shares 2,559,771,733 225,335,141 291,911,306 138,121,427 3,215,139,607
As at 30 April 2018
The accompanying notes form an integral part of these financial statements.
19
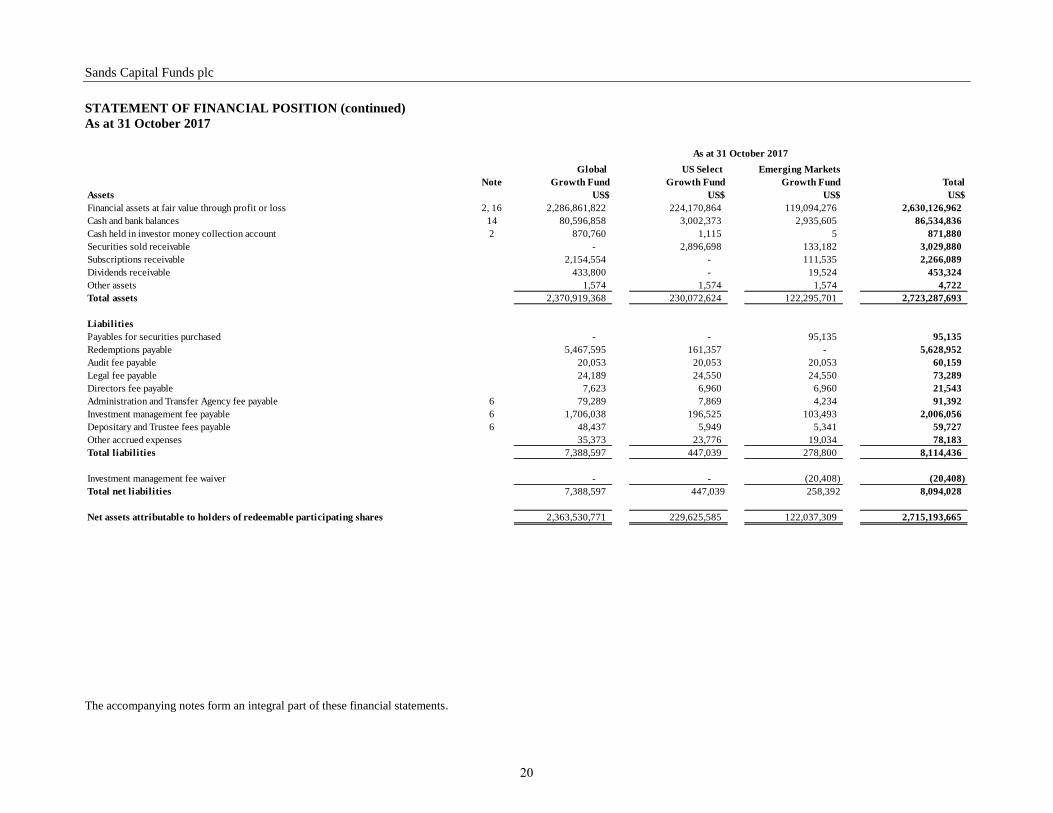
Sands Capital Funds plc
STATEMENT OF FINANCIAL POSITION (continued)
As at 31 October 2017
Global US Select Emerging Markets
Note Growth Fund Growth Fund Growth Fund Total
Assets US$ US$ US$ US$
Financial assets at fair value through profit or loss 2, 16 2,286,861,822 224,170,864 119,094,276 2,630,126,962
Cash and bank balances 14 80,596,858 3,002,373 2,935,605 86,534,836
Cash held in investor money collection account 2 870,760 1,115 5 871,880
Securities sold receivable - 2,896,698 133,182 3,029,880
Subscriptions receivable 2,154,554 - 111,535 2,266,089
Dividends receivable 433,800 - 19,524 453,324
Other assets 1,574 1,574 1,574 4,722
Total assets 2,370,919,368 230,072,624 122,295,701 2,723,287,693
Liabilities
Payables for securities purchased - - 95,135 95,135
Redemptions payable 5,467,595 161,357 - 5,628,952
Audit fee payable 20,053 20,053 20,053 60,159
Legal fee payable 24,189 24,550 24,550 73,289
Directors fee payable 7,623 6,960 6,960 21,543
Administration and Transfer Agency fee payable 6 79,289 7,869 4,234 91,392
Investment management fee payable 6 1,706,038 196,525 103,493 2,006,056
Depositary and Trustee fees payable 6 48,437 5,949 5,341 59,727
Other accrued expenses 35,373 23,776 19,034 78,183
Total liabilities 7,388,597 447,039 278,800 8,114,436
Investment management fee waiver - - (20,408) (20,408)
Total net liabilities 7,388,597 447,039 258,392 8,094,028
Net assets attributable to holders of redeemable participating shares 2,363,530,771 229,625,585 122,037,309 2,715,193,665
As at 31 October 2017
The accompanying notes form an integral part of these financial statements.
20
Sands Capital Funds plc
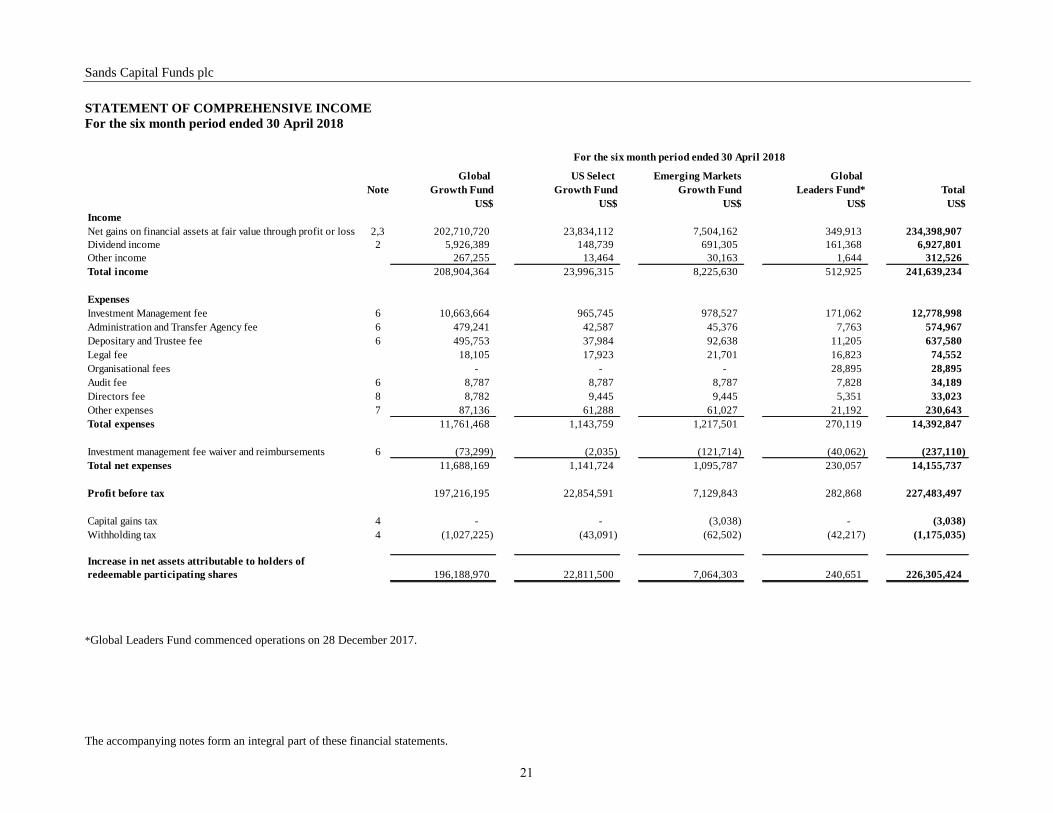
STATEMENT OF COMPREHENSIVE INCOME
For the six month period ended 30 April 2018
Global US Select Emerging Markets Global
Note Growth Fund Growth Fund Growth Fund Leaders Fund* Total
US$ US$ US$ US$ US$
Income
Net gains on financial assets at fair value through profit or loss 2,3 202,710,720 23,834,112 7,504,162 349,913 234,398,907
Dividend income 2 5,926,389 148,739 691,305 161,368 6,927,801
Other income 267,255 13,464 30,163 1,644 312,526
Total income 208,904,364 23,996,315 8,225,630 512,925 241,639,234
Expenses
Investment Management fee 6 10,663,664 965,745 978,527 171,062 12,778,998
Administration and Transfer Agency fee 6 479,241 42,587 45,376 7,763 574,967
Depositary and Trustee fee 6 495,753 37,984 92,638 11,205 637,580
Legal fee 18,105 17,923 21,701 16,823 74,552
Organisational fees - - - 28,895 28,895
Audit fee 6 8,787 8,787 8,787 7,828 34,189
Directors fee 8 8,782 9,445 9,445 5,351 33,023
Other expenses 7 87,136 61,288 61,027 21,192 230,643
Total expenses 11,761,468 1,143,759 1,217,501 270,119 14,392,847
Investment management fee waiver and reimbursements 6 (73,299) (2,035) (121,714) (40,062) (237,110)
Total net expenses 11,688,169 1,141,724 1,095,787 230,057 14,155,737
Profit before tax 197,216,195 22,854,591 7,129,843 282,868 227,483,497
Capital gains tax 4 - - (3,038) - (3,038)
Withholding tax 4 (1,027,225) (43,091) (62,502) (42,217) (1,175,035)
Increase in net assets attributable to holders of
redeemable participating shares 196,188,970 22,811,500 7,064,303 240,651 226,305,424
For the six month period ended 30 April 2018
*Global Leaders Fund commenced operations on 28 December 2017.
The accompanying notes form an integral part of these financial statements.
21
Sands Capital Funds plc
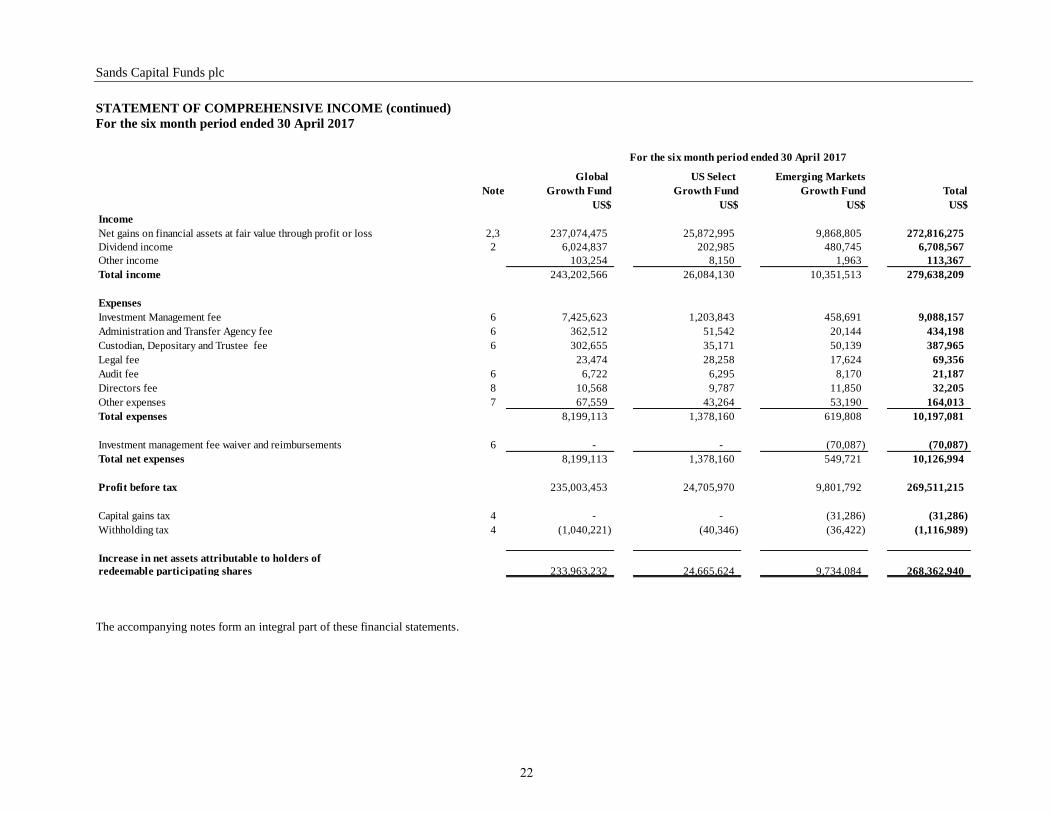
STATEMENT OF COMPREHENSIVE INCOME (continued)
For the six month period ended 30 April 2017
Global US Select Emerging Markets
Note Growth Fund Growth Fund Growth Fund Total
US$ US$ US$ US$
Income
Net gains on financial assets at fair value through profit or loss 2,3 237,074,475 25,872,995 9,868,805 272,816,275
Dividend income 2 6,024,837 202,985 480,745 6,708,567
Other income 103,254 8,150 1,963 113,367
Total income 243,202,566 26,084,130 10,351,513 279,638,209
Expenses
Investment Management fee 6 7,425,623 1,203,843 458,691 9,088,157
Administration and Transfer Agency fee 6 362,512 51,542 20,144 434,198
Custodian, Depositary and Trustee fee 6 302,655 35,171 50,139 387,965
Legal fee 23,474 28,258 17,624 69,356
Audit fee 6 6,722 6,295 8,170 21,187
Directors fee 8 10,568 9,787 11,850 32,205
Other expenses 7 67,559 43,264 53,190 164,013
Total expenses 8,199,113 1,378,160 619,808 10,197,081
Investment management fee waiver and reimbursements 6 - - (70,087) (70,087)
Total net expenses 8,199,113 1,378,160 549,721 10,126,994
Profit before tax 235,003,453 24,705,970 9,801,792 269,511,215
Capital gains tax 4 - - (31,286) (31,286)
Withholding tax 4 (1,040,221) (40,346) (36,422) (1,116,989)
Increase in net assets attributable to holders of
redeemable participating shares 233,963,232 24,665,624 9,734,084 268,362,940
For the six month period ended 30 April 2017
The accompanying notes form an integral part of these financial statements.
22
Sands Capital Funds plc
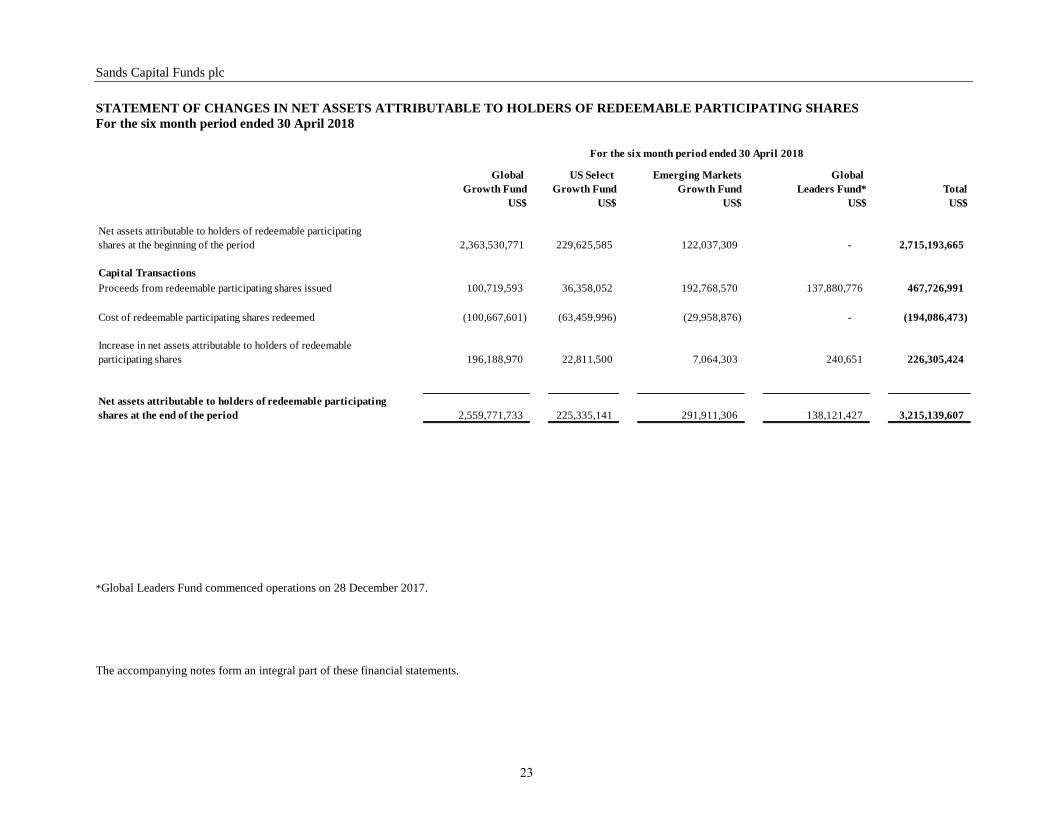
STATEMENT OF CHANGES IN NET ASSETS ATTRIBUTABLE TO HOLDERS OF REDEEMABLE PARTICIPATING SHARES
For the six month period ended 30 April 2018
Global US Select Emerging Markets Global
Growth Fund Growth Fund Growth Fund Leaders Fund* Total
US$ US$ US$ US$ US$
Net assets attributable to holders of redeemable participating
shares at the beginning of the period 2,363,530,771 229,625,585 122,037,309 - 2,715,193,665
Capital Transactions
Proceeds from redeemable participating shares issued 100,719,593 36,358,052 192,768,570 137,880,776 467,726,991
Cost of redeemable participating shares redeemed (100,667,601) (63,459,996) (29,958,876) - (194,086,473)
Increase in net assets attributable to holders of redeemable
participating shares 196,188,970 22,811,500 7,064,303 240,651 226,305,424
Net assets attributable to holders of redeemable participating
shares at the end of the period 2,559,771,733 225,335,141 291,911,306 138,121,427 3,215,139,607
For the six month period ended 30 April 2018
*Global Leaders Fund commenced operations on 28 December 2017.
The accompanying notes form an integral part of these financial statements.
23
Sands Capital Funds plc
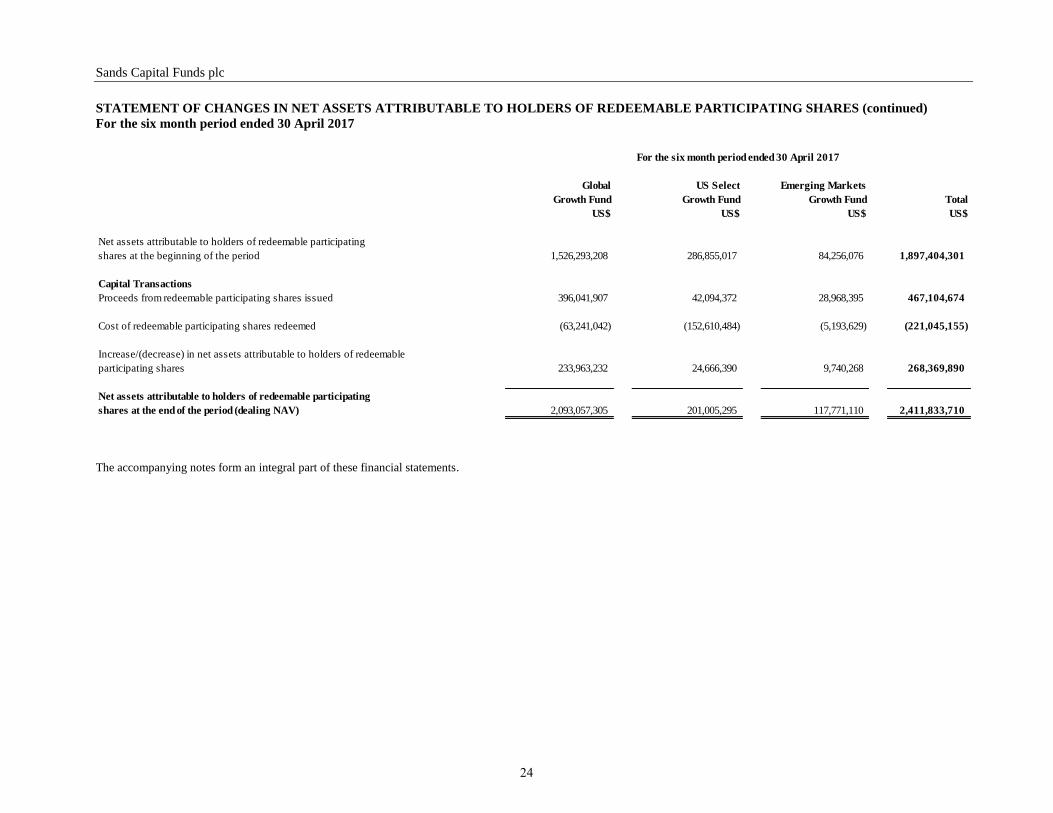
STATEMENT OF CHANGES IN NET ASSETS ATTRIBUTABLE TO HOLDERS OF REDEEMABLE PARTICIPATING SHARES (continued)
For the six month period ended 30 April 2017
Global US Select Emerging Markets
Growth Fund Growth Fund Growth Fund Total
US$ US$ US$ US$
Net assets attributable to holders of redeemable participating
shares at the beginning of the period 1,526,293,208 286,855,017 84,256,076 1,897,404,301
Capital Transactions
Proceeds from redeemable participating shares issued 396,041,907 42,094,372 28,968,395 467,104,674
Cost of redeemable participating shares redeemed (63,241,042) (152,610,484) (5,193,629) (221,045,155)
Increase/(decrease) in net assets attributable to holders of redeemable
participating shares 233,963,232 24,666,390 9,740,268 268,369,890
Net assets attributable to holders of redeemable participating
shares at the end of the period (dealing NAV) 2,093,057,305 201,005,295 117,771,110 2,411,833,710
For the six month period ended 30 April 2017
The accompanying notes form an integral part of these financial statements.
24
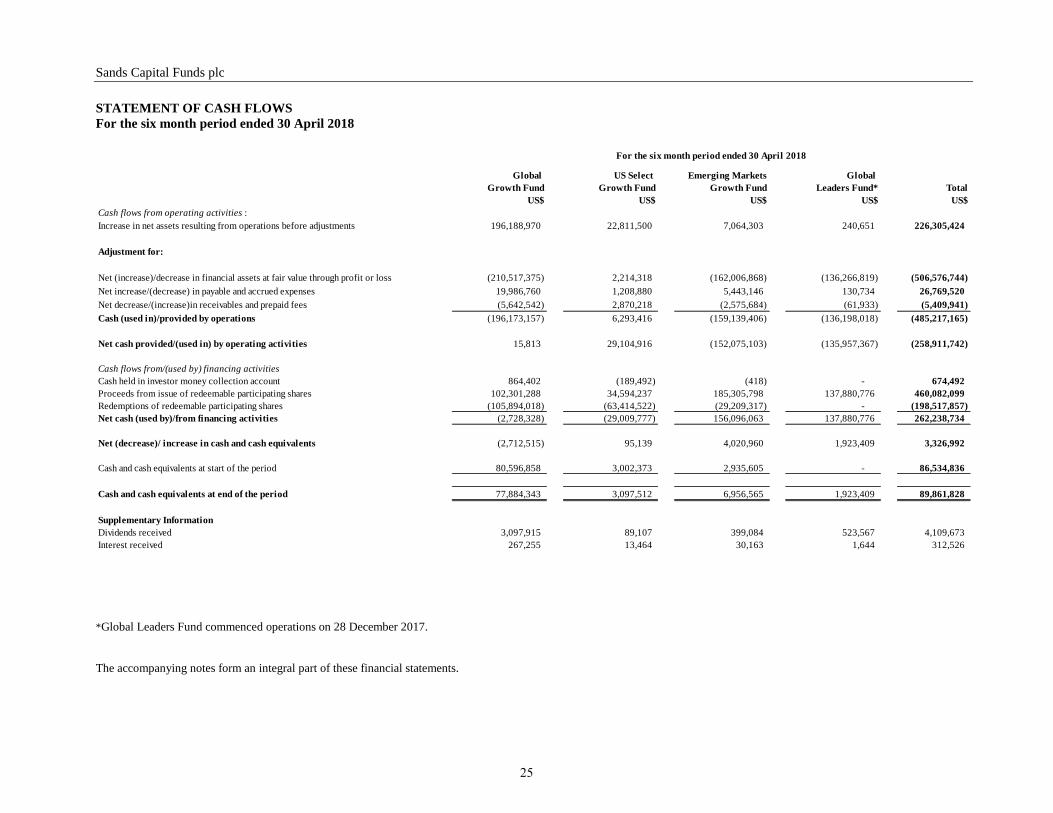
Sands Capital Funds plc
STATEMENT OF CASH FLOWS
For the six month period ended 30 April 2018
Global US Select Emerging Markets Global
Growth Fund Growth Fund Growth Fund Leaders Fund* Total
US$ US$ US$ US$ US$
Cash flows from operating activities :
Increase in net assets resulting from operations before adjustments 196,188,970 22,811,500 7,064,303 240,651 226,305,424
Adjustment for:
Net (increase)/decrease in financial assets at fair value through profit or loss (210,517,375) 2,214,318 (162,006,868) (136,266,819) (506,576,744)
Net increase/(decrease) in payable and accrued expenses 19,986,760 1,208,880 5,443,146 130,734 26,769,520
Net decrease/(increase)in receivables and prepaid fees (5,642,542) 2,870,218 (2,575,684) (61,933) (5,409,941)
Cash (used in)/provided by operations (196,173,157) 6,293,416 (159,139,406) (136,198,018) (485,217,165)
Net cash provided/(used in) by operating activities 15,813 29,104,916 (152,075,103) (135,957,367) (258,911,742)
Cash flows from/(used by) financing activities
Cash held in investor money collection account 864,402 (189,492) (418) - 674,492
Proceeds from issue of redeemable participating shares 102,301,288 34,594,237 185,305,798 137,880,776 460,082,099
Redemptions of redeemable participating shares (105,894,018) (63,414,522) (29,209,317) - (198,517,857)
Net cash (used by)/from financing activities (2,728,328) (29,009,777) 156,096,063 137,880,776 262,238,734
Net (decrease)/ increase in cash and cash equivalents (2,712,515) 95,139 4,020,960 1,923,409 3,326,992
Cash and cash equivalents at start of the period 80,596,858 3,002,373 2,935,605 - 86,534,836
Cash and cash equivalents at end of the period 77,884,343 3,097,512 6,956,565 1,923,409 89,861,828
Supplementary Information
Dividends received 3,097,915 89,107 399,084 523,567 4,109,673
Interest received 267,255 13,464 30,163 1,644 312,526
For the six month period ended 30 April 2018
*Global Leaders Fund commenced operations on 28 December 2017.
The accompanying notes form an integral part of these financial statements.
25
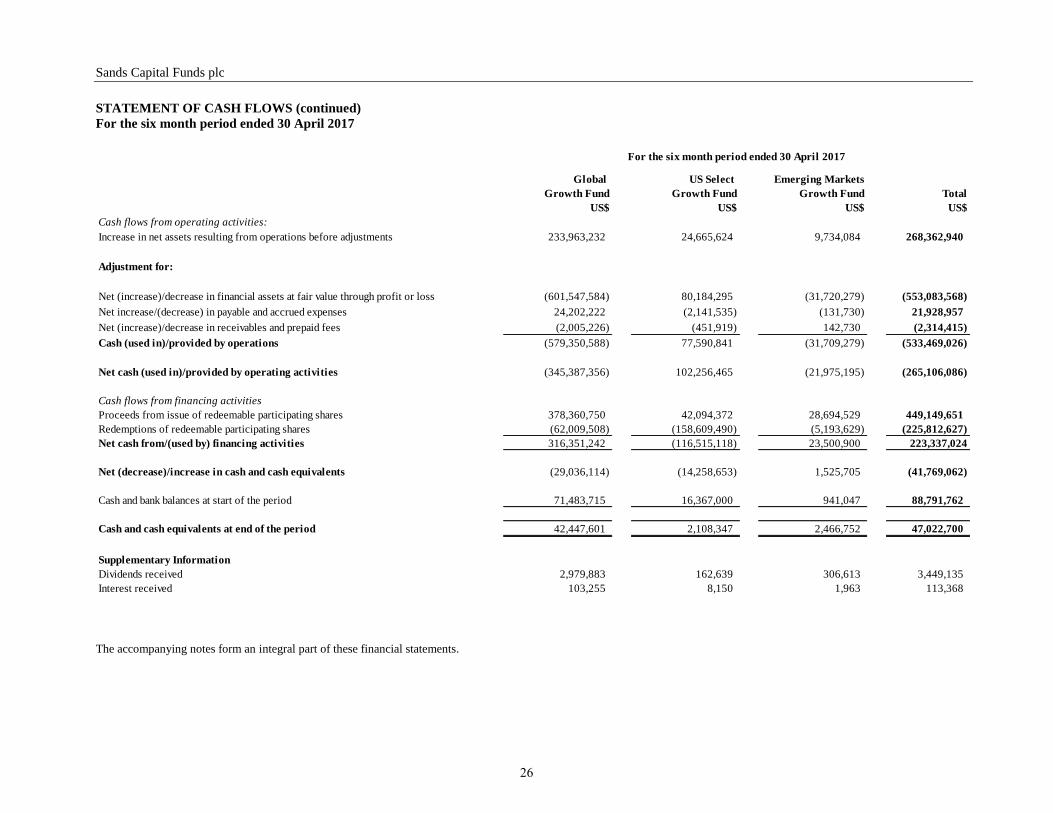
Sands Capital Funds plc
STATEMENT OF CASH FLOWS (continued)
For the six month period ended 30 April 2017
Global US Select Emerging Markets
Growth Fund Growth Fund Growth Fund Total
US$ US$ US$ US$
Cash flows from operating activities:
Increase in net assets resulting from operations before adjustments 233,963,232 24,665,624 9,734,084 268,362,940
Adjustment for:
Net (increase)/decrease in financial assets at fair value through profit or loss (601,547,584) 80,184,295 (31,720,279) (553,083,568)
Net increase/(decrease) in payable and accrued expenses 24,202,222 (2,141,535) (131,730) 21,928,957
Net (increase)/decrease in receivables and prepaid fees (2,005,226) (451,919) 142,730 (2,314,415)
Cash (used in)/provided by operations (579,350,588) 77,590,841 (31,709,279) (533,469,026)
Net cash (used in)/provided by operating activities (345,387,356) 102,256,465 (21,975,195) (265,106,086)
Cash flows from financing activities
Proceeds from issue of redeemable participating shares 378,360,750 42,094,372 28,694,529 449,149,651
Redemptions of redeemable participating shares (62,009,508) (158,609,490) (5,193,629) (225,812,627)
Net cash from/(used by) financing activities 316,351,242 (116,515,118) 23,500,900 223,337,024
Net (decrease)/increase in cash and cash equivalents (29,036,114) (14,258,653) 1,525,705 (41,769,062)
Cash and bank balances at start of the period 71,483,715 16,367,000 941,047 88,791,762
Cash and cash equivalents at end of the period 42,447,601 2,108,347 2,466,752 47,022,700
Supplementary Information
Dividends received 2,979,883 162,639 306,613 3,449,135
Interest received 103,255 8,150 1,963 113,368
For the six month period ended 30 April 2017
The accompanying notes form an integral part of these financial statements.
26
Sands Capital Funds plc
NOTES TO THE FINANCIAL STATEMENTS
For the six month period ended 30 April 2018
1. Organisation
Sands Capital Funds plc (the “Company”) was incorporated on 13 May 2010 and is an investment company
established as an open-ended umbrella fund with variable capital under the laws of Ireland as a public limited
company pursuant to the Companies Act 2014 (as amended) (the “Act”) and the European Communities (Undertaking
for Collective Investment in Transferable Securities) Regulations 2011 (S.I. No 352 of 2011), as amended (the
“UCITS Regulations”) and the Central Bank (Supervision and Enforcement) Act 2013 (Section 48(1)) (Undertakings
for Collective Investments in Transferable Securities) Regulations 2015, as amended (the “Central Bank UCITS
Regulations”) and has been authorised by the Central Bank of Ireland as a UCITS. Notwithstanding the segregation of
assets and liabilities between the sub-funds, the Company is a single legal entity and no sub-fund constitutes a legal
entity separate from the Company itself. The Company’s registration number is 484381.
The Company currently has four active sub-funds, Sands Capital Global Growth Fund (the “Global Growth Fund”),
Sands Capital US Select Growth Fund (the “US Select Growth Fund”), Sands Capital Emerging Markets Growth
Fund (the “Emerging Markets Growth Fund”) and Sands Capital Global Leaders Fund (the “Global Leader Fund”)
(each a “Sub-Fund”, collectively the “Sub-Funds”). The Global Growth Fund launched on 30 June 2010, the US
Select Growth Fund launched on 11 December 2012, the Emerging Markets Growth Fund launched on 31 October
2013 and the Global Leaders Fund launched on 28 December 2017.
Additional sub-funds may be added to the Company by the Directors from time to time with the prior approval of the
Central Bank of Ireland, each with a separate investment objective and policies. The Company may issue shares of
more than one class in each sub-fund.
The Company has appointed Sands Capital Management, LLC as the Investment Manager. The investment objective and policy of each Sub-Fund is as follows: Sands Capital Global Growth Fund The investment objective of the Sub-Fund is to achieve long-term capital appreciation.
The Sub-Fund will seek to achieve its objective by investing primarily in a portfolio of equity securities and equity
related securities quoted or traded on regulated markets on a global basis, including equity securities issued by
companies located in developed and emerging markets.
Sands Capital US Select Growth Fund The investment objective of the Sub-Fund is to achieve long-term capital appreciation.
The Sub-Fund will seek to achieve its objective by investing primarily in a portfolio of equity securities and equity
related securities quoted or traded on regulated markets in the United States. Sands Capital Emerging Markets Growth Fund The investment objective of the Sub-Fund is to achieve long-term capital appreciation.
The Sub-Fund will seek to achieve its objective by investing primarily in a portfolio of equity securities and equity
related securities issued by companies that are domiciled, listed, or that derive over half their revenues or profits from
countries classified as emerging and frontier market countries by MSCI.
Sands Capital Global Leaders Fund The investment objective of the Sub-Fund is to achieve long-term capital appreciation.
The Sub-Fund will seek to achieve its objective by investing primarily in a portfolio of equity securities and equity
related securities quoted or traded on regulated markets on a global basis, including equity securities issued by
companies located in developed and emerging markets.
27
Sands Capital Funds plc
NOTES TO THE FINANCIAL STATEMENTS
For the six month period ended 30 April 2018
2. Accounting Policies
Statement of compliance and basis of preparation
The condensed interim report and unaudited financial statements for the financial period ended 30 April 2018 have
been prepared in accordance with IAS 34 - Interim Financial Reporting, the UCITS Regulations and the Central Bank
UCITS Regulations. The condensed interim report and unaudited financial statements should be read in conjunction
with the annual financial statements for the financial year ended 31 October 2017 which have been prepared in
accordance with International Financial Reporting Standards ("IFRS") as adopted by the European Union and in
accordance with Irish Statute comprising the Companies Act 2014, the UCITS Regulations and the Central Bank
UCITS Regulations.
The accounting policies applied are consistent with those of the annual financial statements for the year ended 31
October 2017, as described in those financial statements.
The preparation of financial statements in conformity with IFRS requires the use of certain critical accounting
estimates. It also requires the Directors to exercise its judgement in the process of applying the Company’s accounting
policies.
The unaudited semi-annual condensed financial statements are prepared in US Dollars (“US$”), the functional
currency of the Company.
28
Sands Capital Funds plc
NOTES TO THE FINANCIAL STATEMENTS
For the six month period ended 30 April 2018
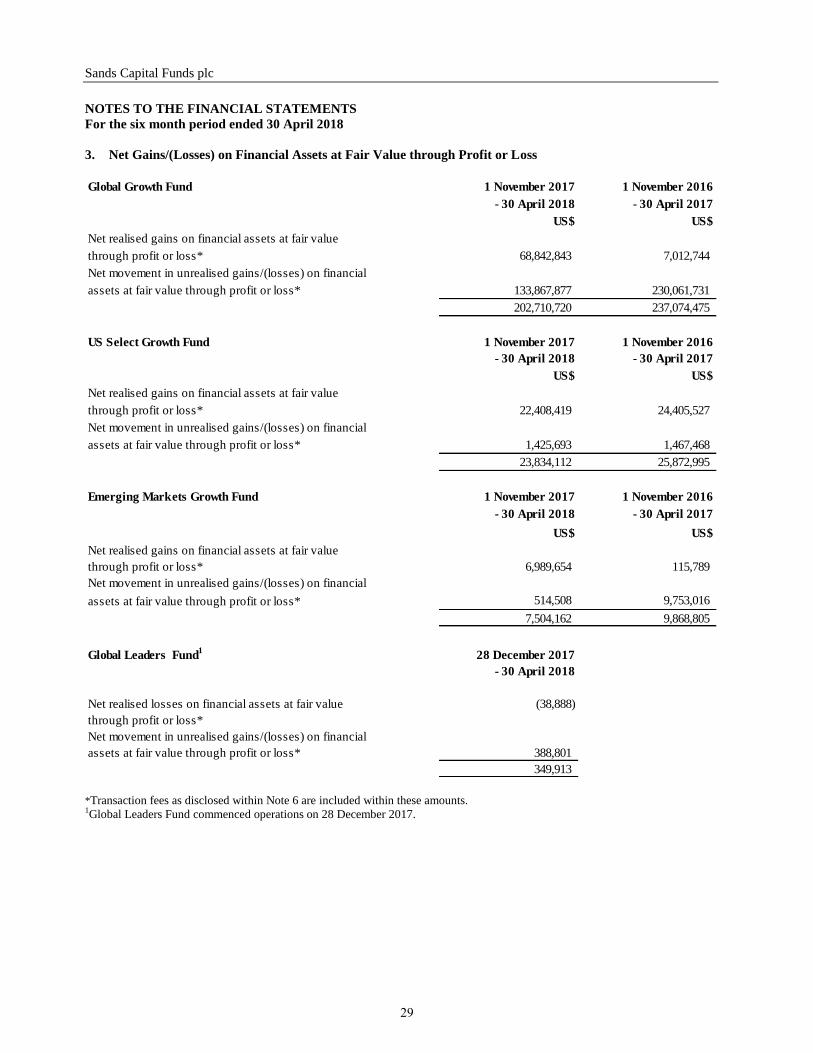
3. Net Gains/(Losses) on Financial Assets at Fair Value through Profit or Loss
Global Growth Fund 1 November 2017 1 November 2016
- 30 April 2018 - 30 April 2017
US$ US$
Net realised gains on financial assets at fair value
through profit or loss* 68,842,843 7,012,744
Net movement in unrealised gains/(losses) on financial
assets at fair value through profit or loss* 133,867,877 230,061,731
202,710,720 237,074,475
US Select Growth Fund 1 November 2017 1 November 2016
- 30 April 2018 - 30 April 2017
US$ US$
Net realised gains on financial assets at fair value
through profit or loss* 22,408,419 24,405,527
Net movement in unrealised gains/(losses) on financial
assets at fair value through profit or loss* 1,425,693 1,467,468
23,834,112 25,872,995
Emerging Markets Growth Fund 1 November 2017 1 November 2016
- 30 April 2018 - 30 April 2017
US$ US$
Net realised gains on financial assets at fair value
through profit or loss* 6,989,654 115,789
Net movement in unrealised gains/(losses) on financial
assets at fair value through profit or loss* 514,508 9,753,016
7,504,162 9,868,805
Global Leaders Fund1
28 December 2017
- 30 April 2018
Net realised losses on financial assets at fair value (38,888)
through profit or loss*
Net movement in unrealised gains/(losses) on financial
assets at fair value through profit or loss* 388,801
349,913
*Transaction fees as disclosed within Note 6 are included within these amounts. 1Global Leaders Fund commenced operations on 28 December 2017.
29
Sands Capital Funds plc
NOTES TO THE FINANCIAL STATEMENTS
For the six month period ended 30 April 2018
4. Taxation
Under current law and practice the Company qualifies as an investment undertaking as defined in Section 739B of the
Taxes Consolidation Act, 1997, as amended. On that basis, it is not chargeable to Irish tax on its income or gains.
However, Irish tax may arise on the happening of a "chargeable event". A chargeable event includes any distribution
payments to shareholders, any encashment, redemption, cancellation or transfer of shares and the holding of shares at
the end of each eight year period beginning with the acquisition of such shares.
No Irish tax will arise on the Company in respect of chargeable events in respect of:
(a) a shareholder who is neither Irish resident nor ordinarily resident in Ireland for tax purposes, at the time of the
chargeable event, provided appropriate valid declarations in accordance with the provisions of the Taxes
Consolidation Act, 1997, as amended, are held by the Company or the Company has been authorised by the Irish
Revenue to make gross payments in the absence of appropriate declarations; and
(b) certain exempted Irish tax resident shareholders who have provided the Company with the necessary signed
statutory declarations.
The Finance Act 2010 provides that the Revenue Commissioners may grant approval for investment funds marketed
outside of Ireland to make payments to non-resident investors without deduction of Irish tax where no relevant
declaration is in place, subject to meeting the “equivalent measures”. A fund wishing to receive approval must apply
in writing to the Revenue Commissioners, confirming compliance with the relevant conditions.
Dividends, interest and capital gains (if any) received on investments made by the Company may be subject to taxes
imposed by the country from which the investment income/gains are received and such taxes may not be recoverable
by the Company or its shareholders.
A new reporting fund regime was introduced by the United Kingdom HM Revenue and Customs with effect from 1
December 2009, which applies in the case of the Company. In accordance with the reporting fund regime, each share
class is viewed as a separate “offshore fund” for UK tax purposes. The reporting regime permits an offshore fund to
seek advance approval from HM Revenue and Customs to be treated as a reporting fund. Once an offshore fund has
been granted “reporting fund” status it maintains that status for so long as it continues to satisfy the conditions to be a
“reporting fund” without a requirement to apply for further certification by HM Revenue and Customs.
Applications for relevant share classes of the Company to be treated as “reporting funds” have been approved by HM
Revenue and Customs and the relevant share classes will be treated as reporting funds for the period ended 30 April
2018.
5. Share Capital
Authorised
The authorised share capital of the Company is two Subscriber Shares of US$1.00 each and 5,000,000,000,000
participating shares of no par value. Subscriber shares
The two Subscriber Shares are held by nominees on behalf of Sands Capital Management, LLC. The subscriber shares
do not form part of the net asset value of the Company and are thus disclosed in the financial statements by way of
this note only. In the opinion of the Directors, this disclosure reflects the nature of the Company’s business as an
investment company.
30
Sands Capital Funds plc
NOTES TO THE FINANCIAL STATEMENTS
For the six month period ended 30 April 2018
5. Share Capital (continued)
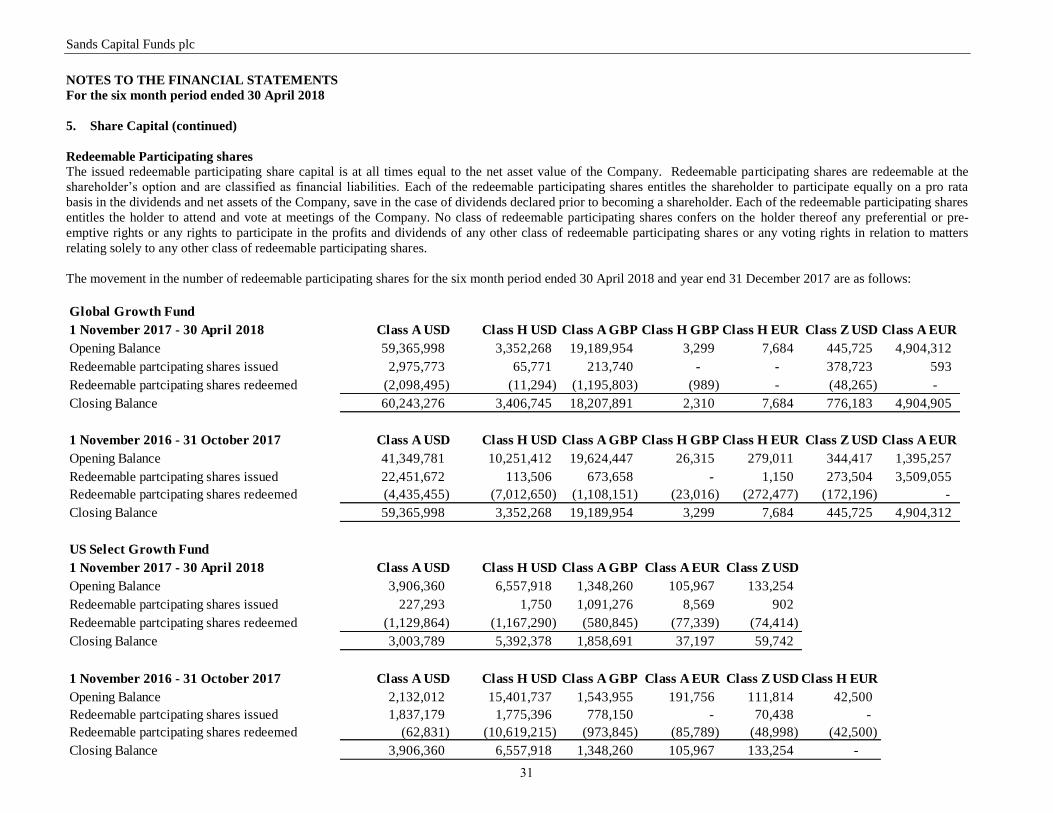
Redeemable Participating shares
The issued redeemable participating share capital is at all times equal to the net asset value of the Company. Redeemable participating shares are redeemable at the
shareholder’s option and are classified as financial liabilities. Each of the redeemable participating shares entitles the shareholder to participate equally on a pro rata
basis in the dividends and net assets of the Company, save in the case of dividends declared prior to becoming a shareholder. Each of the redeemable participating shares
entitles the holder to attend and vote at meetings of the Company. No class of redeemable participating shares confers on the holder thereof any preferential or pre-
emptive rights or any rights to participate in the profits and dividends of any other class of redeemable participating shares or any voting rights in relation to matters
relating solely to any other class of redeemable participating shares.
The movement in the number of redeemable participating shares for the six month period ended 30 April 2018 and year end 31 December 2017 are as follows:
Global Growth Fund
1 November 2017 - 30 April 2018 Class A USD Class H USD Class A GBP Class H GBP Class H EUR Class Z USD Class A EUR
Opening Balance 59,365,998 3,352,268 19,189,954 3,299 7,684 445,725 4,904,312
Redeemable partcipating shares issued 2,975,773 65,771 213,740 - - 378,723 593
Redeemable partcipating shares redeemed (2,098,495) (11,294) (1,195,803) (989) - (48,265) -
Closing Balance 60,243,276 3,406,745 18,207,891 2,310 7,684 776,183 4,904,905
1 November 2016 - 31 October 2017 Class A USD Class H USD Class A GBP Class H GBP Class H EUR Class Z USD Class A EUR
Opening Balance 41,349,781 10,251,412 19,624,447 26,315 279,011 344,417 1,395,257
Redeemable partcipating shares issued 22,451,672 113,506 673,658 - 1,150 273,504 3,509,055
Redeemable partcipating shares redeemed (4,435,455) (7,012,650) (1,108,151) (23,016) (272,477) (172,196) -
Closing Balance 59,365,998 3,352,268 19,189,954 3,299 7,684 445,725 4,904,312
US Select Growth Fund
1 November 2017 - 30 April 2018 Class A USD Class H USD Class A GBP Class A EUR Class Z USD
Opening Balance 3,906,360 6,557,918 1,348,260 105,967 133,254
Redeemable partcipating shares issued 227,293 1,750 1,091,276 8,569 902
Redeemable partcipating shares redeemed (1,129,864) (1,167,290) (580,845) (77,339) (74,414)
Closing Balance 3,003,789 5,392,378 1,858,691 37,197 59,742
1 November 2016 - 31 October 2017 Class A USD Class H USD Class A GBP Class A EUR Class Z USD Class H EUR
Opening Balance 2,132,012 15,401,737 1,543,955 191,756 111,814 42,500
Redeemable partcipating shares issued 1,837,179 1,775,396 778,150 - 70,438 -
Redeemable partcipating shares redeemed (62,831) (10,619,215) (973,845) (85,789) (48,998) (42,500)
Closing Balance 3,906,360 6,557,918 1,348,260 105,967 133,254 - 31
Sands Capital Funds plc
NOTES TO THE FINANCIAL STATEMENTS
For the six month period ended 30 April 2018
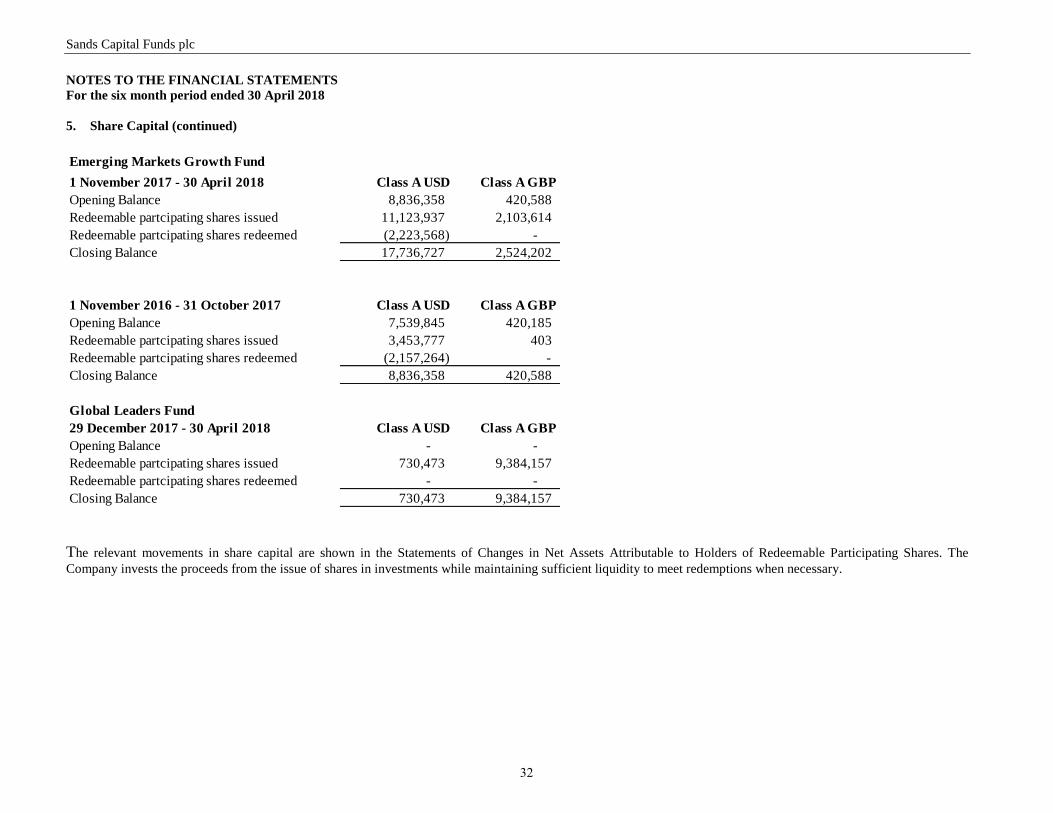
5. Share Capital (continued)
Emerging Markets Growth Fund
1 November 2017 - 30 April 2018 Class A USD Class A GBP
Opening Balance 8,836,358 420,588
Redeemable partcipating shares issued 11,123,937 2,103,614
Redeemable partcipating shares redeemed (2,223,568) -
Closing Balance 17,736,727 2,524,202
1 November 2016 - 31 October 2017 Class A USD Class A GBP
Opening Balance 7,539,845 420,185
Redeemable partcipating shares issued 3,453,777 403
Redeemable partcipating shares redeemed (2,157,264) -
Closing Balance 8,836,358 420,588
Global Leaders Fund
29 December 2017 - 30 April 2018 Class A USD Class A GBP
Opening Balance - -
Redeemable partcipating shares issued 730,473 9,384,157
Redeemable partcipating shares redeemed - -
Closing Balance 730,473 9,384,157
The relevant movements in share capital are shown in the Statements of Changes in Net Assets Attributable to Holders of Redeemable Participating Shares. The
Company invests the proceeds from the issue of shares in investments while maintaining sufficient liquidity to meet redemptions when necessary.
32
Sands Capital Funds plc
NOTES TO THE FINANCIAL STATEMENTS
For the six month period ended 30 April 2018
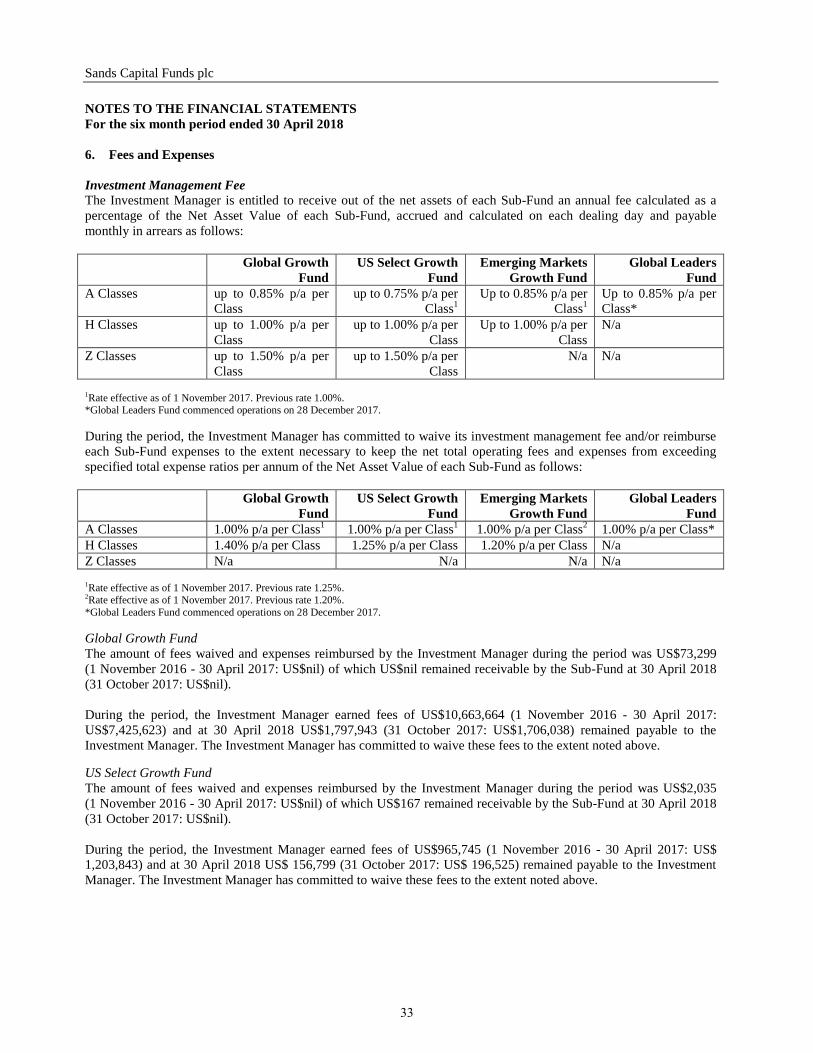
6. Fees and Expenses
Investment Management Fee The Investment Manager is entitled to receive out of the net assets of each Sub-Fund an annual fee calculated as a
percentage of the Net Asset Value of each Sub-Fund, accrued and calculated on each dealing day and payable
monthly in arrears as follows:
Global Growth
Fund
US Select Growth
Fund
Emerging Markets
Growth Fund
Global Leaders
Fund
A Classes up to 0.85% p/a per
Class
up to 0.75% p/a per
Class1
Up to 0.85% p/a per
Class1
Up to 0.85% p/a per
Class*
H Classes up to 1.00% p/a per
Class
up to 1.00% p/a per
Class
Up to 1.00% p/a per
Class
N/a
Z Classes up to 1.50% p/a per
Class
up to 1.50% p/a per
Class
N/a N/a
1Rate effective as of 1 November 2017. Previous rate 1.00%. *Global Leaders Fund commenced operations on 28 December 2017.
During the period, the Investment Manager has committed to waive its investment management fee and/or reimburse
each Sub-Fund expenses to the extent necessary to keep the net total operating fees and expenses from exceeding
specified total expense ratios per annum of the Net Asset Value of each Sub-Fund as follows:
Global Growth
Fund
US Select Growth
Fund
Emerging Markets
Growth Fund
Global Leaders
Fund
A Classes 1.00% p/a per Class1 1.00% p/a per Class
1 1.00% p/a per Class
2 1.00% p/a per Class*
H Classes 1.40% p/a per Class 1.25% p/a per Class 1.20% p/a per Class N/a
Z Classes N/a N/a N/a N/a 1Rate effective as of 1 November 2017. Previous rate 1.25%. 2Rate effective as of 1 November 2017. Previous rate 1.20%.
*Global Leaders Fund commenced operations on 28 December 2017.
Global Growth Fund
The amount of fees waived and expenses reimbursed by the Investment Manager during the period was US$73,299
(1 November 2016 - 30 April 2017: US$nil) of which US$nil remained receivable by the Sub-Fund at 30 April 2018
(31 October 2017: US$nil).
During the period, the Investment Manager earned fees of US$10,663,664 (1 November 2016 - 30 April 2017:
US$7,425,623) and at 30 April 2018 US$1,797,943 (31 October 2017: US$1,706,038) remained payable to the
Investment Manager. The Investment Manager has committed to waive these fees to the extent noted above.
US Select Growth Fund
The amount of fees waived and expenses reimbursed by the Investment Manager during the period was US$2,035
(1 November 2016 - 30 April 2017: US$nil) of which US$167 remained receivable by the Sub-Fund at 30 April 2018
(31 October 2017: US$nil).
During the period, the Investment Manager earned fees of US$965,745 (1 November 2016 - 30 April 2017: US$
1,203,843) and at 30 April 2018 US$ 156,799 (31 October 2017: US$ 196,525) remained payable to the Investment
Manager. The Investment Manager has committed to waive these fees to the extent noted above.
33
Sands Capital Funds plc
NOTES TO THE FINANCIAL STATEMENTS
For the six month period ended 30 April 2018
6. Fees and Expenses (continued)
Investment Management Fee (continued)
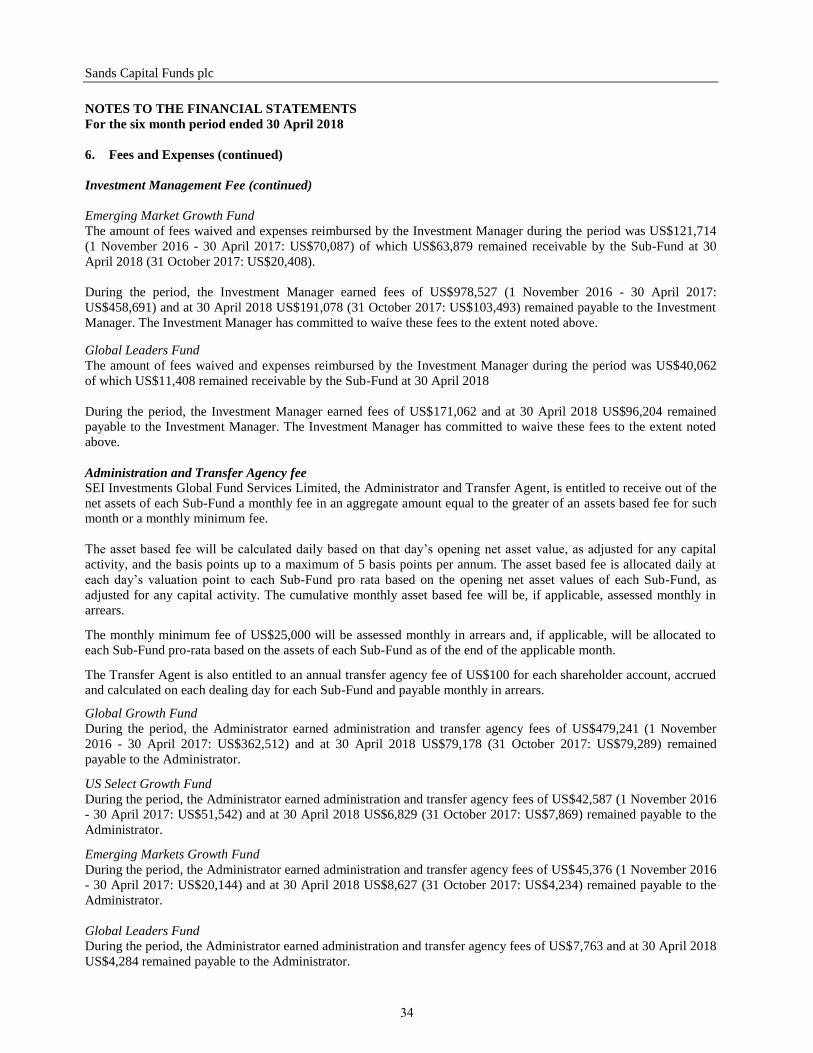
Emerging Market Growth Fund
The amount of fees waived and expenses reimbursed by the Investment Manager during the period was US$121,714
(1 November 2016 - 30 April 2017: US$70,087) of which US$63,879 remained receivable by the Sub-Fund at 30
April 2018 (31 October 2017: US$20,408).
During the period, the Investment Manager earned fees of US$978,527 (1 November 2016 - 30 April 2017:
US$458,691) and at 30 April 2018 US$191,078 (31 October 2017: US$103,493) remained payable to the Investment
Manager. The Investment Manager has committed to waive these fees to the extent noted above.
Global Leaders Fund
The amount of fees waived and expenses reimbursed by the Investment Manager during the period was US$40,062
of which US$11,408 remained receivable by the Sub-Fund at 30 April 2018
During the period, the Investment Manager earned fees of US$171,062 and at 30 April 2018 US$96,204 remained
payable to the Investment Manager. The Investment Manager has committed to waive these fees to the extent noted
above.
Administration and Transfer Agency fee
SEI Investments Global Fund Services Limited, the Administrator and Transfer Agent, is entitled to receive out of the
net assets of each Sub-Fund a monthly fee in an aggregate amount equal to the greater of an assets based fee for such
month or a monthly minimum fee.
The asset based fee will be calculated daily based on that day’s opening net asset value, as adjusted for any capital
activity, and the basis points up to a maximum of 5 basis points per annum. The asset based fee is allocated daily at
each day’s valuation point to each Sub-Fund pro rata based on the opening net asset values of each Sub-Fund, as
adjusted for any capital activity. The cumulative monthly asset based fee will be, if applicable, assessed monthly in
arrears. The monthly minimum fee of US$25,000 will be assessed monthly in arrears and, if applicable, will be allocated to
each Sub-Fund pro-rata based on the assets of each Sub-Fund as of the end of the applicable month. The Transfer Agent is also entitled to an annual transfer agency fee of US$100 for each shareholder account, accrued
and calculated on each dealing day for each Sub-Fund and payable monthly in arrears. Global Growth Fund
During the period, the Administrator earned administration and transfer agency fees of US$479,241 (1 November
2016 - 30 April 2017: US$362,512) and at 30 April 2018 US$79,178 (31 October 2017: US$79,289) remained
payable to the Administrator.
US Select Growth Fund
During the period, the Administrator earned administration and transfer agency fees of US$42,587 (1 November 2016
- 30 April 2017: US$51,542) and at 30 April 2018 US$6,829 (31 October 2017: US$7,869) remained payable to the
Administrator. Emerging Markets Growth Fund
During the period, the Administrator earned administration and transfer agency fees of US$45,376 (1 November 2016
- 30 April 2017: US$20,144) and at 30 April 2018 US$8,627 (31 October 2017: US$4,234) remained payable to the
Administrator.
Global Leaders Fund
During the period, the Administrator earned administration and transfer agency fees of US$7,763 and at 30 April 2018
US$4,284 remained payable to the Administrator.
34
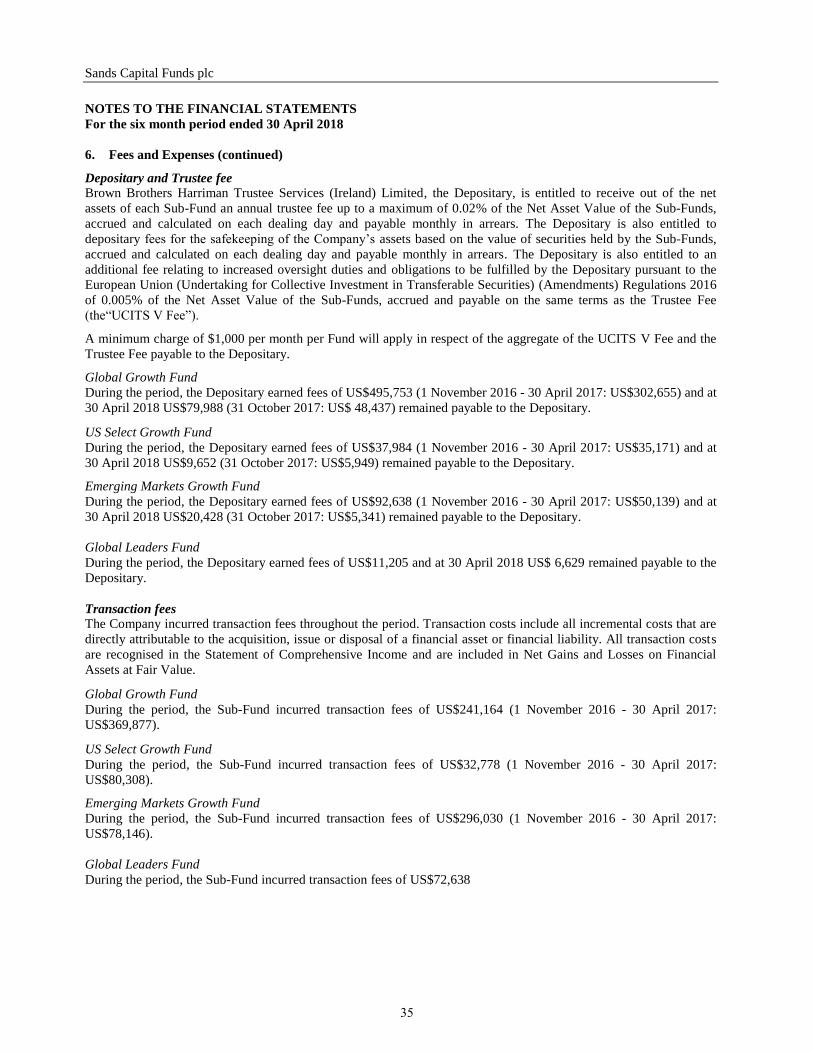
Sands Capital Funds plc
NOTES TO THE FINANCIAL STATEMENTS
For the six month period ended 30 April 2018
6. Fees and Expenses (continued) Depositary and Trustee fee
Brown Brothers Harriman Trustee Services (Ireland) Limited, the Depositary, is entitled to receive out of the net
assets of each Sub-Fund an annual trustee fee up to a maximum of 0.02% of the Net Asset Value of the Sub-Funds,
accrued and calculated on each dealing day and payable monthly in arrears. The Depositary is also entitled to
depositary fees for the safekeeping of the Company’s assets based on the value of securities held by the Sub-Funds,
accrued and calculated on each dealing day and payable monthly in arrears. The Depositary is also entitled to an
additional fee relating to increased oversight duties and obligations to be fulfilled by the Depositary pursuant to the
European Union (Undertaking for Collective Investment in Transferable Securities) (Amendments) Regulations 2016
of 0.005% of the Net Asset Value of the Sub-Funds, accrued and payable on the same terms as the Trustee Fee
(the“UCITS V Fee”). A minimum charge of $1,000 per month per Fund will apply in respect of the aggregate of the UCITS V Fee and the
Trustee Fee payable to the Depositary. Global Growth Fund
During the period, the Depositary earned fees of US$495,753 (1 November 2016 - 30 April 2017: US$302,655) and at
30 April 2018 US$79,988 (31 October 2017: US$ 48,437) remained payable to the Depositary.
US Select Growth Fund
During the period, the Depositary earned fees of US$37,984 (1 November 2016 - 30 April 2017: US$35,171) and at
30 April 2018 US$9,652 (31 October 2017: US$5,949) remained payable to the Depositary. Emerging Markets Growth Fund
During the period, the Depositary earned fees of US$92,638 (1 November 2016 - 30 April 2017: US$50,139) and at
30 April 2018 US$20,428 (31 October 2017: US$5,341) remained payable to the Depositary.
Global Leaders Fund
During the period, the Depositary earned fees of US$11,205 and at 30 April 2018 US$ 6,629 remained payable to the
Depositary.
Transaction fees
The Company incurred transaction fees throughout the period. Transaction costs include all incremental costs that are
directly attributable to the acquisition, issue or disposal of a financial asset or financial liability. All transaction costs
are recognised in the Statement of Comprehensive Income and are included in Net Gains and Losses on Financial
Assets at Fair Value.
Global Growth Fund
During the period, the Sub-Fund incurred transaction fees of US$241,164 (1 November 2016 - 30 April 2017:
US$369,877).
US Select Growth Fund
During the period, the Sub-Fund incurred transaction fees of US$32,778 (1 November 2016 - 30 April 2017:
US$80,308). Emerging Markets Growth Fund
During the period, the Sub-Fund incurred transaction fees of US$296,030 (1 November 2016 - 30 April 2017:
US$78,146).
Global Leaders Fund
During the period, the Sub-Fund incurred transaction fees of US$72,638
35
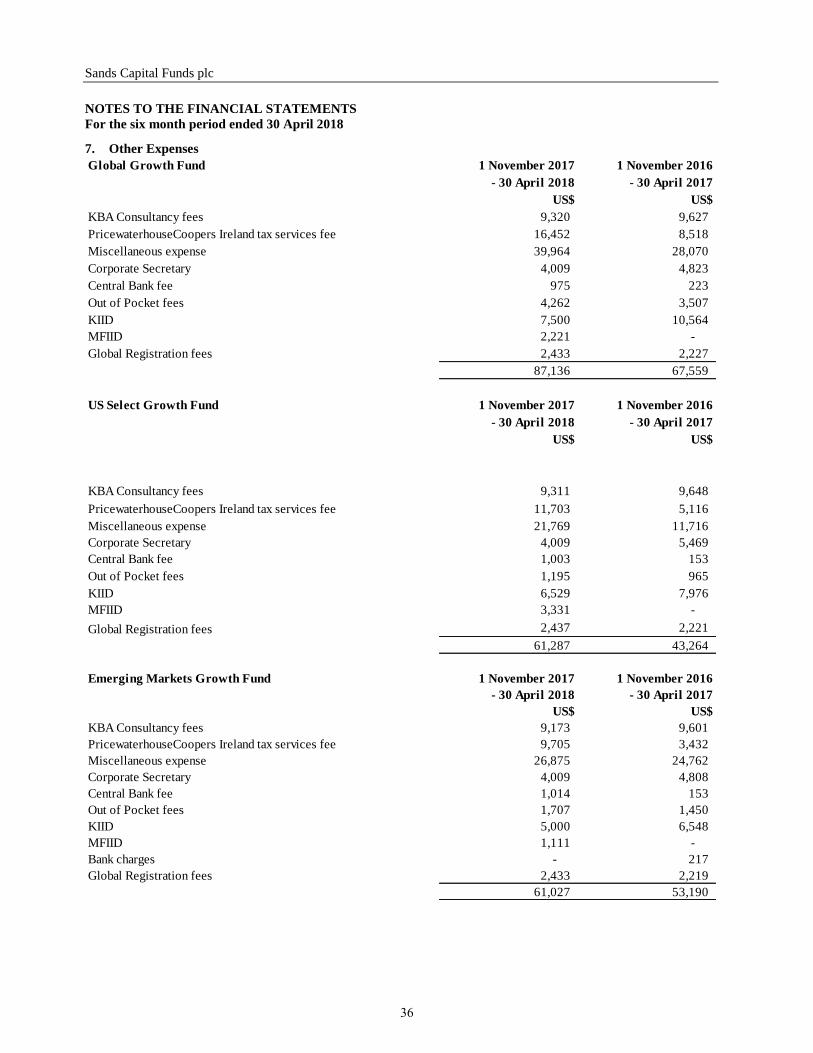
Sands Capital Funds plc
NOTES TO THE FINANCIAL STATEMENTS
For the six month period ended 30 April 2018 7. Other Expenses
Global Growth Fund 1 November 2017 1 November 2016
- 30 April 2018 - 30 April 2017
US$ US$
KBA Consultancy fees 9,320 9,627
PricewaterhouseCoopers Ireland tax services fee 16,452 8,518
Miscellaneous expense 39,964 28,070
Corporate Secretary 4,009 4,823
Central Bank fee 975 223
Out of Pocket fees 4,262 3,507
KIID 7,500 10,564
MFIID 2,221 -
Global Registration fees 2,433 2,227
87,136 67,559
US Select Growth Fund 1 November 2017 1 November 2016
- 30 April 2018 - 30 April 2017
US$ US$
KBA Consultancy fees 9,311 9,648
PricewaterhouseCoopers Ireland tax services fee 11,703 5,116
Miscellaneous expense 21,769 11,716
Corporate Secretary 4,009 5,469
Central Bank fee 1,003 153
Out of Pocket fees 1,195 965
KIID 6,529 7,976
MFIID 3,331 -
Global Registration fees 2,437 2,221
61,287 43,264
Emerging Markets Growth Fund 1 November 2017 1 November 2016
- 30 April 2018 - 30 April 2017
US$ US$
KBA Consultancy fees 9,173 9,601
PricewaterhouseCoopers Ireland tax services fee 9,705 3,432
Miscellaneous expense 26,875 24,762
Corporate Secretary 4,009 4,808
Central Bank fee 1,014 153
Out of Pocket fees 1,707 1,450
KIID 5,000 6,548
MFIID 1,111 -
Bank charges - 217
Global Registration fees 2,433 2,219
61,027 53,190
36
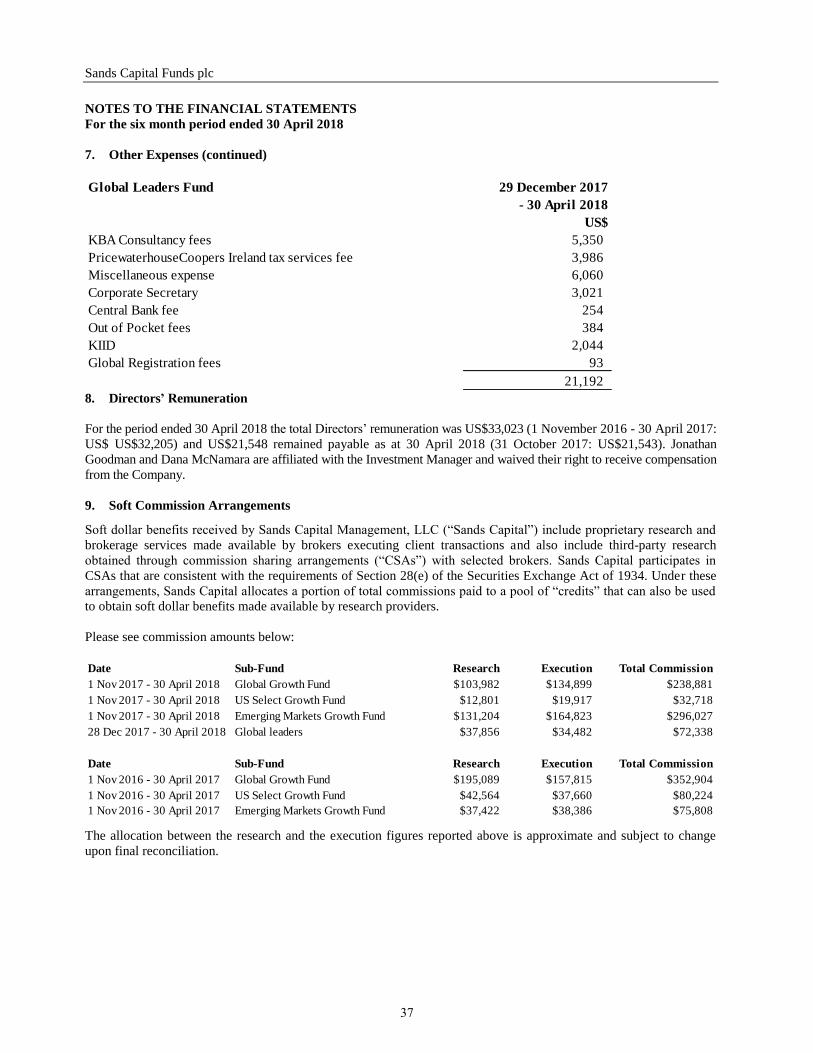
Sands Capital Funds plc
NOTES TO THE FINANCIAL STATEMENTS
For the six month period ended 30 April 2018
7. Other Expenses (continued)
Global Leaders Fund 29 December 2017
- 30 April 2018
US$
KBA Consultancy fees 5,350
PricewaterhouseCoopers Ireland tax services fee 3,986
Miscellaneous expense 6,060
Corporate Secretary 3,021
Central Bank fee 254
Out of Pocket fees 384
KIID 2,044
Global Registration fees 93
21,192 8. Directors’ Remuneration
For the period ended 30 April 2018 the total Directors’ remuneration was US$33,023 (1 November 2016 - 30 April 2017:
US$ US$32,205) and US$21,548 remained payable as at 30 April 2018 (31 October 2017: US$21,543). Jonathan
Goodman and Dana McNamara are affiliated with the Investment Manager and waived their right to receive compensation
from the Company.
9. Soft Commission Arrangements
Soft dollar benefits received by Sands Capital Management, LLC (“Sands Capital”) include proprietary research and
brokerage services made available by brokers executing client transactions and also include third-party research
obtained through commission sharing arrangements (“CSAs”) with selected brokers. Sands Capital participates in
CSAs that are consistent with the requirements of Section 28(e) of the Securities Exchange Act of 1934. Under these
arrangements, Sands Capital allocates a portion of total commissions paid to a pool of “credits” that can also be used
to obtain soft dollar benefits made available by research providers.
Please see commission amounts below:
Date Sub-Fund Research Execution Total Commission
1 Nov 2017 - 30 April 2018 Global Growth Fund $103,982 $134,899 $238,881
1 Nov 2017 - 30 April 2018 US Select Growth Fund $12,801 $19,917 $32,718
1 Nov 2017 - 30 April 2018 Emerging Markets Growth Fund $131,204 $164,823 $296,027
28 Dec 2017 - 30 April 2018 Global leaders $37,856 $34,482 $72,338
Date Sub-Fund Research Execution Total Commission
1 Nov 2016 - 30 April 2017 Global Growth Fund $195,089 $157,815 $352,904
1 Nov 2016 - 30 April 2017 US Select Growth Fund $42,564 $37,660 $80,224
1 Nov 2016 - 30 April 2017 Emerging Markets Growth Fund $37,422 $38,386 $75,808
The allocation between the research and the execution figures reported above is approximate and subject to change
upon final reconciliation.
37
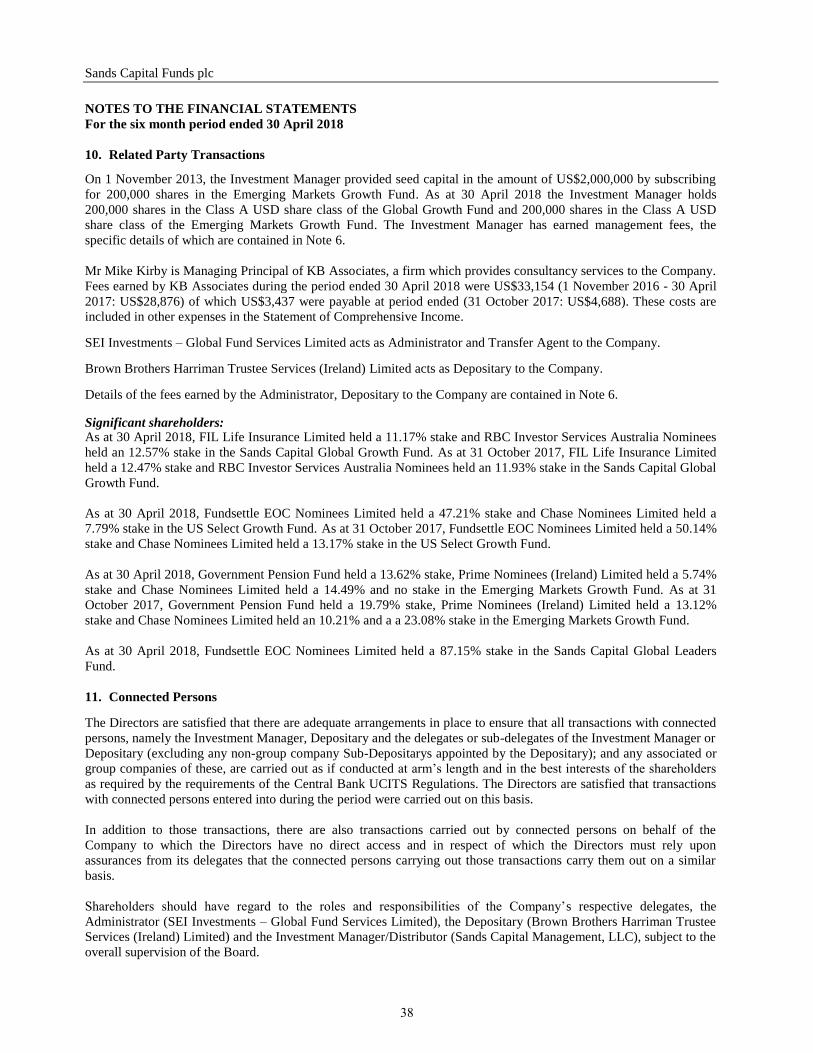
Sands Capital Funds plc
NOTES TO THE FINANCIAL STATEMENTS
For the six month period ended 30 April 2018
10. Related Party Transactions
On 1 November 2013, the Investment Manager provided seed capital in the amount of US$2,000,000 by subscribing
for 200,000 shares in the Emerging Markets Growth Fund. As at 30 April 2018 the Investment Manager holds
200,000 shares in the Class A USD share class of the Global Growth Fund and 200,000 shares in the Class A USD
share class of the Emerging Markets Growth Fund. The Investment Manager has earned management fees, the
specific details of which are contained in Note 6.
Mr Mike Kirby is Managing Principal of KB Associates, a firm which provides consultancy services to the Company.
Fees earned by KB Associates during the period ended 30 April 2018 were US$33,154 (1 November 2016 - 30 April
2017: US$28,876) of which US$3,437 were payable at period ended (31 October 2017: US$4,688). These costs are
included in other expenses in the Statement of Comprehensive Income. SEI Investments – Global Fund Services Limited acts as Administrator and Transfer Agent to the Company. Brown Brothers Harriman Trustee Services (Ireland) Limited acts as Depositary to the Company. Details of the fees earned by the Administrator, Depositary to the Company are contained in Note 6.
Significant shareholders: As at 30 April 2018, FIL Life Insurance Limited held a 11.17% stake and RBC Investor Services Australia Nominees
held an 12.57% stake in the Sands Capital Global Growth Fund. As at 31 October 2017, FIL Life Insurance Limited
held a 12.47% stake and RBC Investor Services Australia Nominees held an 11.93% stake in the Sands Capital Global
Growth Fund.
As at 30 April 2018, Fundsettle EOC Nominees Limited held a 47.21% stake and Chase Nominees Limited held a
7.79% stake in the US Select Growth Fund. As at 31 October 2017, Fundsettle EOC Nominees Limited held a 50.14%
stake and Chase Nominees Limited held a 13.17% stake in the US Select Growth Fund.
As at 30 April 2018, Government Pension Fund held a 13.62% stake, Prime Nominees (Ireland) Limited held a 5.74%
stake and Chase Nominees Limited held a 14.49% and no stake in the Emerging Markets Growth Fund. As at 31
October 2017, Government Pension Fund held a 19.79% stake, Prime Nominees (Ireland) Limited held a 13.12%
stake and Chase Nominees Limited held an 10.21% and a a 23.08% stake in the Emerging Markets Growth Fund.
As at 30 April 2018, Fundsettle EOC Nominees Limited held a 87.15% stake in the Sands Capital Global Leaders
Fund.
11. Connected Persons The Directors are satisfied that there are adequate arrangements in place to ensure that all transactions with connected
persons, namely the Investment Manager, Depositary and the delegates or sub-delegates of the Investment Manager or
Depositary (excluding any non-group company Sub-Depositarys appointed by the Depositary); and any associated or
group companies of these, are carried out as if conducted at arm’s length and in the best interests of the shareholders
as required by the requirements of the Central Bank UCITS Regulations. The Directors are satisfied that transactions
with connected persons entered into during the period were carried out on this basis.
In addition to those transactions, there are also transactions carried out by connected persons on behalf of the
Company to which the Directors have no direct access and in respect of which the Directors must rely upon
assurances from its delegates that the connected persons carrying out those transactions carry them out on a similar
basis.
Shareholders should have regard to the roles and responsibilities of the Company’s respective delegates, the
Administrator (SEI Investments – Global Fund Services Limited), the Depositary (Brown Brothers Harriman Trustee
Services (Ireland) Limited) and the Investment Manager/Distributor (Sands Capital Management, LLC), subject to the
overall supervision of the Board.
38
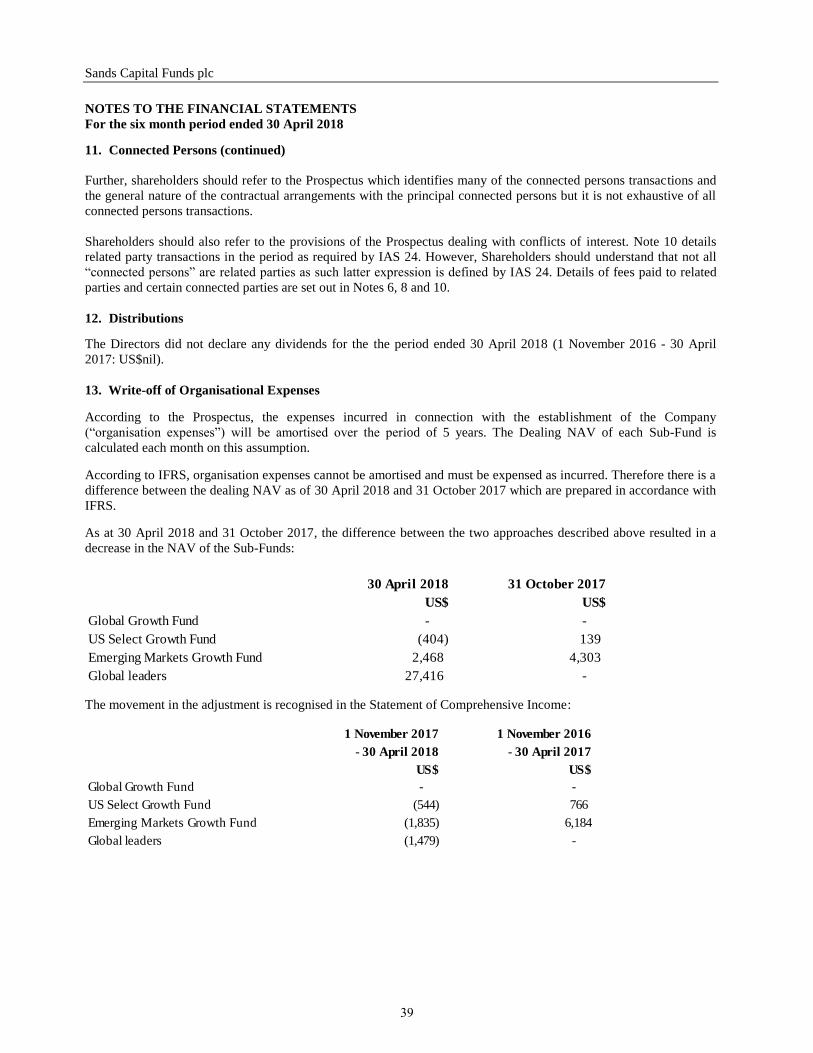
Sands Capital Funds plc
NOTES TO THE FINANCIAL STATEMENTS
For the six month period ended 30 April 2018 11. Connected Persons (continued)
Further, shareholders should refer to the Prospectus which identifies many of the connected persons transactions and
the general nature of the contractual arrangements with the principal connected persons but it is not exhaustive of all
connected persons transactions.
Shareholders should also refer to the provisions of the Prospectus dealing with conflicts of interest. Note 10 details
related party transactions in the period as required by IAS 24. However, Shareholders should understand that not all
“connected persons” are related parties as such latter expression is defined by IAS 24. Details of fees paid to related
parties and certain connected parties are set out in Notes 6, 8 and 10.
12. Distributions The Directors did not declare any dividends for the the period ended 30 April 2018 (1 November 2016 - 30 April
2017: US$nil).
13. Write-off of Organisational Expenses According to the Prospectus, the expenses incurred in connection with the establishment of the Company
(“organisation expenses”) will be amortised over the period of 5 years. The Dealing NAV of each Sub-Fund is
calculated each month on this assumption. According to IFRS, organisation expenses cannot be amortised and must be expensed as incurred. Therefore there is a
difference between the dealing NAV as of 30 April 2018 and 31 October 2017 which are prepared in accordance with
IFRS. As at 30 April 2018 and 31 October 2017, the difference between the two approaches described above resulted in a
decrease in the NAV of the Sub-Funds:
30 April 2018 31 October 2017
US$ US$
Global Growth Fund - -
US Select Growth Fund (404) 139
Emerging Markets Growth Fund 2,468 4,303
Global leaders 27,416 - The movement in the adjustment is recognised in the Statement of Comprehensive Income:
1 November 2017 1 November 2016
- 30 April 2018 - 30 April 2017
US$ US$
Global Growth Fund - -
US Select Growth Fund (544) 766
Emerging Markets Growth Fund (1,835) 6,184
Global leaders (1,479) -
39
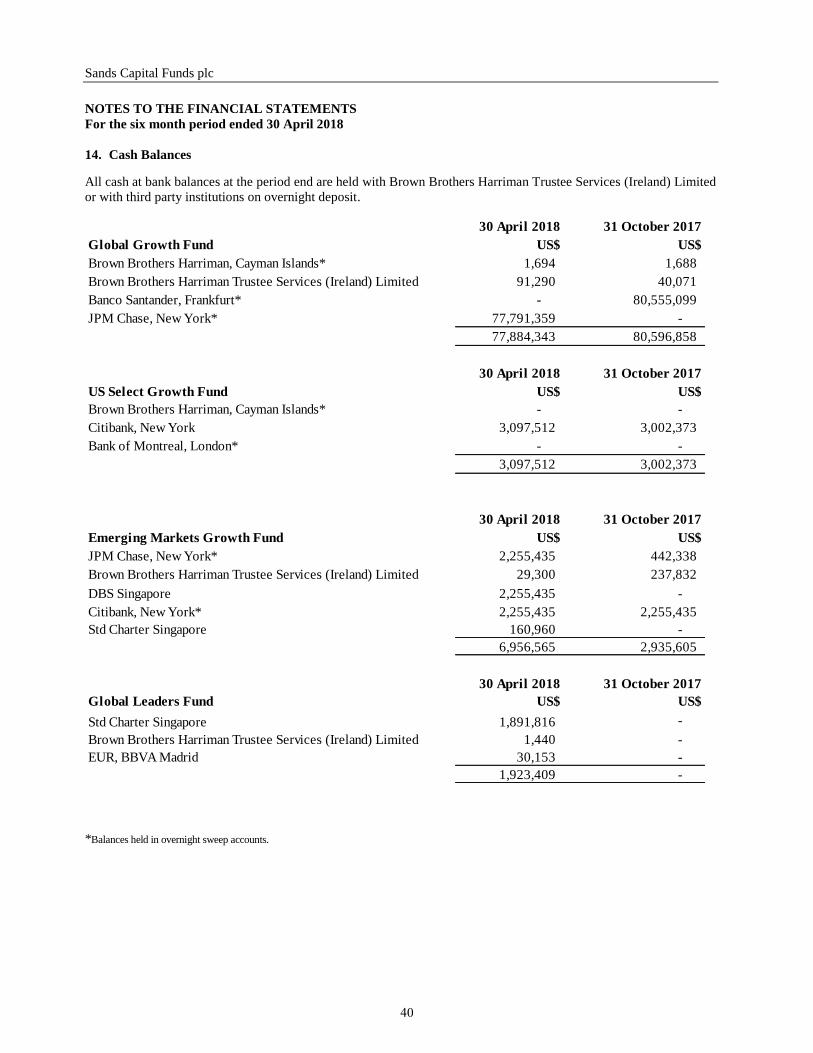
Sands Capital Funds plc
NOTES TO THE FINANCIAL STATEMENTS
For the six month period ended 30 April 2018
14. Cash Balances All cash at bank balances at the period end are held with Brown Brothers Harriman Trustee Services (Ireland) Limited
or with third party institutions on overnight deposit.
30 April 2018 31 October 2017
Global Growth Fund US$ US$
Brown Brothers Harriman, Cayman Islands* 1,694 1,688
Brown Brothers Harriman Trustee Services (Ireland) Limited 91,290 40,071
Banco Santander, Frankfurt* - 80,555,099
JPM Chase, New York* 77,791,359 -
77,884,343 80,596,858
30 April 2018 31 October 2017
US Select Growth Fund US$ US$
Brown Brothers Harriman, Cayman Islands* - -
Citibank, New York 3,097,512 3,002,373
Bank of Montreal, London* - -
3,097,512 3,002,373
30 April 2018 31 October 2017
Emerging Markets Growth Fund US$ US$
JPM Chase, New York* 2,255,435 442,338
Brown Brothers Harriman Trustee Services (Ireland) Limited 29,300 237,832
DBS Singapore 2,255,435 -
Citibank, New York* 2,255,435 2,255,435
Std Charter Singapore 160,960 -
6,956,565 2,935,605
30 April 2018 31 October 2017
Global Leaders Fund US$ US$
Std Charter Singapore 1,891,816 -
Brown Brothers Harriman Trustee Services (Ireland) Limited 1,440 -
EUR, BBVA Madrid 30,153 -
1,923,409 -
*Balances held in overnight sweep accounts.
40
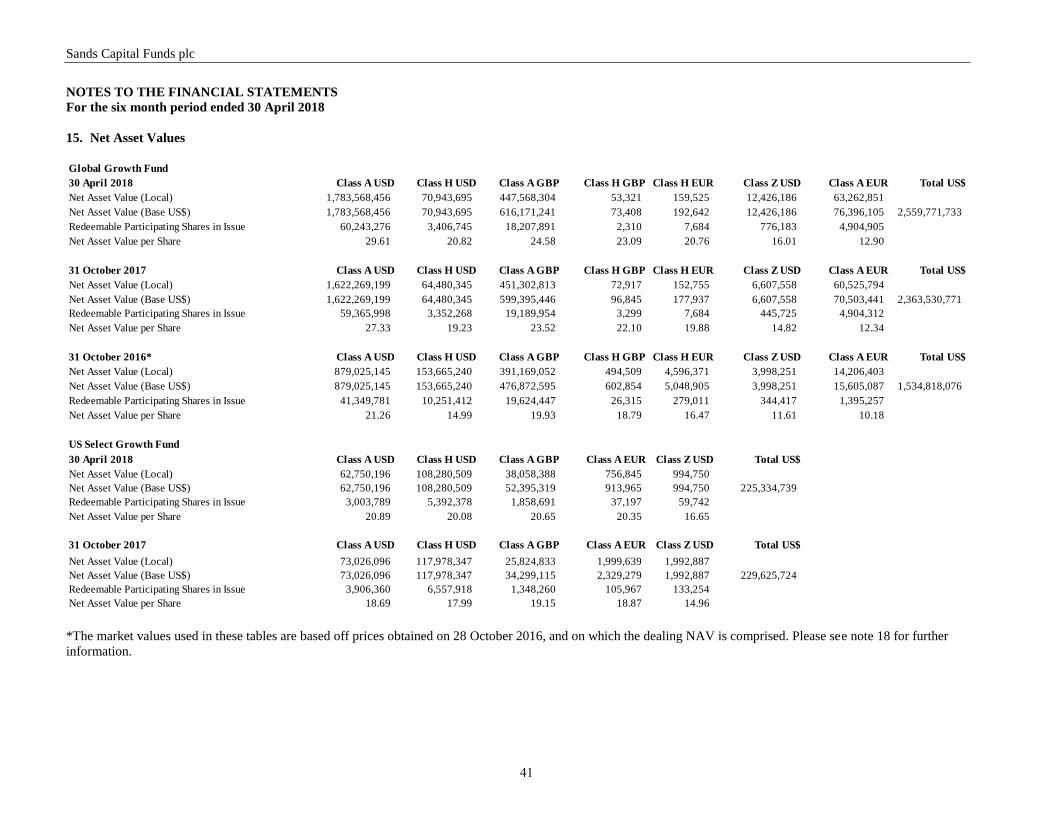
Sands Capital Funds plc
NOTES TO THE FINANCIAL STATEMENTS
For the six month period ended 30 April 2018
15. Net Asset Values
Global Growth Fund
30 April 2018 Class A USD Class H USD Class A GBP Class H GBP Class H EUR Class Z USD Class A EUR Total US$
Net Asset Value (Local) 1,783,568,456 70,943,695 447,568,304 53,321 159,525 12,426,186 63,262,851
Net Asset Value (Base US$) 1,783,568,456 70,943,695 616,171,241 73,408 192,642 12,426,186 76,396,105 2,559,771,733
Redeemable Participating Shares in Issue 60,243,276 3,406,745 18,207,891 2,310 7,684 776,183 4,904,905
Net Asset Value per Share 29.61 20.82 24.58 23.09 20.76 16.01 12.90
31 October 2017 Class A USD Class H USD Class A GBP Class H GBP Class H EUR Class Z USD Class A EUR Total US$
Net Asset Value (Local) 1,622,269,199 64,480,345 451,302,813 72,917 152,755 6,607,558 60,525,794
Net Asset Value (Base US$) 1,622,269,199 64,480,345 599,395,446 96,845 177,937 6,607,558 70,503,441 2,363,530,771
Redeemable Participating Shares in Issue 59,365,998 3,352,268 19,189,954 3,299 7,684 445,725 4,904,312
Net Asset Value per Share 27.33 19.23 23.52 22.10 19.88 14.82 12.34
31 October 2016* Class A USD Class H USD Class A GBP Class H GBP Class H EUR Class Z USD Class A EUR Total US$
Net Asset Value (Local) 879,025,145 153,665,240 391,169,052 494,509 4,596,371 3,998,251 14,206,403
Net Asset Value (Base US$) 879,025,145 153,665,240 476,872,595 602,854 5,048,905 3,998,251 15,605,087 1,534,818,076
Redeemable Participating Shares in Issue 41,349,781 10,251,412 19,624,447 26,315 279,011 344,417 1,395,257
Net Asset Value per Share 21.26 14.99 19.93 18.79 16.47 11.61 10.18
US Select Growth Fund
30 April 2018 Class A USD Class H USD Class A GBP Class A EUR Class Z USD Total US$
Net Asset Value (Local) 62,750,196 108,280,509 38,058,388 756,845 994,750
Net Asset Value (Base US$) 62,750,196 108,280,509 52,395,319 913,965 994,750 225,334,739
Redeemable Participating Shares in Issue 3,003,789 5,392,378 1,858,691 37,197 59,742
Net Asset Value per Share 20.89 20.08 20.65 20.35 16.65
31 October 2017 Class A USD Class H USD Class A GBP Class A EUR Class Z USD Total US$
Net Asset Value (Local) 73,026,096 117,978,347 25,824,833 1,999,639 1,992,887
Net Asset Value (Base US$) 73,026,096 117,978,347 34,299,115 2,329,279 1,992,887 229,625,724
Redeemable Participating Shares in Issue 3,906,360 6,557,918 1,348,260 105,967 133,254
Net Asset Value per Share 18.69 17.99 19.15 18.87 14.96 *The market values used in these tables are based off prices obtained on 28 October 2016, and on which the dealing NAV is comprised. Please see note 18 for further
information.
41
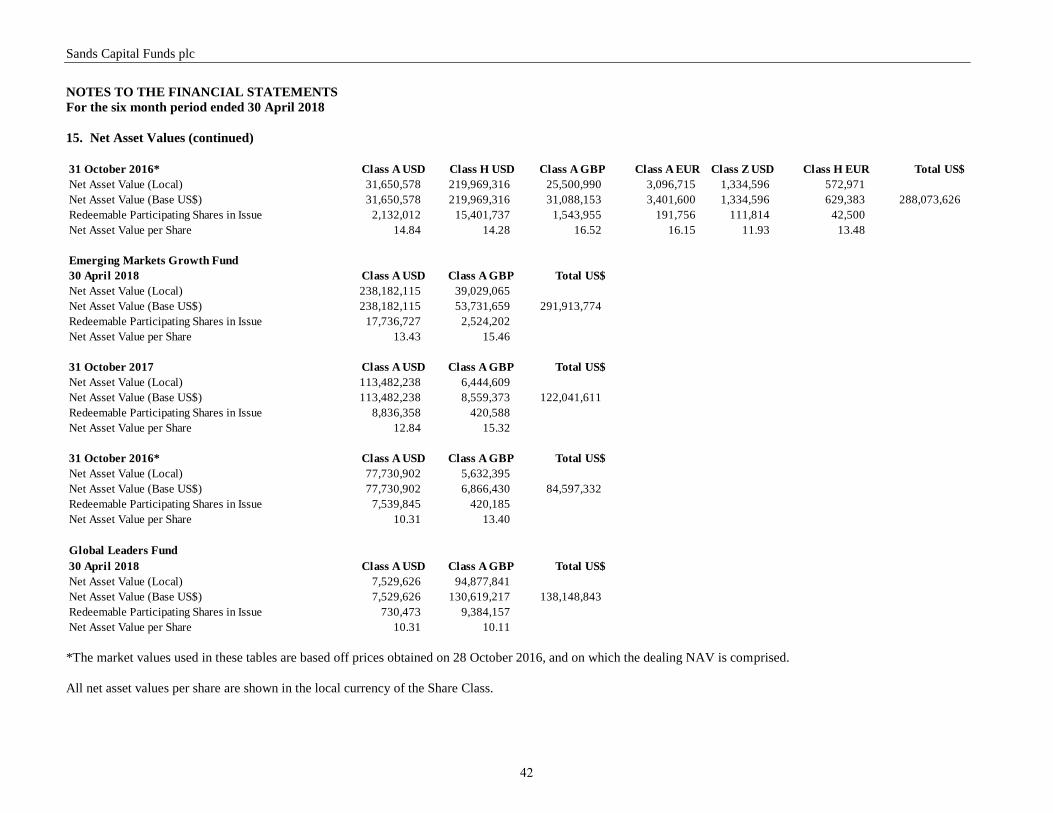
Sands Capital Funds plc
NOTES TO THE FINANCIAL STATEMENTS
For the six month period ended 30 April 2018
15. Net Asset Values (continued)
31 October 2016* Class A USD Class H USD Class A GBP Class A EUR Class Z USD Class H EUR Total US$
Net Asset Value (Local) 31,650,578 219,969,316 25,500,990 3,096,715 1,334,596 572,971
Net Asset Value (Base US$) 31,650,578 219,969,316 31,088,153 3,401,600 1,334,596 629,383 288,073,626
Redeemable Participating Shares in Issue 2,132,012 15,401,737 1,543,955 191,756 111,814 42,500
Net Asset Value per Share 14.84 14.28 16.52 16.15 11.93 13.48
Emerging Markets Growth Fund
30 April 2018 Class A USD Class A GBP Total US$
Net Asset Value (Local) 238,182,115 39,029,065
Net Asset Value (Base US$) 238,182,115 53,731,659 291,913,774
Redeemable Participating Shares in Issue 17,736,727 2,524,202
Net Asset Value per Share 13.43 15.46
31 October 2017 Class A USD Class A GBP Total US$
Net Asset Value (Local) 113,482,238 6,444,609
Net Asset Value (Base US$) 113,482,238 8,559,373 122,041,611
Redeemable Participating Shares in Issue 8,836,358 420,588
Net Asset Value per Share 12.84 15.32
31 October 2016* Class A USD Class A GBP Total US$
Net Asset Value (Local) 77,730,902 5,632,395
Net Asset Value (Base US$) 77,730,902 6,866,430 84,597,332
Redeemable Participating Shares in Issue 7,539,845 420,185
Net Asset Value per Share 10.31 13.40
Global Leaders Fund
30 April 2018 Class A USD Class A GBP Total US$
Net Asset Value (Local) 7,529,626 94,877,841
Net Asset Value (Base US$) 7,529,626 130,619,217 138,148,843
Redeemable Participating Shares in Issue 730,473 9,384,157
Net Asset Value per Share 10.31 10.11
*The market values used in these tables are based off prices obtained on 28 October 2016, and on which the dealing NAV is comprised.
All net asset values per share are shown in the local currency of the Share Class.
42
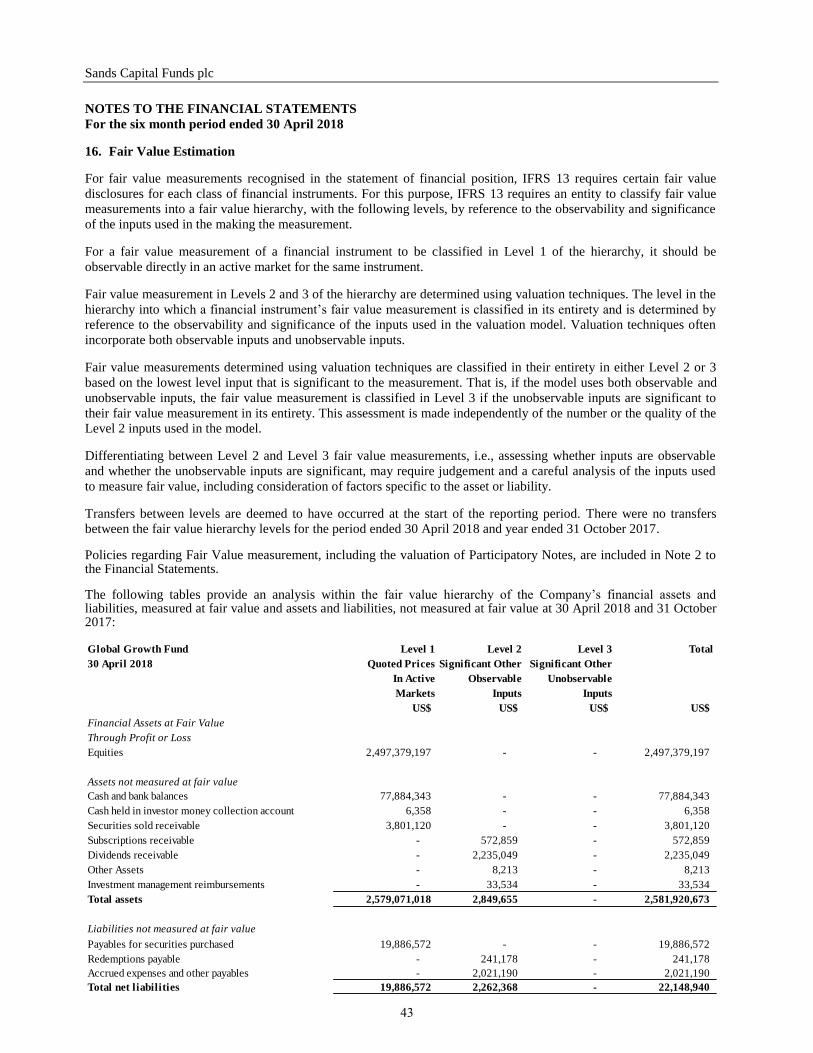
Sands Capital Funds plc
NOTES TO THE FINANCIAL STATEMENTS
For the six month period ended 30 April 2018 16. Fair Value Estimation For fair value measurements recognised in the statement of financial position, IFRS 13 requires certain fair value
disclosures for each class of financial instruments. For this purpose, IFRS 13 requires an entity to classify fair value
measurements into a fair value hierarchy, with the following levels, by reference to the observability and significance
of the inputs used in the making the measurement. For a fair value measurement of a financial instrument to be classified in Level 1 of the hierarchy, it should be
observable directly in an active market for the same instrument. Fair value measurement in Levels 2 and 3 of the hierarchy are determined using valuation techniques. The level in the
hierarchy into which a financial instrument’s fair value measurement is classified in its entirety and is determined by
reference to the observability and significance of the inputs used in the valuation model. Valuation techniques often
incorporate both observable inputs and unobservable inputs. Fair value measurements determined using valuation techniques are classified in their entirety in either Level 2 or 3
based on the lowest level input that is significant to the measurement. That is, if the model uses both observable and
unobservable inputs, the fair value measurement is classified in Level 3 if the unobservable inputs are significant to
their fair value measurement in its entirety. This assessment is made independently of the number or the quality of the
Level 2 inputs used in the model. Differentiating between Level 2 and Level 3 fair value measurements, i.e., assessing whether inputs are observable
and whether the unobservable inputs are significant, may require judgement and a careful analysis of the inputs used
to measure fair value, including consideration of factors specific to the asset or liability. Transfers between levels are deemed to have occurred at the start of the reporting period. There were no transfers
between the fair value hierarchy levels for the period ended 30 April 2018 and year ended 31 October 2017. Policies regarding Fair Value measurement, including the valuation of Participatory Notes, are included in Note 2 to the Financial Statements. The following tables provide an analysis within the fair value hierarchy of the Company’s financial assets and liabilities, measured at fair value and assets and liabilities, not measured at fair value at 30 April 2018 and 31 October 2017: Global Growth Fund Level 1 Level 2 Level 3 Total
30 April 2018 Quoted Prices Significant Other Significant Other
In Active Observable Unobservable
Markets Inputs Inputs
US$ US$ US$ US$
Financial Assets at Fair Value
Through Profit or Loss
Equities 2,497,379,197 - - 2,497,379,197
Assets not measured at fair value
Cash and bank balances 77,884,343 - - 77,884,343
Cash held in investor money collection account 6,358 - - 6,358
Securities sold receivable 3,801,120 - - 3,801,120
Subscriptions receivable - 572,859 - 572,859
Dividends receivable - 2,235,049 - 2,235,049
Other Assets - 8,213 - 8,213
Investment management reimbursements - 33,534 - 33,534
Total assets 2,579,071,018 2,849,655 - 2,581,920,673
Liabilities not measured at fair value
Payables for securities purchased 19,886,572 - - 19,886,572
Redemptions payable - 241,178 - 241,178
Accrued expenses and other payables - 2,021,190 - 2,021,190
Total net liabilities 19,886,572 2,262,368 - 22,148,940 43
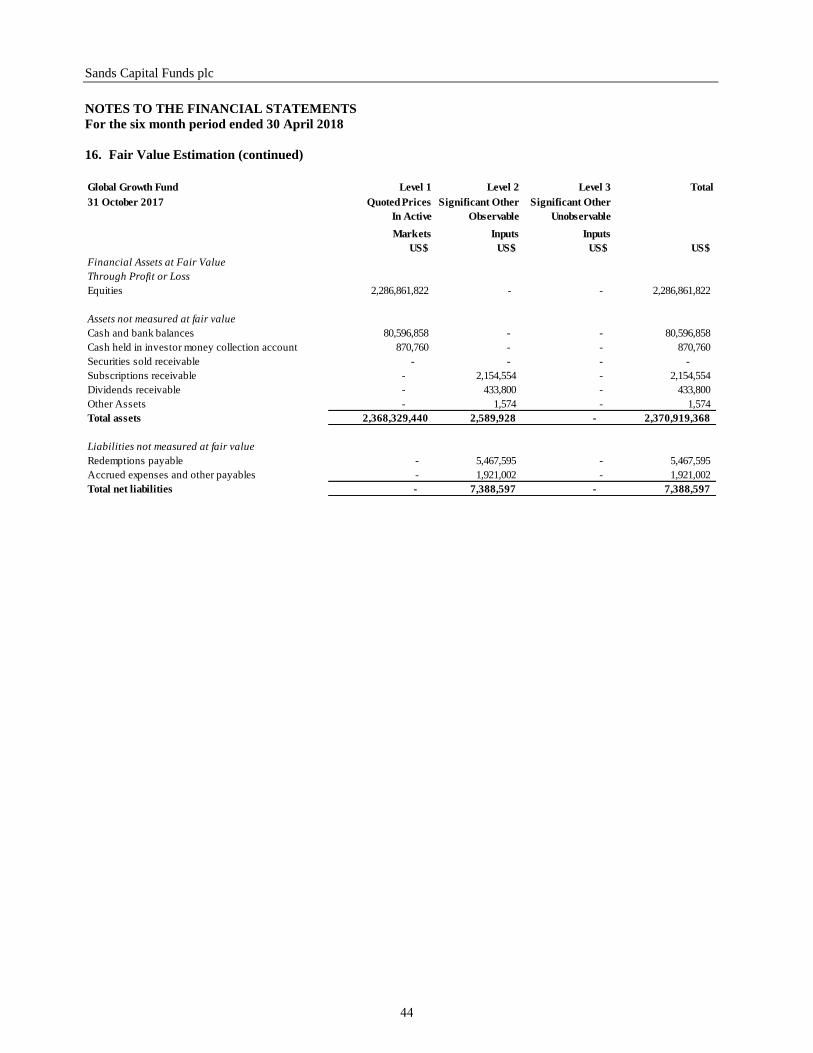
Sands Capital Funds plc
NOTES TO THE FINANCIAL STATEMENTS
For the six month period ended 30 April 2018
16. Fair Value Estimation (continued)
Global Growth Fund Level 1 Level 2 Level 3 Total
31 October 2017 Quoted Prices Significant Other Significant Other
In Active Observable Unobservable
Markets Inputs Inputs
US$ US$ US$ US$
Financial Assets at Fair Value
Through Profit or Loss
Equities 2,286,861,822 - - 2,286,861,822
Assets not measured at fair value
Cash and bank balances 80,596,858 - - 80,596,858
Cash held in investor money collection account 870,760 - - 870,760
Securities sold receivable - - - -
Subscriptions receivable - 2,154,554 - 2,154,554
Dividends receivable - 433,800 - 433,800
Other Assets - 1,574 - 1,574
Total assets 2,368,329,440 2,589,928 - 2,370,919,368
Liabilities not measured at fair value
Redemptions payable - 5,467,595 - 5,467,595
Accrued expenses and other payables - 1,921,002 - 1,921,002
Total net liabilities - 7,388,597 - 7,388,597
44
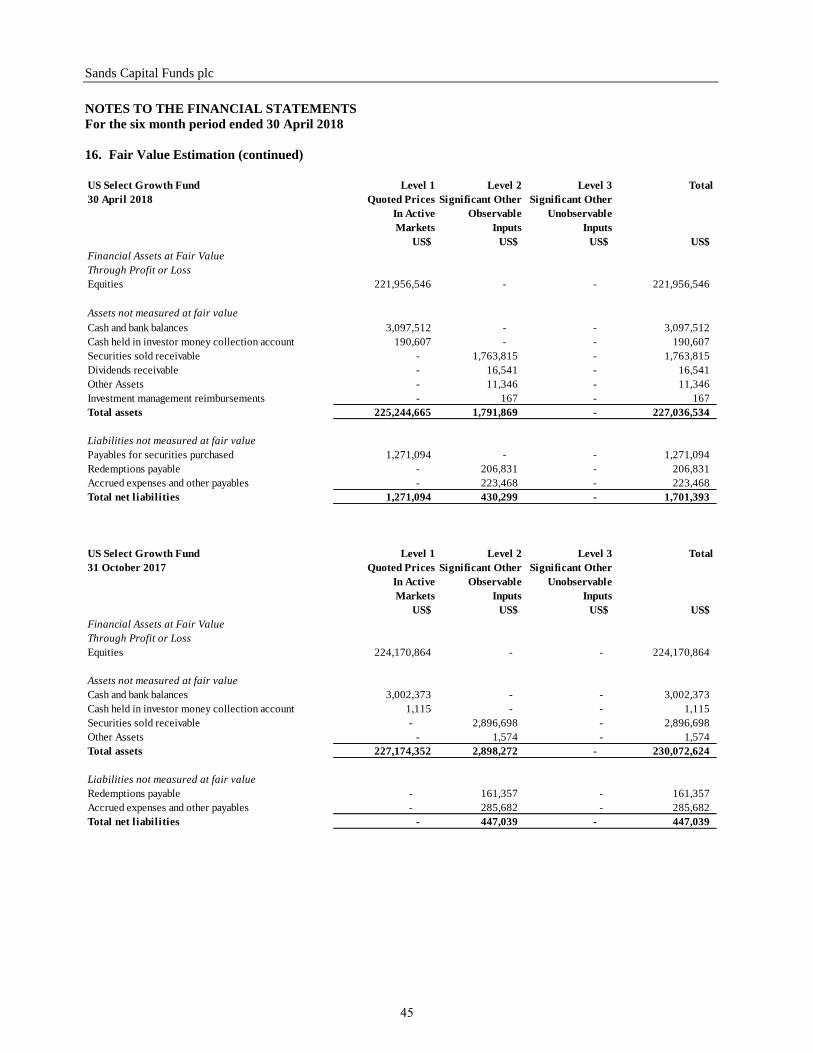
Sands Capital Funds plc
NOTES TO THE FINANCIAL STATEMENTS
For the six month period ended 30 April 2018
16. Fair Value Estimation (continued)
US Select Growth Fund Level 1 Level 2 Level 3 Total
30 April 2018 Quoted Prices Significant Other Significant Other
In Active Observable Unobservable
Markets Inputs Inputs
US$ US$ US$ US$
Financial Assets at Fair Value
Through Profit or Loss
Equities 221,956,546 - - 221,956,546
Assets not measured at fair value
Cash and bank balances 3,097,512 - - 3,097,512
Cash held in investor money collection account 190,607 - - 190,607
Securities sold receivable - 1,763,815 - 1,763,815
Dividends receivable - 16,541 - 16,541
Other Assets - 11,346 - 11,346
Investment management reimbursements - 167 - 167
Total assets 225,244,665 1,791,869 - 227,036,534
Liabilities not measured at fair value
Payables for securities purchased 1,271,094 - - 1,271,094
Redemptions payable - 206,831 - 206,831
Accrued expenses and other payables - 223,468 - 223,468
Total net liabilities 1,271,094 430,299 - 1,701,393
US Select Growth Fund Level 1 Level 2 Level 3 Total
31 October 2017 Quoted Prices Significant Other Significant Other
In Active Observable Unobservable
Markets Inputs Inputs
US$ US$ US$ US$
Financial Assets at Fair Value
Through Profit or Loss
Equities 224,170,864 - - 224,170,864
Assets not measured at fair value
Cash and bank balances 3,002,373 - - 3,002,373
Cash held in investor money collection account 1,115 - - 1,115
Securities sold receivable - 2,896,698 - 2,896,698
Other Assets - 1,574 - 1,574
Total assets 227,174,352 2,898,272 - 230,072,624
Liabilities not measured at fair value
Redemptions payable - 161,357 - 161,357
Accrued expenses and other payables - 285,682 - 285,682
Total net liabilities - 447,039 - 447,039
45
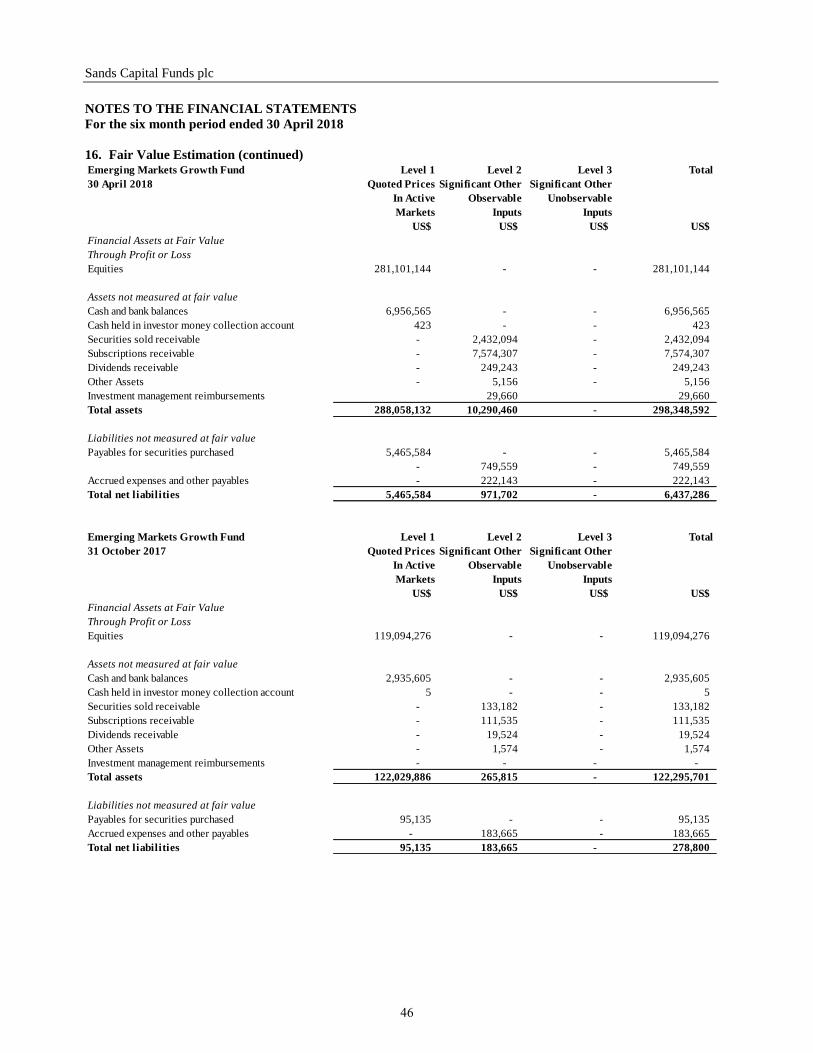
Sands Capital Funds plc
NOTES TO THE FINANCIAL STATEMENTS
For the six month period ended 30 April 2018
16. Fair Value Estimation (continued) Emerging Markets Growth Fund Level 1 Level 2 Level 3 Total
30 April 2018 Quoted Prices Significant Other Significant Other
In Active Observable Unobservable
Markets Inputs Inputs
US$ US$ US$ US$
Financial Assets at Fair Value
Through Profit or Loss
Equities 281,101,144 - - 281,101,144
Assets not measured at fair value
Cash and bank balances 6,956,565 - - 6,956,565
Cash held in investor money collection account 423 - - 423
Securities sold receivable - 2,432,094 - 2,432,094
Subscriptions receivable - 7,574,307 - 7,574,307
Dividends receivable - 249,243 - 249,243
Other Assets - 5,156 - 5,156
Investment management reimbursements 29,660 29,660
Total assets 288,058,132 10,290,460 - 298,348,592
Liabilities not measured at fair value
Payables for securities purchased 5,465,584 - - 5,465,584
- 749,559 - 749,559
Accrued expenses and other payables - 222,143 - 222,143
Total net liabilities 5,465,584 971,702 - 6,437,286
Emerging Markets Growth Fund Level 1 Level 2 Level 3 Total
31 October 2017 Quoted Prices Significant Other Significant Other
In Active Observable Unobservable
Markets Inputs Inputs
US$ US$ US$ US$
Financial Assets at Fair Value
Through Profit or Loss
Equities 119,094,276 - - 119,094,276
Assets not measured at fair value
Cash and bank balances 2,935,605 - - 2,935,605
Cash held in investor money collection account 5 - - 5
Securities sold receivable - 133,182 - 133,182
Subscriptions receivable - 111,535 - 111,535
Dividends receivable - 19,524 - 19,524
Other Assets - 1,574 - 1,574
Investment management reimbursements - - - -
Total assets 122,029,886 265,815 - 122,295,701
Liabilities not measured at fair value
Payables for securities purchased 95,135 - - 95,135
Accrued expenses and other payables - 183,665 - 183,665
Total net liabilities 95,135 183,665 - 278,800
46
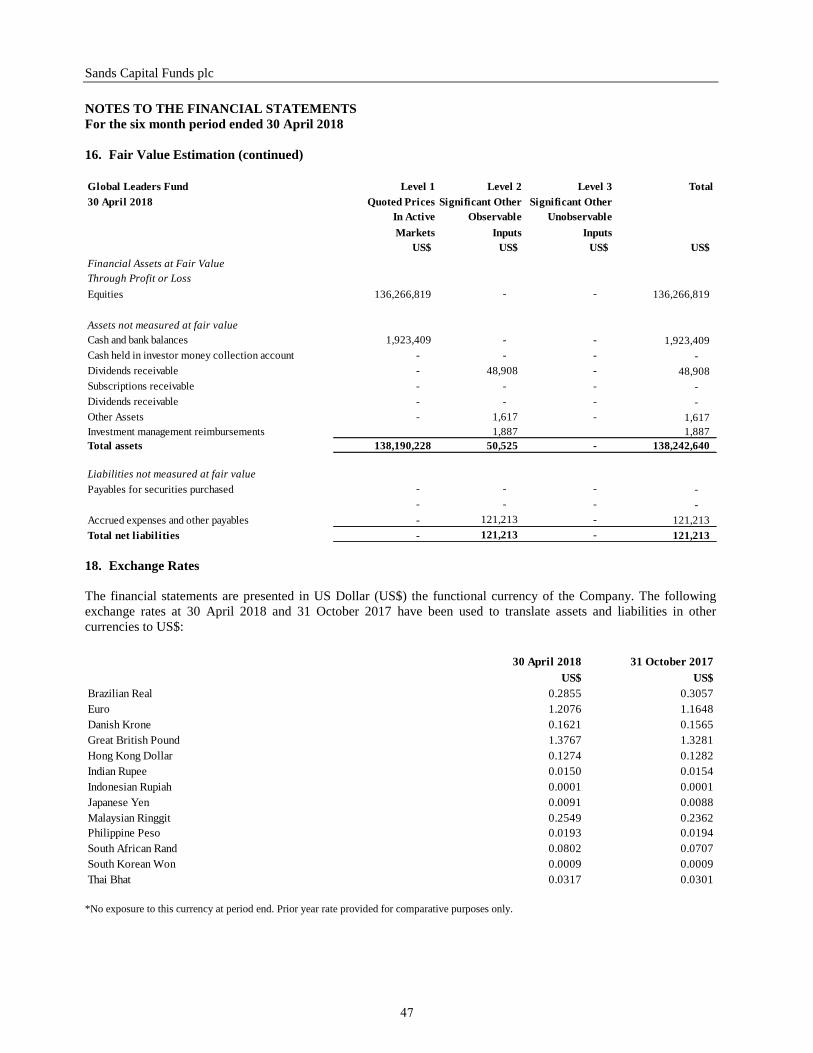
Sands Capital Funds plc
NOTES TO THE FINANCIAL STATEMENTS
For the six month period ended 30 April 2018
16. Fair Value Estimation (continued)
Global Leaders Fund Level 1 Level 2 Level 3 Total
30 April 2018 Quoted Prices Significant Other Significant Other
In Active Observable Unobservable
Markets Inputs Inputs
US$ US$ US$ US$
Financial Assets at Fair Value
Through Profit or Loss
Equities 136,266,819 - - 136,266,819
Assets not measured at fair value
Cash and bank balances 1,923,409 - - 1,923,409
Cash held in investor money collection account - - - -
Dividends receivable - 48,908 - 48,908
Subscriptions receivable - - - -
Dividends receivable - - - -
Other Assets - 1,617 - 1,617
Investment management reimbursements 1,887 1,887
Total assets 138,190,228 50,525 - 138,242,640
Liabilities not measured at fair value
Payables for securities purchased - - - -
- - - -
Accrued expenses and other payables - 121,213 - 121,213
Total net liabilities - 121,213 - 121,213
18. Exchange Rates
The financial statements are presented in US Dollar (US$) the functional currency of the Company. The following
exchange rates at 30 April 2018 and 31 October 2017 have been used to translate assets and liabilities in other
currencies to US$:
30 April 2018 31 October 2017
US$ US$
Brazilian Real 0.2855 0.3057
Euro 1.2076 1.1648
Danish Krone 0.1621 0.1565
Great British Pound 1.3767 1.3281
Hong Kong Dollar 0.1274 0.1282
Indian Rupee 0.0150 0.0154
Indonesian Rupiah 0.0001 0.0001
Japanese Yen 0.0091 0.0088
Malaysian Ringgit 0.2549 0.2362
Philippine Peso 0.0193 0.0194
South African Rand 0.0802 0.0707
South Korean Won 0.0009 0.0009
Thai Bhat 0.0317 0.0301 *No exposure to this currency at period end. Prior year rate provided for comparative purposes only.
47
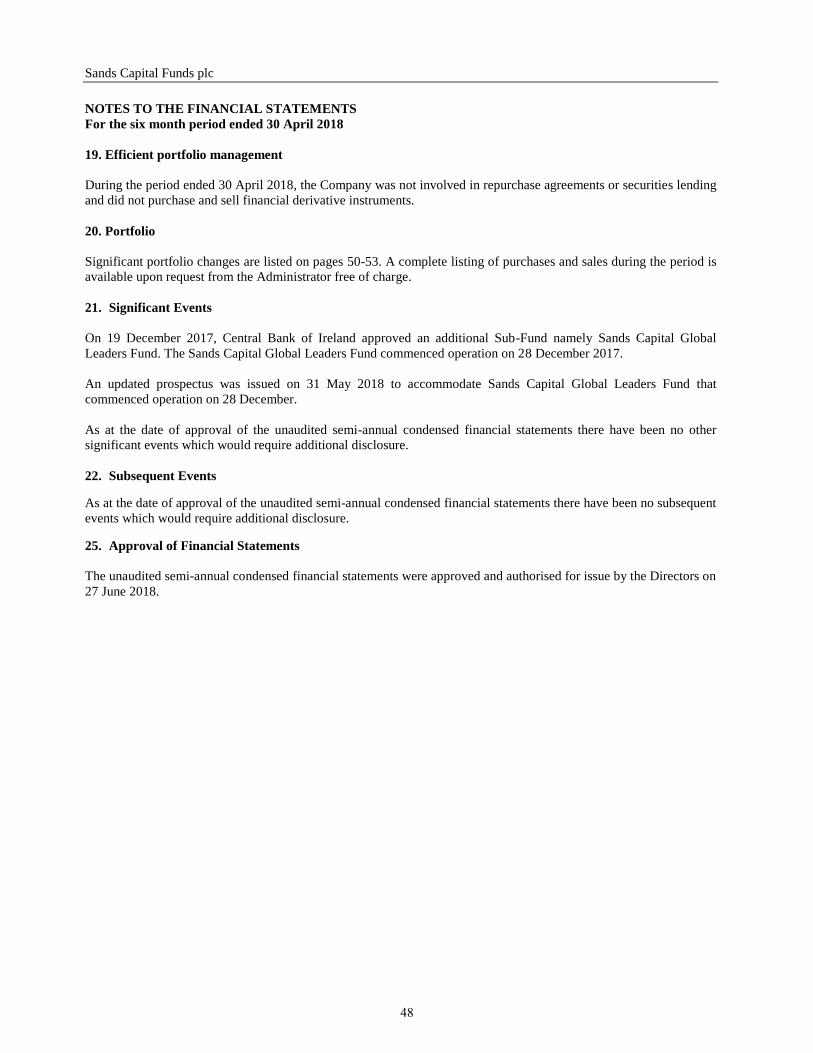
Sands Capital Funds plc
NOTES TO THE FINANCIAL STATEMENTS
For the six month period ended 30 April 2018
19. Efficient portfolio management
During the period ended 30 April 2018, the Company was not involved in repurchase agreements or securities lending
and did not purchase and sell financial derivative instruments.
20. Portfolio
Significant portfolio changes are listed on pages 50-53. A complete listing of purchases and sales during the period is
available upon request from the Administrator free of charge.
21. Significant Events
On 19 December 2017, Central Bank of Ireland approved an additional Sub-Fund namely Sands Capital Global
Leaders Fund. The Sands Capital Global Leaders Fund commenced operation on 28 December 2017.
An updated prospectus was issued on 31 May 2018 to accommodate Sands Capital Global Leaders Fund that
commenced operation on 28 December.
As at the date of approval of the unaudited semi-annual condensed financial statements there have been no other
significant events which would require additional disclosure.
22. Subsequent Events As at the date of approval of the unaudited semi-annual condensed financial statements there have been no subsequent
events which would require additional disclosure. 25. Approval of Financial Statements
The unaudited semi-annual condensed financial statements were approved and authorised for issue by the Directors on
27 June 2018.
48
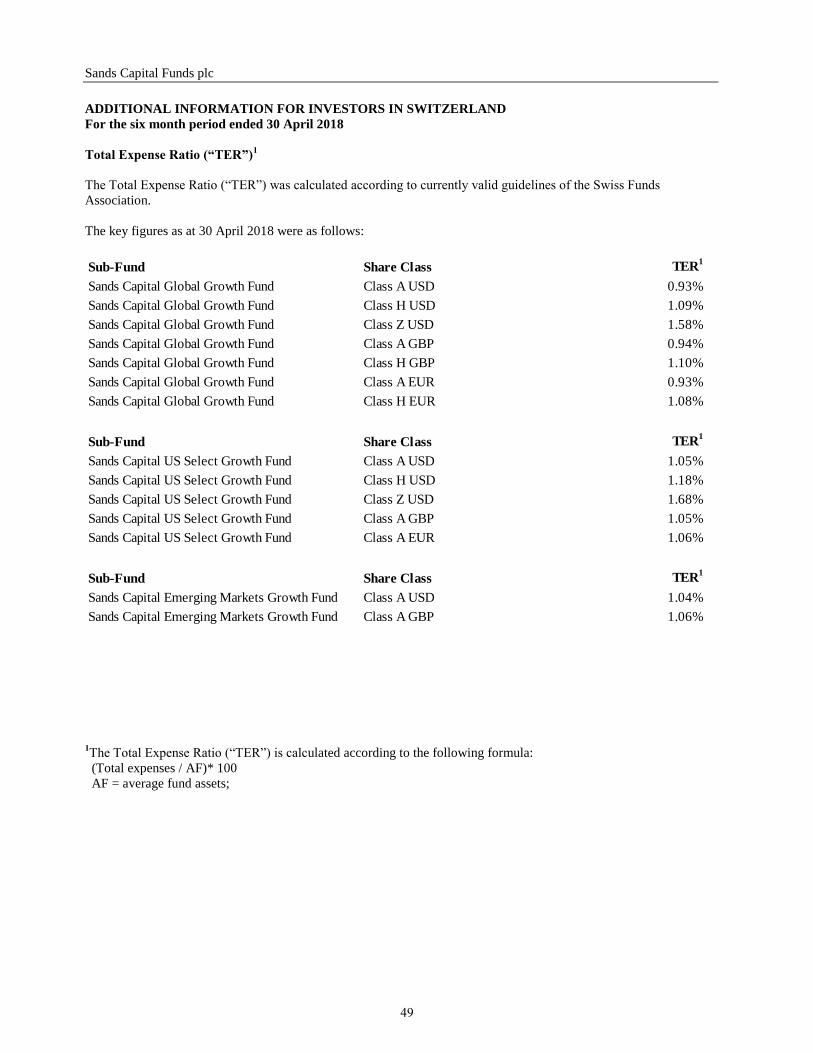
Sands Capital Funds plc
ADDITIONAL INFORMATION FOR INVESTORS IN SWITZERLAND
For the six month period ended 30 April 2018
Total Expense Ratio (“TER”)1
The Total Expense Ratio (“TER”) was calculated according to currently valid guidelines of the Swiss Funds
Association.
The key figures as at 30 April 2018 were as follows:
Sub-Fund Share Class TER1
Sands Capital Global Growth Fund Class A USD 0.93%
Sands Capital Global Growth Fund Class H USD 1.09%
Sands Capital Global Growth Fund Class Z USD 1.58%
Sands Capital Global Growth Fund Class A GBP 0.94%
Sands Capital Global Growth Fund Class H GBP 1.10%
Sands Capital Global Growth Fund Class A EUR 0.93%
Sands Capital Global Growth Fund Class H EUR 1.08%
Sub-Fund Share Class TER1
Sands Capital US Select Growth Fund Class A USD 1.05%
Sands Capital US Select Growth Fund Class H USD 1.18%
Sands Capital US Select Growth Fund Class Z USD 1.68%
Sands Capital US Select Growth Fund Class A GBP 1.05%
Sands Capital US Select Growth Fund Class A EUR 1.06%
Sub-Fund Share Class TER1
Sands Capital Emerging Markets Growth Fund Class A USD 1.04%
Sands Capital Emerging Markets Growth Fund Class A GBP 1.06%
1The Total Expense Ratio (“TER”) is calculated according to the following formula:
(Total expenses / AF)* 100
AF = average fund assets;
49
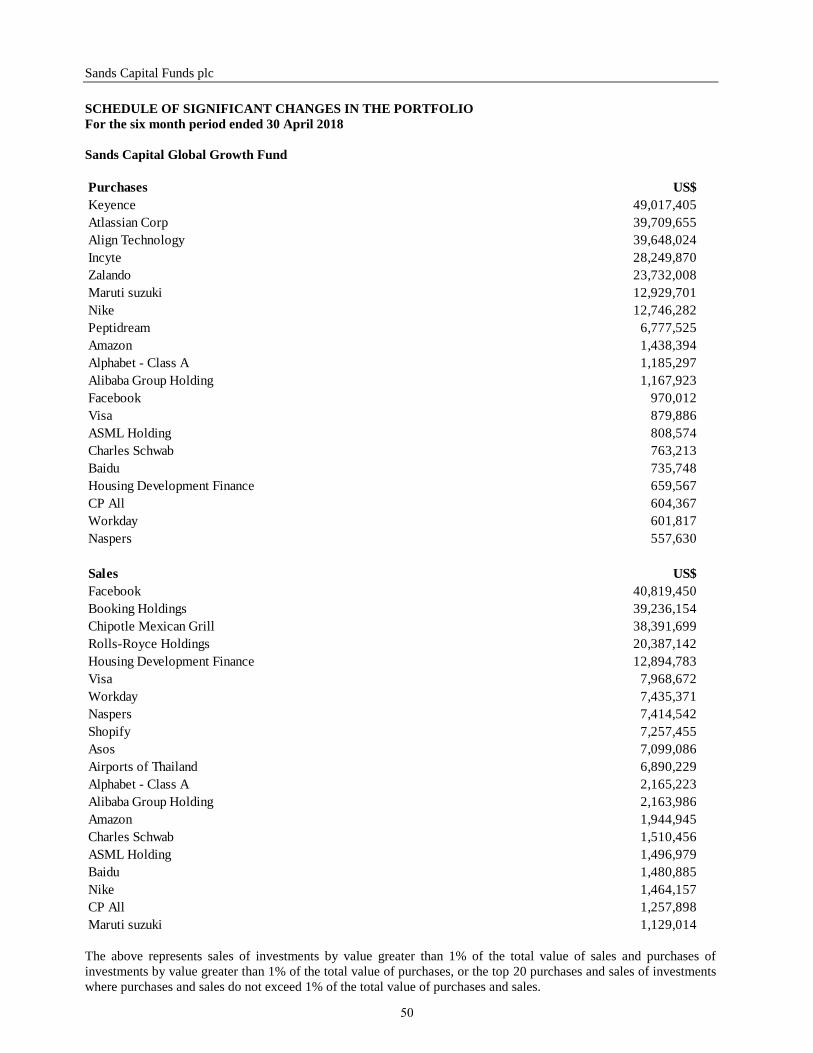
Sands Capital Funds plc
SCHEDULE OF SIGNIFICANT CHANGES IN THE PORTFOLIO
For the six month period ended 30 April 2018
Sands Capital Global Growth Fund
Purchases US$
Keyence 49,017,405
Atlassian Corp 39,709,655
Align Technology 39,648,024
Incyte 28,249,870
Zalando 23,732,008
Maruti suzuki 12,929,701
Nike 12,746,282
Peptidream 6,777,525
Amazon 1,438,394
Alphabet - Class A 1,185,297
Alibaba Group Holding 1,167,923
Facebook 970,012
Visa 879,886
ASML Holding 808,574
Charles Schwab 763,213
Baidu 735,748
Housing Development Finance 659,567
CP All 604,367
Workday 601,817
Naspers 557,630
Sales US$
Facebook 40,819,450
Booking Holdings 39,236,154
Chipotle Mexican Grill 38,391,699
Rolls-Royce Holdings 20,387,142
Housing Development Finance 12,894,783
Visa 7,968,672
Workday 7,435,371
Naspers 7,414,542
Shopify 7,257,455
Asos 7,099,086
Airports of Thailand 6,890,229
Alphabet - Class A 2,165,223
Alibaba Group Holding 2,163,986
Amazon 1,944,945
Charles Schwab 1,510,456
ASML Holding 1,496,979
Baidu 1,480,885
Nike 1,464,157
CP All 1,257,898
Maruti suzuki 1,129,014
The above represents sales of investments by value greater than 1% of the total value of sales and purchases of
investments by value greater than 1% of the total value of purchases, or the top 20 purchases and sales of investments
where purchases and sales do not exceed 1% of the total value of purchases and sales.
50
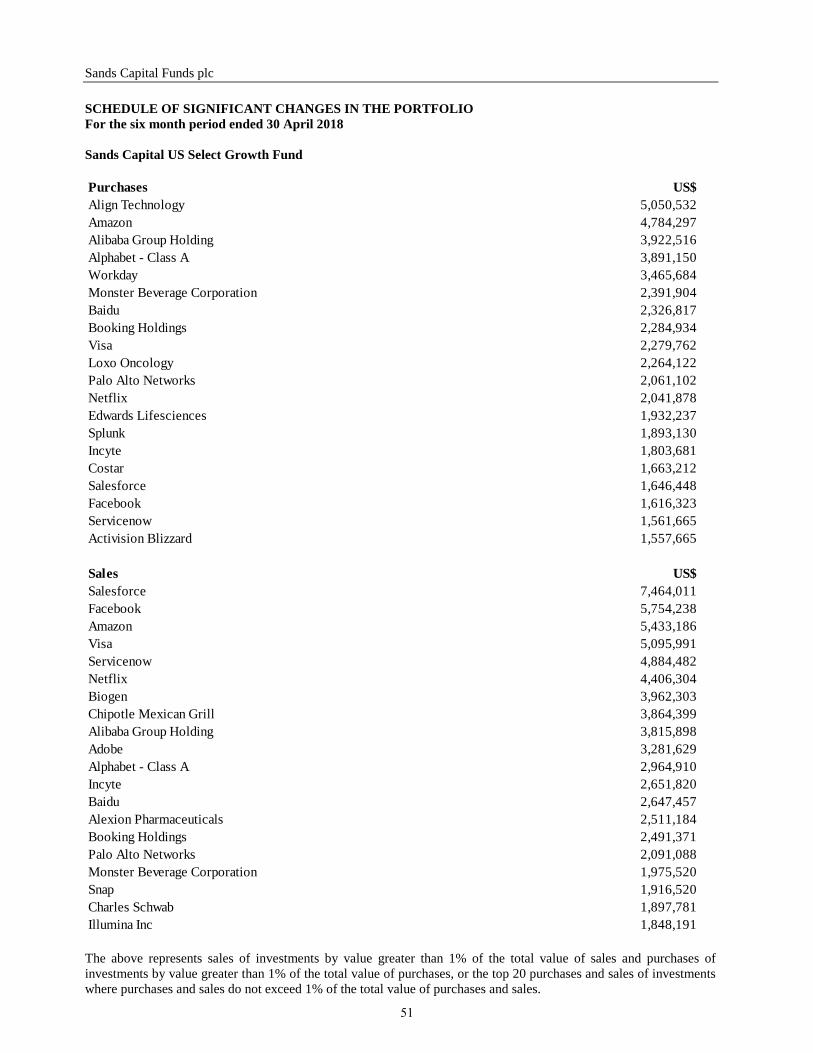
Sands Capital Funds plc
SCHEDULE OF SIGNIFICANT CHANGES IN THE PORTFOLIO
For the six month period ended 30 April 2018
Sands Capital US Select Growth Fund
Purchases US$
Align Technology 5,050,532
Amazon 4,784,297
Alibaba Group Holding 3,922,516
Alphabet - Class A 3,891,150
Workday 3,465,684
Monster Beverage Corporation 2,391,904
Baidu 2,326,817
Booking Holdings 2,284,934
Visa 2,279,762
Loxo Oncology 2,264,122
Palo Alto Networks 2,061,102
Netflix 2,041,878
Edwards Lifesciences 1,932,237
Splunk 1,893,130
Incyte 1,803,681
Costar 1,663,212
Salesforce 1,646,448
Facebook 1,616,323
Servicenow 1,561,665
Activision Blizzard 1,557,665
Sales US$
Salesforce 7,464,011
Facebook 5,754,238
Amazon 5,433,186
Visa 5,095,991
Servicenow 4,884,482
Netflix 4,406,304
Biogen 3,962,303
Chipotle Mexican Grill 3,864,399
Alibaba Group Holding 3,815,898
Adobe 3,281,629
Alphabet - Class A 2,964,910
Incyte 2,651,820
Baidu 2,647,457
Alexion Pharmaceuticals 2,511,184
Booking Holdings 2,491,371
Palo Alto Networks 2,091,088
Monster Beverage Corporation 1,975,520
Snap 1,916,520
Charles Schwab 1,897,781
Illumina Inc 1,848,191
The above represents sales of investments by value greater than 1% of the total value of sales and purchases of
investments by value greater than 1% of the total value of purchases, or the top 20 purchases and sales of investments
where purchases and sales do not exceed 1% of the total value of purchases and sales.
51
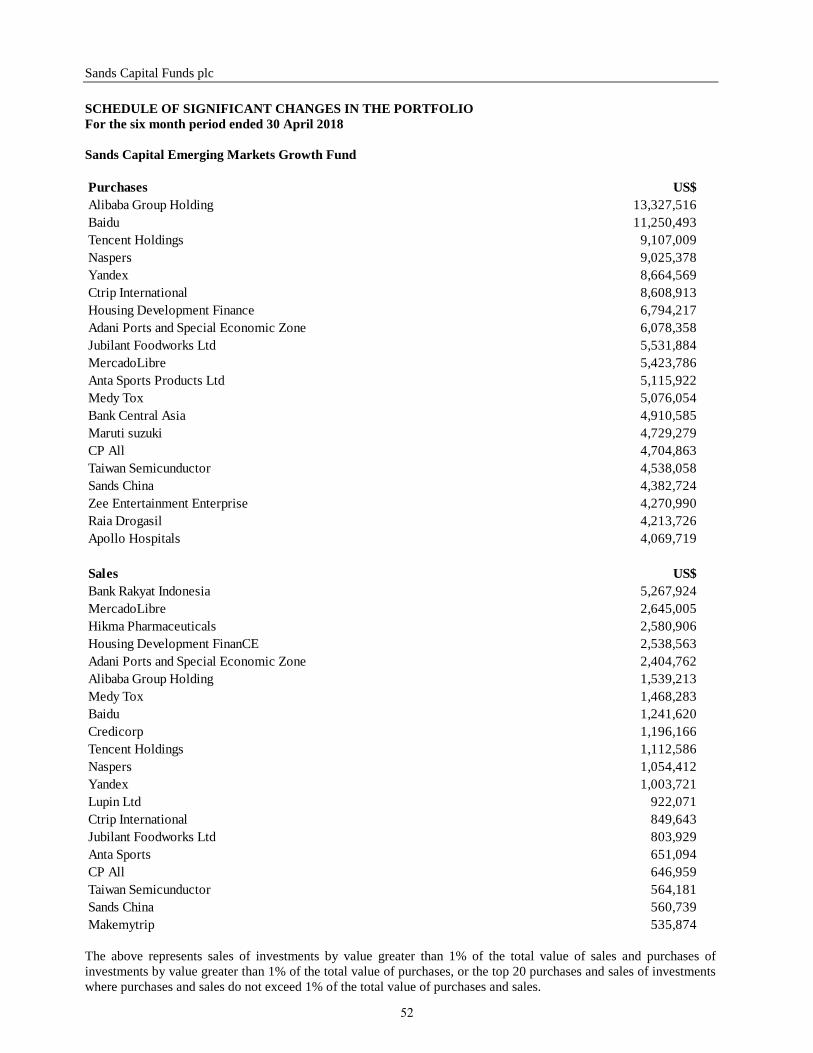
Sands Capital Funds plc
SCHEDULE OF SIGNIFICANT CHANGES IN THE PORTFOLIO
For the six month period ended 30 April 2018
Sands Capital Emerging Markets Growth Fund
Purchases US$
Alibaba Group Holding 13,327,516
Baidu 11,250,493
Tencent Holdings 9,107,009
Naspers 9,025,378
Yandex 8,664,569
Ctrip International 8,608,913
Housing Development Finance 6,794,217
Adani Ports and Special Economic Zone 6,078,358
Jubilant Foodworks Ltd 5,531,884
MercadoLibre 5,423,786
Anta Sports Products Ltd 5,115,922
Medy Tox 5,076,054
Bank Central Asia 4,910,585
Maruti suzuki 4,729,279
CP All 4,704,863
Taiwan Semicunductor 4,538,058
Sands China 4,382,724
Zee Entertainment Enterprise 4,270,990
Raia Drogasil 4,213,726
Apollo Hospitals 4,069,719
Sales US$
Bank Rakyat Indonesia 5,267,924
MercadoLibre 2,645,005
Hikma Pharmaceuticals 2,580,906
Housing Development FinanCE 2,538,563
Adani Ports and Special Economic Zone 2,404,762
Alibaba Group Holding 1,539,213
Medy Tox 1,468,283
Baidu 1,241,620
Credicorp 1,196,166
Tencent Holdings 1,112,586
Naspers 1,054,412
Yandex 1,003,721
Lupin Ltd 922,071
Ctrip International 849,643
Jubilant Foodworks Ltd 803,929
Anta Sports 651,094
CP All 646,959
Taiwan Semicunductor 564,181
Sands China 560,739
Makemytrip 535,874
The above represents sales of investments by value greater than 1% of the total value of sales and purchases of
investments by value greater than 1% of the total value of purchases, or the top 20 purchases and sales of investments
where purchases and sales do not exceed 1% of the total value of purchases and sales.
52
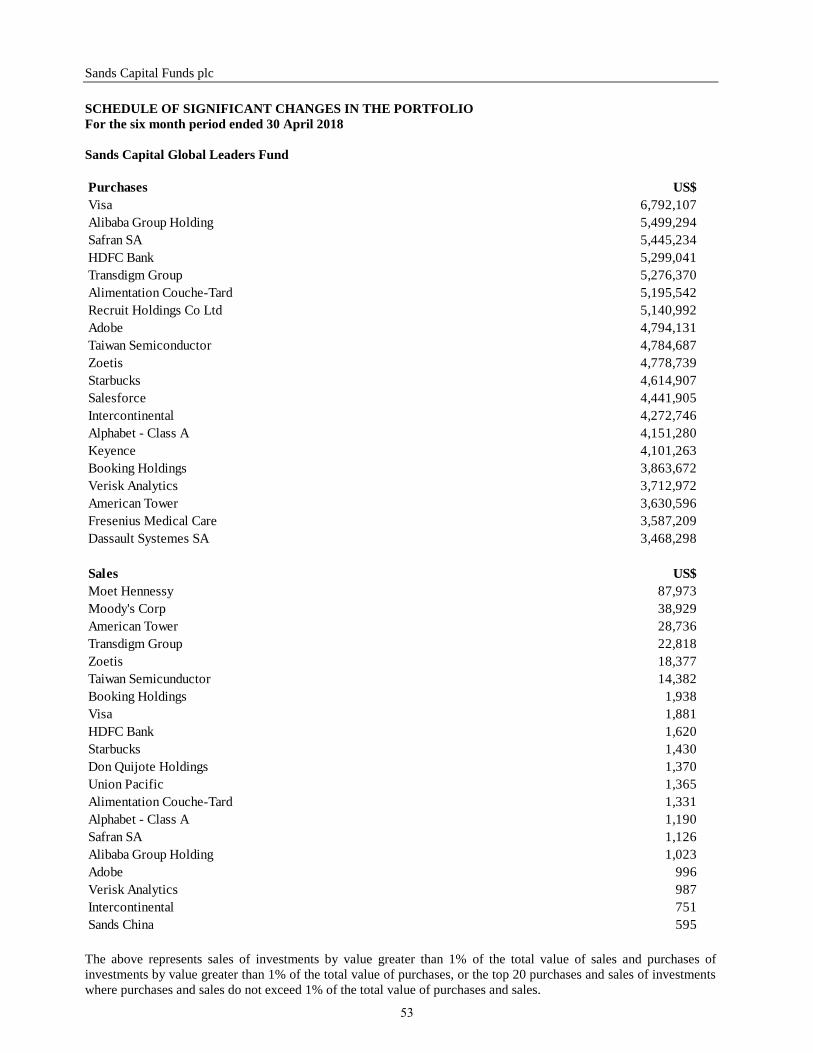
Sands Capital Funds plc
SCHEDULE OF SIGNIFICANT CHANGES IN THE PORTFOLIO
For the six month period ended 30 April 2018
Sands Capital Global Leaders Fund
Purchases US$
Visa 6,792,107
Alibaba Group Holding 5,499,294
Safran SA 5,445,234
HDFC Bank 5,299,041
Transdigm Group 5,276,370
Alimentation Couche-Tard 5,195,542
Recruit Holdings Co Ltd 5,140,992
Adobe 4,794,131
Taiwan Semiconductor 4,784,687
Zoetis 4,778,739
Starbucks 4,614,907
Salesforce 4,441,905
Intercontinental 4,272,746
Alphabet - Class A 4,151,280
Keyence 4,101,263
Booking Holdings 3,863,672
Verisk Analytics 3,712,972
American Tower 3,630,596
Fresenius Medical Care 3,587,209
Dassault Systemes SA 3,468,298
Sales US$
Moet Hennessy 87,973
Moody's Corp 38,929
American Tower 28,736
Transdigm Group 22,818
Zoetis 18,377
Taiwan Semicunductor 14,382
Booking Holdings 1,938
Visa 1,881
HDFC Bank 1,620
Starbucks 1,430
Don Quijote Holdings 1,370
Union Pacific 1,365
Alimentation Couche-Tard 1,331
Alphabet - Class A 1,190
Safran SA 1,126
Alibaba Group Holding 1,023
Adobe 996
Verisk Analytics 987
Intercontinental 751
Sands China 595 The above represents sales of investments by value greater than 1% of the total value of sales and purchases of
investments by value greater than 1% of the total value of purchases, or the top 20 purchases and sales of investments
where purchases and sales do not exceed 1% of the total value of purchases and sales.
53