Embed Size (px)
Citation preview
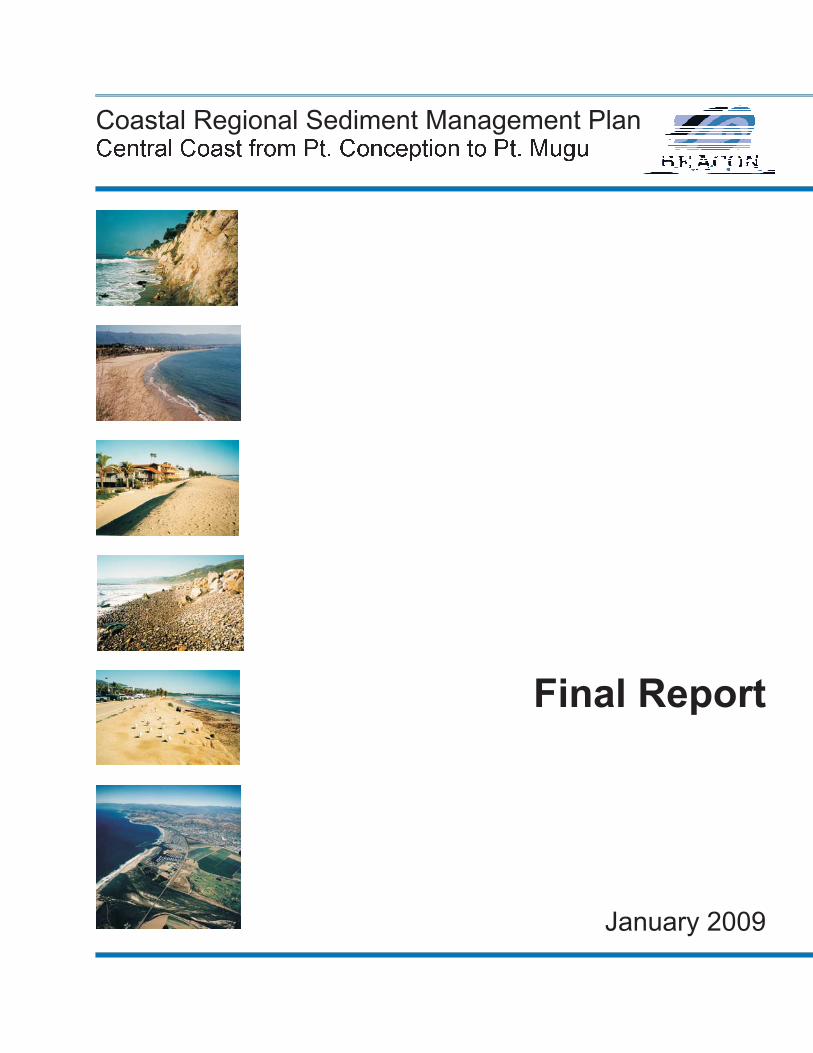
Coastal Regional Sediment Management Plan������� ����� �� ��� ��� ������ �� ��� ����
January 2009
Final Report
BEACON CRSMP Page i Final Report
Coastal Regional Sediment Management Plan Central Coast from Pt. Conception to Pt. Mugu
Beach Erosion Authority for Clean Oceans and Nourishment
Board of Directors Staff
County of Santa Barbara Salud Carbajal, Supervisor 1st District Janet Wolf, Supervisor 2nd District County of Ventura Steve Bennett, Supervisor District 1 John C. Zaragoza, Supervisor District 5 City of Goleta Ed Easton, Councilmember City of Santa Barbara Das Williams, Councilmember City of Carpinteria Gregg Carty, Mayor City of Ventura Brian Brennan, Councilmember City of Oxnard Bryan McDonald, Councilmember City of Port Hueneme Jon Sharkey, Mayor Pro Tem
Brian Brennan, Executive Director Gerald Comati, Project Manager James Bailard, Technical Advisor Patrick Barnard, Special Technical Advisor Karl Trieberg, Staff Advisor Rick Raives, Staff Advisor Kevin Ready, Counsel
Prepared in cooperation with the California Coastal Sediment Management Workgroup and the U.S. Army Corps of Engineers Los Angeles District
Kim Sterrett, Program Manager for the California Department of Boating and Waterways Clif Davenport, Project Manager for the CSMW Heather Schlosser, Acting Section Chief, Coastal Planning for the USACE
This Plan is funded in part with qualified outer continental shelf oil and gas revenues by the Coastal Impact Assistance Program, Bureau of Ocean Energy Management, Regulation, and Enforcement, U.S. Department of the Interior.
January 2009
BEACON CRSMP Page ii Final Report
Table of Contents
Introduction 1 Understanding Our Coast 3 Challenges and Opportunities 16 The Plan 19 Public Comment 33 List of Tables Table 1 Estimated Sediment Supply to the Coast from Rivers and Streams 10 Table 2 Challenges and Opportunities for the BEACON Coast 18 Table 3 BEACON CRSMP Recommended Activities 22 List of Figures Figure 1 BEACON’s Member Agencies 2 Figure 2 The BEACON Coast 4 Figure 3 BEACON CRSMP Planning Reaches 6 Figure 4 Existing Shoreline Armoring 8 Figure 5 Shoreline Trends between Point Conception and Mugu Submarine Canyon 9 Figure 6 Fluvial and Seacliff Sediment Sources along the BEACON Coast 11 Figure 7 Additional Sediment Sources near the BEACON Coast 13 Figure 8 Schematic Diagram of Shoreline Processes along the BEACON Coast 14 Figure 9 The BEACON CRSMP 24 List of Appendices Appendix A List of References 37 Appendix B Glossary of Terms 41 Appendix C Economic Analysis of the BEACON Coast 42 Appendix D Environmental Review of Candidate CRSMP Projects 74
BEACON CRSMP Page 1 Final Report
Introduction
Regional Sediment Management (RSM) is a planning approach that seeks to address coastal sediment processes and issues on a broader geographic scale. It recognizes that sand, cobble, and fine sediment is an important natural resource that is critical to the environmental health and economic vitality of the coastal zone. The sediment is what makes up the beaches, resides offshore in significant deposits, and is delivered to the coast from inland source areas by the various rivers and streams. The relevant sediment processes extend from inland watersheds to offshore areas. This broad coverage overlaps multiple geopolitical boundaries which explains why a regional planning perspective is needed. Regional Sediment Management is about having greater understanding and knowledge about all of the interrelationships between coastal and offshore sediment deposits, inland origins of coastal sediment, sediment pathways to the coast, and how sand moves about the shoreline. From this knowledge base, improved sediment management decisions, policies, and practices can be formulated and implemented on a regional scale to preserve or enhance existing beaches, address inter-related resource needs and opportunities, and optimally manage coastal projects for the regional benefit. California has been actively engaged in finding ways and means to resolve coastal erosion and sediment management issues on a broader scale. The process has been formalized by the State Resources Agency and its member Departments by joining together with the US Army Corps of Engineers (USACE) and other advisory groups to form the Coastal Sediment Management Workgroup (CSMW). This multi-agency body has been charged with the task of coordinating and collaborating toward development of a California
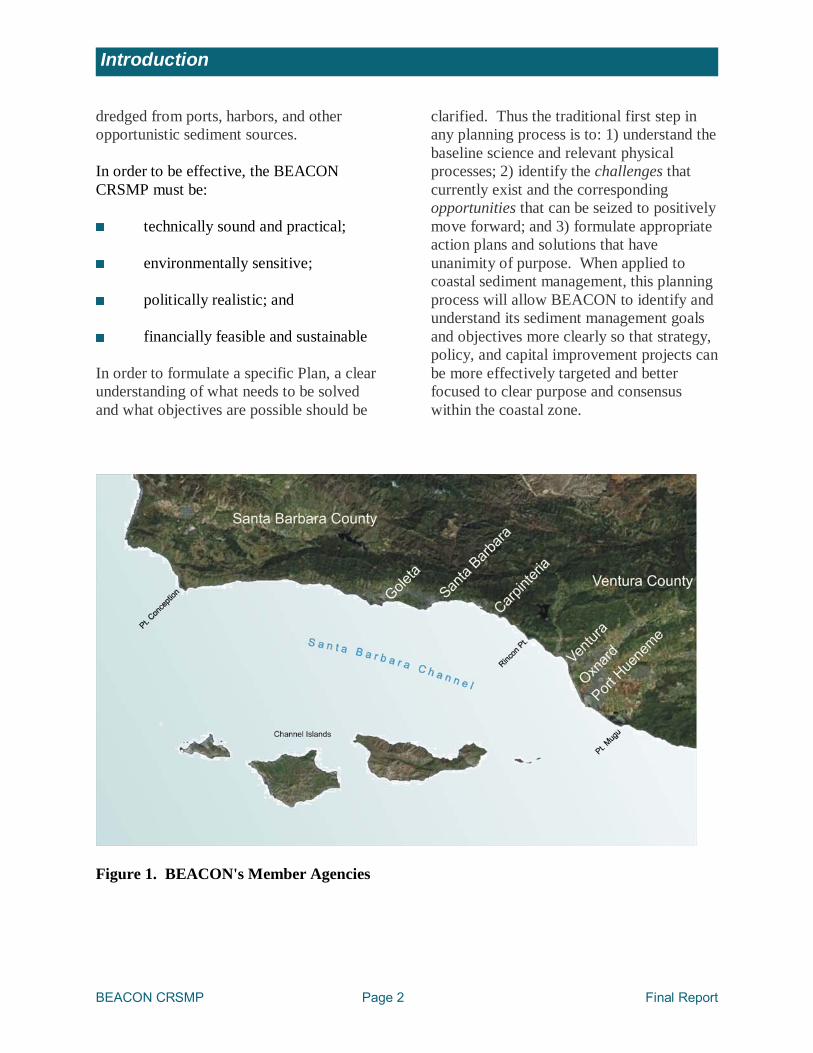
Sediment Master Plan (SMP). To date there have been a number of separately funded studies and projects related to the SMP that range from physical data collection, review of environmental effects, socioeconomic analysis, GIS database development, policy review, and beneficial reuse of sediment. In recognition of the diverse nature of the California coastline, the CSMW intends to fulfill the regional sediment management objectives of the SMP by developing a series of regional Plans that are geographically specific to and target the distinct shoreline segments of the California coast. The Coastal Regional Sediment Management Plans (CRSMP) are intended to formulate regionally relevant consensus-driven sediment management policy and guidance in order to restore, preserve and maintain coastal beaches and other critical areas of sediment deficit, sustain recreation and tourism, enhance public safety and access, and restore coastal sandy habitats. The Beach Erosion Authority for Clean Oceans and Nourishment (BEACON) is a Joint Powers Authority composed of Santa Barbara and Ventura Counties and the six cities of Goleta, Santa Barbara, Carpinteria, Ventura, Oxnard, and Port Hueneme (see Figure 1). BEACON’s CRSMP provides the opportunity to revisit its past and ongoing programs, fine tune its goals and objectives, and map practical implementation strategies into the future. As such its CRSMP is intended to develop a comprehensive road map that addresses how to conserve and restore the valuable sediment resources along its coastline to reduce shoreline erosion and coastal storm damages, protect sensitive environmental resources, increase natural sediment supply to the coast, preserve and enhance beaches, improve water quality along the shoreline, and optimize the beneficial use of material
BEACON CRSMP Page 2 Final Report
Introduction
dredged from ports, harbors, and other opportunistic sediment sources. In order to be effective, the BEACON CRSMP must be:
technically sound and practical;
environmentally sensitive;
politically realistic; and
financially feasible and sustainable In order to formulate a specific Plan, a clear understanding of what needs to be solved and what objectives are possible should be
clarified. Thus the traditional first step in any planning process is to: 1) understand the baseline science and relevant physical processes; 2) identify the challenges that currently exist and the corresponding opportunities that can be seized to positively move forward; and 3) formulate appropriate action plans and solutions that have unanimity of purpose. When applied to coastal sediment management, this planning process will allow BEACON to identify and understand its sediment management goals and objectives more clearly so that strategy, policy, and capital improvement projects can be more effectively targeted and better focused to clear purpose and consensus within the coastal zone.
Figure 1. BEACON's Member Agencies
BEACON CRSMP Page 3 Final Report
Understanding Our Coast - Regions
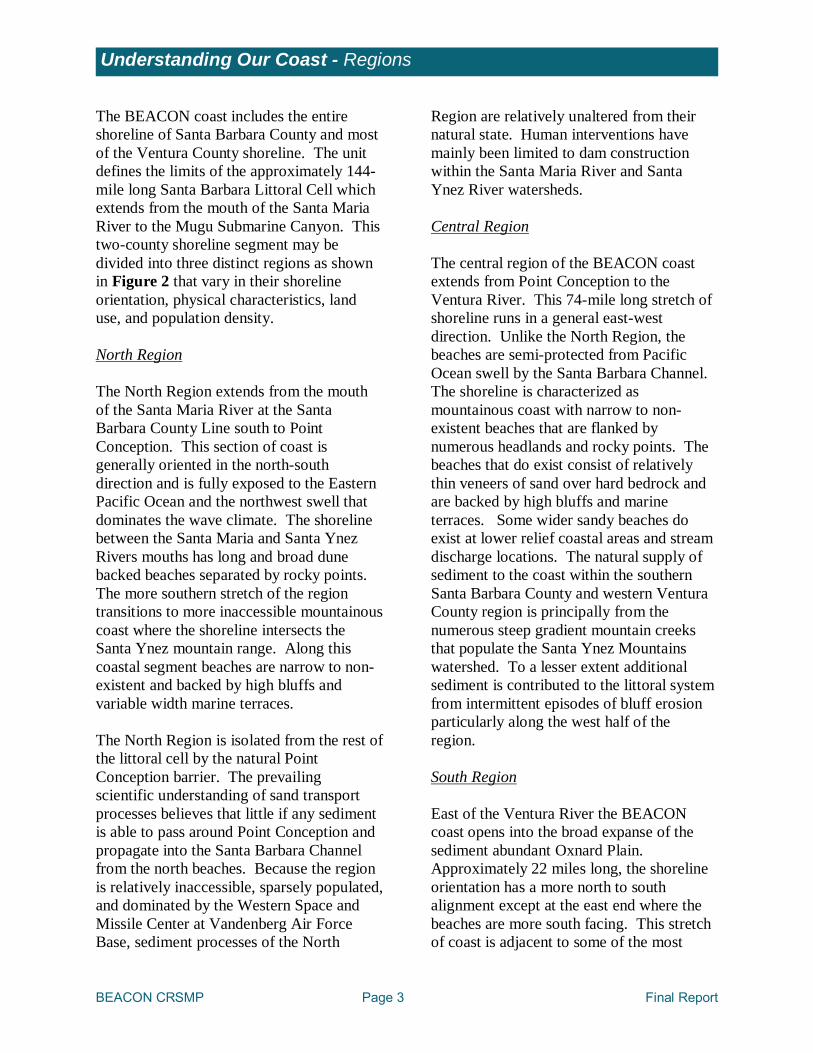
The BEACON coast includes the entire shoreline of Santa Barbara County and most of the Ventura County shoreline. The unit defines the limits of the approximately 144-mile long Santa Barbara Littoral Cell which extends from the mouth of the Santa Maria River to the Mugu Submarine Canyon. This two-county shoreline segment may be divided into three distinct regions as shown in Figure 2 that vary in their shoreline orientation, physical characteristics, land use, and population density. North Region The North Region extends from the mouth of the Santa Maria River at the Santa Barbara County Line south to Point Conception. This section of coast is generally oriented in the north-south direction and is fully exposed to the Eastern Pacific Ocean and the northwest swell that dominates the wave climate. The shoreline between the Santa Maria and Santa Ynez Rivers mouths has long and broad dune backed beaches separated by rocky points. The more southern stretch of the region transitions to more inaccessible mountainous coast where the shoreline intersects the Santa Ynez mountain range. Along this coastal segment beaches are narrow to non-existent and backed by high bluffs and variable width marine terraces. The North Region is isolated from the rest of the littoral cell by the natural Point Conception barrier. The prevailing scientific understanding of sand transport processes believes that little if any sediment is able to pass around Point Conception and propagate into the Santa Barbara Channel from the north beaches. Because the region is relatively inaccessible, sparsely populated, and dominated by the Western Space and Missile Center at Vandenberg Air Force Base, sediment processes of the North
Region are relatively unaltered from their natural state. Human interventions have mainly been limited to dam construction within the Santa Maria River and Santa Ynez River watersheds. Central Region The central region of the BEACON coast extends from Point Conception to the Ventura River. This 74-mile long stretch of shoreline runs in a general east-west direction. Unlike the North Region, the beaches are semi-protected from Pacific Ocean swell by the Santa Barbara Channel. The shoreline is characterized as mountainous coast with narrow to non-existent beaches that are flanked by numerous headlands and rocky points. The beaches that do exist consist of relatively thin veneers of sand over hard bedrock and are backed by high bluffs and marine terraces. Some wider sandy beaches do exist at lower relief coastal areas and stream discharge locations. The natural supply of sediment to the coast within the southern Santa Barbara County and western Ventura County region is principally from the numerous steep gradient mountain creeks that populate the Santa Ynez Mountains watershed. To a lesser extent additional sediment is contributed to the littoral system from intermittent episodes of bluff erosion particularly along the west half of the region. South Region East of the Ventura River the BEACON coast opens into the broad expanse of the sediment abundant Oxnard Plain. Approximately 22 miles long, the shoreline orientation has a more north to south alignment except at the east end where the beaches are more south facing. This stretch of coast is adjacent to some of the most
BEACON CRSMP Page 4 Final Report
Understanding Our Coast - Regions
densely populated areas within the entire littoral cell. The less developed sections that do exist are backed by wind swept dunes or wetlands. The shoreline characteristics and natural supply of sediment within this region is defined by the Ventura and Santa Clara Rivers that drain large watersheds. The Mugu Submarine Canyon is the ultimate sediment sink for the littoral cell because it provides a pathway for sand to the deep Santa Barbara Basin. The distinct coastal regions south and east of Point Conception define the practical limits and focus of the BEACON CRSMP. The more inaccessible shoreline north of Point Conception exists mostly in its natural state, and no sand is delivered to beaches within
the Santa Barbara Channel. This means that sediment management planning for the North Region can be independent from the Central and South Region. The natural state of the North Region and existing land uses suggest that natural processes and conditions should continue to be maintained as much as possible. By contrast shoreline processes and development within the Central and South Regions are more complex. Accordingly it is this section of BEACON’s urbanized coast where coastal sediment management planning should initially focus. Given the greater complexity and challenges of these two regions, it is appropriate to subdivide the shoreline into smaller planning reaches.
Figure 2. The BEACON Coast
BEACON CRSMP Page 5 Final Report
Understanding Our Coast - Reaches
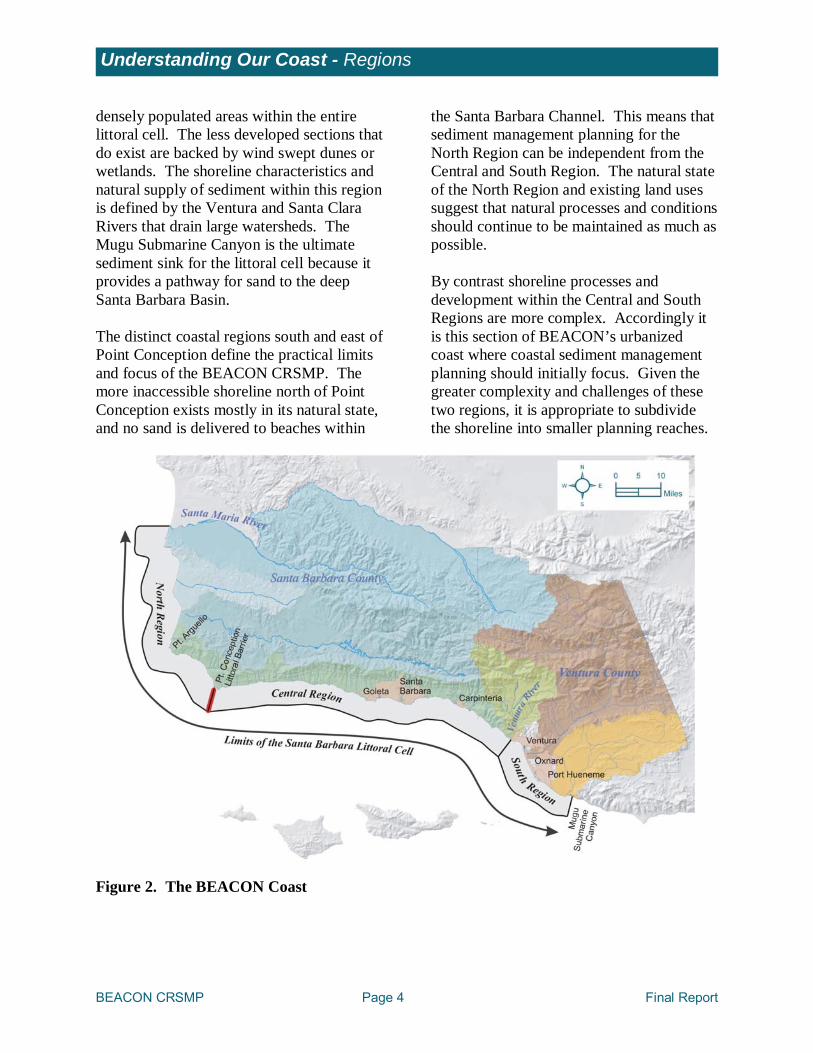
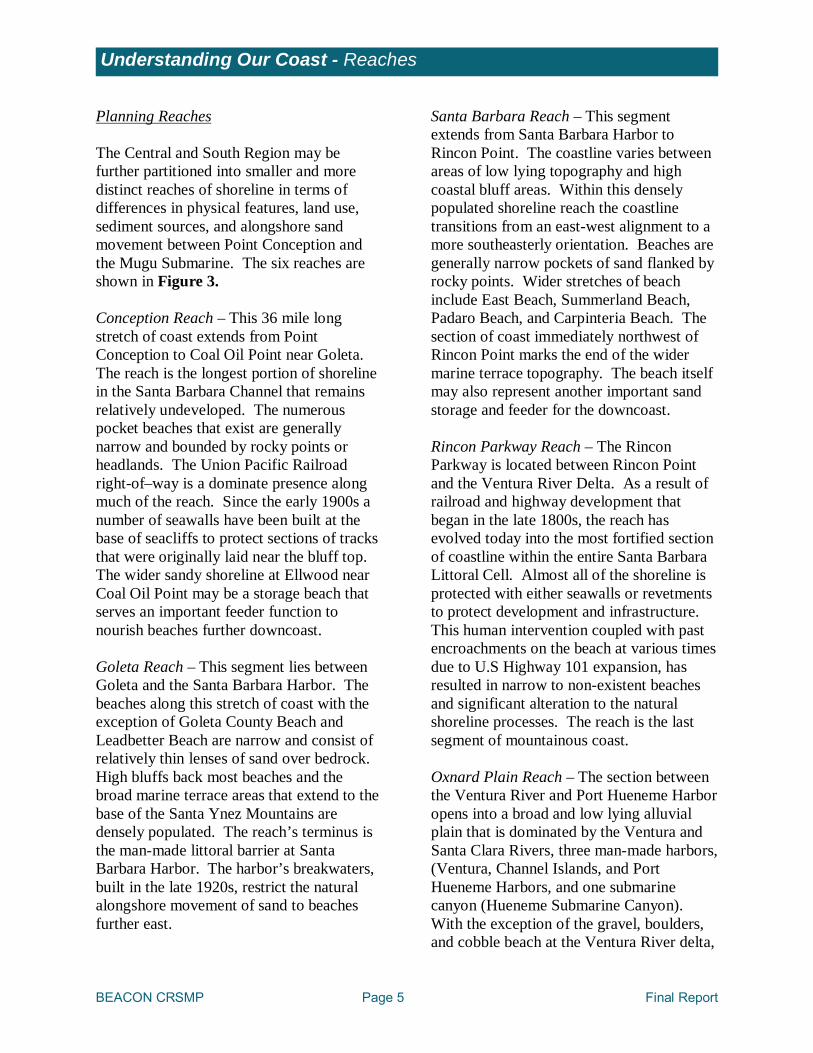
Planning Reaches The Central and South Region may be further partitioned into smaller and more distinct reaches of shoreline in terms of differences in physical features, land use, sediment sources, and alongshore sand movement between Point Conception and the Mugu Submarine. The six reaches are shown in Figure 3. Conception Reach – This 36 mile long stretch of coast extends from Point Conception to Coal Oil Point near Goleta. The reach is the longest portion of shoreline in the Santa Barbara Channel that remains relatively undeveloped. The numerous pocket beaches that exist are generally narrow and bounded by rocky points or headlands. The Union Pacific Railroad right-of–way is a dominate presence along much of the reach. Since the early 1900s a number of seawalls have been built at the base of seacliffs to protect sections of tracks that were originally laid near the bluff top. The wider sandy shoreline at Ellwood near Coal Oil Point may be a storage beach that serves an important feeder function to nourish beaches further downcoast. Goleta Reach – This segment lies between Goleta and the Santa Barbara Harbor. The beaches along this stretch of coast with the exception of Goleta County Beach and Leadbetter Beach are narrow and consist of relatively thin lenses of sand over bedrock. High bluffs back most beaches and the broad marine terrace areas that extend to the base of the Santa Ynez Mountains are densely populated. The reach’s terminus is the man-made littoral barrier at Santa Barbara Harbor. The harbor’s breakwaters, built in the late 1920s, restrict the natural alongshore movement of sand to beaches further east.
Santa Barbara Reach – This segment extends from Santa Barbara Harbor to Rincon Point. The coastline varies between areas of low lying topography and high coastal bluff areas. Within this densely populated shoreline reach the coastline transitions from an east-west alignment to a more southeasterly orientation. Beaches are generally narrow pockets of sand flanked by rocky points. Wider stretches of beach include East Beach, Summerland Beach, Padaro Beach, and Carpinteria Beach. The section of coast immediately northwest of Rincon Point marks the end of the wider marine terrace topography. The beach itself may also represent another important sand storage and feeder for the downcoast. Rincon Parkway Reach – The Rincon Parkway is located between Rincon Point and the Ventura River Delta. As a result of railroad and highway development that began in the late 1800s, the reach has evolved today into the most fortified section of coastline within the entire Santa Barbara Littoral Cell. Almost all of the shoreline is protected with either seawalls or revetments to protect development and infrastructure. This human intervention coupled with past encroachments on the beach at various times due to U.S Highway 101 expansion, has resulted in narrow to non-existent beaches and significant alteration to the natural shoreline processes. The reach is the last segment of mountainous coast. Oxnard Plain Reach – The section between the Ventura River and Port Hueneme Harbor opens into a broad and low lying alluvial plain that is dominated by the Ventura and Santa Clara Rivers, three man-made harbors, (Ventura, Channel Islands, and Port Hueneme Harbors, and one submarine canyon (Hueneme Submarine Canyon). With the exception of the gravel, boulders, and cobble beach at the Ventura River delta,
BEACON CRSMP Page 6 Final Report
Understanding Our Coast - Reaches
the shoreline is mostly long and wide sandy coast historically backed by dunes. Historical development since the late 1800s and mid 1900s has also significantly altered the reach. As a consequence, the densely populated shoreline has become dependant upon continued sand bypassing at Ventura Harbor to maintain natural sediment processes and conditions. Channel Islands Harbor, located near the end of the reach, has helped to maintain wide beaches along Hollywood Beach. However the harbor was originally built in 1970 partly out of the need to remedy the littoral barrier created by the 1940 construction of Port Hueneme Harbor at the head of the Hueneme Submarine Canyon. Regular sand bypassing at Channel Islands Harbor is now necessary to maintain beaches east of Port Hueneme and to a less extent at the adjacent Silverstrand Beach.
Submarine Canyon Reach – This reach extends from Hueneme Submarine Canyon at the entrance to Port Hueneme Harbor to the Mugu Submarine Canyon. Although the shoreline segment is fully developed within Port Hueneme at the western end, the reach opens into wider stretches of undeveloped wetlands, dune fields, and inaccessible low density military base land. The long sandy beaches are backed by the low lying topography of the alluvial plain. However because of the construction of Port Hueneme Harbor in 1940, the beaches are now completely dependant upon regular sand bypassing from the upcoast sand trap at Channel Islands Harbor to maintain conditions. The Mugu Submarine Canyon is the terminus of the reach and the entire Santa Barbara Littoral Cell. The canyon ultimately captures all of the sand from points to the west that propagates alongshore to it by waves and currents.
Figure 3. BEACON CRSMP Planning Reaches
BEACON CRSMP Page 7 Final Report
Understanding Our Coast – Basis of Understanding
The Basis of Understanding Since the 1940s a number of coastal studies and research have been performed to develop an understanding of the basic coastal processes, wave climate, and shoreline evolution that describe how the Santa Barbara and Ventura County coastline behaves. The U.S Army Corps of Engineers conducted some of the earliest review of the BEACON coast in the 1930s. The primary study focus at the time was the understanding of relevant shoreline processes and causes of beach erosion. In 1989, BEACON completed its Coastal Sand Management Plan. This study was one of the first efforts ever undertaken in California to better define the controlling shoreline processes, locate sediment resources, and formulate appropriate sediment management strategies to maintain beaches within the region. Additional data and information has become available more recently through technical studies, field data collection programs, and coastal projects. Studies conducted or underway include the Corps of Engineers’ Coast of California Storm and Tidal Waves Study, the USGS California Urban Ocean Project, and graduate research conducted at the UC Santa Cruz Institute of Marine Science and elsewhere. Additional data and information has also been produced from the results of more focused studies and projects such as BEACON’s South Central Coast Beach Enhancement Program (SCCBEP) development, the Goleta Beach Demonstration Project, and local agency projects such as Ventura’s Surfers Point Project and the County of Santa Barbara’s Goleta Beach Master Plan study and project.
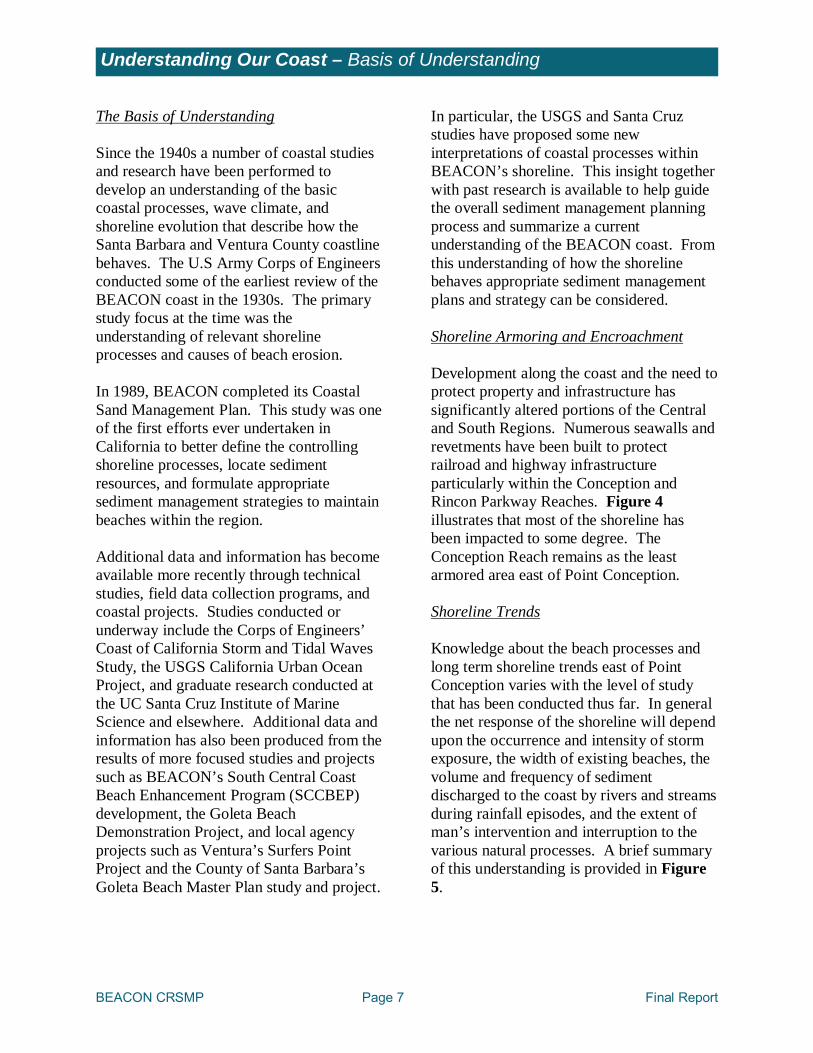
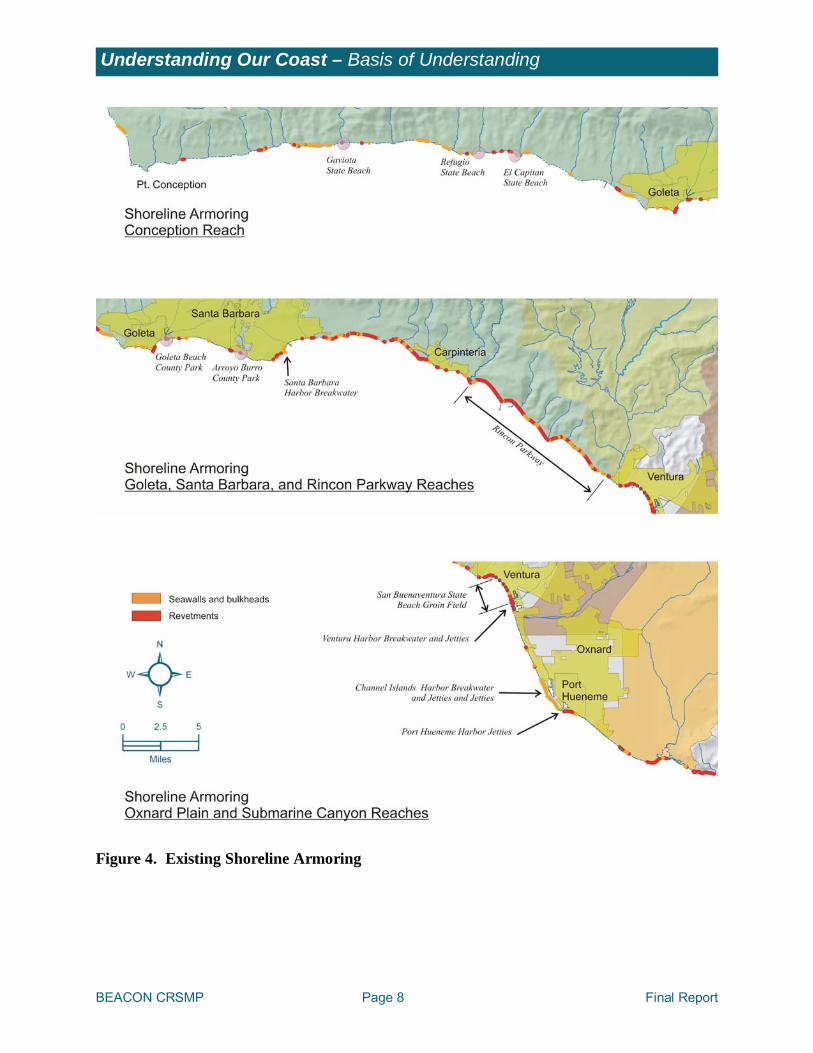
In particular, the USGS and Santa Cruz studies have proposed some new interpretations of coastal processes within BEACON’s shoreline. This insight together with past research is available to help guide the overall sediment management planning process and summarize a current understanding of the BEACON coast. From this understanding of how the shoreline behaves appropriate sediment management plans and strategy can be considered. Shoreline Armoring and Encroachment Development along the coast and the need to protect property and infrastructure has significantly altered portions of the Central and South Regions. Numerous seawalls and revetments have been built to protect railroad and highway infrastructure particularly within the Conception and Rincon Parkway Reaches. Figure 4 illustrates that most of the shoreline has been impacted to some degree. The Conception Reach remains as the least armored area east of Point Conception. Shoreline Trends Knowledge about the beach processes and long term shoreline trends east of Point Conception varies with the level of study that has been conducted thus far. In general the net response of the shoreline will depend upon the occurrence and intensity of storm exposure, the width of existing beaches, the volume and frequency of sediment discharged to the coast by rivers and streams during rainfall episodes, and the extent of man’s intervention and interruption to the various natural processes. A brief summary of this understanding is provided in Figure 5.
BEACON CRSMP Page 8 Final Report
Understanding Our Coast – Basis of Understanding
Figure 4. Existing Shoreline Armoring
BEACON CRSMP Page 9 Final Report
Understanding Our Coast – Basis of Understanding
Figure 5. Shoreline Trends between Point Conception and the Mugu Submarine Canyon
BEACON CRSMP Page 10 Final Report
Understanding Our Coast – Basis of Understanding
Littoral Sediment Sources:Fluvial The beaches within the BEACON Coast are naturally nourished by the tributary rivers and streams that discharge mainly from seven watersheds. The volume of sand and fine grained sediment that is delivered to the shoreline will vary from year to year in response to the amount of rainfall and runoff that occurs. East of Point Conception, littoral sediment supply is dominated by the Santa Ynez Mountains Watershed and the Ventura and Santa Clara Rivers. Alteration of the natural watershed to address flood protection or water storage needs has an impact to the shoreline in terms of reduced sediment supply to the coast. Over time the cumulative impacts of human interventions
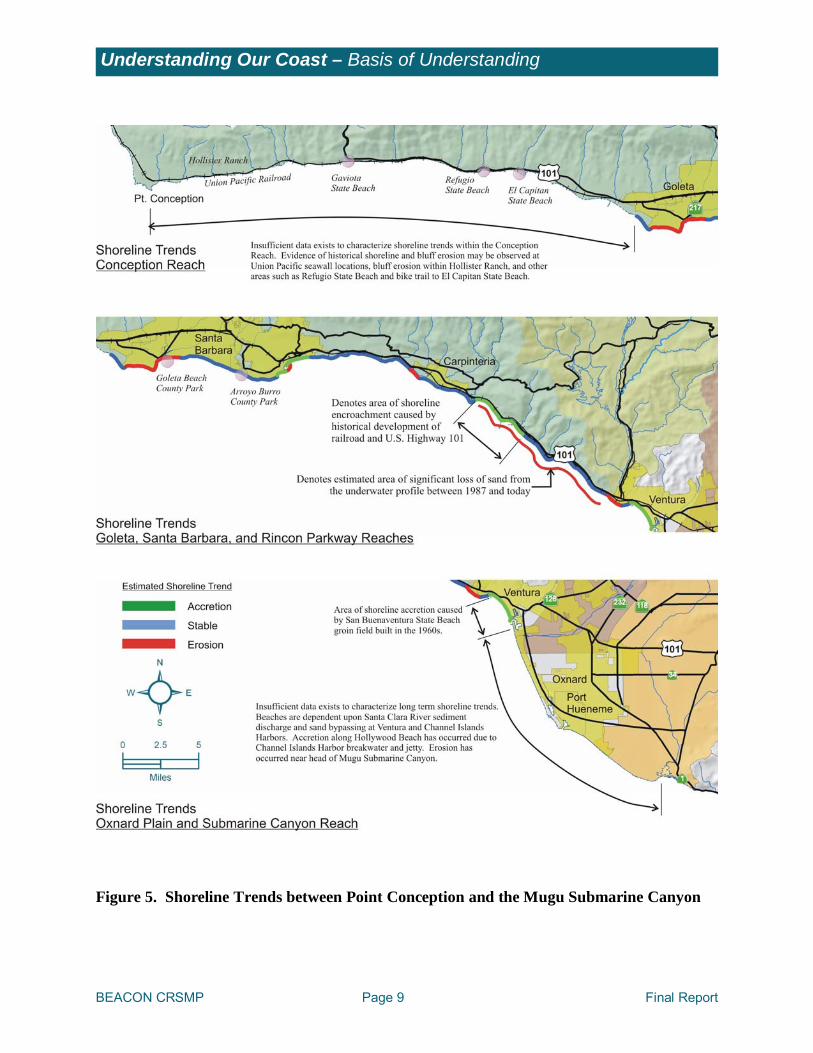
may result in diminishing beach widths or other impacts. The current understanding of reductions in the natural supply of sediment to the coast that has grain size greater than 0.062 millimeters (fine sand) from the major rivers and streams within the Central and South Region are summarized in Table 1. Construction of dams has been the major reason for the reduced delivery of sand to the beaches. Based upon Farnsworth and Warrick’s study (2007) the mean annual fine sediment contributions (silt and clay sized material) from rivers and streams can be at least as much as the corresponding sand delivery values or substantially higher.
Table 1. Estimated Sediment Supply to the Coast from Rivers and Streams
Fluvial Delivery Volume (cy/yr) Watershed Pre-dam Post-dam Reduction (%)
Santa Maria River 811,000 261,000 68
San Antonio Creek 60,000 (No dams) 0
Santa Ynez River 713,000 347,000 51
Santa Ynez Mountains Watershed 195,000 (No dams) 0
Ventura River 216,000 102,000 53
Santa Clara River 1,634,000 1,193,000 27
Calleguas Creek 65,000 (No dams) 0 Source: Willis and Griggs, 2003
Littoral Sediment Sources: Seacliffs The episodic erosion of seacliffs that occurs primarily between Point Conception and Santa Barbara is the other significant source of sediment that is naturally delivered to the shoreline. Estimates of the quantity of sand that enters the littoral system over time vary
between scientific studies. Runyan and Griggs (2003) have proposed that only sediment with grain sizes greater than 0.125 millimeters in diameter meaningfully contribute to nourishment of sandy beaches. Using this sediment size cutoff criteria the natural contribution from bluff erosion between Point Conception and Santa
BEACON CRSMP Page 11 Final Report
Understanding Our Coast – Basis of Understanding
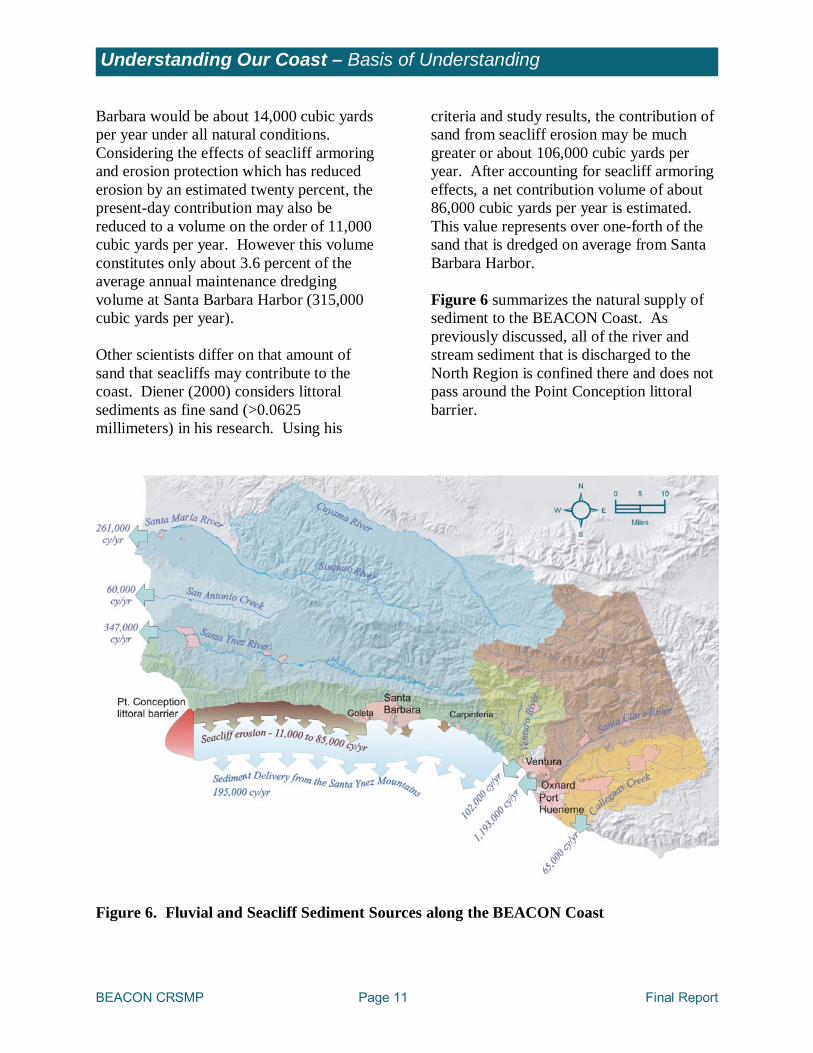
Barbara would be about 14,000 cubic yards per year under all natural conditions. Considering the effects of seacliff armoring and erosion protection which has reduced erosion by an estimated twenty percent, the present-day contribution may also be reduced to a volume on the order of 11,000 cubic yards per year. However this volume constitutes only about 3.6 percent of the average annual maintenance dredging volume at Santa Barbara Harbor (315,000 cubic yards per year). Other scientists differ on that amount of sand that seacliffs may contribute to the coast. Diener (2000) considers littoral sediments as fine sand (>0.0625 millimeters) in his research. Using his
criteria and study results, the contribution of sand from seacliff erosion may be much greater or about 106,000 cubic yards per year. After accounting for seacliff armoring effects, a net contribution volume of about 86,000 cubic yards per year is estimated. This value represents over one-forth of the sand that is dredged on average from Santa Barbara Harbor. Figure 6 summarizes the natural supply of sediment to the BEACON Coast. As previously discussed, all of the river and stream sediment that is discharged to the North Region is confined there and does not pass around the Point Conception littoral barrier.
Figure 6. Fluvial and Seacliff Sediment Sources along the BEACON Coast
BEACON CRSMP Page 12 Final Report
Understanding Our Coast – Basis of Understanding
Other Available Sand Sources In addition to the natural supply of sediments, additional sources exist within the BEACON Coast that may be considered to supplement the natural processes. Sources include:
Debris basin sediment
Trapped sediment behind dams
Estuarine deposits
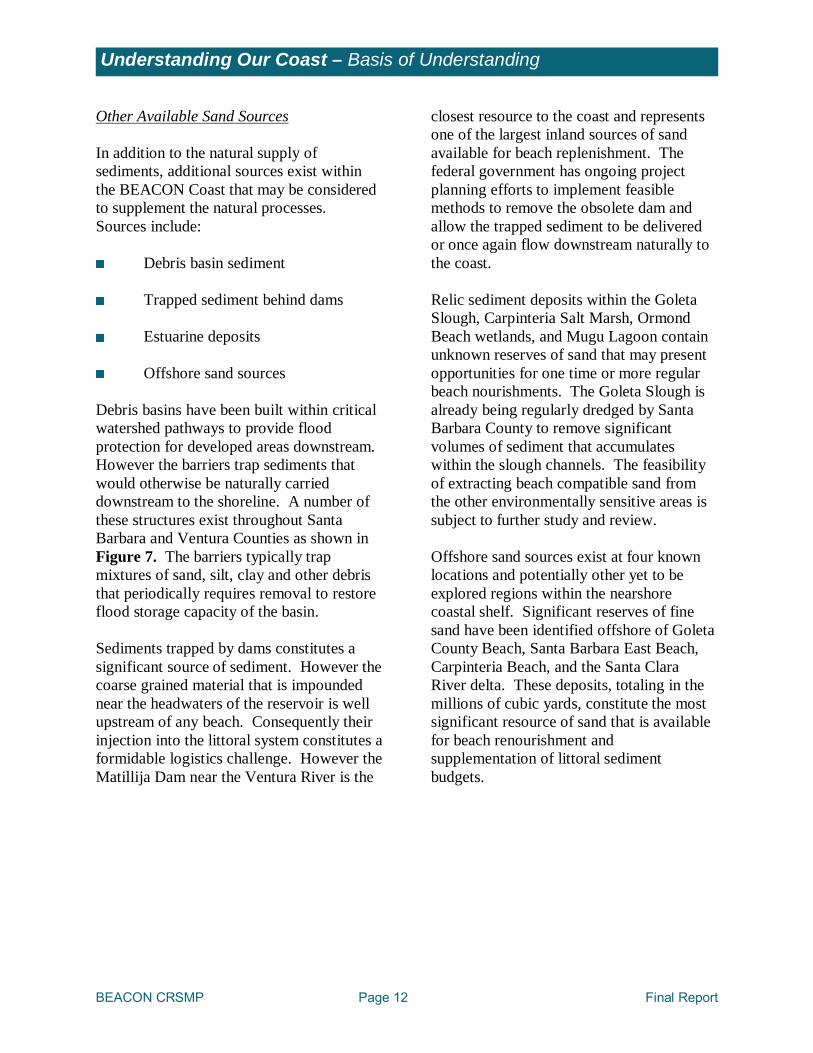
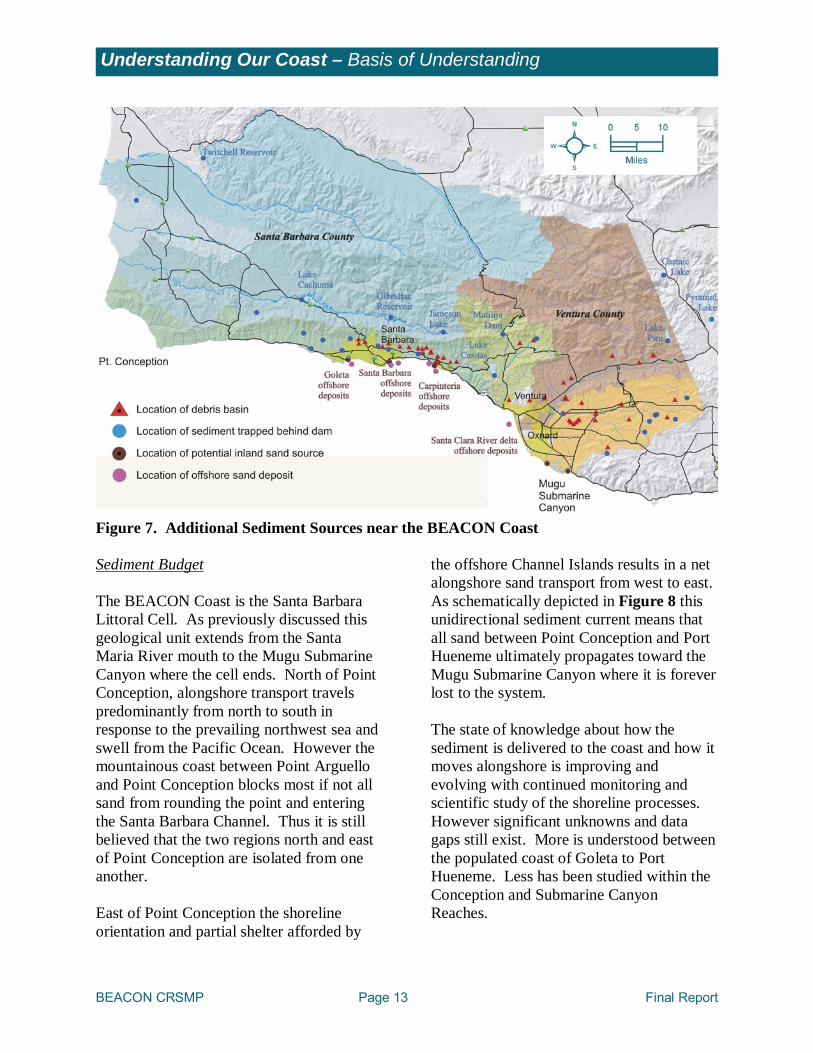
Offshore sand sources Debris basins have been built within critical watershed pathways to provide flood protection for developed areas downstream. However the barriers trap sediments that would otherwise be naturally carried downstream to the shoreline. A number of these structures exist throughout Santa Barbara and Ventura Counties as shown in Figure 7. The barriers typically trap mixtures of sand, silt, clay and other debris that periodically requires removal to restore flood storage capacity of the basin. Sediments trapped by dams constitutes a significant source of sediment. However the coarse grained material that is impounded near the headwaters of the reservoir is well upstream of any beach. Consequently their injection into the littoral system constitutes a formidable logistics challenge. However the Matillija Dam near the Ventura River is the
closest resource to the coast and represents one of the largest inland sources of sand available for beach replenishment. The federal government has ongoing project planning efforts to implement feasible methods to remove the obsolete dam and allow the trapped sediment to be delivered or once again flow downstream naturally to the coast. Relic sediment deposits within the Goleta Slough, Carpinteria Salt Marsh, Ormond Beach wetlands, and Mugu Lagoon contain unknown reserves of sand that may present opportunities for one time or more regular beach nourishments. The Goleta Slough is already being regularly dredged by Santa Barbara County to remove significant volumes of sediment that accumulates within the slough channels. The feasibility of extracting beach compatible sand from the other environmentally sensitive areas is subject to further study and review. Offshore sand sources exist at four known locations and potentially other yet to be explored regions within the nearshore coastal shelf. Significant reserves of fine sand have been identified offshore of Goleta County Beach, Santa Barbara East Beach, Carpinteria Beach, and the Santa Clara River delta. These deposits, totaling in the millions of cubic yards, constitute the most significant resource of sand that is available for beach renourishment and supplementation of littoral sediment budgets.
BEACON CRSMP Page 13 Final Report
Understanding Our Coast – Basis of Understanding
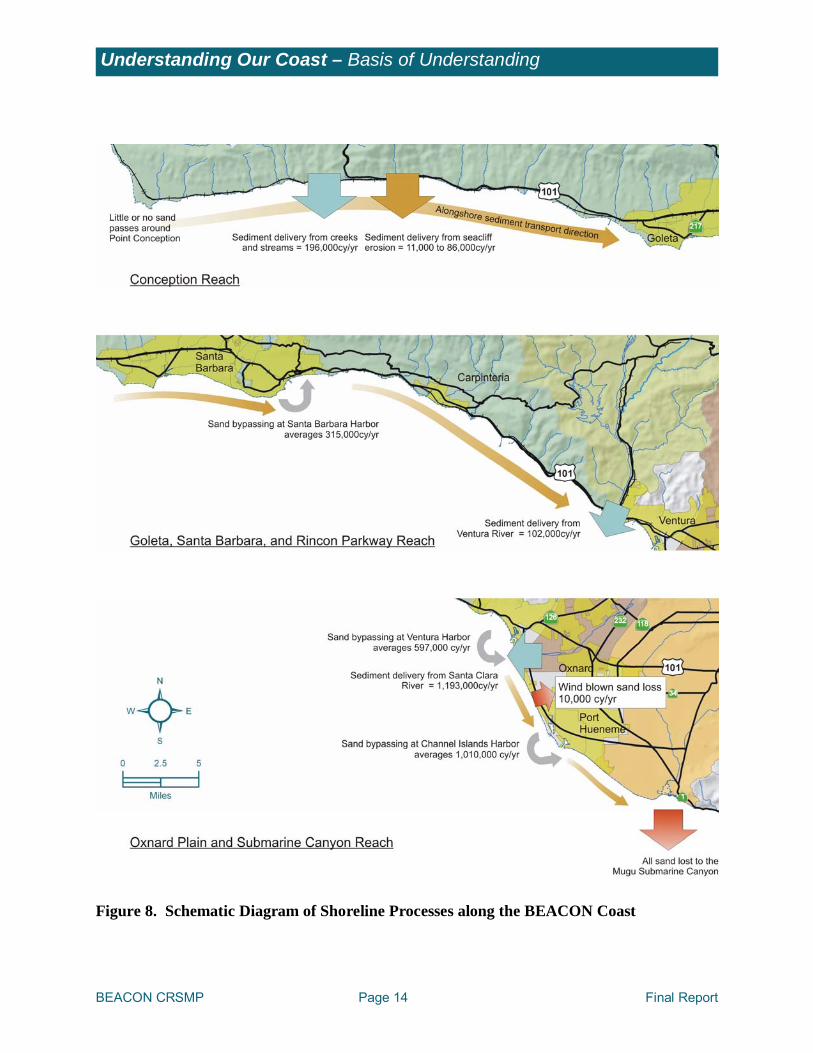
Figure 7. Additional Sediment Sources near the BEACON Coast Sediment Budget The BEACON Coast is the Santa Barbara Littoral Cell. As previously discussed this geological unit extends from the Santa Maria River mouth to the Mugu Submarine Canyon where the cell ends. North of Point Conception, alongshore transport travels predominantly from north to south in response to the prevailing northwest sea and swell from the Pacific Ocean. However the mountainous coast between Point Arguello and Point Conception blocks most if not all sand from rounding the point and entering the Santa Barbara Channel. Thus it is still believed that the two regions north and east of Point Conception are isolated from one another. East of Point Conception the shoreline orientation and partial shelter afforded by
the offshore Channel Islands results in a net alongshore sand transport from west to east. As schematically depicted in Figure 8 this unidirectional sediment current means that all sand between Point Conception and Port Hueneme ultimately propagates toward the Mugu Submarine Canyon where it is forever lost to the system. The state of knowledge about how the sediment is delivered to the coast and how it moves alongshore is improving and evolving with continued monitoring and scientific study of the shoreline processes. However significant unknowns and data gaps still exist. More is understood between the populated coast of Goleta to Port Hueneme. Less has been studied within the Conception and Submarine Canyon Reaches.
BEACON CRSMP Page 14 Final Report
Understanding Our Coast – Basis of Understanding
Figure 8. Schematic Diagram of Shoreline Processes along the BEACON Coast
BEACON CRSMP Page 15 Final Report
Understanding Our Coast – Basis of Understanding
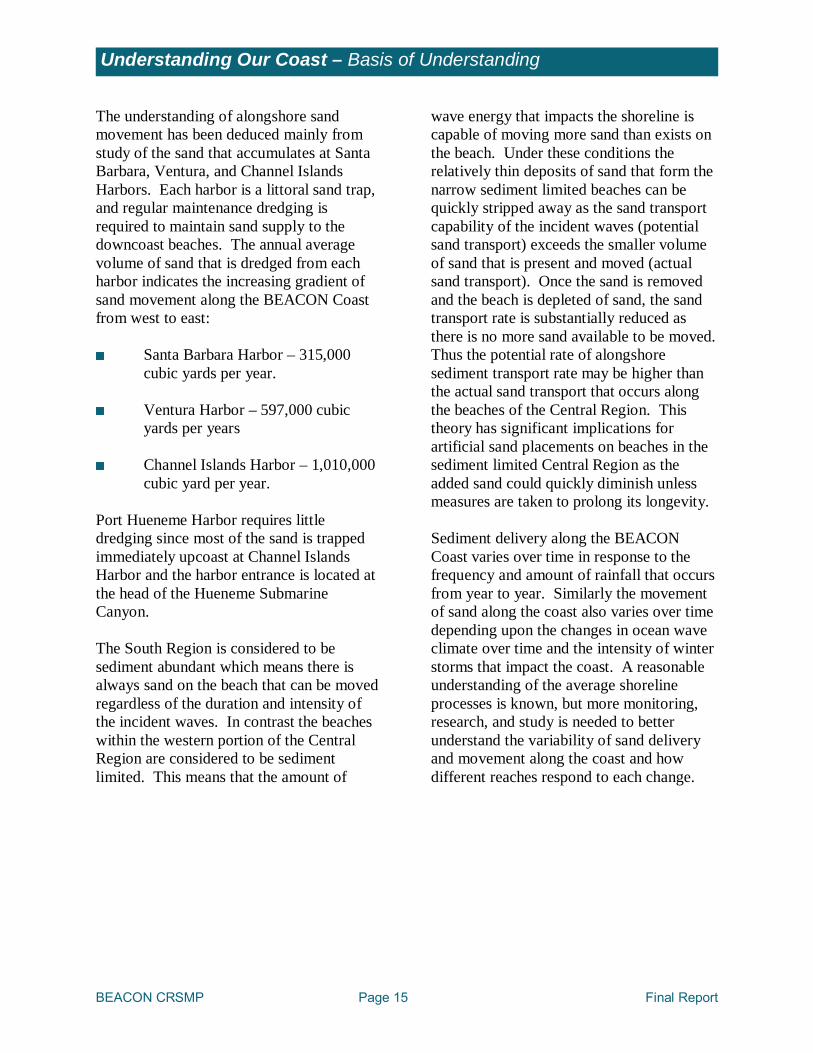
The understanding of alongshore sand movement has been deduced mainly from study of the sand that accumulates at Santa Barbara, Ventura, and Channel Islands Harbors. Each harbor is a littoral sand trap, and regular maintenance dredging is required to maintain sand supply to the downcoast beaches. The annual average volume of sand that is dredged from each harbor indicates the increasing gradient of sand movement along the BEACON Coast from west to east:
Santa Barbara Harbor – 315,000 cubic yards per year.
Ventura Harbor – 597,000 cubic
yards per years
Channel Islands Harbor – 1,010,000 cubic yard per year.
Port Hueneme Harbor requires little dredging since most of the sand is trapped immediately upcoast at Channel Islands Harbor and the harbor entrance is located at the head of the Hueneme Submarine Canyon. The South Region is considered to be sediment abundant which means there is always sand on the beach that can be moved regardless of the duration and intensity of the incident waves. In contrast the beaches within the western portion of the Central Region are considered to be sediment limited. This means that the amount of
wave energy that impacts the shoreline is capable of moving more sand than exists on the beach. Under these conditions the relatively thin deposits of sand that form the narrow sediment limited beaches can be quickly stripped away as the sand transport capability of the incident waves (potential sand transport) exceeds the smaller volume of sand that is present and moved (actual sand transport). Once the sand is removed and the beach is depleted of sand, the sand transport rate is substantially reduced as there is no more sand available to be moved. Thus the potential rate of alongshore sediment transport rate may be higher than the actual sand transport that occurs along the beaches of the Central Region. This theory has significant implications for artificial sand placements on beaches in the sediment limited Central Region as the added sand could quickly diminish unless measures are taken to prolong its longevity. Sediment delivery along the BEACON Coast varies over time in response to the frequency and amount of rainfall that occurs from year to year. Similarly the movement of sand along the coast also varies over time depending upon the changes in ocean wave climate over time and the intensity of winter storms that impact the coast. A reasonable understanding of the average shoreline processes is known, but more monitoring, research, and study is needed to better understand the variability of sand delivery and movement along the coast and how different reaches respond to each change.
BEACON CRSMP Page 16 Final Report
Challenges and Opportunities
From a general perspective, the BEACON shoreline is one that has been significantly altered since the early 1900’s as a consequence of the population and development growth that accelerated during the middle portion of the 20th century. The ensuing development encroachment, infrastructure protection, disruption to watersheds, and other human interventions that occurred over this period impacted much of the Santa Barbara and Ventura Counties shoreline and its natural processes. By necessity certain man-made solutions were needed to restore and maintain the imbalances that resulted. However, specific actions have spawned conflict between advocates of shoreline retreat and abandonment to reverse adverse conditions vs. those who prefer to integrate urbanization with environmentally sensitive planning and solutions. Within the coastal zone political compromises often do not satisfy the technical and scientific requirements for an adequate and complete solution. Sediment management issues span a diverse group of agencies and stakeholders that are directly or indirectly impacted by attempts to balance natural processes with the multiple competing needs and interests. For example, harbors may be reluctant to relinquish control over their sediment sources, and watershed districts may rank upland priorities above the needs of the shoreline. In the absence of collaboration, finding areas of common ground to beneficially reuse sediment or preserve the natural supply of sand to the coast will be difficult. Presently there are conflicting priorities on how the available sediment resources within the region should be used. Offshore sand
resources contain finite amounts of beach compatible material. Taking sand from some of the known areas may raise concerns about permanent loss to habitats. Decisions will need to be made concerning the types of habitats that are impacted and if the resource in question is sufficiently abundant or can be enhanced elsewhere so that careful offshore mining of sand can proceed. Clearly beach preservation within some areas of the BEACON shoreline will depend upon the ability to find appropriate ways to retain and preserve existing beaches. Traditional practices of sand retention solutions will not be appropriate on the BEACON Coast. However, it is becoming more apparent that without some means to increase the longevity of sand on the beach, opportunities to preserve, restore, or enhance beaches will become less feasible particularly in Santa Barbara County. Sediment management is currently constrained by funding limitations. The cost of meaningful projects can often exceed the ability of local agencies to implement unless there is substantial state and federal funding participation. Lastly, the sediment management permit process is onerous. Specific project proposals or strategies must comply with special conditions that are daunting and costly. The myriad of permit requirements, overlapping and inconsistent authorities, and approvals that must be obtained can discourage participation in the most basic of sediment management activities such as sand of opportunity contributions. On a larger scale resource agencies have an inherent discomfort with beach nourishment projects unless all aspects of the project description are detailed to a level of certainty that may exceed the engineers’ and
BEACON CRSMP Page 17 Final Report
Challenges and Opportunities
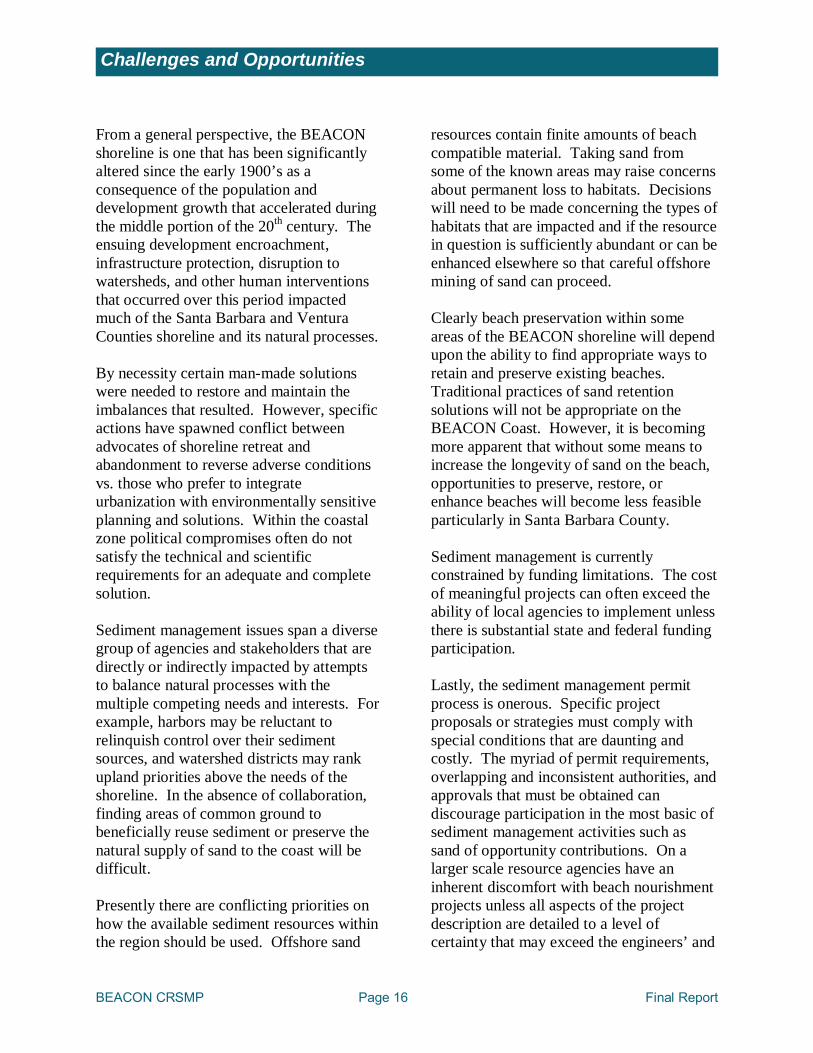
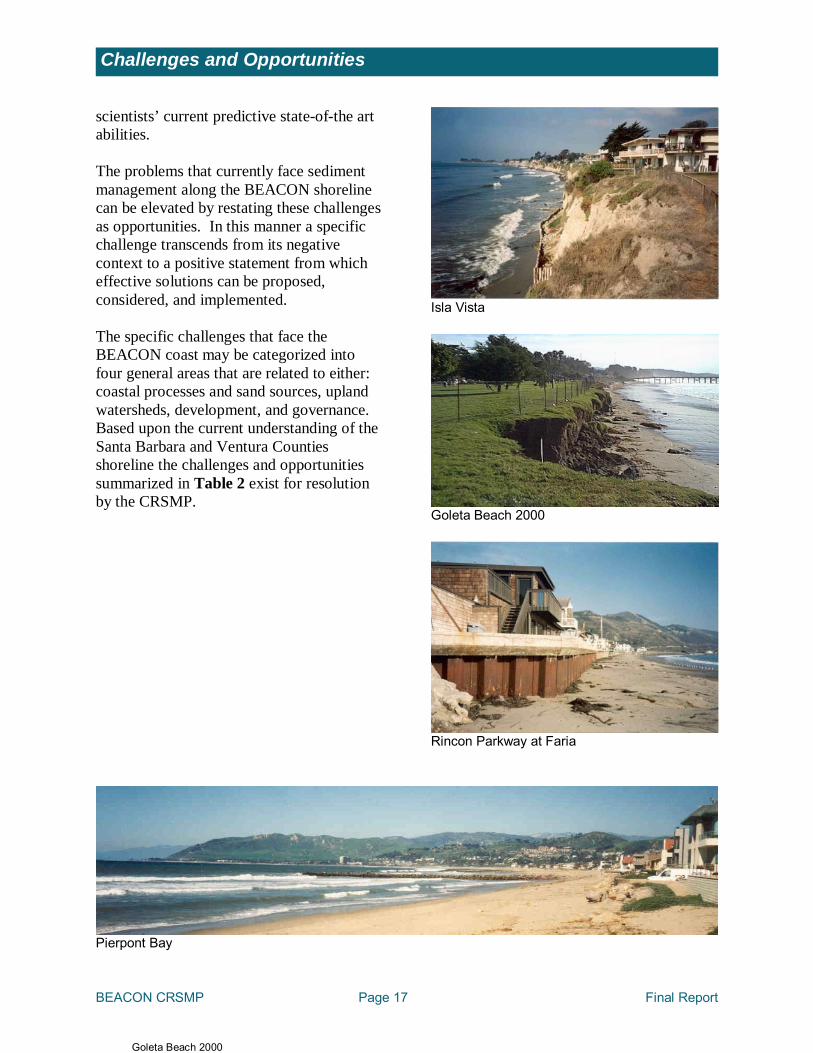
scientists’ current predictive state-of-the art abilities. The problems that currently face sediment management along the BEACON shoreline can be elevated by restating these challenges as opportunities. In this manner a specific challenge transcends from its negative context to a positive statement from which effective solutions can be proposed, considered, and implemented. The specific challenges that face the BEACON coast may be categorized into four general areas that are related to either: coastal processes and sand sources, upland watersheds, development, and governance. Based upon the current understanding of the Santa Barbara and Ventura Counties shoreline the challenges and opportunities summarized in Table 2 exist for resolution by the CRSMP.
Isla Vista
Goleta Beach 2000
Rincon Parkway at Faria
Pierpont Bay
Goleta Beach 2000
BEACON CRSMP Page 18 Final Report
Challenges and Opportunities
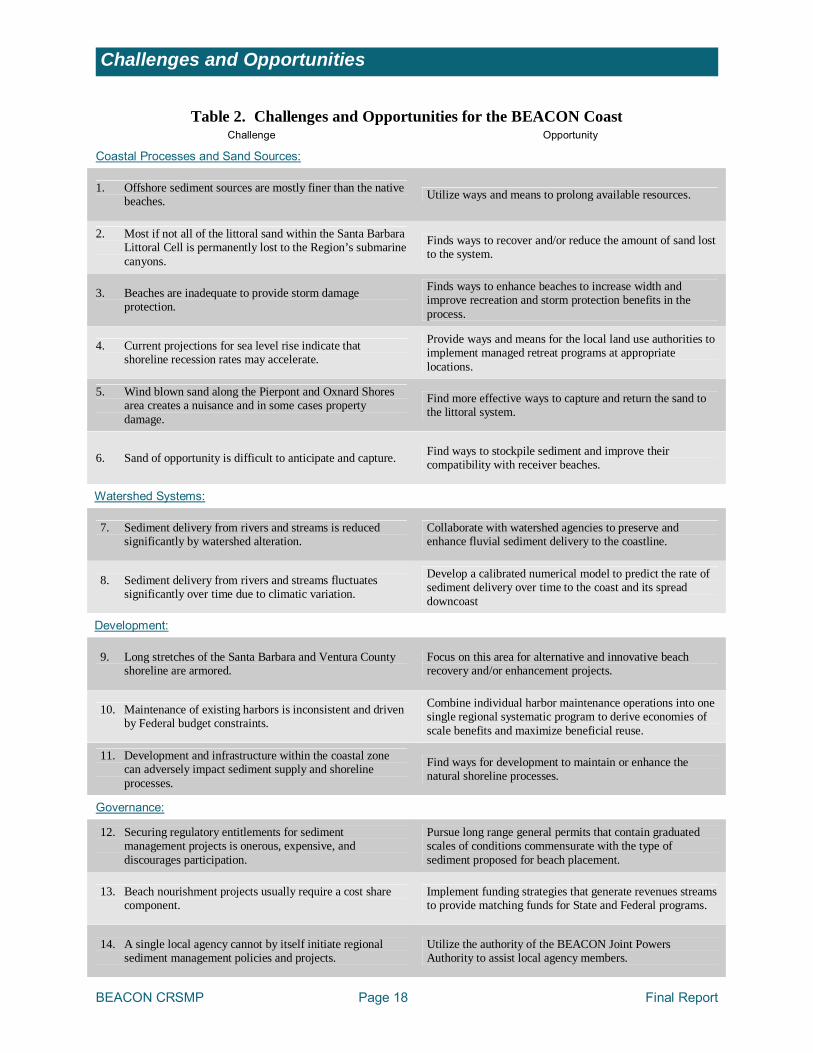
Table 2. Challenges and Opportunities for the BEACON Coast Challenge Opportunity
Coastal Processes and Sand Sources:
1. Offshore sediment sources are mostly finer than the native beaches. Utilize ways and means to prolong available resources.
2. Most if not all of the littoral sand within the Santa Barbara Littoral Cell is permanently lost to the Region’s submarine canyons.
Finds ways to recover and/or reduce the amount of sand lost to the system.
3. Beaches are inadequate to provide storm damage protection.
Finds ways to enhance beaches to increase width and improve recreation and storm protection benefits in the process.
4. Current projections for sea level rise indicate that shoreline recession rates may accelerate.
Provide ways and means for the local land use authorities to implement managed retreat programs at appropriate locations.
5. Wind blown sand along the Pierpont and Oxnard Shores area creates a nuisance and in some cases property damage.
Find more effective ways to capture and return the sand to the littoral system.
6. Sand of opportunity is difficult to anticipate and capture. Find ways to stockpile sediment and improve their compatibility with receiver beaches.
Watershed Systems:
7. Sediment delivery from rivers and streams is reduced significantly by watershed alteration.
Collaborate with watershed agencies to preserve and enhance fluvial sediment delivery to the coastline.
8. Sediment delivery from rivers and streams fluctuates significantly over time due to climatic variation.
Develop a calibrated numerical model to predict the rate of sediment delivery over time to the coast and its spread downcoast
Development:
9. Long stretches of the Santa Barbara and Ventura County shoreline are armored.
Focus on this area for alternative and innovative beach recovery and/or enhancement projects.
10. Maintenance of existing harbors is inconsistent and driven by Federal budget constraints.
Combine individual harbor maintenance operations into one single regional systematic program to derive economies of scale benefits and maximize beneficial reuse.
11. Development and infrastructure within the coastal zone can adversely impact sediment supply and shoreline processes.
Find ways for development to maintain or enhance the natural shoreline processes.
Governance:
12. Securing regulatory entitlements for sediment management projects is onerous, expensive, and discourages participation.
Pursue long range general permits that contain graduated scales of conditions commensurate with the type of sediment proposed for beach placement.
13. Beach nourishment projects usually require a cost share component.
Implement funding strategies that generate revenues streams to provide matching funds for State and Federal programs.
14. A single local agency cannot by itself initiate regional sediment management policies and projects.
Utilize the authority of the BEACON Joint Powers Authority to assist local agency members.
BEACON CRSMP Page 19 Final Report
The Plan – Key Objectives
As previously discussed the six planning reaches within the BEACON Central and South Region are distinguished from one another by their unique differences in shoreline characteristics and land uses. The different physical settings, micro-climates and wave exposures within these reaches have influenced in part where communities have developed and recreational opportunities exist. The diversity of the BEACON shoreline suggests that its CRSMP should consist of a suite of equally diverse strategy, policy, and capital projects to effectively respond to the following specific sediment management challenges and needs of the area:
Beach preservation and maintenance
Beneficial reuse of sand trapped at harbors
Preservation of natural sources of
sediment delivery
Beneficial retrieval of offshore and inland sand sources to supplement existing coastal sediment resources
Implementation of innovative and
alternative technology to maximize the longevity of sand on the beach
Funding needs
Beach Preservation and Maintenance The Santa Barbara County coastline is generally characterized as being sediment limited and more vulnerable to differences in sediment supply to the coast and the natural transport processes associated with waves and currents. These conditions imply that portions of the Central Region would benefit from sand nourishments that are implemented appropriately to maintain the
existing sandy beach or enhance areas that are currently experiencing sediment deficiencies and need of sand. Conversely the low lying sand abundant shoreline within the South Region has naturally longer and wider beaches. The greater volumes of sand that are periodically delivered to the South Region by the Ventura and Santa Clara Rivers define the health and condition of the region. This relative sediment abundance of the shoreline between the Ventura River and the Mugu Submarine Canyon suggests that beach preservation strategies are more appropriate to maintain the existing abundant conditions. Beneficial Reuse of Harbor Trapped Sand The four harbors within the BEACON Coast extend from Santa Barbara to Port Hueneme. The early experiences associated with the construction of Santa Barbara Harbor in the 1930s demonstrated the impacts that each facility can have on the shoreline unless efforts are maintained to keep sand moving around the breakwater and jetty barriers. Therefore Santa Barbara, Ventura, and Channel Islands Harbors are regularly dredged to maintain their navigation channels and to keep sand moving past them to maintain the beaches downcoast. Port Hueneme Harbor does not trap much sand because the entrance channel was built at the head of the Hueneme Submarine Canyon. Nearly all of the alongshore sand transport is trapped at Channel Islands Harbor. From there it is bypassed past Port Hueneme Harbor to Hueneme Beach thereby obviating the need to dredge at Port Hueneme. Given the potential impact each harbor can have on the natural system it is important to preserve the existing practice of sand bypassing and maximize opportunities
BEACON CRSMP Page 20 Final Report
The Plan – Key Objectives
whereby the trapped sediments may be placed on the nearby beaches to derive the maximum benefit. Natural Sediment Sources The most significant source of natural sediment supply to the BEACON Coast is that delivered by the numerous creeks, streams, and rivers that discharge within the different regions. The Ventura River and Santa Clara River are the most dominant sources, but the sediment budget is also critically dependant upon the lesser known and smaller streams that drain the southern face of the Santa Ynez Mountains watershed within the Conception Reach. Seacliff sediments provide an important contribution along the Central Region. Preservation of the major natural sources of sediment to the coast should remain a priority. Supplemental Sand Sources Ways and means to appropriately inject additional sources of sand into the littoral system should remain a high priority. Continued exploration and confirmation of offshore sand reserves will provide BEACON with the resources to address long term deficiencies in sediment supply on a larger scale. Capture of beach compatible sediments from inland sources that otherwise might not find their way to the shoreline will be beneficial to the beaches. BEACON has been a leading agency in the effort to permit and import sand of opportunity whenever and wherever it becomes available through its South Central Coast Beach Enhancement Program (SCCBEP). The effort seeks to encourage capture of those relatively small volumes of sand that can become available when debris basins are emptied or excavations occur at coastal developments. Five beaches (Goleta
County Beach, Carptineria City Beach, Oil Piers Beach, Surfers Point, and Hueneme Beach) have been designated by BEACON thus far to receive beach compatible sediments when they are volunteered from third parties and when the regulatory agencies approve of the action. The probable volume of sand that may become available in any given year may be small. Because of the very nature of the program the source of sand is generally not known until it becomes offered. Therefore the program can benefit from the development of one or more regional stockpile and processing centers as a means to capture more material and distribute sand to priority beaches where it is needed and when it can make the greatest difference. Innovative Technology to Maximize Sand Longevity on the Beach The BEACON Coast is unique in that the alongshore sediment transport along its shoreline is predominantly unidirectional. This characteristic coupled with the more sediment limited beaches of Santa Barbara County places additional constraints upon the feasibility of beach preservation and nourishment projects. Sand that is placed upon the beach without some form of retention strategy will be short lived. Therefore preservation of existing beaches and enhancement efforts will only be effective when combined with appropriate ways to retain sand. Traditional coastal structures such as groins and breakwaters have been used effectively to stabilize beaches in the past, however their use in the future is unlikely to be favored. The challenge then is to find an effective sand retention methodology that is environmentally consistent with the BEACON Coast. In response to this
BEACON CRSMP Page 21 Final Report
The Plan – Key Objectives
challenge the BEACON CRSMP should seek ways to demonstrate and implement new and innovative sand retention technologies that are more compatible with the Santa Barbara and Ventura Counties shoreline setting and provide multi-purpose benefits of beach preservation, biological enhancement, and increased recreation opportunities. The demonstration project at Oil Piers that is being tested in collaboration with the U.S. Army Corps of Engineers presents a promising submerged reef methodology that if successful can lead to new opportunities for innovative beach restoration, preservation, and enhancement. Funding Needs The economic realties associated with coastal sediment management and projects implementation dictates that funding sources and revenue streams be in place to pay for the expensive capital costs that are inherent in the program. Research conducted by the State of California and Dr. Philip King for BEACON’s CRSMP have demonstrated the economic value of beaches and the return on investment that can be gained by restoring and maintaining them. Collaboration with state and federal agencies will remain in the foreseeable future as the most viable means to fund sediment management and beach
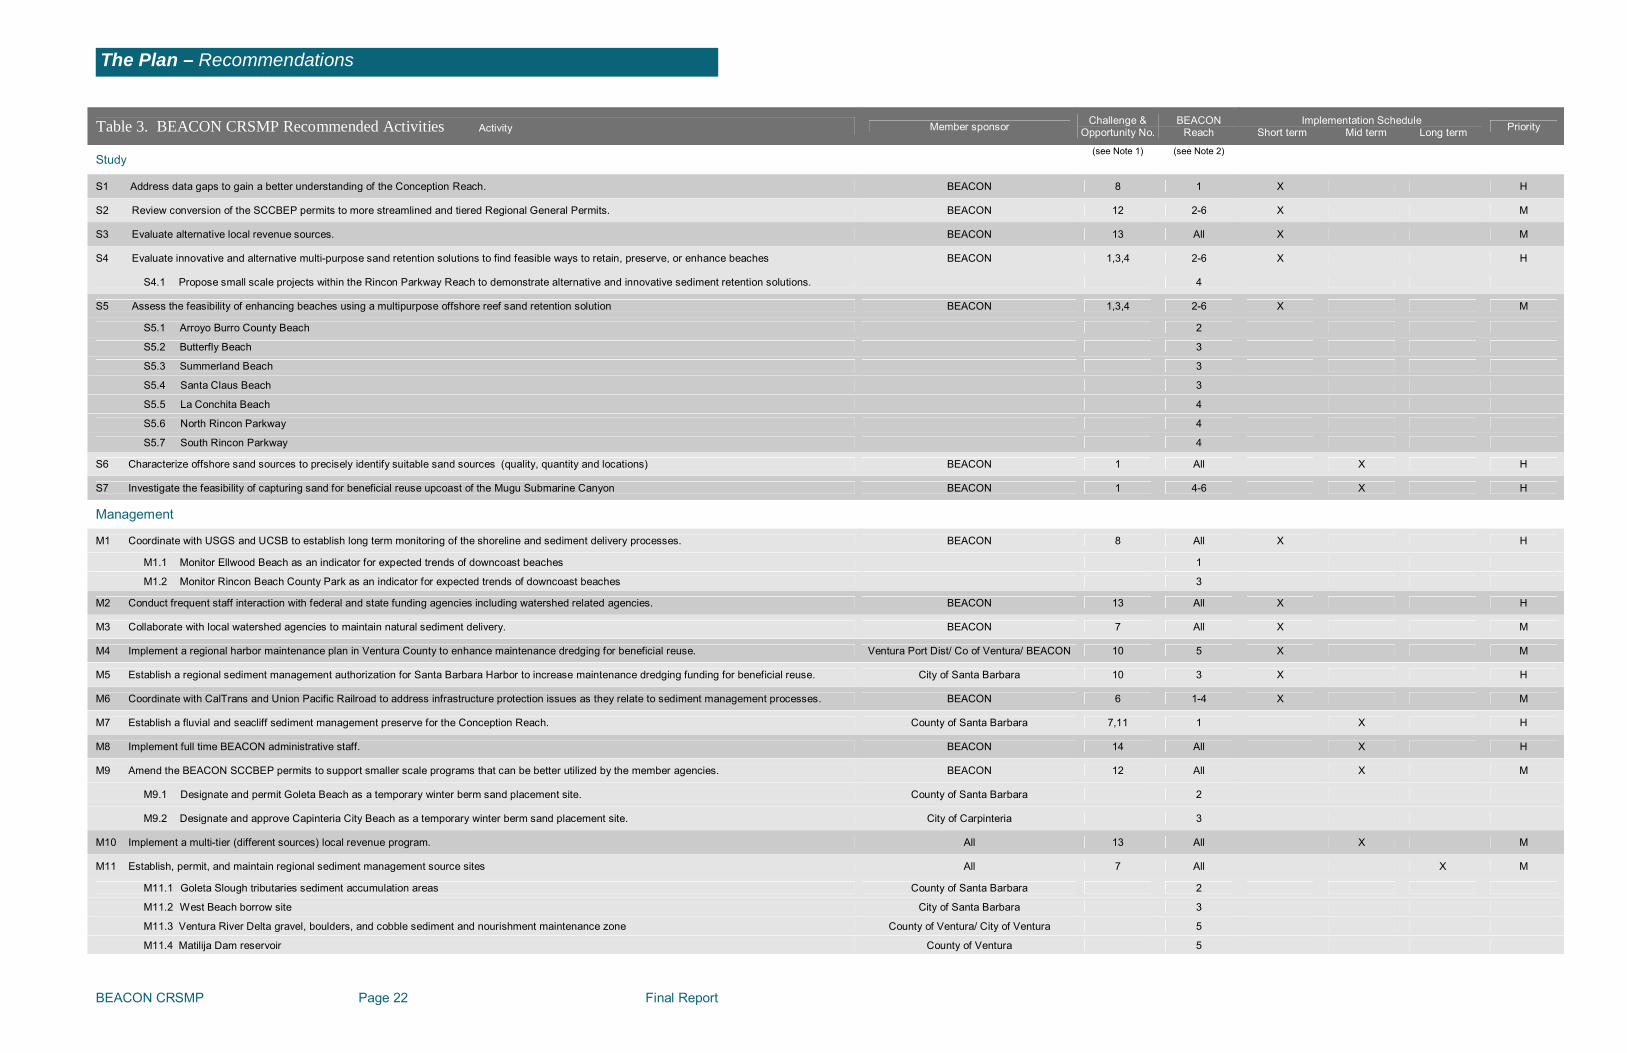
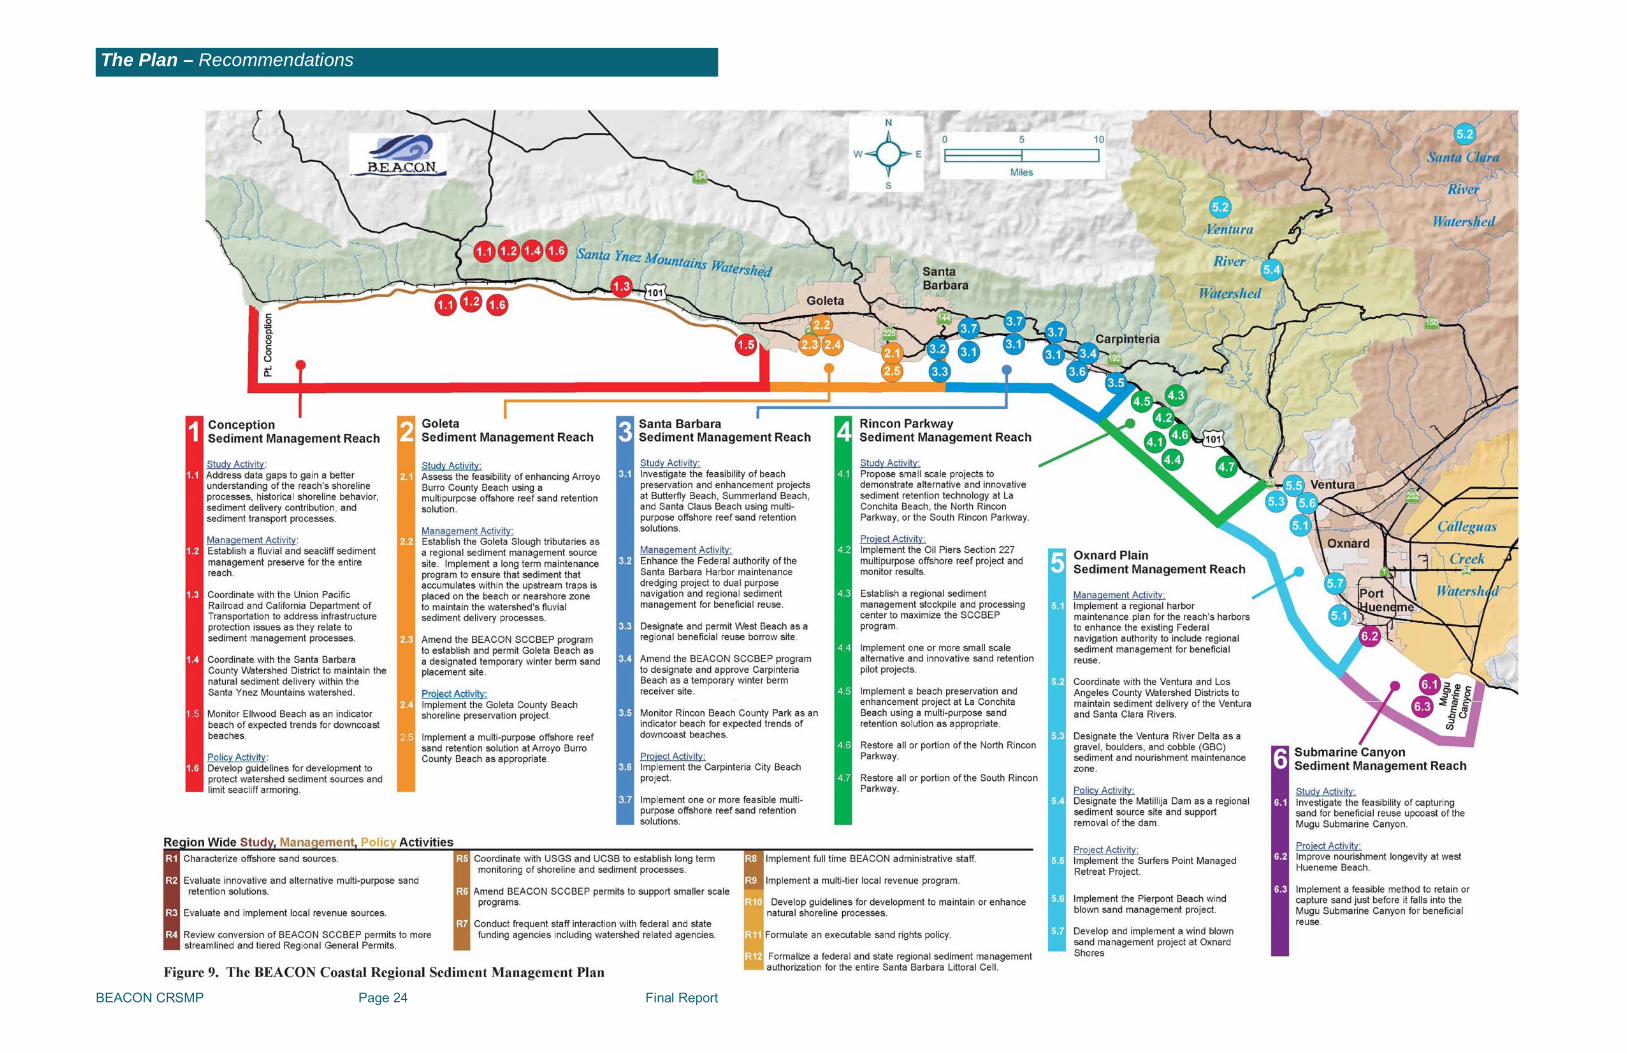
preservation and enhancement programs. This partnership will continue to require local cost sharing in order to move forward. Therefore the scope of BEACON’s CRSMP will depend upon the ability to develop and maintain the minimal funding streams necessary to produce the required state and federal matching fund percentages. Recommended Activities The above general concepts have been formulated into a suite of recommended studies, management strategy, policy, and capital projects that are summarized in Table 3. Collectively they represent the specific recommended activities for the BEACON CRSMP. A graphical summary of the Plan is shown in Figure 9. The Plan includes a number of regional and reach specific activities. Those that are common to the entire BEACON Coast such as strategy and governance issues are best addressed from the regional perspective. Commensurate with the diversity of the BEACON Coast is a list of specific activities on a reach by reach basis. These recommended studies, management practices, policies, or capital projects proposals are geographically divided into the unique stretch of coastline where they apply.
BEACON CRSMP Page 22 Final Report
The Plan – Recommendations
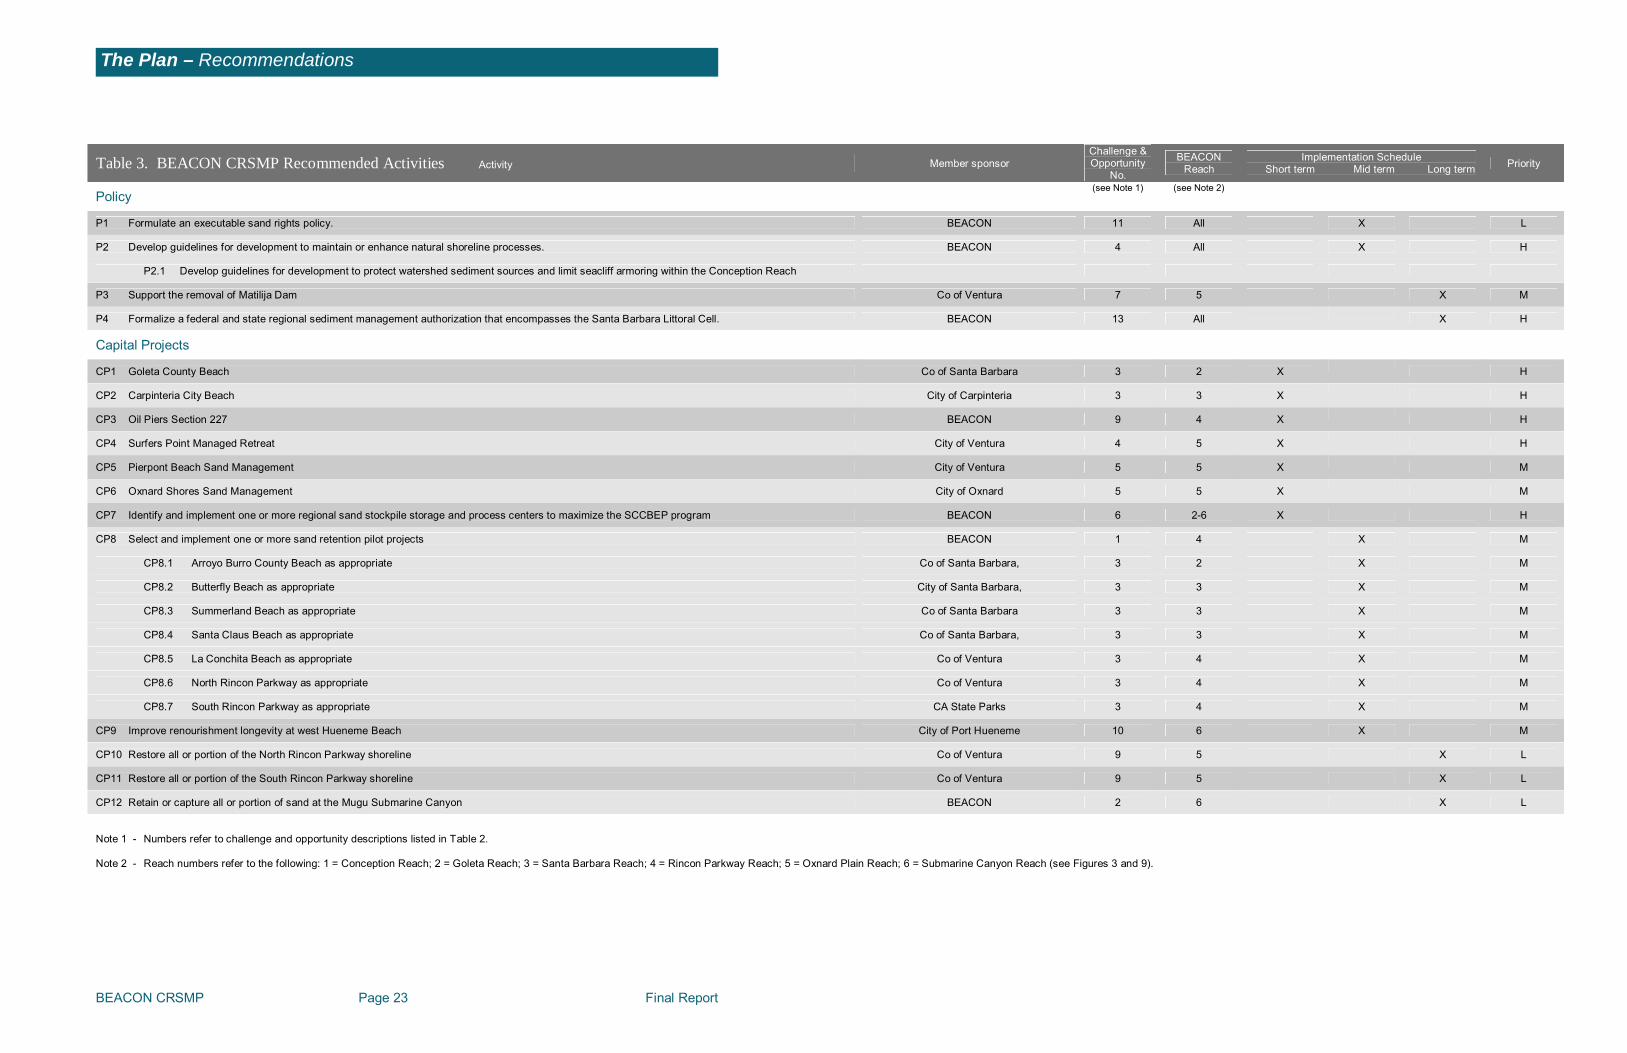
Table 3. BEACON CRSMP Recommended Activities Activity Member sponsor Challenge & Opportunity No.
BEACON Reach
Implementation Schedule Short term Mid term Long term Priority
Study (see Note 1) (see Note 2)
S1 Address data gaps to gain a better understanding of the Conception Reach. BEACON 8 1 X H
S2 Review conversion of the SCCBEP permits to more streamlined and tiered Regional General Permits. BEACON 12 2-6 X M
S3 Evaluate alternative local revenue sources. BEACON 13 All X M
S4 Evaluate innovative and alternative multi-purpose sand retention solutions to find feasible ways to retain, preserve, or enhance beaches BEACON 1,3,4 2-6 X H
S4.1 Propose small scale projects within the Rincon Parkway Reach to demonstrate alternative and innovative sediment retention solutions. 4
S5 Assess the feasibility of enhancing beaches using a multipurpose offshore reef sand retention solution BEACON 1,3,4 2-6 X M
S5.1 Arroyo Burro County Beach 2
S5.2 Butterfly Beach 3
S5.3 Summerland Beach 3
S5.4 Santa Claus Beach 3
S5.5 La Conchita Beach 4
S5.6 North Rincon Parkway 4
S5.7 South Rincon Parkway 4
S6 Characterize offshore sand sources to precisely identify suitable sand sources (quality, quantity and locations) BEACON 1 All X H
S7 Investigate the feasibility of capturing sand for beneficial reuse upcoast of the Mugu Submarine Canyon BEACON 1 4-6 X H
Management
M1 Coordinate with USGS and UCSB to establish long term monitoring of the shoreline and sediment delivery processes. BEACON 8 All X H
M1.1 Monitor Ellwood Beach as an indicator for expected trends of downcoast beaches 1
M1.2 Monitor Rincon Beach County Park as an indicator for expected trends of downcoast beaches 3
M2 Conduct frequent staff interaction with federal and state funding agencies including watershed related agencies. BEACON 13 All X H
M3 Collaborate with local watershed agencies to maintain natural sediment delivery. BEACON 7 All X M
M4 Implement a regional harbor maintenance plan in Ventura County to enhance maintenance dredging for beneficial reuse. Ventura Port Dist/ Co of Ventura/ BEACON 10 5 X M
M5 Establish a regional sediment management authorization for Santa Barbara Harbor to increase maintenance dredging funding for beneficial reuse. City of Santa Barbara 10 3 X H
M6 Coordinate with CalTrans and Union Pacific Railroad to address infrastructure protection issues as they relate to sediment management processes. BEACON 6 1-4 X M
M7 Establish a fluvial and seacliff sediment management preserve for the Conception Reach. County of Santa Barbara 7,11 1 X H
M8 Implement full time BEACON administrative staff. BEACON 14 All X H
M9 Amend the BEACON SCCBEP permits to support smaller scale programs that can be better utilized by the member agencies. BEACON 12 All X M
M9.1 Designate and permit Goleta Beach as a temporary winter berm sand placement site. County of Santa Barbara 2
M9.2 Designate and approve Capinteria City Beach as a temporary winter berm sand placement site. City of Carpinteria 3
M10 Implement a multi-tier (different sources) local revenue program. All 13 All X M
M11 Establish, permit, and maintain regional sediment management source sites All 7 All X M
M11.1 Goleta Slough tributaries sediment accumulation areas County of Santa Barbara 2
M11.2 West Beach borrow site City of Santa Barbara 3
M11.3 Ventura River Delta gravel, boulders, and cobble sediment and nourishment maintenance zone County of Ventura/ City of Ventura 5
M11.4 Matilija Dam reservoir County of Ventura 5
BEACON CRSMP Page 23 Final Report
The Plan – Recommendations
Table 3. BEACON CRSMP Recommended Activities Activity Member sponsor Challenge & Opportunity
No.
BEACON Reach
Implementation Schedule Short term Mid term Long term Priority
Policy (see Note 1) (see Note 2)
P1 Formulate an executable sand rights policy. BEACON 11 All X L
P2 Develop guidelines for development to maintain or enhance natural shoreline processes. BEACON 4 All X H
P2.1 Develop guidelines for development to protect watershed sediment sources and limit seacliff armoring within the Conception Reach
P3 Support the removal of Matilija Dam Co of Ventura 7 5 X M
P4 Formalize a federal and state regional sediment management authorization that encompasses the Santa Barbara Littoral Cell. BEACON 13 All X H
Capital Projects
CP1 Goleta County Beach Co of Santa Barbara 3 2 X H
CP2 Carpinteria City Beach City of Carpinteria 3 3 X H
CP3 Oil Piers Section 227 BEACON 9 4 X H
CP4 Surfers Point Managed Retreat City of Ventura 4 5 X H
CP5 Pierpont Beach Sand Management City of Ventura 5 5 X M
CP6 Oxnard Shores Sand Management City of Oxnard 5 5 X M
CP7 Identify and implement one or more regional sand stockpile storage and process centers to maximize the SCCBEP program BEACON 6 2-6 X H
CP8 Select and implement one or more sand retention pilot projects BEACON 1 4 X M
CP8.1 Arroyo Burro County Beach as appropriate Co of Santa Barbara, 3 2 X M
CP8.2 Butterfly Beach as appropriate City of Santa Barbara, 3 3 X M
CP8.3 Summerland Beach as appropriate Co of Santa Barbara 3 3 X M
CP8.4 Santa Claus Beach as appropriate Co of Santa Barbara, 3 3 X M
CP8.5 La Conchita Beach as appropriate Co of Ventura 3 4 X M
CP8.6 North Rincon Parkway as appropriate Co of Ventura 3 4 X M
CP8.7 South Rincon Parkway as appropriate CA State Parks 3 4 X M
CP9 Improve renourishment longevity at west Hueneme Beach City of Port Hueneme 10 6 X M
CP10 Restore all or portion of the North Rincon Parkway shoreline Co of Ventura 9 5 X L
CP11 Restore all or portion of the South Rincon Parkway shoreline Co of Ventura 9 5 X L
CP12 Retain or capture all or portion of sand at the Mugu Submarine Canyon BEACON 2 6 X L
Note 1 - Numbers refer to challenge and opportunity descriptions listed in Table 2. Note 2 - Reach numbers refer to the following: 1 = Conception Reach; 2 = Goleta Reach; 3 = Santa Barbara Reach; 4 = Rincon Parkway Reach; 5 = Oxnard Plain Reach; 6 = Submarine Canyon Reach (see Figures 3 and 9).
BEACON CRSMP Page 24 Final Report
The Plan – Recommendations
BEACON CRSMP Page 25 Final Report
The Plan – Recommendations
Region Wide Activities: Studies R1. Characterize offshore sand sources to
precisely identify the locations where suitable volumes of beach compatible sand exist so they may be utilized for beach nourishment purposes.
R2. Evaluate innovative and alternative
multi-purpose sand retention solutions to find feasible and appropriate ways to retain, preserve, or enhance existing beach resources.
R3. Evaluate local revenue sources and
implement a program that can draw from multiple sources.
R4. Review conversion of the BEACON
SCCBEP permits to more streamlined and tiered Regional General Permits.
Management R5. Coordinate with the USGS and
UCSB to establish long term monitoring of the shoreline and sediment delivery processes within the BEACON coast.
R6. Amend the BEACON SCCBEP
permits to support a smaller scale
program that can be better utilized by the member agencies.
R7. Conduct frequent staff interaction
with federal and state funding agencies including watershed related agencies.
R8. Implement full time BEACON
administrative staff. R9. Implement a multi-tier (different
sources) local revenue program. Policy R10. Develop guidelines for development
to maintain or enhance natural shoreline processes.
R11. Formulate an executable sand rights
policy. R12. Formalize a federal and state
regional sediment management authorization that encompasses the Santa Barbara Littoral Cell.
Reach Activities: The following pages provide a reach by reach summary of recommended activities that are specific to each of the six planning reaches within the Central and South Region of the BEACON Coast.
BEACON CRSMP Page 26 Final Report
The Plan – Recommendations
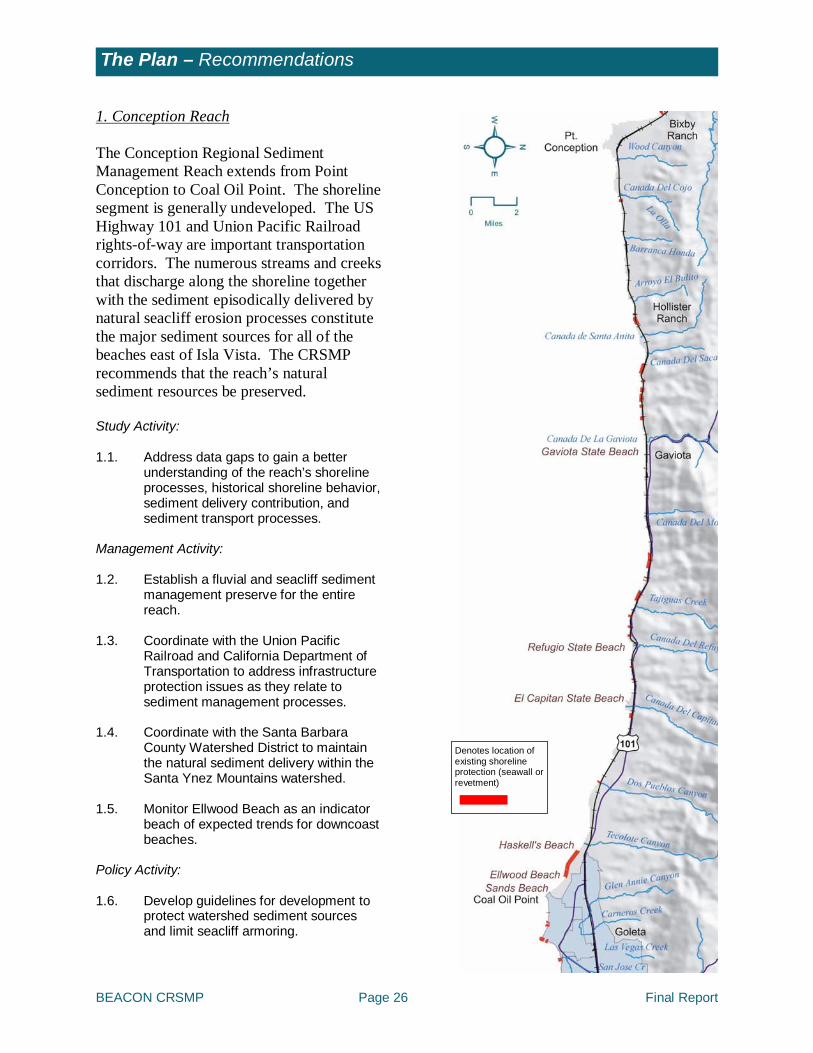
1. Conception Reach The Conception Regional Sediment Management Reach extends from Point Conception to Coal Oil Point. The shoreline segment is generally undeveloped. The US Highway 101 and Union Pacific Railroad rights-of-way are important transportation corridors. The numerous streams and creeks that discharge along the shoreline together with the sediment episodically delivered by natural seacliff erosion processes constitute the major sediment sources for all of the beaches east of Isla Vista. The CRSMP recommends that the reach’s natural sediment resources be preserved. Study Activity: 1.1. Address data gaps to gain a better
understanding of the reach’s shoreline processes, historical shoreline behavior, sediment delivery contribution, and sediment transport processes.
Management Activity: 1.2. Establish a fluvial and seacliff sediment
management preserve for the entire reach.
1.3. Coordinate with the Union Pacific
Railroad and California Department of Transportation to address infrastructure protection issues as they relate to sediment management processes.
1.4. Coordinate with the Santa Barbara
County Watershed District to maintain the natural sediment delivery within the Santa Ynez Mountains watershed.
1.5. Monitor Ellwood Beach as an indicator
beach of expected trends for downcoast beaches.
Policy Activity: 1.6. Develop guidelines for development to
protect watershed sediment sources and limit seacliff armoring.
Denotes location of existing shoreline protection (seawall or revetment)
BEACON CRSMP Page 27 Final Report
The Plan – Recommendations
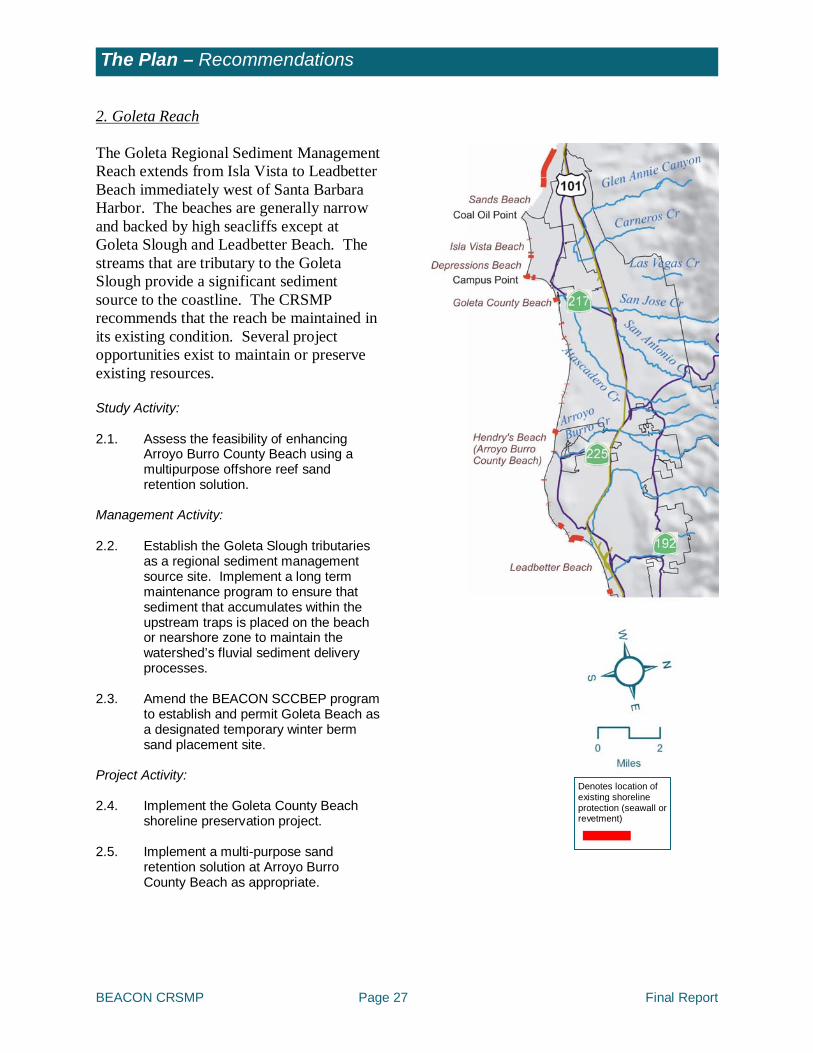
2. Goleta Reach The Goleta Regional Sediment Management Reach extends from Isla Vista to Leadbetter Beach immediately west of Santa Barbara Harbor. The beaches are generally narrow and backed by high seacliffs except at Goleta Slough and Leadbetter Beach. The streams that are tributary to the Goleta Slough provide a significant sediment source to the coastline. The CRSMP recommends that the reach be maintained in its existing condition. Several project opportunities exist to maintain or preserve existing resources. Study Activity: 2.1. Assess the feasibility of enhancing
Arroyo Burro County Beach using a multipurpose offshore reef sand retention solution.
Management Activity: 2.2. Establish the Goleta Slough tributaries
as a regional sediment management source site. Implement a long term maintenance program to ensure that sediment that accumulates within the upstream traps is placed on the beach or nearshore zone to maintain the watershed’s fluvial sediment delivery processes.
2.3. Amend the BEACON SCCBEP program
to establish and permit Goleta Beach as a designated temporary winter berm sand placement site.
Project Activity: 2.4. Implement the Goleta County Beach
shoreline preservation project. 2.5. Implement a multi-purpose sand
retention solution at Arroyo Burro County Beach as appropriate.
Denotes location of existing shoreline protection (seawall or revetment)
BEACON CRSMP Page 28 Final Report
The Plan – Recommendations
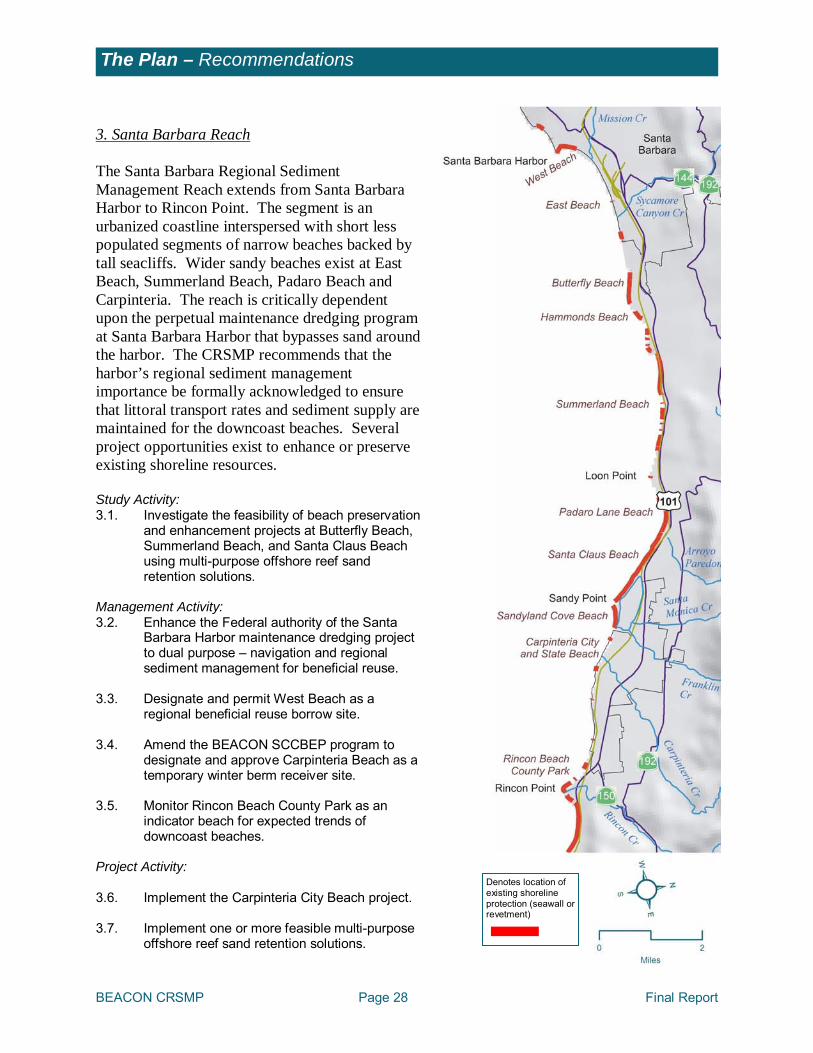
3. Santa Barbara Reach The Santa Barbara Regional Sediment Management Reach extends from Santa Barbara Harbor to Rincon Point. The segment is an urbanized coastline interspersed with short less populated segments of narrow beaches backed by tall seacliffs. Wider sandy beaches exist at East Beach, Summerland Beach, Padaro Beach and Carpinteria. The reach is critically dependent upon the perpetual maintenance dredging program at Santa Barbara Harbor that bypasses sand around the harbor. The CRSMP recommends that the harbor’s regional sediment management importance be formally acknowledged to ensure that littoral transport rates and sediment supply are maintained for the downcoast beaches. Several project opportunities exist to enhance or preserve existing shoreline resources. Study Activity: 3.1. Investigate the feasibility of beach preservation
and enhancement projects at Butterfly Beach, Summerland Beach, and Santa Claus Beach using multi-purpose offshore reef sand retention solutions.
Management Activity: 3.2. Enhance the Federal authority of the Santa
Barbara Harbor maintenance dredging project to dual purpose – navigation and regional sediment management for beneficial reuse.
3.3. Designate and permit West Beach as a
regional beneficial reuse borrow site. 3.4. Amend the BEACON SCCBEP program to
designate and approve Carpinteria Beach as a temporary winter berm receiver site.
3.5. Monitor Rincon Beach County Park as an
indicator beach for expected trends of downcoast beaches.
Project Activity: 3.6. Implement the Carpinteria City Beach project. 3.7. Implement one or more feasible multi-purpose
offshore reef sand retention solutions.
Denotes location of existing shoreline protection (seawall or revetment)
BEACON CRSMP Page 29 Final Report
The Plan – Recommendations
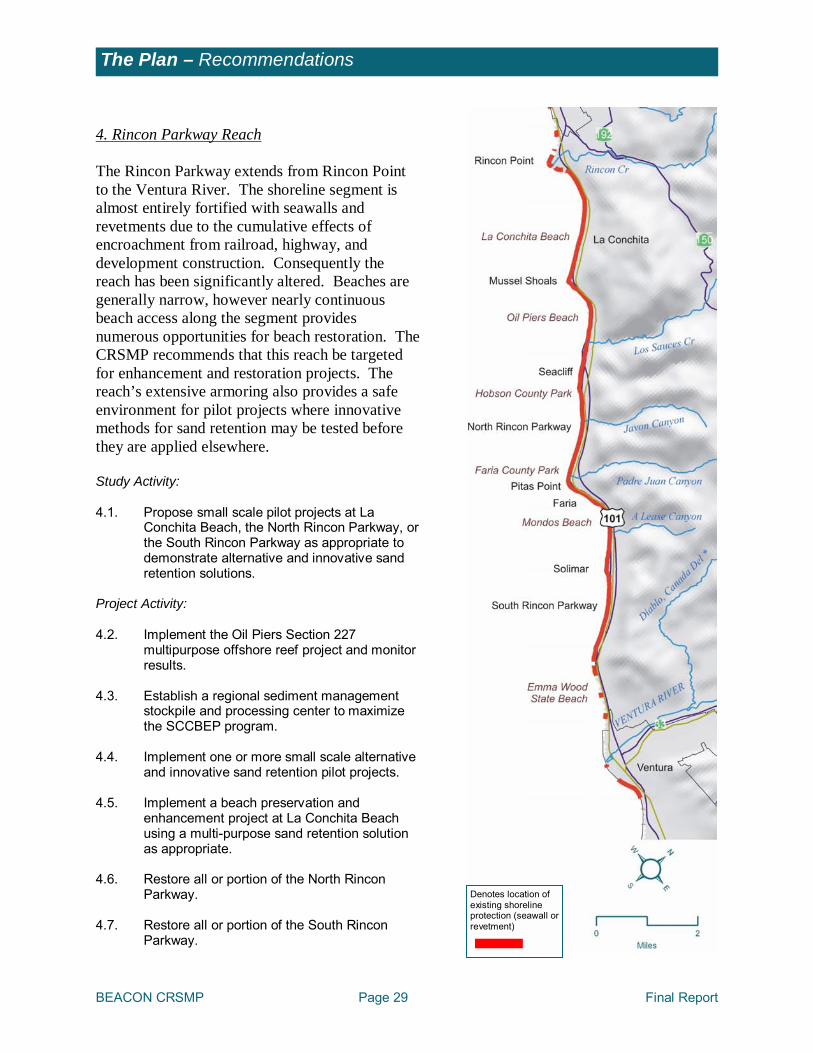
4. Rincon Parkway Reach The Rincon Parkway extends from Rincon Point to the Ventura River. The shoreline segment is almost entirely fortified with seawalls and revetments due to the cumulative effects of encroachment from railroad, highway, and development construction. Consequently the reach has been significantly altered. Beaches are generally narrow, however nearly continuous beach access along the segment provides numerous opportunities for beach restoration. The CRSMP recommends that this reach be targeted for enhancement and restoration projects. The reach’s extensive armoring also provides a safe environment for pilot projects where innovative methods for sand retention may be tested before they are applied elsewhere. Study Activity: 4.1. Propose small scale pilot projects at La
Conchita Beach, the North Rincon Parkway, or the South Rincon Parkway as appropriate to demonstrate alternative and innovative sand retention solutions.
Project Activity: 4.2. Implement the Oil Piers Section 227
multipurpose offshore reef project and monitor results.
4.3. Establish a regional sediment management
stockpile and processing center to maximize the SCCBEP program.
4.4. Implement one or more small scale alternative
and innovative sand retention pilot projects. 4.5. Implement a beach preservation and
enhancement project at La Conchita Beach using a multi-purpose sand retention solution as appropriate.
4.6. Restore all or portion of the North Rincon
Parkway. 4.7. Restore all or portion of the South Rincon
Parkway.
Denotes location of existing shoreline protection (seawall or revetment)
BEACON CRSMP Page 30 Final Report
The Plan – Recommendations
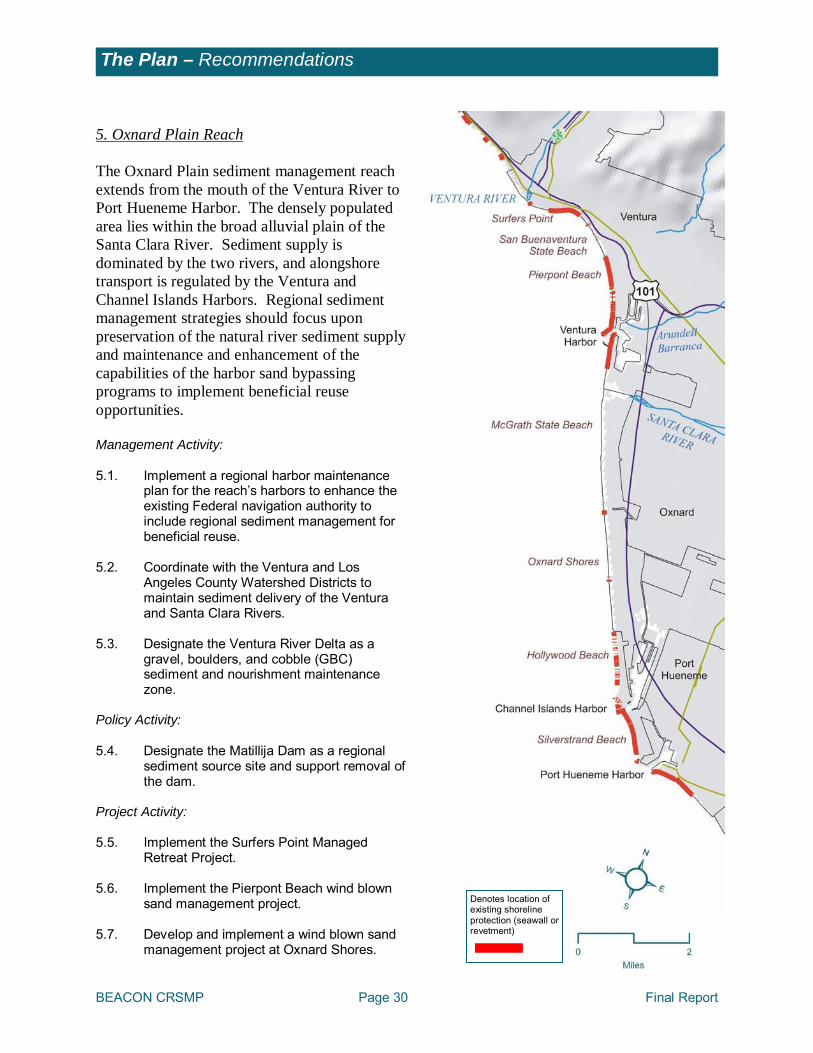
5. Oxnard Plain Reach The Oxnard Plain sediment management reach extends from the mouth of the Ventura River to Port Hueneme Harbor. The densely populated area lies within the broad alluvial plain of the Santa Clara River. Sediment supply is dominated by the two rivers, and alongshore transport is regulated by the Ventura and Channel Islands Harbors. Regional sediment management strategies should focus upon preservation of the natural river sediment supply and maintenance and enhancement of the capabilities of the harbor sand bypassing programs to implement beneficial reuse opportunities. Management Activity: 5.1. Implement a regional harbor maintenance
plan for the reach’s harbors to enhance the existing Federal navigation authority to include regional sediment management for beneficial reuse.
5.2. Coordinate with the Ventura and Los
Angeles County Watershed Districts to maintain sediment delivery of the Ventura and Santa Clara Rivers.
5.3. Designate the Ventura River Delta as a
gravel, boulders, and cobble (GBC) sediment and nourishment maintenance zone.
Policy Activity: 5.4. Designate the Matillija Dam as a regional
sediment source site and support removal of the dam.
Project Activity: 5.5. Implement the Surfers Point Managed
Retreat Project. 5.6. Implement the Pierpont Beach wind blown
sand management project. 5.7. Develop and implement a wind blown sand
management project at Oxnard Shores.
Denotes location of existing shoreline protection (seawall or revetment)
BEACON CRSMP Page 31 Final Report
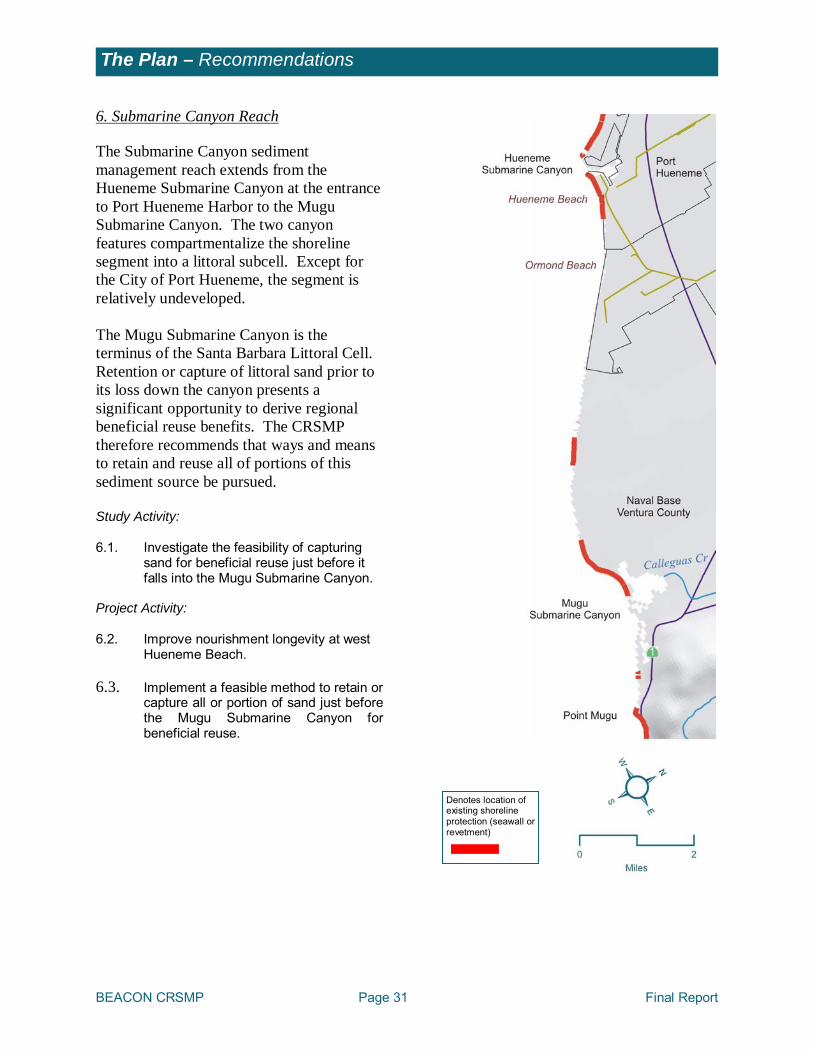
The Plan – Recommendations
6. Submarine Canyon Reach The Submarine Canyon sediment management reach extends from the Hueneme Submarine Canyon at the entrance to Port Hueneme Harbor to the Mugu Submarine Canyon. The two canyon features compartmentalize the shoreline segment into a littoral subcell. Except for the City of Port Hueneme, the segment is relatively undeveloped. The Mugu Submarine Canyon is the terminus of the Santa Barbara Littoral Cell. Retention or capture of littoral sand prior to its loss down the canyon presents a significant opportunity to derive regional beneficial reuse benefits. The CRSMP therefore recommends that ways and means to retain and reuse all of portions of this sediment source be pursued. Study Activity: 6.1. Investigate the feasibility of capturing
sand for beneficial reuse just before it falls into the Mugu Submarine Canyon.
Project Activity: 6.2. Improve nourishment longevity at west
Hueneme Beach. 6.3. Implement a feasible method to retain or
capture all or portion of sand just before the Mugu Submarine Canyon for beneficial reuse.
Denotes location of existing shoreline protection (seawall or revetment)
BEACON CRSMP Page 32 Final Report
The Plan – Next Steps
The Next Steps The BEACON CRSMP represents a long term plan for coastal sediment management within the BEACON Coast. The Plan is meant to be implemented over the next twenty years although clearly its various components may be selectively implemented in proportion to the level of available staffing and funding available to carry out and complete the various activities. Recognizing that resources may be limited priorities may be established to focus initiative and efforts to those tasks that are more critical or offer more immediate regional or reach benefit. The recommended top priority activities for each reach are:
Regional - Coordinate with the USGS and UCSB to establish long term monitoring of the shoreline and sediment delivery processes within the BEACON coast.
Conception Reach - Establish a fluvial
and seacliff sediment management preserve for the entire reach.
Goleta Reach - Implement the Goleta
County Beach shoreline preservation project.
Santa Barbara Reach - Enhance the
Federal authority of the Santa Barbara Harbor maintenance dredging project to dual purpose – navigation and regional sediment management for beneficial reuse.
Rincon Parkway Reach - Establish a
regional sediment management stockpile and processing center to better implement a SCCBEP temporary winter berm sand placement program.
Oxnard Plain Reach - Implement a
regional harbor maintenance plan for the reach’s harbors to enhance the existing Federal navigation authority to include regional sediment management for beneficial reuse.
Submarine Canyon Reach – Improve
nourishment longevity at west Hueneme Beach.
The Rincon Parkway beaches offer the greatest potential for public benefit to the BEACON Coast if they were restored to enhance public usage. However in order for this benefit to be realized new and innovative sand retention solutions will be needed. Therefore a tiered program is recommended to explore the feasibility of restoring all or portions of the Rincon Parkway shoreline. The effort should progress as follows:
Conduct a study to propose small-scale projects to demonstrate alternative and innovative sediment retention technology.
Based upon the study results select and
implement one or more small scale alternative and innovative sand retention pilot projects.
Restore all or portions of the North
and/or South Rincon Parkway shoreline as appropriate and based upon the results of the pilot projects.
The regional sediment management stockpile and processing center, and the above Rincon Parkway projects represent new project proposals. A preliminary environmental review of the environmental impacts associated with each proposal is summarized in Appendix D.
BEACON CRSMP Page 33 Final Report
Public Comment
A public meeting was conducted on November 21, 2008 at Carpinteria City Hall to review the BEACON CRSMP draft report and receive comments. The following is a
brief summary of the verbal comments that were made by the BEACON Board of Directors and the public. Responses to each comments are provided.
BEACON Board of Directors Comment Comment: Provide some explanation for the source of sand supply data in Table 1. Response: The data presented in Table 1 was based upon research recently conducted by
Cope Willis and Dr. Gary Griggs at the U.C. Santa Cruz Department of Earth Sciences and Institute of Marine Science. The researchers quantified the effects of alterations to the principal watersheds by comparing estimates of sediment discharge to the coast under pre-dam and post-dam river flow conditions. The results of the Willis and Griggs study provide the most current estimates of the reduction in natural sediment delivery to the coast.
Comment: Consider adding recommendations for nourishment projects to beaches within the
Conception Reach since this reach supplies eroding beaches such as Goleta Beach and others.
Response: The BEACON CRSMP has been designed to be as flexible as possible. Thus it is
anticipated that the Plan will continually be revised and updated in response to new information and input. The Conception Reach has been identified as a critical sediment source upon which the rest of the Central and Southern Segments of the BEACON Coast depend. Upon resolution of data gaps issues and as the scientific understanding of the coastal processes within the Conception Reach evolve, additional sediment management proposals will undoubtedly emerge including proposals for more beach nourishment sites to feed the downcoast. The ultimate selection of beach nourishment sites within the relatively undeveloped Conception Reach will depend upon review of a number of factors and challenges including proximity to suitable quantities of beach compatible sand, the availability of public access to the proposed receiver site beach, and satisfaction of environmental checklists. The consideration of additional beach nourishment sites will be implemented through the various study and management tasks already recommended by the CRSMP.
Comment: Expand Figure 7 to include all dams within the region. Currently only the
Matilija Dam is referenced. The other dams, while not scheduled for removal, have sediment resources that could be tapped.
Response: Figure 7 has been clarified to show the locations of the significant dams within
the BEACON Coast that have impacted the natural supply of sediment to the beaches as indicated by Table 1.
BEACON CRSMP Page 34 Final Report
Public Comment
Comment: Consider recommending “sand retention solutions” as a “Next Steps” priority. Response: The need for study and implementation of innovation sand retention solutions has
been discussed throughout the CRSMP and included as a high priority recommendation. However it is recognized that the technology needs to be verified within the BEACON Coast before broader project scopes can be made implemented. The Rincon Parkway Reach is considered to be an excellent proving ground to further test the promising technology of multi-purpose sand retention solutions before it is implemented elsewhere along the BEACON Coast. Therefore, a tiered program has been recommended to be first applied within the Rincon Parkway in the “Next Steps” recommendations. The prioritized actions recommend study to propose small scale sand retention pilot projects from which one or more small scale pilot projects can be appropriately selected for demonstration. Ultimately it is envisioned that through this careful study approach sand retention solutions can be more confidently designed and implemented to benefit longer stretches of beaches within the Rincon Parkway and other appropriate locations within the BEACON Coast.
Comment: Port Hueneme does not have regular dredging operations. Response: Page 15 of the report text has been clarified to indicate that Port Hueneme Harbor
has a low maintenance dredging requirement. Comment: A study of the Mugu Submarine Canyon is currently underway by the U.S. Army
Corps of Engineers to review how to capture sand before loss down the canyon. Response: In addition to the Corps study, the U.S. Geological Survey is also conducting
scientific studies of coastal and geologic processes at the Mugu Submarine Canyon and the adjacent shoreline. These two studies will help to further BEACON’s goal and objective of finding ways and means to capture sand before it is lost from the littoral system forever.
Comment: Consider inclusion of a business tax as a revenue source. It would require a two-
thirds majority on the ballot. Response: Many businesses do not benefit directly from beach recreation, and it is thought
these businesses would likely oppose such a tax. In some cities that rely heavily on beach tourism (e.g., Carpinteria) a business tax may be feasible.
Comment: The annual attendance at Goleta Beach appears to be much higher than the
20,000 figure shown in Table 2 of Appendix C. Please confirm the data. Response: This was a typographical error. The estimate used in the analysis was 500,000
people per year. This is still less than official estimates for Goleta County Beach Park, which are closer to one million. Table 2 of Appendix C only includes people on the beach, in the water, or in the picnic area immediately adjacent to the
BEACON CRSMP Page 35 Final Report
Public Comment
beach. A number of people at Goleta Beach go to the restaurant, recreate away from the beach, or park in the parking lot and walk up to UCSB. Some of the people who go to the restaurant or recreate nearby may also experience some benefits from a wider beach but our estimate is conservative.
Comment: The City of Port Hueneme does have paid parking at the beach which raises
about $200,000 per year. Response: Table 5 of Appendix C has been corrected to reflect the fact that Port Hueneme
charges for parking. California Sediment Management Workgroup Comment Clifton Davenport, Project Manager of CSMW: Comment: Supports the recommendation for a full time BEACON staff. Response: None required. Comment: BEACON should consider incorporation of SCOUP into its program of beach
nourishment to ensure that only compatible sediment is placed on beaches. Response: The Sand Compatibility and Opportunistic Use Program (SCOUP) is a pilot study
funded by the CSMW that is intended to standardize and streamline review and testing protocols for sediments proposed for beach nourishment. The program will be considered in subsequent activities recommended by the CRSMP.
Comment: Consider Texas’ program of taxation on sporting goods sales as one means to
raise revenue to support implementation of sediment management programs. Response: The study looked at local (City and County) tax initiatives. The use of sales tax
funds on sporting goods would be a statewide initiative and would include a wide range of activities besides beaches. As such, it is out of the scope of this report, though it may be worth looking at in another context.
California State Parks Comment Richard Rozzelle, Channel Coast District Superintendent Comment: Found the recreational value and visitation estimate information helpful.
Pierpont Beach is part of San Buenaventura State Beach. Response: None required.
BEACON CRSMP Page 36 Final Report
Public Comment
Public Comment Paul Jenkin, Ventura County Chapter of Surfrider: Comment: Beaches are the result of natural processes so the focus of the CRSMP should be
land use planning. Land use policies should be dealt with first. Mitigation for flood control measures is recommended.
Response: The BEACON CRSMP identifies the challenges and opportunities related to
reduced sediment delivery to the shoreline and coastal development. Recommendations for increased collaboration with land use agencies and watershed protection authorities have been made to begin the process of finding ways to preserve and enhance the natural supply of sediment to beaches. The recommendation to establish a sediment management preserve within the relatively undeveloped Conception Reach is an important management activity that will help to establish appropriate strategy and policy to effect preservation of natural processes.
Comment: The predictions for sea level rise projections imply that beach nourishment should
not be a priority. Response: Challenge and Opportunity No. 4 acknowledges the potential shoreline impacts
that may occur from future seal level rise. In consideration of this significant issue the CRSMP recommends that managed retreat be implemented at appropriate areas to effectively deal with potential sea level rise challenges.
Comment: The attendance figures for C Street seem low. Response: The beach attendance at C Street only includes people in the water or on the
cobble, not people on the boardwalk or other sites nearby. Had these people been included the estimates of attendance would be considerably higher (possibly justifying nourishment at the site) and the percentage of surfers would be correspondingly lower. Since this spot is primarily a surf site, it was considered appropriate to emphasize this aspect of C Street.
Comment: The estimate for surfing at Oil Piers is too high. Reponse: The percentage estimate for surfers at Oil Piers was for another spot nearby and
has been corrected.
BEACON CRSMP Page 37 Final Report
Appendix A – List of References
Bailard, J., and Jenkins, S.A., 1982. City of Carpinteria Beach Erosion and Pier Study. Final Report to the City of Carpinteria. Bailard/Jenkins Consultants. April 1982. 292 pgs.
Barnard, P.L., Revell, D.L., Eshleman, J. and Mustain, N. 2007. Carpinteria Coastal Processes
Study: 2005-2007 Final Report. USGS Open File Report 2007-xxx Barnard, P.L., Revell, D.L., Eshleman, J., Mustain, N., Warrick, J. and Elias, E. in prep. Coastal
Processes Study of Santa Barbara and Ventura County, California: Final Report to BEACON. USGS Open File Report 2008 -???
Diener, B.G., 2000. Sand Contribution From Bluff Recession Between Point Conception And Santa Barbara, CA. Shore and Beach 68(2)7-14. Dugan, J.E., D.M. Hubbard, M. McCrary, M. Pierson. 2003. The response of macrofauna
communities and shorebirds to macrophyte wrack subsidies on exposed beaches of southern California. Estuarine, Coastal and Shelf Science, 58S, 133-148.
Dugan, J.E., And Hubbard, D.H., 2006. Ecological Responses to Coastal Armoring on Exposed
Sandy Beaches. Shore and Beach 71(1)10-16. Dugan, J.E., Hubbard, D.M., Rodil, I., and Revell, D.L. in press. Ecological Effects of Coastal
Armoring on Sandy Beaches. Accepted to Marine Ecology. Graham, N.E, (2003). Variability in the Wave Climate of the North Pacific – Links to Inter-
Annual and Inter-Decadal Variability. Proceedings of OCEANS 2003. Vol.2: 969-972. Flick, R.E. 1998. Comparison of California tides, storm surges, and mean sea level during the El Niño winters of 1982-83 and 1997-98. Shore and Beach. 66(3)7-11. Griggs, G.B., Patsch, K., Savoy, L. 2005. Living with the Changing California Coast. University of California Press. Berkeley, CA. 539p. Guza, R., W. O’Reilly. 2001. Wave prediction in the Santa Barbara Channel, MMS OCS Study 2001-055. 8 pages. Hapke, C.J, Reid, D., Richmond, B.M., Ruggiero, P., and List, J. 2006. National Assessment of
Shoreline Change Part 3. Historical Shoreline Change and Coastal Land Loss Along Sandy Shorelines of the California Coast. USGS Open File Report 2006-1219.
Hapke, C.J, and Reid, D. 2007. National Assessment of Shoreline Change, Part 4: Historical Coastal Cliff Retreat along the California Coast. USGS Open File Report 2007-1133. Hapke, C.J, Reid, D.2007 Bluff and Shoreline erosion rates in California. In: Kraus, N.C., Rosati, J.D. (eds.), Coastal Sediments ’07, Proceedings of the 6th International Symposium on Coastal Engineering and Science of Coastal Sediment Processes, American Society of Civil Engineers, New Orleans, LA, Volume 3, pg ???
BEACON CRSMP Page 38 Final Report
Appendix A – List of References
Hubbard, D.M. and J.E. Dugan, 2003. Shorebird use of an exposed sandy beach in southern California. Estuarine, Coastal and Shelf Science 58S (2003) p 41-54. Inman, D.L. and S.A. Jenkins, 1999. Climate Change and the Episodicity of Sediment Flux of
Small California Rivers. Journal of Geology, 107:251-270. King, P.G., 2001. Overcrowding and the Demand for Beaches in Southern California. San
Francisco State University. Report to California Department of Boating and Waterways. 18pgs. King, P. and Symes, D. 2004. Potential loss in GNP and GSP from a failure to maintain
California’s beaches. Shore and Beach 72(1):3-8. Limber, P.W., Patsch, K.B., and Griggs, G.B., 2007. Coastal Sediment Budgets and the Littoral
Cell Cut-off Diameter, a Grain Size Threshold for Quantifying Active Sediment Inputs. Journal of Coastal Research.
Moffatt and Nichol 2002. Goleta Beach County Park Long-Term Beach Restoration and
Shoreline Erosion Management Final Plan. Report to Santa Barbara County Parks from Moffatt and Nichol Engineers, March 15, 2002 available online www.sbparks.org/goletabeach/docs/rsem/Goleta_Beach_Final_Plan.pdf
Mustain, Neomi, 2007. Grain size distribution of beach and nearshore sediments of the Santa
Barbara Littoral Cell: Implications for Beach Nourishment. MS Thesis in Earth Sciences, University of California, Santa Cruz, 107 pp.
Mustain, N., Griggs, G. and Barnard, P.L., 2007. A rapid compatibility analysis of potential
offshore sand sources for beaches of the Santa Barbara littoral cell. In: Kraus, N.C., Rosati, J.D. (eds.), Coastal Sediments ’07, Proceedings of the 6th International Symposium on Coastal Engineering and Science of Coastal Sediment Processes, American Society of Civil Engineers, New Orleans, LA, Volume 3, p. 2501-2514.
Noble Consultants, 1989. Coastal Sand Management Plan Santa Barbara / Ventura County
Coastline. Prepared for BEACON, Beach Erosion Authority for Control Operations and Nourishment, Santa Barbara, CA.
O’Reilly W. C. 1993. The southern California wave climate: effects of islands and bathymetry. Shore and Beach 61(3):14-19. Patsch, K. 2005 Littoral Cells of California. PhD Dissertation, University of California, Santa
Cruz Earth Science Department. Patsch, K. and Griggs, G.B 2006. Littoral Cells, Sand Budgets, and Beaches: Understanding
California’s Shoreline. Institute of Marine Sciences, UCSC and California Department of Boating and Waterways. 39p.
BEACON CRSMP Page 39 Final Report
Appendix A – List of References
Patsch, K., Griggs, G.B. 2007. Development of sand budgets for California’s major littoral cells. Report to the California Coastal Sediment Management Working Group. 105 pgs. http://dbw.ca.gov/csmw/csmwhome.htm
Patsch, K. and G.B. Griggs, 2007. Development of sand budgets for California’s major littoral cells. Report to California Department of Boating and Waterways. Coastal Sediment Management Work Group.105 pgs. http://dbw.ca.gov/CSMW/PDF/Sand_Budgets_Major_Littoral_Cells.pdf Revell, D.L. 2007. Examining Long Term Trends in Beach Changes in the Santa Barbara Sandshed. PhD. Dissertation in Earth Sciences. University of California, Santa Cruz. Revell, D. L., and Griggs, G.B., 2006. Beach Width and Climate Oscillations Along Isla Vista,
Santa Barbara, California. Shore and Beach 74(3)8-16. Revell, D. L. and Griggs, G.B., 2007. Regional Shoreline and Beach Changes in the Santa
Barbara Sandshed. In: Kraus, N.C., Rosati, J.D. (eds.), Coastal Sediments ’07, Proceedings of the 6th International Symposium on Coastal Engineering and Science of Coastal Sediment Processes, American Society of Civil Engineers, New Orleans, LA, Volume 3, pg.??-??
Revell, D. L., Dugan, J.E., Hubbard, D.M., in press. Physical and Ecological Responses of
Sandy Beaches to the 1997-98 El Niño. Accepted to Journal of Coastal Research 7/24/2007. Revell, D.L., Barnard, P., Mustain, N., and Storlazzi, C.D., in review. Influence of Harbor
Construction on Downcoast Morphological Evolution: Santa Barbara, California. Submitted to Coastal Disasters ’08 Conference, April 2008 North Shore, HI.
Runyan, K.B., and Griggs, G.B., 2003. The Effects of Armoring Seacliffs on the Natural Sand
Supply to the Beaches of California. Journal of Coastal Research 19(2) 336-347. Seymour R.J. 1998 Effects of El Niños on the west coast wave climate. Shore and Beach
66(3):3-6. Sherman, D.J., Barron, K.M., and Ellis, J.T., 2002. Retention of Beach Sands by Dams and
Debris Basins in Southern California. Journal of Coastal Research, 35:662-674. Special Issue Proceedings of ICS 2002. Northern Ireland.
Slagel, M. and Griggs, G.B. 2006. Cumulative Losses of Sand to the California Coast by Dam
Impoundment. Report to California Coastal Sediment Management Working Group. 47pgs. www.dbw.ca.gov/CSMW/PDF/Cumulative_Loss_of_Sand_from_Dams_Final_060706.pdf
Storlazzi, C.D., and Griggs, G.B. 2000. The influence of El Niño-Southern Oscillation (ENSO)
events on the evolution of central California’s shoreline. Geological Society of America Bull. 112:2:236-249.
BEACON CRSMP Page 40 Final Report
Appendix A – List of References
Weigel, R. L., 2002. Seawalls, Seacliffs, Beachrock: What Beach Effects? Part 2. Shore and Beach. 70(2)13-22.
Warrick, J.A., 2002, Short-term (1997–2000) and long-term (1928–2000) observations of river
water and sediment discharge to the Santa Barbara Channel, California Ph.D. dissertation. University of California, Santa Barbara, 337 p
Warrick, J.A., J.D. Milliman 2003. Hyperpycnal Sediment Discharge from semiarid Southern
California: Implications for coastal sediment budgets. Journal of Geology, 31:9 pp 781-784. Willis, C.W. and Griggs, G.B., 2003. Reductions in fluvial sediment discharge by coastal dams in
California and implications for beach sustainability. Journal of Geology 111:167-182.
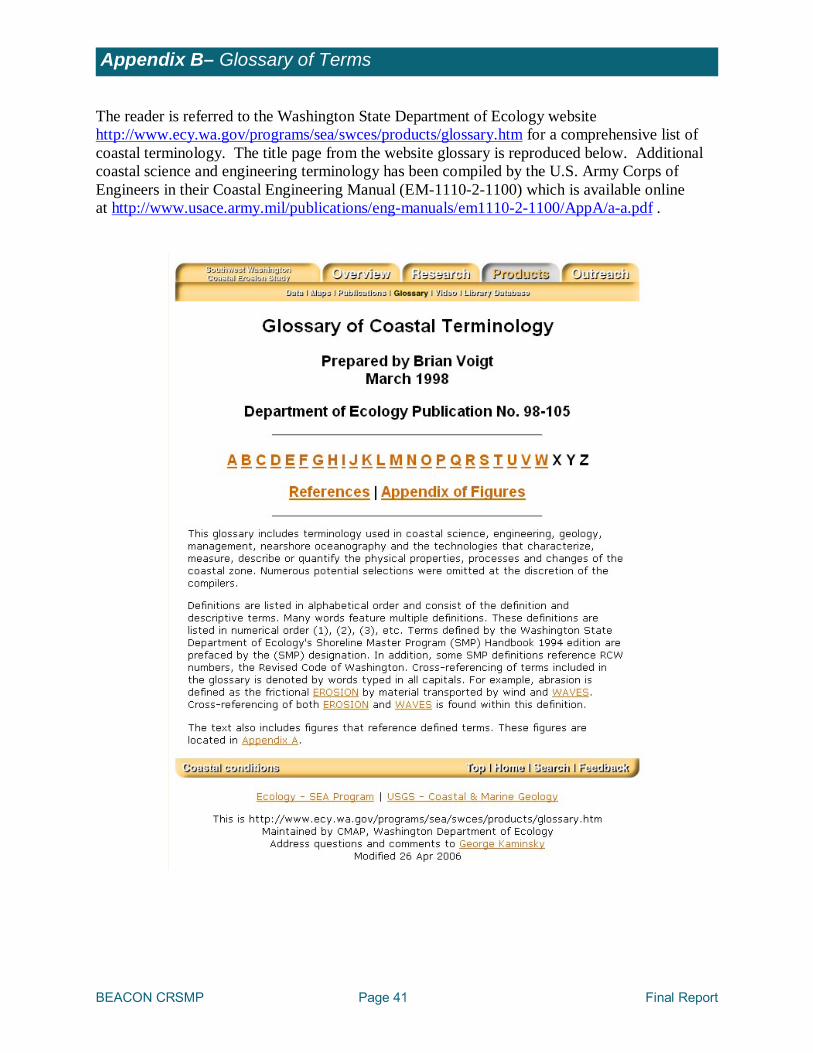
BEACON CRSMP Page 41 Final Report
Appendix B– Glossary of Terms
The reader is referred to the Washington State Department of Ecology website http://www.ecy.wa.gov/programs/sea/swces/products/glossary.htm for a comprehensive list of coastal terminology. The title page from the website glossary is reproduced below. Additional coastal science and engineering terminology has been compiled by the U.S. Army Corps of Engineers in their Coastal Engineering Manual (EM-1110-2-1100) which is available online at http://www.usace.army.mil/publications/eng-manuals/em1110-2-1100/AppA/a-a.pdf .
BEACON CRSMP Page 42 Final Report
Appendix C – Economic Analysis of the BEACON Coast
The Economics of Beach Nourishment
in Santa Barbara/Ventura Counties
Philip G. King, Ph.D.
Prepared for BEACON Coastal Regional Sediment Management Plan
BEACON CRSMP Page 43 Final Report
Appendix C – Economic Analysis of the BEACON Coast
Introduction Beach nourishment is widely recognized as useful way to enhance the recreational value of beaches and to minimize potential storm damage to coastal property adjacent to the beach. The federal government (largely through the US Army Corps of Engineers) has nourished a number of beaches in southern California and throughout the country. The State of California has also been actively involved in beach nourishment at various sites, often in partnerships with federal or local governments. The purpose of this appendix is to analyze the economic benefits, impacts, and costs of beach nourishment projects in Santa Barbara and Ventura Counties. Some opportunistic nourishment already exists, for example at Goleta, but, to date, there has been little regional or long range planning considering nourishment sites and opportunities. The purpose of this appendix is to present a reasonably comprehensive analysis of possible beach nourishment sites for BEACON in order to facilitate long range planning. This study will also provide some specific policy options for BEACON.
In addition, the second part of the study will examine possible local funding options (as part of the local matching share in a State or Federal project) for beach nourishment and present BEACON with an array of options. The economic benefit portion of this study builds on an earlier analysis1 prepared for the Coastal Sediment Management Workgroup (CSMW) which presented a benefit costs analysis for a number of sites in the region as well. This study has expanded this earlier analysis in several ways:
• The number of beaches/reaches has been expanded considerably;
• Most of the attendance data is based on actual attendance counts taken between May and November 2007 rather than relying on official or unofficial counts;
• Attendance has been broken down into surfer and non-surfer populations;
• An estimate for storm damage prevention benefits has been added.
1 See Coastal Sediment Analysis Tool (CSBAT) Beta Version--Sediment Management Decision Support Tool for Santa Barbara and Ventura Counties, Draft Technical Report for U.S. Army Corps of Engineers, Los Angeles District, June 2006.
BEACON CRSMP Page 44 Final Report
Appendix C – Economic Analysis of the BEACON Coast
Beaches Examined in the Study Several criteria were used for beach selection. The study included all of the most popular beaches in the two counties along with a number of smaller beaches (e.g., “Oil Piers” beach) which are under consideration for beach preservation projects. While we have not included every single beach in the two counties, this study covers all of the beaches that should be of interest to regional planners. Below is a list of all the beaches in the study area along with a brief description of the beach, in particular its recreational amenities.
Gaviota State Beach Gaviota State Beach is located off of Highway 101 at Gaviota Beach Road. This narrow sandy beach with a rocky shoreline maintains a campground with 40 trailer sites, 20 tent sites, and 20 sites for RV parking. Amenities include picnic areas, a fishing pier, a boat launch, restrooms, showers, camp store, bait and tackle, fire pits and lifeguards on duty during the summer months. The majority of people represented at this site are fishermen/women and campers. Paid day use parking is available. The weather varies throughout the year with thick layers of marine fog in the late spring and early summer and increased winds in the afternoons.
Refugio State Beach Refugio State Beach is located south of Highway 101 at Refugio Road. This sandy beach has rocky shorelines and numerous tidepools. The beach joins with the 85 campsites and additional RV parking. Day parking is available as well as parking on side roads just beyond the camp boundaries. Amenities include a camp store, restrooms, showers, fishing, hiking, bike trails, picnic tables, fire pits, and lifeguards during the summer months. The beach population is primarily made up of campers and families with young children. The weather varies throughout the year with thick layers of marine layer in the late spring and early summer and increased winds in the afternoons.
El Capitan State Beach El Capitan State Beach is located approximately 10 miles north of Goleta, just south of Highway 101. This narrow sandy beach can be reached from one of the many staircases leading down from the bluffs. The park located on the bluffs is home to 140 campsites. Amenities include picnic areas, a snack shop, restrooms, showers, fire pits, hiking, bike trails and lifeguards on duty during the summer. This beach is well known for its surf in the fall and winter months. Day use parking is available, resulting in a mix of campers, day visitors and surfers occupying the beach. The weather varies throughout the year with thick marine layers in the late spring and early summer. There is a private campground nearby (across Hwy 101).
Goleta Beach County Park Goleta Beach County Park is located off of Sandspit Rd. in Goleta, near the southern entrance to the University of California Santa Barbara. This sandy beach is about a quarter of a mile long, met by bluffs to the north and wetlands and streams to the south. Amenities include a restaurant, large grassy picnic area, canopies, barbeques, picnic tables, volleyball courts, fire pits, children’s playground, horseshoe pits, two restrooms, outdoor showers, and a 1500 ft. pier. The pier is
BEACON CRSMP Page 45 Final Report
Appendix C – Economic Analysis of the BEACON Coast
commonly used by fishermen/women. Volleyball players, kayakers, families and children’s summer camps occupy the beach. The picnic area is highly populated on weekends, drawing large crowds ranging from family picnics to corporate gatherings. The weather is a mix of haze and marine layer during the spring, with a large number of sunny days in the summer months. Winds commonly pick up in the late afternoon.
Arroyo Burro (Hendry’s) Beach Arroyo Burro (Hendry’s) Beach is located off of Cliff Dr. near the Mesa District of Santa Barbara. Coastal bluffs, natural streams, and wetlands border this narrow sandy beach. During high tides coincident with wave action a majority of the beach is washed away. Recreational facilities include a restaurant, small picnic area, lifeguards on duty in the summer months, restrooms, outdoor showers and fire pits. There is a large public parking lot free of charge as well as an equestrian trail that provides access to the beach. All year visitors will witness surfers in the water as well as a large numbers of families with small children playing in the shallow surf break. The weather at this site is characterized by relatively consistent sun in the summer months and high winds in the afternoon.
Leadbetter Beach Leadbetter Beach is located off of Shoreline Dr., north of the Santa Barbara Harbor and West Beach. This relatively wide sandy beach is located in a cove that meets the southern end of Shoreline Park. Amenities include a restaurant, large picnic area, restrooms, outdoor showers, fire pits, kayak rentals, and two lifeguard stations during the summer months and holiday weekends. There are two paid parking lots shared with the harbor providing easy access to the beach, picnic and harbor facilities. On the weekends and on summer nights, the picnic area is highly populated with families and special events. Surfers occupy the point break produced by the cove as families and children’s camps use the beach. The weather varies, but in the summer there is commonly a marine layer in the morning that burns off throughout the day. This site is visited by the sun more sun than a majority of the beaches in this general area. The cove also serves as a form of protection from the strong winds that can develop near the coast.
West Beach West Beach is located on Cabrillo Blvd., just north of the Santa Barbara wharf and East Beach. This short, wide sandy beach is approximately 1,300 feet long and 400 feet wide. This beach has very few amenities. Beyond the six volleyball courts, there are no restrooms, showers or lifeguards. Volleyball players and tourists that are staying near the wharf are common groups of people who make use of this beach. Parking can be found on Cabrillo Blvd or in the paid lot north of the beach that services the marina. The weather at West Beach is quite typical of the Central Coast. During the spring and summer months one can encounter a marine layer in the morning that burns off as the day goes on. West Beach is known for its strong winds that pick up in the early afternoon. Because of the strong winds, a majority of the volleyball is played in the morning.
East Beach East Beach is located off Cabrillo Blvd in Santa Barbara. This sandy beach is approximately a mile and a half long and over 200 feet wide at certain points. At the southern end of this site there are over 25 volleyball courts and a grassy picnic area. Further north is the East Beach Café,
BEACON CRSMP Page 46 Final Report
Appendix C – Economic Analysis of the BEACON Coast
children’s playground, skate park, three restrooms and outdoor showers. Of constant use is the pedestrian walk/bike way that borders the beach and Chase Palm Park. There are two lifeguard stations that are in service during the summer months and on holiday weekends. This beach population is made up of volleyball players, families, and tourists (there are numerous hotels off of Cabrillo Blvd.). Parking can be found on Cabrillo Blvd and in the three paid lots, two at the southern end of Cabrillo Blvd and one near the northern end of East Beach. The weather at East Beach is quite typical of the Central Coast. During the spring and summer months one can encounter a marine layer in the morning that burns off as the day goes on. East Beach is known for its strong winds that pick up in the early afternoon. Because of the strong winds, a majority of the volleyball is played in the morning.
Butterfly (Hammonds) Beach Butterfly Beach is located off of Channel Dr. near the Biltmore Hotel in Montecito. A seawall to the south and bluffs to the north border this narrow sandy beach. This site lacks restrooms or lifeguards. Individuals can park on the shoulder of Channel Dr. and in the neighborhoods near the Biltmore Hotel. The beach is host to hotel guests, walkers, and surfers. Just south of this beach surfers congregate at Hammonds Wall, where there is consistent surf in the winter and fall. During high tides coincident with wave action the beach washes away, resulting in limited hours of use. In respect to weather, this site follows the pattern of a marine layer in the morning with sun and increased winds in the afternoon.
Summerland Beach Summerland Beach is located off Lookout Park Rd. in the small town of Summerland. This site has a grassy park that sits on a bluff overlooking the beach. The park provides parking, restrooms, outdoor showers, volleyball courts, children’s playground and picnic tables. On weekends many members of the community use this park. There is a paved path that leads down to a long sandy beach. Walkers largely populate this beach in the mornings and late afternoon. In respect to weather, this site follows the pattern of a marine layer in the morning with sun and increased winds in the afternoon.
Santa Claus Beach Santa Claus Beach is located on Santa Claus Lane near the Padero exit of the Highway 101 in Carpinteria. This sandy beach is approximately 100 feet in length and over one hundred feet in width. There are no restrooms or lifeguards present at this site. There is a significant amount of parking on the shoulder of Santa Clause Lane. The beach population is made up of families with young children, as the surf is relatively mild. Throughout the summer surf schools occupy the beach. In respect to weather, this site beach follows the pattern of a marine layer in the morning with sun and increased winds in the afternoon.
Carpinteria City Beach
Carpinteria City Beach is located at the end of Linden and Ash Ave. just north of Carpinteria State Beach. Parking is found in the residential avenues of Ash, Linden, Holly and Elm. The sandy beach is approximately 1200 feet long and 150 feet wide. There are two lifeguard stations located at the southern and northern ends of the beach. The station at the southeastern end appears to belong to Carpinteria State Beach, but it serves to patrol the high density of people that spillover to the City beach. The station at the northeast end does not appear to be in service
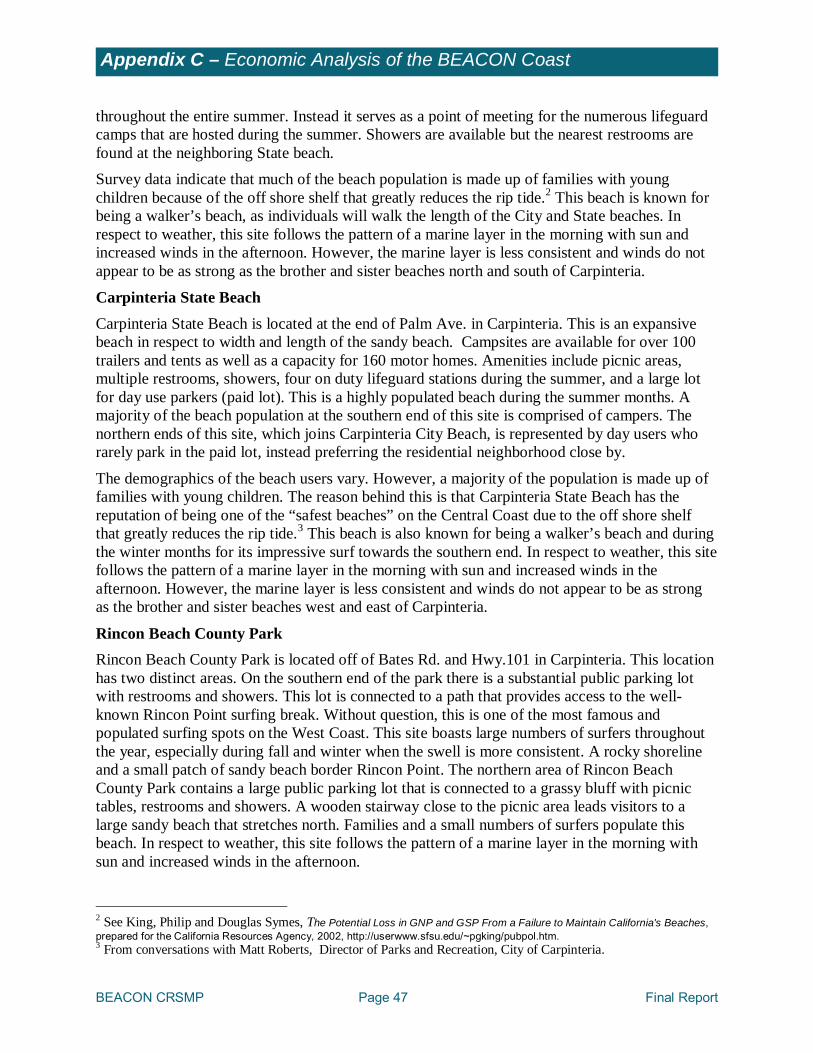
BEACON CRSMP Page 47 Final Report
Appendix C – Economic Analysis of the BEACON Coast
throughout the entire summer. Instead it serves as a point of meeting for the numerous lifeguard camps that are hosted during the summer. Showers are available but the nearest restrooms are found at the neighboring State beach. Survey data indicate that much of the beach population is made up of families with young children because of the off shore shelf that greatly reduces the rip tide.2 This beach is known for being a walker’s beach, as individuals will walk the length of the City and State beaches. In respect to weather, this site follows the pattern of a marine layer in the morning with sun and increased winds in the afternoon. However, the marine layer is less consistent and winds do not appear to be as strong as the brother and sister beaches north and south of Carpinteria.
Carpinteria State Beach Carpinteria State Beach is located at the end of Palm Ave. in Carpinteria. This is an expansive beach in respect to width and length of the sandy beach. Campsites are available for over 100 trailers and tents as well as a capacity for 160 motor homes. Amenities include picnic areas, multiple restrooms, showers, four on duty lifeguard stations during the summer, and a large lot for day use parkers (paid lot). This is a highly populated beach during the summer months. A majority of the beach population at the southern end of this site is comprised of campers. The northern ends of this site, which joins Carpinteria City Beach, is represented by day users who rarely park in the paid lot, instead preferring the residential neighborhood close by.
The demographics of the beach users vary. However, a majority of the population is made up of families with young children. The reason behind this is that Carpinteria State Beach has the reputation of being one of the “safest beaches” on the Central Coast due to the off shore shelf that greatly reduces the rip tide.3 This beach is also known for being a walker’s beach and during the winter months for its impressive surf towards the southern end. In respect to weather, this site follows the pattern of a marine layer in the morning with sun and increased winds in the afternoon. However, the marine layer is less consistent and winds do not appear to be as strong as the brother and sister beaches west and east of Carpinteria.
Rincon Beach County Park Rincon Beach County Park is located off of Bates Rd. and Hwy.101 in Carpinteria. This location has two distinct areas. On the southern end of the park there is a substantial public parking lot with restrooms and showers. This lot is connected to a path that provides access to the well-known Rincon Point surfing break. Without question, this is one of the most famous and populated surfing spots on the West Coast. This site boasts large numbers of surfers throughout the year, especially during fall and winter when the swell is more consistent. A rocky shoreline and a small patch of sandy beach border Rincon Point. The northern area of Rincon Beach County Park contains a large public parking lot that is connected to a grassy bluff with picnic tables, restrooms and showers. A wooden stairway close to the picnic area leads visitors to a large sandy beach that stretches north. Families and a small numbers of surfers populate this beach. In respect to weather, this site follows the pattern of a marine layer in the morning with sun and increased winds in the afternoon.
2 See King, Philip and Douglas Symes, The Potential Loss in GNP and GSP From a Failure to Maintain California's Beaches, prepared for the California Resources Agency, 2002, http://userwww.sfsu.edu/~pgking/pubpol.htm. 3 From conversations with Matt Roberts, Director of Parks and Recreation, City of Carpinteria.
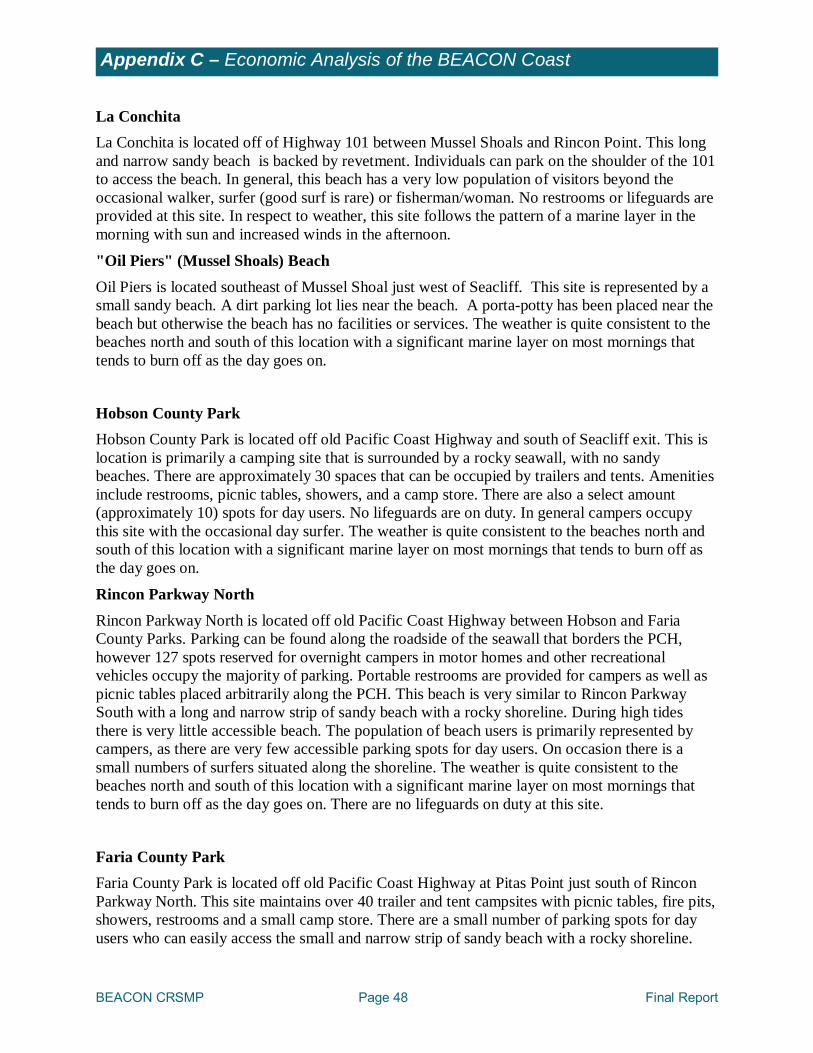
BEACON CRSMP Page 48 Final Report
Appendix C – Economic Analysis of the BEACON Coast
La Conchita La Conchita is located off of Highway 101 between Mussel Shoals and Rincon Point. This long and narrow sandy beach is backed by revetment. Individuals can park on the shoulder of the 101 to access the beach. In general, this beach has a very low population of visitors beyond the occasional walker, surfer (good surf is rare) or fisherman/woman. No restrooms or lifeguards are provided at this site. In respect to weather, this site follows the pattern of a marine layer in the morning with sun and increased winds in the afternoon.
"Oil Piers" (Mussel Shoals) Beach Oil Piers is located southeast of Mussel Shoal just west of Seacliff. This site is represented by a small sandy beach. A dirt parking lot lies near the beach. A porta-potty has been placed near the beach but otherwise the beach has no facilities or services. The weather is quite consistent to the beaches north and south of this location with a significant marine layer on most mornings that tends to burn off as the day goes on.
Hobson County Park Hobson County Park is located off old Pacific Coast Highway and south of Seacliff exit. This is location is primarily a camping site that is surrounded by a rocky seawall, with no sandy beaches. There are approximately 30 spaces that can be occupied by trailers and tents. Amenities include restrooms, picnic tables, showers, and a camp store. There are also a select amount (approximately 10) spots for day users. No lifeguards are on duty. In general campers occupy this site with the occasional day surfer. The weather is quite consistent to the beaches north and south of this location with a significant marine layer on most mornings that tends to burn off as the day goes on.
Rincon Parkway North Rincon Parkway North is located off old Pacific Coast Highway between Hobson and Faria County Parks. Parking can be found along the roadside of the seawall that borders the PCH, however 127 spots reserved for overnight campers in motor homes and other recreational vehicles occupy the majority of parking. Portable restrooms are provided for campers as well as picnic tables placed arbitrarily along the PCH. This beach is very similar to Rincon Parkway South with a long and narrow strip of sandy beach with a rocky shoreline. During high tides there is very little accessible beach. The population of beach users is primarily represented by campers, as there are very few accessible parking spots for day users. On occasion there is a small numbers of surfers situated along the shoreline. The weather is quite consistent to the beaches north and south of this location with a significant marine layer on most mornings that tends to burn off as the day goes on. There are no lifeguards on duty at this site.
Faria County Park Faria County Park is located off old Pacific Coast Highway at Pitas Point just south of Rincon Parkway North. This site maintains over 40 trailer and tent campsites with picnic tables, fire pits, showers, restrooms and a small camp store. There are a small number of parking spots for day users who can easily access the small and narrow strip of sandy beach with a rocky shoreline.
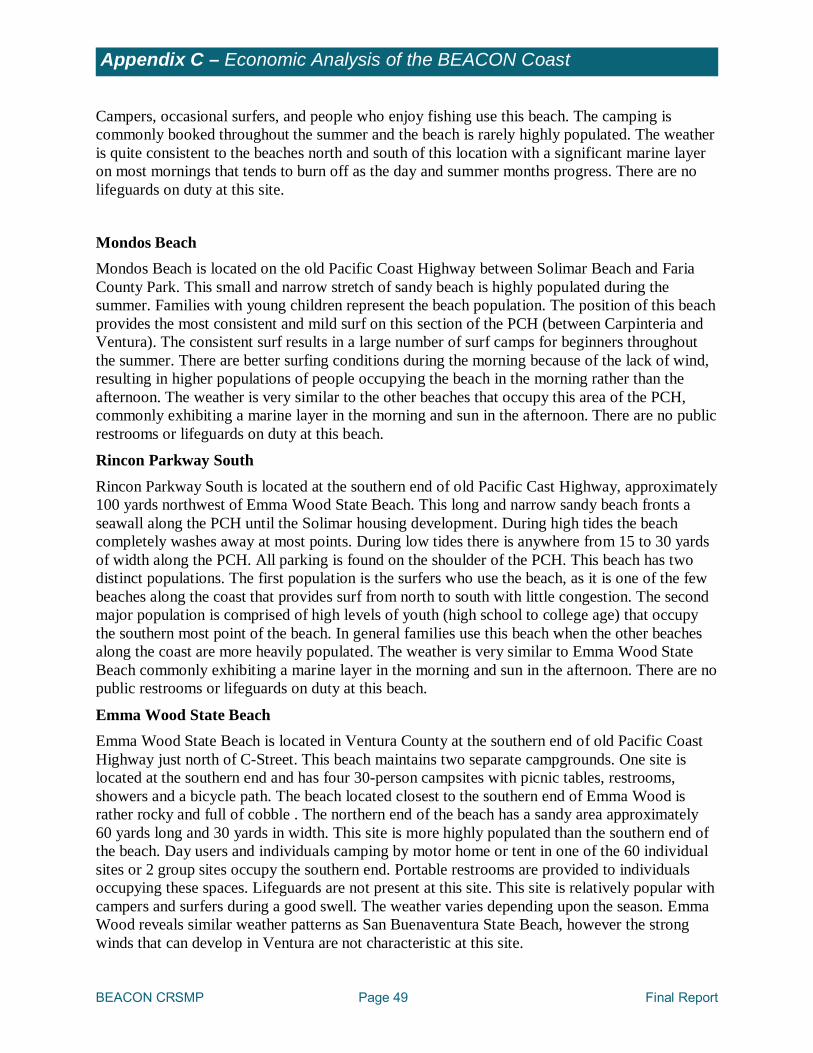
BEACON CRSMP Page 49 Final Report
Appendix C – Economic Analysis of the BEACON Coast
Campers, occasional surfers, and people who enjoy fishing use this beach. The camping is commonly booked throughout the summer and the beach is rarely highly populated. The weather is quite consistent to the beaches north and south of this location with a significant marine layer on most mornings that tends to burn off as the day and summer months progress. There are no lifeguards on duty at this site.
Mondos Beach Mondos Beach is located on the old Pacific Coast Highway between Solimar Beach and Faria County Park. This small and narrow stretch of sandy beach is highly populated during the summer. Families with young children represent the beach population. The position of this beach provides the most consistent and mild surf on this section of the PCH (between Carpinteria and Ventura). The consistent surf results in a large number of surf camps for beginners throughout the summer. There are better surfing conditions during the morning because of the lack of wind, resulting in higher populations of people occupying the beach in the morning rather than the afternoon. The weather is very similar to the other beaches that occupy this area of the PCH, commonly exhibiting a marine layer in the morning and sun in the afternoon. There are no public restrooms or lifeguards on duty at this beach.
Rincon Parkway South Rincon Parkway South is located at the southern end of old Pacific Cast Highway, approximately 100 yards northwest of Emma Wood State Beach. This long and narrow sandy beach fronts a seawall along the PCH until the Solimar housing development. During high tides the beach completely washes away at most points. During low tides there is anywhere from 15 to 30 yards of width along the PCH. All parking is found on the shoulder of the PCH. This beach has two distinct populations. The first population is the surfers who use the beach, as it is one of the few beaches along the coast that provides surf from north to south with little congestion. The second major population is comprised of high levels of youth (high school to college age) that occupy the southern most point of the beach. In general families use this beach when the other beaches along the coast are more heavily populated. The weather is very similar to Emma Wood State Beach commonly exhibiting a marine layer in the morning and sun in the afternoon. There are no public restrooms or lifeguards on duty at this beach.
Emma Wood State Beach Emma Wood State Beach is located in Ventura County at the southern end of old Pacific Coast Highway just north of C-Street. This beach maintains two separate campgrounds. One site is located at the southern end and has four 30-person campsites with picnic tables, restrooms, showers and a bicycle path. The beach located closest to the southern end of Emma Wood is rather rocky and full of cobble . The northern end of the beach has a sandy area approximately 60 yards long and 30 yards in width. This site is more highly populated than the southern end of the beach. Day users and individuals camping by motor home or tent in one of the 60 individual sites or 2 group sites occupy the southern end. Portable restrooms are provided to individuals occupying these spaces. Lifeguards are not present at this site. This site is relatively popular with campers and surfers during a good swell. The weather varies depending upon the season. Emma Wood reveals similar weather patterns as San Buenaventura State Beach, however the strong winds that can develop in Ventura are not characteristic at this site.
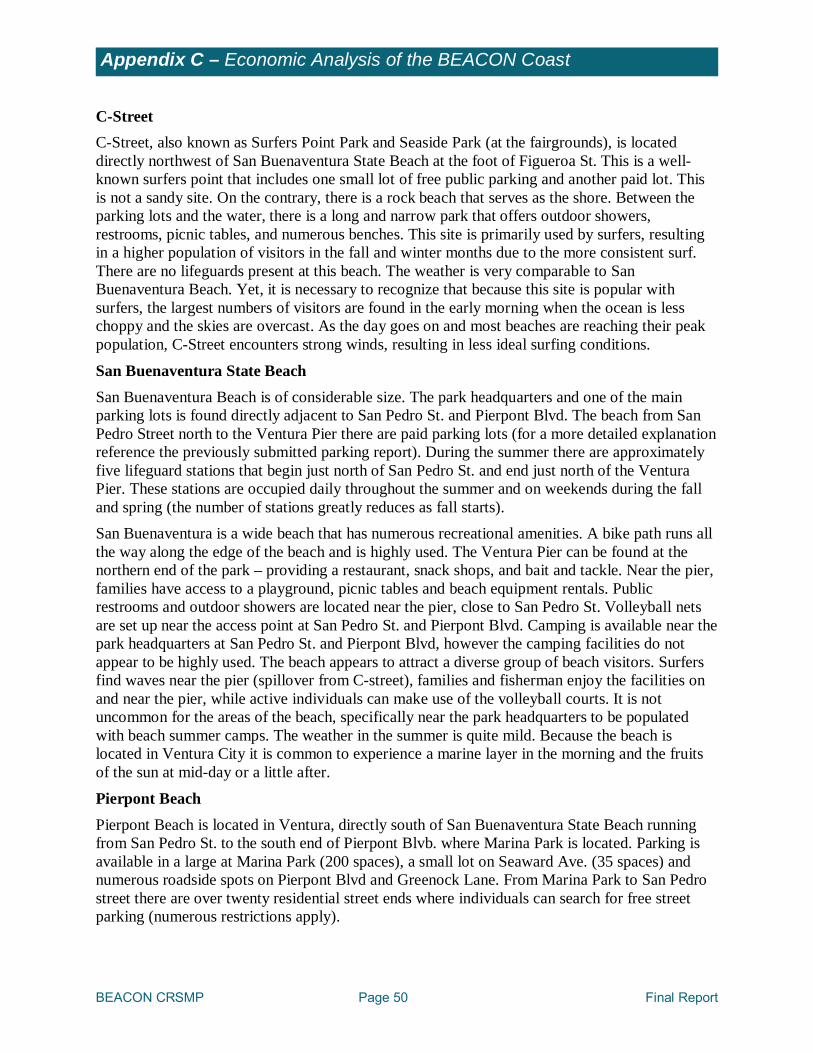
BEACON CRSMP Page 50 Final Report
Appendix C – Economic Analysis of the BEACON Coast
C-Street C-Street, also known as Surfers Point Park and Seaside Park (at the fairgrounds), is located directly northwest of San Buenaventura State Beach at the foot of Figueroa St. This is a well-known surfers point that includes one small lot of free public parking and another paid lot. This is not a sandy site. On the contrary, there is a rock beach that serves as the shore. Between the parking lots and the water, there is a long and narrow park that offers outdoor showers, restrooms, picnic tables, and numerous benches. This site is primarily used by surfers, resulting in a higher population of visitors in the fall and winter months due to the more consistent surf. There are no lifeguards present at this beach. The weather is very comparable to San Buenaventura Beach. Yet, it is necessary to recognize that because this site is popular with surfers, the largest numbers of visitors are found in the early morning when the ocean is less choppy and the skies are overcast. As the day goes on and most beaches are reaching their peak population, C-Street encounters strong winds, resulting in less ideal surfing conditions.
San Buenaventura State Beach San Buenaventura Beach is of considerable size. The park headquarters and one of the main parking lots is found directly adjacent to San Pedro St. and Pierpont Blvd. The beach from San Pedro Street north to the Ventura Pier there are paid parking lots (for a more detailed explanation reference the previously submitted parking report). During the summer there are approximately five lifeguard stations that begin just north of San Pedro St. and end just north of the Ventura Pier. These stations are occupied daily throughout the summer and on weekends during the fall and spring (the number of stations greatly reduces as fall starts). San Buenaventura is a wide beach that has numerous recreational amenities. A bike path runs all the way along the edge of the beach and is highly used. The Ventura Pier can be found at the northern end of the park – providing a restaurant, snack shops, and bait and tackle. Near the pier, families have access to a playground, picnic tables and beach equipment rentals. Public restrooms and outdoor showers are located near the pier, close to San Pedro St. Volleyball nets are set up near the access point at San Pedro St. and Pierpont Blvd. Camping is available near the park headquarters at San Pedro St. and Pierpont Blvd, however the camping facilities do not appear to be highly used. The beach appears to attract a diverse group of beach visitors. Surfers find waves near the pier (spillover from C-street), families and fisherman enjoy the facilities on and near the pier, while active individuals can make use of the volleyball courts. It is not uncommon for the areas of the beach, specifically near the park headquarters to be populated with beach summer camps. The weather in the summer is quite mild. Because the beach is located in Ventura City it is common to experience a marine layer in the morning and the fruits of the sun at mid-day or a little after.
Pierpont Beach Pierpont Beach is located in Ventura, directly south of San Buenaventura State Beach running from San Pedro St. to the south end of Pierpont Blvb. where Marina Park is located. Parking is available in a large at Marina Park (200 spaces), a small lot on Seaward Ave. (35 spaces) and numerous roadside spots on Pierpont Blvd and Greenock Lane. From Marina Park to San Pedro street there are over twenty residential street ends where individuals can search for free street parking (numerous restrictions apply).
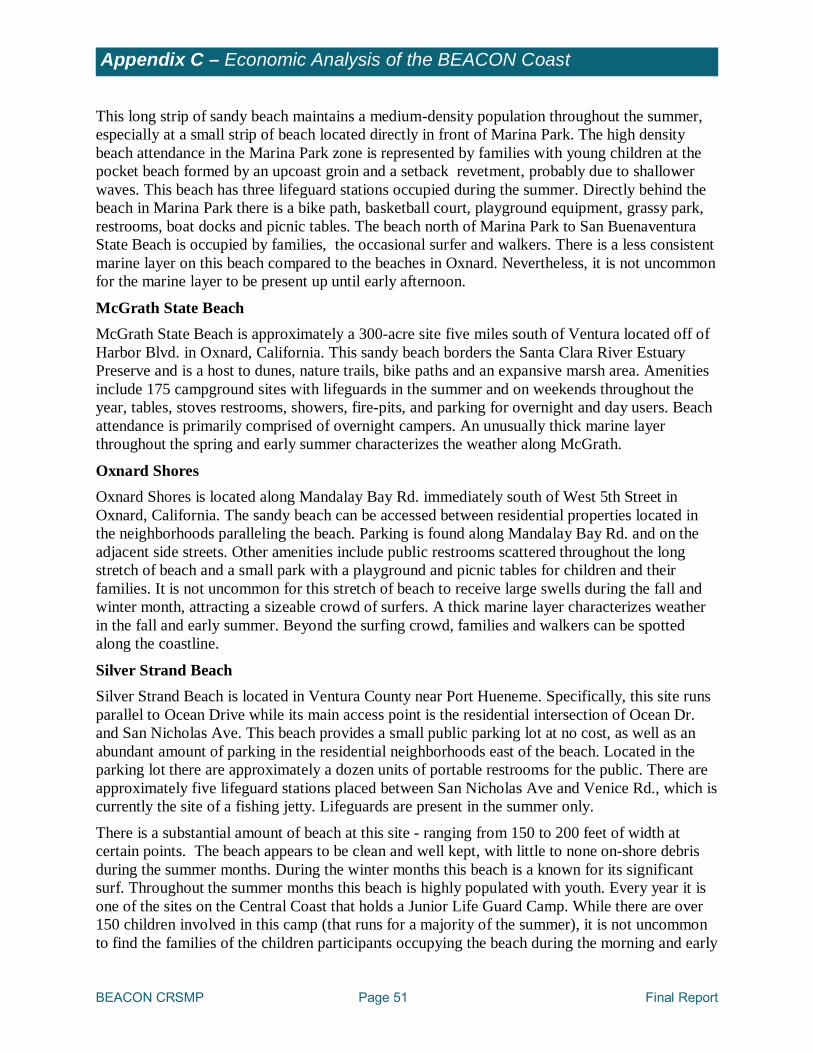
BEACON CRSMP Page 51 Final Report
Appendix C – Economic Analysis of the BEACON Coast
This long strip of sandy beach maintains a medium-density population throughout the summer, especially at a small strip of beach located directly in front of Marina Park. The high density beach attendance in the Marina Park zone is represented by families with young children at the pocket beach formed by an upcoast groin and a setback revetment, probably due to shallower waves. This beach has three lifeguard stations occupied during the summer. Directly behind the beach in Marina Park there is a bike path, basketball court, playground equipment, grassy park, restrooms, boat docks and picnic tables. The beach north of Marina Park to San Buenaventura State Beach is occupied by families, the occasional surfer and walkers. There is a less consistent marine layer on this beach compared to the beaches in Oxnard. Nevertheless, it is not uncommon for the marine layer to be present up until early afternoon.
McGrath State Beach McGrath State Beach is approximately a 300-acre site five miles south of Ventura located off of Harbor Blvd. in Oxnard, California. This sandy beach borders the Santa Clara River Estuary Preserve and is a host to dunes, nature trails, bike paths and an expansive marsh area. Amenities include 175 campground sites with lifeguards in the summer and on weekends throughout the year, tables, stoves restrooms, showers, fire-pits, and parking for overnight and day users. Beach attendance is primarily comprised of overnight campers. An unusually thick marine layer throughout the spring and early summer characterizes the weather along McGrath.
Oxnard Shores Oxnard Shores is located along Mandalay Bay Rd. immediately south of West 5th Street in Oxnard, California. The sandy beach can be accessed between residential properties located in the neighborhoods paralleling the beach. Parking is found along Mandalay Bay Rd. and on the adjacent side streets. Other amenities include public restrooms scattered throughout the long stretch of beach and a small park with a playground and picnic tables for children and their families. It is not uncommon for this stretch of beach to receive large swells during the fall and winter month, attracting a sizeable crowd of surfers. A thick marine layer characterizes weather in the fall and early summer. Beyond the surfing crowd, families and walkers can be spotted along the coastline.
Silver Strand Beach Silver Strand Beach is located in Ventura County near Port Hueneme. Specifically, this site runs parallel to Ocean Drive while its main access point is the residential intersection of Ocean Dr. and San Nicholas Ave. This beach provides a small public parking lot at no cost, as well as an abundant amount of parking in the residential neighborhoods east of the beach. Located in the parking lot there are approximately a dozen units of portable restrooms for the public. There are approximately five lifeguard stations placed between San Nicholas Ave and Venice Rd., which is currently the site of a fishing jetty. Lifeguards are present in the summer only.
There is a substantial amount of beach at this site - ranging from 150 to 200 feet of width at certain points. The beach appears to be clean and well kept, with little to none on-shore debris during the summer months. During the winter months this beach is a known for its significant surf. Throughout the summer months this beach is highly populated with youth. Every year it is one of the sites on the Central Coast that holds a Junior Life Guard Camp. While there are over 150 children involved in this camp (that runs for a majority of the summer), it is not uncommon to find the families of the children participants occupying the beach during the morning and early
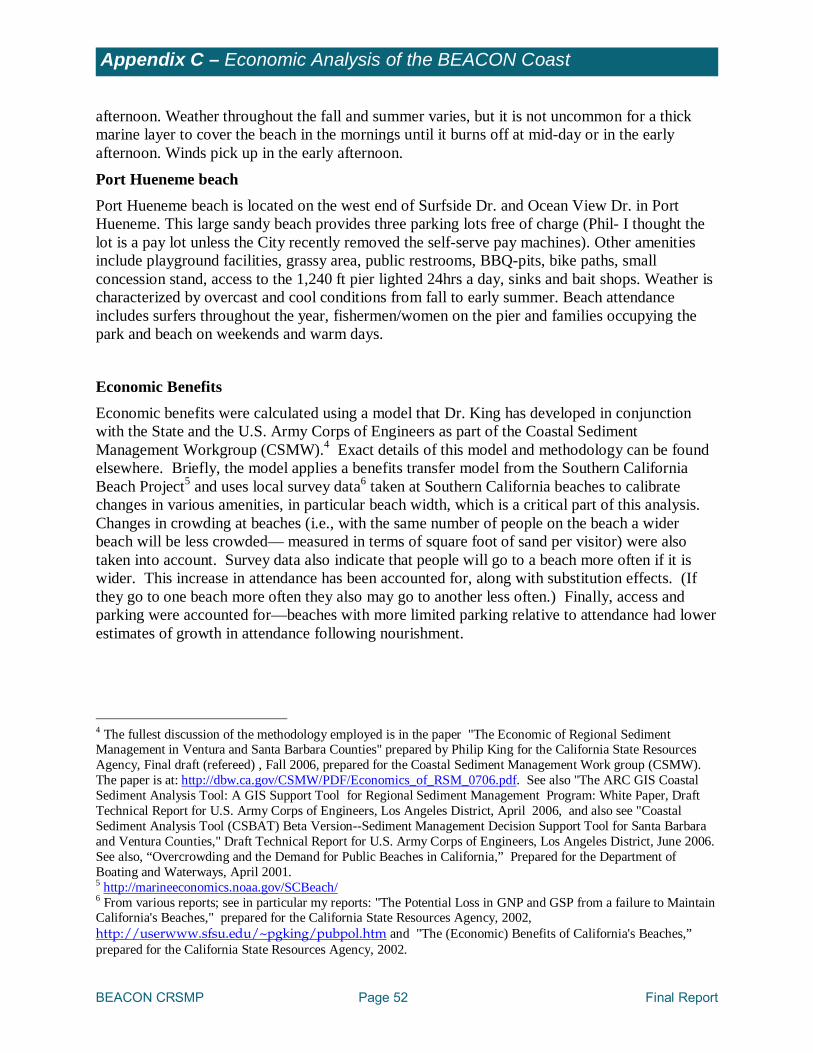
BEACON CRSMP Page 52 Final Report
Appendix C – Economic Analysis of the BEACON Coast
afternoon. Weather throughout the fall and summer varies, but it is not uncommon for a thick marine layer to cover the beach in the mornings until it burns off at mid-day or in the early afternoon. Winds pick up in the early afternoon.
Port Hueneme beach Port Hueneme beach is located on the west end of Surfside Dr. and Ocean View Dr. in Port Hueneme. This large sandy beach provides three parking lots free of charge (Phil- I thought the lot is a pay lot unless the City recently removed the self-serve pay machines). Other amenities include playground facilities, grassy area, public restrooms, BBQ-pits, bike paths, small concession stand, access to the 1,240 ft pier lighted 24hrs a day, sinks and bait shops. Weather is characterized by overcast and cool conditions from fall to early summer. Beach attendance includes surfers throughout the year, fishermen/women on the pier and families occupying the park and beach on weekends and warm days.
Economic Benefits Economic benefits were calculated using a model that Dr. King has developed in conjunction with the State and the U.S. Army Corps of Engineers as part of the Coastal Sediment Management Workgroup (CSMW).4 Exact details of this model and methodology can be found elsewhere. Briefly, the model applies a benefits transfer model from the Southern California Beach Project5 and uses local survey data6 taken at Southern California beaches to calibrate changes in various amenities, in particular beach width, which is a critical part of this analysis. Changes in crowding at beaches (i.e., with the same number of people on the beach a wider beach will be less crowded— measured in terms of square foot of sand per visitor) were also taken into account. Survey data also indicate that people will go to a beach more often if it is wider. This increase in attendance has been accounted for, along with substitution effects. (If they go to one beach more often they also may go to another less often.) Finally, access and parking were accounted for—beaches with more limited parking relative to attendance had lower estimates of growth in attendance following nourishment.
4 The fullest discussion of the methodology employed is in the paper "The Economic of Regional Sediment Management in Ventura and Santa Barbara Counties" prepared by Philip King for the California State Resources Agency, Final draft (refereed) , Fall 2006, prepared for the Coastal Sediment Management Work group (CSMW). The paper is at: http://dbw.ca.gov/CSMW/PDF/Economics_of_RSM_0706.pdf. See also "The ARC GIS Coastal Sediment Analysis Tool: A GIS Support Tool for Regional Sediment Management Program: White Paper, Draft Technical Report for U.S. Army Corps of Engineers, Los Angeles District, April 2006, and also see "Coastal Sediment Analysis Tool (CSBAT) Beta Version--Sediment Management Decision Support Tool for Santa Barbara and Ventura Counties," Draft Technical Report for U.S. Army Corps of Engineers, Los Angeles District, June 2006. See also, “Overcrowding and the Demand for Public Beaches in California,” Prepared for the Department of Boating and Waterways, April 2001. 5 http://marineeconomics.noaa.gov/SCBeach/ 6 From various reports; see in particular my reports: "The Potential Loss in GNP and GSP from a failure to Maintain California's Beaches," prepared for the California State Resources Agency, 2002, http://userwww.sfsu.edu/~pgking/pubpol.htm and "The (Economic) Benefits of California's Beaches,” prepared for the California State Resources Agency, 2002.
BEACON CRSMP Page 53 Final Report
Appendix C – Economic Analysis of the BEACON Coast
Beach attendance was measured from actual counts taken by Dr. King at each site between May 2007 and November 2007. A minimum of twenty counts was taken at each beach/reach over this time period and the attendance estimates are based on a weighting of high and low season activity as well as peak and non peak attendance during the week (weekend days are typically busier). The counts included the type of activity as well—swimming, lying on the beach, picnicking, surfing, etc. The attendance estimates used in this study divide the population into surfers and non-surfers. In addition, a brief survey was conducted and used to help calibrate attendance estimates.
Changes in crowding at beaches (i.e., with the same number of people on the beach a wider beach will be less crowded – measured in terms of square foot of sand per visitor) is also taken into account in this model. Survey data indicates that people will go to a beach more often if it is wider.7 This increase in attendance has been accounted for, along with substitution effects. (If they go to one beach more often they also may go to another less often.) Finally, at certain sites where parking is difficult relative to the number of visitors, the growth rates in attendance from increased beach width have been reduced to account for this difficulty. This is particularly an issue at Mission Beach, where parking spots are hard to find, particularly on weekends in high season.
In addition to recreational benefits, beaches provide potential benefits to coastal property and infrastructure which may be considerable. In the event of a severe (or possibly even moderate) storm, beaches act as a buffer, limiting the encroachment of the ocean and ocean waves on inland property. These benefits accrue to both public and private property. For this project, estimates of potential storm damages were limited to loss of public land due to erosion. Incorporating other storm damage prevention benefits, such as the increased benefit of preserving roads and municipal utilities would yield a somewhat higher result, though the value of lost public land is likely to be the most significant factor overall. Including the loss of private property also would yield substantially higher benefits. A number of the beaches in this study have been armored by seawalls, groins or other structures that already minimize storm damage. In these cases, storm damage prevention benefits were reduced accordingly. All decisions on these issues were made in consultation with Noble Consultants, the principal for this study.
Estimates of Benefits
Table 1 below summarizes this study’s estimates for the day use values of each beach, broken down by amenity value for each beach.
7 See King, Philip, Overcrowding and the Demand for Public Beaches in California,” Prepared for the Department of Boating and Waterways, April 2001.
.
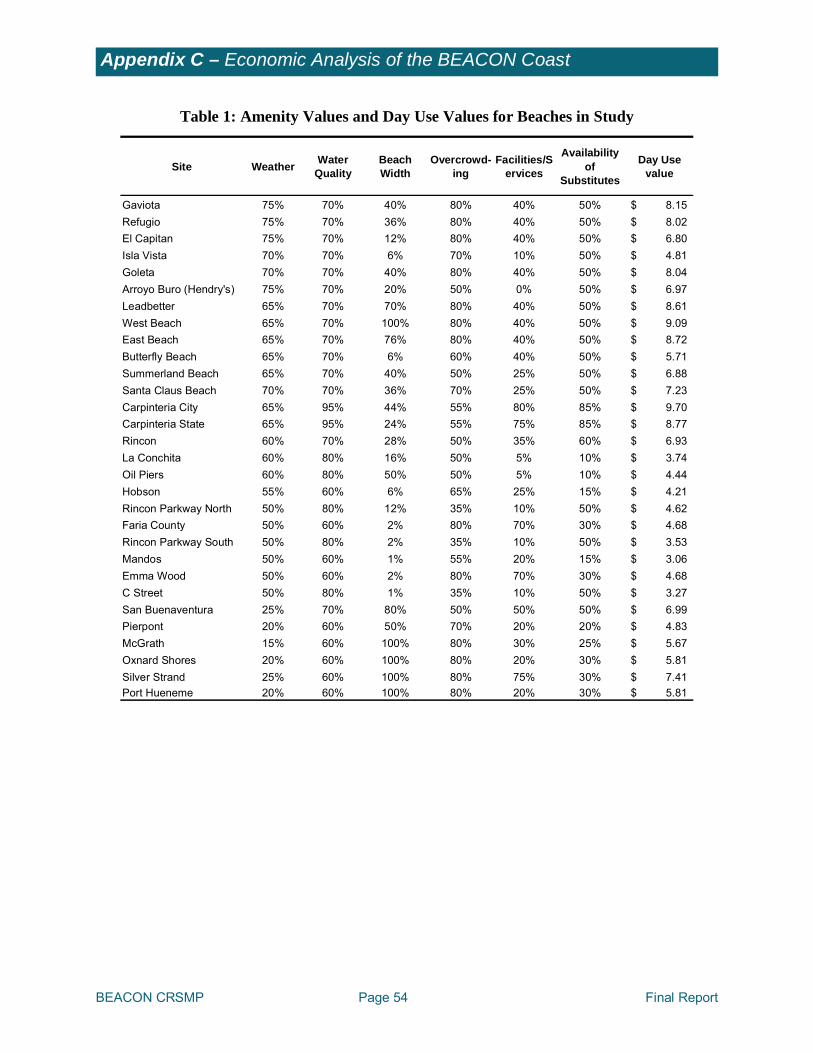
BEACON CRSMP Page 54 Final Report
Appendix C – Economic Analysis of the BEACON Coast
Table 1: Amenity Values and Day Use Values for Beaches in Study
Site Weather Water Quality
Beach Width
Overcrowd-ing
Facilities/Services
Availability of
Substitutes
Day Use value
Gaviota 75% 70% 40% 80% 40% 50% 8.15$ Refugio 75% 70% 36% 80% 40% 50% 8.02$ El Capitan 75% 70% 12% 80% 40% 50% 6.80$ Isla Vista 70% 70% 6% 70% 10% 50% 4.81$ Goleta 70% 70% 40% 80% 40% 50% 8.04$ Arroyo Buro (Hendry's) 75% 70% 20% 50% 0% 50% 6.97$ Leadbetter 65% 70% 70% 80% 40% 50% 8.61$ West Beach 65% 70% 100% 80% 40% 50% 9.09$ East Beach 65% 70% 76% 80% 40% 50% 8.72$ Butterfly Beach 65% 70% 6% 60% 40% 50% 5.71$ Summerland Beach 65% 70% 40% 50% 25% 50% 6.88$ Santa Claus Beach 70% 70% 36% 70% 25% 50% 7.23$ Carpinteria City 65% 95% 44% 55% 80% 85% 9.70$ Carpinteria State 65% 95% 24% 55% 75% 85% 8.77$ Rincon 60% 70% 28% 50% 35% 60% 6.93$ La Conchita 60% 80% 16% 50% 5% 10% 3.74$ Oil Piers 60% 80% 50% 50% 5% 10% 4.44$ Hobson 55% 60% 6% 65% 25% 15% 4.21$ Rincon Parkway North 50% 80% 12% 35% 10% 50% 4.62$ Faria County 50% 60% 2% 80% 70% 30% 4.68$ Rincon Parkway South 50% 80% 2% 35% 10% 50% 3.53$ Mandos 50% 60% 1% 55% 20% 15% 3.06$ Emma Wood 50% 60% 2% 80% 70% 30% 4.68$ C Street 50% 80% 1% 35% 10% 50% 3.27$ San Buenaventura 25% 70% 80% 50% 50% 50% 6.99$ Pierpont 20% 60% 50% 70% 20% 20% 4.83$ McGrath 15% 60% 100% 80% 30% 25% 5.67$ Oxnard Shores 20% 60% 100% 80% 20% 30% 5.81$ Silver Strand 25% 60% 100% 80% 75% 30% 7.41$ Port Hueneme 20% 60% 100% 80% 20% 30% 5.81$
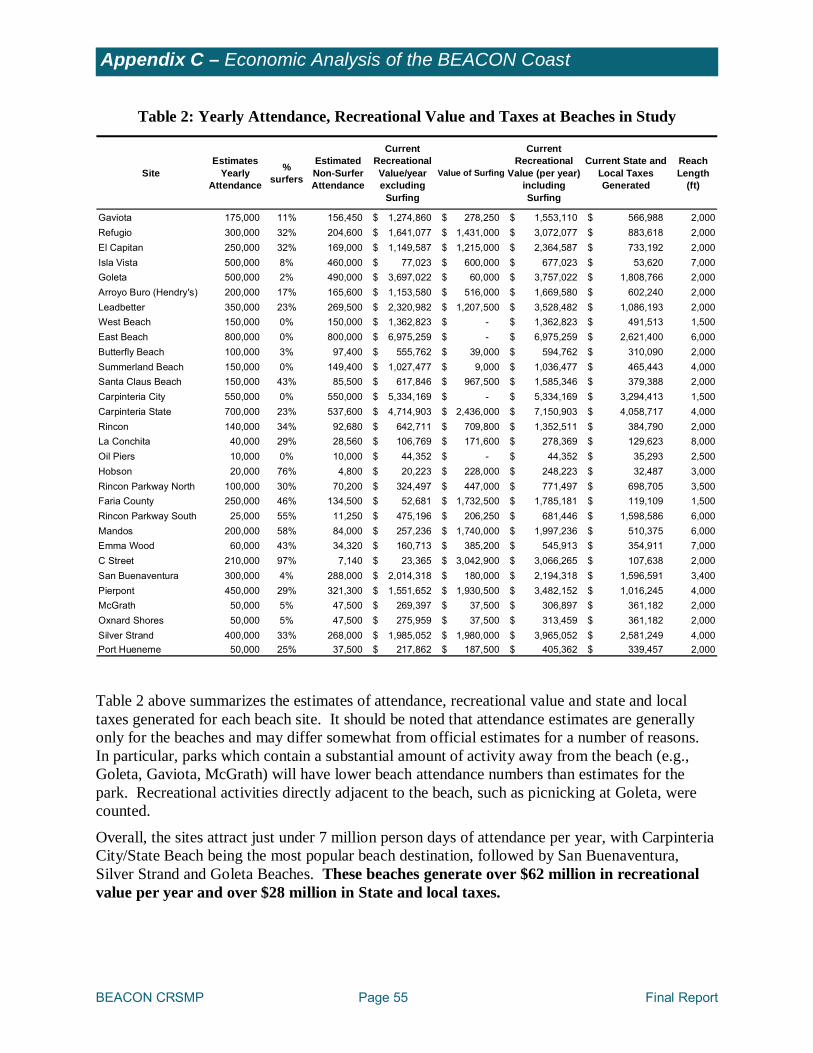
BEACON CRSMP Page 55 Final Report
Appendix C – Economic Analysis of the BEACON Coast
Table 2: Yearly Attendance, Recreational Value and Taxes at Beaches in Study
SiteEstimates
Yearly Attendance
% surfers
Estimated Non-Surfer Attendance
Current Recreational Value/year excluding
Surfing
Value of Surfing
Current Recreational
Value (per year) including Surfing
Current State and Local Taxes Generated
Reach Length
(ft)
Gaviota 175,000 11% 156,450 1,274,860$ 278,250$ 1,553,110$ 566,988$ 2,000Refugio 300,000 32% 204,600 1,641,077$ 1,431,000$ 3,072,077$ 883,618$ 2,000El Capitan 250,000 32% 169,000 1,149,587$ 1,215,000$ 2,364,587$ 733,192$ 2,000Isla Vista 500,000 8% 460,000 77,023$ 600,000$ 677,023$ 53,620$ 7,000Goleta 500,000 2% 490,000 3,697,022$ 60,000$ 3,757,022$ 1,808,766$ 2,000Arroyo Buro (Hendry's) 200,000 17% 165,600 1,153,580$ 516,000$ 1,669,580$ 602,240$ 2,000Leadbetter 350,000 23% 269,500 2,320,982$ 1,207,500$ 3,528,482$ 1,086,193$ 2,000West Beach 150,000 0% 150,000 1,362,823$ -$ 1,362,823$ 491,513$ 1,500East Beach 800,000 0% 800,000 6,975,259$ -$ 6,975,259$ 2,621,400$ 6,000Butterfly Beach 100,000 3% 97,400 555,762$ 39,000$ 594,762$ 310,090$ 2,000Summerland Beach 150,000 0% 149,400 1,027,477$ 9,000$ 1,036,477$ 465,443$ 4,000Santa Claus Beach 150,000 43% 85,500 617,846$ 967,500$ 1,585,346$ 379,388$ 2,000Carpinteria City 550,000 0% 550,000 5,334,169$ -$ 5,334,169$ 3,294,413$ 1,500Carpinteria State 700,000 23% 537,600 4,714,903$ 2,436,000$ 7,150,903$ 4,058,717$ 4,000Rincon 140,000 34% 92,680 642,711$ 709,800$ 1,352,511$ 384,790$ 2,000La Conchita 40,000 29% 28,560 106,769$ 171,600$ 278,369$ 129,623$ 8,000Oil Piers 10,000 0% 10,000 44,352$ -$ 44,352$ 35,293$ 2,500Hobson 20,000 76% 4,800 20,223$ 228,000$ 248,223$ 32,487$ 3,000Rincon Parkway North 100,000 30% 70,200 324,497$ 447,000$ 771,497$ 698,705$ 3,500Faria County 250,000 46% 134,500 52,681$ 1,732,500$ 1,785,181$ 119,109$ 1,500Rincon Parkway South 25,000 55% 11,250 475,196$ 206,250$ 681,446$ 1,598,586$ 6,000Mandos 200,000 58% 84,000 257,236$ 1,740,000$ 1,997,236$ 510,375$ 6,000Emma Wood 60,000 43% 34,320 160,713$ 385,200$ 545,913$ 354,911$ 7,000C Street 210,000 97% 7,140 23,365$ 3,042,900$ 3,066,265$ 107,638$ 2,000San Buenaventura 300,000 4% 288,000 2,014,318$ 180,000$ 2,194,318$ 1,596,591$ 3,400Pierpont 450,000 29% 321,300 1,551,652$ 1,930,500$ 3,482,152$ 1,016,245$ 4,000McGrath 50,000 5% 47,500 269,397$ 37,500$ 306,897$ 361,182$ 2,000Oxnard Shores 50,000 5% 47,500 275,959$ 37,500$ 313,459$ 361,182$ 2,000Silver Strand 400,000 33% 268,000 1,985,052$ 1,980,000$ 3,965,052$ 2,581,249$ 4,000Port Hueneme 50,000 25% 37,500 217,862$ 187,500$ 405,362$ 339,457$ 2,000 Table 2 above summarizes the estimates of attendance, recreational value and state and local taxes generated for each beach site. It should be noted that attendance estimates are generally only for the beaches and may differ somewhat from official estimates for a number of reasons. In particular, parks which contain a substantial amount of activity away from the beach (e.g., Goleta, Gaviota, McGrath) will have lower beach attendance numbers than estimates for the park. Recreational activities directly adjacent to the beach, such as picnicking at Goleta, were counted.
Overall, the sites attract just under 7 million person days of attendance per year, with Carpinteria City/State Beach being the most popular beach destination, followed by San Buenaventura, Silver Strand and Goleta Beaches. These beaches generate over $62 million in recreational value per year and over $28 million in State and local taxes.
BEACON CRSMP Page 56 Final Report
Appendix C – Economic Analysis of the BEACON Coast
The Benefits of Beach Nourishment Beach nourishment provides two main benefits—recreational benefits and storm damage prevention benefits. Recreational benefits are provided in a number of ways:
1. Widening narrow beaches provides a better recreational experience;
2. Widening beaches can reduce crowding; 3. Widening beaches increases attendance (though this mitigates the benefits of reducing
crowding). In addition, beaches may provide n benefits for non-users in the form of “existence value” or aesthetic benefits to people who do not go to the beach. These benefits are difficult to measure and have not been included in this analysis.
A more detailed discussion of how benefits were derived is available in Appendix A. A brief description follows. Beaches were rated according to the following criteria:
1. Weather: Santa Barbara and Ventura county beaches are typically cool and foggy in the morning and warmer and sunnier in the afternoon, especially during summer months. Microclimates matter and some beaches are warmer and sunnier than others. As a general rule, the weather improves in these two counties as one goes north and west. Ventura and Oxnard beaches can be quite cold all year round.
2. Water Quality: Water quality (specifically bacteria counts) is a serious issue at many beaches in California, but not typically in the study area and most beaches score well in this regard.
3. Beach Width: Narrow beaches score lower than wide beaches.
4. Overcrowding: The survey results indicate that most people prefer less crowded beaches and beaches are scored accordingly. Most beaches in the study area are generally not that crowded, though Carpinteria and Silver Strand can be crowded on summer weekends.
5. Beach Facilities and Services: Beaches with more facilities and services such as restrooms, lifeguards, piers scored higher.
6. Availability of Substitutes: If a similar beach is available nearby then its value is diminished.
Each beach was rated for the above amenities. Weather varies somewhat from north to south. Ironically, beaches in the eastern/southern part of the study area (e.g., Oxnard Shores) generally have more cold windy, foggy days than beaches in the northern part of the study (e.g., Gaviota). The index for water quality primarily examines the issue of bacterial contamination and is not a significant issue at most beaches in the study. Beach width was measured from USGS lidar survey data recorded in October 2005.
Overcrowding was measured based on attendance counts and the effective size of the beaches where they are used most often. Most of the beaches in the study area do not have significant overcrowding issues, except for a few (e.g., Carpinteria City Beach) on summer weekends or very small beaches that are quite popular (e.g., Butterfly Beach).
BEACON CRSMP Page 57 Final Report
Appendix C – Economic Analysis of the BEACON Coast
Beaches with lifeguards, good restroom facilities and amenities such as snack bars or other recreational activities were given higher scores on facilities and services. Beaches which had fewer close substitutes scored higher in terms of availability of substitutes. Due to limited information and budget constraints of the study, storm damage prevention benefits were limited to an examination of loss of public land due to erosion. In a number of cases, this resulted in an underestimate of the benefits of nourishment. For example, some beaches (e.g., Rincon Parkway) are directly adjacent to Highway 1 and a beach might help act as an additional buffer, even where a seawall exists. Second, public structures such as piers, restrooms as well as municipal electric and gas lines might also be protected by increased nourishment. These additional benefits were not estimated but could be substantial at a number of sites (e.g. Goleta). Table 3 presents this study’s estimates of the present value of a permanent 100 foot increase in beach width at each site maintained over a twenty year period. Benefits vary considerably by site. As a general rule, narrow beaches benefit much more than wider beaches, as one would expect. The other issue is the popularity of the beach. The model factors in increases in beach attendance at each side as the beach are widened. Once again, narrower beaches benefit the most but already popular beaches (e.g. Carpinteria) also benefit substantially since everyone benefits from wider beaches.
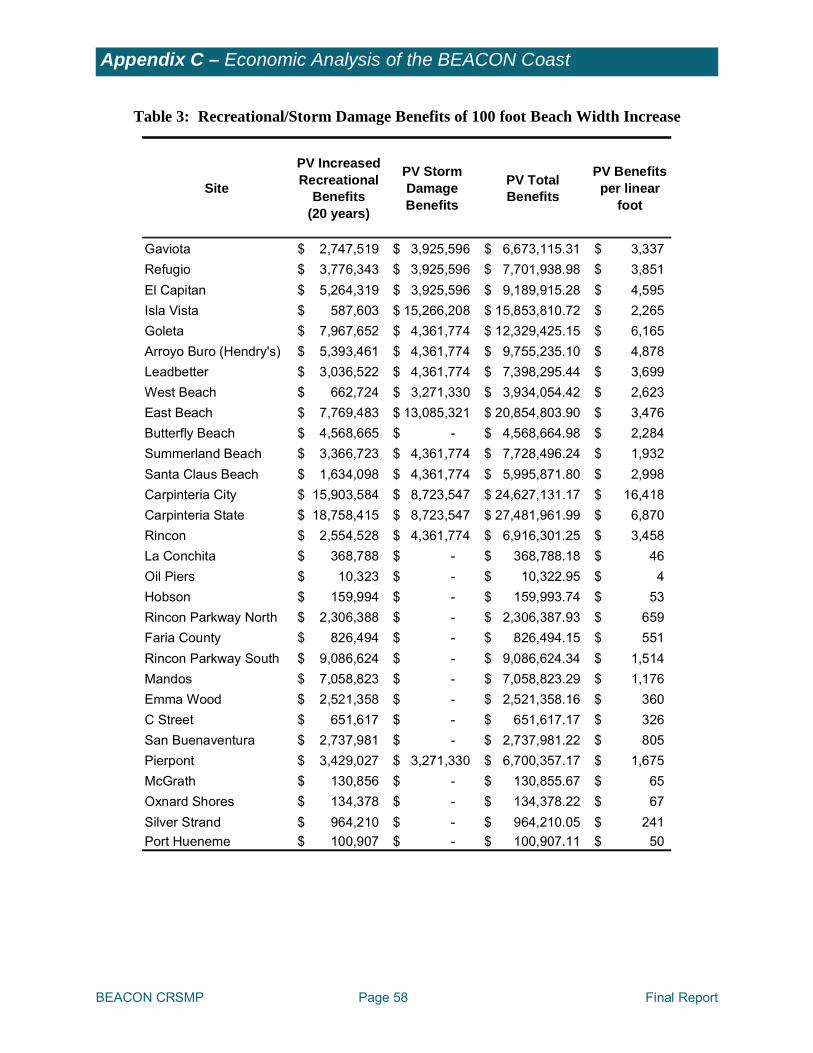
BEACON CRSMP Page 58 Final Report
Appendix C – Economic Analysis of the BEACON Coast
Table 3: Recreational/Storm Damage Benefits of 100 foot Beach Width Increase
Site
PV Increased Recreational
Benefits (20 years)
PV Storm Damage Benefits
PV Total Benefits
PV Benefits per linear
foot
Gaviota 2,747,519$ 3,925,596$ 6,673,115.31$ 3,337$ Refugio 3,776,343$ 3,925,596$ 7,701,938.98$ 3,851$ El Capitan 5,264,319$ 3,925,596$ 9,189,915.28$ 4,595$ Isla Vista 587,603$ 15,266,208$ 15,853,810.72$ 2,265$ Goleta 7,967,652$ 4,361,774$ 12,329,425.15$ 6,165$ Arroyo Buro (Hendry's) 5,393,461$ 4,361,774$ 9,755,235.10$ 4,878$ Leadbetter 3,036,522$ 4,361,774$ 7,398,295.44$ 3,699$ West Beach 662,724$ 3,271,330$ 3,934,054.42$ 2,623$ East Beach 7,769,483$ 13,085,321$ 20,854,803.90$ 3,476$ Butterfly Beach 4,568,665$ -$ 4,568,664.98$ 2,284$ Summerland Beach 3,366,723$ 4,361,774$ 7,728,496.24$ 1,932$ Santa Claus Beach 1,634,098$ 4,361,774$ 5,995,871.80$ 2,998$ Carpinteria City 15,903,584$ 8,723,547$ 24,627,131.17$ 16,418$ Carpinteria State 18,758,415$ 8,723,547$ 27,481,961.99$ 6,870$ Rincon 2,554,528$ 4,361,774$ 6,916,301.25$ 3,458$ La Conchita 368,788$ -$ 368,788.18$ 46$ Oil Piers 10,323$ -$ 10,322.95$ 4$ Hobson 159,994$ -$ 159,993.74$ 53$ Rincon Parkway North 2,306,388$ -$ 2,306,387.93$ 659$ Faria County 826,494$ -$ 826,494.15$ 551$ Rincon Parkway South 9,086,624$ -$ 9,086,624.34$ 1,514$ Mandos 7,058,823$ -$ 7,058,823.29$ 1,176$ Emma Wood 2,521,358$ -$ 2,521,358.16$ 360$ C Street 651,617$ -$ 651,617.17$ 326$ San Buenaventura 2,737,981$ -$ 2,737,981.22$ 805$ Pierpont 3,429,027$ 3,271,330$ 6,700,357.17$ 1,675$ McGrath 130,856$ -$ 130,855.67$ 65$ Oxnard Shores 134,378$ -$ 134,378.22$ 67$ Silver Strand 964,210$ -$ 964,210.05$ 241$ Port Hueneme 100,907$ -$ 100,907.11$ 50$
BEACON CRSMP Page 59 Final Report
Appendix C – Economic Analysis of the BEACON Coast
The costs of these projects would vary significantly depending upon the frequency of the nourishment cycle and if any structures are necessary to keep the sand in place. However, one clear criterion is beach/reach length. Longer beach length will requite more beach fill to maintain a 100 ft increase than will shorter beaches. The final column in table 2 divides the total benefits by reach length in order to give a relative valuation here. As one can see, Carpinteria City beach has by far the largest benefit per linear foot, although it is unlikely that Carpinteria City beach would be nourished without also nourishing the State beach. Fortunately, Carpinteria State beach has the second highest benefit per linear foot. Thus, based on this criterion, Carpinteria City and State beaches deserve careful examination. A number of other beaches in Santa Barbara county also deserve careful consideration including: Goleta, El Capitan, Refugio, and Hendry’s. In Ventura County, the Rincon Parkway South/Mandos reach also deserves consideration.
Financing Nourishment Projects In California, most nourishment projects have been financed by State or federal funds. Local financial participation has generally been limited and the local financial share has often come from State sources. Currently, the state of California’s shore protection program is operated through the Department of Boating and Waterways (DBW). DBW has dedicated funds from the state gasoline tax—the percentage of the tax DBW receives is equivalent to estimates of the percentage of gasoline consumption by recreational boaters. Proposition 84, the Clean Water, Parks and Coastal Protection Act of 2006, was approved on the November 2006 ballot. The bill is designed to provide $5.4 billion for clean water, flood protection, and protection of California’s coast, including beaches. It is likely that State financing will continue to play a dominant role with funds from California Proposition 84 also potentially used for BEACON projects.
The Army Corps of Engineers has also played an important role in beach nourishment in California. Currently, Oil Piers is slated for a demonstration project and Carpinteria is under consideration for potential nourishment. However, recently the Corps’s budget has been stretched severely by obligations on the Gulf coast post-Katrina and by resource limitations in Washington, D.C. However, for small nourishment projects and for matching funds, some local financing options may be needed. Further, the availability of even a relatively small amount of local funding can often be used to leverage much larger amounts of State and local funding. Consequently, BEACON may find it useful to examine potential sources of revenue for nourishment projects. This section will look at a wide variety of funding options available to BEACON or to the cities within BEACON.
What are other States Doing? Many other states have been active in financing beaches. In particular, Florida has gathered financial and political support for beach nourishment. According to the Florida Shore and Beach Preservation Association (FSBPA), over half of all recent spending in the state was financed
BEACON CRSMP Page 60 Final Report
Appendix C – Economic Analysis of the BEACON Coast
from local funds. Florida uses a number of mechanisms to finance beach nourishment. State law requires that at least $30 million of revenues from Florida’s real estate documentary stamp tax (equivalent to California’s real estate transfer tax) must go for beach nourishment projects and in many years the state funds more than the required minimum.8
Florida state law also requires that half of the non-federal funding for a nourishment project must come from local sources. In cases where state land is involved, the state share is higher (as much as 100 percent) and in some smaller projects the local share is higher. In Florida, the local share of these projects is, in fact, higher than the state share and considerably higher than the federal share. In Florida, the primary means of financing the local share is the tourist development tax, which is essentially the same as California’s Transient Occupancy Tax (TOT). In Florida, typically at least one percent of the tax is dedicated to beach nourishment and an additional one or two per cent may be (and often is) dedicated to nourishment. The typical tourist development tax (levied by individual counties) is 3 percent. However, Florida also levies a 6 percent state sales tax on hotel occupancy and some counties also add on up to a 1 percent local discretionary tax, so the effective tax on tourists is generally 9-10 percent, not significantly different from the taxes on hotel and transient housing in California, which is not subject to sales tax. In some parts of Florida, voters have also approved a special assessment on property (as part of the property tax). These assessments are generally higher for property closer to the beach and lower for property farther away. One advantage of these assessments is that bonds can be issued against them so that a nourishment project can proceed sooner than would be possible with other taxes, where one must typically wait until the money has been collected.
In New York State, the local governments cost-share, with the state paying 70 percent and the locals paying 30 percent of the non-federal cost of the project. In New Jersey, $25 million is dedicated annually from the legislature for shore protection projects across the entire state. These funds come from New Jersey’s real estate transfer tax. Most of this money goes to the state share of federal projects with the US Army Corps of Engineers. The Corps generally funds 65 percent of these nourishment projects; the remaining 35 percent of the project is split between the state and the municipality. The state/local share in New Jersey is split 75 percent/25 percent, so it only costs the municipality nine cents out of every dollar to finance beach nourishment. New Jersey is also engaged in smaller state/local projects with no federal involvement, financed also at a 75 percent/25 percent state/local ratio. The municipalities typically raise bond revenues for their portion and counties sometimes fund a portion to help defer the local costs.9 Delaware has passed a “Beach Act” which specifies at least $1 million per year go to beach nourishment and shoreline preservation. Delaware also finances shoreline protection and beach nourishment through bond measures, plus it added a 1 percent state “accommodations tax,” (essentially a transient occupancy tax) dedicated to shoreline protection. According to Tony Pratt, who has been involved in beach nourishment issues in Delaware for many years, the Delaware General Assembly will typically add funding if needed. In Delaware, the typical state and local cost share is 50/50. However the 1 percent transient occupancy tax dedicated to
8 From telephone conversation with Deborah Flack of the FSBPA, September 2006. 9 Ben Keiser, Supervising Engineer, State of New Jersey.
BEACON CRSMP Page 61 Final Report
Appendix C – Economic Analysis of the BEACON Coast
nourishment (which in Delaware, unlike most states, is levied by the state) can be used as part of local share.10 This tax raises an estimated $1.7 million per year.
Dedicated Taxes at the State and Local Level It is clear from an examination of other states that one of the primary sources of funding for beach restoration at the local level is the transient occupancy tax (TOT) or equivalent, though some local authorities also use property tax assessments and the real estate transfer tax. TOT’s are popular for a variety of reasons. First, non-residents generally pay TOT’s11, and voters are less opposed when someone else pays. Second, since TOT’s are levied on tourist dollars and beaches generate tourism, there is a direct link between the tax and beach restoration. The California cities of Encinitas and Solana Beach have already increased TOT’s from 10 percent to 12 percent and used the proceeds to create a fund to finance beach restoration. The San Diego Association of Governments (SANDAG) has had serious discussion about using TOT’s to finance a project covering the entire coast of San Diego County. TOT’s can generate substantial funds for beach nourishment and are generally a politically feasible way to accomplish this goal. To give an idea of how effective TOT’s can be in California, an analysis was made of the impact of a one or two per cent increase in TOT’s at in cities in the study area as well as in unincorporated areas at the county level. (TOT’s in unincorporated areas go directly to the county.)
The Potential for Transient Occupancy Taxes in BEACON Table 3 below presents current TOT revenue collections for the cities and counties in BEACON. Data was collected directly from the cities, usually their Comprehensive Annual Financial Report (CAFR). The data is for the most recent year, generally 2007. The TOT data for the counties is only for unincorporated areas, and there are only a handful of hotels in Ventura that are in these areas, unlike in Santa Barbara County. As one can see, TOT’s vary considerably by city and county and depend upon the popularity and price of hotels. Not surprisingly, the City of Santa Barbara than the rest of the study area combined. However, even smaller cities like Carpinteria, TOT’s can generate revenue in the millions. Column three of Table 3 indicates the current TOT rate. In most cities in the study area, as in California as a whole, the TOT rate is 10%. The City of Santa Barbara already has a TOT rate of 12%; the county of Ventura (unincorporated areas) has an unusually low TOT rate of 8%.
For most cities in Santa Barbara and Ventura counties, as well as the unincorporated area of Ventura County, it may be reasonable to raise TOT’s by another one or two percent and use some or all of the proceeds for beach restoration, as the cities of Encinitas and Solana beach have
10 Information obtained from Tony Pratt, Coastal Manager, State of Delaware. 11 However, an economist will point out that an increase in TOT can also lower hotel revenues since the higher cost in TOT will be at least partially offset by lower hotel revenues.
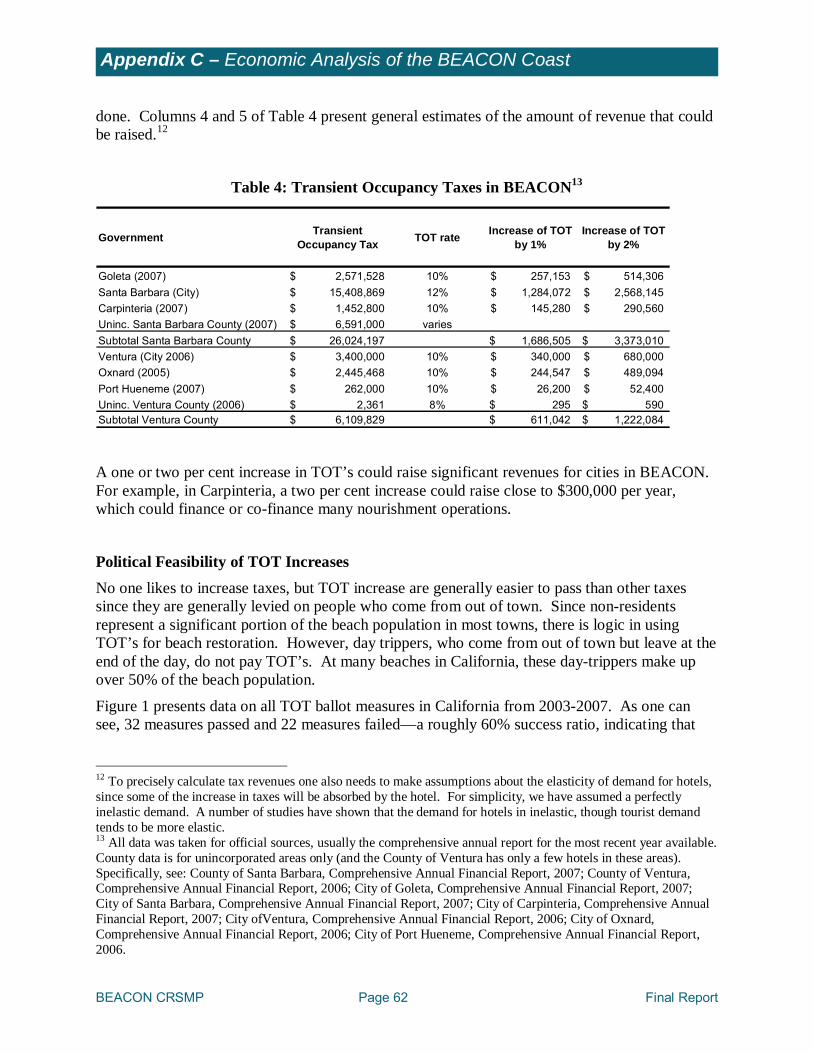
BEACON CRSMP Page 62 Final Report
Appendix C – Economic Analysis of the BEACON Coast
done. Columns 4 and 5 of Table 4 present general estimates of the amount of revenue that could be raised.12
Table 4: Transient Occupancy Taxes in BEACON13
Government Transient Occupancy Tax TOT rate Increase of TOT
by 1%Increase of TOT
by 2%
Goleta (2007) 2,571,528$ 10% 257,153$ 514,306$ Santa Barbara (City) 15,408,869$ 12% 1,284,072$ 2,568,145$ Carpinteria (2007) 1,452,800$ 10% 145,280$ 290,560$ Uninc. Santa Barbara County (2007) 6,591,000$ variesSubtotal Santa Barbara County 26,024,197$ 1,686,505$ 3,373,010$ Ventura (City 2006) 3,400,000$ 10% 340,000$ 680,000$ Oxnard (2005) 2,445,468$ 10% 244,547$ 489,094$ Port Hueneme (2007) 262,000$ 10% 26,200$ 52,400$ Uninc. Ventura County (2006) 2,361$ 8% 295$ 590$ Subtotal Ventura County 6,109,829$ 611,042$ 1,222,084$ A one or two per cent increase in TOT’s could raise significant revenues for cities in BEACON. For example, in Carpinteria, a two per cent increase could raise close to $300,000 per year, which could finance or co-finance many nourishment operations.
Political Feasibility of TOT Increases No one likes to increase taxes, but TOT increase are generally easier to pass than other taxes since they are generally levied on people who come from out of town. Since non-residents represent a significant portion of the beach population in most towns, there is logic in using TOT’s for beach restoration. However, day trippers, who come from out of town but leave at the end of the day, do not pay TOT’s. At many beaches in California, these day-trippers make up over 50% of the beach population.
Figure 1 presents data on all TOT ballot measures in California from 2003-2007. As one can see, 32 measures passed and 22 measures failed—a roughly 60% success ratio, indicating that
12 To precisely calculate tax revenues one also needs to make assumptions about the elasticity of demand for hotels, since some of the increase in taxes will be absorbed by the hotel. For simplicity, we have assumed a perfectly inelastic demand. A number of studies have shown that the demand for hotels in inelastic, though tourist demand tends to be more elastic. 13 All data was taken for official sources, usually the comprehensive annual report for the most recent year available. County data is for unincorporated areas only (and the County of Ventura has only a few hotels in these areas). Specifically, see: County of Santa Barbara, Comprehensive Annual Financial Report, 2007; County of Ventura, Comprehensive Annual Financial Report, 2006; City of Goleta, Comprehensive Annual Financial Report, 2007; City of Santa Barbara, Comprehensive Annual Financial Report, 2007; City of Carpinteria, Comprehensive Annual Financial Report, 2007; City ofVentura, Comprehensive Annual Financial Report, 2006; City of Oxnard, Comprehensive Annual Financial Report, 2006; City of Port Hueneme, Comprehensive Annual Financial Report, 2006.
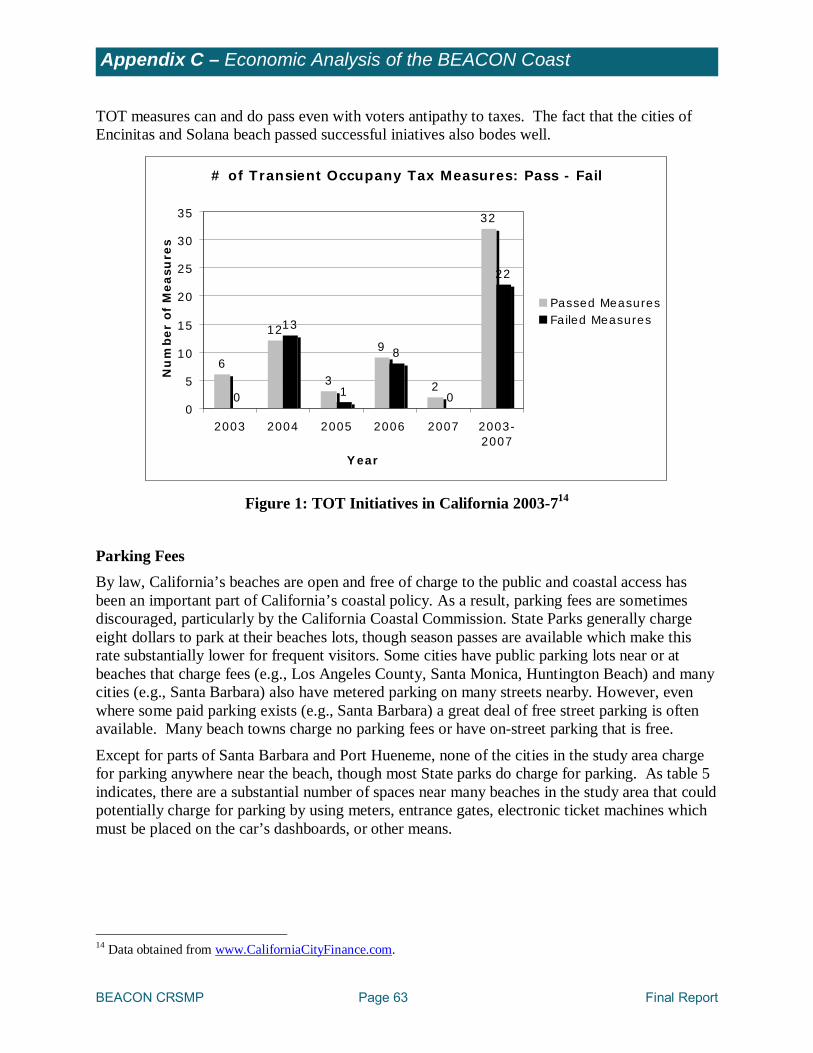
BEACON CRSMP Page 63 Final Report
Appendix C – Economic Analysis of the BEACON Coast
TOT measures can and do pass even with voters antipathy to taxes. The fact that the cities of Encinitas and Solana beach passed successful iniatives also bodes well.
# of Transient Occupany Tax Measures: Pass - Fail
6
12
3
9
2
32
0
13
1
8
0
22
0
5
10
15
20
25
30
35
2003 2004 2005 2006 2007 2003-2007
Year
Nu
mber
of
Measu
res
Passed MeasuresFailed Measures
Figure 1: TOT Initiatives in California 2003-714
Parking Fees By law, California’s beaches are open and free of charge to the public and coastal access has been an important part of California’s coastal policy. As a result, parking fees are sometimes discouraged, particularly by the California Coastal Commission. State Parks generally charge eight dollars to park at their beaches lots, though season passes are available which make this rate substantially lower for frequent visitors. Some cities have public parking lots near or at beaches that charge fees (e.g., Los Angeles County, Santa Monica, Huntington Beach) and many cities (e.g., Santa Barbara) also have metered parking on many streets nearby. However, even where some paid parking exists (e.g., Santa Barbara) a great deal of free street parking is often available. Many beach towns charge no parking fees or have on-street parking that is free.
Except for parts of Santa Barbara and Port Hueneme, none of the cities in the study area charge for parking anywhere near the beach, though most State parks do charge for parking. As table 5 indicates, there are a substantial number of spaces near many beaches in the study area that could potentially charge for parking by using meters, entrance gates, electronic ticket machines which must be placed on the car’s dashboards, or other means.
14 Data obtained from www.CaliforniaCityFinance.com.
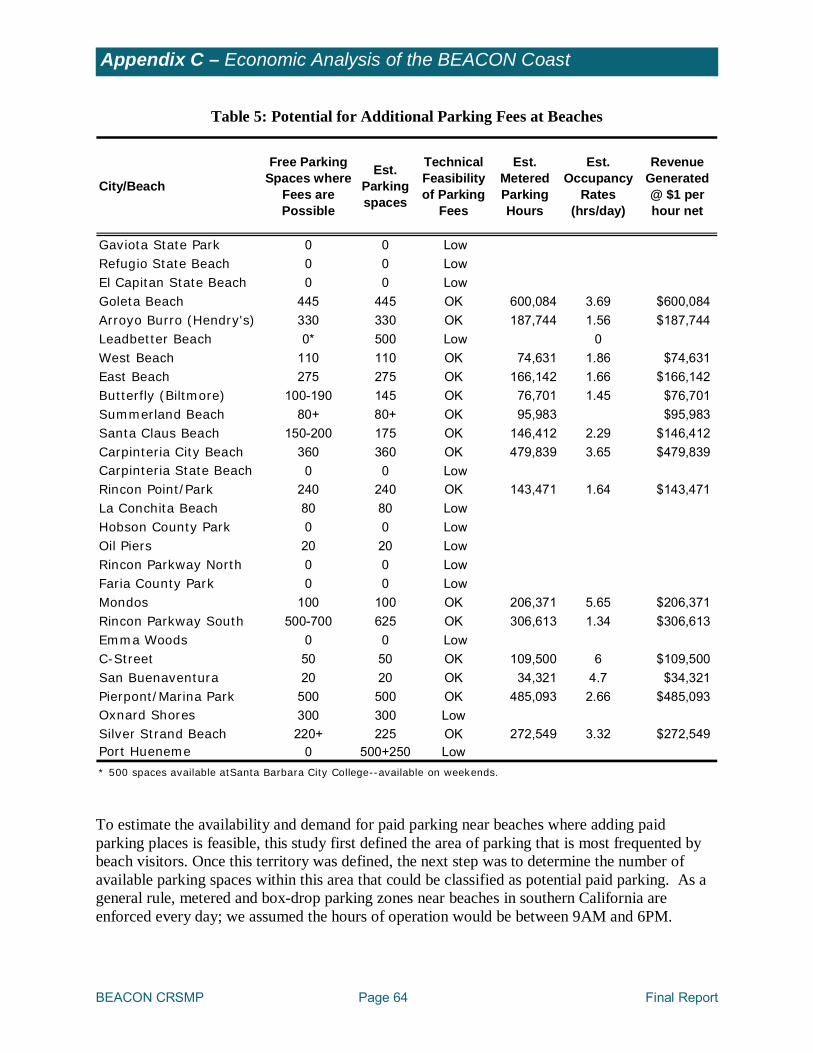
BEACON CRSMP Page 64 Final Report
Appendix C – Economic Analysis of the BEACON Coast
Table 5: Potential for Additional Parking Fees at Beaches
City/Beach
Free Parking Spaces where
Fees are Possible
Est. Parking spaces
Technical Feasibility of Parking
Fees
Est. Metered Parking Hours
Est. Occupancy
Rates (hrs/day)
Revenue Generated @ $1 per hour net
Gaviota State Park 0 0 LowRefugio State Beach 0 0 LowEl Capitan State Beach 0 0 LowGoleta Beach 445 445 OK 600,084 3.69 $600,084Arroyo Burro (Hendry's) 330 330 OK 187,744 1.56 $187,744Leadbetter Beach 0* 500 Low 0West Beach 110 110 OK 74,631 1.86 $74,631East Beach 275 275 OK 166,142 1.66 $166,142Butterfly (Biltmore) 100-190 145 OK 76,701 1.45 $76,701Summerland Beach 80+ 80+ OK 95,983 $95,983Santa Claus Beach 150-200 175 OK 146,412 2.29 $146,412Carpinteria City Beach 360 360 OK 479,839 3.65 $479,839Carpinteria State Beach 0 0 LowRincon Point/Park 240 240 OK 143,471 1.64 $143,471La Conchita Beach 80 80 LowHobson County Park 0 0 LowOil Piers 20 20 LowRincon Parkway North 0 0 LowFaria County Park 0 0 LowMondos 100 100 OK 206,371 5.65 $206,371Rincon Parkway South 500-700 625 OK 306,613 1.34 $306,613Emma Woods 0 0 LowC-Street 50 50 OK 109,500 6 $109,500San Buenaventura 20 20 OK 34,321 4.7 $34,321Pierpont/Marina Park 500 500 OK 485,093 2.66 $485,093Oxnard Shores 300 300 LowSilver Strand Beach 220+ 225 OK 272,549 3.32 $272,549Port Hueneme 0 500+250 Low* 500 spaces available atSanta Barbara City College--available on weekends. To estimate the availability and demand for paid parking near beaches where adding paid parking places is feasible, this study first defined the area of parking that is most frequented by beach visitors. Once this territory was defined, the next step was to determine the number of available parking spaces within this area that could be classified as potential paid parking. As a general rule, metered and box-drop parking zones near beaches in southern California are enforced every day; we assumed the hours of operation would be between 9AM and 6PM.
BEACON CRSMP Page 65 Final Report
Appendix C – Economic Analysis of the BEACON Coast
Longer hours might yield somewhat higher revenues, particularly at popular surf sites which are busy early in the morning.
After identifying the number of feasible parking spots and hours in which fees could be charged, the study used its beach visitor attendance and survey data. The survey data provided a reasonable estimate of the percentage of people who drove and parked near the beach. At sites where paid parking already exists, we used an estimate of the percentage of people who parked in free, non-metered parking.15 Using these estimates, we derived the estimated demands for parking (in hours).
While parking fees vary, we chose $1/hr for parking rates. As a practical matter, one should also include the costs of administering the fees and paying for parking meters, attendants, etc. Administrative costs of this sort are typically 18-20% of total revenues. Some people will choose not to come, will come less often, or will use alternative transportation if parking fees are charged.16 We believe this substitution will reduce the demand by another 20%. However, parking fines (for people who do not pay) typically amount to at least 50% of parking meter revenue, even after accounting for expenses and we have not accounted for fine revenue, so we believe these estimates are reasonably conservative as a general indicator of the amount of revenue that could be raised per site. Finally, some cities may wish to exempt local visitors from paying fees. This would lower revenues depending upon the percentage of local visitors and how one defines “local.” At many city beaches the majority of visitors (typically 80% or more) come from out of town.
Charging for parking can raise a substantial amount of revenues for a city or county. One chief advantage of parking fees is that they can be created so as to target day trippers from out of town who generally act as “free-riders” for beach towns. Local citizens pay local taxes. Overnight guests generate taxes in the form of TOT’s (see above discussion) and sales taxes. However day trippers spend little in town, but cost cities money for lifeguards, public safety, beach cleanup and crowding, and other issues. In terms of economic efficiency, a parking fee levied on day-trippers from out of town makes a great deal of sense. Consequently, cities should seriously consider increasing parking fees at municipal beaches, including street parking. To minimize the impact on local citizens or even TOT paying condo-renters and hotel guests, these people can be exempted or given lower fees or free parking for two hours. This arrangement not only seems fairer given the free-rider problem discussed above, but it would also make increasing parking fees more politically feasible.
Political Feasibility of Parking Fees The California Coastal Commission generally opposes parking fees since they believe it limits access to the coast. If a city of county decides to raise parking fess near the coast it will likely face some opposition from the Coastal Commission. If these fees will be used to further beach restoration and enhance the coast, it is more likely that the Coastal Commission would approve.
15 Survey data was taken from an ongoing study of attendance at beaches in Santa Barbara and Ventura counties. The study is being conducted for the State Department of Boating and Waterways. 16 See The High Cost of Free Parking, by Donald Shoup, The Planners Press of the American Planning Association, March, 2005.
BEACON CRSMP Page 66 Final Report
Appendix C – Economic Analysis of the BEACON Coast
Further, it is clear that their main objection concerns the potential for beach parking to make it difficult for low income people to get to the beach. (Ironically, Los Angeles County charges for parking at many beaches which have very low average incomes relative to most other beaches in the state.) One possible solution would be for a city or county to grant free passes to low income families or to ensure that public transportation is available to and from the beach, at least during high season.
If local citizens are exempt and if it is clearly explained that parking fees will be used to enhance the beach, parking fess may be politically feasible. It would also be possible to exempt people staying overnight at hotels, though this would lower revenues substantially.
Sales Taxes Cities and counties have the authority to raise a portion of the sales tax and use the proceeds for “quality of life” issues. Even a small increase would raise necessary funds for nourishment, though this solution may not be politically feasible.
One proposal, considered for San Diego County by SANDAG several years ago, was a 0.25% “quality of life” increase in the sales tax rate. State law allows such funds to be used for a variety of projects to improve the quality of life in a region. For example, sports stadiums may be financed by such a measure.17
As Table 6 below indicates, even a 0.25% sales tax increase can raise a substantial amount of money, particularly if it is levied on the county. For Santa Barbara County, the total amount of money generated would be just under $9 million per year; for Ventura County the amount would be just under $15 million per year. Table 6 also indicates the estimated sales tax which could be raised at the City level.
17 Recently Sacramento proposed such an increase to finance a new stadium for its NBA team the Kings. The measure failed.
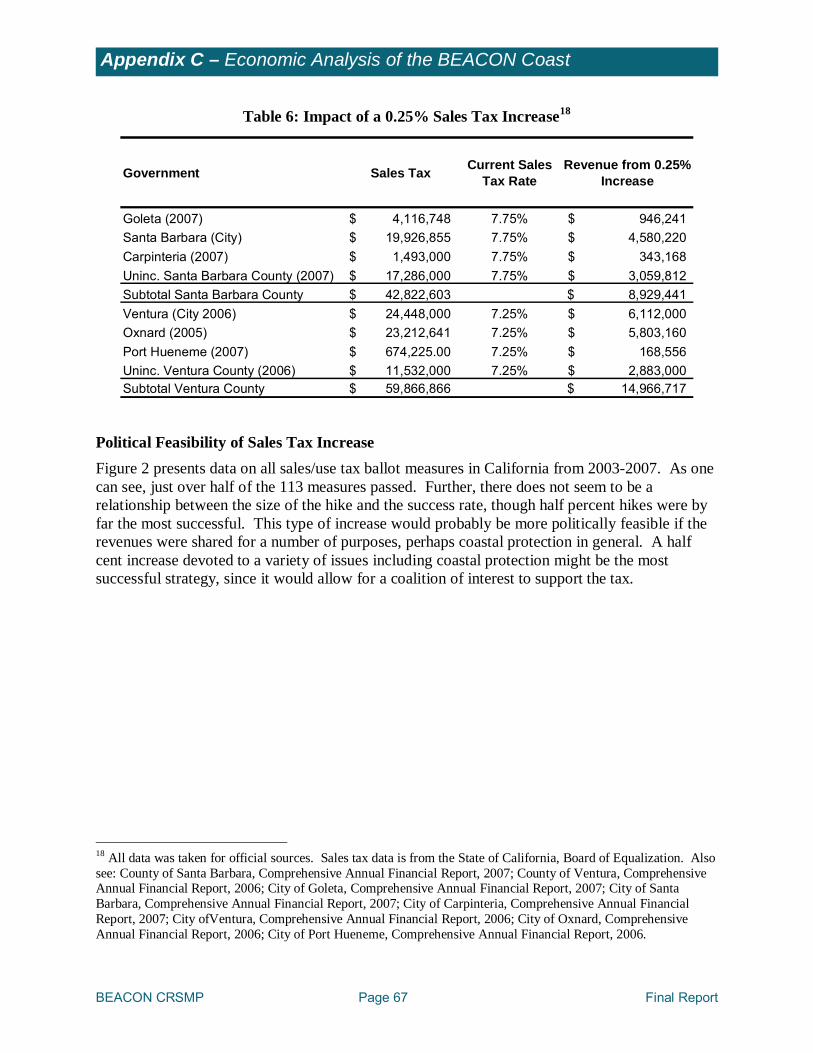
BEACON CRSMP Page 67 Final Report
Appendix C – Economic Analysis of the BEACON Coast
Table 6: Impact of a 0.25% Sales Tax Increase18
Government Sales Tax Current Sales Tax Rate
Revenue from 0.25% Increase
Goleta (2007) 4,116,748$ 7.75% 946,241$ Santa Barbara (City) 19,926,855$ 7.75% 4,580,220$ Carpinteria (2007) 1,493,000$ 7.75% 343,168$ Uninc. Santa Barbara County (2007) 17,286,000$ 7.75% 3,059,812$ Subtotal Santa Barbara County 42,822,603$ 8,929,441$ Ventura (City 2006) 24,448,000$ 7.25% 6,112,000$ Oxnard (2005) 23,212,641$ 7.25% 5,803,160$ Port Hueneme (2007) 674,225.00$ 7.25% 168,556$ Uninc. Ventura County (2006) 11,532,000$ 7.25% 2,883,000$ Subtotal Ventura County 59,866,866$ 14,966,717$
Political Feasibility of Sales Tax Increase Figure 2 presents data on all sales/use tax ballot measures in California from 2003-2007. As one can see, just over half of the 113 measures passed. Further, there does not seem to be a relationship between the size of the hike and the success rate, though half percent hikes were by far the most successful. This type of increase would probably be more politically feasible if the revenues were shared for a number of purposes, perhaps coastal protection in general. A half cent increase devoted to a variety of issues including coastal protection might be the most successful strategy, since it would allow for a coalition of interest to support the tax.
18 All data was taken for official sources. Sales tax data is from the State of California, Board of Equalization. Also see: County of Santa Barbara, Comprehensive Annual Financial Report, 2007; County of Ventura, Comprehensive Annual Financial Report, 2006; City of Goleta, Comprehensive Annual Financial Report, 2007; City of Santa Barbara, Comprehensive Annual Financial Report, 2007; City of Carpinteria, Comprehensive Annual Financial Report, 2007; City ofVentura, Comprehensive Annual Financial Report, 2006; City of Oxnard, Comprehensive Annual Financial Report, 2006; City of Port Hueneme, Comprehensive Annual Financial Report, 2006.
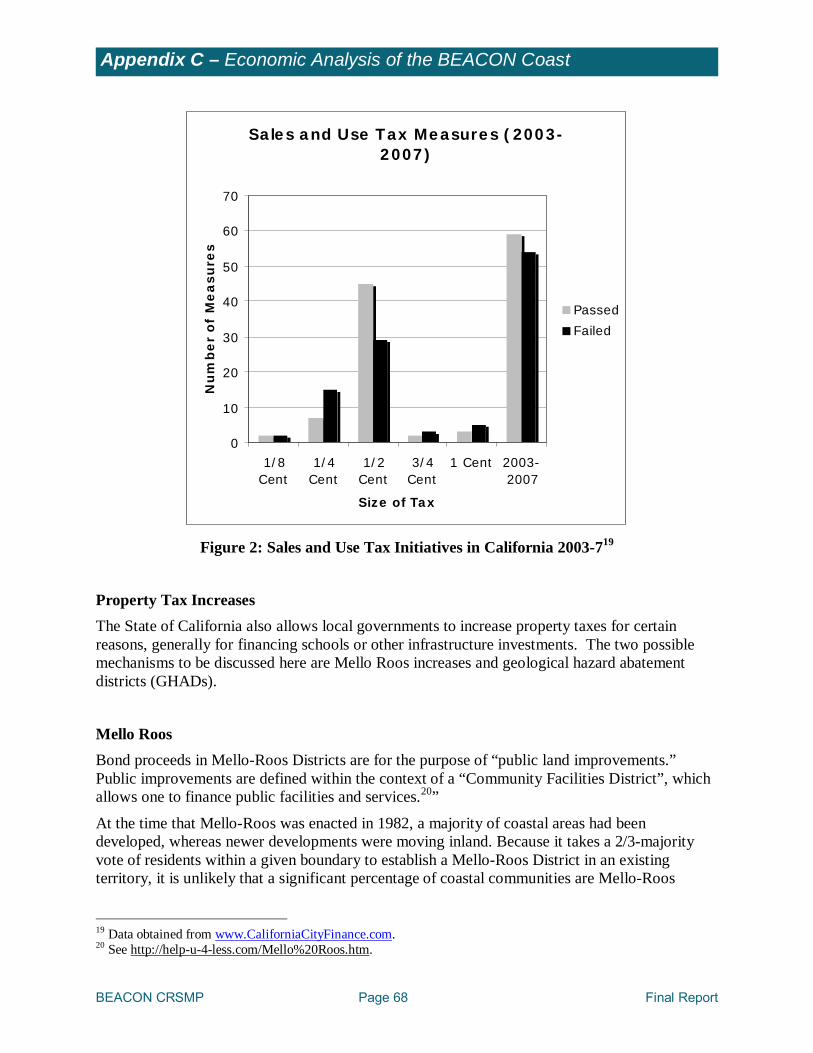
BEACON CRSMP Page 68 Final Report
Appendix C – Economic Analysis of the BEACON Coast
Sales and Use Tax Measures (2003-2007)
0
10
20
30
40
50
60
70
1/8Cent
1/4Cent
1/2Cent
3/4Cent
1 Cent 2003-2007
Size of Tax
Nu
mb
er
of
Me
asu
res
Passed
Failed
Figure 2: Sales and Use Tax Initiatives in California 2003-719
Property Tax Increases The State of California also allows local governments to increase property taxes for certain reasons, generally for financing schools or other infrastructure investments. The two possible mechanisms to be discussed here are Mello Roos increases and geological hazard abatement districts (GHADs).
Mello Roos Bond proceeds in Mello-Roos Districts are for the purpose of “public land improvements.” Public improvements are defined within the context of a “Community Facilities District”, which allows one to finance public facilities and services.20”
At the time that Mello-Roos was enacted in 1982, a majority of coastal areas had been developed, whereas newer developments were moving inland. Because it takes a 2/3-majority vote of residents within a given boundary to establish a Mello-Roos District in an existing territory, it is unlikely that a significant percentage of coastal communities are Mello-Roos
19 Data obtained from www.CaliforniaCityFinance.com. 20 See http://help-u-4-less.com/Mello%20Roos.htm.
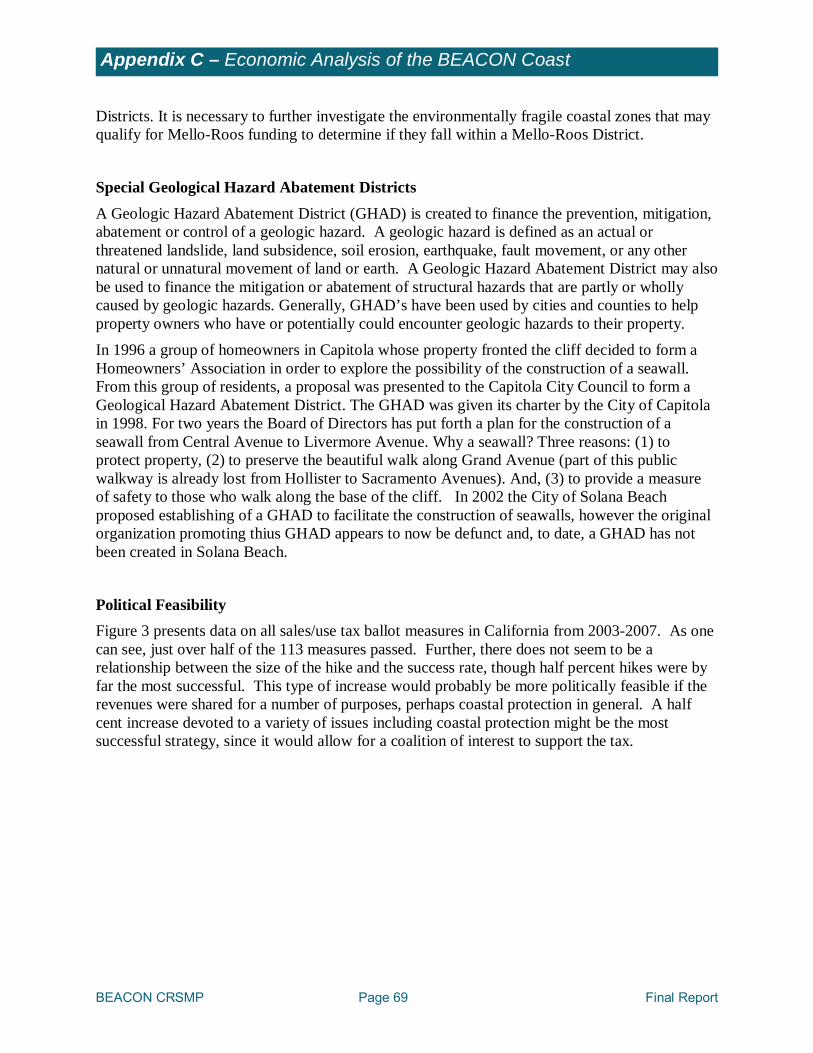
BEACON CRSMP Page 69 Final Report
Appendix C – Economic Analysis of the BEACON Coast
Districts. It is necessary to further investigate the environmentally fragile coastal zones that may qualify for Mello-Roos funding to determine if they fall within a Mello-Roos District.
Special Geological Hazard Abatement Districts A Geologic Hazard Abatement District (GHAD) is created to finance the prevention, mitigation, abatement or control of a geologic hazard. A geologic hazard is defined as an actual or threatened landslide, land subsidence, soil erosion, earthquake, fault movement, or any other natural or unnatural movement of land or earth. A Geologic Hazard Abatement District may also be used to finance the mitigation or abatement of structural hazards that are partly or wholly caused by geologic hazards. Generally, GHAD’s have been used by cities and counties to help property owners who have or potentially could encounter geologic hazards to their property. In 1996 a group of homeowners in Capitola whose property fronted the cliff decided to form a Homeowners’ Association in order to explore the possibility of the construction of a seawall. From this group of residents, a proposal was presented to the Capitola City Council to form a Geological Hazard Abatement District. The GHAD was given its charter by the City of Capitola in 1998. For two years the Board of Directors has put forth a plan for the construction of a seawall from Central Avenue to Livermore Avenue. Why a seawall? Three reasons: (1) to protect property, (2) to preserve the beautiful walk along Grand Avenue (part of this public walkway is already lost from Hollister to Sacramento Avenues). And, (3) to provide a measure of safety to those who walk along the base of the cliff. In 2002 the City of Solana Beach proposed establishing of a GHAD to facilitate the construction of seawalls, however the original organization promoting thius GHAD appears to now be defunct and, to date, a GHAD has not been created in Solana Beach.
Political Feasibility Figure 3 presents data on all sales/use tax ballot measures in California from 2003-2007. As one can see, just over half of the 113 measures passed. Further, there does not seem to be a relationship between the size of the hike and the success rate, though half percent hikes were by far the most successful. This type of increase would probably be more politically feasible if the revenues were shared for a number of purposes, perhaps coastal protection in general. A half cent increase devoted to a variety of issues including coastal protection might be the most successful strategy, since it would allow for a coalition of interest to support the tax.
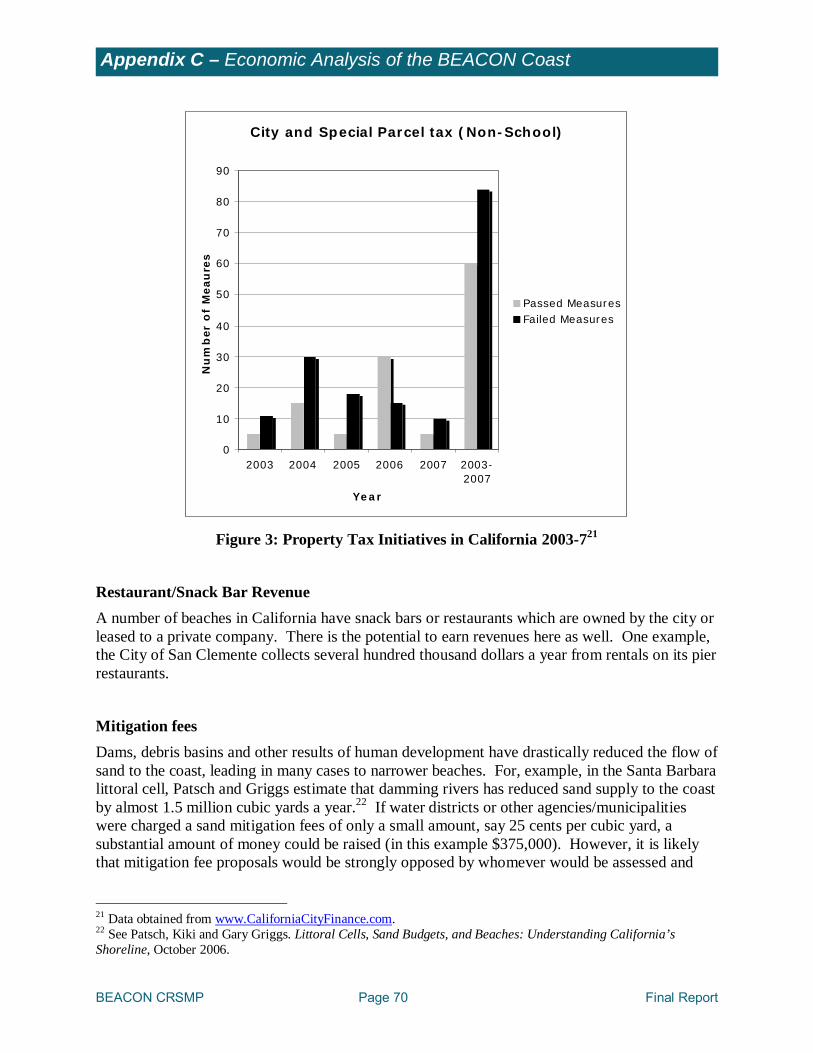
BEACON CRSMP Page 70 Final Report
Appendix C – Economic Analysis of the BEACON Coast
City and Special Parcel tax (Non-School)
0
10
20
30
40
50
60
70
80
90
2003 2004 2005 2006 2007 2003-2007
Year
Nu
mb
er
of
Meau
res
Passed MeasuresFailed Measures
Figure 3: Property Tax Initiatives in California 2003-721
Restaurant/Snack Bar Revenue A number of beaches in California have snack bars or restaurants which are owned by the city or leased to a private company. There is the potential to earn revenues here as well. One example, the City of San Clemente collects several hundred thousand dollars a year from rentals on its pier restaurants.
Mitigation fees Dams, debris basins and other results of human development have drastically reduced the flow of sand to the coast, leading in many cases to narrower beaches. For, example, in the Santa Barbara littoral cell, Patsch and Griggs estimate that damming rivers has reduced sand supply to the coast by almost 1.5 million cubic yards a year.22 If water districts or other agencies/municipalities were charged a sand mitigation fees of only a small amount, say 25 cents per cubic yard, a substantial amount of money could be raised (in this example $375,000). However, it is likely that mitigation fee proposals would be strongly opposed by whomever would be assessed and
21 Data obtained from www.CaliforniaCityFinance.com. 22 See Patsch, Kiki and Gary Griggs. Littoral Cells, Sand Budgets, and Beaches: Understanding California’s Shoreline, October 2006.
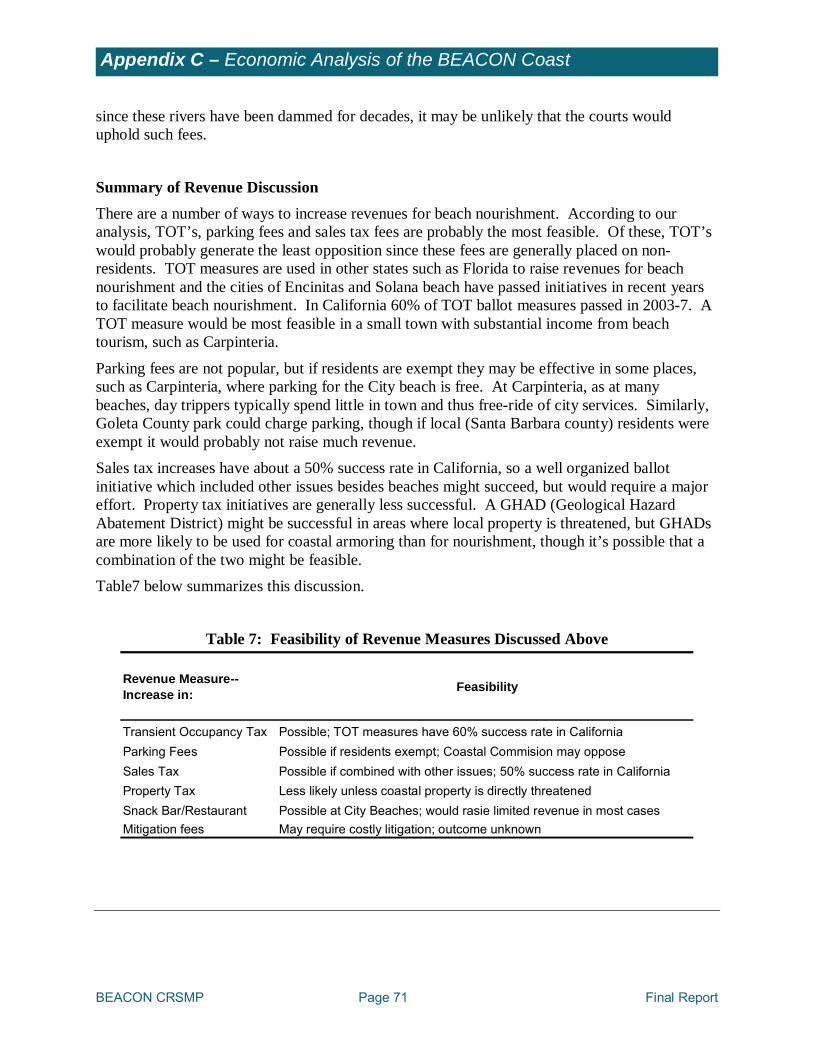
BEACON CRSMP Page 71 Final Report
Appendix C – Economic Analysis of the BEACON Coast
since these rivers have been dammed for decades, it may be unlikely that the courts would uphold such fees.
Summary of Revenue Discussion There are a number of ways to increase revenues for beach nourishment. According to our analysis, TOT’s, parking fees and sales tax fees are probably the most feasible. Of these, TOT’s would probably generate the least opposition since these fees are generally placed on non-residents. TOT measures are used in other states such as Florida to raise revenues for beach nourishment and the cities of Encinitas and Solana beach have passed initiatives in recent years to facilitate beach nourishment. In California 60% of TOT ballot measures passed in 2003-7. A TOT measure would be most feasible in a small town with substantial income from beach tourism, such as Carpinteria.
Parking fees are not popular, but if residents are exempt they may be effective in some places, such as Carpinteria, where parking for the City beach is free. At Carpinteria, as at many beaches, day trippers typically spend little in town and thus free-ride of city services. Similarly, Goleta County park could charge parking, though if local (Santa Barbara county) residents were exempt it would probably not raise much revenue. Sales tax increases have about a 50% success rate in California, so a well organized ballot initiative which included other issues besides beaches might succeed, but would require a major effort. Property tax initiatives are generally less successful. A GHAD (Geological Hazard Abatement District) might be successful in areas where local property is threatened, but GHADs are more likely to be used for coastal armoring than for nourishment, though it’s possible that a combination of the two might be feasible. Table7 below summarizes this discussion.
Table 7: Feasibility of Revenue Measures Discussed Above
Revenue Measure-- Increase in: Feasibility
Transient Occupancy Tax Possible; TOT measures have 60% success rate in CaliforniaParking Fees Possible if residents exempt; Coastal Commision may opposeSales Tax Possible if combined with other issues; 50% success rate in CaliforniaProperty Tax Less likely unless coastal property is directly threatenedSnack Bar/Restaurant Possible at City Beaches; would rasie limited revenue in most casesMitigation fees May require costly litigation; outcome unknown
BEACON CRSMP Page 72 Final Report
Appendix C – Economic Analysis of the BEACON Coast
REFERENCES
CaliforniaCityFinance.com, www.CaliforniaCityFinance.com.
City of Carpinteria, Comprehensive Annual Financial Report, 2007.
City of Goleta, Comprehensive Annual Financial Report, 2007.
City of Oxnard, Comprehensive Annual Financial Report, 2006.
City of Port Hueneme, Comprehensive Annual Financial Report, 2006.
City of Santa Barbara, Comprehensive Annual Financial Report, 2007.
City of Ventura, Comprehensive Annual Financial Report, 2006.
County of Santa Barbara, Comprehensive Annual Financial Report, 2007.
County of Ventura, Comprehensive Annual Financial Report, 2006.
King, Philip, The Economic of Regional Sediment Management in Ventura and Santa Barbara Counties, prepared for the California State Resources Agency, fall 2006, prepared for the Coastal Sediment Management Work group (CSMW): http://dbw.ca.gov/CSMW/PDF/Economics_of_RSM_0706.pdf.
King, Philip, Estimating Beach Attendance and Calibrating the Beach Counters for the City of Encinitas, February 15, 2006.
King, Philip, The Economic and Fiscal Impact of Carlsbad’s Beaches: A Survey and Estimate of Attendance, December 12, 2005,
King, Philip and Douglas Symes, The Potential Loss in GNP and GSP From a Failure to Maintain California's Beaches, prepared for the California Resources Agency, 2002, http://userwww.sfsu.edu/~pgking/pubpol.htm.
King, Philip, Overcrowding and the Demand for Public Beaches in California,” Prepared for the Department of Boating and Waterways, April 2001.
Patsch, Kiki and Gary Griggs. Littoral Cells, Sand Budgets, and Beaches: Understanding California’s Shoreline, October 2006.
Shoup, Donald, The High Cost of Free Parking, Planners Press of the American Planning Association, March, 2005
Southern California Beach valuation Project: http://marineeconomics.noaa.gov/SCBeach/.
State of California, Board of Equalization, http://www.boe.ca.gov/sutax/sutprograms.htm.
BEACON CRSMP Page 73 Final Report
Appendix C – Economic Analysis of the BEACON Coast
U.S. Army Corps of Engineers, Coastal Sediment Analysis Tool (CSBAT) Beta Version--Sediment Management Decision Support Tool for Santa Barbara and Ventura Counties, Draft Technical Report for U.S. Army Corps of Engineers, Los Angeles District, June 2006.
U.S. Army Corps of Engineers, The ARC GIS Coastal Sediment Analysis Tool: A GIS Support Tool for Regional Sediment Management Program: White Paper, Draft Technical Report for U.S. Army Corps of Engineers, Los Angeles District, April 2006.
BEACON CRSMP Page 74 Final Report
Appendix D – Environmental Review of Candidate CRSMP Projects
Environmental Review of
Candidate CRSMP Projects
Prepared by Padre Associates, Inc.
Prepared for BEACON Coastal Regional Sediment Management Plan
Coastal Regional Sediment Management Plan Central Coast from Pt. Conception to Pt. Mugu Appendix D - Environmental Constraints
D-1
APPENDIX D – ENVIRONMENTAL REVIEW OF CANDIDATE CRSMP PROJECTS D.1 Introduction
The purpose and objective of the following discussions are to provide BEACON with a summary of environmental constraints and/or issues that could or would affect the construction and/or operation of three proposed projects. These proposed projects are:
1) A Regional Sediment Storage and Processing Center;
2) A Mid-Range North Rincon Parkway Sand Retention Pilot Project; and
3) A Long-Range South Rincon Parkway Beach Enhancement Project.
The location and preliminary design of the three projects are provided in figures and photographs in each subsection. With the selection of the three associated, but separate, projects, the scope of the CEQA-related task was to focus on the environmental issues and constraints that are likely to be considered by regulatory and resource agencies in assessing impacts of the three proposed projects.
The descriptions of the potential constraints are, at this preliminary stage of project design, necessarily general and when additional details on the construction methods, equipment type(s), and proposed operational aspects for each of the projects become available, the environmental issues and constraints will need to be refined. Despite the relatively generic description of the proposed actions that are currently available, issues related to land use policies, environmental sensitivities (i.e. special status species and habitat areas, and air emissions and waste discharges), and other regulatory constraints can be identified.
Through a proactive approach of using this preliminary information during the more detailed design of the project components and mitigating potentially significant environmental effects by instituting design features, BEACON should be able to expedite the CEQA/NEPA review and permitting process.
D.1.1 General Environmental Requirements/Constraints
Prior to initiating proposed project actions, compliance with the California Environmental Quality Act (CEQA), and possibly the National Environmental Policy Act (NEPA), will be required. The CEQA Guidelines specify that the impacts that are attributable to a project are to be identified and potentially significant impacts are to be mitigated to the greatest degree feasible. The CEQA Initial Study/Checklist (IS), which is prepared by the Lead Agency, identifies the resources that could be subjected to potentially significant impacts and specifies the type of analysis (i.e. exemption, Negative Declaration, or Environmental Impact Report) that will be required for the proposed project. Table 1 below lists the issues that are included in a typical CEQA IS.
Coastal Regional Sediment Management Plan Central Coast from Pt. Conception to Pt. Mugu Appendix D - Environmental Constraints
D-2
Table 1: Technical Issues and Resources for a CEQA Initial Study/Checklist
Aesthetics/Light & Glare Agriculture Resources Air Quality
Biological Resources Cultural Resources Geology /Soils
Hazards & Hazardous Materials
Hydrology / Water Quality Land Use / Planning
Mineral Resources Noise Population / Housing
Public Services Recreation Transportation/Traffic
Utilities / Service Systems
While all issues must be addressed in the IS, those resources that are not anticipated to be subjected to project-related impacts do not require a more detailed analysis in subsequent CEQA documentation. Permitting of a project can be initiated during the environmental analysis but must necessarily await completion of that analysis and for certification of the environmental document. Permits and authorizations for projects within California cannot be issued until the lead CEQA agency has certified the environmental document and approved a project.
NEPA likewise must be satisfied if the project 1) is funded by a federal agency, 2) requires a federal permit (i.e. Corps of Engineers), or 3) potentially affects a resource that is regulated by a federal statute (i.e. Endangered Species Act). NEPA compliance can be completed during the permitting process unless the lead federal agency mandates that a NEPA document be prepared or that a “joint” NEPA/CEQA analysis may be completed in a single document.
The following discussions focus on the environmental issues, irrespective of whether they are associated with federal or state regulations, which are most likely to require detailed analysis for each of the proposed projects. In addition environmental constraints (issues or resources that are expected to require mitigation or other consideration in design of the projects) are also identified.
The environmental analysis of any project is based on the description of the proposed action. The following discussions are based on the project descriptions that are currently available and from information obtained from published literature sources. No project-specific field surveys or agency contacts have been completed for this analysis. For issues that lack sufficient literature-based information to allow a complete and accurate assessment, field surveys could be required by the regulatory and/or resource agencies during the CEQA/NEPA environmental analysis.
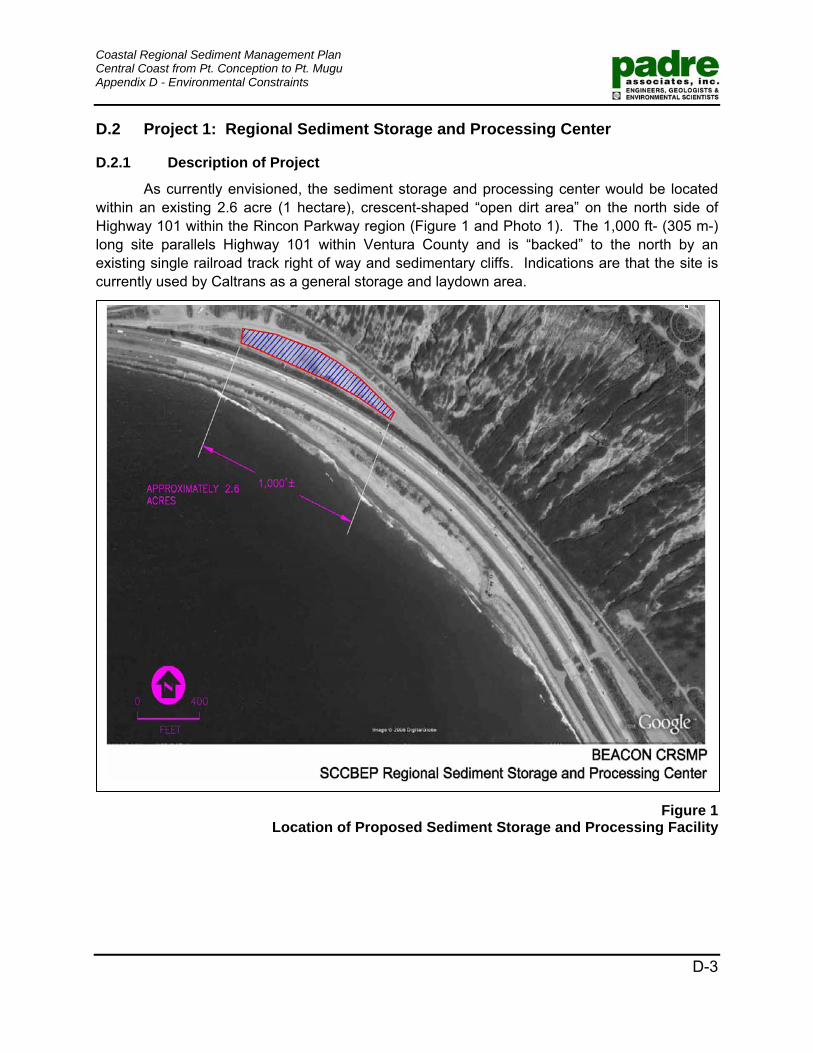
Coastal Regional Sediment Management Plan Central Coast from Pt. Conception to Pt. Mugu Appendix D - Environmental Constraints
D-3
D.2 Project 1: Regional Sediment Storage and Processing Center
D.2.1 Description of Project
As currently envisioned, the sediment storage and processing center would be located within an existing 2.6 acre (1 hectare), crescent-shaped “open dirt area” on the north side of Highway 101 within the Rincon Parkway region (Figure 1 and Photo 1). The 1,000 ft- (305 m-) long site parallels Highway 101 within Ventura County and is “backed” to the north by an existing single railroad track right of way and sedimentary cliffs. Indications are that the site is currently used by Caltrans as a general storage and laydown area.
Figure 1
Location of Proposed Sediment Storage and Processing Facility
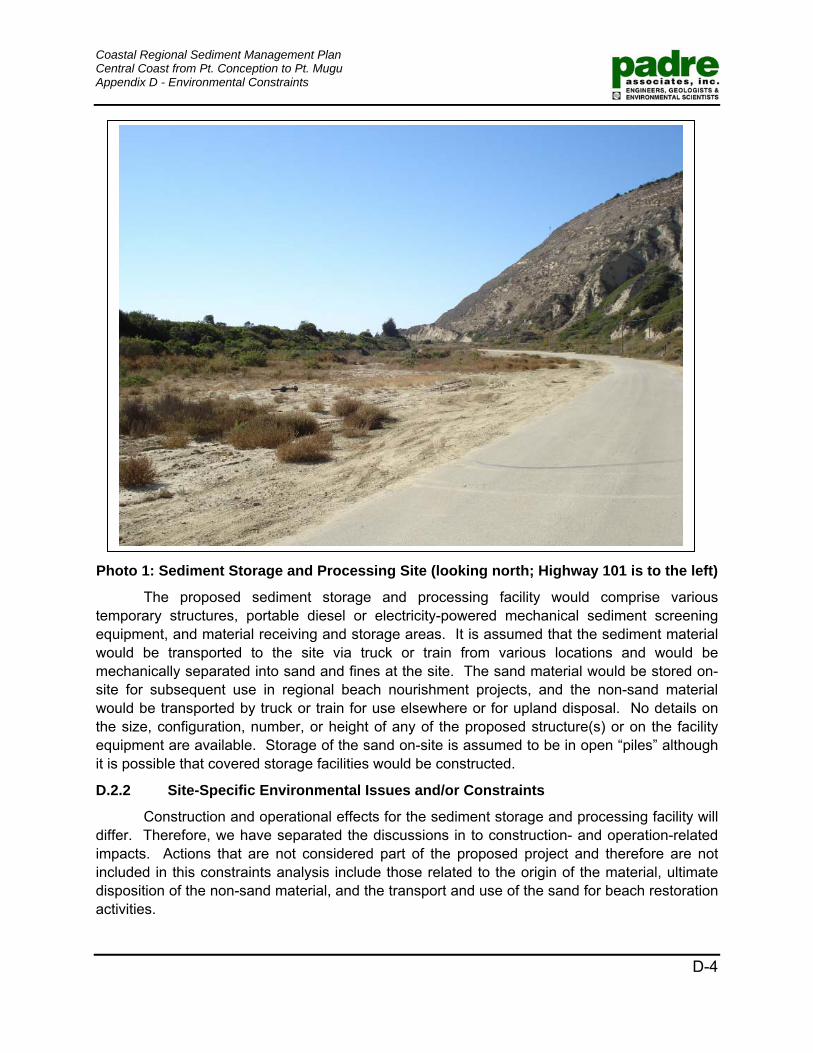
Coastal Regional Sediment Management Plan Central Coast from Pt. Conception to Pt. Mugu Appendix D - Environmental Constraints
D-4
Photo 1: Sediment Storage and Processing Site (looking north; Highway 101 is to the left)
The proposed sediment storage and processing facility would comprise various temporary structures, portable diesel or electricity-powered mechanical sediment screening equipment, and material receiving and storage areas. It is assumed that the sediment material would be transported to the site via truck or train from various locations and would be mechanically separated into sand and fines at the site. The sand material would be stored on-site for subsequent use in regional beach nourishment projects, and the non-sand material would be transported by truck or train for use elsewhere or for upland disposal. No details on the size, configuration, number, or height of any of the proposed structure(s) or on the facility equipment are available. Storage of the sand on-site is assumed to be in open “piles” although it is possible that covered storage facilities would be constructed.
D.2.2 Site-Specific Environmental Issues and/or Constraints
Construction and operational effects for the sediment storage and processing facility will differ. Therefore, we have separated the discussions in to construction- and operation-related impacts. Actions that are not considered part of the proposed project and therefore are not included in this constraints analysis include those related to the origin of the material, ultimate disposition of the non-sand material, and the transport and use of the sand for beach restoration activities.
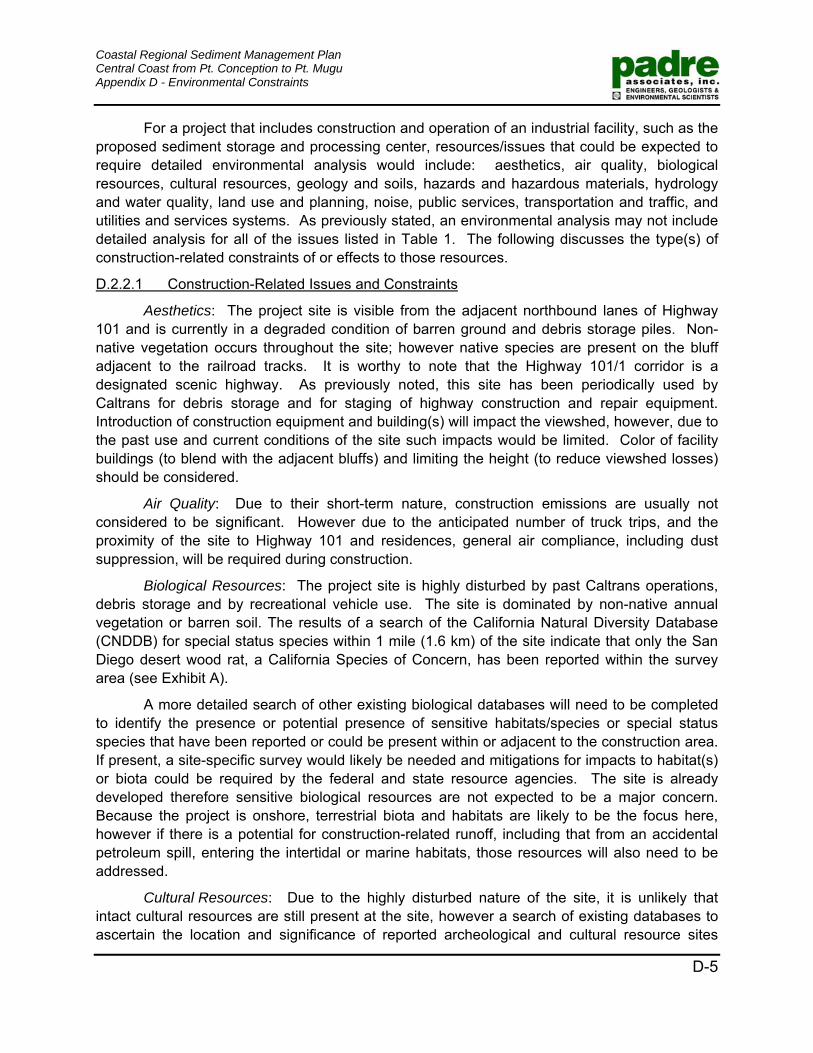
Coastal Regional Sediment Management Plan Central Coast from Pt. Conception to Pt. Mugu Appendix D - Environmental Constraints
D-5
For a project that includes construction and operation of an industrial facility, such as the proposed sediment storage and processing center, resources/issues that could be expected to require detailed environmental analysis would include: aesthetics, air quality, biological resources, cultural resources, geology and soils, hazards and hazardous materials, hydrology and water quality, land use and planning, noise, public services, transportation and traffic, and utilities and services systems. As previously stated, an environmental analysis may not include detailed analysis for all of the issues listed in Table 1. The following discusses the type(s) of construction-related constraints of or effects to those resources.
D.2.2.1 Construction-Related Issues and Constraints
Aesthetics: The project site is visible from the adjacent northbound lanes of Highway 101 and is currently in a degraded condition of barren ground and debris storage piles. Non-native vegetation occurs throughout the site; however native species are present on the bluff adjacent to the railroad tracks. It is worthy to note that the Highway 101/1 corridor is a designated scenic highway. As previously noted, this site has been periodically used by Caltrans for debris storage and for staging of highway construction and repair equipment. Introduction of construction equipment and building(s) will impact the viewshed, however, due to the past use and current conditions of the site such impacts would be limited. Color of facility buildings (to blend with the adjacent bluffs) and limiting the height (to reduce viewshed losses) should be considered.
Air Quality: Due to their short-term nature, construction emissions are usually not considered to be significant. However due to the anticipated number of truck trips, and the proximity of the site to Highway 101 and residences, general air compliance, including dust suppression, will be required during construction.
Biological Resources: The project site is highly disturbed by past Caltrans operations, debris storage and by recreational vehicle use. The site is dominated by non-native annual vegetation or barren soil. The results of a search of the California Natural Diversity Database (CNDDB) for special status species within 1 mile (1.6 km) of the site indicate that only the San Diego desert wood rat, a California Species of Concern, has been reported within the survey area (see Exhibit A).
A more detailed search of other existing biological databases will need to be completed to identify the presence or potential presence of sensitive habitats/species or special status species that have been reported or could be present within or adjacent to the construction area. If present, a site-specific survey would likely be needed and mitigations for impacts to habitat(s) or biota could be required by the federal and state resource agencies. The site is already developed therefore sensitive biological resources are not expected to be a major concern. Because the project is onshore, terrestrial biota and habitats are likely to be the focus here, however if there is a potential for construction-related runoff, including that from an accidental petroleum spill, entering the intertidal or marine habitats, those resources will also need to be addressed.
Cultural Resources: Due to the highly disturbed nature of the site, it is unlikely that intact cultural resources are still present at the site, however a search of existing databases to ascertain the location and significance of reported archeological and cultural resource sites
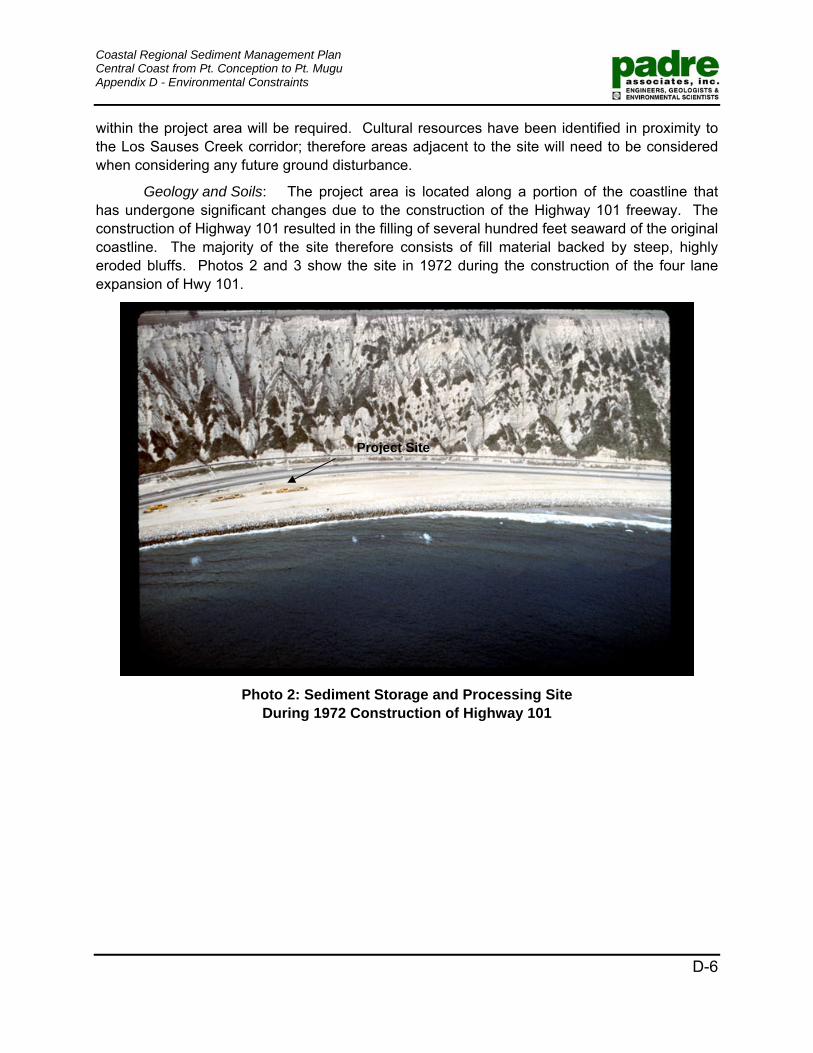
Coastal Regional Sediment Management Plan Central Coast from Pt. Conception to Pt. Mugu Appendix D - Environmental Constraints
D-6
within the project area will be required. Cultural resources have been identified in proximity to the Los Sauses Creek corridor; therefore areas adjacent to the site will need to be considered when considering any future ground disturbance.
Geology and Soils: The project area is located along a portion of the coastline that has undergone significant changes due to the construction of the Highway 101 freeway. The construction of Highway 101 resulted in the filling of several hundred feet seaward of the original coastline. The majority of the site therefore consists of fill material backed by steep, highly eroded bluffs. Photos 2 and 3 show the site in 1972 during the construction of the four lane expansion of Hwy 101.
Photo 2: Sediment Storage and Processing Site
During 1972 Construction of Highway 101
Project Site
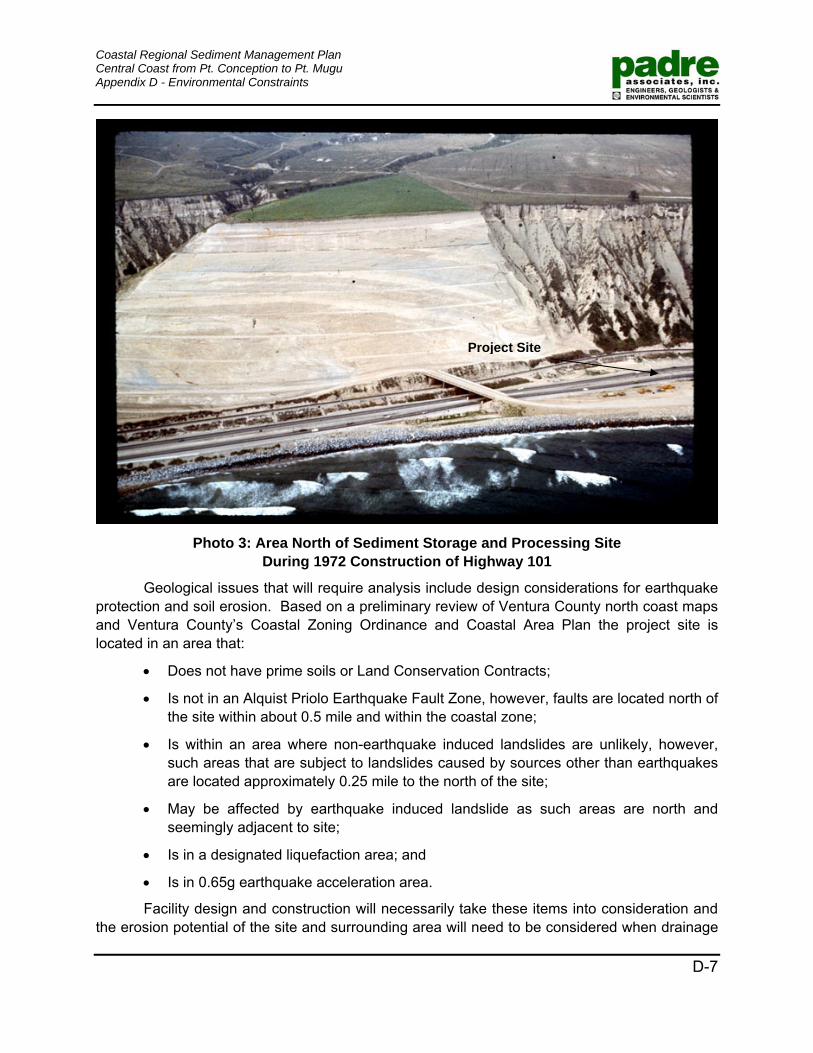
Coastal Regional Sediment Management Plan Central Coast from Pt. Conception to Pt. Mugu Appendix D - Environmental Constraints
D-7
Photo 3: Area North of Sediment Storage and Processing Site
During 1972 Construction of Highway 101
Geological issues that will require analysis include design considerations for earthquake protection and soil erosion. Based on a preliminary review of Ventura County north coast maps and Ventura County’s Coastal Zoning Ordinance and Coastal Area Plan the project site is located in an area that:
• Does not have prime soils or Land Conservation Contracts;
• Is not in an Alquist Priolo Earthquake Fault Zone, however, faults are located north of the site within about 0.5 mile and within the coastal zone;
• Is within an area where non-earthquake induced landslides are unlikely, however, such areas that are subject to landslides caused by sources other than earthquakes are located approximately 0.25 mile to the north of the site;
• May be affected by earthquake induced landslide as such areas are north and seemingly adjacent to site;
• Is in a designated liquefaction area; and
• Is in 0.65g earthquake acceleration area.
Facility design and construction will necessarily take these items into consideration and the erosion potential of the site and surrounding area will need to be considered when drainage
Project Site
Coastal Regional Sediment Management Plan Central Coast from Pt. Conception to Pt. Mugu Appendix D - Environmental Constraints
D-8
is assessed. The proximity of sedimentary bluffs that could subject the site to landslide damage needs to be considered in designing the facilities, including the potential effects of operation-generated vibrations from truck traffic and sediment separation activities.
Hazards and Hazardous Materials: Due to past onsite construction operations and associated debris storage, the potential for onsite soil contamination exists at this site. It is therefore recommended that a site assessment be completed at this site prior to commencement of a project related activities. During construction, the health and safety of the workers is considered in the impact assessment. Therefore a construction-specific health and safety plan is usually required as mitigation, particularly where heavy construction equipment is being used or hazardous operations are being completed. Although the sediment itself would not generally be considered hazardous, containment and cleanup equipment, and methods to be used to contain and recover accidental spills of on-site petroleum products such as fuel or lubricants for the construction equipment will likely be required.
Hydrology and Water Quality: The project site is relatively flat and surface drainage is directed to the south by the Highway 101 embankment on the west, and the railroad right of way and bluff face to the east. Some surface runoff could enter the adjacent ocean through the pedestrian tunnel under Highway 101 near the midpoint in the site or to the south via Los Sauses Creek; however sufficient area exists at the site to provide onsite containment of typical surface flows. Runoff-related issues during construction are the most likely environmental concerns for this resource. Increased sedimentation in the local drainages as well the aforementioned contamination of intertidal or water courses from construction-related discharges will need to identified and mitigated. A project-specific construction Storm Water Prevention Plan (SWPP) will likely be required as part of the permit-to-construct authorizations.
Land Use and Planning: A review of available County of Ventura General and Coastal Plans indicates that the project site land use designation is Open Space. That designation not only specifies the type of permit required, but also limits what development is allowed. Consultation with Ventura County staff will be required to determine if the proposed use is allowed. In general, we have found that non-county initiated public works projects are allowed in areas zoned coastal open space (C-O-S) with a Conditional Use Permit. Shoreline repair and maintenance projects are allowed with a Planned Development Permit, however as currently designated, coastal industrial projects would not be allowed within this zoning designation.
Based upon our review of the description of shoreline maintenance activities and public works facilities, it is unlikely that the proposed project would be fall into either of these categories. Therefore, the project would likely be considered industrial. The Coastal Area Plan states "…all industrial facilities which require a Coastal Industrial (C-M) zone are restricted to locations designated ‘Industrial’ by this plan.” However, assuming the project would involve only temporary and/or portable equipment and that only temporary stockpiling of materials would occur on site it is expected this issue could be resolved. The definitive answer would need to come from the Ventura County Planning Department.
Noise: Existing noise conditions at the site are dominated by that generated by Highway 101 vehicles and the trains using the adjacent railway. Due to the relative isolation of the
Coastal Regional Sediment Management Plan Central Coast from Pt. Conception to Pt. Mugu Appendix D - Environmental Constraints
D-9
project site from sensitive receptors, noise-related impacts are less likely than if construction was within an urbanized location. However, Ventura County’s General Plan requires that outdoor noise levels do not exceed CNEL 60 or an Leq (h) of 65 dB(A) during any hour and discretionary development which would be impacted by noise, or generate project�related noise which cannot be reduced to meet the standards prescribed in Policy 2.16.2.1., shall be prohibited. The nearest sensitive receptor is likely to be the Mussel Shoals community including Cliff House Restaurant which is located adjacent to Highway 101 approximately 0.3 mile (0.5 km) north of the project site. Noise-related limitations are likely to include scheduling of activities to coincide with noise ordinance requirements and construction noise monitoring. Sound attenuation may also be required if percussive equipment (i.e. pile drivers) are used during facility construction.
Public Services: A Ventura County Fire Station currently exists at the Highway 101 interchange to the south of the site and would likely provide first response capability to the site. The Ventura County Sheriff would provide police services to the area. These resources are not likely to be subjected to substantial impacts; however consideration of the potential for an increase in fire or police protection as a result of the construction will necessarily be addressed in the analysis.
Transportation and Traffic: The project site would be accessible from Highway 101 and from Highway 1 which dead ends at the site. Currently no through traffic can traverse the site, however pedestrian and bicycle traffic is common. Construction-related transportation and traffic issues are not likely to be of major concern, however because construction vehicles and equipment will utilize Highway 101, a major north-south arterial roadway, to access the site, traffic controls and possibly limitations on the hours that construction-related vehicles can utilize the freeway should be discussed with Caltrans. A traffic plan may be required if existing traffic flow is substantially affected or if ingress/egress to the site creates a traffic hazard.
Utilities and Service Systems: The site does not appear to be serviced by any existing utilities; however such services could be extended to the site from the residential areas located to the south. These issues are not expected to be of major concern during construction; however the availability of the utilities and service systems to support the operation of the facility (see below) will likely require more detailed analysis.
D.2.2.2 Operation-Related Issues and Constraints
Available information on the operation of the proposed facility suggests that it would consist of:
1) the delivery of sediment from various sources in southern California;
2) physical separation of the sand and non-sand fractions via a shaker-type system;
3) temporary storage of the sand material on-site for future use for beach enhancement projects within the area; and
4) transport of the non-sand material for either off-site use or disposal at an upland location.
Coastal Regional Sediment Management Plan Central Coast from Pt. Conception to Pt. Mugu Appendix D - Environmental Constraints
D-10
The following constraints assessment is based on these proposed actions, except the effects associated with the actual placement/disposal of the sand or non-sand material as the locations for those actions are not known. Operational effects on aesthetics, air quality, geology and soils, hazards and hazardous materials, hydrology and water quality, noise, public services, transportation and traffic, and utilities and service systems are likely to occur and are summarized below.
Aesthetics: Similar to the discussions for construction, this site has been periodically used by Caltrans for debris storage and for staging of highway construction and repair equipment. Introduction of operations equipment and structures(s) will impact the viewshed however due to the past use and current conditions of the site, such impacts would be limited. The design and color of the facility structures are likely to be scrutinized due to the proximity of the highway and the relatively “open” viewshed of the site and surrounding natural features. Dust generated by the operation may also be considered detrimental to the aesthetic value of the site. Lighting design and orientation (i.e. shielding and downward directing) will need to be addressed to reduce visual impacts to the surrounding area and along the highway.
Air Quality: Emissions from trucks or trains that deliver and/or remove material are not expected to be of major concern, however as with construction and due to the on-site storage of sand and other sediment, dust emissions will need to be addressed and reduced or eliminated. In addition, if stationary diesel or gasoline-driven equipment is on-site, a permit to operate will be required and specific emission standards will be included.
Geology and Soils: The loss of surficial sediments from the site and the increase in erosion or sediment deposition during storm events will need to be addressed in the design and site drainage. Also, the stability of the nearby cliffs and the potential slope failure to be triggered by operational vibrations could also be a concern. Consultation with the railroad owner/operator and the County on that topic is suggested during the design phase so that the environmental document can specify that operations will not increase the chances of slope failure.
Hazards and Hazardous Materials: The presence of on-site petroleum products is expected to result in the requirement of a spill prevention and recovery plan. Likewise, if hazardous materials are stored on-site, a product-specific response plan may be required by the county health and/or fire departments. Health and safety plans, specific to the operations that are proposed, are likely to be required by OSHA and/or CalOSHA.
Hydrology and Water Quality: The operational issues for these resources are similar to those discussed for construction (see above) and comprise plans for recovering on-site spills, protecting natural water ways and ground water resources, and reducing or eliminating increased sedimentation into drainages and onto the beach. Depending upon the amount of impervious cover (i.e. asphalt) on the site, stormwater capture and treatment may be required.
Noise: Operational noise levels will depend upon the type of equipment and the duration of use, however as previously noted the onsite noise conditions are dominated by vehicular traffic on Highway 101 and by trains utilizing the adjacent rail line. As discussed in the construction-related noise section above, operational noise levels will need to be determined and the dB levels at nearby sensitive receptors will need to be calculated. On-site noise
Coastal Regional Sediment Management Plan Central Coast from Pt. Conception to Pt. Mugu Appendix D - Environmental Constraints
D-11
attenuation devices may be required if operation-generated noise exceeds county-regulated levels.
Public Services: Unless the facility requires extensive police patrols or represents a substantial new source for fire potential, it is unlikely that operation of the proposed facility will require a significant increase in public services. The number of new employees is expected to be small, so schools or other pubic facilities are not expected to be impacted.
Transportation and Traffic: The type of sediment transport has not yet been specified, but it is assumed that most of the material would be delivered by truck. In addition, non-sand material would be transported off-site following separation. The number of trucks needed for that operation is also unknown, however a project-specific traffic study, to assess potential impacts to the existing vehicle flow along the primary routes, may be required. The results of that study or similar analysis will determine whether the impacts are significant and whether mitigations such as additional signage/signals, or improvements to ingress and egress routes are required.
Utilities and Service Systems: Assuming that the proposed operation would not result in the need for a significant amount of service from existing utilities (i.e. electricity, water, sewage, waste/sediment disposal), this issue is not expected to be of major concern. Should, however, the required service(s) exceed existing supply, then revisions to the proposed operation and/or identification of alternative sources of those services could be required. Design of the facilities should consider maximizing “green” operations to facilitate self-reliance and on-site services (i.e. solar, co-generation, etc.).
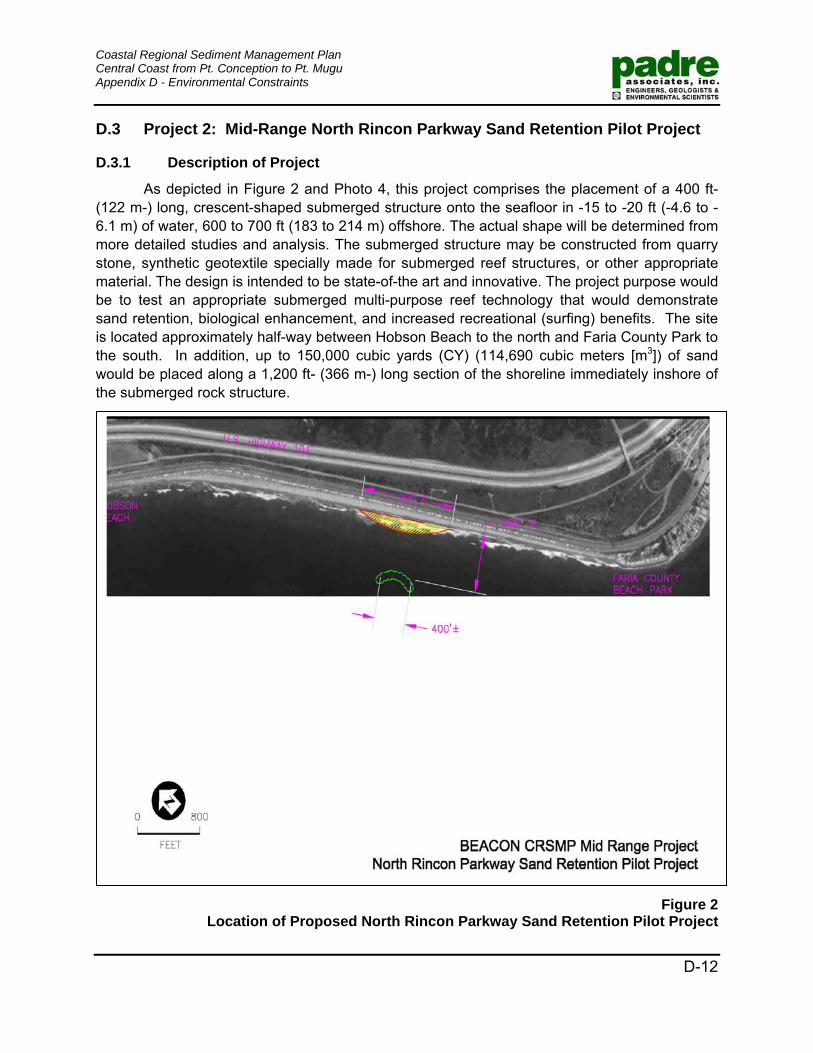
Coastal Regional Sediment Management Plan Central Coast from Pt. Conception to Pt. Mugu Appendix D - Environmental Constraints
D-12
D.3 Project 2: Mid-Range North Rincon Parkway Sand Retention Pilot Project
D.3.1 Description of Project
As depicted in Figure 2 and Photo 4, this project comprises the placement of a 400 ft-(122 m-) long, crescent-shaped submerged structure onto the seafloor in -15 to -20 ft (-4.6 to -6.1 m) of water, 600 to 700 ft (183 to 214 m) offshore. The actual shape will be determined from more detailed studies and analysis. The submerged structure may be constructed from quarry stone, synthetic geotextile specially made for submerged reef structures, or other appropriate material. The design is intended to be state-of-the art and innovative. The project purpose would be to test an appropriate submerged multi-purpose reef technology that would demonstrate sand retention, biological enhancement, and increased recreational (surfing) benefits. The site is located approximately half-way between Hobson Beach to the north and Faria County Park to the south. In addition, up to 150,000 cubic yards (CY) (114,690 cubic meters [m3]) of sand would be placed along a 1,200 ft- (366 m-) long section of the shoreline immediately inshore of the submerged rock structure.
Figure 2
Location of Proposed North Rincon Parkway Sand Retention Pilot Project
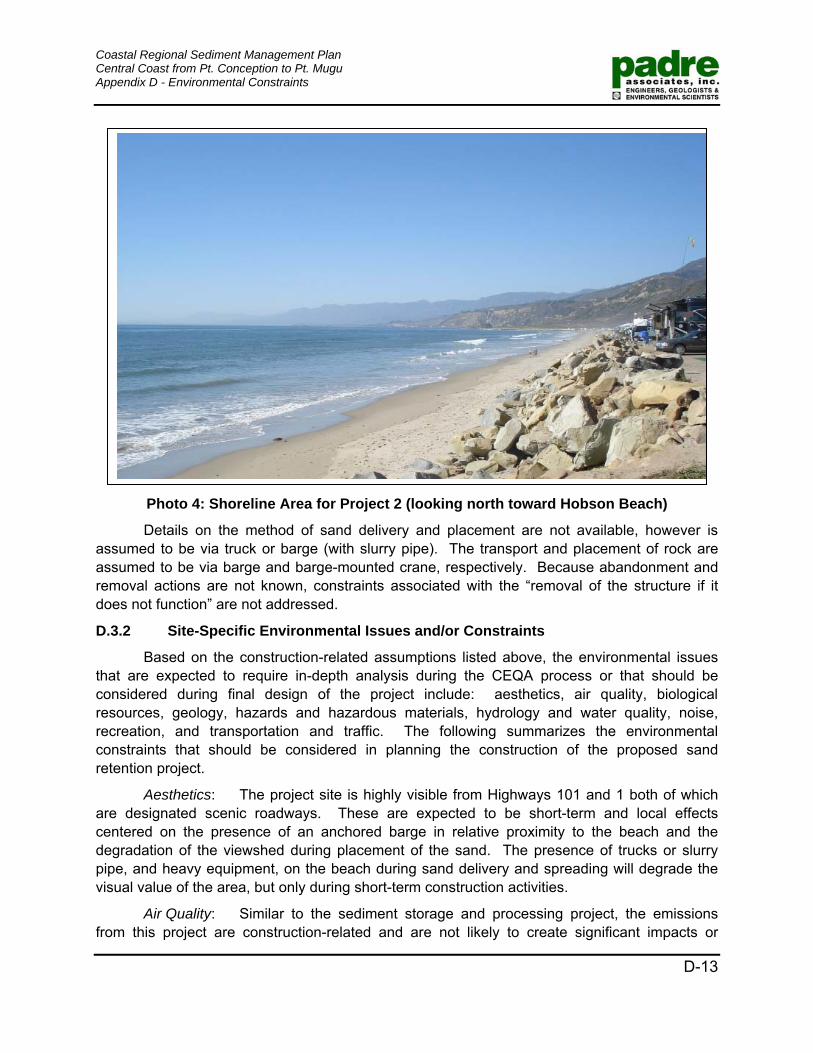
Coastal Regional Sediment Management Plan Central Coast from Pt. Conception to Pt. Mugu Appendix D - Environmental Constraints
D-13
Photo 4: Shoreline Area for Project 2 (looking north toward Hobson Beach)
Details on the method of sand delivery and placement are not available, however is assumed to be via truck or barge (with slurry pipe). The transport and placement of rock are assumed to be via barge and barge-mounted crane, respectively. Because abandonment and removal actions are not known, constraints associated with the “removal of the structure if it does not function” are not addressed.
D.3.2 Site-Specific Environmental Issues and/or Constraints
Based on the construction-related assumptions listed above, the environmental issues that are expected to require in-depth analysis during the CEQA process or that should be considered during final design of the project include: aesthetics, air quality, biological resources, geology, hazards and hazardous materials, hydrology and water quality, noise, recreation, and transportation and traffic. The following summarizes the environmental constraints that should be considered in planning the construction of the proposed sand retention project.
Aesthetics: The project site is highly visible from Highways 101 and 1 both of which are designated scenic roadways. These are expected to be short-term and local effects centered on the presence of an anchored barge in relative proximity to the beach and the degradation of the viewshed during placement of the sand. The presence of trucks or slurry pipe, and heavy equipment, on the beach during sand delivery and spreading will degrade the visual value of the area, but only during short-term construction activities.
Air Quality: Similar to the sediment storage and processing project, the emissions from this project are construction-related and are not likely to create significant impacts or
Coastal Regional Sediment Management Plan Central Coast from Pt. Conception to Pt. Mugu Appendix D - Environmental Constraints
D-14
exceed establish levels. Emission calculations for the trucks and other diesel-fueling equipment including the barge generator and crane will be required and “typical” mitigations such as low sulfur fuel use and limiting idling time should be expected.
Biological Resources: The onshore portion of the project site is sandy beach backed by a rock rip-rap wall. This sandy beach is subject to tidal and wave surge that typically extends to the base of the rip-rap structure. County plans and other regulations provide some guidance for the protection of biological resources and habitats for nearshore and beach replenishment projects. That guidance includes identification of sensitive habitats, buffer areas, and special status species. Specifically:
• Wetland, river mouths, rocky intertidal, subtidal reefs, coastal dunes, beaches that have historically supported grunion spawns, bird/mammal rookeries and haul-out areas, and kelp beds are considered sensitive (Environmentally Sensitive Habitat Areas [ESHAs]) and will have restrictions for sand supply or placement.
• A 100+ ft (31+ m) buffer area around wetland and dune vegetation should be planned for when considering beach sand placement or vehicle access.
• Special status or sensitive species within the region include: snowy plover, least terns, globose dune beetle, tidewater goby, steelhead, grunion, Pismo clams, and all marine mammals.
Tidepools are considered sensitive habitats and have been documented at Pitas Point (Faria County Beach Park); subtidal rocky reefs and associated kelp beds are likewise considered sensitive resources. The beach and nearshore habitats are expected to be sedimentary; however rock features, and associated kelp beds, are present to the north and south of the site. Actions that could affect these resources include the anchoring of the offshore barge, placement of the slurry pipe (for delivery of sand from a barge), and placement of rock and sand onto the seafloor and beach. The beach area that is proposed for replenishment has been documented to support Pismo and littleneck clams and is likely to be considered a sensitive habitat. Restrictions to sand placement due to that sensitivity should be investigated prior to finalizing construction plans.
A search of the CNDDB resulted in the identification of two terrestrial special status species having been reported within 1 mile (1.6 km) of the project location: the San Diego desert wood rat and southern tarplant (see Table A-1, Exhibit A). As is shown in Figure A-1, Exhibit A, both species have been reported near Pitas Point and are unlikely to be affected by the proposed actions.
The resource and regulatory agencies could be expected to require a project-specific anchoring plan (one that describes how rocky habitats and kelp beds will be avoided). In addition, seasonal use of the water and beach areas by, for example, grunion, marine mammals, and shorebirds, needs to be considered during construction planning. A Marine Wildlife Contingency Plan that describes methods to reduce or eliminate impacts to those resources will possibly be required prior to the issuance of one or more permits.
Geology: The inshore portion of the project site is comprised of a narrow sandy beach backed by rock rip-rap. Seasonal wave action results in a steeper winter profile with a
Coastal Regional Sediment Management Plan Central Coast from Pt. Conception to Pt. Mugu Appendix D - Environmental Constraints
D-15
cobble beach face. In shore of the beach, across from the Highway 1 roadway, the area is comprised of steeply terraced highly eroded slopes. The percent of sand that the beach replenishment material must contain is well-established by the Corps of Engineers and adherence to that requirement, or Corps-concurrence for a different percent, is expected. Offshore geological considerations would include assurance that the surficial geology of the seafloor is capable of supporting the rock reef material (i.e. the sediments have the appropriate geotechnical characteristics to preclude the rock from “sinking”) and that existing rocky areas are avoided.
Hazards and Hazardous Materials: Due to the active coastal environment present at the project site, the presence of contaminated materials or hazards materials is unlikely. Environmental constraints for this issue are related to worker safety during hazardous operations (i.e. anchor placement, barge movements, etc.) and could require the preparation of a project-specific Health and Safety Plan for both onshore and offshore operations. Project-specific containment and recovery plans for accidental spills of petroleum products are also expected to be required and the on-site presence of the appropriate type and amount of recovery equipment should be included in that plan.
Hydrology and Water Quality: The project site is on a narrow coastal plain, backed by steep highly eroded bluffs. During seasonal storm events the area can be subject to both high wave action and rapid runoff from the adjacent bluffs. Such conditions can result in flooding along the Highway 1 and the project area and sediment runoff from the coastal bluffs.
Turbidity or petroleum spill-related degradation of ocean water quality during construction are expected to be the primary concerns for this issue. While the submerged multi-purpose reef is designed to alter the wave climate and reduce wave effects on the beach, it is not anticipated that the proposed actions would have a significant effect on the hydrology of the project site. Water quality concerns would be expected to be centered on those related to the resuspension of seafloor sediments during barge anchoring, material placement, and possibly slurry pipeline installation. Nearshore turbidity increases are likely during beach replenishment, and Ocean Plan criteria for pH, dissolved oxygen, etc. cannot be exceeded. Analysis of offshore sediments and beach replenishment material could be required by various regulatory and/or resource agencies.
Noise: Noise levels at the project site are dominated by coastal wave and wind as well as traffic-generated noise from Highway 1 and train-generated noise along the adjacent railroad tracks. Sensitive receptors within the project area include a residential development and an RV campground located to the southeast of the site. In addition, seasonal RV parking occurs adjacent to the site along Highway 1. Construction-related noise is not expected to be a major concern; however the proximity of the rock-supply barge and crane to an existing beach (considered to be a sensitive receptor) may require that operations be scheduled during low-beach use periods. Truck- or slurry-associated noise during beach replenishment may require onsite monitoring and could result in mitigations (i.e. burial of pipe or re-routing of trucks) if established noise levels are exceeded during that phase of the proposed project.
Recreation: The project site is located adjacent to an area used for seasonal RV overnight parking/camping provided by the California State Parks Department. In addition,
Coastal Regional Sediment Management Plan Central Coast from Pt. Conception to Pt. Mugu Appendix D - Environmental Constraints
D-16
Faria County Beach Park is located southeast of the site and provides additional off-road RV parking/camping. The beach itself and the offshore area are commonly used for beach-related recreational activities including surfing and fishing. Generally, beach and/or nearshore construction projects in southern California are scheduled for lower-use periods (after Labor Day and before Memorial Day). Enforcement of that restriction will likely depend upon the length of the construction period and the historical recreational use of the project site. Popular SCUBA diving and surfing locations within the project area should be identified and avoided and beach-related impacts due to parking or beach-use restrictions during replenishment operations will need to be assessed. The beneficial aspects of the reef to create waves that could be used as a surfing resource will also need to be assessed and discussed in the project description.
Transportation and Traffic: The project site is located adjacent to Highway 1 with regional access provided by Highway 101. Access to the site can be obtained at either the Seacliff on and off ramps located north of the site, or via the Emma Wood Beach on and off ramps to the south. The potential significance of the impacts on this resource will necessarily depend upon the method of transport of the sand material. Onshore delivery, via truck, could result in substantial traffic effects, particularly if ingress and egress affect Highway 101 flows or eliminate a substantial number of parking spaces. Assuming that each truck would deliver approximately 15 CY (11.5 m3) of sand, up to 10,000 one-way trips would be required to deliver the 150,000 CY (114,690 m3) of replenishment sand. A project-specific traffic analysis should be considered during the planning of this project.
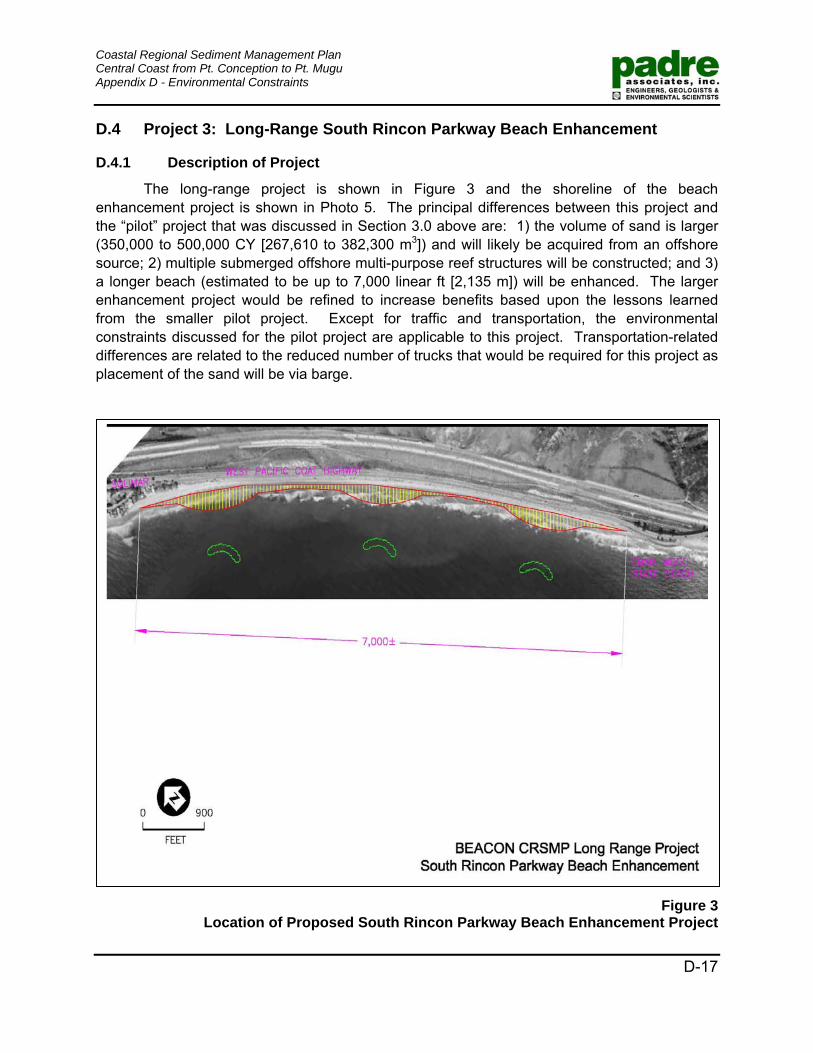
Coastal Regional Sediment Management Plan Central Coast from Pt. Conception to Pt. Mugu Appendix D - Environmental Constraints
D-17
D.4 Project 3: Long-Range South Rincon Parkway Beach Enhancement
D.4.1 Description of Project
The long-range project is shown in Figure 3 and the shoreline of the beach enhancement project is shown in Photo 5. The principal differences between this project and the “pilot” project that was discussed in Section 3.0 above are: 1) the volume of sand is larger (350,000 to 500,000 CY [267,610 to 382,300 m3]) and will likely be acquired from an offshore source; 2) multiple submerged offshore multi-purpose reef structures will be constructed; and 3) a longer beach (estimated to be up to 7,000 linear ft [2,135 m]) will be enhanced. The larger enhancement project would be refined to increase benefits based upon the lessons learned from the smaller pilot project. Except for traffic and transportation, the environmental constraints discussed for the pilot project are applicable to this project. Transportation-related differences are related to the reduced number of trucks that would be required for this project as placement of the sand will be via barge.
Figure 3
Location of Proposed South Rincon Parkway Beach Enhancement Project
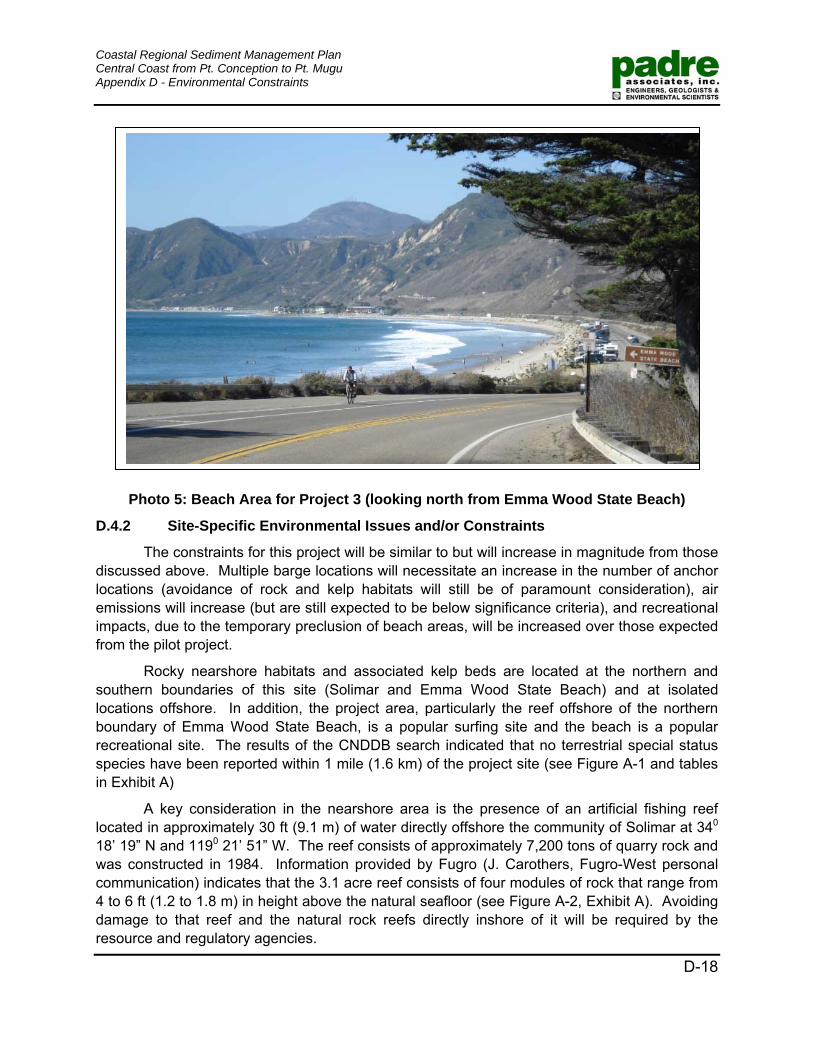
Coastal Regional Sediment Management Plan Central Coast from Pt. Conception to Pt. Mugu Appendix D - Environmental Constraints
D-18
Photo 5: Beach Area for Project 3 (looking north from Emma Wood State Beach)
D.4.2 Site-Specific Environmental Issues and/or Constraints
The constraints for this project will be similar to but will increase in magnitude from those discussed above. Multiple barge locations will necessitate an increase in the number of anchor locations (avoidance of rock and kelp habitats will still be of paramount consideration), air emissions will increase (but are still expected to be below significance criteria), and recreational impacts, due to the temporary preclusion of beach areas, will be increased over those expected from the pilot project.
Rocky nearshore habitats and associated kelp beds are located at the northern and southern boundaries of this site (Solimar and Emma Wood State Beach) and at isolated locations offshore. In addition, the project area, particularly the reef offshore of the northern boundary of Emma Wood State Beach, is a popular surfing site and the beach is a popular recreational site. The results of the CNDDB search indicated that no terrestrial special status species have been reported within 1 mile (1.6 km) of the project site (see Figure A-1 and tables in Exhibit A)
A key consideration in the nearshore area is the presence of an artificial fishing reef located in approximately 30 ft (9.1 m) of water directly offshore the community of Solimar at 340 18’ 19” N and 1190 21’ 51” W. The reef consists of approximately 7,200 tons of quarry rock and was constructed in 1984. Information provided by Fugro (J. Carothers, Fugro-West personal communication) indicates that the 3.1 acre reef consists of four modules of rock that range from 4 to 6 ft (1.2 to 1.8 m) in height above the natural seafloor (see Figure A-2, Exhibit A). Avoiding damage to that reef and the natural rock reefs directly inshore of it will be required by the resource and regulatory agencies.
Coastal Regional Sediment Management Plan Central Coast from Pt. Conception to Pt. Mugu Appendix D - Environmental Constraints
D-19
The proximity of the Solimar beach community to offshore rock reef construction and sand slurry placement along the northern portion of the project site may require additional noise-related mitigation considerations. Seasonal restrictions on construction due to conflicts with human use and the presence of marine wildlife (i.e. marine mammals, shorebirds, grunion, etc.) along the beach and/or within the nearshore areas need to be considered in scheduling the construction activities.
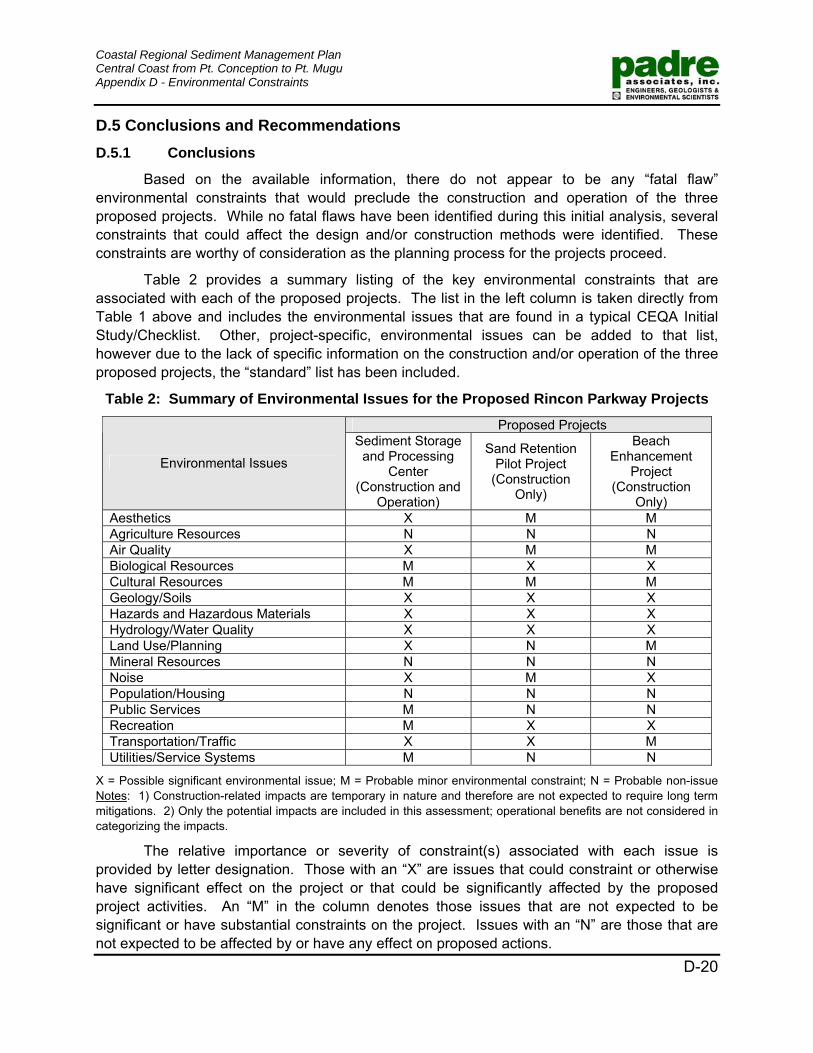
Coastal Regional Sediment Management Plan Central Coast from Pt. Conception to Pt. Mugu Appendix D - Environmental Constraints
D-20
D.5 Conclusions and Recommendations D.5.1 Conclusions
Based on the available information, there do not appear to be any “fatal flaw” environmental constraints that would preclude the construction and operation of the three proposed projects. While no fatal flaws have been identified during this initial analysis, several constraints that could affect the design and/or construction methods were identified. These constraints are worthy of consideration as the planning process for the projects proceed.
Table 2 provides a summary listing of the key environmental constraints that are associated with each of the proposed projects. The list in the left column is taken directly from Table 1 above and includes the environmental issues that are found in a typical CEQA Initial Study/Checklist. Other, project-specific, environmental issues can be added to that list, however due to the lack of specific information on the construction and/or operation of the three proposed projects, the “standard” list has been included.
Table 2: Summary of Environmental Issues for the Proposed Rincon Parkway Projects
Proposed Projects
Environmental Issues
Sediment Storage and Processing
Center (Construction and
Operation)
Sand Retention Pilot Project
(Construction Only)
Beach Enhancement
Project (Construction
Only) Aesthetics X M M Agriculture Resources N N N Air Quality X M M Biological Resources M X X Cultural Resources M M M Geology/Soils X X X Hazards and Hazardous Materials X X X Hydrology/Water Quality X X X Land Use/Planning X N M Mineral Resources N N N Noise X M X Population/Housing N N N Public Services M N N Recreation M X X Transportation/Traffic X X M Utilities/Service Systems M N N
X = Possible significant environmental issue; M = Probable minor environmental constraint; N = Probable non-issue Notes: 1) Construction-related impacts are temporary in nature and therefore are not expected to require long term mitigations. 2) Only the potential impacts are included in this assessment; operational benefits are not considered in categorizing the impacts.
The relative importance or severity of constraint(s) associated with each issue is provided by letter designation. Those with an “X” are issues that could constraint or otherwise have significant effect on the project or that could be significantly affected by the proposed project activities. An “M” in the column denotes those issues that are not expected to be significant or have substantial constraints on the project. Issues with an “N” are those that are not expected to be affected by or have any effect on proposed actions.
Coastal Regional Sediment Management Plan Central Coast from Pt. Conception to Pt. Mugu Appendix D - Environmental Constraints
D-21
The designations are based on the available information on each of the projects and on the results of a preliminary review of available literature on the sites. More detailed descriptions of the proposed actions could be expected to result in refinement of the designations and to allow a more quantitative assessment of potential impacts.
A list of recommendations that will facilitate timely environmental and permitting processes is also provided.
D.5.2 Recommendations
The definitiveness of an environmental analysis is based upon the level of detail provided in the description of the proposed action and on the completeness of information that is used to describe the existing conditions or setting of the project region and site. Further, regulatory agencies expect applications that are submitted to initiate environmental analysis include a complete project description, a preliminary assessment of potential impacts, and applicant-incorporated mitigations to reduce those impacts.
If the decision is made that one or more of the projects are to be initiated, the environmental process will be the next major task. However, before BEACON can proceed with the CEQA/NEPA process, it is recommended that the following be completed:
1) Meet with Ventura County and the California State Lands Commission to identify land use or zoning constraints on the use of onshore and offshore areas for all three proposed projects. It is further recommended that a meeting be held with Caltrans to discuss site use and access issues for all three projects.
2) If use or zoning constraints do not preclude the proposed project(s), develop a detailed project description for the proposed actions for each project that BEACON wants to initiate within the next one to two years.
3) Complete a detailed search of literature on the project site and complete a reconnaissance level survey of the site to provide a database on the existing conditions.
4) Meet with regulatory and resource agencies to discuss the proposed action and to ascertain environmental concerns each has and to determine which agency will be the Lead Agency for CEQA and/or NEPA.
5) Based on the results of the preliminary meetings with the agencies, complete additional data acquisition and analysis, refine the description of the proposed actions, and complete an application support package that provides the agencies with the relevant information.
Coastal Regional Sediment Management Plan Central Coast from Pt. Conception to Pt. Mugu Environmental Constraints
EXHIBIT A
CNDDB TABLES AND FIGURE
PITAS POINT ARTIFICIAL FISHING REEF FIGURE
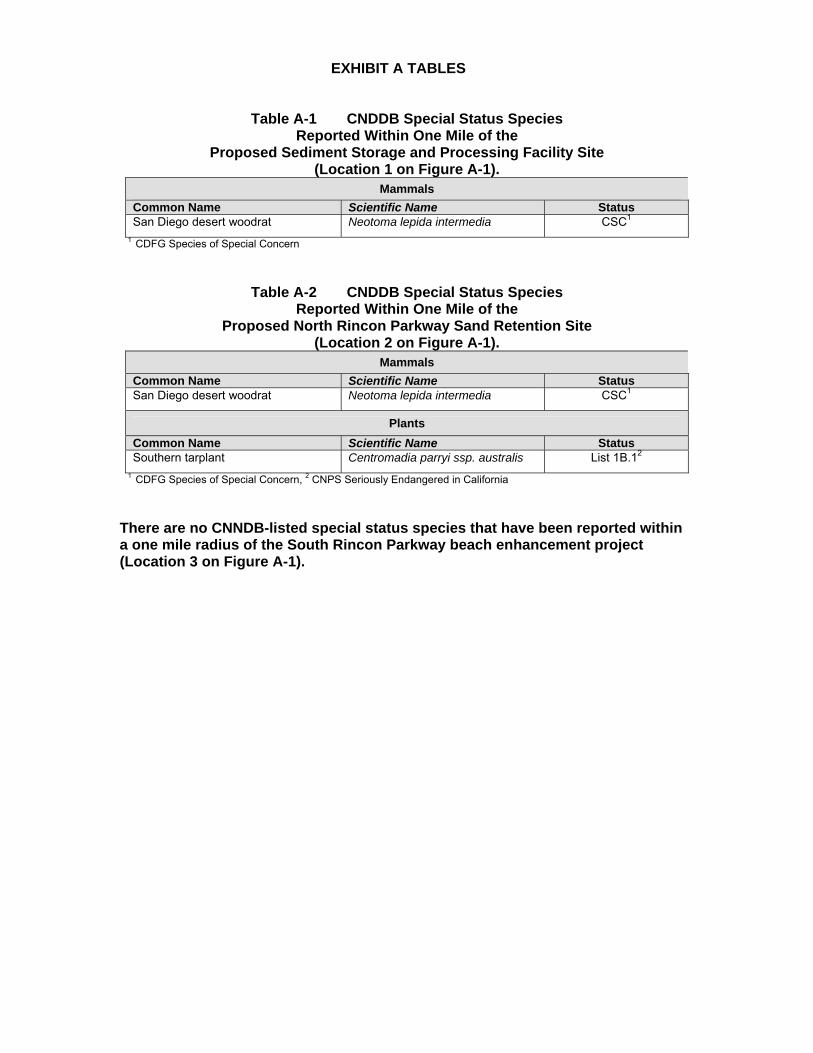
EXHIBIT A TABLES
Table A-1 CNDDB Special Status Species Reported Within One Mile of the
Proposed Sediment Storage and Processing Facility Site (Location 1 on Figure A-1).
Mammals Common Name Scientific Name Status San Diego desert woodrat Neotoma lepida intermedia CSC1
1 CDFG Species of Special Concern
Table A-2 CNDDB Special Status Species Reported Within One Mile of the
Proposed North Rincon Parkway Sand Retention Site (Location 2 on Figure A-1).
Mammals Common Name Scientific Name Status San Diego desert woodrat Neotoma lepida intermedia CSC1
Plants Common Name Scientific Name Status Southern tarplant Centromadia parryi ssp. australis List 1B.12
1 CDFG Species of Special Concern, 2 CNPS Seriously Endangered in California There are no CNNDB-listed special status species that have been reported within a one mile radius of the South Rincon Parkway beach enhancement project (Location 3 on Figure A-1).
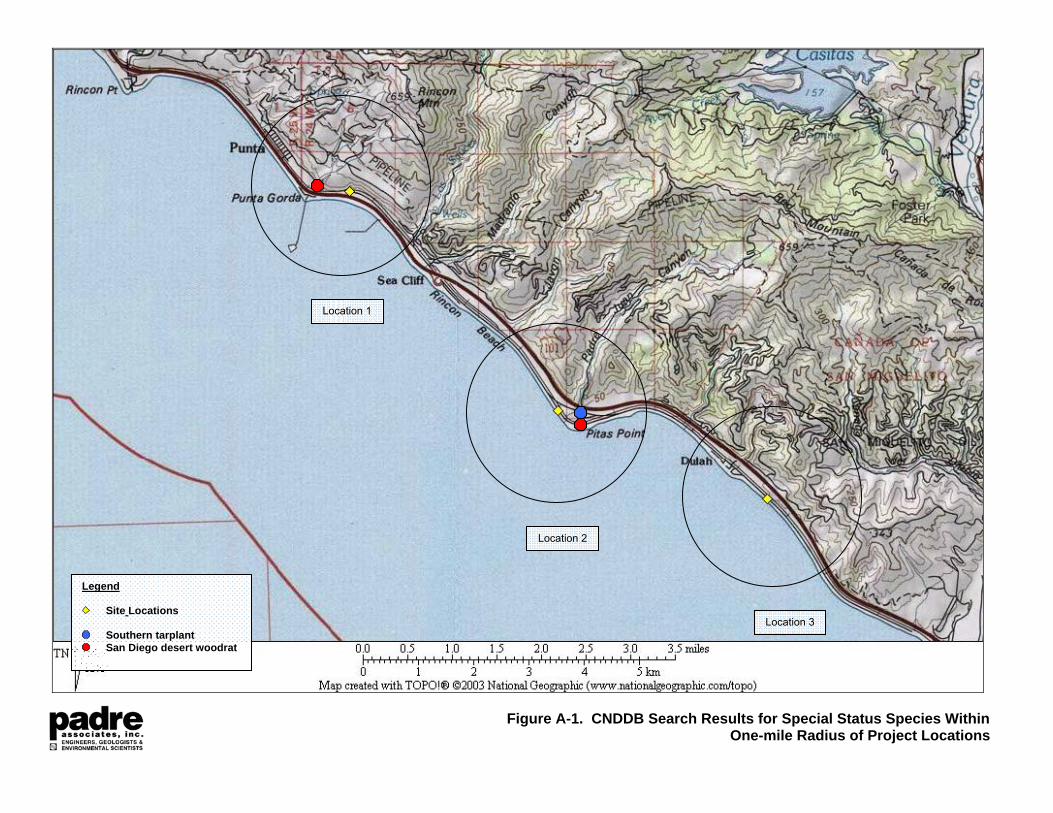
Figure A-1. CNDDB Search Results for Special Status Species Within One-mile Radius of Project Locations
Legend
Site Locations
Southern tarplant San Diego desert woodrat
Location 3
Location 2
Location 1
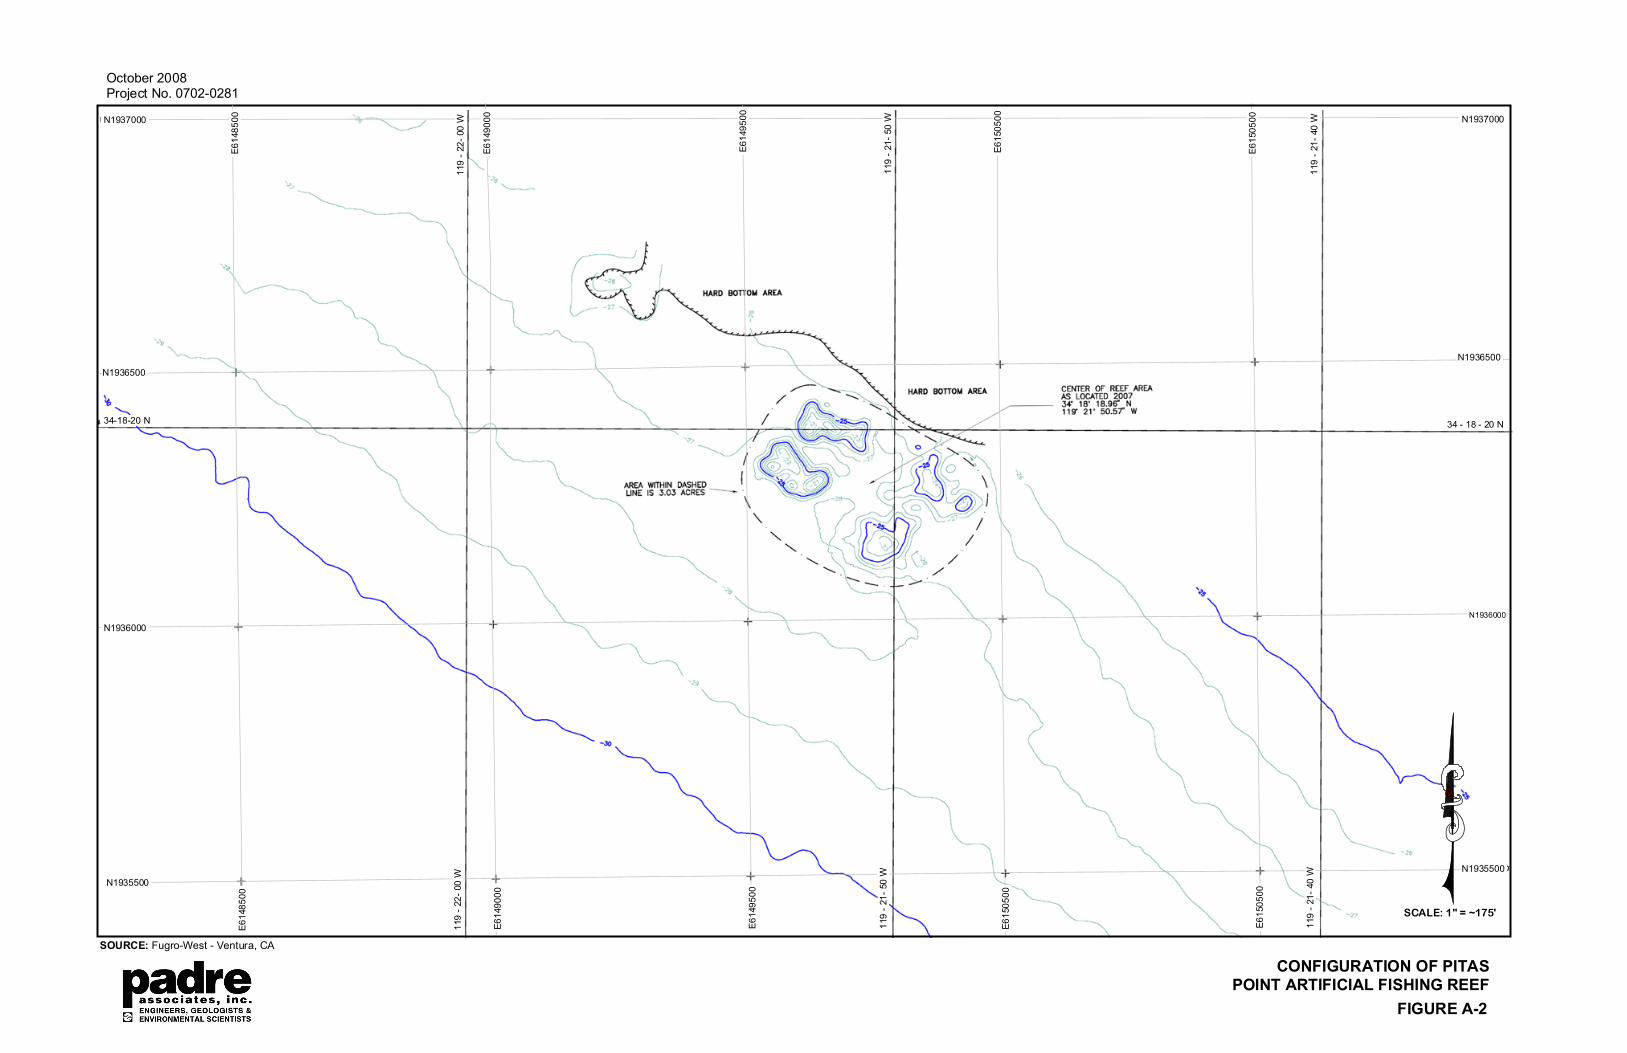
� � � � � � � � � � � � � � � � �
� � � � � � � � � � � � � � � � � � � � � � � � �
� � � � � � � � �
� � � � � � � � �� � � � � � � � � � � � � � �
� � � � � � � � � � � � � � � � � � � � � � � � � � � � � � �
� � � � ! �
� � " � � � � � � � � � � � �
� � � � � �
� � � � ! ! �
� � " � � � � � � � �
� � � � ! �
� � � � � �
����������"��
�
�# �!!�
����������"��
�
�# �!!�
�# �!!�
����������!��
�
�����������
�
����������!��
�
�# �"�!�
�# �"�!�
�# �"��
�# �"�!�
�# �"��
�# �"�!�
� � � � � � �
�# �!!�
�����������
�
� � � � � � �
� � � � � ! ! �
� � � � � � � � � � � � � �