Embed Size (px)
Citation preview
Santa Monica College Student Equity Plan
2014
Santa Monica College Student Equity Plan 2014 ii
Table of Contents
Executive Summary ……………………………………………………………………………………… iv
Introduction ……………………………………………………………………………………… 1
Campus-Based Research……………………………………………………………………………………... 6
Goals and Activities ……………………………………………………………………………………… 26
Access ……………………………………………………………………………………… 26
Course Completion ………………………………………………………………………………… 29
ESL/Basic Skills Course Completion………………………………………………………… 34
Degree and Certificate Completion………………………………………………………… 39
Transfer ……………………………………………………………………………………… 42
Evaluation Schedule and Process………………………………………………………………………… 44
Budget ……………………………………………………………………………………… 45
Santa Monica College Student Equity Plan 2014 iv
Executive Summary There are three overarching goals for the Santa Monica College Student Equity Plan.
• To build institutional capacity to address the achievement gap by engaging in systematic quantitative and qualitative inquiry using a practitioner-researcher model and by implementing interventions and student support that directly address the identified equity gaps.
• To establish a standing college committee on Student Equity which will monitor progress on the plan, submit required annual reports, and develop future plans.
• To develop consensus on determining the performance measures for monitoring progress toward achieving the desired outcomes and establish target dates for achieving these outcomes.
These overarching goals will be accomplished through two pathways: 1. Research and inquiry and 2. Intervention and student support. These two pathways will culminate in an evaluation process in order to determine as a college community the most successful practices and how they can be brought to scale in order to have a broad and significant impact on closing the achievement gap.
The Student Equity Plan Taskforce has selected a primary focus for each year, however, activities that address all equity indicators are supported in this plan. Year 1 of this three year plan will focus on Indicator C, ESL and Basic Skills Completion. Year 2 will focus on Course Completion. Year 3 will focus on Degree and Certificate Completion as well as Transfer. The target group students who experience the greatest disproportionate impact across indicators were African American and Latino/a students, particularly male students.
Planned activities include the following:
Research and Inquiry • Minority Male Community College Collaborative (M2C3): Santa Monica College (SMC) will engage
Dr. Frank Harris Co-Director of the Minority Male Community College Collaborative at San Diego State University at both an institutional and departmental level. At the institutional level, SMC will contract with Dr. Frank Harris to conduct the Community College Survey of Men (CCSM), a comprehensive instrument for assessing the needs of men of color in community colleges. In addition he will conduct focus groups with all involved constituents (students, faculty) and deliver follow up professional development for faculty campus wide as well as for the Math department specifically. This project will inform all indicators of the SMC Student Equity Plan.
• Research and Inquiry: Develop an inquiry group comprised of SMC practitioners to deepen the institution’s understanding of why the equity gaps exist for basic skills metrics within the context of instructional support services and curriculum delivery. While this inquiry is focused on basic skills students, the lessons learned will inform our approach to improving course completion more generally.
• Equity Research Analyst: SMC will hire a Research Analyst to assist the Equity Plan Task Force and research/inquiry committees with identifying baseline data for equity performance measures, determining standards for achievement, and conducting a variety of inquiry projects. The analyst will work with pilot projects to determine efficacy and sustainability of efforts to close identified equity gaps.
Santa Monica College Student Equity Plan 2014 v
Intervention and Student Support In addition to the many student and instructional support services offered at Santa Monica College, the Student Equity Plan Taskforce has selected projects that provide new or enhanced support services to students to improve course, degree, certificate, and transfer achievement and minimize the equity gaps experienced by target group students.
Access:
• Improve identifying and access to services for foster youth. • Improve identification of Veterans in need of Disabled Student Programs and Services (DSPS)
and access to those services. • Improve access to Disabled Student Programs and Services (DSPS) services overall. • Improve access to technical majors for basic skills students.
Course Completion
• Assess the overall efficacy of student instructional support services and better promote their use among groups experiencing disproportionate impact in course completion.
• Develop a rigorous plan for faculty and staff professional development to address the issues contributing to academic underperformance of Latino/a, African American, Veteran, and male students.
• Support projects in history, sociology, and other academic disciplines to promote successful course completion by target group students.
• Expand access to instructional support services for target group students.
ESL and Basic Skills Completion
• Establish an inquiry group made up of faculty, administrators, and support staff will engage to systematically investigate practices to build our capacity to address Basic Skills course completion disparities.
• Invest in interventions that create pathways from basic skills to college level courses. Examples of these interventions include the English Academy and STEM Academy.
• Expand access to instructional support services for target group students.
Degree and Certificate Completion
• Create experiences for students that promote a connection to their academic goals including research opportunities at universities, attendance at leadership and resiliency conferences and events.
• Enhance services offered by categorical and other special programs that promote degree and certificate completion among target group students.
Santa Monica College Student Equity Plan 2014 vi
Transfer
• Assess the overall efficacy of our student transfer support services in promoting their use among groups experiencing disproportionate impact.
• Develop a rigorous plan for faculty and staff professional development to address the issues contributing to academic underperformance of Latino/a, African American, Veteran, and Disabled students with regards to transfer metrics.
• Create experiences for students that promote a connection to their academic goals including research opportunities at universities, attendance at leadership and resiliency conferences and events.
• Enhance services offered by categorical and other special programs that promote transfer among target group students.
SB 860 Requirements Foster youth, Veterans, and low-income/disadvantaged student data have been included in the “campus-based research” to the extent data are available. In some cases data were not collected for these student groups until a later date than the cohort specified for the equity plan. In the annual update to the Student Equity Plan, we will disaggregate data by gender within target groups. All revised data requirements included in SB 860 will be reviewed by the Dean, Institutional Research in order to insure these are included in our annual update. There was close collaboration with categorical and special support programs on campus that work directly with target group students throughout the planning process.
Resources Budgeted The Student Equity Plan funds have been allocated based on the disproportionate impact study in order to address identified equity gaps in each of the indicators following the funding guidelines provided by the Chancellor’s Office in September 2014. In addition to the activities supported by Student Equity Plan funding, there are many, ongoing institutional activities that address equity gaps in academic achievement for target group students that are supported by the general fund, grants such as Title V, SSSP, and other categorical funds.
The budget for Santa Monica College has been categorized by object code as follows:
Revenue (2014 – 2015) 8600 State $1,089,834 Expenditures 1000 Academic Salaries $ 360,948 2000 Non Academic Salaries $ 388,978 3000 Employee Benefits $ 136,598.56 4000 Supplies & Materials $ 36,956.44 5000 Other Operating Expenditures $ 166,353
College Contact The Student Equity Plan contact for Santa Monica College is Dr. Melanie Bocanegra. She can be reached at 310-434-3992 or [email protected].
Santa Monica College Student Equity Plan 2014 1
Introduction The Student Equity Plan development process has been utilized as a tool for engaging the broader college community in meaningful dialogue to improve the success rates of our African American and Latino/a students. The Santa Monica College Student Equity Plan Task Force began its work in Spring 2014. Academic Senate President, Eve Adler, the President of Chapter 36 of the California State Employees Association (CSEA), Bernie Rosenlocher, and the Office of Academic Affairs solicited membership for this committee across constituent groups. The Task Force decided to pursue two pathways of activity in the college equity plan: 1. Research and inquiry and 2. Intervention and student support. These two pathways will culminate in an evaluation process in order to determine as a college community the most successful practices and how they can be brought to scale in order to have a broad and significant impact on closing the achievement gap. In the initial meetings the Task Force began examining campus-based research data for the purposes of developing the student equity plan. At each meeting it seemed new questions were generated for the Institutional Research staff to try and answer by providing additional data. This thirst for additional knowledge about the achievement gap at Santa Monica College (SMC) reflects a commitment and overall ethos at the college. SMC has regularly evaluated student success and achievement data disaggregated by race/ethnicity. In the Annual Report on Institutional Effectiveness and the annual and comprehensive department program review processes it became clear that African American and Latino/a students experience disparate educational outcomes when compared to their peers. The following is from the annual report of the Academic Senate Joint Committee on Program Review as presented to the District Planning and Advisory Council:
Through long term support for the Adelante and Black Collegians programs, Master Plan for Education annual objectives, Board priorities, current work on the Student Equity Plan, and other activities, the College has institutionalized a commitment to improving student equity. An array of support services provided… have been shown to have a positive impact. However, beyond support services, current research indicates that the type of interaction and engagement with instructors has the greatest impact on student success—both positive and negative. Many programs express not knowing how or what they could do to improve the success and positive college experience of students of color. Given the number of programs identifying this issue, it seems timely to identify a formalized means for engaging the broader college community in ongoing dialogue and the sharing of strategies and practices shown to be effective. Further institutional research drilling down to determine the most impactful and scalable strategies would support such dialogue.
[Recommendation #12] Identify a process for engaging the broader college community in dialogue focused on means to improve the success rates of Black and Hispanic students and identify research questions to inform this dialogue.
(Spring and Fall 2013 Program Review Planning Summary, pp. 6-7, http://www.smc.edu/ACG/DistrictPlanningPolicies/Documents/District_Planning_and_Advisory_Council/DPAC%202013-2014/Program%20Review%202013%20Planning%20Summary.pdf).
Santa Monica College has made addressing the achievement gap for African American and Latino/a students a campus wide priority.
Santa Monica College Student Equity Plan 2014 2
Goal There are three overarching goals for the SMC Student Equity Plan.
• To build institutional capacity to address the achievement gap by engaging in systematic quantitative and qualitative inquiry using a practitioner-researcher model and by implementing interventions and support that directly address the identified equity gaps.
• To establish a standing college committee on Student Equity which will monitor progress on the plan, submit required annual reports, and develop future plans.
• To develop consensus on determining the performance measures for determining progress toward achieving the desired outcomes and establish target dates for achieving expected outcomes.
Activities
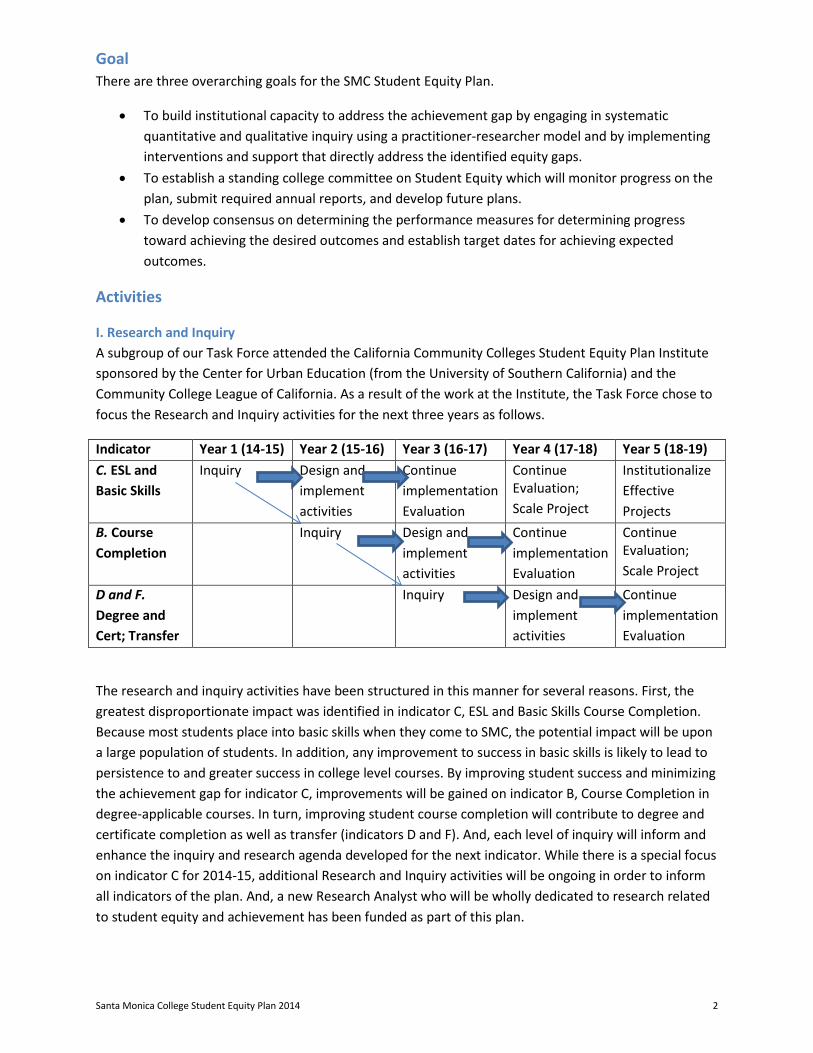
I. Research and Inquiry A subgroup of our Task Force attended the California Community Colleges Student Equity Plan Institute sponsored by the Center for Urban Education (from the University of Southern California) and the Community College League of California. As a result of the work at the Institute, the Task Force chose to focus the Research and Inquiry activities for the next three years as follows.
Indicator Year 1 (14-15) Year 2 (15-16) Year 3 (16-17) Year 4 (17-18) Year 5 (18-19) C. ESL and Basic Skills
Inquiry Design and implement activities
Continue implementation Evaluation
Continue Evaluation; Scale Project
Institutionalize Effective Projects
B. Course Completion
Inquiry Design and implement activities
Continue implementation Evaluation
Continue Evaluation; Scale Project
D and F. Degree and Cert; Transfer
Inquiry Design and implement activities
Continue implementation Evaluation
The research and inquiry activities have been structured in this manner for several reasons. First, the greatest disproportionate impact was identified in indicator C, ESL and Basic Skills Course Completion. Because most students place into basic skills when they come to SMC, the potential impact will be upon a large population of students. In addition, any improvement to success in basic skills is likely to lead to persistence to and greater success in college level courses. By improving student success and minimizing the achievement gap for indicator C, improvements will be gained on indicator B, Course Completion in degree-applicable courses. In turn, improving student course completion will contribute to degree and certificate completion as well as transfer (indicators D and F). And, each level of inquiry will inform and enhance the inquiry and research agenda developed for the next indicator. While there is a special focus on indicator C for 2014-15, additional Research and Inquiry activities will be ongoing in order to inform all indicators of the plan. And, a new Research Analyst who will be wholly dedicated to research related to student equity and achievement has been funded as part of this plan.
Santa Monica College Student Equity Plan 2014 3
This initial investment in research and inquiry is critical. A core group of faculty, staff, and administrators will engage in practitioner-research. In addition we will engage in research facilitated by Dr. Frank Harris, Co-Director of the Minority Male Community College Collaborative (M2C3). The skills and knowledge gained in Year 1 through these initial inquiry projects will be applied in future years to the other indicators as well as future inquiry projects. Investing in the development of in-house expertise to create comprehensive tools to investigate the origins of equity gaps in SMC classrooms and student support services will benefit our research and inquiry efforts for years to come.
II. Student Intervention and Support Following the model used for the Student Success and Support Program (SSSP) at SMC, the Task Force solicited proposals from the college community which: a.) address the equity gaps identified in our college data, b.) address one of the indicators in the equity plan, and c.) meet the funding guidelines provided in SB 860. The data report was posted on the Institutional Research website along with the proposal guidelines. Multiple information sessions were held on campus, and the materials from these presentations were also posted on the web. Dozens of thoughtful proposals were received. A subcommittee of the Task Force met and made decisions on funding. This subcommittee was made up of categorical and special program leaders, the STEM director, the Dean of Institutional Research, the SSSP coordinator, counseling faculty members, instructional faculty members from English and Math, and the Vice President for Academic Affairs. The funded activities are listed under the relevant indicators in the “Goals and Activities” section of this plan.
Ongoing Institutional Research and Activities Seeking to achieve equity in educational outcomes is not limited to the research and activities of the Student Equity Plan. This is a priority which is reflected across the institution. Addressing the achievement gap is an objective for the 2014-15 Master Plan for Education which reads, “To identify additional strategies, based on student equity data, to improve the success and retention of Latino and African-American students, as well as students from other historically underrepresented groups.” The Board of Trustees also sets annual goals and priorities. This academic year they have established the following goal to address student equity: “Institutionalize initiatives that are effective in improving student success, with an emphasis on improving basic skills mastery in mathematics and English, and strengthening students’ non-cognitive skills (GRIT), to achieve more equitable outcomes.” Equity was the theme for “Opening Day,” the fall professional development day for all faculty and staff. The Spring 2015 Flex Day will feature workshops on equity-funded projects as well as keynote speaker Pedro Noguera, Peter L. Agnew Professor of Education at New York University and author of Schooling for Resilience: Improving the Life Trajectories of African American and Latino Boys. In addition the Center for Teaching Excellence, funded by a Title V grant, regularly focuses professional development activities for faculty on culturally responsive pedagogy. As mentioned above, the annual and comprehensive Program Review processes require departments and programs to conduct self-evaluation using achievement and participation data disaggregated by race/ethnicity. The Office of Institutional Research in collaboration with the Academic Senate Joint committee on Institutional Effectiveness produces the annual “Institutional Effectiveness” report. This annual report includes many indicators that parallel those of the Student Equity Plan including:
Santa Monica College Student Equity Plan 2014 4
• Fall-to-Fall Persistence Rate • Course Success Rate • Degrees Awarded • Certificates Awarded • Transfers to Public Four-Year Institutions • Progress and Achievement Rate • Transfer Rate • Basic Skills Course Success Rate • Basic Skills Course Improvement Rate • Basic Skills Transition to Degree Course Rate • CTE Course Success Rate • CTE Completion Rate
The Student Services and Success Program (SSSP) at SMC is integrated with the Student Equity Plan in order to leverage and maximize both sources of funding to promote student success and completion. The First Year Student work group evolved from the SSSP planning for the college. This work group will analyze first year student services, the efficacy of those services, and, most importantly, which students are not taking advantage of the available services. Several standing committees at SMC focus their activities on minimizing the achievement gap for students from target groups. Both the Academic Senate Joint committee on Student Success and the Student Instructional Support committee conduct important work in support of student equity.
Evaluation and Performance Goals
Performance Goals In Year 1 of the SMC Student Equity Plan, the committee will engage in setting performance measures for each indicator as well as timelines to achieve them. The committee will follow the model established by the Academic Senate Joint Committee on Institutional Effectiveness and develop a process for establishing institution-set standards and targets for each indicator. These standards and targets will then be shared and vetted with college community members. The committee will adopt a methodology for indicating progress toward the targets in line with that used in the Institutional Effectiveness report. The Institutional Effectiveness committee has set the following rubric to measure achievement across metrics:
If the College performs below the target range (within 1% of the target goal), the key indicator is marked with “in progress – needs attention.” This status indicates that additional attention/effort from the College is needed if the target is to be achieved. If the College performs within the target range (within 1% of the target goal), the key indicator is marked with “in progress – on target.” This status indicates that, based on the progress towards the target, the College is projected to meet the target. If the College exceeds the target goal by at least 1%, the key indicator is marked with “target achieved.” This status indicates that the indicator target was met.
Santa Monica College Student Equity Plan 2014 5
Equity Summit The committee will host the first annual SMC Equity Summit on January 23, 2015. This all day meeting will focus on:
• Integration of all equity-funded activities with the overarching vision for student equity at SMC • Development of standards, targets, and timelines for each equity performance measure • Development of the evaluation process for all funded projects • Professional development to enhance the impact and success of all equity-funded activities in
Year 1 of the plan
Faculty and staff involved in any of the funded equity projects will attend, as well as members of the committee, and faculty and staff who work directly with target group students. In addition invitations will be extended to department chairs, instructional faculty in target disciplines, counselors, members of the First Year Student work group, and the Associate Dean for Grants and Institutional Development.
Santa Monica College Student Equity Plan 2014 6
Campus-Based Research
Part A. Access
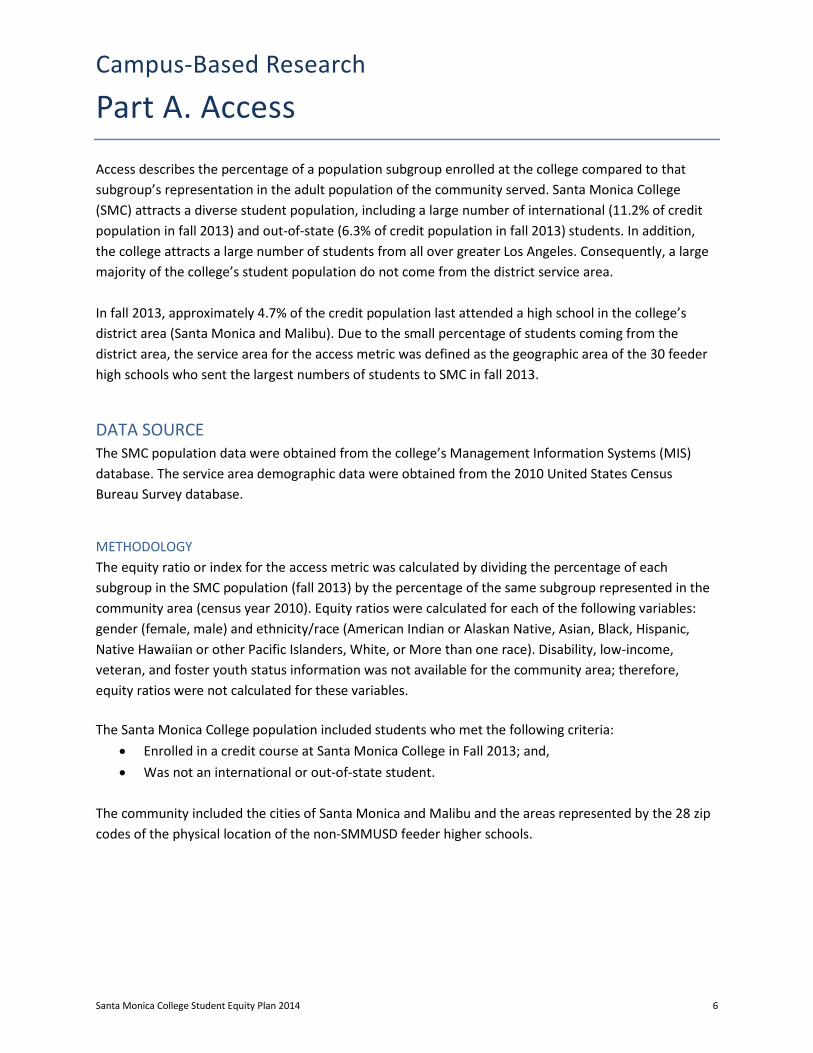
Access describes the percentage of a population subgroup enrolled at the college compared to that subgroup’s representation in the adult population of the community served. Santa Monica College (SMC) attracts a diverse student population, including a large number of international (11.2% of credit population in fall 2013) and out-of-state (6.3% of credit population in fall 2013) students. In addition, the college attracts a large number of students from all over greater Los Angeles. Consequently, a large majority of the college’s student population do not come from the district service area. In fall 2013, approximately 4.7% of the credit population last attended a high school in the college’s district area (Santa Monica and Malibu). Due to the small percentage of students coming from the district area, the service area for the access metric was defined as the geographic area of the 30 feeder high schools who sent the largest numbers of students to SMC in fall 2013.
DATA SOURCE
The SMC population data were obtained from the college’s Management Information Systems (MIS) database. The service area demographic data were obtained from the 2010 United States Census Bureau Survey database.
METHODOLOGY The equity ratio or index for the access metric was calculated by dividing the percentage of each subgroup in the SMC population (fall 2013) by the percentage of the same subgroup represented in the community area (census year 2010). Equity ratios were calculated for each of the following variables: gender (female, male) and ethnicity/race (American Indian or Alaskan Native, Asian, Black, Hispanic, Native Hawaiian or other Pacific Islanders, White, or More than one race). Disability, low-income, veteran, and foster youth status information was not available for the community area; therefore, equity ratios were not calculated for these variables. The Santa Monica College population included students who met the following criteria:
• Enrolled in a credit course at Santa Monica College in Fall 2013; and, • Was not an international or out-of-state student.
The community included the cities of Santa Monica and Malibu and the areas represented by the 28 zip codes of the physical location of the non-SMMUSD feeder higher schools.
Santa Monica College Student Equity Plan 2014 7
DATA AND ANALYSES
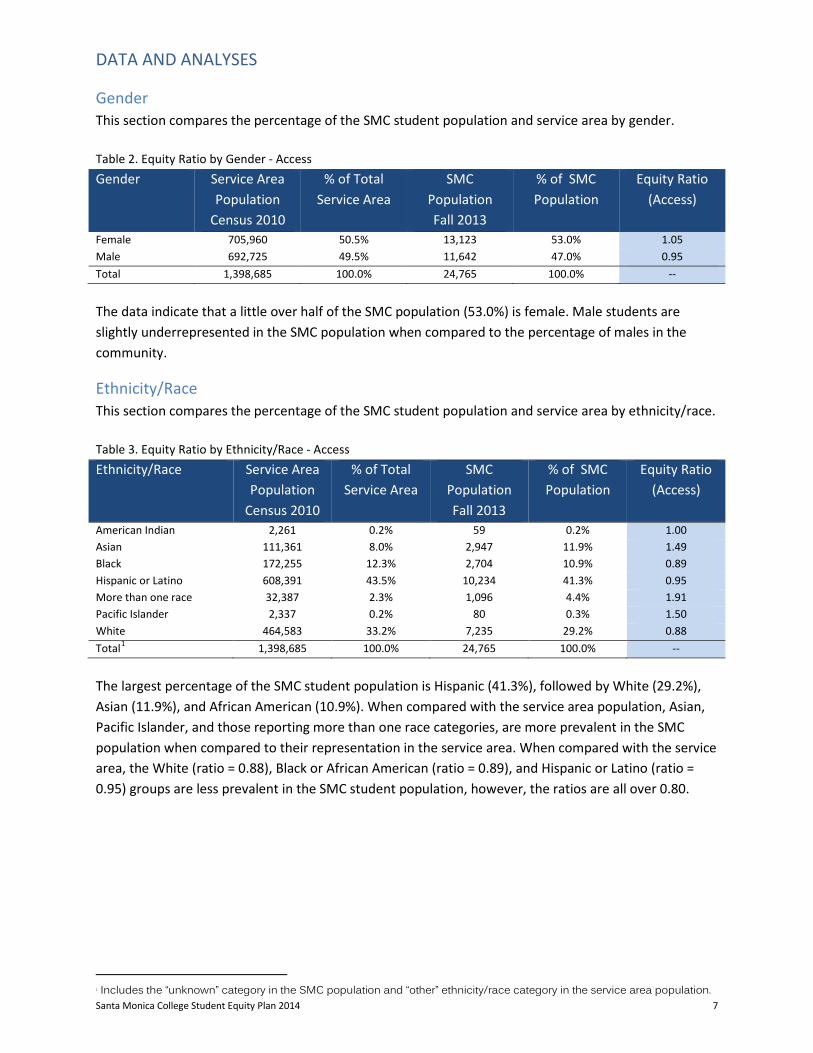
Gender This section compares the percentage of the SMC student population and service area by gender. Table 2. Equity Ratio by Gender - Access Gender Service Area
Population Census 2010
% of Total Service Area
SMC Population Fall 2013
% of SMC Population
Equity Ratio (Access)
Female 705,960 50.5% 13,123 53.0% 1.05 Male 692,725 49.5% 11,642 47.0% 0.95 Total 1,398,685 100.0% 24,765 100.0% -- The data indicate that a little over half of the SMC population (53.0%) is female. Male students are slightly underrepresented in the SMC population when compared to the percentage of males in the community.
Ethnicity/Race This section compares the percentage of the SMC student population and service area by ethnicity/race. Table 3. Equity Ratio by Ethnicity/Race - Access Ethnicity/Race Service Area
Population Census 2010
% of Total Service Area
SMC Population Fall 2013
% of SMC Population
Equity Ratio (Access)
American Indian 2,261 0.2% 59 0.2% 1.00 Asian 111,361 8.0% 2,947 11.9% 1.49 Black 172,255 12.3% 2,704 10.9% 0.89 Hispanic or Latino 608,391 43.5% 10,234 41.3% 0.95 More than one race 32,387 2.3% 1,096 4.4% 1.91 Pacific Islander 2,337 0.2% 80 0.3% 1.50 White 464,583 33.2% 7,235 29.2% 0.88 Total1 1,398,685 100.0% 24,765 100.0% -- The largest percentage of the SMC student population is Hispanic (41.3%), followed by White (29.2%), Asian (11.9%), and African American (10.9%). When compared with the service area population, Asian, Pacific Islander, and those reporting more than one race categories, are more prevalent in the SMC population when compared to their representation in the service area. When compared with the service area, the White (ratio = 0.88), Black or African American (ratio = 0.89), and Hispanic or Latino (ratio = 0.95) groups are less prevalent in the SMC student population, however, the ratios are all over 0.80.
1 Includes the “unknown” category in the SMC population and “other” ethnicity/race category in the service area population.
Santa Monica College Student Equity Plan 2014 8
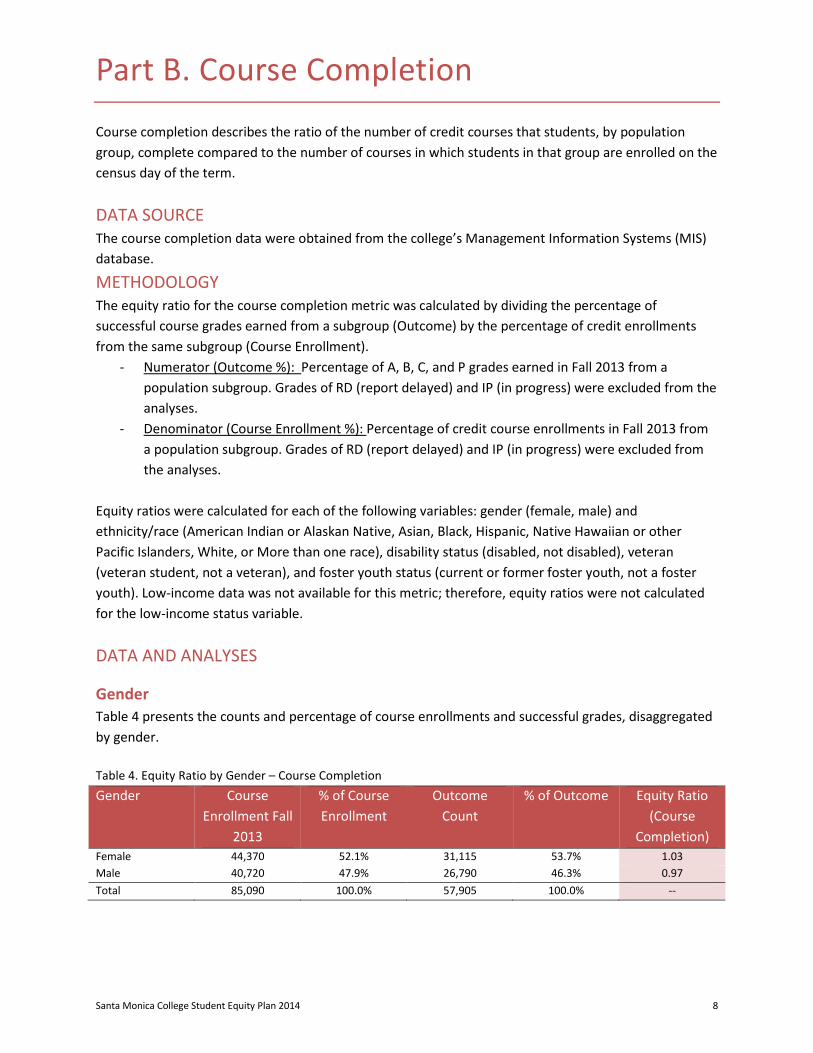
Part B. Course Completion
Course completion describes the ratio of the number of credit courses that students, by population group, complete compared to the number of courses in which students in that group are enrolled on the census day of the term.
DATA SOURCE The course completion data were obtained from the college’s Management Information Systems (MIS) database.
METHODOLOGY The equity ratio for the course completion metric was calculated by dividing the percentage of successful course grades earned from a subgroup (Outcome) by the percentage of credit enrollments from the same subgroup (Course Enrollment).
- Numerator (Outcome %): Percentage of A, B, C, and P grades earned in Fall 2013 from a population subgroup. Grades of RD (report delayed) and IP (in progress) were excluded from the analyses.
- Denominator (Course Enrollment %): Percentage of credit course enrollments in Fall 2013 from a population subgroup. Grades of RD (report delayed) and IP (in progress) were excluded from the analyses.
Equity ratios were calculated for each of the following variables: gender (female, male) and ethnicity/race (American Indian or Alaskan Native, Asian, Black, Hispanic, Native Hawaiian or other Pacific Islanders, White, or More than one race), disability status (disabled, not disabled), veteran (veteran student, not a veteran), and foster youth status (current or former foster youth, not a foster youth). Low-income data was not available for this metric; therefore, equity ratios were not calculated for the low-income status variable.
DATA AND ANALYSES
Gender Table 4 presents the counts and percentage of course enrollments and successful grades, disaggregated by gender. Table 4. Equity Ratio by Gender – Course Completion Gender Course
Enrollment Fall 2013
% of Course Enrollment
Outcome Count
% of Outcome Equity Ratio (Course
Completion) Female 44,370 52.1% 31,115 53.7% 1.03 Male 40,720 47.9% 26,790 46.3% 0.97 Total 85,090 100.0% 57,905 100.0% --
Santa Monica College Student Equity Plan 2014 9
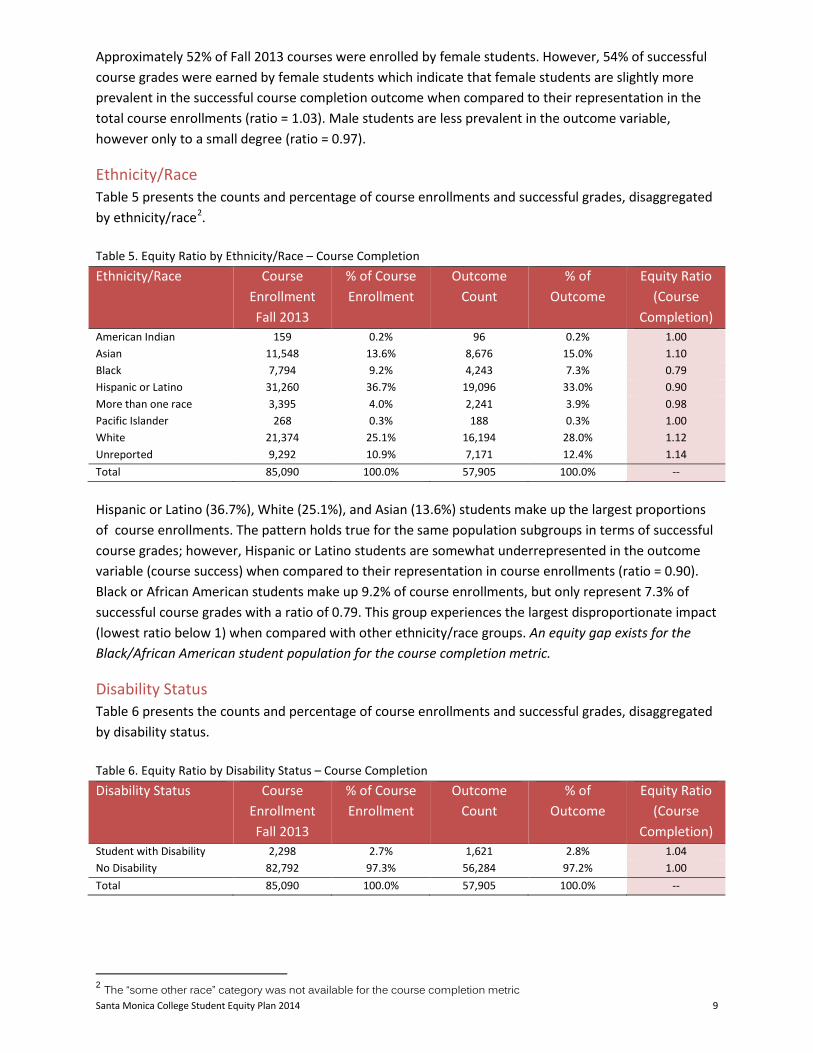
Approximately 52% of Fall 2013 courses were enrolled by female students. However, 54% of successful course grades were earned by female students which indicate that female students are slightly more prevalent in the successful course completion outcome when compared to their representation in the total course enrollments (ratio = 1.03). Male students are less prevalent in the outcome variable, however only to a small degree (ratio = 0.97).
Ethnicity/Race Table 5 presents the counts and percentage of course enrollments and successful grades, disaggregated by ethnicity/race2. Table 5. Equity Ratio by Ethnicity/Race – Course Completion Ethnicity/Race Course
Enrollment Fall 2013
% of Course Enrollment
Outcome Count
% of Outcome
Equity Ratio (Course
Completion) American Indian 159 0.2% 96 0.2% 1.00 Asian 11,548 13.6% 8,676 15.0% 1.10 Black 7,794 9.2% 4,243 7.3% 0.79 Hispanic or Latino 31,260 36.7% 19,096 33.0% 0.90 More than one race 3,395 4.0% 2,241 3.9% 0.98 Pacific Islander 268 0.3% 188 0.3% 1.00 White 21,374 25.1% 16,194 28.0% 1.12 Unreported 9,292 10.9% 7,171 12.4% 1.14 Total 85,090 100.0% 57,905 100.0% -- Hispanic or Latino (36.7%), White (25.1%), and Asian (13.6%) students make up the largest proportions of course enrollments. The pattern holds true for the same population subgroups in terms of successful course grades; however, Hispanic or Latino students are somewhat underrepresented in the outcome variable (course success) when compared to their representation in course enrollments (ratio = 0.90). Black or African American students make up 9.2% of course enrollments, but only represent 7.3% of successful course grades with a ratio of 0.79. This group experiences the largest disproportionate impact (lowest ratio below 1) when compared with other ethnicity/race groups. An equity gap exists for the Black/African American student population for the course completion metric.
Disability Status Table 6 presents the counts and percentage of course enrollments and successful grades, disaggregated by disability status. Table 6. Equity Ratio by Disability Status – Course Completion Disability Status Course
Enrollment Fall 2013
% of Course Enrollment
Outcome Count
% of Outcome
Equity Ratio (Course
Completion) Student with Disability 2,298 2.7% 1,621 2.8% 1.04 No Disability 82,792 97.3% 56,284 97.2% 1.00 Total 85,090 100.0% 57,905 100.0% --
2 The “some other race” category was not available for the course completion metric
Santa Monica College Student Equity Plan 2014 10
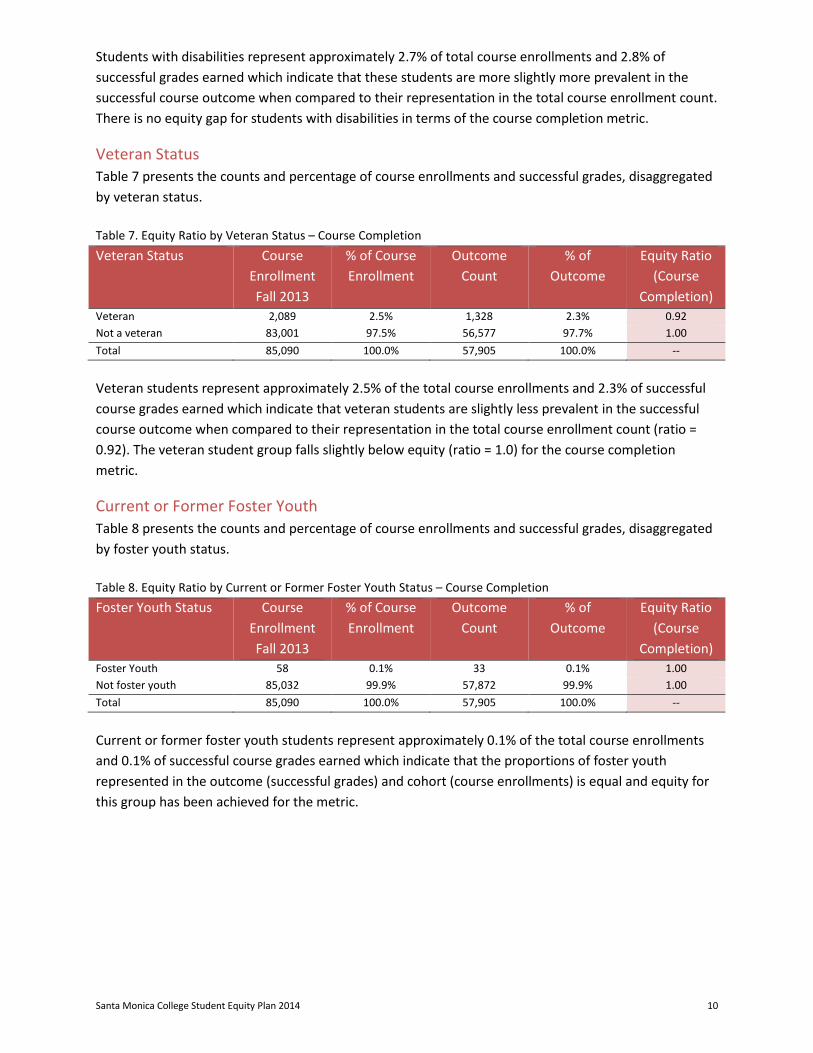
Students with disabilities represent approximately 2.7% of total course enrollments and 2.8% of successful grades earned which indicate that these students are more slightly more prevalent in the successful course outcome when compared to their representation in the total course enrollment count. There is no equity gap for students with disabilities in terms of the course completion metric.
Veteran Status Table 7 presents the counts and percentage of course enrollments and successful grades, disaggregated by veteran status. Table 7. Equity Ratio by Veteran Status – Course Completion Veteran Status Course
Enrollment Fall 2013
% of Course Enrollment
Outcome Count
% of Outcome
Equity Ratio (Course
Completion) Veteran 2,089 2.5% 1,328 2.3% 0.92 Not a veteran 83,001 97.5% 56,577 97.7% 1.00 Total 85,090 100.0% 57,905 100.0% -- Veteran students represent approximately 2.5% of the total course enrollments and 2.3% of successful course grades earned which indicate that veteran students are slightly less prevalent in the successful course outcome when compared to their representation in the total course enrollment count (ratio = 0.92). The veteran student group falls slightly below equity (ratio = 1.0) for the course completion metric.
Current or Former Foster Youth Table 8 presents the counts and percentage of course enrollments and successful grades, disaggregated by foster youth status. Table 8. Equity Ratio by Current or Former Foster Youth Status – Course Completion Foster Youth Status Course
Enrollment Fall 2013
% of Course Enrollment
Outcome Count
% of Outcome
Equity Ratio (Course
Completion) Foster Youth 58 0.1% 33 0.1% 1.00 Not foster youth 85,032 99.9% 57,872 99.9% 1.00 Total 85,090 100.0% 57,905 100.0% -- Current or former foster youth students represent approximately 0.1% of the total course enrollments and 0.1% of successful course grades earned which indicate that the proportions of foster youth represented in the outcome (successful grades) and cohort (course enrollments) is equal and equity for this group has been achieved for the metric.
Santa Monica College Student Equity Plan 2014 11
Part C. ESL and Basic Skills Completion
ESL and basic skills completion describes the ratio of the number of students who complete a degree applicable course by population group, compared to the number of those students who began their sequence of courses in basic skills. While the SMC Student Equity Planning Task Force analyzed and discussed the college’s performance on all five student equity metrics, for the 2014-2015 planning year, the Task Force dug further and examined additional data related to the basic skills English and math completion metrics by ethnicity/race.
DATA SOURCE
The course completion data were obtained from the California Community College Chancellor’s Office Data-on-Demand and the college’s Management Information Systems (MIS) database.
METHODOLOGY
The ESL and basic skills completion ratios were calculated by dividing the percentage of credit basic skills students who complete a degree applicable course in ESL, English, or math course (Outcome) by the percentage of those students who began their course sequence in basic skills (Cohort). The data for each discipline are presented separately. Denominator (Cohort %): Percentage of a population subgroup who met the following criteria:
• Credit student began sequence of ESL, English, or math courses in basic skills in the year 2007-2008;
• First basic skills course in discipline was at least two levels below transfer; and, • Reported a valid Social Security Number (SSN), which excludes international and AB540 students
from the cohort. Numerator (Outcome %): Percentage of population subgroup in the cohort who earned a successful grade (A, B, C, or P) in the degree-applicable ESL, English, or math at any California Community College within six years of the initial basic skills course. Equity ratios were calculated for each of the following variables: gender (female, male) and ethnicity/race (American Indian or Alaskan Native, Asian, Black, Filipino, Hispanic, Native Hawaiian or other Pacific Islanders, or White), disability status (disabled, not disabled), low-income status (low income, not low income). Veteran and foster youth status data were not available for this metric; therefore, equity ratios were not calculated for these variables. In addition, the following data were collected for the basic skills English and math completion metrics: basic skills completion rates by ethnicity/race and beginning course level.
Santa Monica College Student Equity Plan 2014 12
ESL AND BASIC SKILLS COURSE SEQUENCE
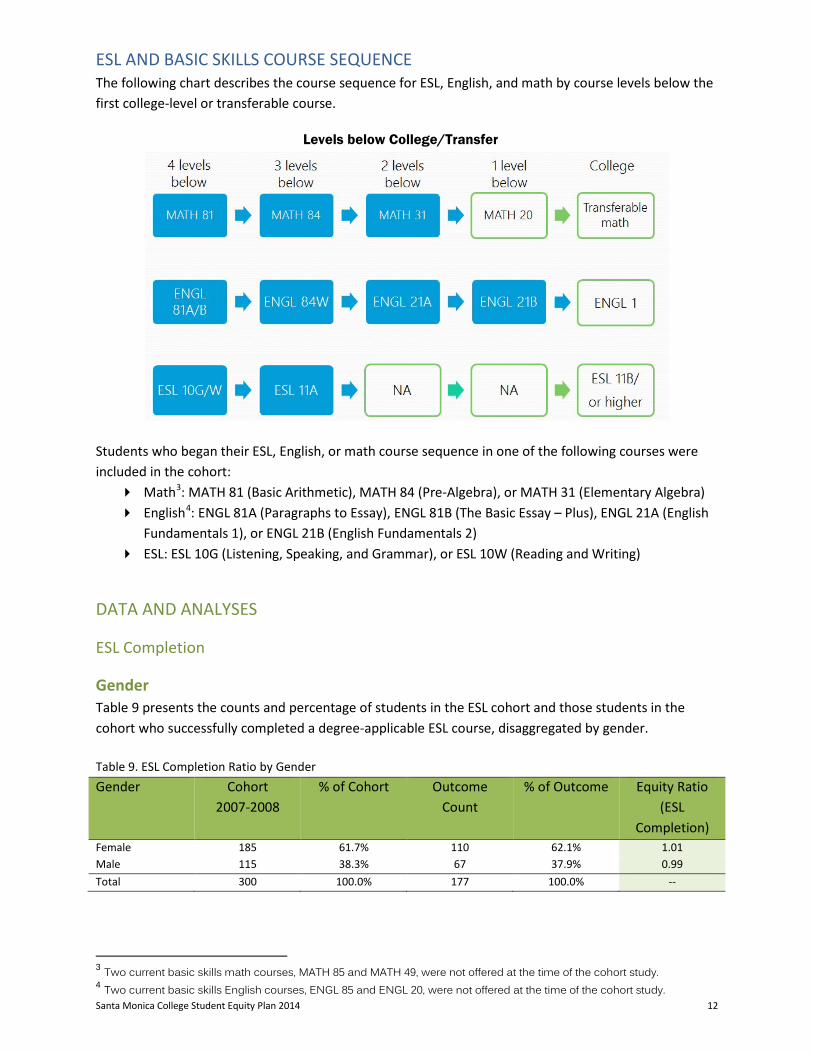
The following chart describes the course sequence for ESL, English, and math by course levels below the first college-level or transferable course.
Students who began their ESL, English, or math course sequence in one of the following courses were included in the cohort: Math3: MATH 81 (Basic Arithmetic), MATH 84 (Pre-Algebra), or MATH 31 (Elementary Algebra) English4: ENGL 81A (Paragraphs to Essay), ENGL 81B (The Basic Essay – Plus), ENGL 21A (English
Fundamentals 1), or ENGL 21B (English Fundamentals 2) ESL: ESL 10G (Listening, Speaking, and Grammar), or ESL 10W (Reading and Writing)
DATA AND ANALYSES
ESL Completion
Gender Table 9 presents the counts and percentage of students in the ESL cohort and those students in the cohort who successfully completed a degree-applicable ESL course, disaggregated by gender. Table 9. ESL Completion Ratio by Gender Gender Cohort
2007-2008 % of Cohort Outcome
Count % of Outcome Equity Ratio
(ESL Completion)
Female 185 61.7% 110 62.1% 1.01 Male 115 38.3% 67 37.9% 0.99 Total 300 100.0% 177 100.0% --
3 Two current basic skills math courses, MATH 85 and MATH 49, were not offered at the time of the cohort study. 4 Two current basic skills English courses, ENGL 85 and ENGL 20, were not offered at the time of the cohort study.
Levels below College/Transfer
Santa Monica College Student Equity Plan 2014 13
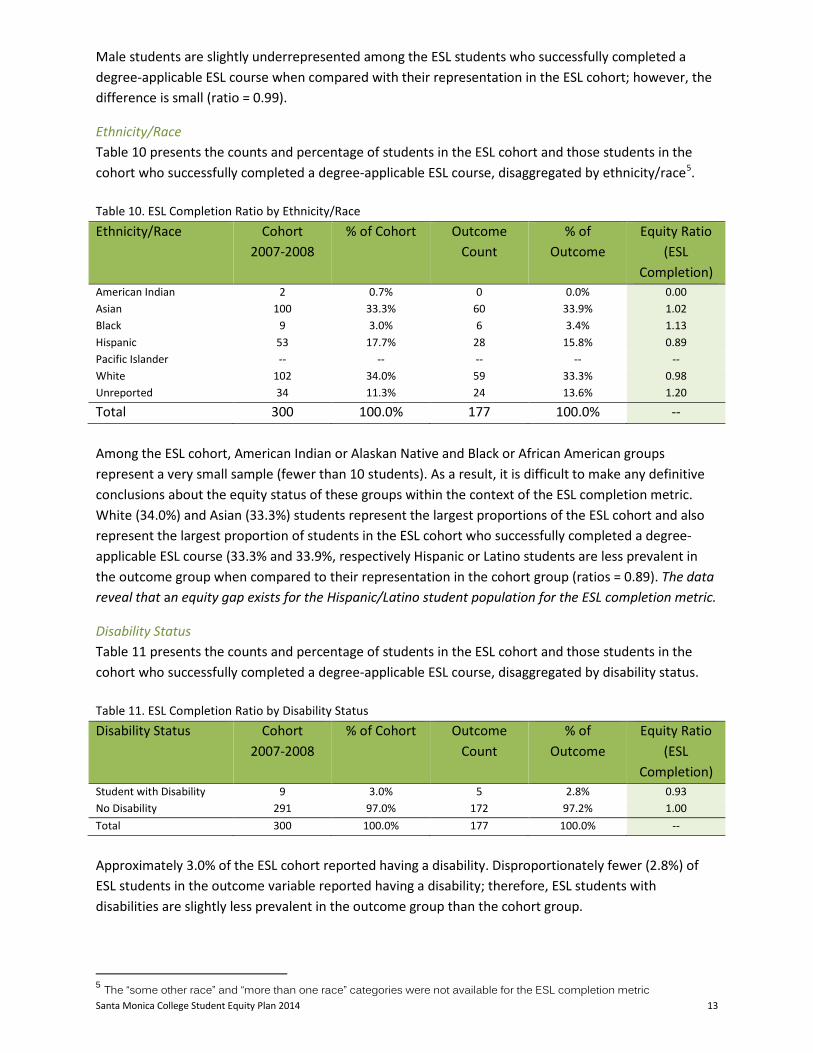
Male students are slightly underrepresented among the ESL students who successfully completed a degree-applicable ESL course when compared with their representation in the ESL cohort; however, the difference is small (ratio = 0.99).
Ethnicity/Race Table 10 presents the counts and percentage of students in the ESL cohort and those students in the cohort who successfully completed a degree-applicable ESL course, disaggregated by ethnicity/race5. Table 10. ESL Completion Ratio by Ethnicity/Race Ethnicity/Race Cohort
2007-2008 % of Cohort Outcome
Count % of
Outcome Equity Ratio
(ESL Completion)
American Indian 2 0.7% 0 0.0% 0.00 Asian 100 33.3% 60 33.9% 1.02 Black 9 3.0% 6 3.4% 1.13 Hispanic 53 17.7% 28 15.8% 0.89 Pacific Islander -- -- -- -- -- White 102 34.0% 59 33.3% 0.98 Unreported 34 11.3% 24 13.6% 1.20
Total 300 100.0% 177 100.0% -- Among the ESL cohort, American Indian or Alaskan Native and Black or African American groups represent a very small sample (fewer than 10 students). As a result, it is difficult to make any definitive conclusions about the equity status of these groups within the context of the ESL completion metric. White (34.0%) and Asian (33.3%) students represent the largest proportions of the ESL cohort and also represent the largest proportion of students in the ESL cohort who successfully completed a degree-applicable ESL course (33.3% and 33.9%, respectively Hispanic or Latino students are less prevalent in the outcome group when compared to their representation in the cohort group (ratios = 0.89). The data reveal that an equity gap exists for the Hispanic/Latino student population for the ESL completion metric.
Disability Status Table 11 presents the counts and percentage of students in the ESL cohort and those students in the cohort who successfully completed a degree-applicable ESL course, disaggregated by disability status. Table 11. ESL Completion Ratio by Disability Status Disability Status Cohort
2007-2008 % of Cohort Outcome
Count % of
Outcome Equity Ratio
(ESL Completion)
Student with Disability 9 3.0% 5 2.8% 0.93 No Disability 291 97.0% 172 97.2% 1.00 Total 300 100.0% 177 100.0% --
Approximately 3.0% of the ESL cohort reported having a disability. Disproportionately fewer (2.8%) of ESL students in the outcome variable reported having a disability; therefore, ESL students with disabilities are slightly less prevalent in the outcome group than the cohort group.
5 The “some other race” and “more than one race” categories were not available for the ESL completion metric
Santa Monica College Student Equity Plan 2014 14
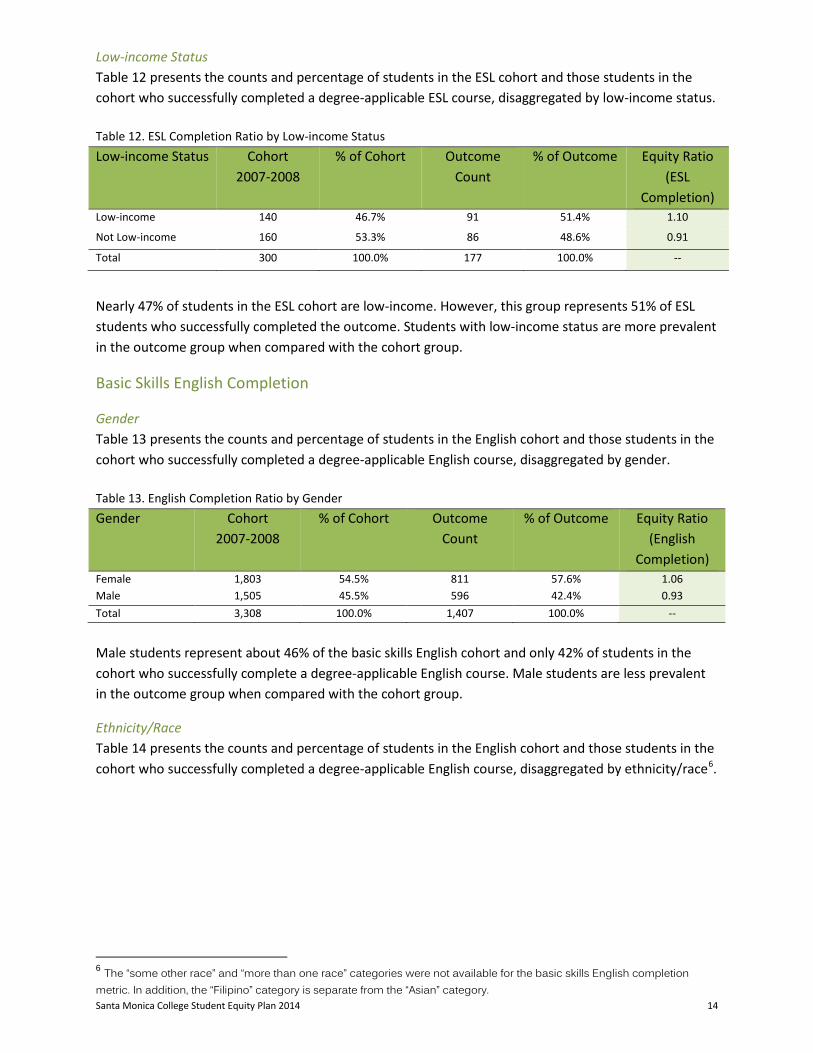
Low-income Status Table 12 presents the counts and percentage of students in the ESL cohort and those students in the cohort who successfully completed a degree-applicable ESL course, disaggregated by low-income status. Table 12. ESL Completion Ratio by Low-income Status
Low-income Status Cohort 2007-2008
% of Cohort Outcome Count
% of Outcome Equity Ratio (ESL
Completion) Low-income 140 46.7% 91 51.4% 1.10
Not Low-income 160 53.3% 86 48.6% 0.91
Total 300 100.0% 177 100.0% --
Nearly 47% of students in the ESL cohort are low-income. However, this group represents 51% of ESL students who successfully completed the outcome. Students with low-income status are more prevalent in the outcome group when compared with the cohort group.
Basic Skills English Completion
Gender Table 13 presents the counts and percentage of students in the English cohort and those students in the cohort who successfully completed a degree-applicable English course, disaggregated by gender. Table 13. English Completion Ratio by Gender Gender Cohort
2007-2008 % of Cohort Outcome
Count % of Outcome Equity Ratio
(English Completion)
Female 1,803 54.5% 811 57.6% 1.06 Male 1,505 45.5% 596 42.4% 0.93 Total 3,308 100.0% 1,407 100.0% --
Male students represent about 46% of the basic skills English cohort and only 42% of students in the cohort who successfully complete a degree-applicable English course. Male students are less prevalent in the outcome group when compared with the cohort group.
Ethnicity/Race Table 14 presents the counts and percentage of students in the English cohort and those students in the cohort who successfully completed a degree-applicable English course, disaggregated by ethnicity/race6.
6 The “some other race” and “more than one race” categories were not available for the basic skills English completion metric. In addition, the “Filipino” category is separate from the “Asian” category.
Santa Monica College Student Equity Plan 2014 15
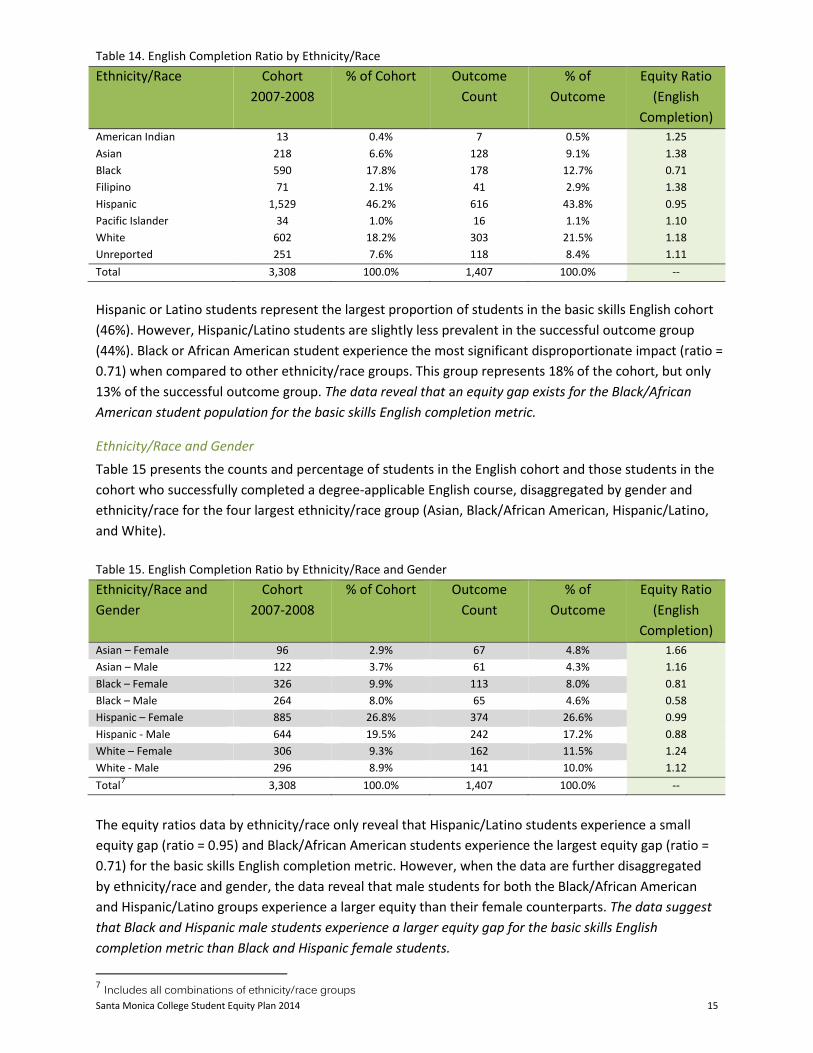
Table 14. English Completion Ratio by Ethnicity/Race
Ethnicity/Race Cohort 2007-2008
% of Cohort Outcome Count
% of Outcome
Equity Ratio (English
Completion) American Indian 13 0.4% 7 0.5% 1.25 Asian 218 6.6% 128 9.1% 1.38 Black 590 17.8% 178 12.7% 0.71 Filipino 71 2.1% 41 2.9% 1.38 Hispanic 1,529 46.2% 616 43.8% 0.95 Pacific Islander 34 1.0% 16 1.1% 1.10 White 602 18.2% 303 21.5% 1.18 Unreported 251 7.6% 118 8.4% 1.11 Total 3,308 100.0% 1,407 100.0% -- Hispanic or Latino students represent the largest proportion of students in the basic skills English cohort (46%). However, Hispanic/Latino students are slightly less prevalent in the successful outcome group (44%). Black or African American student experience the most significant disproportionate impact (ratio = 0.71) when compared to other ethnicity/race groups. This group represents 18% of the cohort, but only 13% of the successful outcome group. The data reveal that an equity gap exists for the Black/African American student population for the basic skills English completion metric.
Ethnicity/Race and Gender Table 15 presents the counts and percentage of students in the English cohort and those students in the cohort who successfully completed a degree-applicable English course, disaggregated by gender and ethnicity/race for the four largest ethnicity/race group (Asian, Black/African American, Hispanic/Latino, and White). Table 15. English Completion Ratio by Ethnicity/Race and Gender Ethnicity/Race and Gender
Cohort 2007-2008
% of Cohort Outcome Count
% of Outcome
Equity Ratio (English
Completion) Asian – Female 96 2.9% 67 4.8% 1.66 Asian – Male 122 3.7% 61 4.3% 1.16 Black – Female 326 9.9% 113 8.0% 0.81 Black – Male 264 8.0% 65 4.6% 0.58 Hispanic – Female 885 26.8% 374 26.6% 0.99 Hispanic - Male 644 19.5% 242 17.2% 0.88 White – Female 306 9.3% 162 11.5% 1.24 White - Male 296 8.9% 141 10.0% 1.12 Total7 3,308 100.0% 1,407 100.0% --
The equity ratios data by ethnicity/race only reveal that Hispanic/Latino students experience a small equity gap (ratio = 0.95) and Black/African American students experience the largest equity gap (ratio = 0.71) for the basic skills English completion metric. However, when the data are further disaggregated by ethnicity/race and gender, the data reveal that male students for both the Black/African American and Hispanic/Latino groups experience a larger equity than their female counterparts. The data suggest that Black and Hispanic male students experience a larger equity gap for the basic skills English completion metric than Black and Hispanic female students.
7 Includes all combinations of ethnicity/race groups
Santa Monica College Student Equity Plan 2014 16
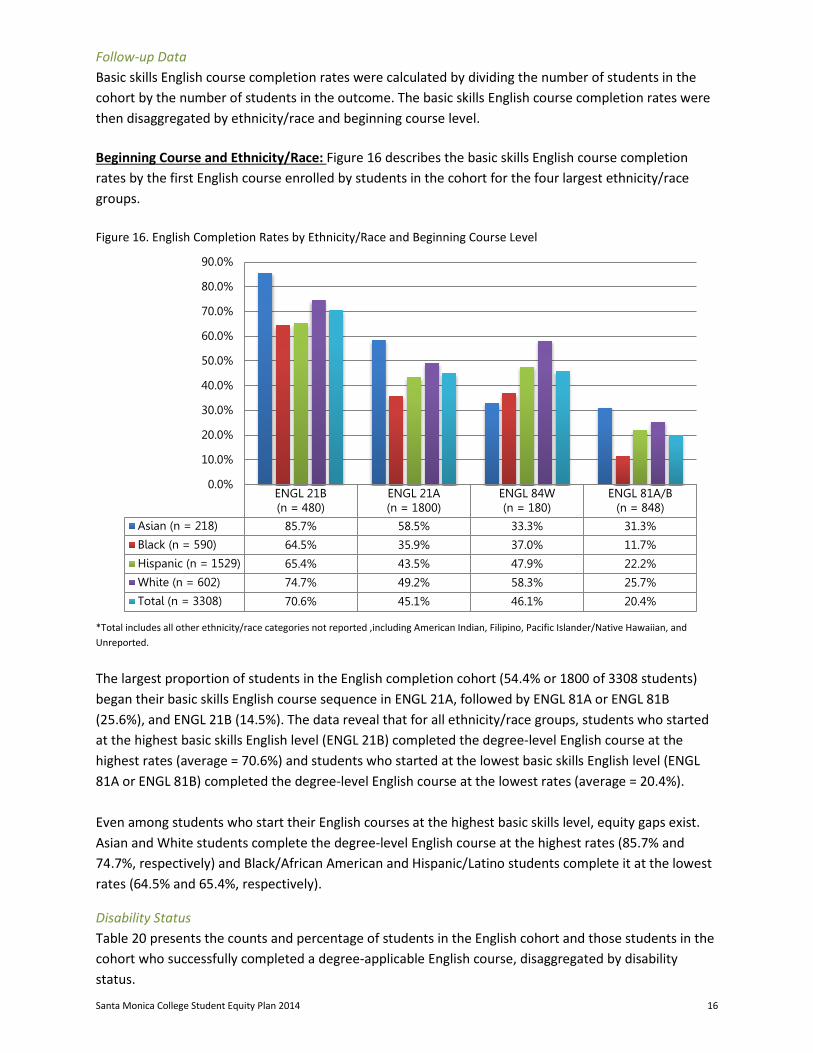
Follow-up Data Basic skills English course completion rates were calculated by dividing the number of students in the cohort by the number of students in the outcome. The basic skills English course completion rates were then disaggregated by ethnicity/race and beginning course level. Beginning Course and Ethnicity/Race: Figure 16 describes the basic skills English course completion rates by the first English course enrolled by students in the cohort for the four largest ethnicity/race groups. Figure 16. English Completion Rates by Ethnicity/Race and Beginning Course Level
*Total includes all other ethnicity/race categories not reported ,including American Indian, Filipino, Pacific Islander/Native Hawaiian, and Unreported.
The largest proportion of students in the English completion cohort (54.4% or 1800 of 3308 students) began their basic skills English course sequence in ENGL 21A, followed by ENGL 81A or ENGL 81B (25.6%), and ENGL 21B (14.5%). The data reveal that for all ethnicity/race groups, students who started at the highest basic skills English level (ENGL 21B) completed the degree-level English course at the highest rates (average = 70.6%) and students who started at the lowest basic skills English level (ENGL 81A or ENGL 81B) completed the degree-level English course at the lowest rates (average = 20.4%). Even among students who start their English courses at the highest basic skills level, equity gaps exist. Asian and White students complete the degree-level English course at the highest rates (85.7% and 74.7%, respectively) and Black/African American and Hispanic/Latino students complete it at the lowest rates (64.5% and 65.4%, respectively).
Disability Status Table 20 presents the counts and percentage of students in the English cohort and those students in the cohort who successfully completed a degree-applicable English course, disaggregated by disability status.
ENGL 21B(n = 480)
ENGL 21A(n = 1800)
ENGL 84W(n = 180)
ENGL 81A/B(n = 848)
Asian (n = 218) 85.7% 58.5% 33.3% 31.3%
Black (n = 590) 64.5% 35.9% 37.0% 11.7%
Hispanic (n = 1529) 65.4% 43.5% 47.9% 22.2%
White (n = 602) 74.7% 49.2% 58.3% 25.7%
Total (n = 3308) 70.6% 45.1% 46.1% 20.4%
0.0%
10.0%
20.0%
30.0%
40.0%
50.0%
60.0%
70.0%
80.0%
90.0%
Santa Monica College Student Equity Plan 2014 17
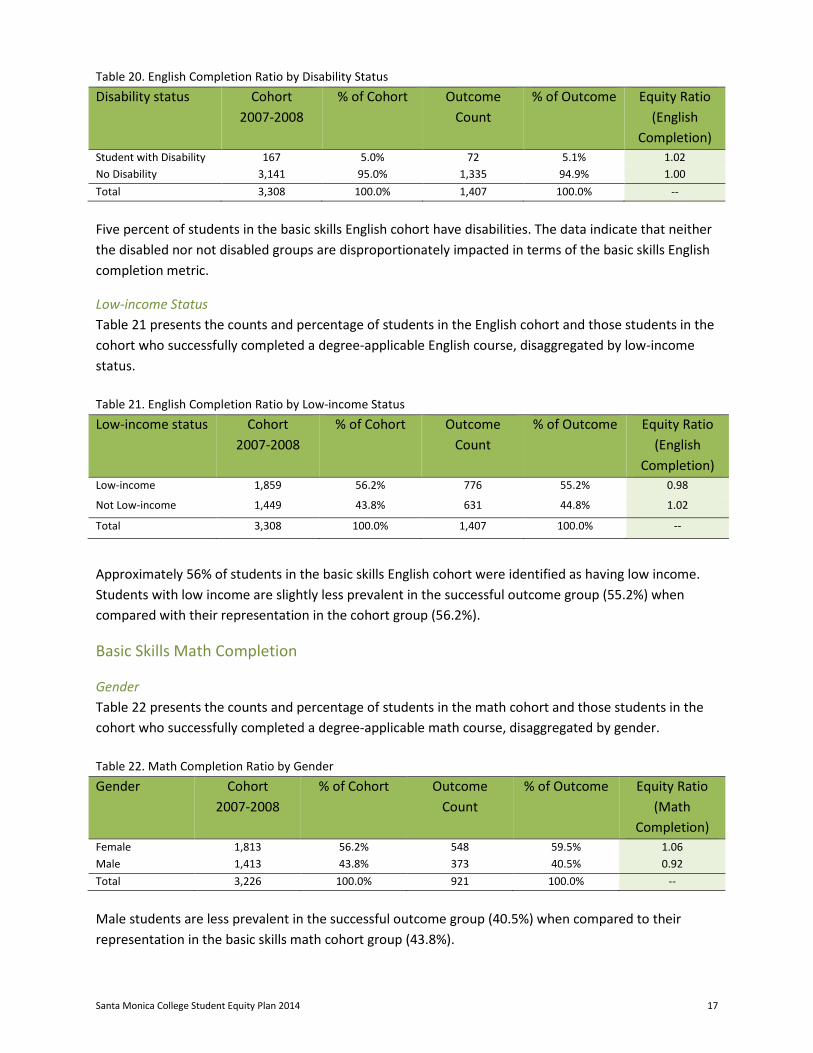
Table 20. English Completion Ratio by Disability Status Disability status Cohort
2007-2008 % of Cohort Outcome
Count % of Outcome Equity Ratio
(English Completion)
Student with Disability 167 5.0% 72 5.1% 1.02 No Disability 3,141 95.0% 1,335 94.9% 1.00 Total 3,308 100.0% 1,407 100.0% -- Five percent of students in the basic skills English cohort have disabilities. The data indicate that neither the disabled nor not disabled groups are disproportionately impacted in terms of the basic skills English completion metric.
Low-income Status Table 21 presents the counts and percentage of students in the English cohort and those students in the cohort who successfully completed a degree-applicable English course, disaggregated by low-income status. Table 21. English Completion Ratio by Low-income Status Low-income status Cohort
2007-2008 % of Cohort Outcome
Count % of Outcome Equity Ratio
(English Completion)
Low-income 1,859 56.2% 776 55.2% 0.98
Not Low-income 1,449 43.8% 631 44.8% 1.02
Total 3,308 100.0% 1,407 100.0% --
Approximately 56% of students in the basic skills English cohort were identified as having low income. Students with low income are slightly less prevalent in the successful outcome group (55.2%) when compared with their representation in the cohort group (56.2%).
Basic Skills Math Completion
Gender Table 22 presents the counts and percentage of students in the math cohort and those students in the cohort who successfully completed a degree-applicable math course, disaggregated by gender. Table 22. Math Completion Ratio by Gender Gender Cohort
2007-2008 % of Cohort Outcome
Count % of Outcome Equity Ratio
(Math Completion)
Female 1,813 56.2% 548 59.5% 1.06 Male 1,413 43.8% 373 40.5% 0.92 Total 3,226 100.0% 921 100.0% -- Male students are less prevalent in the successful outcome group (40.5%) when compared to their representation in the basic skills math cohort group (43.8%).
Santa Monica College Student Equity Plan 2014 18
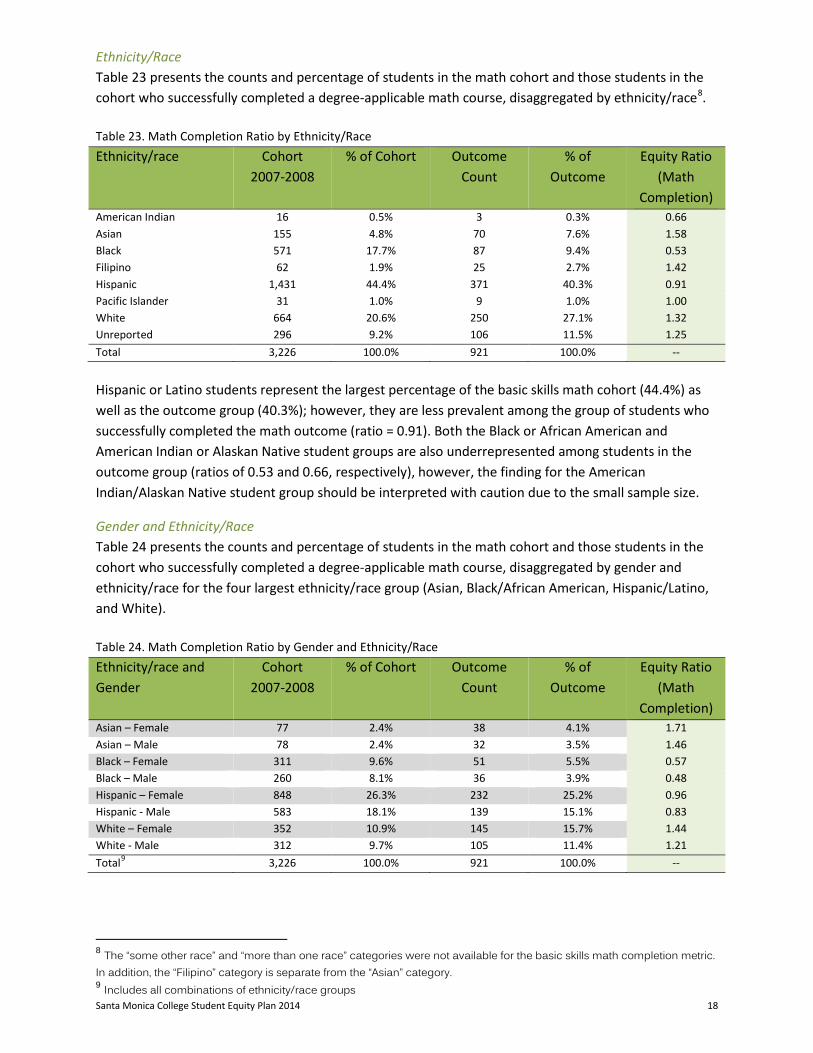
Ethnicity/Race Table 23 presents the counts and percentage of students in the math cohort and those students in the cohort who successfully completed a degree-applicable math course, disaggregated by ethnicity/race8. Table 23. Math Completion Ratio by Ethnicity/Race Ethnicity/race Cohort
2007-2008 % of Cohort Outcome
Count % of
Outcome Equity Ratio
(Math Completion)
American Indian 16 0.5% 3 0.3% 0.66 Asian 155 4.8% 70 7.6% 1.58 Black 571 17.7% 87 9.4% 0.53 Filipino 62 1.9% 25 2.7% 1.42 Hispanic 1,431 44.4% 371 40.3% 0.91 Pacific Islander 31 1.0% 9 1.0% 1.00 White 664 20.6% 250 27.1% 1.32 Unreported 296 9.2% 106 11.5% 1.25 Total 3,226 100.0% 921 100.0% -- Hispanic or Latino students represent the largest percentage of the basic skills math cohort (44.4%) as well as the outcome group (40.3%); however, they are less prevalent among the group of students who successfully completed the math outcome (ratio = 0.91). Both the Black or African American and American Indian or Alaskan Native student groups are also underrepresented among students in the outcome group (ratios of 0.53 and 0.66, respectively), however, the finding for the American Indian/Alaskan Native student group should be interpreted with caution due to the small sample size.
Gender and Ethnicity/Race Table 24 presents the counts and percentage of students in the math cohort and those students in the cohort who successfully completed a degree-applicable math course, disaggregated by gender and ethnicity/race for the four largest ethnicity/race group (Asian, Black/African American, Hispanic/Latino, and White). Table 24. Math Completion Ratio by Gender and Ethnicity/Race Ethnicity/race and Gender
Cohort 2007-2008
% of Cohort Outcome Count
% of Outcome
Equity Ratio (Math
Completion) Asian – Female 77 2.4% 38 4.1% 1.71 Asian – Male 78 2.4% 32 3.5% 1.46 Black – Female 311 9.6% 51 5.5% 0.57 Black – Male 260 8.1% 36 3.9% 0.48 Hispanic – Female 848 26.3% 232 25.2% 0.96 Hispanic - Male 583 18.1% 139 15.1% 0.83 White – Female 352 10.9% 145 15.7% 1.44 White - Male 312 9.7% 105 11.4% 1.21 Total9 3,226 100.0% 921 100.0% --
8 The “some other race” and “more than one race” categories were not available for the basic skills math completion metric. In addition, the “Filipino” category is separate from the “Asian” category. 9 Includes all combinations of ethnicity/race groups
Santa Monica College Student Equity Plan 2014 19
The equity ratios data by ethnicity/race only reveal that Hispanic/Latino students experience a small equity gap (ratio = 0.91) and Black/African American students experience the largest equity gap (ratio = 0.53) for the basic skills math completion metric. However, when the data are further disaggregated by ethnicity/race and gender, the data reveal that male students for both the Hispanic/Latino and Black/African American group experience a larger equity than their female counterparts. The data suggest that Black and Hispanic male students experience a larger equity gap for the basic skills math completion metric than Black and Hispanic female students.
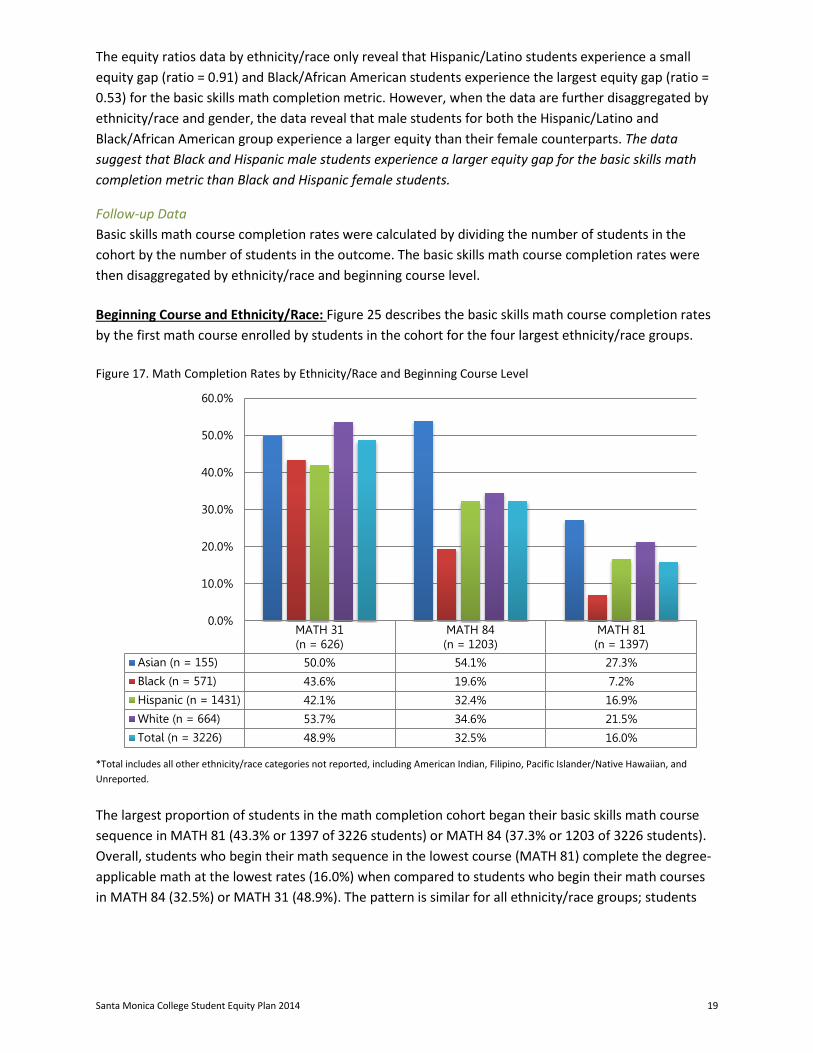
Follow-up Data Basic skills math course completion rates were calculated by dividing the number of students in the cohort by the number of students in the outcome. The basic skills math course completion rates were then disaggregated by ethnicity/race and beginning course level. Beginning Course and Ethnicity/Race: Figure 25 describes the basic skills math course completion rates by the first math course enrolled by students in the cohort for the four largest ethnicity/race groups. Figure 17. Math Completion Rates by Ethnicity/Race and Beginning Course Level
*Total includes all other ethnicity/race categories not reported, including American Indian, Filipino, Pacific Islander/Native Hawaiian, and Unreported.
The largest proportion of students in the math completion cohort began their basic skills math course sequence in MATH 81 (43.3% or 1397 of 3226 students) or MATH 84 (37.3% or 1203 of 3226 students). Overall, students who begin their math sequence in the lowest course (MATH 81) complete the degree-applicable math at the lowest rates (16.0%) when compared to students who begin their math courses in MATH 84 (32.5%) or MATH 31 (48.9%). The pattern is similar for all ethnicity/race groups; students
MATH 31(n = 626)
MATH 84(n = 1203)
MATH 81(n = 1397)
Asian (n = 155) 50.0% 54.1% 27.3%
Black (n = 571) 43.6% 19.6% 7.2%
Hispanic (n = 1431) 42.1% 32.4% 16.9%
White (n = 664) 53.7% 34.6% 21.5%
Total (n = 3226) 48.9% 32.5% 16.0%
0.0%
10.0%
20.0%
30.0%
40.0%
50.0%
60.0%
Santa Monica College Student Equity Plan 2014 20
who start in the lowest math course have the lowest math completion rate than students who start in higher-level courses. Even among students who start their math sequence in the highest basic math course, an equity gap exists for the Black and Hispanic students; these groups complete the degree-applicable math course at lower rates (43.6% and 42.1%, respectively) when compared to the Asian and White students (50.0% and 53.7%, respectively).
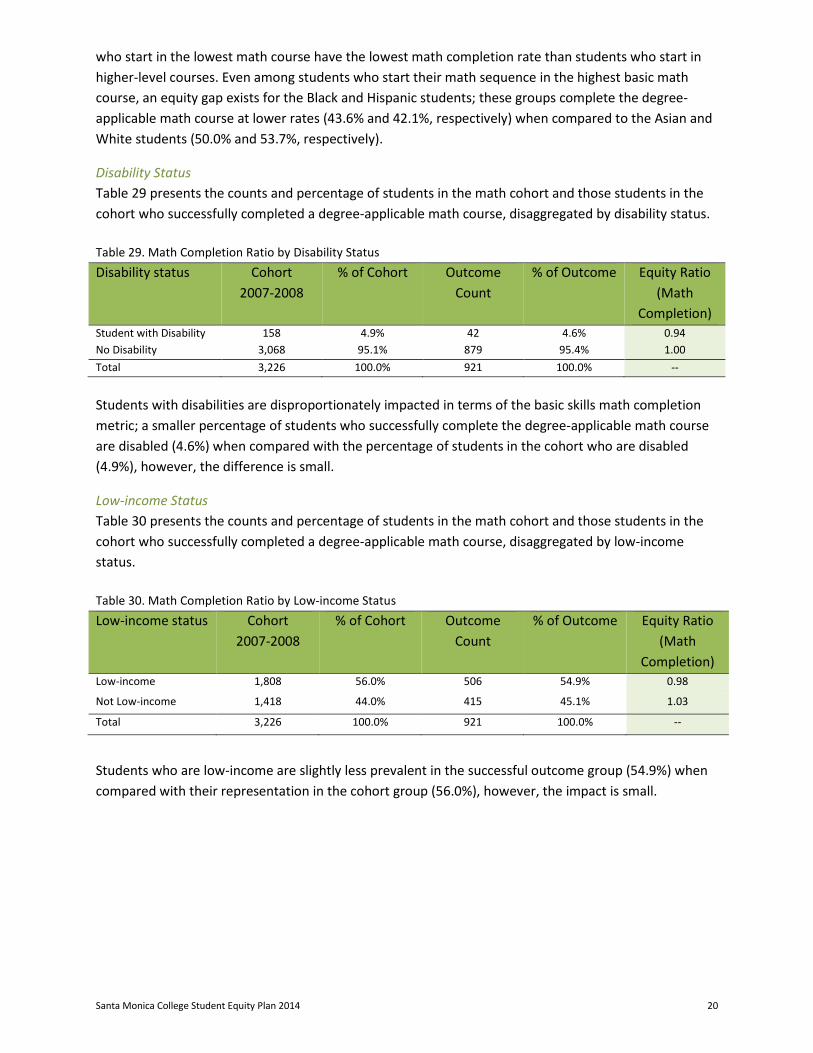
Disability Status Table 29 presents the counts and percentage of students in the math cohort and those students in the cohort who successfully completed a degree-applicable math course, disaggregated by disability status. Table 29. Math Completion Ratio by Disability Status Disability status Cohort
2007-2008 % of Cohort Outcome
Count % of Outcome Equity Ratio
(Math Completion)
Student with Disability 158 4.9% 42 4.6% 0.94 No Disability 3,068 95.1% 879 95.4% 1.00 Total 3,226 100.0% 921 100.0% -- Students with disabilities are disproportionately impacted in terms of the basic skills math completion metric; a smaller percentage of students who successfully complete the degree-applicable math course are disabled (4.6%) when compared with the percentage of students in the cohort who are disabled (4.9%), however, the difference is small.
Low-income Status Table 30 presents the counts and percentage of students in the math cohort and those students in the cohort who successfully completed a degree-applicable math course, disaggregated by low-income status. Table 30. Math Completion Ratio by Low-income Status Low-income status Cohort
2007-2008 % of Cohort Outcome
Count % of Outcome Equity Ratio
(Math Completion)
Low-income 1,808 56.0% 506 54.9% 0.98
Not Low-income 1,418 44.0% 415 45.1% 1.03
Total 3,226 100.0% 921 100.0% --
Students who are low-income are slightly less prevalent in the successful outcome group (54.9%) when compared with their representation in the cohort group (56.0%), however, the impact is small.
Santa Monica College Student Equity Plan 2014 21
Part D. Degree and Certificate Completion Degree and certificate completion describes the ratio of the number of CTE students who achieve an award or transferred to a four-year institution to the number of those students who showed intent to earn an award or transfer by population group.
DATA SOURCE The course completion data were obtained from the California Community College Chancellor’s Office Data-on-Demand.
METHODOLOGY The degree and certificate completion ratio was calculated by dividing the percentage of credit students who achieved a credential or transfer outcome (Outcome) by the percentage of those students who completed CTE courses. Denominator (Cohort %): Percentage of a population subgroup who met the following criteria:
• Attempted a credit CTE course for the first time in the year 2007-2008; • Completed (with a grade of D or better) more than 8 units in a single CTE discipline (defined by
2-digit vocational TOP code) within three years of the initial CTE course; • At least one of the CTE courses were defined as “clearly occupational” or “advanced
occupational”; and, • Reported a valid Social Security Number (SSN), which excludes international and AB540 students
from the cohort. Numerator (Outcome %): Percentage of population subgroup in the cohort who achieved one or more of the following outcomes within six years of the initial CTE course:
• Earned a certificate of achievement or associate degree at any California Community College; • Became transfer-prepared (earned 60 or more UC/CSU transferable units with a GPA of 2.0 or
greater); and/or, • Transferred to a four-year institution.
Equity ratios were calculated for each of the following variables: gender (female, male) and ethnicity/race (American Indian or Alaskan Native, Asian, Black, Hispanic, Native Hawaiian or other Pacific Islanders, White, or More than one race), disability status (disabled, not disabled), and low-income status (low income, not low income). Veteran and foster youth status data were not available for this metric; therefore, equity ratios were not calculated for these two variables.
Santa Monica College Student Equity Plan 2014 22
DATA AND ANALYSES
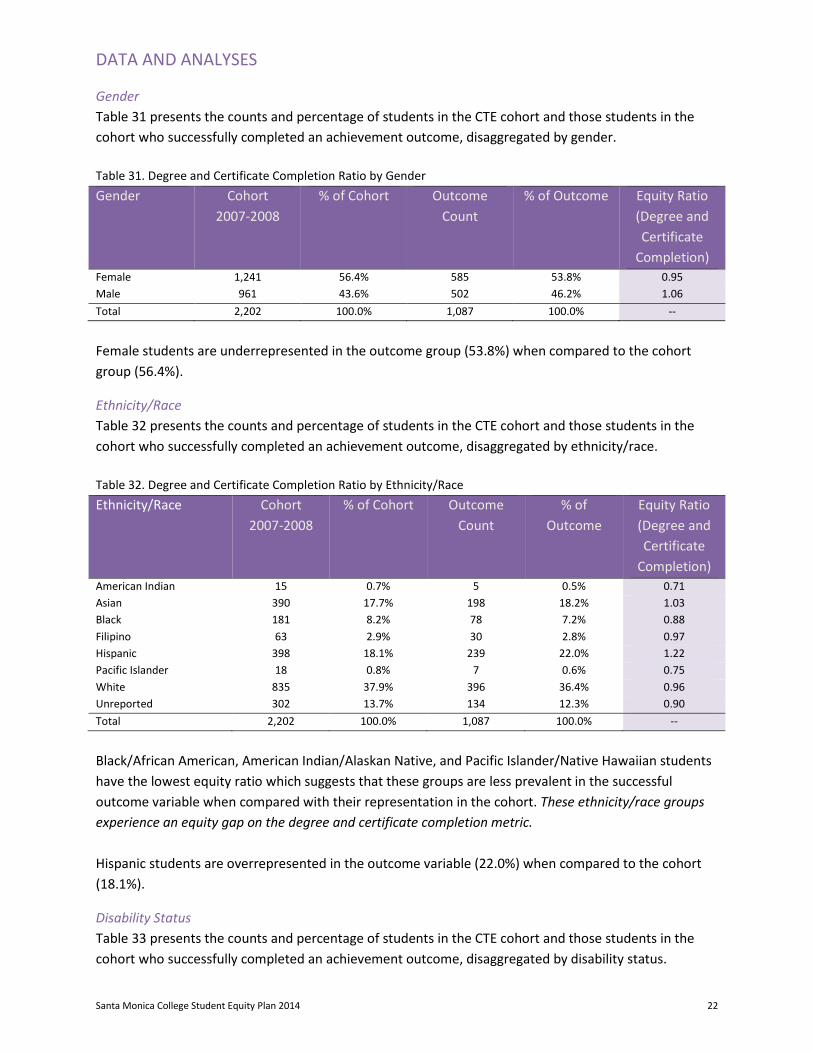
Gender Table 31 presents the counts and percentage of students in the CTE cohort and those students in the cohort who successfully completed an achievement outcome, disaggregated by gender. Table 31. Degree and Certificate Completion Ratio by Gender Gender Cohort
2007-2008 % of Cohort Outcome
Count % of Outcome Equity Ratio
(Degree and Certificate
Completion) Female 1,241 56.4% 585 53.8% 0.95 Male 961 43.6% 502 46.2% 1.06 Total 2,202 100.0% 1,087 100.0% --
Female students are underrepresented in the outcome group (53.8%) when compared to the cohort group (56.4%).
Ethnicity/Race Table 32 presents the counts and percentage of students in the CTE cohort and those students in the cohort who successfully completed an achievement outcome, disaggregated by ethnicity/race. Table 32. Degree and Certificate Completion Ratio by Ethnicity/Race Ethnicity/Race Cohort
2007-2008 % of Cohort Outcome
Count % of
Outcome Equity Ratio (Degree and Certificate
Completion) American Indian 15 0.7% 5 0.5% 0.71 Asian 390 17.7% 198 18.2% 1.03 Black 181 8.2% 78 7.2% 0.88 Filipino 63 2.9% 30 2.8% 0.97 Hispanic 398 18.1% 239 22.0% 1.22 Pacific Islander 18 0.8% 7 0.6% 0.75 White 835 37.9% 396 36.4% 0.96 Unreported 302 13.7% 134 12.3% 0.90 Total 2,202 100.0% 1,087 100.0% --
Black/African American, American Indian/Alaskan Native, and Pacific Islander/Native Hawaiian students have the lowest equity ratio which suggests that these groups are less prevalent in the successful outcome variable when compared with their representation in the cohort. These ethnicity/race groups experience an equity gap on the degree and certificate completion metric. Hispanic students are overrepresented in the outcome variable (22.0%) when compared to the cohort (18.1%).
Disability Status Table 33 presents the counts and percentage of students in the CTE cohort and those students in the cohort who successfully completed an achievement outcome, disaggregated by disability status.
Santa Monica College Student Equity Plan 2014 23
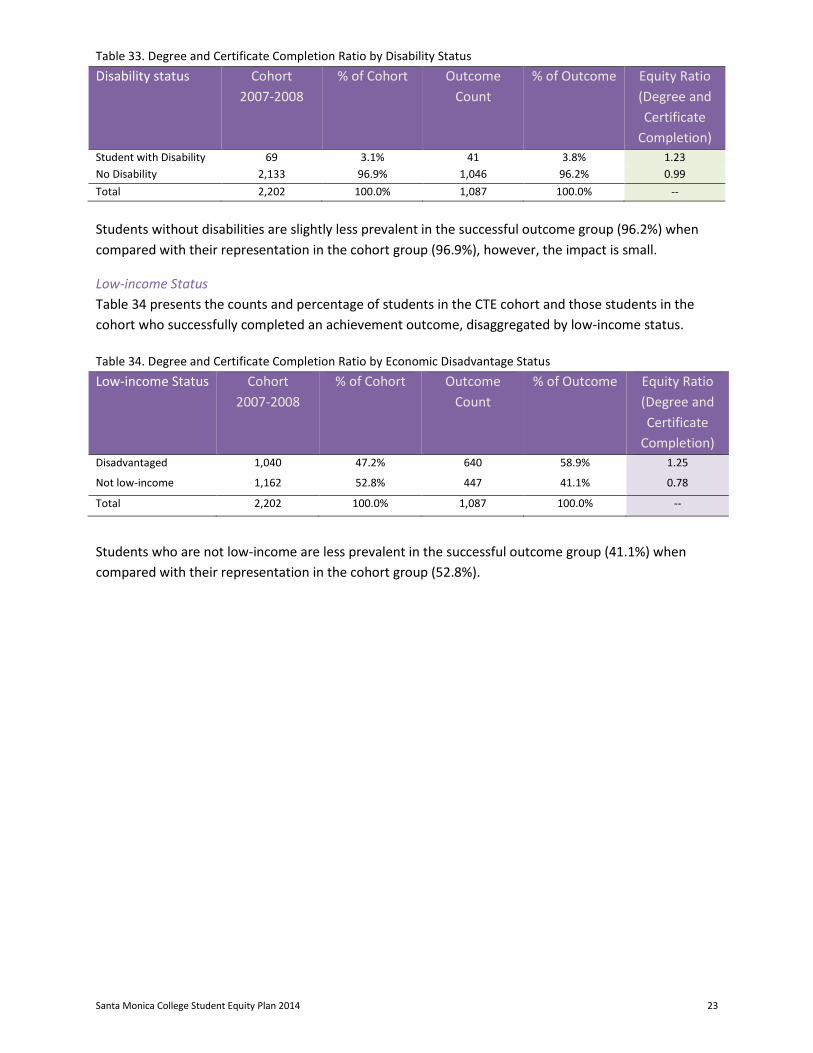
Table 33. Degree and Certificate Completion Ratio by Disability Status Disability status Cohort
2007-2008 % of Cohort Outcome
Count % of Outcome Equity Ratio
(Degree and Certificate
Completion) Student with Disability 69 3.1% 41 3.8% 1.23 No Disability 2,133 96.9% 1,046 96.2% 0.99 Total 2,202 100.0% 1,087 100.0% -- Students without disabilities are slightly less prevalent in the successful outcome group (96.2%) when compared with their representation in the cohort group (96.9%), however, the impact is small.
Low-income Status Table 34 presents the counts and percentage of students in the CTE cohort and those students in the cohort who successfully completed an achievement outcome, disaggregated by low-income status. Table 34. Degree and Certificate Completion Ratio by Economic Disadvantage Status Low-income Status Cohort
2007-2008 % of Cohort Outcome
Count % of Outcome Equity Ratio
(Degree and Certificate
Completion) Disadvantaged 1,040 47.2% 640 58.9% 1.25
Not low-income 1,162 52.8% 447 41.1% 0.78
Total 2,202 100.0% 1,087 100.0% --
Students who are not low-income are less prevalent in the successful outcome group (41.1%) when compared with their representation in the cohort group (52.8%).
Santa Monica College Student Equity Plan 2014 24
Part E. Transfer Transfer describes the ratio of the number of first-time students who transferred to a four-year institution to the number of those students who showed intent to transfer by population group.
DATA SOURCE The course completion data were obtained from the California Community College Chancellor’s Office Data Mart.
METHODOLOGY
The transfer ratio was calculated by dividing the percentage of first-time students who transferred to a four-year institution (Outcome) by the percentage of those students who showed intent to transfer. Denominator (Cohort %): Percentage of a population subgroup who met the following criteria:
• First-time freshmen in the year 2007-2008; • Completed 12 or more credit units (with a grade of D or better) at any California Community
College (CCC) within six years; • Completed the largest proportion of credit units at SMC (regardless of whether they began their
postsecondary education at SMC or another CCC; • Attempted a transfer-level math and/or English course; and, • Reported a valid Social Security Number (SSN), which excludes international and AB540 students
from the cohort. Numerator (Outcome %): Percentage of population subgroup in the cohort who transferred to a four-year institution within six years of entry into the CCC system. Equity ratios were calculated for each of the following variables: gender (female, male) and ethnicity/race (American Indian or Alaskan Native, Asian, Black, Hispanic, Native Hawaiian or other Pacific Islanders, White, or More than one race), and disability status (disabled, not disabled). Veteran, foster youth, and low-income status data were not available for this metric; therefore, equity ratios were not calculated for these variables.
DATA AND ANALYSES
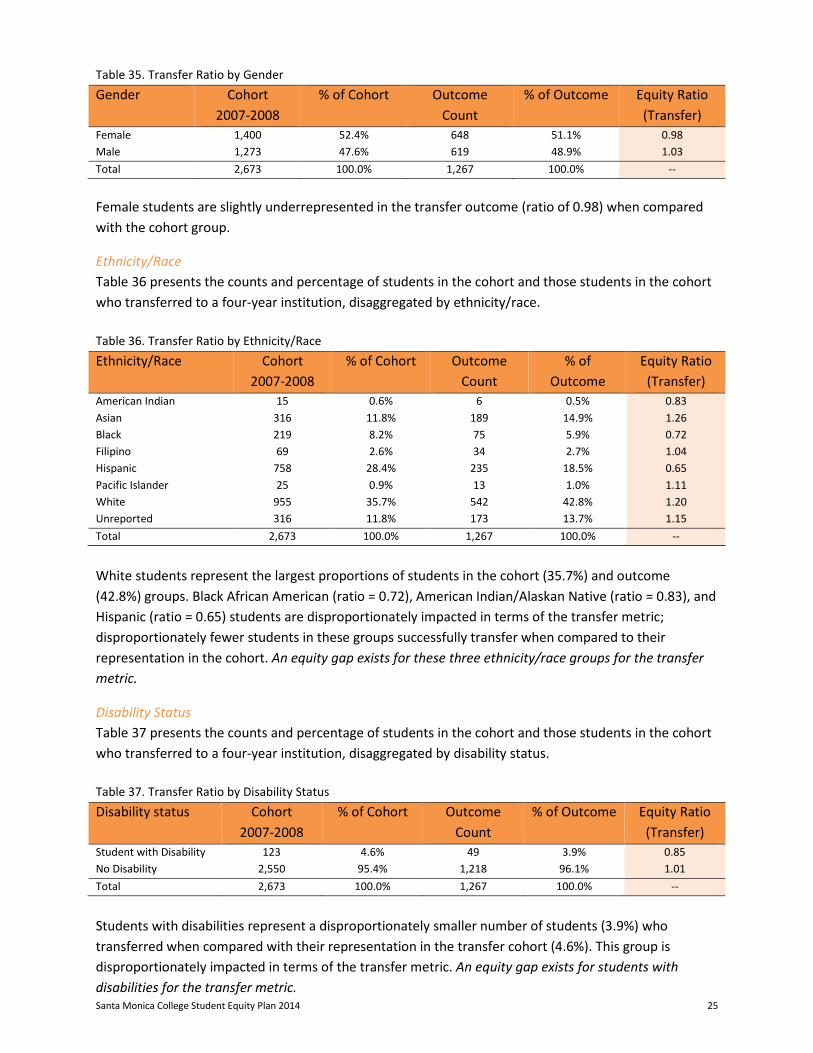
Gender Table 35 presents the counts and percentage of students in the cohort and those students in the cohort who transferred to a four-year institution, disaggregated by gender.
Santa Monica College Student Equity Plan 2014 25
Table 35. Transfer Ratio by Gender Gender Cohort
2007-2008 % of Cohort Outcome
Count % of Outcome Equity Ratio
(Transfer) Female 1,400 52.4% 648 51.1% 0.98 Male 1,273 47.6% 619 48.9% 1.03 Total 2,673 100.0% 1,267 100.0% -- Female students are slightly underrepresented in the transfer outcome (ratio of 0.98) when compared with the cohort group.
Ethnicity/Race Table 36 presents the counts and percentage of students in the cohort and those students in the cohort who transferred to a four-year institution, disaggregated by ethnicity/race. Table 36. Transfer Ratio by Ethnicity/Race Ethnicity/Race Cohort
2007-2008 % of Cohort Outcome
Count % of
Outcome Equity Ratio
(Transfer) American Indian 15 0.6% 6 0.5% 0.83 Asian 316 11.8% 189 14.9% 1.26 Black 219 8.2% 75 5.9% 0.72 Filipino 69 2.6% 34 2.7% 1.04 Hispanic 758 28.4% 235 18.5% 0.65 Pacific Islander 25 0.9% 13 1.0% 1.11 White 955 35.7% 542 42.8% 1.20 Unreported 316 11.8% 173 13.7% 1.15 Total 2,673 100.0% 1,267 100.0% --
White students represent the largest proportions of students in the cohort (35.7%) and outcome (42.8%) groups. Black African American (ratio = 0.72), American Indian/Alaskan Native (ratio = 0.83), and Hispanic (ratio = 0.65) students are disproportionately impacted in terms of the transfer metric; disproportionately fewer students in these groups successfully transfer when compared to their representation in the cohort. An equity gap exists for these three ethnicity/race groups for the transfer metric.
Disability Status Table 37 presents the counts and percentage of students in the cohort and those students in the cohort who transferred to a four-year institution, disaggregated by disability status. Table 37. Transfer Ratio by Disability Status Disability status Cohort
2007-2008 % of Cohort Outcome
Count % of Outcome Equity Ratio
(Transfer) Student with Disability 123 4.6% 49 3.9% 0.85 No Disability 2,550 95.4% 1,218 96.1% 1.01 Total 2,673 100.0% 1,267 100.0% --
Students with disabilities represent a disproportionately smaller number of students (3.9%) who transferred when compared with their representation in the transfer cohort (4.6%). This group is disproportionately impacted in terms of the transfer metric. An equity gap exists for students with disabilities for the transfer metric.
Santa Monica College Student Equity Plan 2014 26
Goals and Activities
A. Access As explained in the campus-based research section of this report, Santa Monica College (SMC) enrolls students from across the Los Angeles region, with the majority of our students coming from outside the Santa Monica/Malibu school district. Thus the service area for the access indicator was defined as the geographic area of the 30 high schools that sent the most students to SMC.
African American and White students were slightly underrepresented in SMC’s student population with an equity index of 0.89 and 0.88 respectively. Hispanic/Latino(a) students and male students had an equity index of 0.95. Although these numbers are respectable, SMC plans to utilize the equity plan to enhance our outreach and support program’s ability to target these groups specifically.
Access Goals SMC’s goal in the access indicator is to maintain a student body that is reflective of the race/ethnicity of high school graduates in the Los Angeles region and to reach equity for all groups. In addition to access to the college generally, we have conceptualized this indicator to include access to programs and services at the college that offer special services or opportunities for our students.
• Improve identifying and access for foster youth. • Improve identification of Veterans in need of Disabled Student Programs and Services (DSPS)
and access to those services. • Improve access to Disabled Student Programs and Services (DSPS) services overall. • Improve access to technical majors for basic skills students.
Activities
I. Research and Inquiry
Equity-Funded Initiatives • Minority Male Community College Collaborative (M2C3): SMC will engage Dr. Frank Harris Co-
Director of the Minority Male Community College Collaborative at San Diego State University at both an institutional and departmental level. At the institutional level, SMC will contract with Dr. Frank Harris to conduct the Community College Survey of Men (CCSM), a comprehensive instrument for assessing the needs of men of color in community colleges. In addition he will conduct focus groups with all involved constituents (students, faculty) and deliver follow up professional development for faculty campus wide as well as for the Math department specifically. This project will inform all indicators of the SMC Student Equity Plan.
Santa Monica College Student Equity Plan 2014 27
• Equity Research Analyst: SMC will hire a Research Analyst to assist the Equity Plan Task Force
and research/inquiry committees with identifying baseline data for equity performance measures, determining standards for achievement, and conducting a variety of inquiry projects. The analyst will work with pilot projects to determine efficacy and sustainability of efforts to close identified equity gaps.
II. Intervention and Student Support
Ongoing Institutional Activities SMC has a strong Outreach department in the division of Enrollment Development and robust student support programs in the divisions of Student and Academic Affairs. SMC’s sustained outreach and student support efforts are designed to help students from all backgrounds obtain a sense of belonging on campus.
To increase the engagement of students from underserved subgroups, Outreach is collaborating with the Welcome Center to respond to recommendations from the First Year Student Workgroup which was formed as a result of SSSP. The aim of the group is to identify which students are not utilizing student services aimed at first year students in order to insure we improve access. These are services proven to improve student outcomes.
SMC’s commitment to creating a supportive environment for ALL students is demonstrated by sponsoring the following ongoing, institution- or categorical/grant-funded outreach and orientation activities:
• Pico Promise Transfer Academy is a collaborative program established with the City of Santa Monica to provide academic, career, and wellness counseling; assistance with enrollment and early registration, FAFSA, scholarship research, textbook vouchers; Northern and Southern California College tours. This program targets low income students.
• VIP Welcome Day: A campus-wide orientation day and resource fair designed to introduce first year students to SMC campus resources and services.
• The Welcome Center: The Welcome Center is a one-stop shop for new students, which eases student transition to the college. Enrollment, counseling, and financial aid are all available at the Welcome Center for students to get started on the right foot.
• CTE LA HI-TECH Grant: Development of high school partnerships to connect students to career pathways.
• High school Programs: o High School Articulation Agreements in a variety of disciplines o Young Collegians: Collaborative program between SMC and the Santa Monica-Malibu
Unified School District (SMMUSD) aimed at improving college-going rates. The program gives high school students the opportunity to participate in college courses at SMC beginning in the summer after their freshman high school year and to continue enrolling in courses each subsequent summer until they graduate.
o Concurrent enrollment: The High School Concurrent Enrollment program allows high school students to take college level courses on the Santa Monica College campus.
o Upward Bound: Assists High school students in developing skills to succeed in high school and ultimately in college.
Santa Monica College Student Equity Plan 2014 28
• First Year Experience: The First Year Experience (FYE) program is a student success program for where participating students receive guaranteed English and Math classes for the year by participating in a mandatory orientation and follow-up workshops.
• Summer Jams: Summer Jams is a bridge program that helps first time college students with their transition from high school into college. Selected students will participate in 10 days of fun, dynamic activities designed to strengthen reading, writing, math and study skills for a head start toward a college degree or career certification.
• STEM Skills: High school and current SMC students, who are accepted into the Science and Research Initiative (SRI) program, attend a 5-day workshop that provides math preparation and applied learning experiences in Earth, Life, Computer and Physical Science subject areas.
• Guardian Scholars: The Guardian Scholars Program supports the academic and personal goals of current and former foster youth attending Santa Monica College.
Equity Funded Activities: Although the data suggest SMC is doing a fairly good job of reaching out to students from all target groups, there is an identified need to identify and provide direct services to Veteran, DSPS, foster youth, and Basic Skills students.
• DSPS Handbook: Design a handbook to provide a comprehensive description of DSPS program services best practices to create a supportive and understanding environment for DSPS students across campus.
• DSPS and Veterans Collaborative: Offer disability screenings to veterans on campus and refer individuals identified in screening for learning and cognitive disability testing. At present Veterans are underrepresented among students receiving DSPS services.
• Veteran Center Service Expansion: Increase capacity for connecting Veterans at SMC to centralized psychology and counseling services in the Veterans Center.
• Guardian Scholars Coordinator and Counseling: Provide Guardian Scholars (foster youth) with a dedicated program coordinator and counselor to connect participants with student support services and closely monitor academic progress.
• STEM Academy: Accelerate placement in math and chemistry and promote the successful course completion of math and chemistry courses by offering intensive faculty-led workshops for new and current SMC students exiting Basic Skills Math (84/85).
Expected Outcomes The expected outcomes of these activities include:
• Maintain a student body which reflects the Los Angeles region. • Strengthen student awareness of and engagement in the diverse opportunities for
programmatic support for Veteran, DSPS, Foster Youth, and basic skills students. • Engage target student groups in support programs before they begin their studies at SMC. • Insure access to all majors and areas of study regardless of a student’s placement level in math
and English.
Santa Monica College Student Equity Plan 2014 29
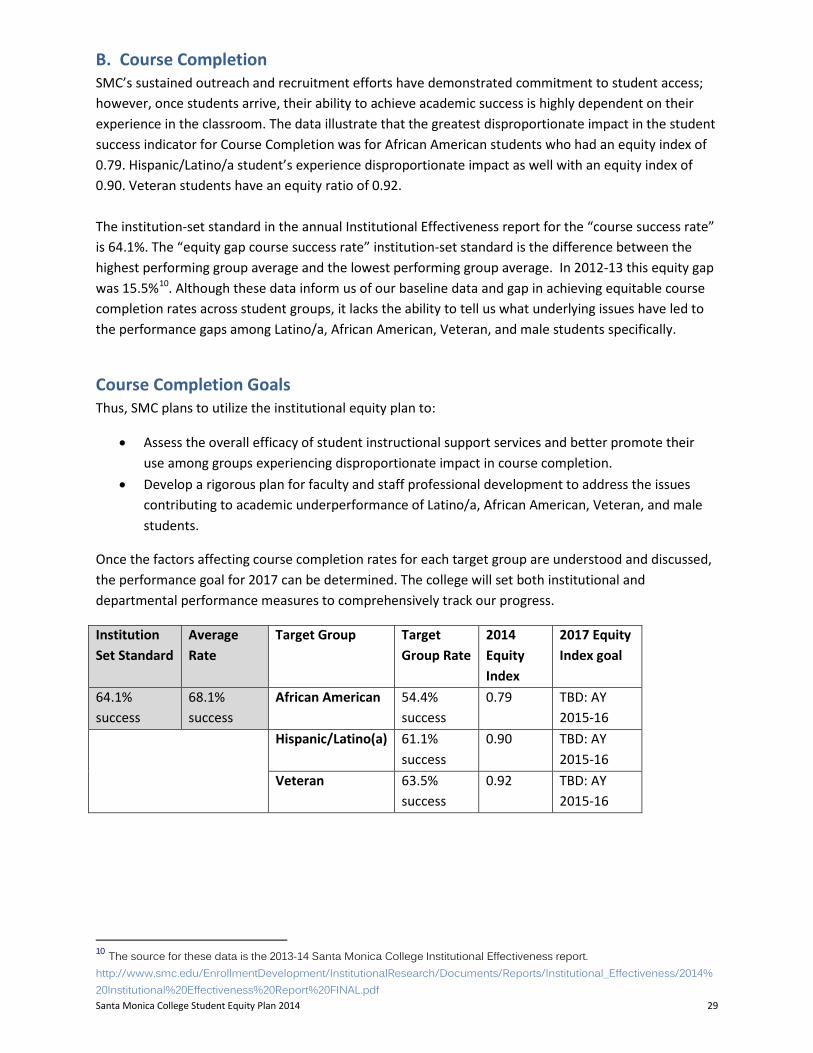
B. Course Completion SMC’s sustained outreach and recruitment efforts have demonstrated commitment to student access; however, once students arrive, their ability to achieve academic success is highly dependent on their experience in the classroom. The data illustrate that the greatest disproportionate impact in the student success indicator for Course Completion was for African American students who had an equity index of 0.79. Hispanic/Latino/a student’s experience disproportionate impact as well with an equity index of 0.90. Veteran students have an equity ratio of 0.92. The institution-set standard in the annual Institutional Effectiveness report for the “course success rate” is 64.1%. The “equity gap course success rate” institution-set standard is the difference between the highest performing group average and the lowest performing group average. In 2012-13 this equity gap was 15.5%10. Although these data inform us of our baseline data and gap in achieving equitable course completion rates across student groups, it lacks the ability to tell us what underlying issues have led to the performance gaps among Latino/a, African American, Veteran, and male students specifically.
Course Completion Goals Thus, SMC plans to utilize the institutional equity plan to:
• Assess the overall efficacy of student instructional support services and better promote their use among groups experiencing disproportionate impact in course completion.
• Develop a rigorous plan for faculty and staff professional development to address the issues contributing to academic underperformance of Latino/a, African American, Veteran, and male students.
Once the factors affecting course completion rates for each target group are understood and discussed, the performance goal for 2017 can be determined. The college will set both institutional and departmental performance measures to comprehensively track our progress.
Institution Set Standard
Average Rate
Target Group Target Group Rate
2014 Equity Index
2017 Equity Index goal
64.1% success
68.1% success
African American 54.4% success
0.79 TBD: AY 2015-16
Hispanic/Latino(a) 61.1% success
0.90 TBD: AY 2015-16
Veteran 63.5% success
0.92 TBD: AY 2015-16
10 The source for these data is the 2013-14 Santa Monica College Institutional Effectiveness report. http://www.smc.edu/EnrollmentDevelopment/InstitutionalResearch/Documents/Reports/Institutional_Effectiveness/2014%20Institutional%20Effectiveness%20Report%20FINAL.pdf
Santa Monica College Student Equity Plan 2014 30
Activities
I. Research and Inquiry
Equity Funded Initiatives: • Minority Male Community College Collaborative (M2C3): SMC will engage Dr. Frank Harris Co-
Director of the Minority Male Community College Collaborative at San Diego State University at both an institutional and departmental level. At the institutional level, SMC will contract with Dr. Frank Harris to conduct the Community College Survey of Men (CCSM), a comprehensive instrument for assessing the needs of men of color in community colleges. In addition he will conduct focus groups with all involved constituents (students, faculty) and deliver follow up professional development for faculty campus wide as well as for the Math department specifically. This project will inform all indicators of the SMC Student Equity Plan.
• Research and Inquiry Group: Develop an inquiry group comprised of SMC practitioners to deepen the institution’s understanding of why the equity gaps exist for basic skills metrics within the context of instructional support services and curriculum delivery. While this inquiry is focused on basic skills students, the lessons learned will inform our approach to improving course completion more generally.
• Learning Resources and Academic Support Service Tracking System: Establish a comprehensive computer-based tracking system that enables each tutoring site to perform systematic analysis of learning centers and student support services at SMC.
• Equity Research Analyst: SMC will hire a Research Analyst to assist the Equity Plan Task Force and research/inquiry committees with identifying baseline data for equity performance measures, determining standards for achievement, and conducting a variety of inquiry projects. The analyst will work with pilot projects to determine efficacy and sustainability of efforts to close identified equity gaps.
II. Intervention and Student Support SMC offers students a myriad of support services, programs, and supplemental learning activities. The research activities proposed above will enable SMC to specifically address the effectiveness of these support services in reaching African American and Latino(a) students. This research will be vital to our understanding of why these students experience disproportionate impact, despite the extensive support services/programs we offer. In 2015, The Equity Committee will also support the development of discipline-specific pilot programs aimed at promoting course completion for specific target groups. Proposals for such interventions are included under “Equity Funded Activities” and comprehensive evaluation plans will be developed to assess each during our Winter Equity Summit in January 2015.
Ongoing Institutional Activities Santa Monica College has several activities already in place to promote student success in basic skills courses and persistence to and success in the college-level course. These include but are not limited to the following institution- and grant/categorical-funded services:
Student Instructional Support Services:
• Supplemental Instruction (Transfer- level courses and Basic Skills Math and English): Supplemental Instruction (SI) is an academic assistance program at Santa Monica College that provides free out-of-class sessions to students enrolled in specific courses. In SI sessions, SI peer
Santa Monica College Student Equity Plan 2014 31
leaders engage students in interactive group activities to help them learn course concepts, prepare for exams, and learn effective study skills.
• Learning Centers and Tutoring: Math lab, Humanities Writing Center, Modern Language lab, Science Learning Resource Center, Business and Computer Science, and Student Centers (STEM, African American Collegians Center, Latino Center/Adelante Program, Veterans).
Programmatic Support Services
• Veteran’s Resource Center serves Veterans entering college for the first time or returning to college to further their education. The office acts as a liaison with the Veteran’s Administration verifying enrollment for students claiming benefits under the G.I. Bill or the Veterans’ Vocational Rehabilitation Program. The office assists Veterans with referrals to various veteran-serving programs in the West Los Angeles area.
• TRIO/SMC Student Support Services (SSS) helps students who want to transfer with an
Associate’s Degree to a four-year college or university to complete a Baccalaureate (bachelor’s or BA) degree.
o Early Registration, Tutoring, Counseling, Workshops / Seminars, o Referral to services on campus, Assistance with Course Selection, o Financial and Economic Literacy: FAFSA (federal application for financial aid) and finding
Scholarships o Northern California College and Southern California College Tours and Cultural Activities
• Disabled Student Program Services: ensures that all college programs on our campus are
accessible to students with disabilities. We strive to provide the highest quality programs. We encourage and promote independence in students so that they may achieve their full potential. Benefits:
o A wide range of accommodations for students o Resources for faculty and staff in meeting the needs of DSPS students at SMC.
• EOPS/CARE/CalWorks/Guardian Scholars (Foster Youth): Extended Opportunity Program &
Services (EOPS) at Santa Monica College is a program that supports the enrollment, retention, graduation and transfer of students who are challenged by language, social, economic, and educational disadvantages. Benefits:
o Counseling, tutoring, financial assistance, and priority registration
• African American Collegians Center/Black Collegians Program: The Black Collegians Program at SMC is designed to assist students of African descent in transferring to four-year universities and obtaining their Associate degree. Activities:
o Black Collegians Club, Academic, career, and personal counseling o Assisting in the development of students’ skills that are necessary for college success. o Educational and cultural activities in which students can participate. o Teaching students to develop a life plan that involves personal, social and academic
responsibilities. o A selection of general education courses that are transferable to the UC and CSU
systems as well as pre-collegiate level courses in English and math.
Santa Monica College Student Equity Plan 2014 32
o Scholarships for active participants.
• Latino Center/Adelante Program: A network of faculty, students, classes and essential services to promote Latino student success by providing a wide range of bilingual services including:
o Adelante Club, and academic, career, and personal counseling o Assisting in the development of students’ skills that are necessary for college success. o Educational and cultural activities in which students can participate. o Teaching students to develop a life plan that involves personal, social and academic
responsibilities. o A selection of general education courses that are transferable to the UC and CSU
systems as well as pre-collegiate level courses in English and math. o Scholarships for active participants
• Science and Research Initiative Program (Title V HSI STEM Grant): Is an academic support
program designed to help traditionally underrepresented students interested in STEM careers successfully complete their studies at SMC, transfer to a 4 year research orientated baccalaureate program, and/or enter the STEM workforce. Activities:
o STEM Sponsored Transfer-COACH-ella o UCLA SMC/STEM Days on the quad o STEM/SRI specific counseling, priority registration, SRI specific sections, and SI/tutoring. o Specialized STEM courses and Paid UCLA Research Internships and residential programs o STEM Skills Week
• Scholars The Scholars Program offers special transfer agreements with top four-year colleges
and universities. Benefits:
o Specialized Counseling o Designated course sections with a rigorous writing focus and lower seat counts
Faculty and Staff development Services
• Paid adjunct faculty office hours • Center for Teaching Excellence: The Center for Teaching Excellence is funded by the U.S.
Department of Education, Title V - Hispanic Serving Institutions (HSI) Program. The aim of this project is to support low-income, Latino, and other traditionally underrepresented students as they pursue their academic and career goals. At the heart of this grant will be SMC's new Center for Teaching Excellence (The Center), which will offer an annual Faculty Summer Institute, quarterly seminars for all faculty, departmental workshops that target career-specific improvements in math, English, and content specific-courses, and customized individual and small group support.
o Faculty Summer Institute: During the Faculty Summer Institute, faculty explored issues of pedagogy and practice, exchanged ideas, studied new approaches and tested innovative strategies for building student skills and understanding. Experts and practitioners in the field of education shared research-based strategies that increase student success.
Santa Monica College Student Equity Plan 2014 33
• Faculty Technology workshops: Basic Skills Initiative and The Center Teaching Excellence Collaborative that offers a series of series of workshops on using technology effectively in the classroom.
Equity Funded Activities • DSPS and Veterans Collaborative: Offer disability screenings to all Veterans on campus and
refer individuals identified in screening for learning and cognitive disability testing. • Veteran Center Service Expansion: Increase capacity for connecting Veterans at SMC to
centralized psychological and counseling services in the Veterans Center. • Guardian Scholars Coordinator: Provide Guardian Scholars (foster youth) with a dedicated
program coordinator to connect participants with student support services and closely monitor academic progress.
• English Academy: Address the overrepresentation of Latino/a and African American students in Basic skills English classes by offering 10 faculty led workshops aimed at increasing course success, and accelerating their progress to transfer level English 1.
• STEM Academy: Promote the successful course completion of math and chemistry courses by offering intensive faculty-led workshops and intercession peer instruction for current SMC students exiting Basic Skills Math (84/85).
• EOPS/CARE Winter Counseling: Counseling hours to support EOPS/CARE students during the winter intersession.
• Sociology Coaching Program: Develop a faculty coach model to promote successful course completion among African American and Latino/a students.
• Resiliency/Leadership for Men of Color Conference: Engage at-risk men of color with valuable training and networking experience to enhance their connectedness to SMC and their academic goals.
• Expansion of Supplemental Instruction and Tutoring: Increase tutoring capacity across campus and provide a Student Services Specialist for Supplemental Instruction to promote utilization of support services by target groups.
• History Peer Learning Program: Establish a peer-learning program to expand on the history department’s successful reading and writing skill building workshops.
• Black Collegians and Latino Center Equity Initiatives: Support Black Collegians and Adelante students with improving their academic performance by:
o Hiring a dedicated Math Instructional Assistant to serve in their centers, o Providing Chemistry Bootcamps (in collaboration w/STEM Academy) for students that
will focus on boosting math/chemistry skills that lead to successful course completion. o Creating Library Projects to assist students who are interested in transferring to learn
how to utilize undergraduate libraries for research either at SMC or their transfer-destination university.
o Providing Peer Mentors to utilize the experience of students who have participated in Black Collegians and Adelante program activities to counsel and motivate new SMC students.
o Hiring a licensed social worker to address the specific mental health and community connection needs of Latino(a) and Africa American students.
o Increasing the number of students motivated to pursue transfer by offering placements in a residential Undergraduate research program at Loyola Marymount University
Santa Monica College Student Equity Plan 2014 34
o Participating in the national Umoja Conference to assist students in finding a community of educators and student learners committed to the academic success, personal growth and self-actualization of African American and other students.
• Early Childhood Education (ECE) Book Exchange: Increase completion of ECE courses by offering students a lending library to obtain essential textbooks at no cost.
Expected Outcomes The expected outcomes will involve:
• Development of inquiry groups made up of faculty, administrators, and staff. Follow same model and utilize tools created in ESL/Basic Skills Completion metric.
• Evaluation of the impact funded activities have on reducing equity gaps. Scaling up of most successful equity proposals developed.
• Increased dialogue and collaboration among departments across campus, specifically via the Equity Summit and professional development activities.
C. ESL and Basic Skills Completion In examining our campus-based research it became clear that the most significant disparities were in basic skills English and math completion, and African American and Hispanic/Latino(a) students experience the greatest disproportionate impact. Therefore African American and Hispanic/Latino(a) students will serve as our “target groups” for this indicator. American Indian students also experienced disproportionate impact in basic skills math, but the population of 16 students is very low as compared to these other groups. The intent is that the outcomes of our work to bring about equity in educational outcomes will benefit this group as well.
Only 15.2% of African American students and 25.9% of Latino/a students who began in a basic skills math course successfully completed a college-level math course. The highest performing group, Asian, had a 45.2% success rate. The equity/proportionality index was 0.53 for African American students and 0.91 for Hispanic/Latino(a).
In basic skills English, African American students’ success rate was 30.2%. For Hispanic/Latino(a) students the success rate was 40.3%. The highest performing group was Asian again at 58.7%. The equity index for African American students was 0.71 and for Hispanic/Latino/a it was 0.95.
Basic Skills and ESL are the gateway courses to college level coursework. A bottleneck at this stage will prevent us from moving forward with long-term degree completion and transfer goals. The campus-based research describes the disparities that exist but it does not answer why they exist. We propose to expend equity funds to partner with equity research experts to help SMC dig deeper into the data.
ESL and Basic Skills Completion Goals The success rates for the highest performing groups (45.2% and 58.7%) are unacceptable, thus our strategy is to research and identify successful practices and interventions for the target groups that can be applied to all Basic Skills and ESL students. For the ESL/Basic Skills completion indicator our goal is to improve student success rates in basic skills English and Math over the next three years for African American, Hispanic/Latino(a) students though intense research and pilot interventions.
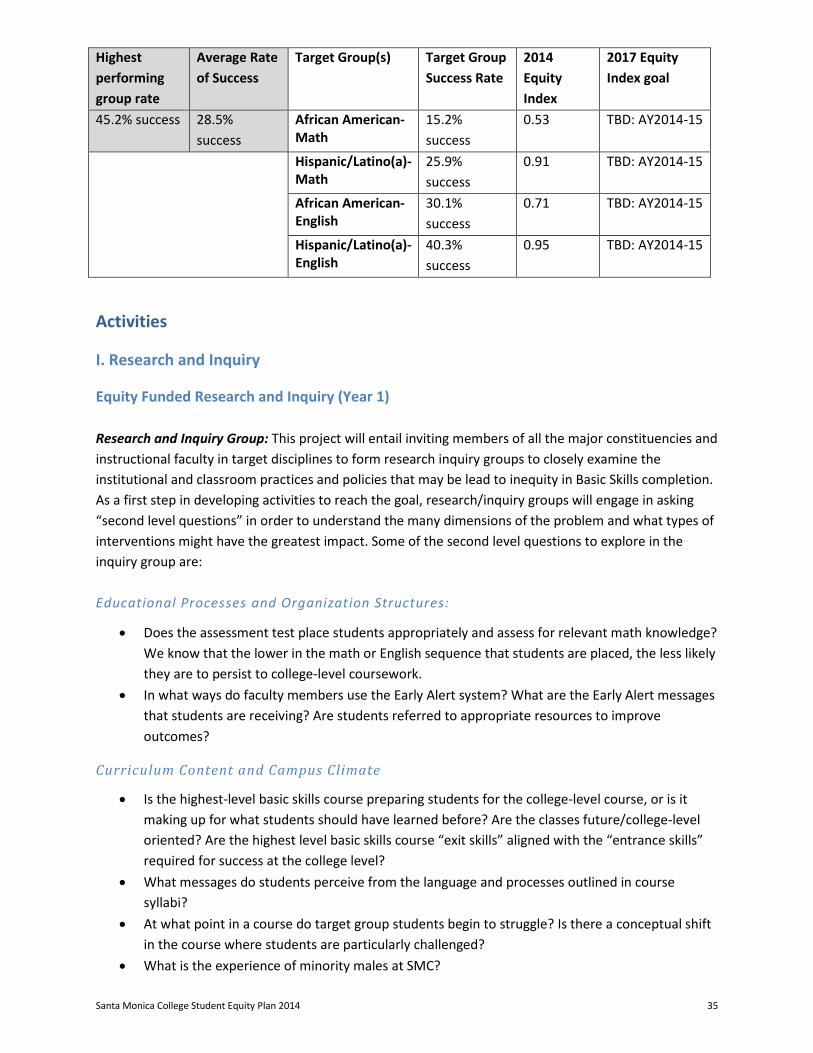
Santa Monica College Student Equity Plan 2014 35
Highest performing group rate
Average Rate of Success
Target Group(s) Target Group Success Rate
2014 Equity Index
2017 Equity Index goal
45.2% success 28.5% success
African American- Math
15.2% success
0.53 TBD: AY2014-15
Hispanic/Latino(a)- Math
25.9% success
0.91 TBD: AY2014-15
African American- English
30.1% success
0.71 TBD: AY2014-15
Hispanic/Latino(a)- English
40.3% success
0.95 TBD: AY2014-15
Activities
I. Research and Inquiry
Equity Funded Research and Inquiry (Year 1) Research and Inquiry Group: This project will entail inviting members of all the major constituencies and instructional faculty in target disciplines to form research inquiry groups to closely examine the institutional and classroom practices and policies that may be lead to inequity in Basic Skills completion. As a first step in developing activities to reach the goal, research/inquiry groups will engage in asking “second level questions” in order to understand the many dimensions of the problem and what types of interventions might have the greatest impact. Some of the second level questions to explore in the inquiry group are: Educational Processes and Organization Structures:
• Does the assessment test place students appropriately and assess for relevant math knowledge? We know that the lower in the math or English sequence that students are placed, the less likely they are to persist to college-level coursework.
• In what ways do faculty members use the Early Alert system? What are the Early Alert messages that students are receiving? Are students referred to appropriate resources to improve outcomes?
Curriculum Content and Campus Climate
• Is the highest-level basic skills course preparing students for the college-level course, or is it making up for what students should have learned before? Are the classes future/college-level oriented? Are the highest level basic skills course “exit skills” aligned with the “entrance skills” required for success at the college level?
• What messages do students perceive from the language and processes outlined in course syllabi?
• At what point in a course do target group students begin to struggle? Is there a conceptual shift in the course where students are particularly challenged?
• What is the experience of minority males at SMC?
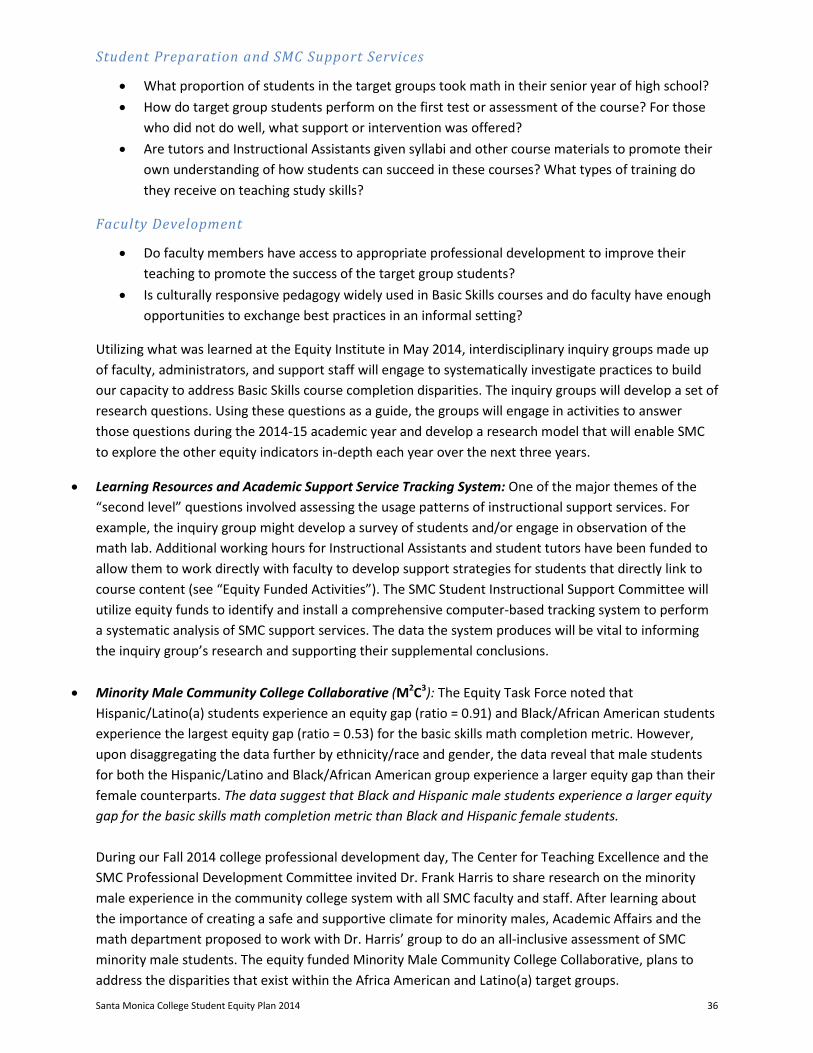
Santa Monica College Student Equity Plan 2014 36
Student Preparation and SMC Support Services
• What proportion of students in the target groups took math in their senior year of high school? • How do target group students perform on the first test or assessment of the course? For those
who did not do well, what support or intervention was offered? • Are tutors and Instructional Assistants given syllabi and other course materials to promote their
own understanding of how students can succeed in these courses? What types of training do they receive on teaching study skills?
Faculty Development
• Do faculty members have access to appropriate professional development to improve their teaching to promote the success of the target group students?
• Is culturally responsive pedagogy widely used in Basic Skills courses and do faculty have enough opportunities to exchange best practices in an informal setting?
Utilizing what was learned at the Equity Institute in May 2014, interdisciplinary inquiry groups made up of faculty, administrators, and support staff will engage to systematically investigate practices to build our capacity to address Basic Skills course completion disparities. The inquiry groups will develop a set of research questions. Using these questions as a guide, the groups will engage in activities to answer those questions during the 2014-15 academic year and develop a research model that will enable SMC to explore the other equity indicators in-depth each year over the next three years.
• Learning Resources and Academic Support Service Tracking System: One of the major themes of the “second level” questions involved assessing the usage patterns of instructional support services. For example, the inquiry group might develop a survey of students and/or engage in observation of the math lab. Additional working hours for Instructional Assistants and student tutors have been funded to allow them to work directly with faculty to develop support strategies for students that directly link to course content (see “Equity Funded Activities”). The SMC Student Instructional Support Committee will utilize equity funds to identify and install a comprehensive computer-based tracking system to perform a systematic analysis of SMC support services. The data the system produces will be vital to informing the inquiry group’s research and supporting their supplemental conclusions.
• Minority Male Community College Collaborative (M2C3): The Equity Task Force noted that Hispanic/Latino(a) students experience an equity gap (ratio = 0.91) and Black/African American students experience the largest equity gap (ratio = 0.53) for the basic skills math completion metric. However, upon disaggregating the data further by ethnicity/race and gender, the data reveal that male students for both the Hispanic/Latino and Black/African American group experience a larger equity gap than their female counterparts. The data suggest that Black and Hispanic male students experience a larger equity gap for the basic skills math completion metric than Black and Hispanic female students. During our Fall 2014 college professional development day, The Center for Teaching Excellence and the SMC Professional Development Committee invited Dr. Frank Harris to share research on the minority male experience in the community college system with all SMC faculty and staff. After learning about the importance of creating a safe and supportive climate for minority males, Academic Affairs and the math department proposed to work with Dr. Harris’ group to do an all-inclusive assessment of SMC minority male students. The equity funded Minority Male Community College Collaborative, plans to address the disparities that exist within the Africa American and Latino(a) target groups.
Santa Monica College Student Equity Plan 2014 37
This project will consist of two components: 1. A series of opportunities for faculty to develop more effective strategies to identify and engage students in need of additional assistance and 2. Workshops designed for Latino and African American male students to encourage the development of a growth mindset and the use of student support resources. SMC will administer the Community College Survey of Men (CCSM) throughout the campus, and results from this research will be the focus of future professional development. Additionally, the math faculty will sponsor department-specific activities around promoting strategies that will narrow the achievement gaps in basic skills math.
• Equity Research Analyst: Through our Basic skills Math and English research activities in year one, we plan to build a framework to assess equity, set achievement goals for the campus, and determine the effectiveness of interventions and practices. This framework can then be applied across disciplines and indicators. A major component SMC plan will involve hiring a dedicated research analyst to assist the Equity Plan Task Force and inquiry groups in identifying baseline data for equity performance measures and determining standards for achievement. Members of the inquiry teams, including the Equity Research Analyst, will provide professional development and leadership for future inquiry groups (Indicators A, B-D and F). In year two (2015-16) we will implement interventions, practices, and professional development identified by the inquiry groups as having the greatest impact on African American and Latino/a student success in English and math basic skills completion. In year 3 (2016-17) we will bring the most successful interventions to scale while engaging in the evaluation of all funded activities and related outcomes.
II. Intervention and Student Support Basic skills completion and progression to transfer level coursework is a major focus of the annual Master Plan for Education. We have developed a number of programs that employ the use of best practices (acceleration models in English and Math, Supplemental Instruction, tutoring labs, Summer Jams, and First Year Experience). These efforts will have a positive impact on future completion data, however, the importance of continuing to push for active student interventions to boost student performance in basic skills is a priority.
Ongoing Institutional Activities Santa Monica College has several activities already in place to promote student success in basic skills courses and persistence to and success in the college-level course. These institution- and grant/categorical programs include but are not limited to the following:
Student Support Services:
• Supplemental Instruction (Transfer- level courses and Basic Skills Math and English): Supplemental Instruction is an academic assistance program at Santa Monica College that provides free out-of-class sessions to students enrolled in specific courses. In SI sessions, SI peer leaders engage students in interactive group activities to help them learn course concepts, prepare for exams, and learn effective study skills.
• Learning Centers and Tutoring: Math lab, Humanities Writing Center, Modern Language lab, Science Learning Resource Center, Business and Computer Science, and Student Centers (STEM, African American Collegians Center, Latino Center/Adelante Program, Veterans).
Programmatic Support Services
Santa Monica College Student Equity Plan 2014 38
• Veteran’s Resource Center serves veterans entering college for the first time or returning to college to further their education. The office acts as a liaison with the Veterans Administration verifying enrollment for students claiming benefits under the G.I. Bill or the Veterans’ Vocational Rehabilitation Program. The office assists veterans with referrals to various veteran-serving programs in the West Los Angeles area.
• TRIO/SMC Student Support Services (SSS) helps students who want to transfer with an Associate of Arts (or AA) Degree to a four-year college or university to complete a Baccalaureate (bachelor’s or BA) degree.
• Disabled Student Program Services: ensures that all college programs on our campus are accessible to students with disabilities. Students are encouraged to achieve independence in order to achieve their full potential.
• EOPS/CARE/CalWorks/Guardian Scholars (Foster Youth): Extended Opportunity Program & Services (EOPS) at Santa Monica College is a program that supports the enrollment, retention, graduation and transfer of students who are challenged by language, social, economic, and educational disadvantages.
• African American Collegians Center/Black Collegians Program: The Black Collegians Program at SMC is designed to assist students of African descent in transferring to four-year universities and obtaining their Associate degree.
• Latino Center/Adelante Program: A network of faculty, students, classes and essential services to promote Latino student success by providing a wide range of services.
• Science and Research Initiative Program (Title V HSI STEM Grant): An academic support program designed to help traditionally underrepresented students interested in STEM careers successfully complete their studies at SMC.
Faculty and Staff development Services
• Paid adjunct faculty office hours • Center for Teaching Excellence: The Center for Teaching Excellence is funded by the U.S.
Department of Education, Title V - Hispanic Serving Institutions (HSI) Program. The aim of this project is to support low-income, Latino, and other traditionally underrepresented students as they pursue their academic and career goals.
• Faculty Summer Institute: During the Faculty Summer Institute, faculty explored issues of pedagogy and practice, exchanged ideas, studied new approaches and tested innovative strategies for building student skills and understanding. Experts and practitioners in the field of education shared research-based strategies that increase student success.
• Faculty Technology workshops: Basic Skills Initiative and The Center Teaching Excellence Collaborative that offers a series of series of workshops on using technology effectively in the classroom.
Equity Funded Activities • English Academy: Address the overrepresentation of Latino/a and African American students in
Basic skills English classes by offering 10 faculty led workshops aimed at increasing course success, and accelerating their progress to transfer level English 1.
• STEM Academy: Promote the successful course completion of math and chemistry courses by offering intensive faculty-led workshops and intercession peer instruction for current SMC students exiting Basic Skills Math (84/85).
Santa Monica College Student Equity Plan 2014 39
• Resiliency/Leadership for Men of Color Conference: Engage at-risk men of color with valuable training and networking experience to enhance their connectedness to SMC and their academic goals.
• Expansion of Supplemental Instruction and Tutoring: Increase tutoring capacity across campus and provide a Student Services Specialist for Supplemental Instruction to promote utilization of support services by target groups.
• Black Collegians and Latino Center Equity Initiatives: Support Black Collegians and Adelante students with improving their academic performance by:
o Hiring a dedicated Math Instructional Assistant to serve in their centers, o Providing Peer Mentors to utilize the experience of students who have participated in
Black Collegians and Adelante program activities to counsel and motivate new SMC students.
o Hiring a licensed social worker to address the specific mental health and community connection needs of Latino(a) and Africa American students.
o Participating in the national Umoja Conference to assist students in finding a community of educators and student learners committed to the academic success, personal growth and self-actualization of African American and other students.
Expected Outcomes The expected outcomes for Basic Skills completion equity activities in year one are to:
• Develop a set of activities to address the achievement gap for African American and Latino/a students in basic skills Math and English.
• Answer “second level” research questions with quantitative and qualitative data in practitioner research/inquiry groups.
• Establish a tool that will allow us to track the usage of our tutoring/learning support centers and explore the effectiveness of these support centers (LRC, Math Lab, and programs like Supplemental Instruction) with respect to basic skills students.
• Utilize the Community College Survey of Men (CCSM) instrument to inform the institution and math department about the perceived climate at SMC. Follow up work will focus on identifying strategies to engage male students from traditionally underserved backgrounds.
Santa Monica College Student Equity Plan 2014 40
D. Degree and Certificate Completion Career Technical Education (CTE) departments have created innovative programming that seeks to recruit and retain students from diverse backgrounds by connecting them with professional opportunities. CTE faculty and administrators have successfully created career pathways that combine theory with applied learning experiences. This approach has been especially effective in promoting degree completion for Hispanic/Latino(a), disabled, and low income students. One example of innovative CTE programming is “Promo Pathway,” an immersive one year program aimed at training students to write, produce and edit television programming. With the support of the Los Angeles HiTech grant, programs like Promo Pathway will be developed and expanded into area high schools with SMC serving as a hub.
Degree and Certificate Completion Goals It will be important to continue the success of CTE programs by closing the equity gap for Black/African American, American Indian/Alaskan Native, and Pacific Islander/Native Hawaiian students. We plan to specifically address this disparity in Year 3; however, we believe that focusing on our Basic Skills completion rates in 2014-15 will lay the groundwork for greater degree and certificate completion rates for African American/Native American and Pacific Islander students.
Activities
I. Research and Inquiry
Equity Funded Research and Inquiry • Minority Male Community College Collaborative (M2C3): This project will inform the committee
of challenges related to degree and certificate completion among men of color.
• Equity Research Analyst: The research analyst will support ongoing research in the area of degree and certificate completion.
II. Intervention and Student Support
Ongoing Institutional Activities Student Support Services:
• TRIO/SMC Student Support Services (SSS) helps students who want to transfer with an Associate of Arts (or AA) Degree to a four-year college or university to complete a Baccalaureate (bachelor’s or BA) degree.
o Early Registration, Tutoring, Counseling, Workshops / Seminars, o Referral to services on campus, Assistance with Course Selection, o Financial and Economic Literacy: FAFSA (federal application for financial aid) and finding
Scholarships o Northern California College and Southern California College Tours and Cultural Activities
• EOPS/CARE/CalWorks/Guardian Scholars (Foster Youth): Extended Opportunity Program & Services (EOPS) at Santa Monica College is a program that supports the enrollment, retention, graduation and transfer of students who are challenged by language, social, economic, and educational disadvantages.
Santa Monica College Student Equity Plan 2014 41
• African American Collegians Center/Black Collegians Program: The Black Collegians Program at SMC is designed to assist students of African descent in transferring to four-year universities and obtaining their Associate degree. Activities:
o Teaching students to develop a life plan that involves personal, social and academic responsibilities.
o A selection of general education courses that are transferable to the UC and CSU systems as well as pre-collegiate level courses in English and math.
o Scholarships for active participants. • Latino Center/Adelante Program: A network of faculty, students, classes and essential services
to promote Latino student success by providing a wide range of bilingual services including:
o Educational and cultural activities in which students can participate. o Teaching students to develop a life plan that involves personal, social and academic
responsibilities. o A selection of general education courses that are transferable to the UC and CSU
systems as well as pre-collegiate level courses in English and math. o Scholarships for active participants
• Science and Research Initiative Program (Title V HSI STEM Grant): Is an academic support program designed to help traditionally underrepresented students interested in STEM careers successfully complete their studies at SMC, transfer to a 4 year research orientated baccalaureate program, and/or enter the STEM workforce.
• Scholars The Scholars Program offers special transfer agreements with top four-year colleges and universities. Benefits:
o Specialized Counseling o Designated course sections with a rigorous writing focus and lower seat counts o Priority consideration for admissions to the following campuses: The UCLA College of
Letters and Science (TAP), UC Irvine, Loyola Marymount University and many more. • General Counseling: SMC has a strong commitment to counseling. Counselors meet individually
with students to create comprehensive education plans in order to help them complete their degrees and/or certificates.
• MyEdPlan: A new online tool developed at SMC available via the student portal, “Corsair Connect.” Students can use this tool to create an abbreviated or comprehensive education plan which is connected directly to Degree Audit. This tool helps students map their course taking in order to complete their degrees and/or certificates in a timely manner.
• SMC Career Center: One stop shop for career advising, employment/internship placement and major advisement.
Equity Funded Activities • Resiliency/Leadership for Men of Color Conference: Engage at-risk men of color with valuable
training and networking experience to enhance their connectedness to SMC and their academic goals.
• Black Collegians and Latino Center Equity Initiatives: Support Black Collegians and Adelante students with improving their academic performance by:
Santa Monica College Student Equity Plan 2014 42
o Providing Peer Mentors to utilize the experience of students who have participated in Black Collegians and Adelante program activities to counsel and motivate new SMC students.
o Hiring a licensed social worker to address the specific mental health and community connection needs of Latino(a) and African American students.
o Increasing the number of students motivated to pursue transfer by offering placements in a residential Undergraduate research program at Loyola Marymount University
o Participating in the national Umoja Conference to assist students in finding a community of educators and student learners committed to the academic success, personal growth and self-actualization of African American and other students.
• Early Childhood Education (ECE) Book Exchange: Increase completion of ECE courses, degrees, and certificates by offering students a lending library to obtain essential textbooks at no cost to them.
Expected Outcome The expected outcomes will involve:
• Development of inquiry groups made up of faculty, administrators, and support staff in Year 3. • Program evaluation on the impact activities had on reducing equity gaps. Scaling up of most
successful equity proposals developed. • Increased dialogue and collaboration of departments across campus through the 2015 Equity
Summit and professional development activities
E. Transfer Santa Monica College has a strong history of success in transferring students to both CSU and UC systems. SMC has consistently transferred the highest number of African American and Latino/a students to the UC system, with 31 and 141 students transferring in 2013 from each group respectively. Despite the honor of being one of the state’s top performing schools in transfer, California community college transfer numbers as a whole remain staggeringly low. White students represent the largest proportion of students in the cohort (35.7%) and the transfer outcome (42.8%) groups. The following students experience inequities: Black/African American (8.2% cohort/5.9% outcome, ratio = 0.72), American Indian/Alaskan Native (.6% cohort/.5% outcome, ratio = 0.83), and Hispanic/Latino(a) (28.4% cohort/18.5% outcome, ratio = 0.65). These students are disproportionately impacted in terms of the transfer metric. SMC data show that the low transfer numbers can be attributed to the proportion of students progressing from the Basic Skills level through transfer level courses. The college has a number of programs geared towards promoting transfer, however, course completion rates, particularly in the basic skills, impact this goal. We plan to learn more about the barriers to student outcomes in basic skills while working on pilot programs targeting acceleration and use of instructional support in Year 1.
Santa Monica College Student Equity Plan 2014 43
Transfer Goals Thus, SMC plans to utilize the institutional equity plan to:
• Assess the overall efficacy of our student transfer support services in promoting their use among groups experiencing disproportionate impact.
• Develop a rigorous plan for faculty and staff professional development to address the issues contributing to academic underperformance of Latino/a, African American, Veteran, and Disabled students with regards to transfer metrics.
Activities
I. Research and Inquiry
Equity Funded Research and Inquiry • Minority Male Community College Collaborative (M2C3): This project will inform the committee
of challenges related to degree and certificate completion among men of color. • Equity Research Analyst: The research analyst will support ongoing research in the area of
degree and certificate completion.
II. Intervention and Student Support
Ongoing Institutional Activities All programs and student support and instructional support services are focused on promoting transfer to baccalaureate programs for students. The following institution-funded programs and activities specifically target transfer.
• Scholars The Scholars Program offers special transfer agreements with top four-year colleges and universities. Benefits:
o Specialized Counseling o Designated course sections with a rigorous writing focus and lower seat counts o Priority consideration for admissions to the following campuses: The UCLA College of
Letters and Science (TAP), UC Irvine, Loyola Marymount University and many more.
• Transfer Center: Offers transfer counseling, TAG assistance, and transfer workshops. Activities:
o SMC Transfer Fair: Offered every semester the transfer fair brings hundreds of schools that represent wide range specialties to speak directly with students about their next steps.
o TAG-Santa Monica College students can get guaranteed admission to a variety of UC, CSU, and private colleges.
o Transfer Workshops given by counselors and college admissions representatives from all over the nation.
Santa Monica College Student Equity Plan 2014 44
• SMC Career Center: One stop shop for career advising, employment/internship placement and major advisement. Activities:
o Career Counseling for SMC students o Cool Careers Workshops featuring a wide range of career panelists o Counseling 12 (Career Planning) and Counseling 15 (STEM Job Search Strategies) Courses o Jobs Skill Counseling: Employment and Internship placement, resume writing,
informational interview skills.
Equity Funded Activities • Resiliency/Leadership for Men of Color Conference: Engage at-risk men of color with valuable
training and networking experience to enhance their connectedness to SMC and their academic goals.
• Black Collegians and Latino Center Equity Initiatives: Support Black Collegians and Adelante students with improving their academic performance by:
o Creating Library Projects to assist students who are interested in transferring to learn how to utilize undergraduate libraries towards research options either at SMC or their transfer school.
o Increasing the number of students motivated to pursue transfer by offering placements in a residential Undergraduate research program at Loyola Marymount University
o Participating in the national Umoja Conference to assist students in finding a community of educators and student learners committed to the academic success, personal growth and self-actualization of African American and other students.
Expected Outcomes • Development of transfer inquiry groups made up of faculty, administrators, and support staff in
Year 4. • Program evaluation of direct impact activities had on reducing equity gaps with respect to
transfer. Scaling up of most successful equity proposals developed (starting in Year 1). • Increase dialogue and collaboration across campus and departments through the Equity Summit
(annually beginning Year 1), and follow-up professional development activities.
Evaluation Schedule and Process The evaluation schedule and process for all equity-funded activities will be developed in Year 1. Every project will be subject to annual evaluation. The project leaders will attend the annual SMC Equity Summit and submit an annual report. The Equity Research Analyst will assist faculty and staff in the evaluation of projects.
January 2015 Equity Summit I
Spring 2015 Implementation, ongoing monitoring of projects
Summer 2015 Implementation, ongoing monitoring of projects; begin evaluation
Fall 2015 Evaluation reports submitted to committee Equity Summit II
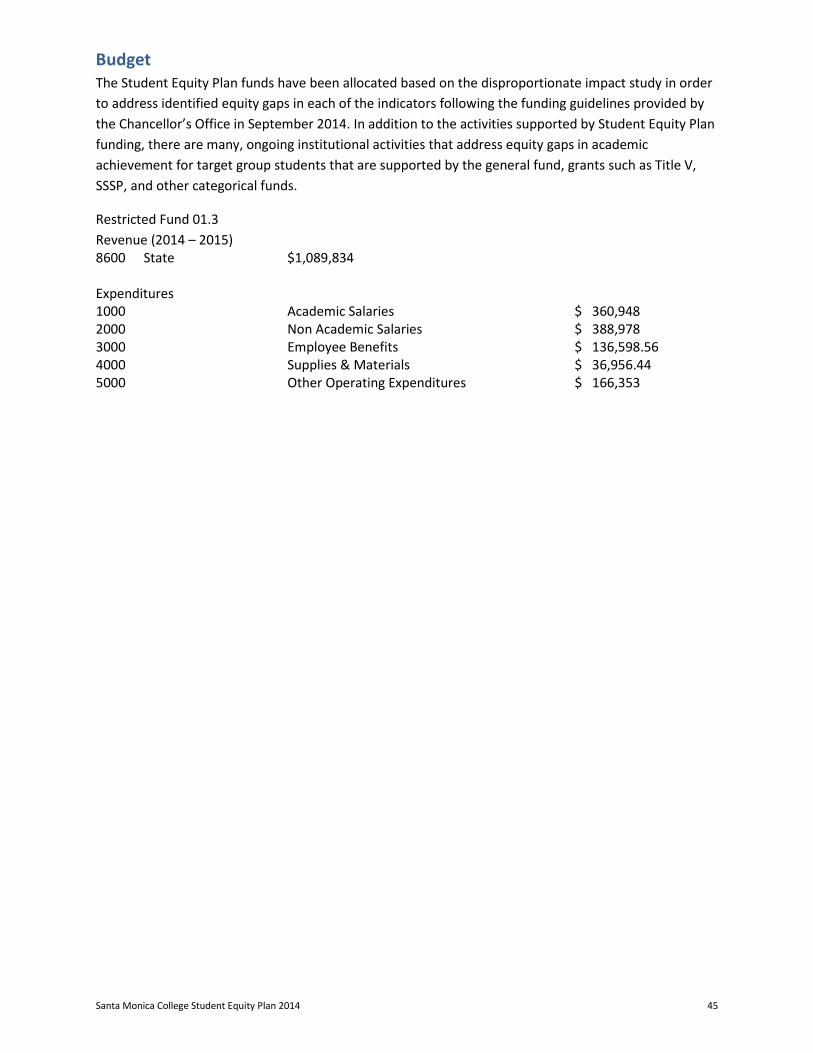
Santa Monica College Student Equity Plan 2014 45
Budget The Student Equity Plan funds have been allocated based on the disproportionate impact study in order to address identified equity gaps in each of the indicators following the funding guidelines provided by the Chancellor’s Office in September 2014. In addition to the activities supported by Student Equity Plan funding, there are many, ongoing institutional activities that address equity gaps in academic achievement for target group students that are supported by the general fund, grants such as Title V, SSSP, and other categorical funds.
Restricted Fund 01.3 Revenue (2014 – 2015) 8600 State $1,089,834 Expenditures 1000 Academic Salaries $ 360,948 2000 Non Academic Salaries $ 388,978 3000 Employee Benefits $ 136,598.56 4000 Supplies & Materials $ 36,956.44 5000 Other Operating Expenditures $ 166,353