Embed Size (px)
Citation preview
FAMILY AND CONSUMER SCIENCES RESEARCH JOURNALByrd-Bredbenner / TELEVISION ADVERTISING
Saturday Morning Children’s TelevisionAdvertising: A Longitudinal
Content Analysis
Carol Byrd-BredbennerRutgers, The State University of New Jersey
The content of advertisements broadcast in 1993 and 1999 during top-ranked Saturday morn-ing children’s network television programs was analyzed and compared with dietary recommen-dations and advertising guidelines. Study data were compared to earlier work to create a longi-tudinal perspective. One fourth to one sixth of broadcast time was devoted to commercials. Overthe past three decades, food was the largest advertisement category. Produce, protein-rich foods,and dairy products were rarely advertised. Advertisements for breakfast cereals and foods highin sugar or fat predominated. Food advertisements over the past 30 years are not reflective ofdietary recommendations. However, most adhered to advertising guidelines.
“TV is the national hearth. In some homes it’s a steady backdrop,morning till night” (Sama, 1993, p. 1). Many families arrange theirschedules, their meals, their conversation, and even their furniturearound the television set. Parents frequently capitalize on television’smesmerizing property and use it as an electronic babysitter whenthey need to free themselves to engage in other activities (Wilson &Christopher, 1992). Children quickly learn to use television to pass thetime—they learn so well that the only thing children in the UnitedStates do more than watch television is sleep. In fact, children spendnearly 1,250 hours watching television each year—that amounts tomore hours than most spend in school (Nielsen Media Research,1998). In light of their exposure to television, it is not surprising thatthousands of children spell relief R-O-L-A-I-D-S or can name morebeer brands than U.S. presidents (Dietz & Strasburger, 1991).
Television is one of the greatest educators ever invented: It influ-ences the attitudes, behaviors, and values of viewers—intended or
382
Author’s Note: Please direct all correspondence and reprint requests to Carol Byrd-Bredbenner, Ph.D., R.D., F.A.D.A., Professor and Extension Specialist in Nutrition,Rutgers, The State University of New Jersey, 88 Lipman Drive, New Brunswick, NJ08901; telephone: (732) 932-5000, ext. 604; e-mail: [email protected] and Consumer Sciences Research Journal, Vol. 30, No. 3, March 2002 382-403© 2002 American Association of Family and Consumer Sciences
not—beginning before children can walk, talk, read, or write. Its influ-ence on attitude formation may be more important than school, reli-gion, parents, or books (Pearl, Bouthilet, & Lazar, 1982; Signorielli &Staples, 1997; Smith, Trivax, Zuehlke, Lowinger, & Nghiem, 1972).The hours spent watching television, coupled with the amount ofmaterial presented and its repetitive nature, all but guarantee thattelevision’s messages will be observed, practiced, and eventuallylearned (Bandura, 1977; Everett, Schnuth, & Tribble, 1998; Watkins,1985). The messages taught via observational learning include atti-tudes about what is right and wrong, family and gender roles, vio-lence and conflict resolution, race relations, occupations, aging, bodyimage norms, and health (American Academy of Pediatrics [AAP],1999; Blum, 1990; Children Now, 1998; Greenberg, 1982; D. B. Jeffrey,McLellarn, & Fox, 1982; Signorielli, 1990; Signorielli & Staples, 1997).Television watching interferes with healthy activity levels and is cor-related with the consumption of highly advertised low-nutrient-density foods, persuasion of parents to purchase such foods, develop-ment of poor eating habits, obesity, eating disorders, and elevatedcholesterol levels (Andersen, Crespo, Bartlett, Cheskin, & Pratt, 1998;Dietz, 1993; Dietz & Gortmaker, 1985; Dietz & Strasburger, 1991;Dussere, 1976; Galst & White, 1976; Goldsmith, 1990; D. B. Jeffrey et al.,1982; Taras, Sallis, Patterson, Nader, & Nelson, 1989; Wong, Hei,Qaqundah, Davidson, Bassin, & Gold, 1992).
Since at least the early 1970s, public health advocates haveexpressed concern about the quality of foods advertised on television(Barcus, 1971; Gussow, 1972). In 1971, Nicholas Johnson, a formerFederal Communications Commission (FCC) commissioner stated,“Commercial television is a nutritional disaster for children, fosteringpositively harmful nutritional habits and ill-preparing children forthe basic human activity of eating properly” (p. 1). The influence oftelevision is so worrisome that for more than a decade, the AAP hasencouraged parents to reduce children’s exposure to this medium(AAP, 1999). Most recently, the AAP has asked pediatricians to incor-porate questions about media use into their routine patient exams(AAP, 1999). In addition, the American Dietetic Association (ADA)has expressed concern about food advertisements aimed at childrenand have called on dietitians to advocate for regulations that ensuremessages targeted to children are consistent with current dietary rec-ommendations (ADA, 1999). In recognition of the need for specialsafeguards to protect children from overcommercialization on televi-sion, the U.S. Congress passed the Children’s Television Act (CTA) of
Byrd-Bredbenner / TELEVISION ADVERTISING 383
1990. However, in terms of advertising regulation, this legislation islimited. That is, it does not dictate or limit the content of commercials,rather it limits commercial time during children’s shows to 10.5 min-utes per hour on weekends and 12 minutes per hour on weekdays(CTA, 1990).
If television is such a powerful influence on attitude, values, andbehavior and is largely unregulated, it is crucial for professionals con-cerned with the health and well-being of families to be aware of thehealth and nutrition messages presented on television. Previousresearch studies have examined the food and beverages advertised onSaturday morning children’s television (Barcus, 1971, 1978; Barcus &Wolkin, 1977; Brown, 1977; Cotugna, 1988; Gussow, 1972; Kotz &Story, 1994); however, none reporting data less than a decade old orthat compared advertisements broadcast over a range of years couldbe located. The potential effects of television advertisements, espe-cially those promoting food and beverages, in tandem with the evolv-ing nature of television advertising, points to this medium as a primecandidate for continuing investigation. Thus, the purpose of thisstudy was to content analyze advertisements broadcast in 1993 and1999 during top-ranked Saturday morning children’s network televi-sion programs and compare their content with current dietary recom-mendations and guidelines for children’s television advertising. Inaddition, for the sake of longitudinal comparisons, whenever datacomparable to those collected in this study could be located, they arereported and compared with the data collected by the author. Thestudy was limited to advertisements aired on network (i.e., ABC, CBS,NBC, Fox, and WB) programs because networks traditionally havethe largest viewing audiences and cable is still not available or sub-scribed to by a sizable proportion of the U.S. population (NielsenMedia Research, 1998).
METHOD
A total of 11.5 and 9.5 hours of top-ranked Saturday morning chil-dren’s network programs was videotaped in spring 1993 and 1999,respectively. For this study, commercial time was defined as allnonprogram time. Commercial time included advertisements, pro-motions for television programs, and public service announcements/drop-ins (PSA/DIs). Advertisements included all paid commercialannouncements for products, with the exception of promotions for
384 FAMILY AND CONSUMER SCIENCES RESEARCH JOURNAL
upcoming television programs, provided by an identified sponsorduring nonprogram time. PSA/DIs promoted educational, health,and/or social information/messages or nonprofit organizations(Condry, Bence, & Scheibe, 1988).
The commercials aired during the study time frame were contentanalyzed. Content analysis methodology was employed because itpermits researchers to describe the use of visual and linguistic ele-ments in television commercials in an objective, systematic, andquantitative manner (Berelson, 1971; Pratt & Pratt, 1995). This meth-odology also enables researchers to “provide knowledge, newinsights, a representation of ‘facts’, and a guide to action”(Krippendorf, 1980, p. 21) as well as draw “replicable and valid infer-ences from the data to their context” (Krippendorf, 1980, p. 21), whichcan facilitate our understanding of how television commercials mayimpact nutrition knowledge, attitudes, and behaviors (Pratt & Pratt,1995).
The study instrument was based on those used in previouslyreported studies (Brown, 1977; Cotugna, 1988; Gussow, 1972; Kotz &Story, 1994; Smith et al., 1972). In addition, it was designed to deter-mine compliance with key guidelines set by the Children’s Advertis-ing Review Unit (CARU) of the Council of Better Business Bureaus(BBB). The National Advertising Review Council established CARUin 1974 to promote responsible children’s advertising. CARUdesigned and updates a set of guidelines to help advertisers deal sen-sitively and honestly with children while recognizing that childrenhave limited experience and skills in evaluating advertising and mak-ing purchasing decisions (BBB, 2000). These guidelines apply to anytype of advertising directed to children younger than the age of 12.
The study instrument was pilot-tested by four trained nutritioneducation researchers, refined, retested by two researchers, andrefined again. The final instrument had two parts. In Part 1, informa-tion about the commercial (e.g., commercial length and type, productadvertised) was recorded. Commercial types included advertise-ments, promotions for television programs, and PSA/DIs. Part 2 wascompleted only for food (including beverages and restaurants)advertisements. In Part 2, the following data were recorded: foodadvertised, characteristics of individuals who ate the advertised food,and compliance with certain CARU guidelines (i.e., presentation ofnutritional benefits, features encouraging development of good
Byrd-Bredbenner / TELEVISION ADVERTISING 385
nutritional practices, premiums or prizes offered, and coercive fea-tures) (BBB, 2000).
Data Collection
Two health education researchers used the instrument developedfor this study to analyze the commercials in the videotaped programs.They reviewed and discussed the instrument prior to the onset of datacollection to establish uniformity in the instrument’s recording proto-col and definitions. The researchers jointly viewed and coded thecommercials in an hour of Saturday morning children’s programs.Then, each researcher independently viewed and coded all the com-mercials in the sample. The procedure was to watch each commercialwithout recording any data, then code the commercial using thestudy instrument. The researcher was permitted to stop, restart, and/or rewind the videotape, use slow-motion video, and/or use closed-captioning information to ensure that all relevant information wascomplete and error free. Then, the researchers compared their codingand, in the few cases where coding differed, they discussed the differ-ences to reach a unanimous decision.
RESULTS AND DISCUSSION
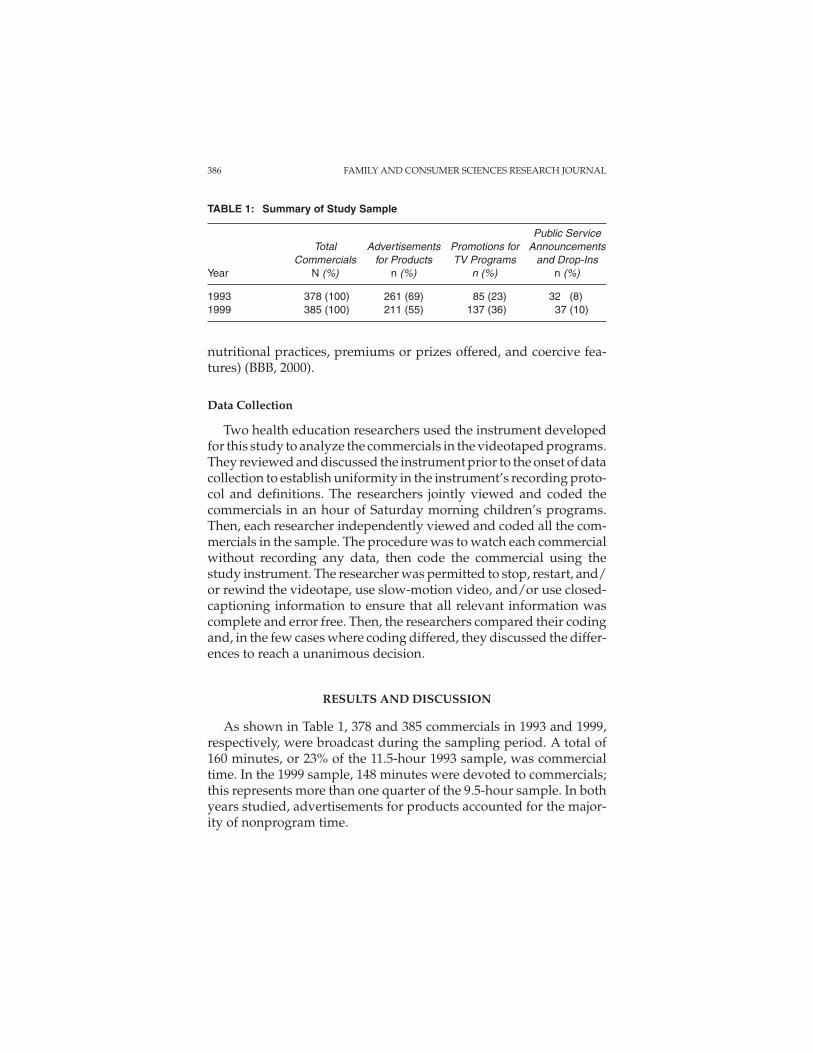
As shown in Table 1, 378 and 385 commercials in 1993 and 1999,respectively, were broadcast during the sampling period. A total of160 minutes, or 23% of the 11.5-hour 1993 sample, was commercialtime. In the 1999 sample, 148 minutes were devoted to commercials;this represents more than one quarter of the 9.5-hour sample. In bothyears studied, advertisements for products accounted for the major-ity of nonprogram time.
386 FAMILY AND CONSUMER SCIENCES RESEARCH JOURNAL
TABLE 1: Summary of Study Sample
Public ServiceTotal Advertisements Promotions for Announcements
Commercials for Products TV Programs and Drop-InsYear N (%) n (%) n (%) n (%)
1993 378 (100) 261 (69) 85 (23) 32 (8)1999 385 (100) 211 (55) 137 (36) 37 (10)
Commercial Types
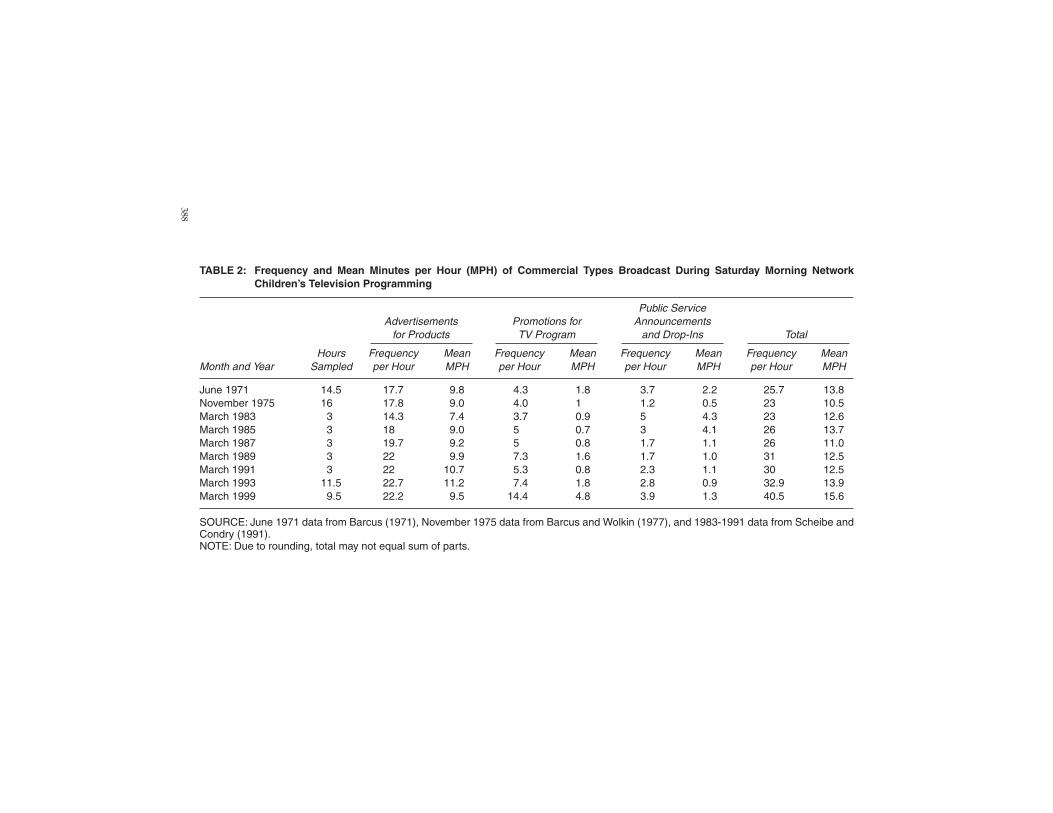
Table 2 shows the frequency with which each type of commercialwas broadcast per hour in the sample for both years studied as well asthe mean minutes per hour devoted to each commercial type. Table 2also includes, for the sake of comparison over time, comparable datareported by others (Barcus, 1971; Barcus & Wolkin, 1977; Scheibe &Condry, 1991). Overall, the total frequency of commercials broadcasthourly tended to increase over the past 30 years, whereas the broad-cast time (mean minutes per hour) devoted to commercials held fairlysteady until between 1993 and 1999, when it rose 12%. The mostrecent data indicate that for every 4 minutes viewers watch Saturdaymorning children’s television programs, they will spend at least 1minute watching commercials.
An examination of the PSA/DI frequencies indicates that over thepast three decades, PSA/DIs account for a minority of the totalnonprogramming time. Time devoted to PSA peaked at 30% or moreof all commercial time in 1983 and 1985, then declined sharply,accounting for only about 8% of all commercial time in 1999. The lowrate of PSA/DIs on Saturday morning is not surprising given that thegoal of commercial television is to generate revenue, something PSA/DIs do not do. In 1993, 13 (41%) PSA/DIs focused on a health issue,namely anti–drug use, seat-belt use, bicycle safety, and nutrition. Ofthe two nutrition PSA/DIs, one focused on popcorn and mentionedits fiber content. The other nutrition PSA/DI was from the What’s onYour Plate campaign launched by McDonald’s and the Society forNutrition Education. Interestingly, in 1999, the percentage of PSA/DIs addressing a health issue rose to 78% (n = 29). Most of the health-related PSA/DIs in 1999 were antidrug and antismoking messages orfocused on safety. Although none of the PSA/DIs in 1999 focused onnutrition, per se, one PSA/DI, shown twice, focused on the benefits ofexercise. This PSA/DI featured an overweight child and extolledviewers to get up and get out. Because PSA/DIs can reach a vast audi-ence and objectively convey highly personal information, they are anexcellent method for delivering important public health information.However, the data from this study indicate that less than 1 minute perhour is devoted to health messages.
Further investigation of Table 2 reveals that the frequency andbroadcast time allocated to promotions for television programsremained relatively steady until 1993, accounting for only 5% to 13%
Byrd-Bredbenner / TELEVISION ADVERTISING 387
388
TABLE 2: Frequency and Mean Minutes per Hour (MPH) of Commercial Types Broadcast During Saturday Morning NetworkChildren’s Television Programming
Public ServiceAdvertisements Promotions for Announcements
for Products TV Program and Drop-Ins Total
Hours Frequency Mean Frequency Mean Frequency Mean Frequency MeanMonth and Year Sampled per Hour MPH per Hour MPH per Hour MPH per Hour MPH
June 1971 14.5 17.7 9.8 4.3 1.8 3.7 2.2 25.7 13.8November 1975 16 17.8 9.0 4.0 1 1.2 0.5 23 10.5March 1983 3 14.3 7.4 3.7 0.9 5 4.3 23 12.6March 1985 3 18 9.0 5 0.7 3 4.1 26 13.7March 1987 3 19.7 9.2 5 0.8 1.7 1.1 26 11.0March 1989 3 22 9.9 7.3 1.6 1.7 1.0 31 12.5March 1991 3 22 10.7 5.3 0.8 2.3 1.1 30 12.5March 1993 11.5 22.7 11.2 7.4 1.8 2.8 0.9 32.9 13.9March 1999 9.5 22.2 9.5 14.4 4.8 3.9 1.3 40.5 15.6
SOURCE: June 1971 data from Barcus (1971), November 1975 data from Barcus and Wolkin (1977), and 1983-1991 data from Scheibe andCondry (1991).NOTE: Due to rounding, total may not equal sum of parts.
of all commercial time. However, between 1993 and 1999, their fre-quency nearly doubled and the minutes-per-hour allocation rose166%.
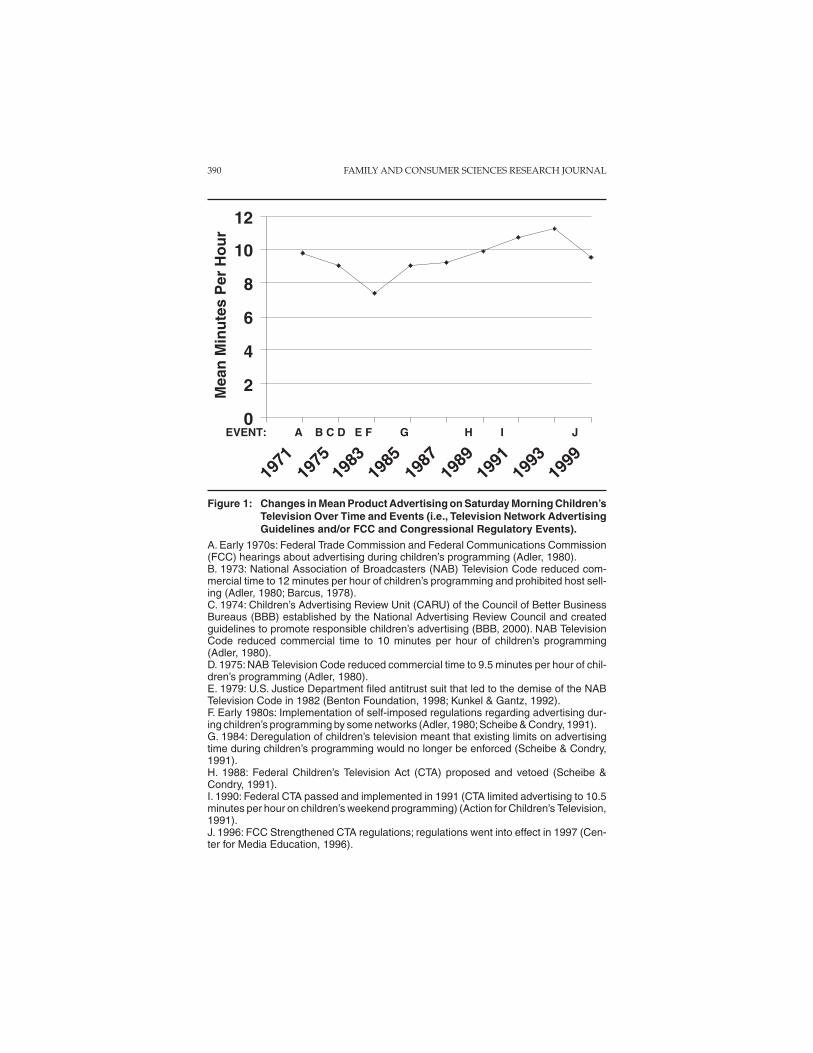
Perhaps most notable in Table 2 is that the vast majority ofnonprogram time over the past three decades has been devoted toadvertisements for products. The total minutes per hour that adver-tisements were broadcast during Saturday morning children’s televi-sion declined from the early 1970s to 1983, rose steadily until 1993,and declined in 1999. As shown in Figure 1, these fluctuations tend tocoincide with guidelines self-imposed by the networks as well as FCCand Congressional regulatory activity. For example, in the early1970s, public concern about the possible adverse effects of televisionadvertising on children lead the Federal Trade Commission (agencythat regulates advertising) and the FCC (agency that regulates televi-sion broadcasting) to hold hearings (Adler, 1980). In an attempt tohead off legislative activity, broadcasting’s self-regulatory body, theNational Association of Broadcasters (NAB) Television Code, beganreducing commercial time in children’s programming to 12, 10, and9.5 minutes per hour in 1973, 1974, and 1975, respectively. Between1971 and 1975, advertising on Saturday morning children’s televisiondeclined nearly 9%. In the late 1970s, the U.S. Justice Department suc-cessfully challenged a provision of the NAB’s voluntary televisioncode as a violation of antitrust law thereby leading to the demise ofthe code (Scheibe & Condry, 1991). In 1984, the FCC rescinded adver-tising limits and the television industry was deregulated (Kunkel &Gantz, 1992). Between 1983 and 1985, a 22% increase occurred in themean minutes per hour allocated to advertising on Saturday morningchildren’s television programming. When the CTA, which attemptedto impose regulations on advertisers, was vetoed in 1988 (Scheibe &Condry, 1991), advertising time increased again, this time by 8%.Prior to the October 1991 implementation of the CTA of 1990, whichlimited advertisements for products to 10.5 minutes per hour on Sat-urday mornings (Action for Children’s Television, 1991), advertisingtime increased once more by nearly 8%. An examination of Figure 1reveals that between 1991 and 1993, advertising time increased by 5%despite the advertising limitations imposed by the CTA. In 1996, theFCC passed new rules that strengthened sections of the CTA regula-tions (Center for Media Education, 1996). Although the strengthenedregulations did not alter existing advertising time limits, between1993 and 1999 the amount of time devoted to advertising on Saturday
Byrd-Bredbenner / TELEVISION ADVERTISING 389
390 FAMILY AND CONSUMER SCIENCES RESEARCH JOURNAL
0
2
4
6
8
10
12
1971
1975
1983
1985
1987
1989
1991
1993
1999
Mea
n M
inu
tes
Per
Ho
ur
EVENT: A B C D E F G H I J
Figure 1: Changes in Mean Product Advertising on Saturday Morning Children’sTelevision Over Time and Events (i.e., Television Network AdvertisingGuidelines and/or FCC and Congressional Regulatory Events).
A. Early 1970s: Federal Trade Commission and Federal Communications Commission(FCC) hearings about advertising during children’s programming (Adler, 1980).B. 1973: National Association of Broadcasters (NAB) Television Code reduced com-mercial time to 12 minutes per hour of children’s programming and prohibited host sell-ing (Adler, 1980; Barcus, 1978).C. 1974: Children’s Advertising Review Unit (CARU) of the Council of Better BusinessBureaus (BBB) established by the National Advertising Review Council and createdguidelines to promote responsible children’s advertising (BBB, 2000). NAB TelevisionCode reduced commercial time to 10 minutes per hour of children’s programming(Adler, 1980).D. 1975: NAB Television Code reduced commercial time to 9.5 minutes per hour of chil-dren’s programming (Adler, 1980).E. 1979: U.S. Justice Department filed antitrust suit that led to the demise of the NABTelevision Code in 1982 (Benton Foundation, 1998; Kunkel & Gantz, 1992).F. Early 1980s: Implementation of self-imposed regulations regarding advertising dur-ing children’s programming by some networks (Adler, 1980;Scheibe & Condry, 1991).G. 1984: Deregulation of children’s television meant that existing limits on advertisingtime during children’s programming would no longer be enforced (Scheibe & Condry,1991).H. 1988: Federal Children’s Television Act (CTA) proposed and vetoed (Scheibe &Condry, 1991).I. 1990: Federal CTA passed and implemented in 1991 (CTA limited advertising to 10.5minutes per hour on children’s weekend programming) (Action for Children’s Television,1991).J. 1996: FCC Strengthened CTA regulations; regulations went into effect in 1997 (Cen-ter for Media Education, 1996).
morning children’s television declined 18%. The data from this studyappear to indicate that the section of the CTA setting finite limits onadvertising time is working in that the time allocated to advertising inthe sampled Saturday morning children’s programming in 1999 fellbelow the maximum time permitted. However, the CTAdid not placelimits on promotions for television programs. When advertisementsare coupled with promotions for television programs, viewers of Sat-urday morning children’s television are currently seeing nearly 37advertisements and TV promotions every hour—a rate greater thanever seen before.
Advertisements for Products
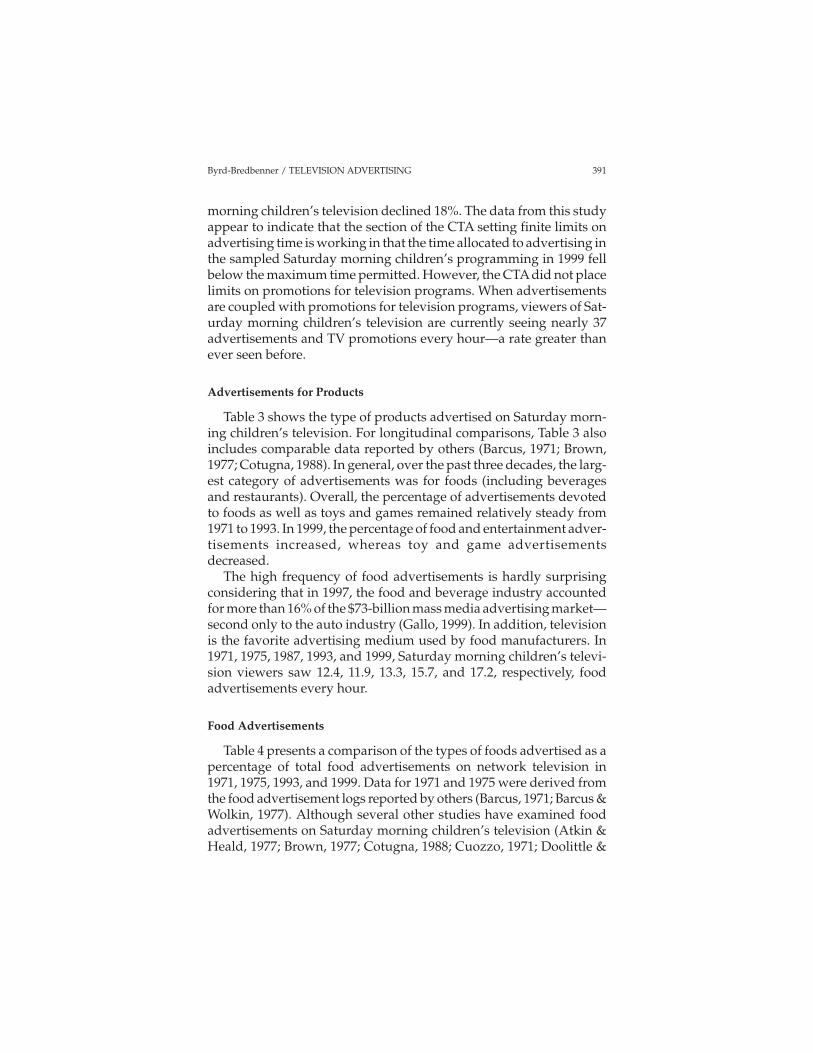
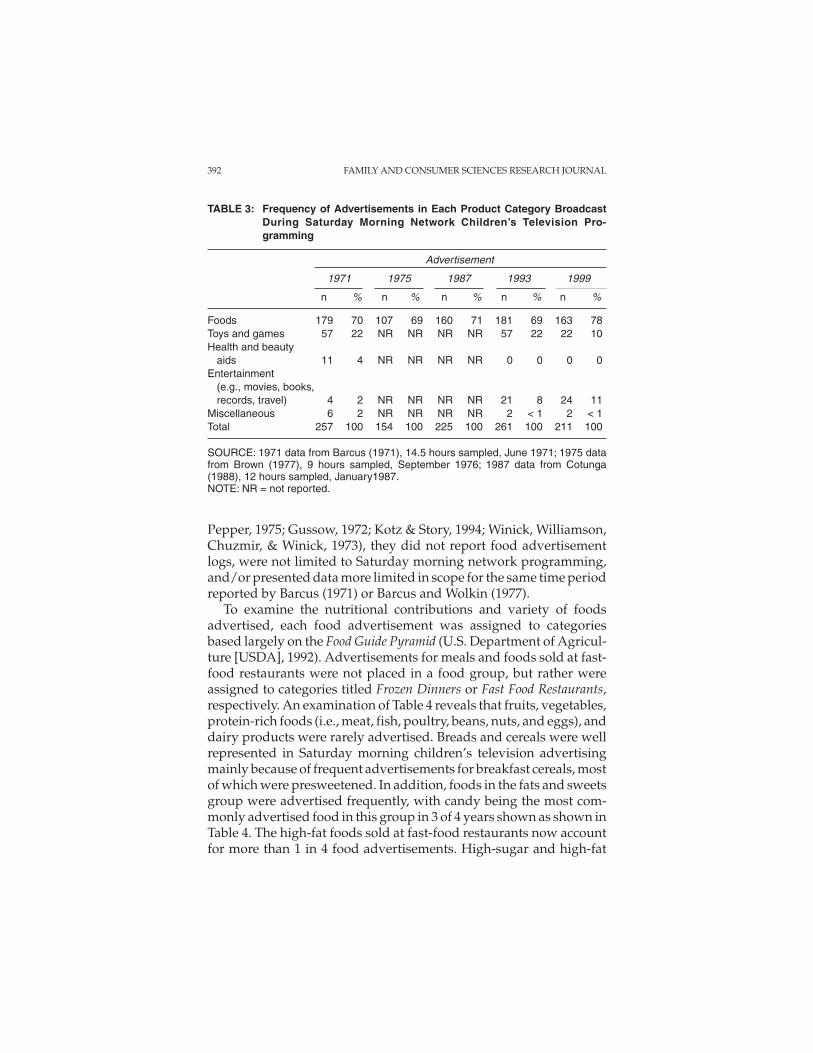
Table 3 shows the type of products advertised on Saturday morn-ing children’s television. For longitudinal comparisons, Table 3 alsoincludes comparable data reported by others (Barcus, 1971; Brown,1977; Cotugna, 1988). In general, over the past three decades, the larg-est category of advertisements was for foods (including beveragesand restaurants). Overall, the percentage of advertisements devotedto foods as well as toys and games remained relatively steady from1971 to 1993. In 1999, the percentage of food and entertainment adver-tisements increased, whereas toy and game advertisementsdecreased.
The high frequency of food advertisements is hardly surprisingconsidering that in 1997, the food and beverage industry accountedfor more than 16% of the $73-billion mass media advertising market—second only to the auto industry (Gallo, 1999). In addition, televisionis the favorite advertising medium used by food manufacturers. In1971, 1975, 1987, 1993, and 1999, Saturday morning children’s televi-sion viewers saw 12.4, 11.9, 13.3, 15.7, and 17.2, respectively, foodadvertisements every hour.
Food Advertisements
Table 4 presents a comparison of the types of foods advertised as apercentage of total food advertisements on network television in1971, 1975, 1993, and 1999. Data for 1971 and 1975 were derived fromthe food advertisement logs reported by others (Barcus, 1971; Barcus &Wolkin, 1977). Although several other studies have examined foodadvertisements on Saturday morning children’s television (Atkin &Heald, 1977; Brown, 1977; Cotugna, 1988; Cuozzo, 1971; Doolittle &
Byrd-Bredbenner / TELEVISION ADVERTISING 391
Pepper, 1975; Gussow, 1972; Kotz & Story, 1994; Winick, Williamson,Chuzmir, & Winick, 1973), they did not report food advertisementlogs, were not limited to Saturday morning network programming,and/or presented data more limited in scope for the same time periodreported by Barcus (1971) or Barcus and Wolkin (1977).
To examine the nutritional contributions and variety of foodsadvertised, each food advertisement was assigned to categoriesbased largely on the Food Guide Pyramid (U.S. Department of Agricul-ture [USDA], 1992). Advertisements for meals and foods sold at fast-food restaurants were not placed in a food group, but rather wereassigned to categories titled Frozen Dinners or Fast Food Restaurants,respectively. An examination of Table 4 reveals that fruits, vegetables,protein-rich foods (i.e., meat, fish, poultry, beans, nuts, and eggs), anddairy products were rarely advertised. Breads and cereals were wellrepresented in Saturday morning children’s television advertisingmainly because of frequent advertisements for breakfast cereals, mostof which were presweetened. In addition, foods in the fats and sweetsgroup were advertised frequently, with candy being the most com-monly advertised food in this group in 3 of 4 years shown as shown inTable 4. The high-fat foods sold at fast-food restaurants now accountfor more than 1 in 4 food advertisements. High-sugar and high-fat
392 FAMILY AND CONSUMER SCIENCES RESEARCH JOURNAL
TABLE 3: Frequency of Advertisements in Each Product Category BroadcastDuring Saturday Morning Network Children’s Television Pro-gramming
Advertisement
1971 1975 1987 1993 1999
n % n % n % n % n %
Foods 179 70 107 69 160 71 181 69 163 78Toys and games 57 22 NR NR NR NR 57 22 22 10Health and beauty
aids 11 4 NR NR NR NR 0 0 0 0Entertainment
(e.g., movies, books,records, travel) 4 2 NR NR NR NR 21 8 24 11
Miscellaneous 6 2 NR NR NR NR 2 < 1 2 < 1Total 257 100 154 100 225 100 261 100 211 100
SOURCE: 1971 data from Barcus (1971), 14.5 hours sampled, June 1971; 1975 datafrom Brown (1977), 9 hours sampled, September 1976; 1987 data from Cotunga(1988), 12 hours sampled, January1987.NOTE: NR = not reported.
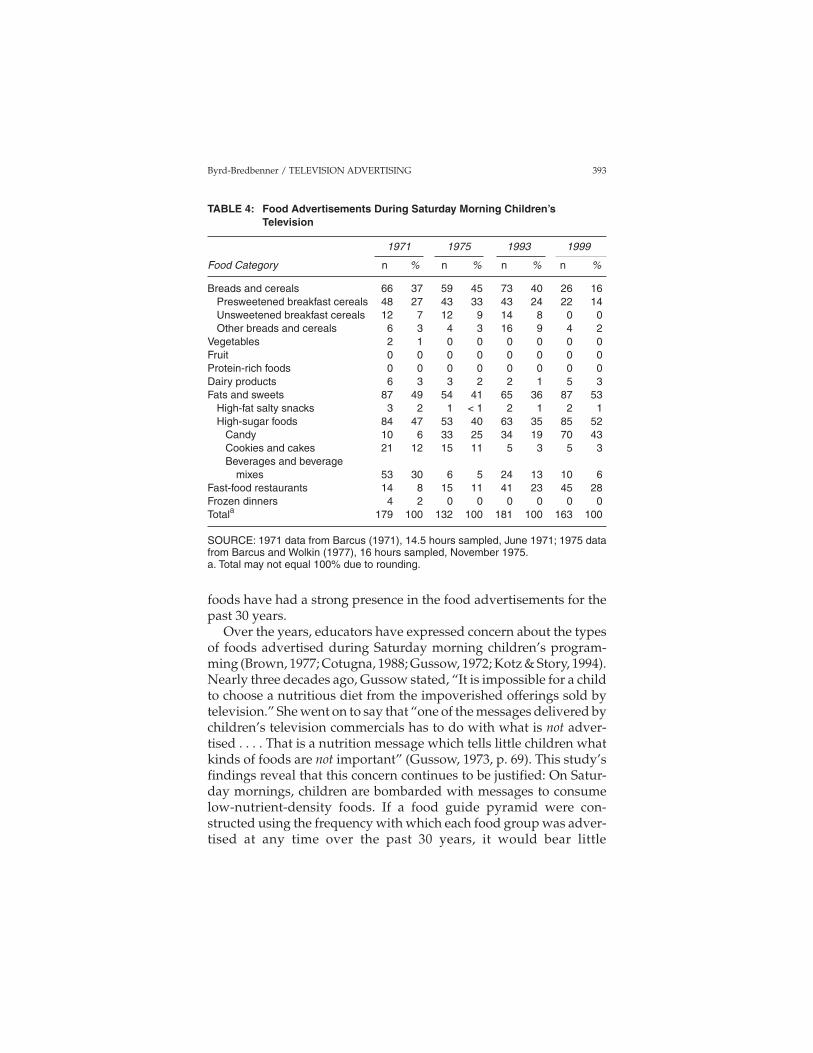
foods have had a strong presence in the food advertisements for thepast 30 years.
Over the years, educators have expressed concern about the typesof foods advertised during Saturday morning children’s program-ming (Brown, 1977; Cotugna, 1988; Gussow, 1972; Kotz & Story, 1994).Nearly three decades ago, Gussow stated, “It is impossible for a childto choose a nutritious diet from the impoverished offerings sold bytelevision.” She went on to say that “one of the messages delivered bychildren’s television commercials has to do with what is not adver-tised . . . . That is a nutrition message which tells little children whatkinds of foods are not important” (Gussow, 1973, p. 69). This study’sfindings reveal that this concern continues to be justified: On Satur-day mornings, children are bombarded with messages to consumelow-nutrient-density foods. If a food guide pyramid were con-structed using the frequency with which each food group was adver-tised at any time over the past 30 years, it would bear little
Byrd-Bredbenner / TELEVISION ADVERTISING 393
TABLE 4: Food Advertisements During Saturday Morning Children’sTelevision
1971 1975 1993 1999
Food Category n % n % n % n %
Breads and cereals 66 37 59 45 73 40 26 16Presweetened breakfast cereals 48 27 43 33 43 24 22 14Unsweetened breakfast cereals 12 7 12 9 14 8 0 0Other breads and cereals 6 3 4 3 16 9 4 2
Vegetables 2 1 0 0 0 0 0 0Fruit 0 0 0 0 0 0 0 0Protein-rich foods 0 0 0 0 0 0 0 0Dairy products 6 3 3 2 2 1 5 3Fats and sweets 87 49 54 41 65 36 87 53
High-fat salty snacks 3 2 1 < 1 2 1 2 1High-sugar foods 84 47 53 40 63 35 85 52
Candy 10 6 33 25 34 19 70 43Cookies and cakes 21 12 15 11 5 3 5 3Beverages and beverage
mixes 53 30 6 5 24 13 10 6Fast-food restaurants 14 8 15 11 41 23 45 28Frozen dinners 4 2 0 0 0 0 0 0Totala 179 100 132 100 181 100 163 100
SOURCE: 1971 data from Barcus (1971), 14.5 hours sampled, June 1971; 1975 datafrom Barcus and Wolkin (1977), 16 hours sampled, November 1975.a. Total may not equal 100% due to rounding.
resemblance to the recommended eating pattern. In addition, thefoods advertised do little to help children work toward achieving thedietary guidelines for Americans (USDA and U.S. Department ofHealth and Human Services, 2000). The data shown in Table 4 indi-cate that former FCC Commissioner Johnson’s statement that “com-mercial television is a nutritional disaster for children” (Johnson,1971, p. 1) continues to be reflective of the “Saturday morning chil-dren’s television diet.”
Food Advertisements and CARU Guidelines
Nutritional benefits. One CARU guideline states that advertise-ments should not mislead children about the product or its perfor-mance characteristics, including its nutritional benefits (BBB, 2000).Although all food advertisements included pictures of the foodsbeing promoted, some included misleading images. The most com-mon misleading image was fresh fruit shown in advertisements forfruit-flavored candy and beverages. Through visual images of fruits,advertisers conveyed a false impression of the fruit content of foodseven though they did not make any false verbal statements. Given thethought processes of young children, it is logical for them to reach theconclusion that fruit-flavored foods must have the same benefits asthe fruit their parents encourage them to eat. In fact, an earlierresearch study found that children in kindergarten through Grade 6were deceived about the real fruit content of cereals and beveragesadvertised on television (Ross, Campbell, Huston-Stein, & Wright,1981). Another CARU guideline indicates that advertisers shouldtake care not to exploit a child’s imagination and the younger child’sdifficulty in distinguishing between the real and the fanciful (BBB,2000). The data suggest that some advertisers are deceiving childrenby falsely implying that the images shown accurately depict the con-tent and nutritional value of the food products advertised.
Another potentially misleading aspect of food advertisements isthe characteristics of individuals who ate advertised foods. In both1993 and 1999, actors actually ate the food advertised in slightly morethan two thirds of the food advertisements. The actors who ate foodtended to be White male children who were thin or average weight(see Table 5). Adults rarely appeared in Saturday morning food com-mercials and when they did, they almost never ate. Asian and His-panic children were almost never shown eating food (3% in 1993 and
394 FAMILY AND CONSUMER SCIENCES RESEARCH JOURNAL
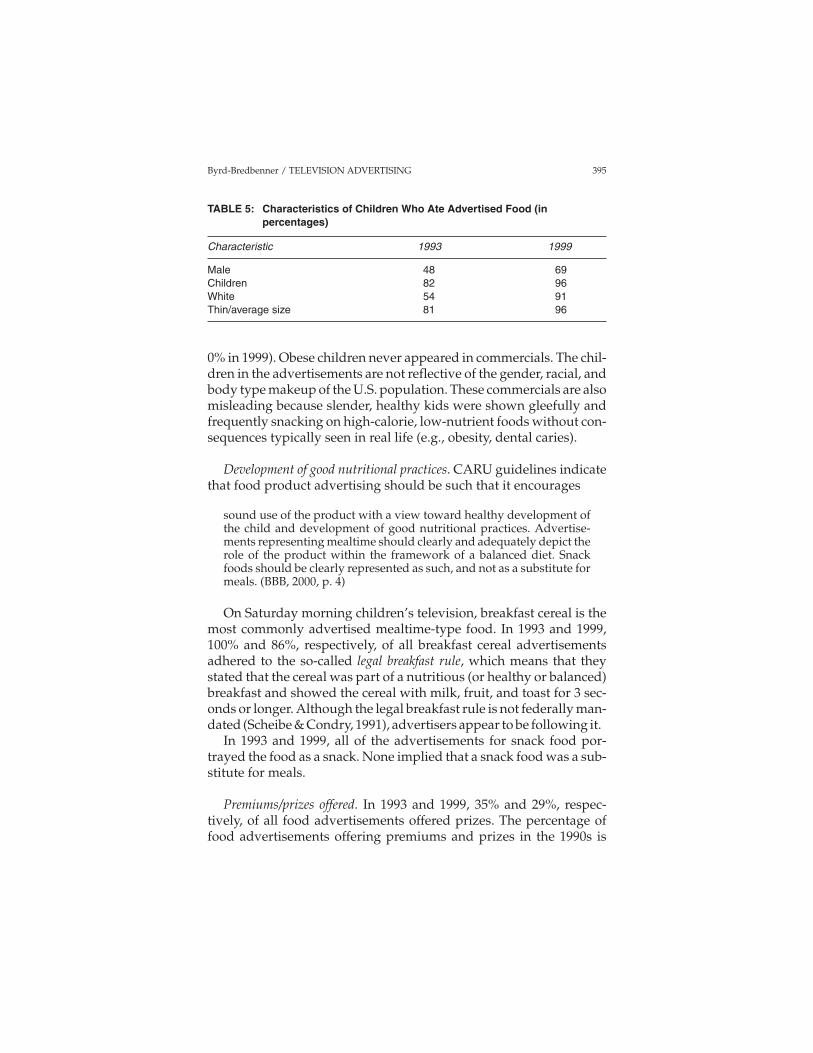
0% in 1999). Obese children never appeared in commercials. The chil-dren in the advertisements are not reflective of the gender, racial, andbody type makeup of the U.S. population. These commercials are alsomisleading because slender, healthy kids were shown gleefully andfrequently snacking on high-calorie, low-nutrient foods without con-sequences typically seen in real life (e.g., obesity, dental caries).
Development of good nutritional practices. CARU guidelines indicatethat food product advertising should be such that it encourages
sound use of the product with a view toward healthy development ofthe child and development of good nutritional practices. Advertise-ments representing mealtime should clearly and adequately depict therole of the product within the framework of a balanced diet. Snackfoods should be clearly represented as such, and not as a substitute formeals. (BBB, 2000, p. 4)
On Saturday morning children’s television, breakfast cereal is themost commonly advertised mealtime-type food. In 1993 and 1999,100% and 86%, respectively, of all breakfast cereal advertisementsadhered to the so-called legal breakfast rule, which means that theystated that the cereal was part of a nutritious (or healthy or balanced)breakfast and showed the cereal with milk, fruit, and toast for 3 sec-onds or longer. Although the legal breakfast rule is not federally man-dated (Scheibe & Condry, 1991), advertisers appear to be following it.
In 1993 and 1999, all of the advertisements for snack food por-trayed the food as a snack. None implied that a snack food was a sub-stitute for meals.
Premiums/prizes offered. In 1993 and 1999, 35% and 29%, respec-tively, of all food advertisements offered prizes. The percentage offood advertisements offering premiums and prizes in the 1990s is
Byrd-Bredbenner / TELEVISION ADVERTISING 395
TABLE 5: Characteristics of Children Who Ate Advertised Food (inpercentages)
Characteristic 1993 1999
Male 48 69Children 82 96White 54 91Thin/average size 81 96
similar to that reported in the mid-1970s (Barcus & Wolkin, 1977).However, unlike the mid-1970s, when most prizes were associatedwith breakfast cereals, in both 1993 and 1999, prizes were most com-mon in fast-food restaurant advertisements. Specifically, 61% and79% of all food advertisements offering prizes in 1993 and 1999,respectively, were for fast food restaurants.
Using premiums and prizes to entice children is generallyregarded as unfair and deceptive because children have difficulty dis-cerning the product advertised from the premium or prize offered.Thus, CARU guidelines state that advertisers should focus the child’sattention primarily on the product and any premium message shouldbe clearly secondary (BBB, 2000). Of the food advertisements offeringa prize in 1993, approximately half (52%) focused mainly on the prod-uct rather than the prize. However, in 1999, only 13% of these adver-tisements focused on the food—the overwhelming majority (87%)focused primarily on the prize.
The current frequent practice of focusing on prizes and premiumsin food advertisements is particularly troubling because it encour-ages children to choose food on the basis of a prize that is totally unre-lated to the value of the food. Also, it is unreasonable to expect chil-dren to disregard the promise of an attractive free toy and chooseanother food, without a toy, because it is more nutritious (Barcus &Wolkin, 1977). The persuasive power of advertisements influenceschildren, who, in turn, influence family food-purchasing choices(Galst & White, 1976). Thus, the impact of prizes on the dietary intakeof the entire family should not be discounted. One parent recentlyreported, “It’s the cool promotions that drug us into restaurants weotherwise might pass up” (Hook, 1999, p. 14A).
Coercion features present in advertisements. One CARU guidelineindicates that advertisers should avoid using extreme sales pressurein child-targeted advertisements. This sales pressure extends to tell-ing children to urge parents or others to buy products or implying thatadults who purchase the advertised product for children are better,smarter, or more generous (BBB, 2000). None of the advertisementssampled in 1993 and 1999 had a coercion feature present. Specifically,none directed children to ask parents to purchase the advertisedproduct or implied that adults who buy the advertised product forchildren are somehow superior to those who do not make suchpurchases.
396 FAMILY AND CONSUMER SCIENCES RESEARCH JOURNAL
Another CARU guideline is that advertising should not misleadchildren about benefits from use of the product by implying that theproduct leads to acquisition of characteristics such as status, popular-ity, strength, growth proficiency, or intelligence. Of the advertise-ments sampled in 1993 and 1999, none explicitly stated that childrenwho buy the advertised product would be more popular or have morefriends if they purchased the product. However, advertisements thatdepicted the food with attractive children in desirable settings mayhave implied that the food could increase social status.
Research findings have demonstrated that the appearance of a tele-vision character with a product can significantly alter a child’s per-ception of the product and may interfere with a child’s ability to dis-tinguish between programs and advertisements (BBB, 2000). As aresult, a CARU guideline discourages host selling. Host selling iswhen program personalities, either live or animated, are used inadvertisements adjacent to the programs featuring the same person-alities (BBB, 2000). In 1993 and 1999, as in 1975 (Barcus & Wolkin,1977), there were no instances of host selling noted in the food adver-tisements studied. However, in 1999, one advertisement for a toystore, shown thrice, offered a poster depicting myriad cartoon charac-ters as a premium. The characters on the poster were in the three pro-grams on which this advertisement was broadcast.
CONCLUSION AND IMPLICATIONS
For the past 30 years, the foods advertised on Saturday morningchildren’s television have been largely presweetened breakfast cere-als and low-nutrient-density foods, namely candy and fast foods.Advertisements for dairy products, fruits, vegetables, and protein-rich foods almost never appeared. The Saturday morning children’stelevision diet is strikingly similar to the actual diet of the Americanpopulation; that is, a diet high in sugar and fat and low in fruits, vege-tables, and whole grains (Putnam & Allshouse, 1999; Tippett & Cleve-land, 1999; U.S. Department of Health and Human Services, 1988).The impact of fast food restaurant eating on nutritional status is ofconcern. Between 1977 and 1995, the nutrient density of foods pre-pared at home increased to a much greater level than did foods pre-pared away from home (Lin, Frazao, & Guthrie, 1999). Also of concernis evidence that increases in fast food availability along with
Byrd-Bredbenner / TELEVISION ADVERTISING 397
television viewing may contribute to rising obesity rates in the UnitedStates (S. W. Jeffrey & French, 1998).
Although the actual and the Saturday morning children’s televi-sion diets share many similarities, the extremely limited inclusion ofoverweight children in food advertisements does not accurately depictthe current situation in the United States where an estimated 10% ofchildren are overweight or obese (Centers for Disease Control andPrevention, 2000). This contrast raises issues concerning the inherent,yet confusing, message that it is possible to consume the calorie-ladenfoods advertised on television and remain healthy and slender.
“Advertising’s critics have generally held that advertising shapesour way of life, whereas advertising’s defenders have argued thatadvertising merely echoes existing patterns” (Belk & Pollay, 1985,p. 888). Regardless of whether food advertising on Saturday morningchildren’s television is shaping or echoing American children’s eatingpatterns, its message is problematic. That is, if food advertisementsare only echoing existing patterns, for the past 30 years they have beenreinforcing food choices that are not recommended. Alternatively, iffood advertisements are shaping eating patterns, they are teachingfood habits that are not recommended.
The prevalence of health messages in television advertising thatrun counter to current recommendations coupled with the potentialimpact advertisements may have on dietary behavior suggests thatchanges are needed. However, historical evidence indicates that legis-lative activities to further regulate television advertising are not likelyto result in monumental changes. Thus, alternative methods areneeded to help Americans, particularly children, use advertisingmessages effectively. One way to help reduce the adverse impact oftelevision advertising on children’s attitudes and behaviors is toincorporate media literacy programs into the school curriculum(AAP, 1999). Media literacy programs teach children how to seethrough or “decipher the purpose and message of media rather thanaccepting it at face value” (AAP, 1999, p. 341). Media literacy pro-grams are particularly important for children because they are veryimpressionable and tend to have difficulty in interpreting informa-tion provided via television and in distinguishing reality from fan-tasy (Ambrosino, 1972; Centerwall, 1992; Condry & Freund, 1989;Derksen & Strasburger, 1994; Singer, Zuckerman, & Singer, 1980; VanEvra, 1998). In fact, a growing body of data indicate that media liter-acy programs can help children and teens understand and appreciate
398 FAMILY AND CONSUMER SCIENCES RESEARCH JOURNAL
the value of media while helping them to resist the negative influenceof messages embedded in media and, in the case of advertisements,make better purchasing decisions. For instance, evaluation studies ofseveral media literacy programs have shown that elementary school–age children who participated in such programs are better able to crit-ically evaluate advertisements (AAP, 1999). In addition, anothermedia literacy program helped change reported attitudes toward theintention to drink alcohol (AAP, 1999).
Although this study has generated a rich picture of advertising onSaturday morning children’s television, it is important to recognizethe limitations of this study. It must be noted that the data were gath-ered over a rather narrow period of time (i.e., a single month in vari-ous years). Earlier research provides evidence that advertising to chil-dren varies seasonally. Specifically, toy and game advertisements risesignificantly in the fourth quarter with a concomitant fall in foodadvertisements (Barcus & Wolkin, 1977). Also, the results are limitedto Saturday morning television and may not be generalizable to otherbroadcasting time periods targeted to children. A further potentiallimitation is the use of data previously collected by other researchers.However, a great deal of care was exercised to ensure that the researchmethods use by others were as comparable as possible with the meth-ods used by the author.
Despite the study’s limitations, the findings indicate that familyand consumer science (FCS) professionals need to be cognizant of thefrequency and type of advertising broadcast on Saturday morningchildren’s television. There are more than 43 million children betweenthe ages of 2 and 12 in this country—on most Saturday mornings theywatch an average of 73 minutes of television (Nielsen MediaResearch, 1998). Approximately one quarter of their viewing time willbe spent watching commercial advertising. Although the impact oftelevision on the individual viewer may vary, “there is little denyingthat the influence of television is great on both the individual andsocietal levels” (Blum, 1990, p. 86). In terms of nutritional status, tele-vision impacts our youth in three ways. “First, it educates about foodthrough programs and advertisements, second, it establishes normsregarding body image, and third, it facilitates a sedentary lifestyle”(Blum, 1990, p. 89). Because the aim of advertising is to change an atti-tude or behavior as quickly as possible (Newcomb & Hirsch, 1987), itis important for FCS professionals to remain abreast of television’scontent and its potential influence on children and families. Anawareness of what television is teaching its students also can help us
Byrd-Bredbenner / TELEVISION ADVERTISING 399
to more effectively do our job as FCS educators. That is, this knowl-edge can enable us to more effectively incorporate media literacy con-cepts and skills into consumer education and parenting courses sothat children and families can better reap the benefits of televisionviewing while minimizing the risks.
REFERENCES
Action for Children’s Television. (1991). Choices for children. An action kit to implement theChildren’s Television Act. Cambridge, MA: Author.
Adler, R.P. (1980). Children’s television advertising: History of the issue. In E.L. Palmer &A. Dorr (Eds.), Children and the faces of television. Teaching, violence, selling. New York:Academic Press.
Ambrosino, L. (1972). Do children believe TV? Children Today, 1, 18-19.American Academy of Pediatrics. (1999). Media education. Pediatrics, 104, 341-343.American Dietetic Association. (1999). Position of the American Dietetic Association:
Dietary guidance for healthy children aged 2 to 11 years. Journal of the AmericanDietetic Association, 99, 93-101.
Andersen, R. D., Crespo, C. H., Bartlett, S. J., Cheskin, L. J., & Pratt, M. (1998). Relation-ship of physical activity and television watching with body weight and level of fat-ness among children: Results from the Third National Health and Nutrition Exami-nation Survey. Journal of the American Medical Association, 279, 938-942.
Atkin, C., & Heald, G. (1977). The content of children’s toy and food commercials. Jour-nal of Communications, 27(Winter), 107-114.
Bandura, A. (1977). Social learning theory. Englewood Cliffs, NJ: Prentice Hall.Barcus, F. E. (1971). Saturday children’s television: A report of TV programming and advertis-
ing on Boston Commercial Television. Newtonville, MA: Action for Children’sTelevision.
Barcus, F. E. (1978). Commercial children’s television on weekends & weekday afternoons: Acontent analysis of children’s programming and advertising broadcast in October, 1977.Newtonville, MA: Action for Children’s Television.
Barcus, F. E., & Wolkin, R. (1977). Children’s television: An analysis of programming andadvertising. New York: Praeger.
Belk, R. W., & Pollay, R. W. (1985). Images of ourselves: The good live in twentieth cen-tury advertising. Journal of Consumer Research, 11, 887-897.
Benton Foundation. (1998). Advisory committee on public interest obligations of Digital Tele-vision Broadcasters. The public interest standard in television broadcasting. Washington,DC: Author.
Berelson, B. (1971). Content analysis in communications research. New York: Hafner.Better Business Bureau. (2000). The Children’s Advertising Review Unit: Self regulatory
guidelines for children’s advertising. Retrieved November 5, 2000, fromwww.bbb.org/advertising/caruguid.asp
Blum, R. (1990). Executive summary. Journal of Adolescent Health Care, 11, 86-90.Brown, J. (1977). Graduate students examine TV ads for food. Journal of Nutrition Educa-
tion, 9, 120-121.
400 FAMILY AND CONSUMER SCIENCES RESEARCH JOURNAL
Center for Media Education. (1996). Afield guide to the Children’s Television Act. RetrievedAugust 13, 1999, from www.cme.org/children/kids_tv/fguide.html
Centers for Disease Control and Prevention. (2000). CDC’s guidelines for school and com-munity programs. Promoting lifelong physical activity. Retrieved November 12, 2000,from www.cdc.gov/nccdphp/dash/phactaag.htm
Centerwall, B. S. (1992). Television and violence. The scale of the problem and where togo from here. Journal of the American Medical Association, 267, 3059-3063.
Children Now. (1998). A different world. Children’s perceptions of race and class in media.Retrieved October 15, 1998, from www.childrennow.org/media/mc98/DiffWorld.html
Children’s Television Act of 1990, H.R. 1677 (1990).Condry, J., Bence, P., & Scheibe, C. (1988). Non-program content of children’s television.
Journal of Broadcasting and Electronic Media, 32, 255-270.Condry, J., & Freund, S. (1989, April). Discriminating real from make-believe on television: A
developmental study. Paper presented at the annual meeting of the Society forResearch on Child Development, Kansas City, MO.
Cotugna, N. (1988). TV ads on Saturday morning children’s programming—What’snew? Journal of Nutrition Education, 20, 125-127.
Cuozzo, P. F. (1971). An inquiry into the image of food and food habits as presented by televisionfood commercials. Unpublished master’s thesis. University of Pennsylvania,Philadelphia.
Derksen, D. J.,& Strasburger, V. C. (1994). Children and the influence of the media. Pri-mary Care, 21, 747-758.
Dietz, W. H. (1993). Television, obesity, and eating disorders. Adolescent Medicine: Stateof the Art Reviews, 4, 543-549.
Dietz, W. H., & Gortmaker, S. L. (1985). Do we fatten our children at the television set?Obesity and television viewing in children and adolescents. Pediatrics, 75, 807-812.
Dietz, W. H., & Strasburger, V. C. (1991). Children, adolescents and television. CurrentProblems in Pediatrics, 21, 8-32.
Doolittle, J., & Pepper, R. (1975). Children’s TV ad content: 1974. Journal of Broadcasting,19, 131-142.
Dussere, S. D. (1976). The effects of television advertising on children’s eating habits. Unpub-lished master’s thesis, University of Massachusetts, Amherst.
Everett, S. H., Schnuth, R. L., & Tribble, J. L. (1998). Tobacco and alcohol use in top-grossing American films. Journal of Community Health, 23, 317-324.
Gallo, A. E. (1999). Food advertising in the United States. In E. Frazao (Ed.), America’seating habits: Changes and consequences (Agriculture Information Bulletin No. 750).Washington, DC: U.S. Department of Agriculture.
Galst, J., & White, M. (1976). The unhealthy persuader: The reinforcing value of televi-sion and children’s purchase-influence attempts at the supermarket. Child Develop-ment, 47, 1089-1094.
Goldsmith, M. F. (1990). Youngsters dialing up cholesterol levels? Journal of the Ameri-can Medical Association, 264, 2976.
Greenberg, B. S. (1982). Television and role socialization: An overview. In D. Pearl,L. Bouthilet, & J. Lazar (Eds.), Television and behavior: Ten years of scientific progress andimplications for the eighties. Vol. 2: Technical Reviews. (DHHS Publication No. ADM 82-1196). Rockville, MD: U.S. Department of Health and Human Services, PublicHealth Service, Alcohol, Drug Abuse, and Mental Health Administration, NationalInstitute of Mental Health.
Byrd-Bredbenner / TELEVISION ADVERTISING 401
Gussow, J. (1972). Counter nutritional messages of TV ads aimed at children. Journal ofNutrition Education, 4, 48-52.
Gussow, J. (1973). It makes even milk a dessert. A report on the counternutritional mes-sages of children’s television advertising. Clinical Pediatrics, 12, 68-71.
Hook, J. (1999, August 11). Gizmos sell fast food. Letters. USA Today, p. 14A.Jeffrey, D. B., McLellarn, R. W., & Fox, D. T. (1982). The development of children’s eating
habits: The role of television commercials. Health Education Quarterly, 9, 174-189.Jeffrey, S. W., & French, S. A. (1998). Epidemic obesity in the United States: Are fast
foods and television viewing contributing? American Journal of Public Health, 88, 277-280.
Johnson, N. (1971, October 20). TV a nutritional disaster says FCC’s Johnson in RC: Kid-die shows. Variety, 264(10), 1, 38.
Kotz, K., & Story, M. (1994). Food advertisements during children’s Saturday morningtelevision programming: Are they consistent with dietary recommendations? Jour-nal of the American Dietetic Association, 94, 1296-1300.
Krippendorf, K. (1980). Content analysis: An introduction to its methodology. Beverly Hills,CA: Sage.
Kunkel, D., & Gantz, W. (1992). Children’s television advertising in the multichannelenvironment. Journal of Communications, 42, 134-152.
Lin, B. H., Frazao, E., & Guthrie, J. (1999). Away-from-home foods increasingly important toquality of American diet. (Agricultural Information Bulletin No. 749). Washington,DC: U.S. Department of Health and Human Services, Food and Rural EconomicsDivision, Economic Research Service.
Newcomb, H., & Hirsch, P. M. (1987). Television as a cultural forum. In H. Newcomb(Ed.), Television, the critical view (4th ed.). New York: Oxford University Press.
Nielsen Media Research. (1998). Report on television 1998. New York: Author.Pearl, D., Bouthilet, L., & Lazar, J. (Eds.). (1982). Television and behavior: Ten years of scien-
tific progress and implications for the eighties (DHHS Publication Nos. ADM 82-1195 &ADM 82-1196). Rockville, MD: U.S. Dept. of Health and Human Services, PublicHealth Service, Alcohol, Drug Abuse, and Mental Health Administration, NationalInstitute of Mental Health.
Pratt, C. A., & Pratt, C. B. (1995). Comparative content analysis of food and nutritionadvertisements in Ebony, Essence, and Ladies’ Home Journal. Journal of Nutrition Edu-cation, 27, 11-17.
Putnam, J. J., & Allshouse, J. E. (1999). Food consumption, prices, and expenditures, 1970-97(Statistical Bulletin No. 965). Washington, DC: U.S. Department of Agriculture,Food and Rural Economics Division, Economic Research Service.
Ross, R. P., Campbell, T., Huston-Stein, A., & Wright, J. (1981). Nutritional misinforma-tion of children: A developmental and experimental analysis of the effects of tele-vised food commercials. Journal of Applied Developmental Psychology, 1, 329-347.
Sama, A. (1993, July 2). Mom is TV’s best remote controller. Wresting back the raising ofyour kids from programmers and pitchmen. USA Today, p. 1.
Scheibe, C., & Condry, J. (1991, April). Program and non-program content of children’s tele-vision, 1970-1990. Paper presented at the biennial meeting of the Society forResearch in Child Development, Seattle, WA.
Signorielli, N. (1990). Children, television and gender roles: Messages and impact. Jour-nal of Adolescent Health Care, 11, 50-58.
Signorielli, N., & Staples, J. (1997). Television and children’s conceptions of nutrition.Health Communications, 9, 289-301.
402 FAMILY AND CONSUMER SCIENCES RESEARCH JOURNAL
Singer, D. G., Zuckerman, D. M., & Singer, J. L. (1980). Helping elementary school chil-dren learn about TV. Journal of Communications, 30, 84-93.
Smith, F. A., Trivax, G., Zuehlke, D. A., Lowinger, P., & Nghiem, T. L. (1972). Healthinformation during a week of television. New England Journal of Medicine, 286, 516-520.
Taras, H. L., Sallis, J. F., Patterson, T. L., Nader, P. R., & Nelson, J. A. (1989). Television’sinfluence on children’s diet and physical activity. Journal of Developmental and Behav-ioral Pediatrics, 10, 176-180.
Tippett, K. S., & Cleveland, L. E. (1999). How current diets stack up. Comparison withdietary guidelines. In E. Frazao (Ed.), America’s eating habits: Changes and conse-quences (Agriculture Information Bulletin No. 750). Washington, DC: U.S. Depart-ment of Agriculture.
U.S. Department of Agriculture. (1992). The food guide pyramid (Home and Garden Bul-letin No. 252). Washington, DC: Author.
U.S. Department of Agriculture and U.S. Department of Health and Human Services.(2000). Nutrition and your health: Dietary guidelines for Americans (5th ed.). (Home andGarden Bulletin No. 232). Washington, DC: Government Printing Office.
U.S. Department of Health and Human Services. (1988). The Surgeon General’s report onnutrition and health. Washington, DC: Government Printing Office.
Van Evra, J. (1998). Television and child development (2nd ed.). Hillsdale, NJ: LawrenceErlbaum.
Watkins, B. (1985). Television viewing as a dominant activity of childhood: A develop-mental theory of television effects. Critical Studies in Mass Communication, 2, 323-337.
Wilson, P. M., & Christopher, F. C. (1992). The home-television environment: Implica-tions for families. Journal of Home Economics, 83(Winter), 27-31.
Winick, C., Williamson, L. G., Chuzmir, S. F., & Winick, M. P. (1973). Children’s televisioncommercials. A content analysis. New York: Praeger.
Wong, H. D., Hei, T. K., Qaqundah, P. Y., Davidson, D. M., Bassin, S. L., & Gold, K. V.(1992). Television viewing and pediatric hypercholesterolemia. Pediatrics, 90, 75-79.
Byrd-Bredbenner / TELEVISION ADVERTISING 403