Embed Size (px)
Citation preview
Saving Behavior Assessment Survey in Georgia
Report on Quantitative Survey Version: 2.0 Prepared for Savings Banks Foundation for International Cooperation January, 2011 Tbilisi, Georgia
Saving Behavior Assessment Survey in Georgia, January, 2011 2/19
Contents 1. Introduction __________________________________________________________ 3
2. Survey Design _________________________________________________________ 4
2.1. Survey Goal and Objectives _______________________________________________________ 4
2.2. Survey Methodology _____________________________________________________________ 5
3. Survey Results _________________________________________________________ 6
3.1. The Assessment of Saving Behavior _________________________________________________ 6
3.1.1. Attitude toward Money and Spending Habits ___________________________________________________ 6 3.1.2. Savers by Self-Identification vs. Savers by Actual Behavior ________________________________________ 7 3.1.3. Spending-Saving Pattern ____________________________________________________________________ 8 3.1.4. Potential Spending-Saving Pattern ____________________________________________________________ 8 3.1.5. Factors Affecting the Decision to Save or Not to Save ____________________________________________ 9 3.1.6. Preferred Places/Means of Saving Money and Their Selection Criteria _____________________________ 11 3.1.7. The Possibility of Deposit Insurance _________________________________________________________ 12 3.1.8. Making a Deposit _________________________________________________________________________ 13
3.2. The Analysis of Banking Experience ________________________________________________ 16
3.2.1. The Awareness of Banks ___________________________________________________________________ 16 3.2.2. The Use of Banks _________________________________________________________________________ 17 3.2.3. The Use of Bank Products and Services _______________________________________________________ 17 3.2.3. Factors Causing Loyalty and Disloalty toward a Bank ___________________________________________ 18
3.3. Demographic and Socio-Economic Structure of the Georgian Population _________________ 18
Annex #1 – Graphical Report on Saving Behavior Assessment Survey in Georgia
Saving Behavior Assessment Survey in Georgia, January, 2011 3/19
1. Introduction
This document is the analytical report on “Saving Behavior Assessment Survey in Georgia” prepared for Savings Banks Foundation for International Cooperation by ACT Research.
Savings Banks Foundation for International Cooperation (SBFIC) made a decision to study the saving behavior of the Georgian population. To achieve this purpose, SBFIC contacted the analytical and consulting group ACT. ACT, in agreement with SBFIC, developed the survey design and defined the specific objectives and methodology.
The project employed the face-to-face interviewing technique of quantitative survey. The survey was carried out in the whole country in December 2010.
The given document presents the main findings of Saving Behavior Assessment Survey in Georgia.
Saving Behavior Assessment Survey in Georgia, January, 2011 4/19
2. Survey Design
2.1. Survey Goal and Objectives
The goal of this survey was to assess the saving behavior of the Georgian population. Based on the survey goal, specific objectives have been defined: Assessing the saving behavior of the Georgian population through studying the following aspects:
Attitudes toward money, saving and spending habits Self-identification as a saver and a non-saver Actual and potential saving behavior Factors determining the decision to save or not to save Preferred means of saving Saving in a bank vs. saving at another place The effect of deposit insurance possibility Risks considered when making a deposit Criteria for selecting a bank to make a deposit Choice between time and demand deposits Choice among currencies when making a deposit Characteristics of currencies considered first of all when making a deposit Optimal interest rate on deposits denominated in Georgian Lari Possible reasons for withdrawing money from a bank
Analyzing banking experience through studying the following aspects:
The awareness and use of banks The awareness and use of bank products and services Factors causing loyalty and disloyalty toward banks
Studying demographic and socio-economic structure of the population
Saving Behavior Assessment Survey in Georgia, January, 2011 5/19
2.2. Survey Methodology
The survey employed the quantitative survey method via the use of face-to-face interviewing technique and was carried throughout the country.
Two-step clusterization with preliminary stratification was used as the sampling method. For stratification, the country was divided into three parts – Tbilisi, cities/villages with population above 5000 (labeled simply as “cities” hereafter), and cities/villages with population below 5000 (labeled simply as “villages” hereafter). Overall, 500 respondents have been surveyed. Out of these, 100 were surveyed in Tbilisi, 100 in cities and 300 in villages. (See table #1).
The census districts formed during the general census of 2002 were used for clusterization. In each cluster 10 respondents were interviewed, selected by the random walk principle. The starting point, the step and the route were determined in advance. The final selection of a respondent was carried out according to the last birthday principle.
Weighting was performed to make data aggregation and generalization possible.Weighting coefficients were calculated according to strata and gender and age categories were taken into consideration.
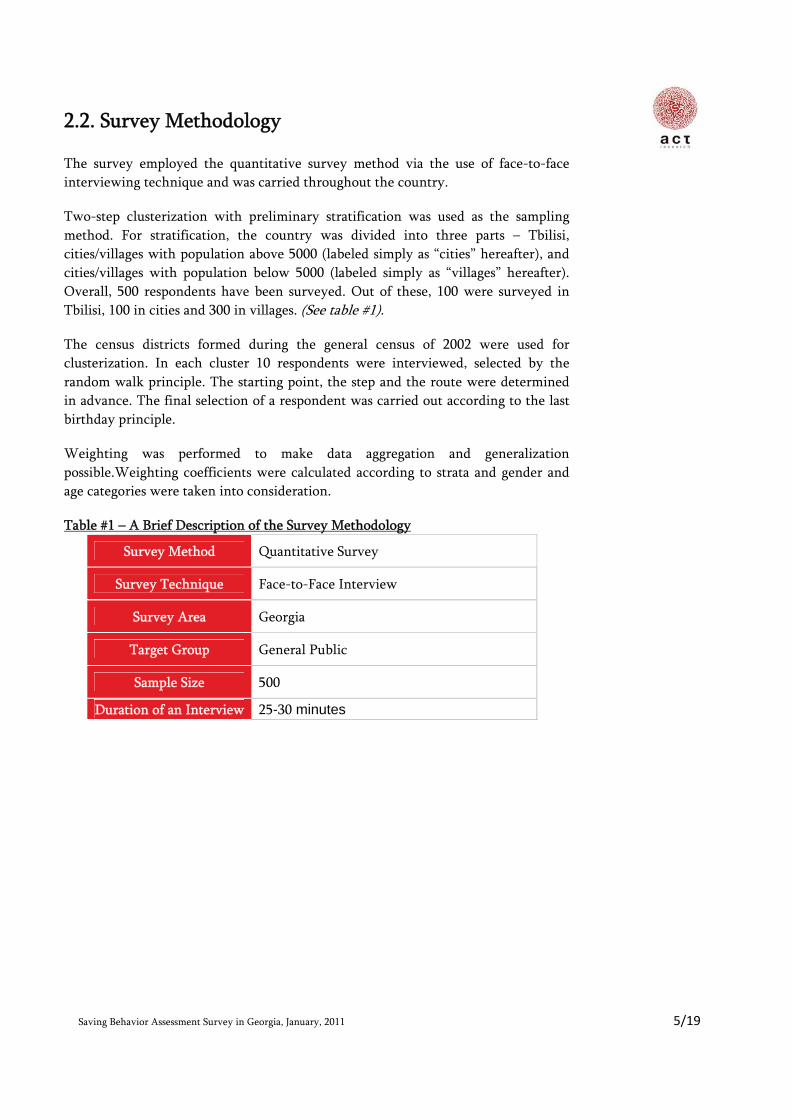
Table #1 – A Brief Description of the Survey Methodology
Survey Method Quantitative Survey
Survey Technique Face-to-Face Interview
Survey Area Georgia
Target Group General Public
Sample Size 500
Duration of an Interview 25-30 minutes
Saving Behavior Assessment Survey in Georgia, January, 2011 6/19
3. Survey Results
3.1. The Assessment of Saving Behavior
3.1.1. Attitude toward Money and Spending Habits
The attitudes of Georgians toward money, their saving and spending habits have been studied on the basis of pre-defined statements that were evaluated by the respondents. The results bring us to several important conclusions about the topic of this survey. Based on data analysis, it could be inferred that saving habit is by far not an inherent characteristic of the Georgian population – 84% of the population does not usually manage to put money aside from the monthly income. This conclusion is backed up by 66% of the population stating that they spend the major part of their income as soon as they get it, especially taking into account that 76% of the population often face unforeseen expenses. This could be telling us that a large part of the Georgian population spends money in an unsystematic manner without a careful spending plan – otherwise it is hard to imagine what could be causing such frequent unforeseen expenses. 70% of the population states that low income prevents them from saving money. Together all these percentage indicators could imply that saving is mostly hindered by a very low income level and unsystematic, unplanned spending behavior. Later, the relative importance of income and expenditures on saving will be tested via a more rigorous statistical setting using regression analysis.
A very interesting pattern becomes apparent when looking at statistical data – even though the level of spending is very high, it does not induce an equivalently high level of indebtedness in the population, which is somewhat contrary to what one would expect. Only 34% of the population state that all of their major purchases have been made by borrowed money. This goes pretty much in line with the following findings: 73% of the population hates debts and tries not to borrow money, and 79% prefers postponing business until they have money rather than borrowing it. Therefore, debt aversion seems to be quite prevalent in the country.
An important link between spending and debt aversion could be discerned while looking at the results of statistical analysis – only 32% of the population states that they spend money excessively/uncontrollably today relying on the possibility of
Saving Behavior Assessment Survey in Georgia, January, 2011 7/19
borrowing tomorrow. In a way this could be enforcing the idea that the low level of saving observed in the country is driven by unsystematic spending behavior not backed by sufficient income levels rather than the population’s natural propensity to spend in excessive amounts. Apparent debt aversion renders the latter possibility less plausible. To reinforce this finding, only 5% of the population states that they have particular affinity for spending.
One more implication could be drawn from the survey results – some changes have seemingly been taking place in the mentality of the Georgian society. If in previous decades the urge of paying the bills for friends in bars, restaurants or cafes was rather common, 71% of the population claims not to hold on to this type of behavior today.
3.1.2. Savers by Self-Identification vs. Savers by Actual Behavior
Survey results show that 23% of the population identify themselves as savers, whereas 49% identify themselves as non-savers. The self-identification pattern in Tbilisi, however, does not fit into the overall trend – only 16% identify themselves as savers and 62% identify themselves as non-savers. It is also quite informative to look at the gender breakdown when it comes to the self-identification issue. The share of females who consider themselves savers (27%) is higher than the analogous indicator for males (19%).
It is very important to bear in mind that self-identification as a saver does not necessarily go in line with the actual saving behavior. It is indispensable to look at the latter separately and only then observe how these two notions interact.
According to survey data, the share of those who save money currently (either personally or as a family) is 16%. However, almost a quarter of Tbilisi population seems to be saving money, namely 24%. This could be explained by the fact that the income level in the capital is significantly higher than in the regions. The validity of this explanation, i.e. hypothesized importance of the income level, will be tested later, when the factors determining the saving decision will be analyzed.
Juxtaposing the notions of a saver by self-identification and a saver by behavior, quite a logical trend emerges overall: the share of those who actually save falls short of the share who consider themselves savers. The trend observed in Tbilisi, however, deserves considerable attention – only 16% of the population in the capital treat themselves as savers, but the percentage of those who actually save is higher – 24%. This indicates to the existence of a certain type of people who are savers but do not
Saving Behavior Assessment Survey in Georgia, January, 2011 8/19
feel comfortable with the saver’s self-image and prefer to think of themselves as non-savers or neutral.
3.1.3. Spending-Saving Pattern
First of all, it is worth noting that saving in the Georgian population lacks regularity and is quite chaotic – 74% of the population claims that they save money whenever possible rather than systematically. This pattern is particularly apparent in villages, where the respective indicator reaches 83%.
As for the shares of income allocated to spending and saving, no statistically significant difference is observed across the regions, which allows us to assert that both in Tbilisi and in cities as well as in villages the percentage of monthly income saved is around 20%1 on average.
Looking at the spending-saving pattern in the gender breakdown helps us arrive at an interesting conclusion: the share of monthly income saved is higher in women than in men (25% as opposite to 15%). This does not imply that saving is higher in women than in men in absolute amounts, since men usually earn more than women, but the difference in percentage terms is still important and statistically significant. Such an outcome can be indicative of the possibility that women plan their spending more rigorously and are more realistic about the financial needs of their families.
3.1.4. Potential Spending-Saving Pattern2
In case income doubles, the odds of saving and not saving become almost equal when looking at the general picture – 51% of the population plans to save money if they get twice as much income as they have now, and 49% does not plan to save money even in this case. Here it is rather interesting to look at the regional breakdown – the share of potential saving is much higher in Tbilisi (67%) than in cities or villages (47% and 44%, respectively) in case income doubles. Such a difference can be the result of a significantly low income level in the regions compared to that in the capital city –
1 This result has been calculated based on the information provided by only those respondents who save money currently.
2 In the current survey potential saving is defined as the saving level in the country (in percentage terms) in case income doubles.
Saving Behavior Assessment Survey in Georgia, January, 2011 9/19
most likely, income in the regions is so low that even its doubling would not lead to a drastic increase in saving.
Interestingly, 55% of the female population declares to be willing to save money if income doubles, whereas in males the same indicator is only 46%. This goes in line with the previous observation that women in Georgia are more prone to save money than men.
Looking at the contrast between current and potential saving, we come to the conclusion that in Tbilisi the doubling of income is likely to have the highest positive effect on saving (current saving - 24%, potential saving – 67%) as compared to the same effect in cities and villages. However, the reader should be wary of the fact that the percentages of potential saving have been calculated according to the plans declared by the respondents, which may not be a good forecast of the true potential saving in case income doubles.
Analyzing the saving plans of those who don’t save currently shows us that out of these people 59% are still not planning to save money even if income doubles. This could imply that even though income is one of the most important factors affecting the decision to save or not to save, it is not the only one. This should not come as a surprise, since the Georgian society as a whole is generally not in the habit of saving money and this fact itself may be a very significant obstacle for increasing the overall saving level in the country.
3.1.5. Factors Affecting the Decision to Save or Not to Save
Those who find themselves reluctant to save money even if income doubles mostly name large expenses as the major hampering factor (57%).
The following trend becomes apparent when looking at the regional breakdown: Even though the share of the people who don’t save currently and would not save even if income doubled is the lowest in Tbilisi (33%), this segment of the capital seems to have more kinship for and higher propensity toward spending as compared to the analogous segment in cities and villages - 35% of Tbilisi population admits that the more money they have, the more they desire, 22% declares that they prefer spending money today since they don’t know what will happen tomorrow, and 18% states that they just love spending money.
Another interesting implication catches the eye – in villages 11% of those who don’t save and aren’t going to save even if income doubles state that the major reason for not
Saving Behavior Assessment Survey in Georgia, January, 2011 10/19
wanting to save money is the desire to invest in business. Surprisingly, the analogous indicator is only 3% in Tbilisi.
As for the most important purpose of saving/accumulating money, the purchase of real estate and the financing of children’s education happen to be the two driving motivators for saving (24% and 20%, respectively). Incidentally, children’s education turns out to be the top purpose of saving in Tbilisi and in cities. A contrasting picture emerges in villages, where children’s education (13%), as the motive for saving, is not as important as the improvement of social conditions (20%).
A more rigorous way to identify the factors that influence the decision of an individual to save or not to save money is the setting of binary logistic regression. During the given research the saving decision has been hypothesized to be triggered by several demographic and socio-economic factors – the place of residence (whether Tbilisi or regions), age, gender, marital status, education level (whether secondary or higher), employment status (whether employed or unemployed), house/apartment ownership status (whether the house/apartment is owned or rented), financial involvement (whether or not an individual helps others financially), remittances (whether or not an individual gets money remittances from abroad), income increase (whether or not income has increased over the past year), income type (whether an individual’s income exceeds GEL 7003 or not) and expenditures.
Binary logistic regression shows that after controlling for the effects of all the above-mentioned factors, only four of them – income type, employment status, education level and remittances – prove to have a statistically significant effect on the decision to save or not. The results can be summed up as follows:
An individual whose family income exceeds 700 GEL is 2.9 times more likely to be saving money than an individual whose family income falls short of 700 GEL.
An employed individual is 2.2 times more likely to be saving money than an unemployed individual.
An individual with a higher education level is twice more likely to be saving money than an individual with a secondary education level.
An individual who receives money remittances from abroad is twice more likely to be saving money than an individual who does not receive money remittances from abroad.
3 In the scope of this survey GEL 700 was chosen as the gradation between low income and middle/high income families.
Saving Behavior Assessment Survey in Georgia, January, 2011 11/19
Apart from these interpretations the following conclusions can be made:
Even though large expenses were named by the population as one of the most important hurdles preventing from saving money, the expenses lose significance in the multiple regression setting. In the end, income proves to be the most statistically significant factor determining the saving decision. As a corollary, the population rationalizes its behavior by the existence of large expenses, but in reality bases the decision to save or not on the income level rather than expenditures.
The residence variable (whether living in Tbilisi or in the regions) is a significant factor when its effect on the saving decision is analyzed in isolation from other factors. However, once all the hypothesized variables are entered in the regression model, the residence factor loses significance. Therefore, in the end it does not really matter whether one lives in Tbilisi or in the regions, his/her saving decision is mainly based on income type, income pattern and employment status.
3.1.6. Preferred Places/Means of Saving Money and Their Selection Criteria
The survey has identified the two most preferred places of saving money among potential users, i.e. those who would save if income doubled – deposit/current account in a bank (preferred by 63% of potential savers) and secret places at home, like a mattress, a pillow, a jar, etc. (preferred by 24% of potential savers).
As for saving places used currently, 38% of savers keep their money in banks, whereas 47% accumulate money at another place. Interestingly, 15% of the savers refuse to answer this question (this indicator is particularly high in the villages, reaching 32%).
Scarcity of data (resulting from a low percentage of those who save money in banks) does not allow to provide valid statistical inference on the reasons (stated by the respondents) of saving money in banks; however, according to the general trend, the trust and interest earning motives seem to be dominant.
The same problem emerges when analyzing the means of saving money in banks – data are scarce. Again, we can still accentuate the main trends – time deposit and incremental savings account seem to be the most used means of saving today.
Saving Behavior Assessment Survey in Georgia, January, 2011 12/19
As for those who save money at another place rather than banks, they base their decision mostly on two considerations: they don’t find it reasonable to save money in a bank due to the small amount of it or they just like having money at home. Again, data scarcity renders the provision of valid statistical inference infeasible when it comes to the reasons stated by the respondents explaining the decision to save money at another place rather than a bank.
Just like with the decision to save money or not in general, binary logistic regression has been used to determine the factors that affect the decision of savers to save money in a bank rather than at another place. This decision has been hypothesized to be driven by such demographic and socio-economic factors as the residence of living, age, education level, employment status, remittances from abroad, income pattern and income type4. It is indispensable to bear in mind that the sample size is rather small to claim the validity of this regression; however, we can still get interesting insights from looking at the results. After controlling for all the above-mentioned factors only two of them – employment status and income pattern – prove to be statistically significant. The odds ratios interpretation goes as follows:
A saver whose income has increased over the past year is 11.3 times more likely to be saving money in a bank than a saver whose income has remained the same or decreased over the past year.
An employed saver is 8.7 times more likely to be saving money in a bank than an unemployed saver.
Even though both of these factors are important, it is quite logical that income increase has larger effect on the decision of saving in a bank than employment status – after all, one can be employed but still have low income; what matters most of all in the end is how much income one earns.
The effects of these two factors may be largely exaggerated due to the small sample size, but most likely they correctly indicate to the general trend in the country.
3.1.7. The Possibility of Deposit Insurance
The share of those who declare the desire to deposit money in a bank if deposit insurance is offered is quite high – 60%. It is even more striking when we compare the
4 All of these variables here are defined in the same manner as they were in the previous regression.
Saving Behavior Assessment Survey in Georgia, January, 2011 13/19
current level of saving in a bank and a possible level of saving when deposit insurance is in place (6% and 60%, respectively). However, this observation should not lead us to believe that 60% is necessarily a true forecast of what the saving level will be if deposit insurance is actually in practice in Georgia – this excessively optimistic indicator is more of a description of the current attitude of people toward deposit insurance possibility. These attitudes do not deliver sufficient information to correctly predict the deposit insurance effect on the saving level in the future.
That said, the high percentages on possible saving if deposit insurance is offered highlight an important fact: the fact that the idea of deposit insurance elicits such positive feelings in the population could be indicating that trust toward banks is generally low. To elaborate on this point, around two decades ago, after the collapse of the Soviet Union, many people in Georgia lost considerable amounts of money that they were keeping in banks. Most likely the adverse effects entailed by this development have not yet disappeared. Given that this is true, the results of this survey imply that deposit insurance could work as a very effective mechanism against “fear of losing money” and could increase the level of saving in the country; however, forecasting the exact magnitudes of this increase requires a research of its own.
As for institutions preferred as potential deposit insurers, no particular institution is favored over others significantly when we look at the general picture. However, regional breakdown delivers some interesting information. In Tbilisi foreign banks are preferred most of all (44%) with the government coming second in the ranking (32%). The same institutions are much less favored in cities and villages, where large Georgian banks are considered more preferable deposit insurers.
3.1.8. Making a Deposit
3.1.8.1. The Risk Considered First of All When Making a Deposit
The population of Georgia seems to be more concerned with bank specific risks (41%) than political risks (20). This finding goes in line with the previous speculation that trust toward banks is low. Such an attitude could be resulting not only from the massive loss of deposits that took place after the breakdown of the USSR, but also from the war of 2008 - during this military conflict people faced difficulties when trying to withdraw money from banks and these difficulties led to a panic.
Saving Behavior Assessment Survey in Georgia, January, 2011 14/19
It has to be noted that 32% of the population considers both political and bank specific risks equally important. This indicator is particularly high in villages, reaching 41%.
3.1.8.2. Bank Selection Criteria When Making a Deposit
Two of the most important bank selection criteria emerge when making a deposit – reliability of a bank/trust toward a bank (29%) and high interest on deposits (23%). The reliability factor is particularly important in Tbilisi, where 40% of the capital’s population names it the crucial factor when selecting a bank for depositing money. At the same time the interest rate factor is of much less importance in Tbilisi than in cities or villages (12%, as compared to 30% and 26%, respectively). It goes without saying that these results are rather meaningful, because the use of banks for saving money is much higher in Tbilisi than in other cities or villages.
Even though both in Tbilisi and villages the reliability factor wins over the interest rate factor, in cities the situation is reversed – only 19% of the respective population names reliability as the most important factor, whereas 30% votes for high interest rate on deposits.
The explanation to the interest rate being much more important in cities and villages than in Tbilisi could be the following: as we have already seen above, both the actual saving rate and the willingness to save are much lower in cities and villages than they are in Tbilisi, because people outside capital have lower incomes and the employment rate is also lower here (two of the most important factors affecting the decision to save or not, as shown by the regression results). Therefore, interest rate has to be high in cities and villages in order to compensate for the named obstacles and to induce high level of saving.
3.1.8.3. Choice between a Time Deposit and a Demand Deposit
As the survey results demonstrate, demand deposits are given preference over time deposits overall in the country – the population declare that in case they want to save money in a bank, they would allocate 63% of it to demand deposit and 37% to time deposit on average. However, it has to be noted than in Tbilisi the pattern is different – the respective percentages are 49% and 51%. It is especially informative to look at the percentages allocated to time deposit in the regional breakdown – Tbilisi 51%, cities 30% and villages 32%. Such a pattern could be explained by the fact that in cities and villages the income level is lower than in the capital and because of everyday expenses people don’t find enough money to put aside and, more
Saving Behavior Assessment Survey in Georgia, January, 2011 15/19
importantly, to save in a bank. Therefore, if they still decide to save money in a bank, they would want to make sure that they can withdraw money at any time without any barriers – they cannot afford to have large amounts of their income tied up on a time deposit account.
3.1.8.4. Choice among Currencies when Making a Deposit
In the process of deciding how much money to save in Georgian Laris (GEL), US Dollars (USD) and Euros (EUR), seemingly GEL is given a slight preference over the other two – the respective (average) percentages are 37%, 32% and 31%. It has to be noted here, though, that the pattern in Tbilisi does not conform to the overall pattern – only 26% is going to be allocated to GEL, whereas 30% and 44% are going to be allocated to USD and EUR, respectively. Thus, in percentage terms GEL is trusted much less in the capital than outside of it. Since the amount of money that can possibly be deposited in Tbilisi is higher than in cities and villages, the importance of Euro becomes particularly apparent.
3.1.8.5. The Characteristic of a Currency Considered Primarily when Depositing Money in a Bank
The stability of a currency seems to be the dominant characteristic that people in Georgia care most about - the interest rate earned on a deposit comes second in the ranking. However, in the regional breakdown we observe that interest rate is given much more importance outside the capital city than in Tbilisi, which perfectly conforms to the previous pattern concerning the interest rate discussed earlier.
3.1.8.6. The Optimal Interest Rate on the Deposit Denominated in GEL
As it can be seen in the annex (graphical report), given that we take 10% as the benchmark interest rate on the deposit denominated in a foreign currency, the increase of the interest rate on GEL beyond 15% is less likely to entice significantly more people into depositing money in the national currency. Therefore, it seems that 15% is the most optimal interest rate that should be set on GEL, other things being equal.
Saving Behavior Assessment Survey in Georgia, January, 2011 16/19
3.1.8.7. Reasons for Possible Withdrawing of Money from a Bank
Two of the most likely reasons for withdrawing money from a bank completely or even partially are the necessity to finance unforeseen personal expenditures and to finance planned personal expenditures. An interesting result is observed in the regional breakdown – the increase in political/economic and other types of macroeconomic risks are much more likely to cause massive withdrawing of money from banks in Tbilisi than in cities and villages.
3.2. The Analysis of Banking Experience
3.2.1. The Awareness of Banks
Saving Behavior Assessment Survey in Georgia, January, 2011 17/19
3.2.2. The Use of Banks5
3.2.3. The Use of Bank Products and Services
First of all, we should bear in mind that the analysis performed on the use of bank products and services did not include current account and concentrated on the following items: credit/loan, credit plastic card, quick money transfers, installment payments services offered by a bank, deposit, individual safe deposit box and pawn service. Out of these, credit is the most used bank product currently (16%), followed by credit plastic card (13%) and quick money transfers (11%). The use of bank deposits is just 6%.
As for potential use of bank products and services, credit/loan leads with 10%, with deposit coming second in the ranking (7%). Some interesting trends emerge: the use of credit/loan is more prevalent in cities in percentage terms rather than in villages currently, however, according to the survey results, it is possible that this pattern will reverse in the future. The use of deposit is currently most prevalent in Tbilisi in percentage terms, but it is possible that this pattern will also change and the use of deposit will become more widespread in cities than in Tbilisi in percentage terms.
5 The use of banks here implies using not only classical bank products (credit, deposit, etc.), but also such services as quick money transfers, installment payment services, payment of utility fees, etc.
6 The term “major bank” implies the bank where a respondent has placed the largest amount of money or where he/she makes the largest financial transactions.
Saving Behavior Assessment Survey in Georgia, January, 2011 18/19
3.2.3. Factors Causing Loyalty and Disloalty toward a Bank
Survey results show that 41% of bank users are content with absolutely everything about their major bank. However this indicator varies substantially in the regional breakdown – in Tbilisi it is 18%, in cities – 39% and in villages – 61%. Thus, the level of absolute satisfaction is low in Tbilisi and very high in villages. As for the actual factors causing loyalty toward the major bank, high quality service and polite, attentive, responsive bank officers seem to be the most important of them.
Many bank users find it difficult to name any factors that they dislike about their major bank. However, out of those who do so, 10% name loan conditions (interest rate on the loan, loan amount, loan duration, collateral, etc.) as the aspect they are mostly discontented with. Other negative factors have been named with much less frequency.
Generally we could say that the overall level of satisfaction with bank service is quite high in bank users.
3.3. Demographic and Socio-Economic Structure of the Georgian Population
According to the survey results, women account for 54% of the population and the age group of 35-44 is the most prevalent among other age groups (21%).
Average personal income amounts to GEL 154, with Tbilisi having the highest indicator - GEL 279. Average family income amounts to GEL 433, with Tbilisi again having the highest indicator - GEL 718.
Data analysis demonstrates that around 17% of the Georgian population receives money remittances from abroad.
The most important expenditure components in the country are: food (average GEL 256), ritual service/holidays (wedding, funeral) (average GEL 75), medicines/medical service (average GEL 64) and clothes (average GEL62).
According to the population’s self-assessment of income and expenditure patterns, income of 44% has decreased over the past year, whereas expenditures of 62% have increased over the same time period. The latter indicator should not come as a surprise,
Saving Behavior Assessment Survey in Georgia, January, 2011 19/19
taking into account the inflation that has been going on recently in the country – prices of many important products rose significantly in 2010.
Finally, 82% of the population attribute themselves to low-income families and only 1% - to high-income families. This is particularly problematic in terms of saving, because according to previous research conducted worldwide and also the results of the current survey (binary logistic regression results in particular), high-income families are much more likely to save money than low-income families and having a very small share of high-income families in the country is likely to have considerably unfavorable effects on saving. This could be a very sound explanation of why saving rate is so low in Georgia.