Embed Size (px)
Citation preview
Scales and Multi-Item Indicators
Tabea Mehrbrodt
Stefan Gruber Melanie Wagner
March 31st, 2017
2
Table of Contents
I. Mental health measures .................................................................................................... 3
1. EURO-D ............................................................................................................................ 3
2. CASP-12 ........................................................................................................................... 5
3. Three-Item Loneliness Scale ............................................................................................ 7
4. Multi-Item Indicator Anxiety ........................................................................................... 8
II. Physical health measures ................................................................................................... 9
1. Global Activity Limitation Index (GALI) ........................................................................... 9
2. Activities of Daily Living (ADL) ....................................................................................... 10
3. Instrumental Activities of Daily Living (IADL) ................................................................ 11
4. Self-perceived Health – US Version (SPHUS) and EU Version (SPHEU)......................... 12
5. Multi-Item Indicator Pain .............................................................................................. 13
6. Body Mass Index (BMI) .................................................................................................. 14
7. Grip Strength (GS) ......................................................................................................... 15
8. Walking Speed ............................................................................................................... 16
9. Peak Flow ...................................................................................................................... 17
10. Chair Stand Test ............................................................................................................. 18
III. Cognitive functioning measures .................................................................................... 19
1. Temporal orientation .................................................................................................... 19
2. Numeracy ...................................................................................................................... 20
3. 10-words recall test ....................................................................................................... 21
4. Verbal fluency ................................................................................................................ 25
IV. Occupational measures ................................................................................................. 26
1. Effort-Reward Imbalance (ERI) questionnaire .............................................................. 26
2. International Standard Classification of Occupations (ISCO) ........................................ 27
3. Statistical Classification of Economic Activities in the European Community (NACE).. 30
V. Educational measures.................................................................................................... 33
1. International Standard Classification of Education (ISCED) .......................................... 33
VI. Other ............................................................................................................................. 36
1. Multi-Item Indicator Residential Environment Quality ................................................. 36
3
About this manual
I. Mental health measures
1. EURO-D
Definition
The EURO-D scale (Prince et al., 1999) was originally developed in an effort to derive a
common depression symptoms scale from various instruments on late-life depression used
in different European countries. The resulting scale consists of the following items:
depression, pessimism, suicidality, guilt, sleep, interest, irritability, appetite, fatigue,
concentration (on reading or entertainment), enjoyment, and tearfulness.
Operationalisation in SHARE
SHARE provides the EURO-D variable (eurod) and the EURO-D caseness variable (eurodcat)
as generated variables in the gv_health module. eurod is generated from questions in the
mental health module (mh002_ – mh017_) as a composite index of the sixteen items. Please
note that information in mh005_/mh006_, mh008_/mh009_, mh011_/mh012_ and
mh014_/mh015_ is combined when generating eurod so that the list of 16 items in table 1 is
reduced to 12 final items. The maximum score a respondent can get is 12 “very depressed”
and the minimum score is 0 “not depressed”.
The attainment of a scale score of 4 or higher is categorized as “case of depression” and a
scale score below 4 as “not depressed”. The generated variable eurodcat equals 1 if the scale
score is 4 or higher.
The purpose of this manual is to provide an informative overview of all scales
and item groups that are included in the questionnaire of Wave 1 to Wave 6
of the Survey of Health, Age and Retirement in Europe (SHARE). The manual
covers literature based information on the definition and content of the
respective scale or multi-item indicator and its operationalisation in SHARE.
All scales and multi-item indicators are displayed in English according to the
generic version of the SHARE questionnaire.
4
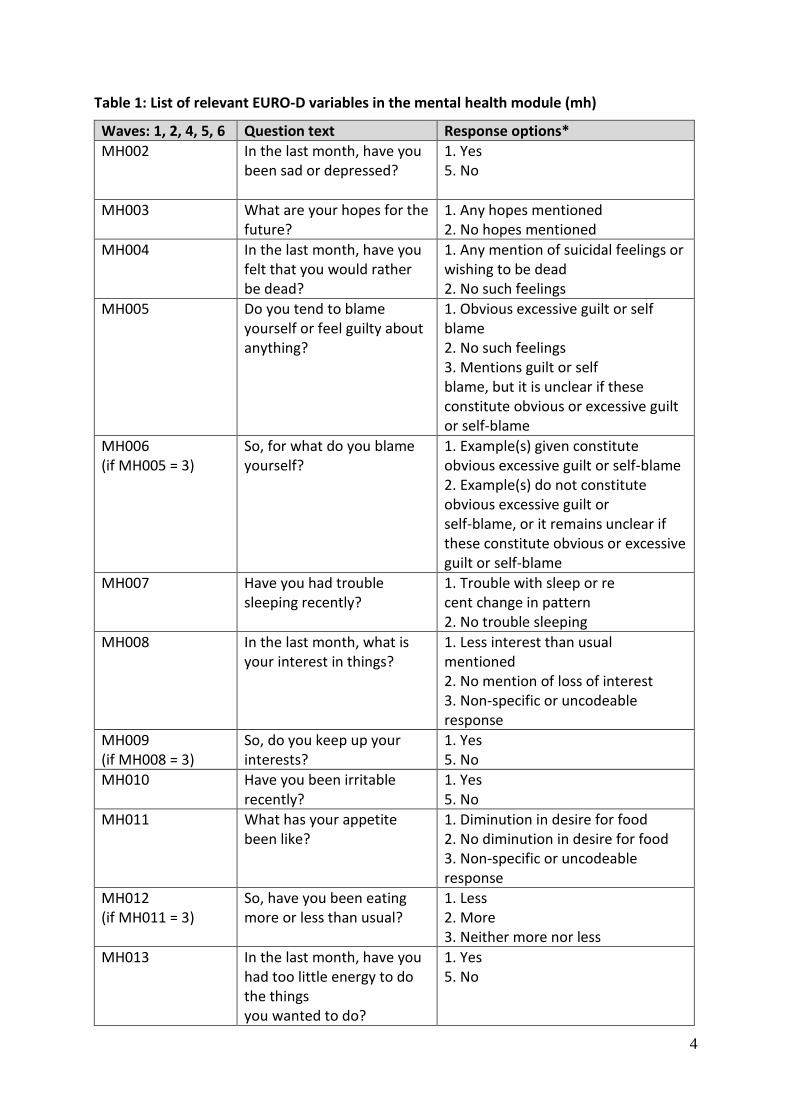
Table 1: List of relevant EURO-D variables in the mental health module (mh)
Waves: 1, 2, 4, 5, 6 Question text Response options*
MH002 In the last month, have you been sad or depressed?
1. Yes 5. No
MH003 What are your hopes for the future?
1. Any hopes mentioned 2. No hopes mentioned
MH004 In the last month, have you felt that you would rather be dead?
1. Any mention of suicidal feelings or wishing to be dead 2. No such feelings
MH005 Do you tend to blame yourself or feel guilty about anything?
1. Obvious excessive guilt or self blame 2. No such feelings 3. Mentions guilt or self blame, but it is unclear if these constitute obvious or excessive guilt or self-blame
MH006 (if MH005 = 3)
So, for what do you blame yourself?
1. Example(s) given constitute obvious excessive guilt or self-blame 2. Example(s) do not constitute obvious excessive guilt or self-blame, or it remains unclear if these constitute obvious or excessive guilt or self-blame
MH007 Have you had trouble sleeping recently?
1. Trouble with sleep or re cent change in pattern 2. No trouble sleeping
MH008 In the last month, what is your interest in things?
1. Less interest than usual mentioned 2. No mention of loss of interest 3. Non-specific or uncodeable response
MH009 (if MH008 = 3)
So, do you keep up your interests?
1. Yes 5. No
MH010 Have you been irritable recently?
1. Yes 5. No
MH011 What has your appetite been like?
1. Diminution in desire for food 2. No diminution in desire for food 3. Non-specific or uncodeable response
MH012 (if MH011 = 3)
So, have you been eating more or less than usual?
1. Less 2. More 3. Neither more nor less
MH013 In the last month, have you had too little energy to do the things you wanted to do?
1. Yes 5. No
5
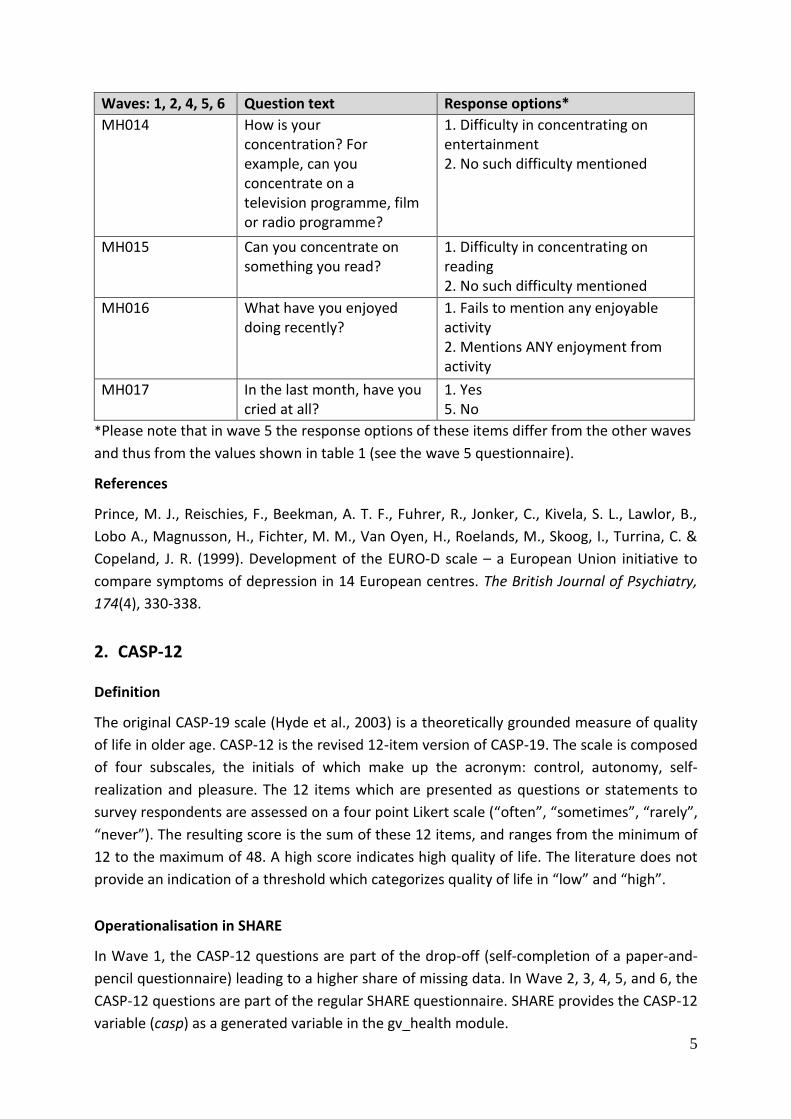
Waves: 1, 2, 4, 5, 6 Question text Response options*
MH014 How is your concentration? For example, can you concentrate on a television programme, film or radio programme?
1. Difficulty in concentrating on entertainment 2. No such difficulty mentioned
MH015 Can you concentrate on something you read?
1. Difficulty in concentrating on reading 2. No such difficulty mentioned
MH016 What have you enjoyed doing recently?
1. Fails to mention any enjoyable activity 2. Mentions ANY enjoyment from activity
MH017 In the last month, have you cried at all?
1. Yes 5. No
*Please note that in wave 5 the response options of these items differ from the other waves
and thus from the values shown in table 1 (see the wave 5 questionnaire).
References
Prince, M. J., Reischies, F., Beekman, A. T. F., Fuhrer, R., Jonker, C., Kivela, S. L., Lawlor, B.,
Lobo A., Magnusson, H., Fichter, M. M., Van Oyen, H., Roelands, M., Skoog, I., Turrina, C. &
Copeland, J. R. (1999). Development of the EURO-D scale – a European Union initiative to
compare symptoms of depression in 14 European centres. The British Journal of Psychiatry,
174(4), 330-338.
2. CASP-12
Definition
The original CASP-19 scale (Hyde et al., 2003) is a theoretically grounded measure of quality
of life in older age. CASP-12 is the revised 12-item version of CASP-19. The scale is composed
of four subscales, the initials of which make up the acronym: control, autonomy, self-
realization and pleasure. The 12 items which are presented as questions or statements to
survey respondents are assessed on a four point Likert scale (“often”, “sometimes”, “rarely”,
“never”). The resulting score is the sum of these 12 items, and ranges from the minimum of
12 to the maximum of 48. A high score indicates high quality of life. The literature does not
provide an indication of a threshold which categorizes quality of life in “low” and “high”.
Operationalisation in SHARE
In Wave 1, the CASP-12 questions are part of the drop-off (self-completion of a paper-and-
pencil questionnaire) leading to a higher share of missing data. In Wave 2, 3, 4, 5, and 6, the
CASP-12 questions are part of the regular SHARE questionnaire. SHARE provides the CASP-12
variable (casp) as a generated variable in the gv_health module.
6
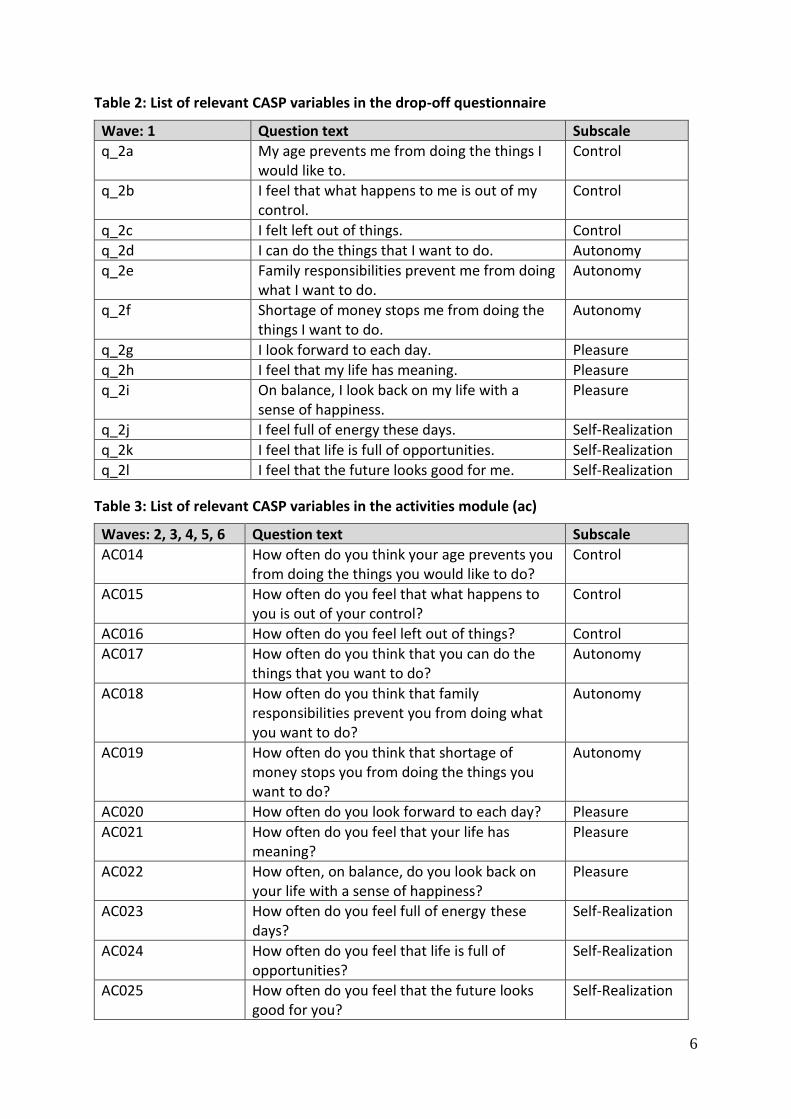
Table 2: List of relevant CASP variables in the drop-off questionnaire
Wave: 1 Question text Subscale
q_2a My age prevents me from doing the things I would like to.
Control
q_2b I feel that what happens to me is out of my control.
Control
q_2c I felt left out of things. Control
q_2d I can do the things that I want to do. Autonomy
q_2e Family responsibilities prevent me from doing what I want to do.
Autonomy
q_2f Shortage of money stops me from doing the things I want to do.
Autonomy
q_2g I look forward to each day. Pleasure
q_2h I feel that my life has meaning. Pleasure
q_2i On balance, I look back on my life with a sense of happiness.
Pleasure
q_2j I feel full of energy these days. Self-Realization
q_2k I feel that life is full of opportunities. Self-Realization
q_2l I feel that the future looks good for me. Self-Realization
Table 3: List of relevant CASP variables in the activities module (ac)
Waves: 2, 3, 4, 5, 6 Question text Subscale
AC014 How often do you think your age prevents you from doing the things you would like to do?
Control
AC015 How often do you feel that what happens to you is out of your control?
Control
AC016 How often do you feel left out of things? Control
AC017 How often do you think that you can do the things that you want to do?
Autonomy
AC018 How often do you think that family responsibilities prevent you from doing what you want to do?
Autonomy
AC019 How often do you think that shortage of money stops you from doing the things you want to do?
Autonomy
AC020 How often do you look forward to each day? Pleasure
AC021 How often do you feel that your life has meaning?
Pleasure
AC022 How often, on balance, do you look back on your life with a sense of happiness?
Pleasure
AC023 How often do you feel full of energy these days?
Self-Realization
AC024 How often do you feel that life is full of opportunities?
Self-Realization
AC025 How often do you feel that the future looks good for you?
Self-Realization
7
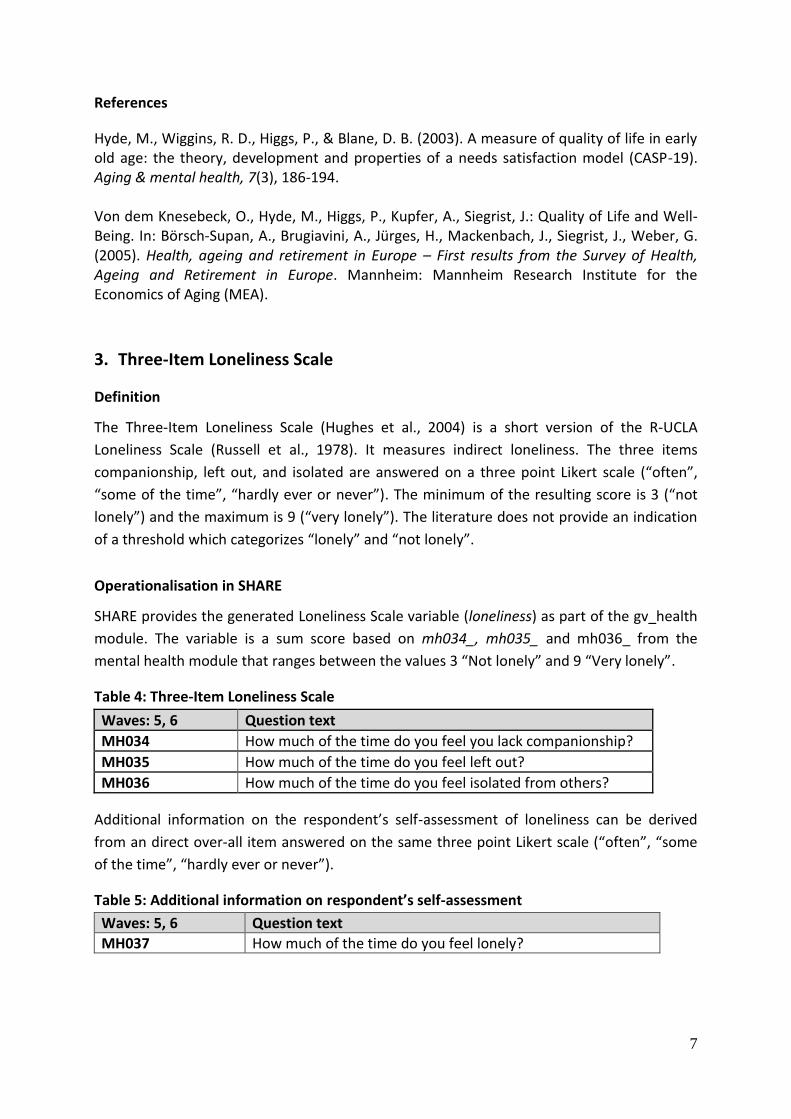
References
Hyde, M., Wiggins, R. D., Higgs, P., & Blane, D. B. (2003). A measure of quality of life in early old age: the theory, development and properties of a needs satisfaction model (CASP-19). Aging & mental health, 7(3), 186-194.
Von dem Knesebeck, O., Hyde, M., Higgs, P., Kupfer, A., Siegrist, J.: Quality of Life and Well-Being. In: Börsch-Supan, A., Brugiavini, A., Jürges, H., Mackenbach, J., Siegrist, J., Weber, G. (2005). Health, ageing and retirement in Europe – First results from the Survey of Health, Ageing and Retirement in Europe. Mannheim: Mannheim Research Institute for the Economics of Aging (MEA).
3. Three-Item Loneliness Scale
Definition
The Three-Item Loneliness Scale (Hughes et al., 2004) is a short version of the R-UCLA
Loneliness Scale (Russell et al., 1978). It measures indirect loneliness. The three items
companionship, left out, and isolated are answered on a three point Likert scale (“often”,
“some of the time”, “hardly ever or never”). The minimum of the resulting score is 3 (“not
lonely”) and the maximum is 9 (“very lonely”). The literature does not provide an indication
of a threshold which categorizes “lonely” and “not lonely”.
Operationalisation in SHARE
SHARE provides the generated Loneliness Scale variable (loneliness) as part of the gv_health
module. The variable is a sum score based on mh034_, mh035_ and mh036_ from the
mental health module that ranges between the values 3 “Not lonely” and 9 “Very lonely”.
Table 4: Three-Item Loneliness Scale
Waves: 5, 6 Question text
MH034 How much of the time do you feel you lack companionship?
MH035 How much of the time do you feel left out?
MH036 How much of the time do you feel isolated from others?
Additional information on the respondent’s self-assessment of loneliness can be derived
from an direct over-all item answered on the same three point Likert scale (“often”, “some
of the time”, “hardly ever or never”).
Table 5: Additional information on respondent’s self-assessment
Waves: 5, 6 Question text
MH037 How much of the time do you feel lonely?
8
References
Russell, D., Peplau, L. A. & Ferguson M. L. (2010) Developing a measure of loneliness. Journal of Personality Assessment, 42(3), 290-294. Russel, D., Peplau, L. A. & Cutrona, C. E. (1980). The revised UCLA Loneliness Scale:
concurrent and discriminant validity evidence. Journal of Personality and Social Psychology,
39(3), 472-480.
Russell, D. W. (1996). UCLA Loneliness Scale (Version 3): Reliability, validity, and factor structure. Journal of Personality Assessment, 66(1), 20-40. Hughes, M. E., Waite, L. J., Hawkley, L. C., & Cacioppo, J. T. (2004). A short scale for measuring loneliness in large surveys results from two population-based studies. Research on Aging, 26(6), 655-672.
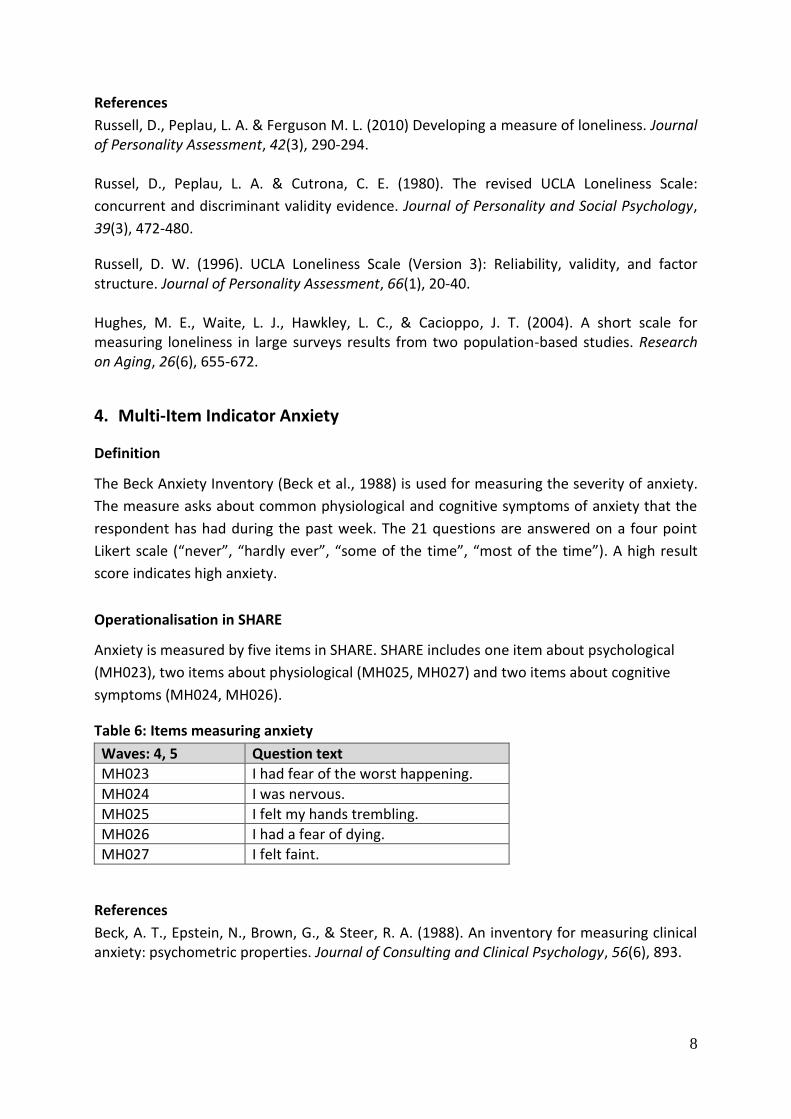
4. Multi-Item Indicator Anxiety
Definition
The Beck Anxiety Inventory (Beck et al., 1988) is used for measuring the severity of anxiety.
The measure asks about common physiological and cognitive symptoms of anxiety that the
respondent has had during the past week. The 21 questions are answered on a four point
Likert scale (“never”, “hardly ever”, “some of the time”, “most of the time”). A high result
score indicates high anxiety.
Operationalisation in SHARE
Anxiety is measured by five items in SHARE. SHARE includes one item about psychological
(MH023), two items about physiological (MH025, MH027) and two items about cognitive
symptoms (MH024, MH026).
Table 6: Items measuring anxiety
Waves: 4, 5 Question text
MH023 I had fear of the worst happening.
MH024 I was nervous.
MH025 I felt my hands trembling.
MH026 I had a fear of dying.
MH027 I felt faint.
References
Beck, A. T., Epstein, N., Brown, G., & Steer, R. A. (1988). An inventory for measuring clinical anxiety: psychometric properties. Journal of Consulting and Clinical Psychology, 56(6), 893.
9
II. Physical health measures
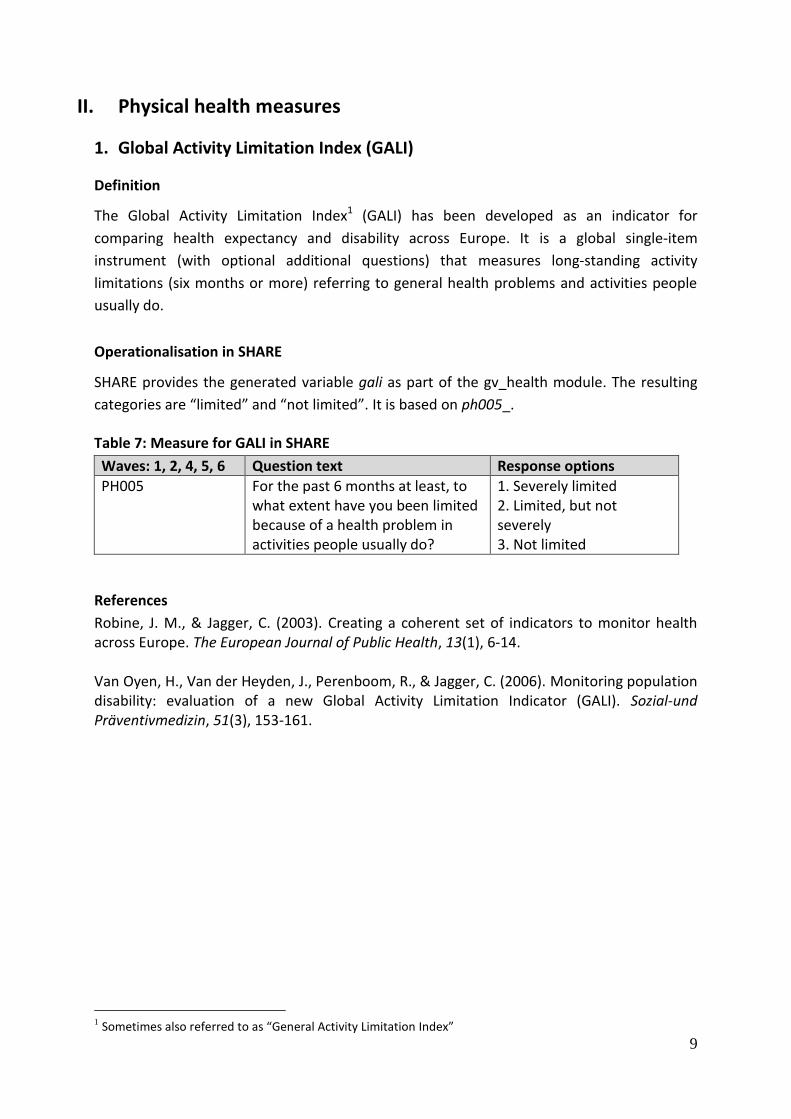
1. Global Activity Limitation Index (GALI)
Definition
The Global Activity Limitation Index1 (GALI) has been developed as an indicator for
comparing health expectancy and disability across Europe. It is a global single-item
instrument (with optional additional questions) that measures long-standing activity
limitations (six months or more) referring to general health problems and activities people
usually do.
Operationalisation in SHARE
SHARE provides the generated variable gali as part of the gv_health module. The resulting
categories are “limited” and “not limited”. It is based on ph005_.
Table 7: Measure for GALI in SHARE
Waves: 1, 2, 4, 5, 6 Question text Response options
PH005 For the past 6 months at least, to what extent have you been limited because of a health problem in activities people usually do?
1. Severely limited 2. Limited, but not severely 3. Not limited
References
Robine, J. M., & Jagger, C. (2003). Creating a coherent set of indicators to monitor health across Europe. The European Journal of Public Health, 13(1), 6-14. Van Oyen, H., Van der Heyden, J., Perenboom, R., & Jagger, C. (2006). Monitoring population disability: evaluation of a new Global Activity Limitation Indicator (GALI). Sozial-und Präventivmedizin, 51(3), 153-161.
1 Sometimes also referred to as “General Activity Limitation Index”
10
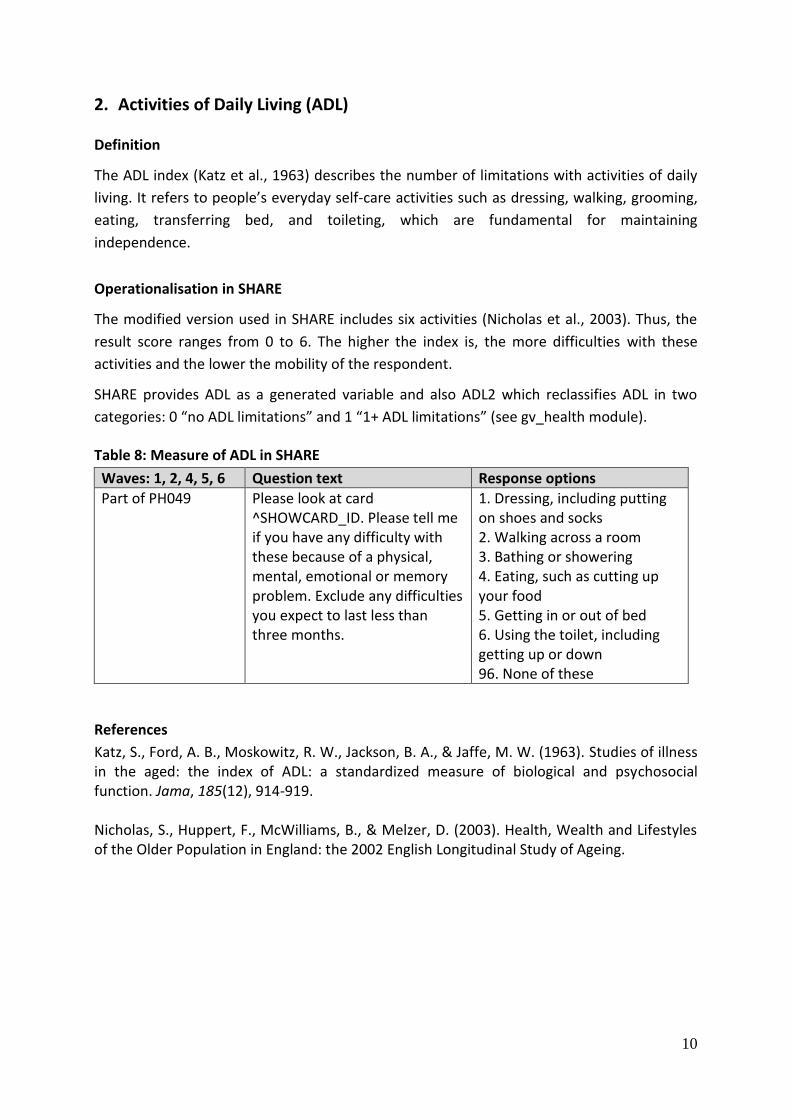
2. Activities of Daily Living (ADL)
Definition
The ADL index (Katz et al., 1963) describes the number of limitations with activities of daily
living. It refers to people’s everyday self-care activities such as dressing, walking, grooming,
eating, transferring bed, and toileting, which are fundamental for maintaining
independence.
Operationalisation in SHARE
The modified version used in SHARE includes six activities (Nicholas et al., 2003). Thus, the
result score ranges from 0 to 6. The higher the index is, the more difficulties with these
activities and the lower the mobility of the respondent.
SHARE provides ADL as a generated variable and also ADL2 which reclassifies ADL in two
categories: 0 “no ADL limitations” and 1 “1+ ADL limitations” (see gv_health module).
Table 8: Measure of ADL in SHARE
Waves: 1, 2, 4, 5, 6 Question text Response options
Part of PH049 Please look at card ^SHOWCARD_ID. Please tell me if you have any difficulty with these because of a physical, mental, emotional or memory problem. Exclude any difficulties you expect to last less than three months.
1. Dressing, including putting on shoes and socks 2. Walking across a room 3. Bathing or showering 4. Eating, such as cutting up your food 5. Getting in or out of bed 6. Using the toilet, including getting up or down 96. None of these
References
Katz, S., Ford, A. B., Moskowitz, R. W., Jackson, B. A., & Jaffe, M. W. (1963). Studies of illness in the aged: the index of ADL: a standardized measure of biological and psychosocial function. Jama, 185(12), 914-919. Nicholas, S., Huppert, F., McWilliams, B., & Melzer, D. (2003). Health, Wealth and Lifestyles of the Older Population in England: the 2002 English Longitudinal Study of Ageing.
11
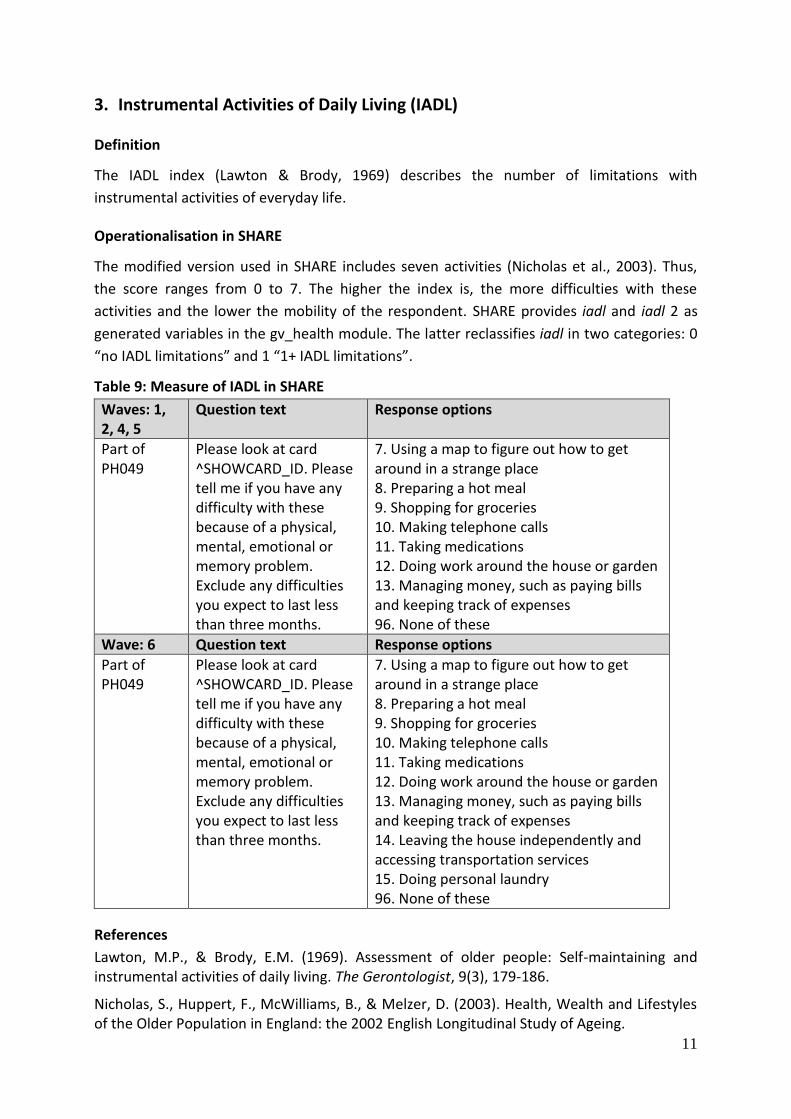
3. Instrumental Activities of Daily Living (IADL)
Definition
The IADL index (Lawton & Brody, 1969) describes the number of limitations with
instrumental activities of everyday life.
Operationalisation in SHARE
The modified version used in SHARE includes seven activities (Nicholas et al., 2003). Thus,
the score ranges from 0 to 7. The higher the index is, the more difficulties with these
activities and the lower the mobility of the respondent. SHARE provides iadl and iadl 2 as
generated variables in the gv_health module. The latter reclassifies iadl in two categories: 0
“no IADL limitations” and 1 “1+ IADL limitations”.
Table 9: Measure of IADL in SHARE
Waves: 1, 2, 4, 5
Question text Response options
Part of PH049
Please look at card ^SHOWCARD_ID. Please tell me if you have any difficulty with these because of a physical, mental, emotional or memory problem. Exclude any difficulties you expect to last less than three months.
7. Using a map to figure out how to get around in a strange place 8. Preparing a hot meal 9. Shopping for groceries 10. Making telephone calls 11. Taking medications 12. Doing work around the house or garden 13. Managing money, such as paying bills and keeping track of expenses 96. None of these
Wave: 6 Question text Response options
Part of PH049
Please look at card ^SHOWCARD_ID. Please tell me if you have any difficulty with these because of a physical, mental, emotional or memory problem. Exclude any difficulties you expect to last less than three months.
7. Using a map to figure out how to get around in a strange place 8. Preparing a hot meal 9. Shopping for groceries 10. Making telephone calls 11. Taking medications 12. Doing work around the house or garden 13. Managing money, such as paying bills and keeping track of expenses 14. Leaving the house independently and accessing transportation services 15. Doing personal laundry 96. None of these
References
Lawton, M.P., & Brody, E.M. (1969). Assessment of older people: Self-maintaining and instrumental activities of daily living. The Gerontologist, 9(3), 179-186.
Nicholas, S., Huppert, F., McWilliams, B., & Melzer, D. (2003). Health, Wealth and Lifestyles of the Older Population in England: the 2002 English Longitudinal Study of Ageing.
12
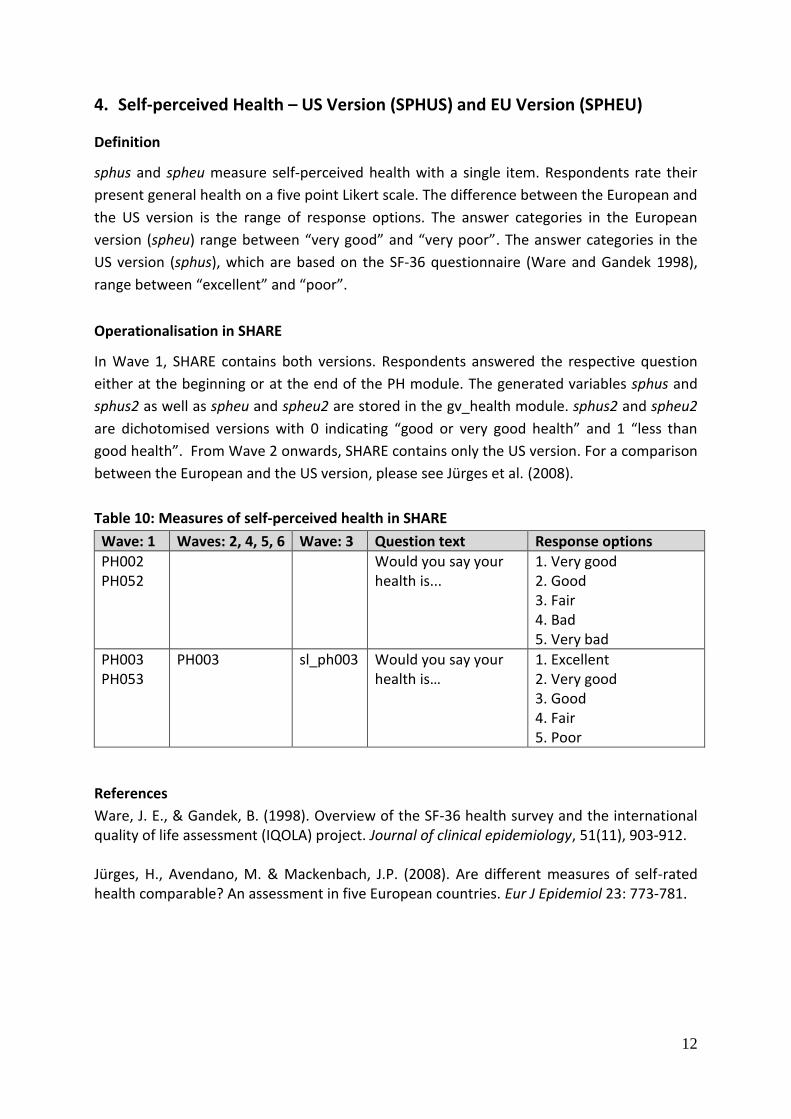
4. Self-perceived Health – US Version (SPHUS) and EU Version (SPHEU)
Definition
sphus and spheu measure self-perceived health with a single item. Respondents rate their
present general health on a five point Likert scale. The difference between the European and
the US version is the range of response options. The answer categories in the European
version (spheu) range between “very good” and “very poor”. The answer categories in the
US version (sphus), which are based on the SF-36 questionnaire (Ware and Gandek 1998),
range between “excellent” and “poor”.
Operationalisation in SHARE
In Wave 1, SHARE contains both versions. Respondents answered the respective question
either at the beginning or at the end of the PH module. The generated variables sphus and
sphus2 as well as spheu and spheu2 are stored in the gv_health module. sphus2 and spheu2
are dichotomised versions with 0 indicating “good or very good health” and 1 “less than
good health”. From Wave 2 onwards, SHARE contains only the US version. For a comparison
between the European and the US version, please see Jürges et al. (2008).
Table 10: Measures of self-perceived health in SHARE
Wave: 1 Waves: 2, 4, 5, 6 Wave: 3 Question text Response options
PH002 PH052
Would you say your health is...
1. Very good 2. Good 3. Fair 4. Bad 5. Very bad
PH003 PH053
PH003 sl_ph003 Would you say your health is…
1. Excellent 2. Very good 3. Good 4. Fair 5. Poor
References
Ware, J. E., & Gandek, B. (1998). Overview of the SF-36 health survey and the international quality of life assessment (IQOLA) project. Journal of clinical epidemiology, 51(11), 903-912. Jürges, H., Avendano, M. & Mackenbach, J.P. (2008). Are different measures of self-rated health comparable? An assessment in five European countries. Eur J Epidemiol 23: 773-781.
13
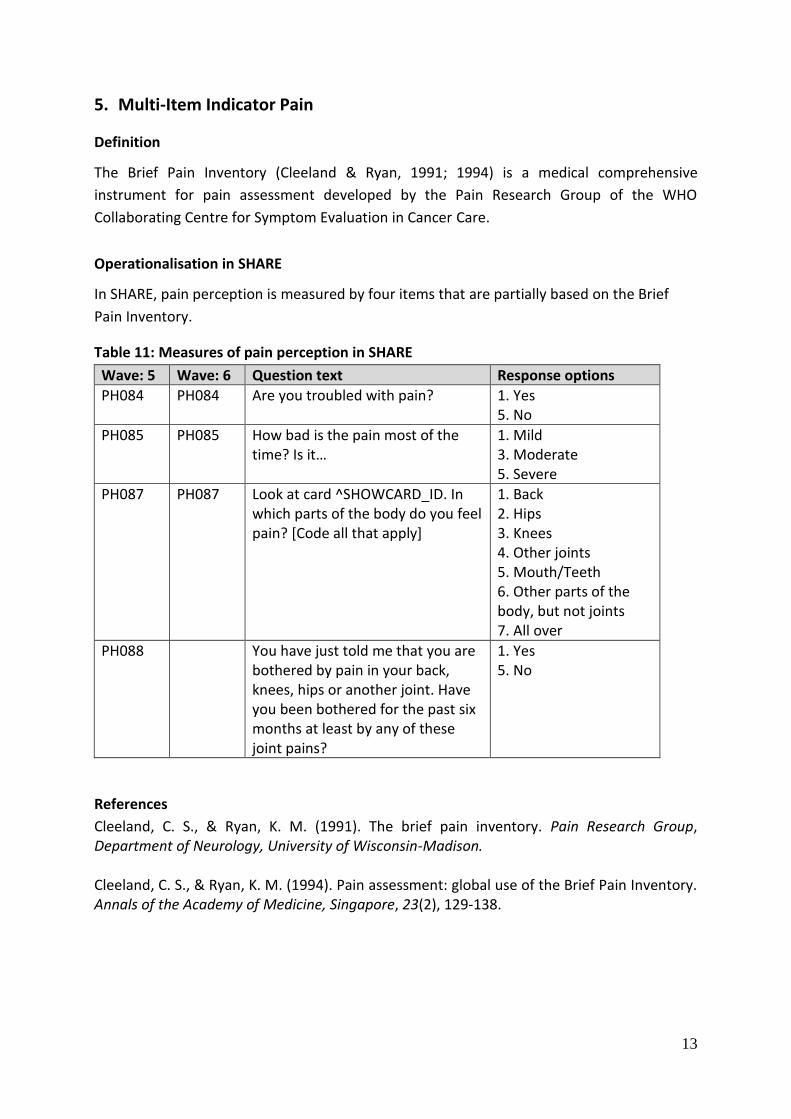
5. Multi-Item Indicator Pain
Definition
The Brief Pain Inventory (Cleeland & Ryan, 1991; 1994) is a medical comprehensive
instrument for pain assessment developed by the Pain Research Group of the WHO
Collaborating Centre for Symptom Evaluation in Cancer Care.
Operationalisation in SHARE
In SHARE, pain perception is measured by four items that are partially based on the Brief
Pain Inventory.
Table 11: Measures of pain perception in SHARE
Wave: 5 Wave: 6 Question text Response options
PH084 PH084 Are you troubled with pain? 1. Yes 5. No
PH085 PH085 How bad is the pain most of the time? Is it…
1. Mild 3. Moderate 5. Severe
PH087 PH087 Look at card ^SHOWCARD_ID. In which parts of the body do you feel pain? [Code all that apply]
1. Back 2. Hips 3. Knees 4. Other joints 5. Mouth/Teeth 6. Other parts of the body, but not joints 7. All over
PH088 You have just told me that you are bothered by pain in your back, knees, hips or another joint. Have you been bothered for the past six months at least by any of these joint pains?
1. Yes 5. No
References
Cleeland, C. S., & Ryan, K. M. (1991). The brief pain inventory. Pain Research Group, Department of Neurology, University of Wisconsin-Madison. Cleeland, C. S., & Ryan, K. M. (1994). Pain assessment: global use of the Brief Pain Inventory. Annals of the Academy of Medicine, Singapore, 23(2), 129-138.
14
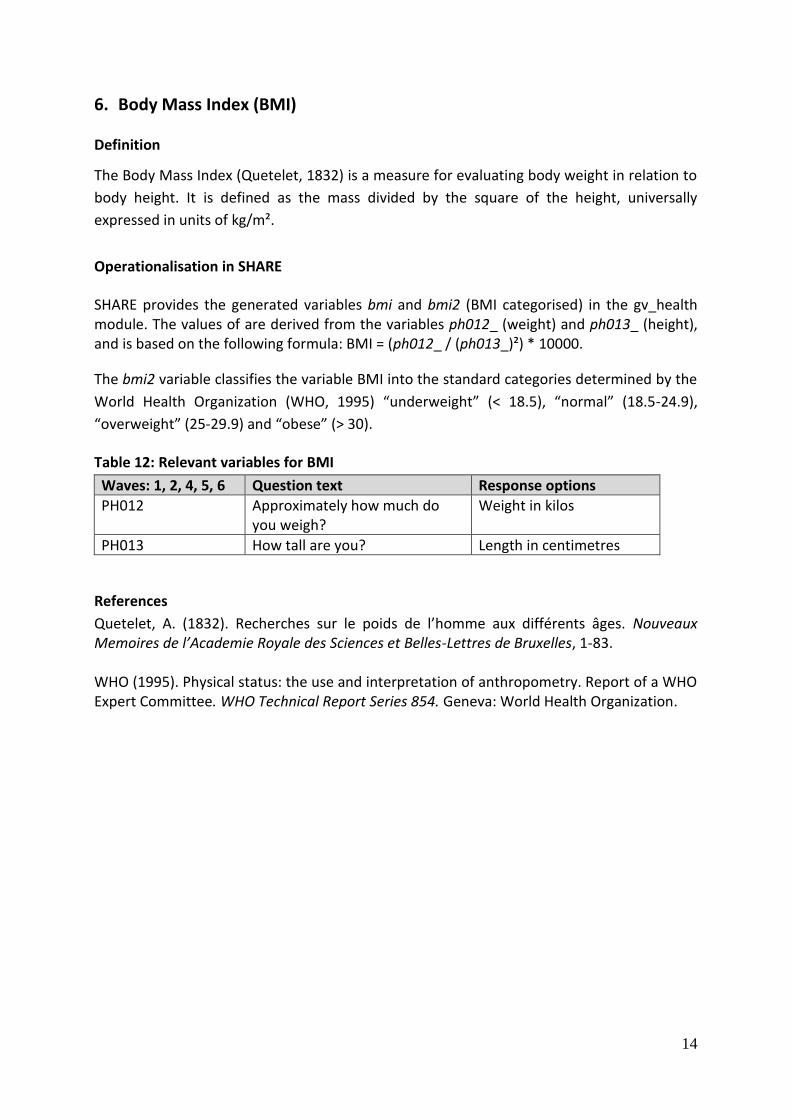
6. Body Mass Index (BMI)
Definition
The Body Mass Index (Quetelet, 1832) is a measure for evaluating body weight in relation to
body height. It is defined as the mass divided by the square of the height, universally
expressed in units of kg/m².
Operationalisation in SHARE
SHARE provides the generated variables bmi and bmi2 (BMI categorised) in the gv_health module. The values of are derived from the variables ph012_ (weight) and ph013_ (height), and is based on the following formula: BMI = (ph012_ / (ph013_)²) * 10000.
The bmi2 variable classifies the variable BMI into the standard categories determined by the
World Health Organization (WHO, 1995) “underweight” (< 18.5), “normal” (18.5-24.9),
“overweight” (25-29.9) and “obese” (> 30).
Table 12: Relevant variables for BMI
Waves: 1, 2, 4, 5, 6 Question text Response options
PH012 Approximately how much do you weigh?
Weight in kilos
PH013 How tall are you? Length in centimetres
References
Quetelet, A. (1832). Recherches sur le poids de l’homme aux différents âges. Nouveaux Memoires de l’Academie Royale des Sciences et Belles-Lettres de Bruxelles, 1-83. WHO (1995). Physical status: the use and interpretation of anthropometry. Report of a WHO Expert Committee. WHO Technical Report Series 854. Geneva: World Health Organization.
15
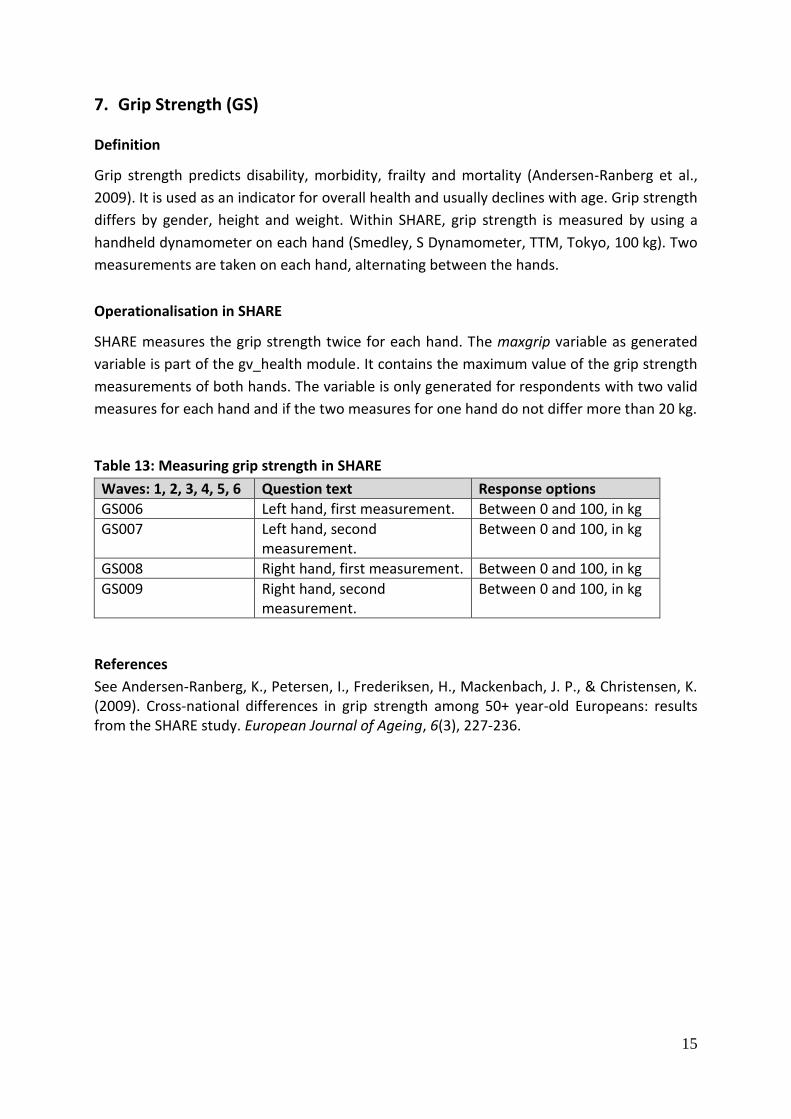
7. Grip Strength (GS)
Definition
Grip strength predicts disability, morbidity, frailty and mortality (Andersen-Ranberg et al.,
2009). It is used as an indicator for overall health and usually declines with age. Grip strength
differs by gender, height and weight. Within SHARE, grip strength is measured by using a
handheld dynamometer on each hand (Smedley, S Dynamometer, TTM, Tokyo, 100 kg). Two
measurements are taken on each hand, alternating between the hands.
Operationalisation in SHARE
SHARE measures the grip strength twice for each hand. The maxgrip variable as generated
variable is part of the gv_health module. It contains the maximum value of the grip strength
measurements of both hands. The variable is only generated for respondents with two valid
measures for each hand and if the two measures for one hand do not differ more than 20 kg.
Table 13: Measuring grip strength in SHARE
Waves: 1, 2, 3, 4, 5, 6 Question text Response options
GS006 Left hand, first measurement. Between 0 and 100, in kg
GS007 Left hand, second measurement.
Between 0 and 100, in kg
GS008 Right hand, first measurement. Between 0 and 100, in kg
GS009 Right hand, second measurement.
Between 0 and 100, in kg
References
See Andersen-Ranberg, K., Petersen, I., Frederiksen, H., Mackenbach, J. P., & Christensen, K. (2009). Cross-national differences in grip strength among 50+ year-old Europeans: results from the SHARE study. European Journal of Ageing, 6(3), 227-236.
16
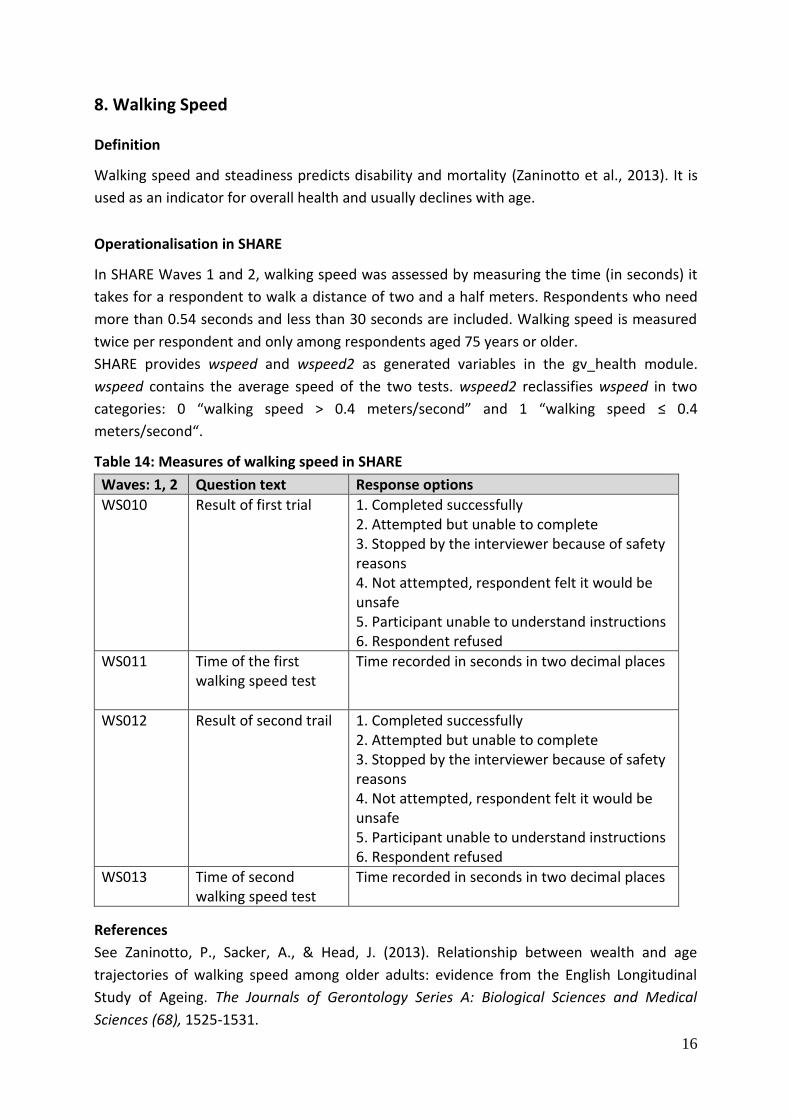
8. Walking Speed
Definition
Walking speed and steadiness predicts disability and mortality (Zaninotto et al., 2013). It is
used as an indicator for overall health and usually declines with age.
Operationalisation in SHARE
In SHARE Waves 1 and 2, walking speed was assessed by measuring the time (in seconds) it
takes for a respondent to walk a distance of two and a half meters. Respondents who need
more than 0.54 seconds and less than 30 seconds are included. Walking speed is measured
twice per respondent and only among respondents aged 75 years or older.
SHARE provides wspeed and wspeed2 as generated variables in the gv_health module.
wspeed contains the average speed of the two tests. wspeed2 reclassifies wspeed in two
categories: 0 “walking speed > 0.4 meters/second” and 1 “walking speed ≤ 0.4
meters/second“.
Table 14: Measures of walking speed in SHARE
Waves: 1, 2 Question text Response options
WS010 Result of first trial 1. Completed successfully 2. Attempted but unable to complete 3. Stopped by the interviewer because of safety reasons 4. Not attempted, respondent felt it would be unsafe 5. Participant unable to understand instructions 6. Respondent refused
WS011 Time of the first walking speed test
Time recorded in seconds in two decimal places
WS012 Result of second trail 1. Completed successfully 2. Attempted but unable to complete 3. Stopped by the interviewer because of safety reasons 4. Not attempted, respondent felt it would be unsafe 5. Participant unable to understand instructions 6. Respondent refused
WS013 Time of second walking speed test
Time recorded in seconds in two decimal places
References
See Zaninotto, P., Sacker, A., & Head, J. (2013). Relationship between wealth and age
trajectories of walking speed among older adults: evidence from the English Longitudinal
Study of Ageing. The Journals of Gerontology Series A: Biological Sciences and Medical
Sciences (68), 1525-1531.
17
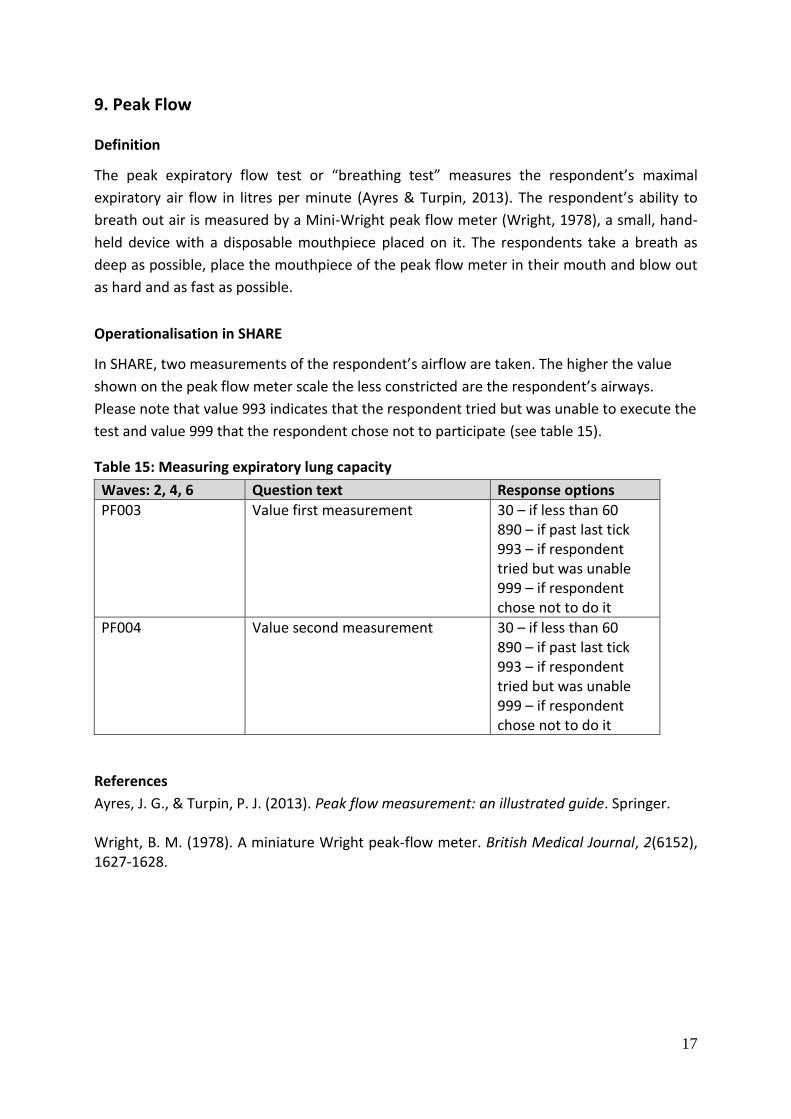
9. Peak Flow
Definition
The peak expiratory flow test or “breathing test” measures the respondent’s maximal
expiratory air flow in litres per minute (Ayres & Turpin, 2013). The respondent’s ability to
breath out air is measured by a Mini-Wright peak flow meter (Wright, 1978), a small, hand-
held device with a disposable mouthpiece placed on it. The respondents take a breath as
deep as possible, place the mouthpiece of the peak flow meter in their mouth and blow out
as hard and as fast as possible.
Operationalisation in SHARE
In SHARE, two measurements of the respondent’s airflow are taken. The higher the value
shown on the peak flow meter scale the less constricted are the respondent’s airways.
Please note that value 993 indicates that the respondent tried but was unable to execute the
test and value 999 that the respondent chose not to participate (see table 15).
Table 15: Measuring expiratory lung capacity
Waves: 2, 4, 6 Question text Response options
PF003 Value first measurement 30 – if less than 60 890 – if past last tick 993 – if respondent tried but was unable 999 – if respondent chose not to do it
PF004 Value second measurement
30 – if less than 60 890 – if past last tick 993 – if respondent tried but was unable 999 – if respondent chose not to do it
References
Ayres, J. G., & Turpin, P. J. (2013). Peak flow measurement: an illustrated guide. Springer. Wright, B. M. (1978). A miniature Wright peak-flow meter. British Medical Journal, 2(6152), 1627-1628.
18
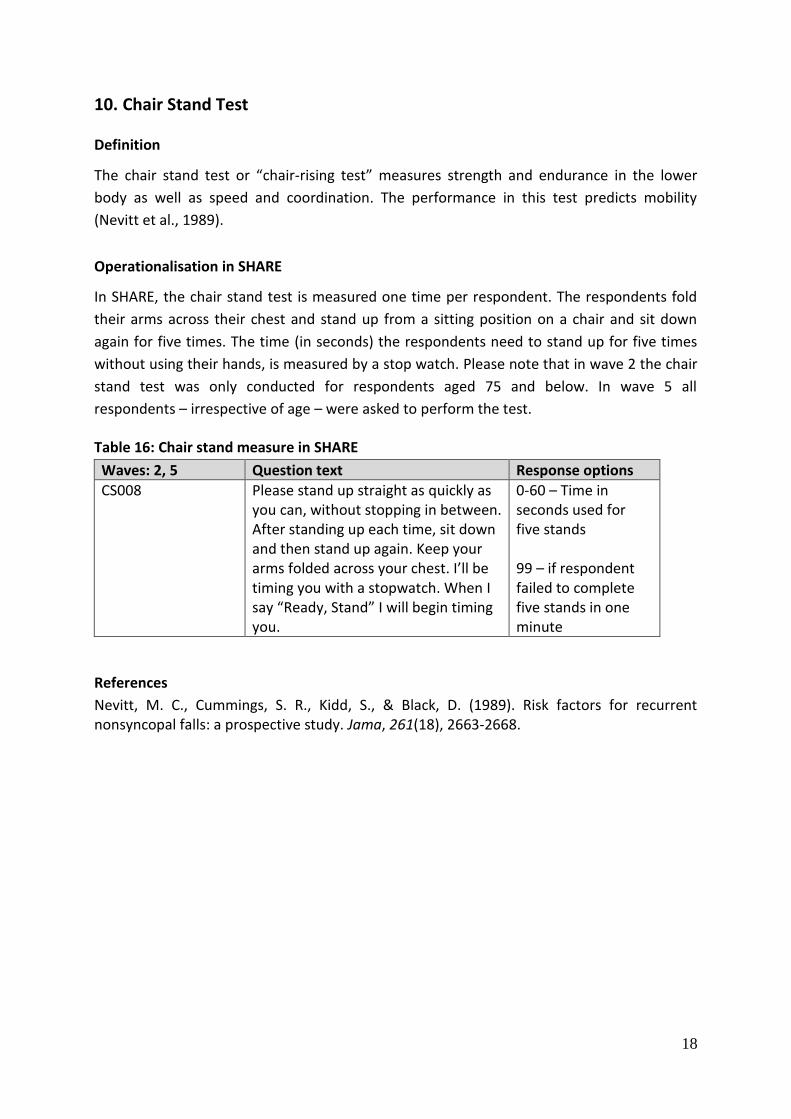
10. Chair Stand Test
Definition
The chair stand test or “chair-rising test” measures strength and endurance in the lower
body as well as speed and coordination. The performance in this test predicts mobility
(Nevitt et al., 1989).
Operationalisation in SHARE
In SHARE, the chair stand test is measured one time per respondent. The respondents fold
their arms across their chest and stand up from a sitting position on a chair and sit down
again for five times. The time (in seconds) the respondents need to stand up for five times
without using their hands, is measured by a stop watch. Please note that in wave 2 the chair
stand test was only conducted for respondents aged 75 and below. In wave 5 all
respondents – irrespective of age – were asked to perform the test.
Table 16: Chair stand measure in SHARE
Waves: 2, 5 Question text Response options
CS008 Please stand up straight as quickly as you can, without stopping in between. After standing up each time, sit down and then stand up again. Keep your arms folded across your chest. I’ll be timing you with a stopwatch. When I say “Ready, Stand” I will begin timing you.
0-60 – Time in seconds used for five stands 99 – if respondent failed to complete five stands in one minute
References
Nevitt, M. C., Cummings, S. R., Kidd, S., & Black, D. (1989). Risk factors for recurrent nonsyncopal falls: a prospective study. Jama, 261(18), 2663-2668.
19
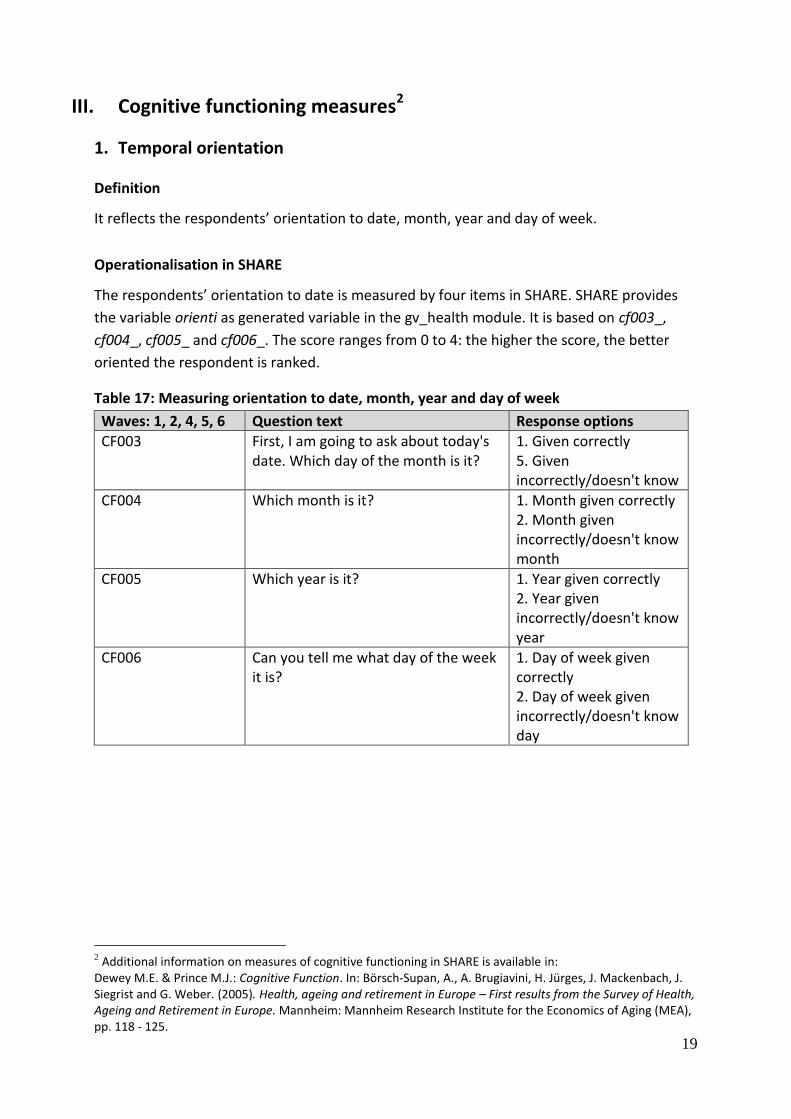
III. Cognitive functioning measures2
1. Temporal orientation
Definition
It reflects the respondents’ orientation to date, month, year and day of week.
Operationalisation in SHARE
The respondents’ orientation to date is measured by four items in SHARE. SHARE provides
the variable orienti as generated variable in the gv_health module. It is based on cf003_,
cf004_, cf005_ and cf006_. The score ranges from 0 to 4: the higher the score, the better
oriented the respondent is ranked.
Table 17: Measuring orientation to date, month, year and day of week
Waves: 1, 2, 4, 5, 6 Question text Response options
CF003 First, I am going to ask about today's date. Which day of the month is it?
1. Given correctly 5. Given incorrectly/doesn't know
CF004 Which month is it? 1. Month given correctly 2. Month given incorrectly/doesn't know month
CF005 Which year is it? 1. Year given correctly 2. Year given incorrectly/doesn't know year
CF006 Can you tell me what day of the week it is?
1. Day of week given correctly 2. Day of week given incorrectly/doesn't know day
2 Additional information on measures of cognitive functioning in SHARE is available in:
Dewey M.E. & Prince M.J.: Cognitive Function. In: Börsch-Supan, A., A. Brugiavini, H. Jürges, J. Mackenbach, J. Siegrist and G. Weber. (2005). Health, ageing and retirement in Europe – First results from the Survey of Health, Ageing and Retirement in Europe. Mannheim: Mannheim Research Institute for the Economics of Aging (MEA), pp. 118 - 125.
20
2. Numeracy
Definition
Numeracy is a measure of the respondents’ mathematical performance.
Operationalisation in SHARE
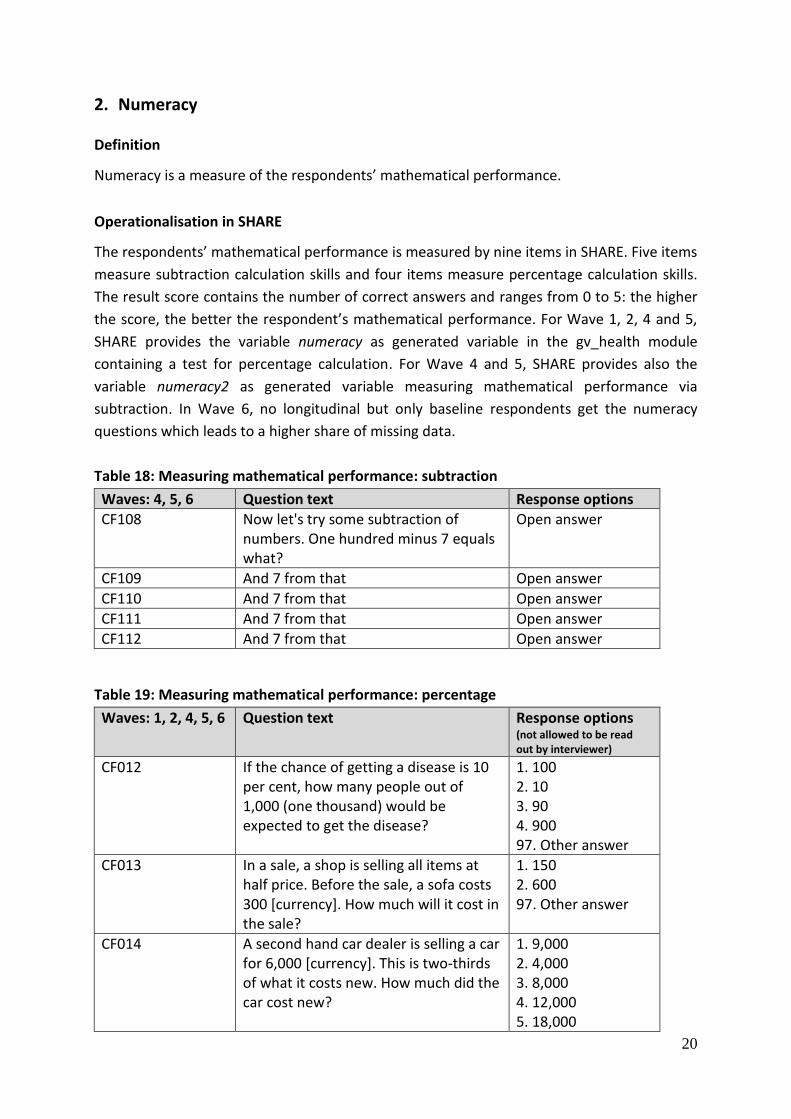
The respondents’ mathematical performance is measured by nine items in SHARE. Five items
measure subtraction calculation skills and four items measure percentage calculation skills.
The result score contains the number of correct answers and ranges from 0 to 5: the higher
the score, the better the respondent’s mathematical performance. For Wave 1, 2, 4 and 5,
SHARE provides the variable numeracy as generated variable in the gv_health module
containing a test for percentage calculation. For Wave 4 and 5, SHARE provides also the
variable numeracy2 as generated variable measuring mathematical performance via
subtraction. In Wave 6, no longitudinal but only baseline respondents get the numeracy
questions which leads to a higher share of missing data.
Table 18: Measuring mathematical performance: subtraction
Waves: 4, 5, 6 Question text Response options
CF108 Now let's try some subtraction of numbers. One hundred minus 7 equals what?
Open answer
CF109 And 7 from that Open answer
CF110 And 7 from that Open answer
CF111 And 7 from that Open answer
CF112 And 7 from that Open answer
Table 19: Measuring mathematical performance: percentage
Waves: 1, 2, 4, 5, 6 Question text Response options (not allowed to be read out by interviewer)
CF012 If the chance of getting a disease is 10 per cent, how many people out of 1,000 (one thousand) would be expected to get the disease?
1. 100 2. 10 3. 90 4. 900 97. Other answer
CF013 In a sale, a shop is selling all items at half price. Before the sale, a sofa costs 300 [currency]. How much will it cost in the sale?
1. 150 2. 600 97. Other answer
CF014 A second hand car dealer is selling a car for 6,000 [currency]. This is two-thirds of what it costs new. How much did the car cost new?
1. 9,000 2. 4,000 3. 8,000 4. 12,000 5. 18,000
21
97. Other answer
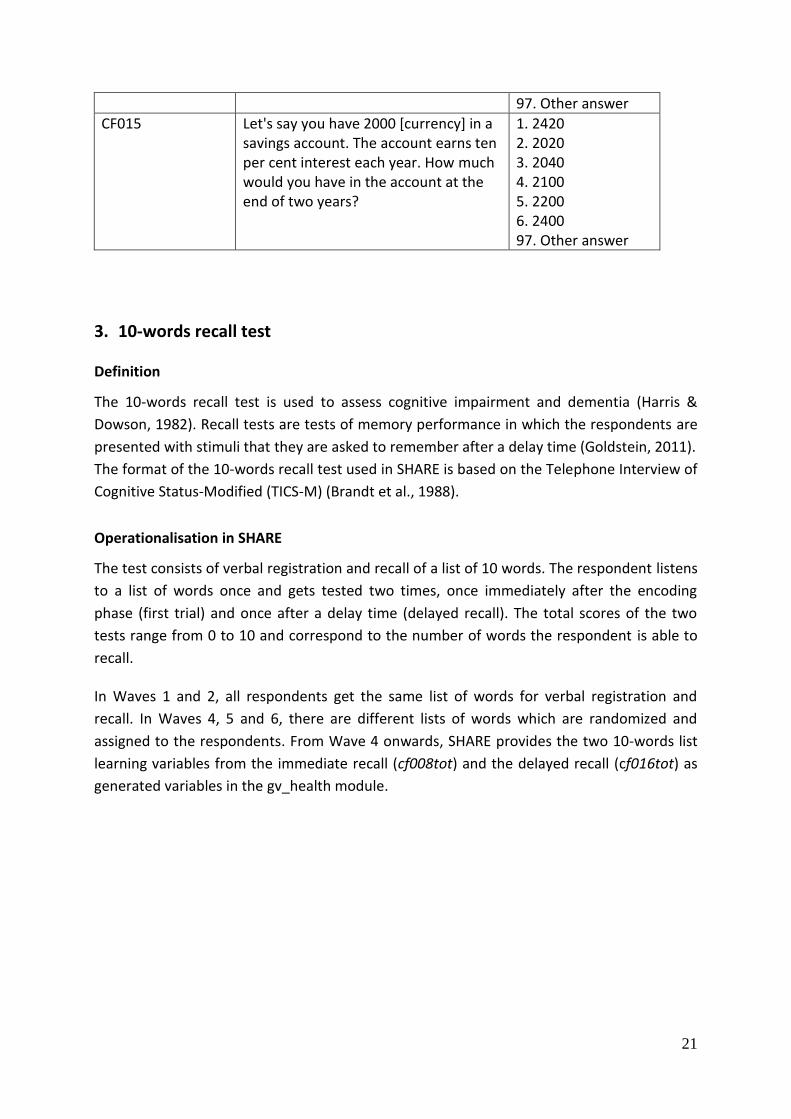
CF015 Let's say you have 2000 [currency] in a savings account. The account earns ten per cent interest each year. How much would you have in the account at the end of two years?
1. 2420 2. 2020 3. 2040 4. 2100 5. 2200 6. 2400 97. Other answer
3. 10-words recall test
Definition
The 10-words recall test is used to assess cognitive impairment and dementia (Harris &
Dowson, 1982). Recall tests are tests of memory performance in which the respondents are
presented with stimuli that they are asked to remember after a delay time (Goldstein, 2011).
The format of the 10-words recall test used in SHARE is based on the Telephone Interview of
Cognitive Status-Modified (TICS-M) (Brandt et al., 1988).
Operationalisation in SHARE
The test consists of verbal registration and recall of a list of 10 words. The respondent listens
to a list of words once and gets tested two times, once immediately after the encoding
phase (first trial) and once after a delay time (delayed recall). The total scores of the two
tests range from 0 to 10 and correspond to the number of words the respondent is able to
recall.
In Waves 1 and 2, all respondents get the same list of words for verbal registration and
recall. In Waves 4, 5 and 6, there are different lists of words which are randomized and
assigned to the respondents. From Wave 4 onwards, SHARE provides the two 10-words list
learning variables from the immediate recall (cf008tot) and the delayed recall (cf016tot) as
generated variables in the gv_health module.
22
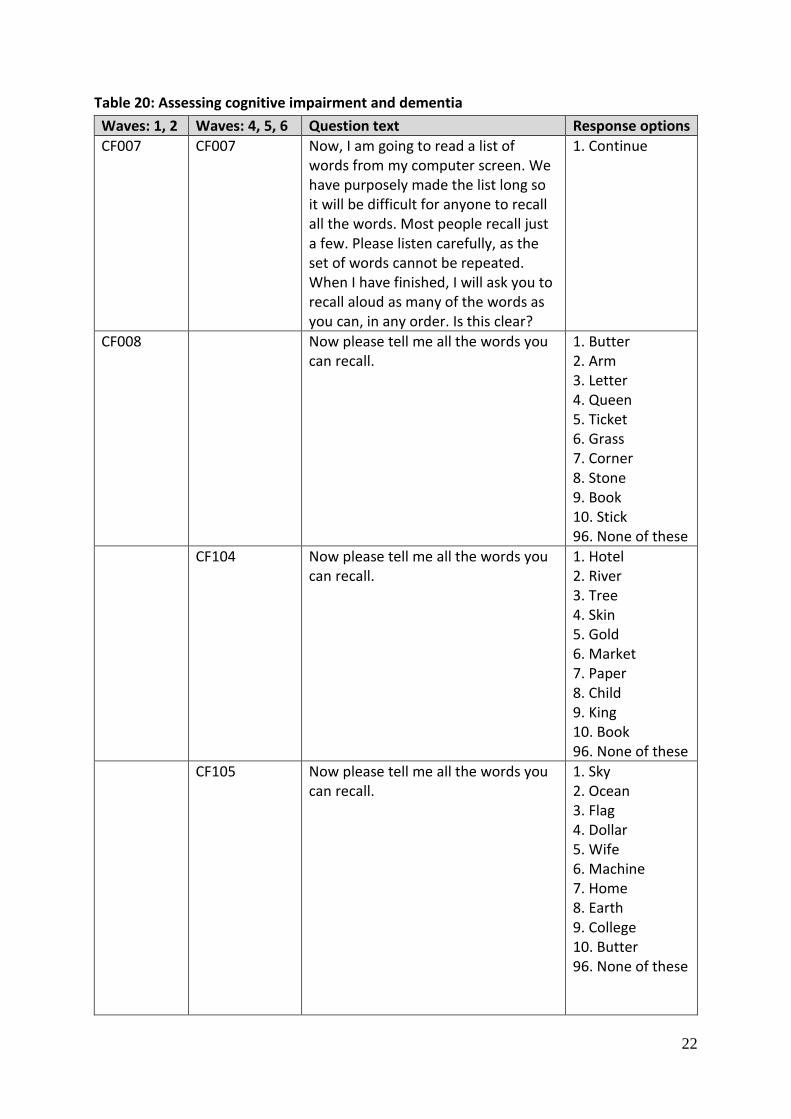
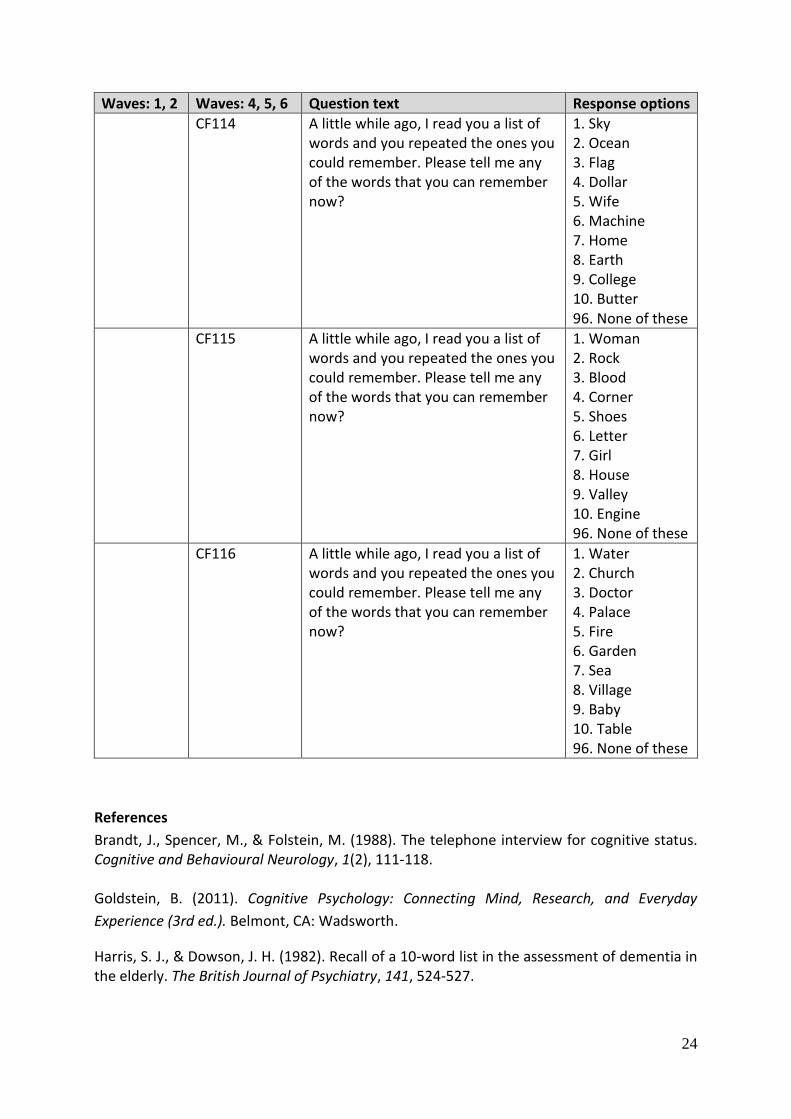
Table 20: Assessing cognitive impairment and dementia
Waves: 1, 2 Waves: 4, 5, 6 Question text Response options
CF007 CF007 Now, I am going to read a list of words from my computer screen. We have purposely made the list long so it will be difficult for anyone to recall all the words. Most people recall just a few. Please listen carefully, as the set of words cannot be repeated. When I have finished, I will ask you to recall aloud as many of the words as you can, in any order. Is this clear?
1. Continue
CF008 Now please tell me all the words you can recall.
1. Butter 2. Arm 3. Letter 4. Queen 5. Ticket 6. Grass 7. Corner 8. Stone 9. Book 10. Stick 96. None of these
CF104 Now please tell me all the words you can recall.
1. Hotel 2. River 3. Tree 4. Skin 5. Gold 6. Market 7. Paper 8. Child 9. King 10. Book 96. None of these
CF105 Now please tell me all the words you can recall.
1. Sky 2. Ocean 3. Flag 4. Dollar 5. Wife 6. Machine 7. Home 8. Earth 9. College 10. Butter 96. None of these
23
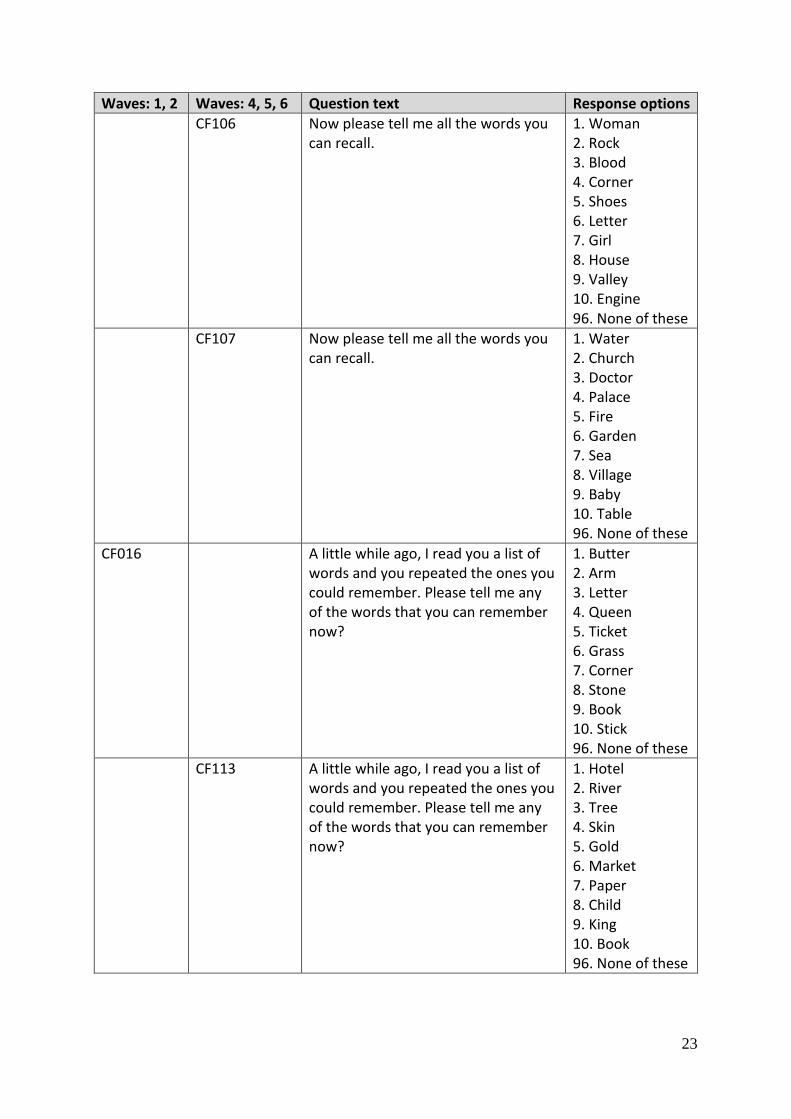
Waves: 1, 2 Waves: 4, 5, 6 Question text Response options
CF106 Now please tell me all the words you can recall.
1. Woman 2. Rock 3. Blood 4. Corner 5. Shoes 6. Letter 7. Girl 8. House 9. Valley 10. Engine 96. None of these
CF107 Now please tell me all the words you can recall.
1. Water 2. Church 3. Doctor 4. Palace 5. Fire 6. Garden 7. Sea 8. Village 9. Baby 10. Table 96. None of these
CF016 A little while ago, I read you a list of words and you repeated the ones you could remember. Please tell me any of the words that you can remember now?
1. Butter 2. Arm 3. Letter 4. Queen 5. Ticket 6. Grass 7. Corner 8. Stone 9. Book 10. Stick 96. None of these
CF113 A little while ago, I read you a list of words and you repeated the ones you could remember. Please tell me any of the words that you can remember now?
1. Hotel 2. River 3. Tree 4. Skin 5. Gold 6. Market 7. Paper 8. Child 9. King 10. Book 96. None of these
24
Waves: 1, 2 Waves: 4, 5, 6 Question text Response options
CF114 A little while ago, I read you a list of words and you repeated the ones you could remember. Please tell me any of the words that you can remember now?
1. Sky 2. Ocean 3. Flag 4. Dollar 5. Wife 6. Machine 7. Home 8. Earth 9. College 10. Butter 96. None of these
CF115 A little while ago, I read you a list of words and you repeated the ones you could remember. Please tell me any of the words that you can remember now?
1. Woman 2. Rock 3. Blood 4. Corner 5. Shoes 6. Letter 7. Girl 8. House 9. Valley 10. Engine 96. None of these
CF116 A little while ago, I read you a list of words and you repeated the ones you could remember. Please tell me any of the words that you can remember now?
1. Water 2. Church 3. Doctor 4. Palace 5. Fire 6. Garden 7. Sea 8. Village 9. Baby 10. Table 96. None of these
References
Brandt, J., Spencer, M., & Folstein, M. (1988). The telephone interview for cognitive status. Cognitive and Behavioural Neurology, 1(2), 111-118. Goldstein, B. (2011). Cognitive Psychology: Connecting Mind, Research, and Everyday
Experience (3rd ed.). Belmont, CA: Wadsworth.
Harris, S. J., & Dowson, J. H. (1982). Recall of a 10-word list in the assessment of dementia in the elderly. The British Journal of Psychiatry, 141, 524-527.
25
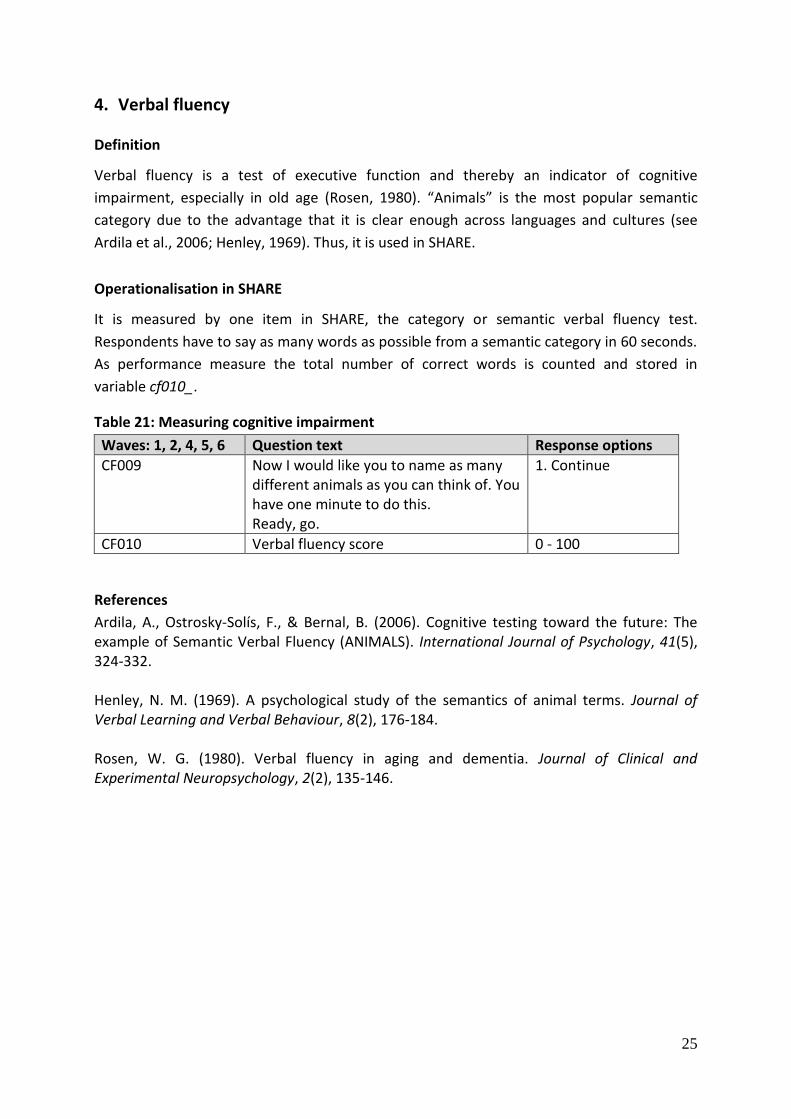
4. Verbal fluency
Definition
Verbal fluency is a test of executive function and thereby an indicator of cognitive
impairment, especially in old age (Rosen, 1980). “Animals” is the most popular semantic
category due to the advantage that it is clear enough across languages and cultures (see
Ardila et al., 2006; Henley, 1969). Thus, it is used in SHARE.
Operationalisation in SHARE
It is measured by one item in SHARE, the category or semantic verbal fluency test.
Respondents have to say as many words as possible from a semantic category in 60 seconds.
As performance measure the total number of correct words is counted and stored in
variable cf010_.
Table 21: Measuring cognitive impairment
Waves: 1, 2, 4, 5, 6 Question text Response options
CF009 Now I would like you to name as many different animals as you can think of. You have one minute to do this. Ready, go.
1. Continue
CF010 Verbal fluency score 0 - 100
References
Ardila, A., Ostrosky‐Solís, F., & Bernal, B. (2006). Cognitive testing toward the future: The example of Semantic Verbal Fluency (ANIMALS). International Journal of Psychology, 41(5), 324-332. Henley, N. M. (1969). A psychological study of the semantics of animal terms. Journal of Verbal Learning and Verbal Behaviour, 8(2), 176-184. Rosen, W. G. (1980). Verbal fluency in aging and dementia. Journal of Clinical and Experimental Neuropsychology, 2(2), 135-146.
26
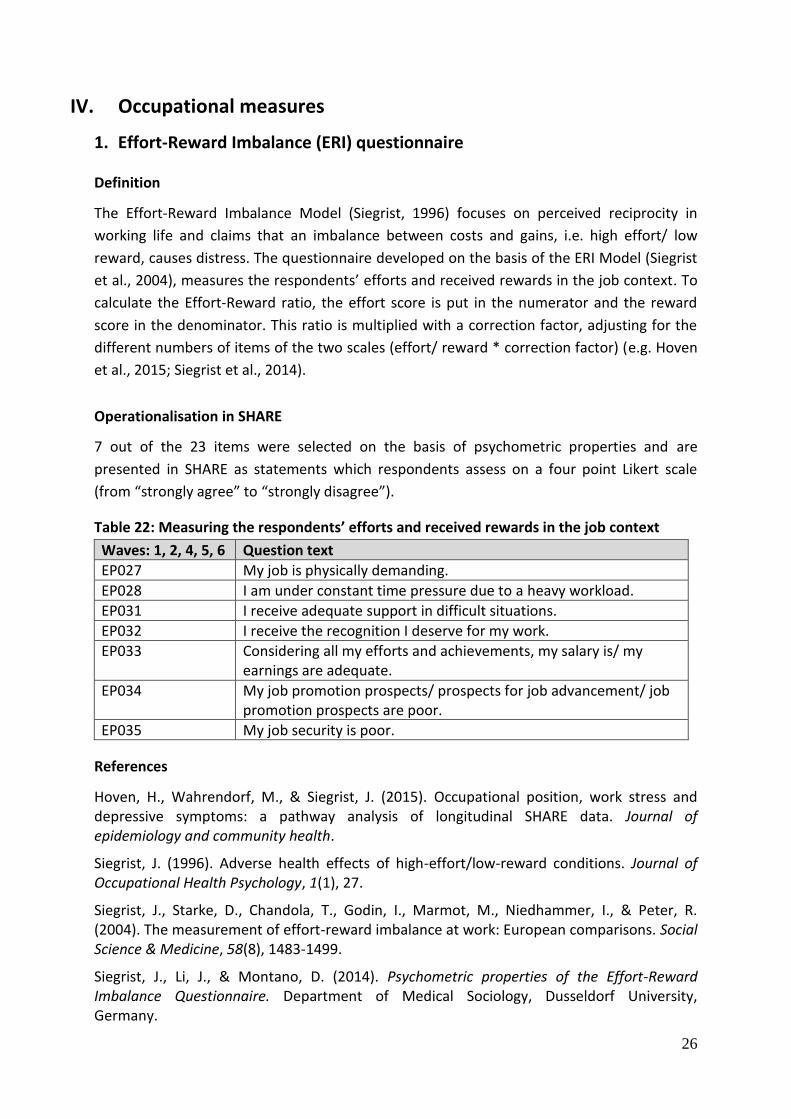
IV. Occupational measures
1. Effort-Reward Imbalance (ERI) questionnaire
Definition
The Effort-Reward Imbalance Model (Siegrist, 1996) focuses on perceived reciprocity in
working life and claims that an imbalance between costs and gains, i.e. high effort/ low
reward, causes distress. The questionnaire developed on the basis of the ERI Model (Siegrist
et al., 2004), measures the respondents’ efforts and received rewards in the job context. To
calculate the Effort-Reward ratio, the effort score is put in the numerator and the reward
score in the denominator. This ratio is multiplied with a correction factor, adjusting for the
different numbers of items of the two scales (effort/ reward * correction factor) (e.g. Hoven
et al., 2015; Siegrist et al., 2014).
Operationalisation in SHARE
7 out of the 23 items were selected on the basis of psychometric properties and are
presented in SHARE as statements which respondents assess on a four point Likert scale
(from “strongly agree” to “strongly disagree”).
Table 22: Measuring the respondents’ efforts and received rewards in the job context
Waves: 1, 2, 4, 5, 6 Question text
EP027 My job is physically demanding.
EP028 I am under constant time pressure due to a heavy workload.
EP031 I receive adequate support in difficult situations.
EP032 I receive the recognition I deserve for my work.
EP033 Considering all my efforts and achievements, my salary is/ my earnings are adequate.
EP034 My job promotion prospects/ prospects for job advancement/ job promotion prospects are poor.
EP035 My job security is poor.
References
Hoven, H., Wahrendorf, M., & Siegrist, J. (2015). Occupational position, work stress and depressive symptoms: a pathway analysis of longitudinal SHARE data. Journal of epidemiology and community health.
Siegrist, J. (1996). Adverse health effects of high-effort/low-reward conditions. Journal of Occupational Health Psychology, 1(1), 27.
Siegrist, J., Starke, D., Chandola, T., Godin, I., Marmot, M., Niedhammer, I., & Peter, R. (2004). The measurement of effort-reward imbalance at work: European comparisons. Social Science & Medicine, 58(8), 1483-1499.
Siegrist, J., Li, J., & Montano, D. (2014). Psychometric properties of the Effort-Reward Imbalance Questionnaire. Department of Medical Sociology, Dusseldorf University, Germany.
27
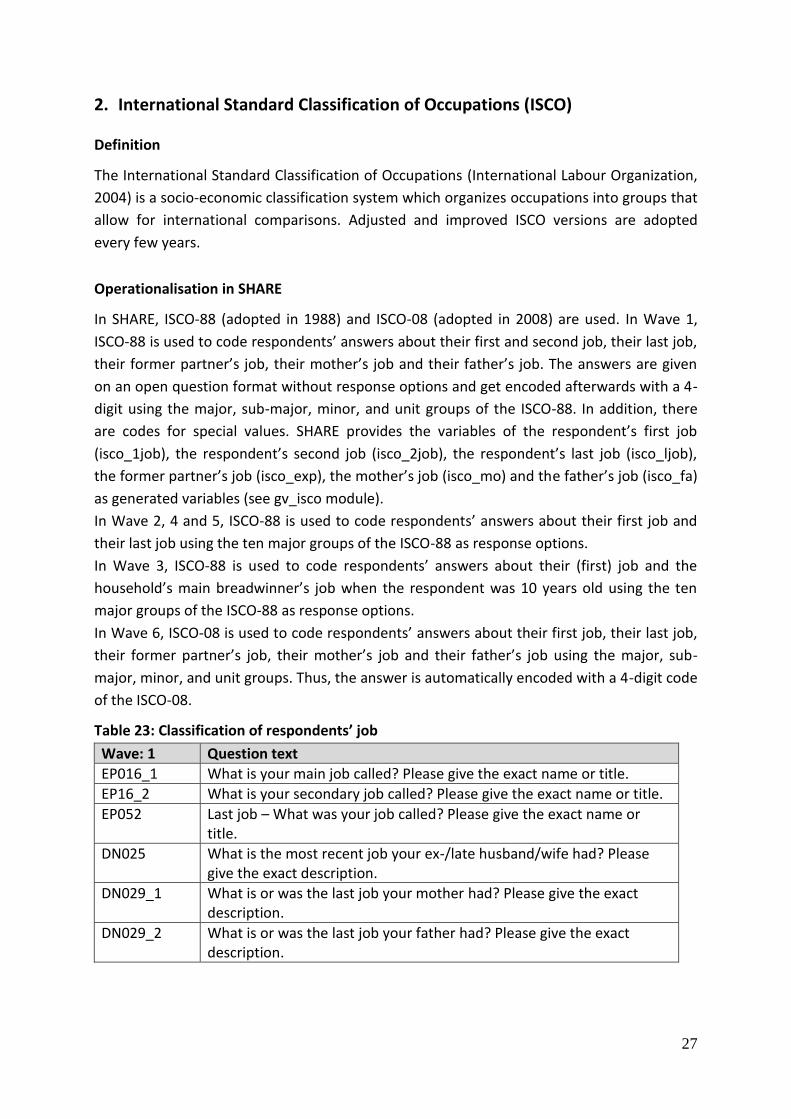
2. International Standard Classification of Occupations (ISCO)
Definition
The International Standard Classification of Occupations (International Labour Organization,
2004) is a socio-economic classification system which organizes occupations into groups that
allow for international comparisons. Adjusted and improved ISCO versions are adopted
every few years.
Operationalisation in SHARE
In SHARE, ISCO-88 (adopted in 1988) and ISCO-08 (adopted in 2008) are used. In Wave 1,
ISCO-88 is used to code respondents’ answers about their first and second job, their last job,
their former partner’s job, their mother’s job and their father’s job. The answers are given
on an open question format without response options and get encoded afterwards with a 4-
digit using the major, sub-major, minor, and unit groups of the ISCO-88. In addition, there
are codes for special values. SHARE provides the variables of the respondent’s first job
(isco_1job), the respondent’s second job (isco_2job), the respondent’s last job (isco_ljob),
the former partner’s job (isco_exp), the mother’s job (isco_mo) and the father’s job (isco_fa)
as generated variables (see gv_isco module).
In Wave 2, 4 and 5, ISCO-88 is used to code respondents’ answers about their first job and
their last job using the ten major groups of the ISCO-88 as response options.
In Wave 3, ISCO-88 is used to code respondents’ answers about their (first) job and the
household’s main breadwinner’s job when the respondent was 10 years old using the ten
major groups of the ISCO-88 as response options.
In Wave 6, ISCO-08 is used to code respondents’ answers about their first job, their last job,
their former partner’s job, their mother’s job and their father’s job using the major, sub-
major, minor, and unit groups. Thus, the answer is automatically encoded with a 4-digit code
of the ISCO-08.
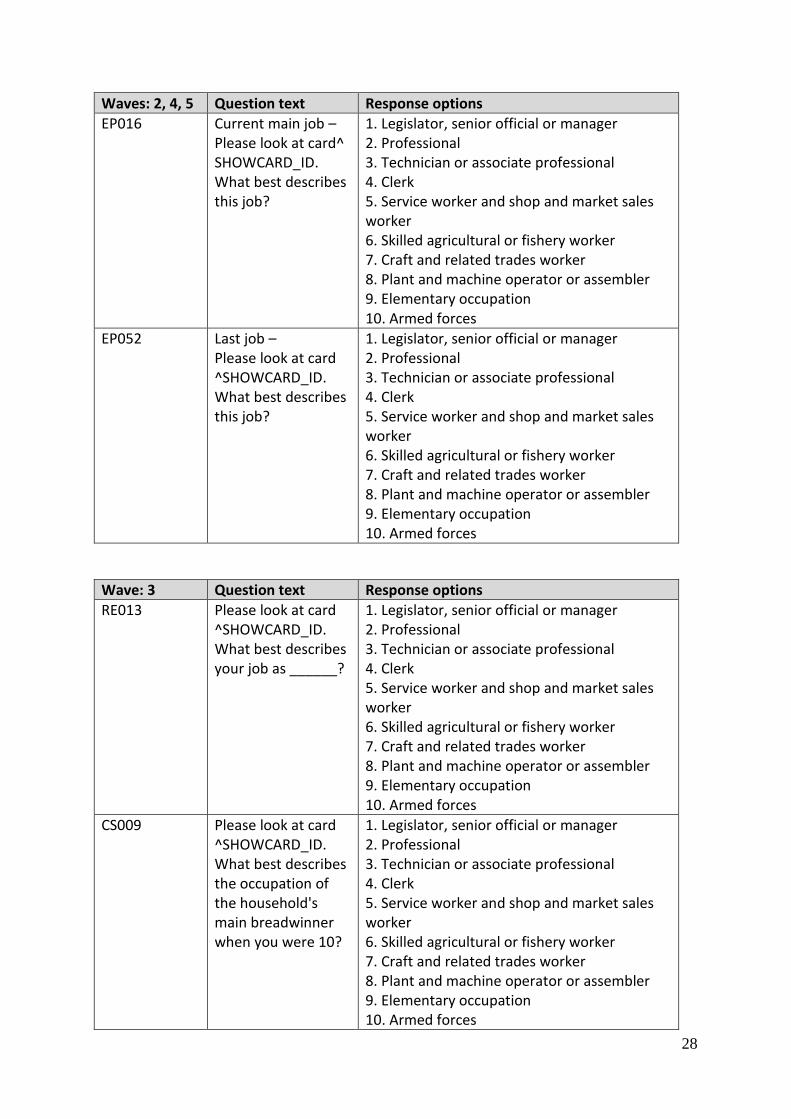
Table 23: Classification of respondents’ job
Wave: 1 Question text
EP016_1 What is your main job called? Please give the exact name or title.
EP16_2 What is your secondary job called? Please give the exact name or title.
EP052 Last job – What was your job called? Please give the exact name or title.
DN025 What is the most recent job your ex-/late husband/wife had? Please give the exact description.
DN029_1 What is or was the last job your mother had? Please give the exact description.
DN029_2 What is or was the last job your father had? Please give the exact description.
28
Waves: 2, 4, 5 Question text Response options
EP016 Current main job – Please look at card^ SHOWCARD_ID. What best describes this job?
1. Legislator, senior official or manager 2. Professional 3. Technician or associate professional 4. Clerk 5. Service worker and shop and market sales worker 6. Skilled agricultural or fishery worker 7. Craft and related trades worker 8. Plant and machine operator or assembler 9. Elementary occupation 10. Armed forces
EP052 Last job – Please look at card ^SHOWCARD_ID. What best describes this job?
1. Legislator, senior official or manager 2. Professional 3. Technician or associate professional 4. Clerk 5. Service worker and shop and market sales worker 6. Skilled agricultural or fishery worker 7. Craft and related trades worker 8. Plant and machine operator or assembler 9. Elementary occupation 10. Armed forces
Wave: 3 Question text Response options
RE013 Please look at card ^SHOWCARD_ID. What best describes your job as ______?
1. Legislator, senior official or manager 2. Professional 3. Technician or associate professional 4. Clerk 5. Service worker and shop and market sales worker 6. Skilled agricultural or fishery worker 7. Craft and related trades worker 8. Plant and machine operator or assembler 9. Elementary occupation 10. Armed forces
CS009 Please look at card ^SHOWCARD_ID. What best describes the occupation of the household's main breadwinner when you were 10?
1. Legislator, senior official or manager 2. Professional 3. Technician or associate professional 4. Clerk 5. Service worker and shop and market sales worker 6. Skilled agricultural or fishery worker 7. Craft and related trades worker 8. Plant and machine operator or assembler 9. Elementary occupation 10. Armed forces
29
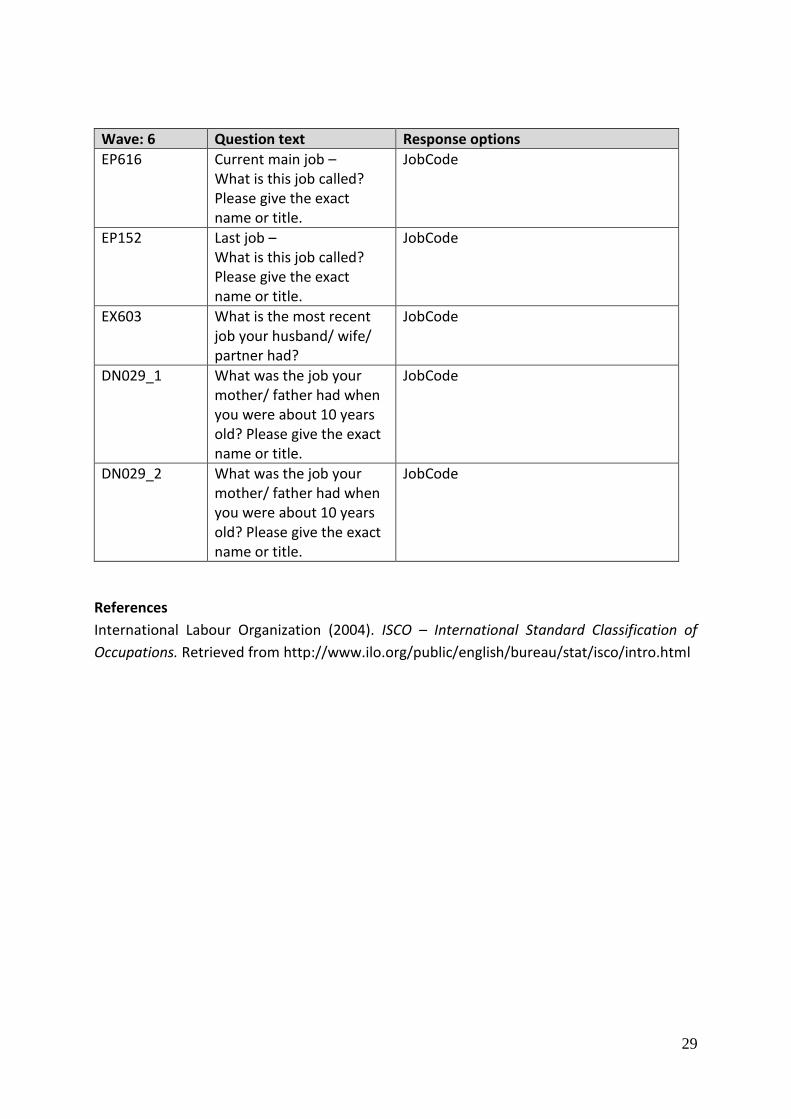
Wave: 6 Question text Response options
EP616 Current main job – What is this job called? Please give the exact name or title.
JobCode
EP152 Last job – What is this job called? Please give the exact name or title.
JobCode
EX603 What is the most recent job your husband/ wife/ partner had?
JobCode
DN029_1 What was the job your mother/ father had when you were about 10 years old? Please give the exact name or title.
JobCode
DN029_2 What was the job your mother/ father had when you were about 10 years old? Please give the exact name or title.
JobCode
References
International Labour Organization (2004). ISCO – International Standard Classification of
Occupations. Retrieved from http://www.ilo.org/public/english/bureau/stat/isco/intro.html
30
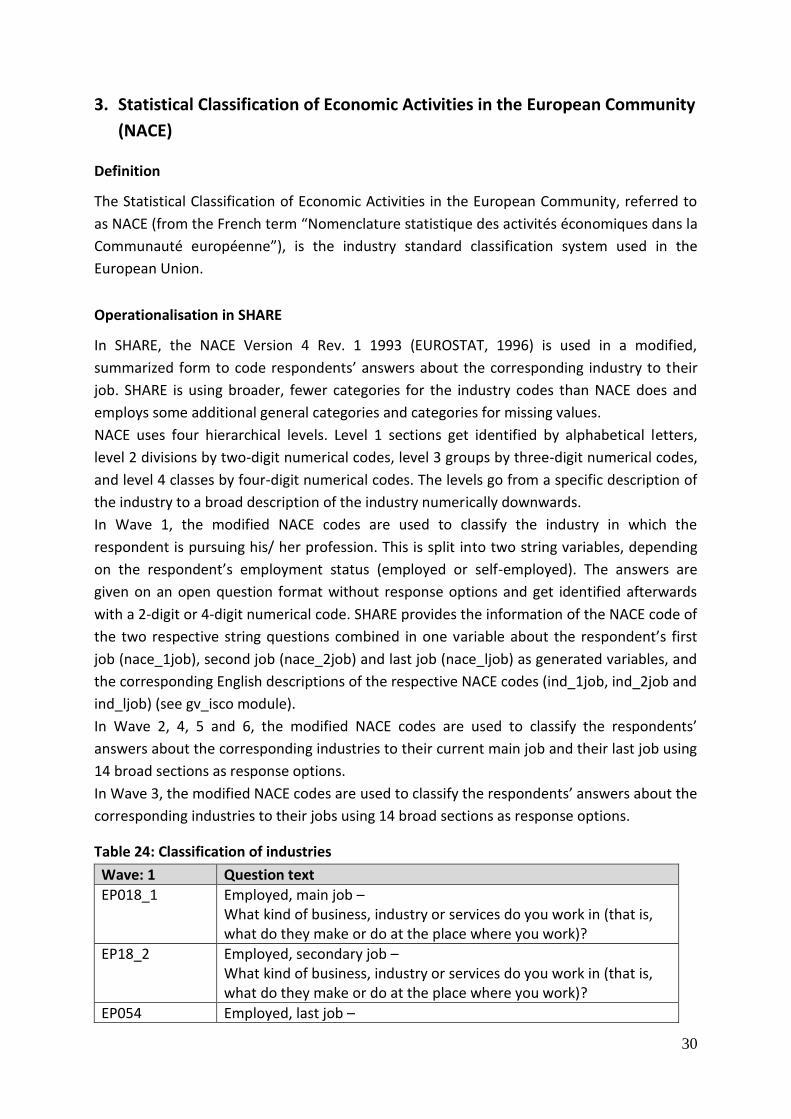
3. Statistical Classification of Economic Activities in the European Community
(NACE)
Definition
The Statistical Classification of Economic Activities in the European Community, referred to
as NACE (from the French term “Nomenclature statistique des activités économiques dans la
Communauté européenne”), is the industry standard classification system used in the
European Union.
Operationalisation in SHARE
In SHARE, the NACE Version 4 Rev. 1 1993 (EUROSTAT, 1996) is used in a modified,
summarized form to code respondents’ answers about the corresponding industry to their
job. SHARE is using broader, fewer categories for the industry codes than NACE does and
employs some additional general categories and categories for missing values.
NACE uses four hierarchical levels. Level 1 sections get identified by alphabetical letters,
level 2 divisions by two-digit numerical codes, level 3 groups by three-digit numerical codes,
and level 4 classes by four-digit numerical codes. The levels go from a specific description of
the industry to a broad description of the industry numerically downwards.
In Wave 1, the modified NACE codes are used to classify the industry in which the
respondent is pursuing his/ her profession. This is split into two string variables, depending
on the respondent’s employment status (employed or self-employed). The answers are
given on an open question format without response options and get identified afterwards
with a 2-digit or 4-digit numerical code. SHARE provides the information of the NACE code of
the two respective string questions combined in one variable about the respondent’s first
job (nace_1job), second job (nace_2job) and last job (nace_ljob) as generated variables, and
the corresponding English descriptions of the respective NACE codes (ind_1job, ind_2job and
ind_ljob) (see gv_isco module).
In Wave 2, 4, 5 and 6, the modified NACE codes are used to classify the respondents’
answers about the corresponding industries to their current main job and their last job using
14 broad sections as response options.
In Wave 3, the modified NACE codes are used to classify the respondents’ answers about the
corresponding industries to their jobs using 14 broad sections as response options.
Table 24: Classification of industries
Wave: 1 Question text
EP018_1 Employed, main job – What kind of business, industry or services do you work in (that is, what do they make or do at the place where you work)?
EP18_2 Employed, secondary job – What kind of business, industry or services do you work in (that is, what do they make or do at the place where you work)?
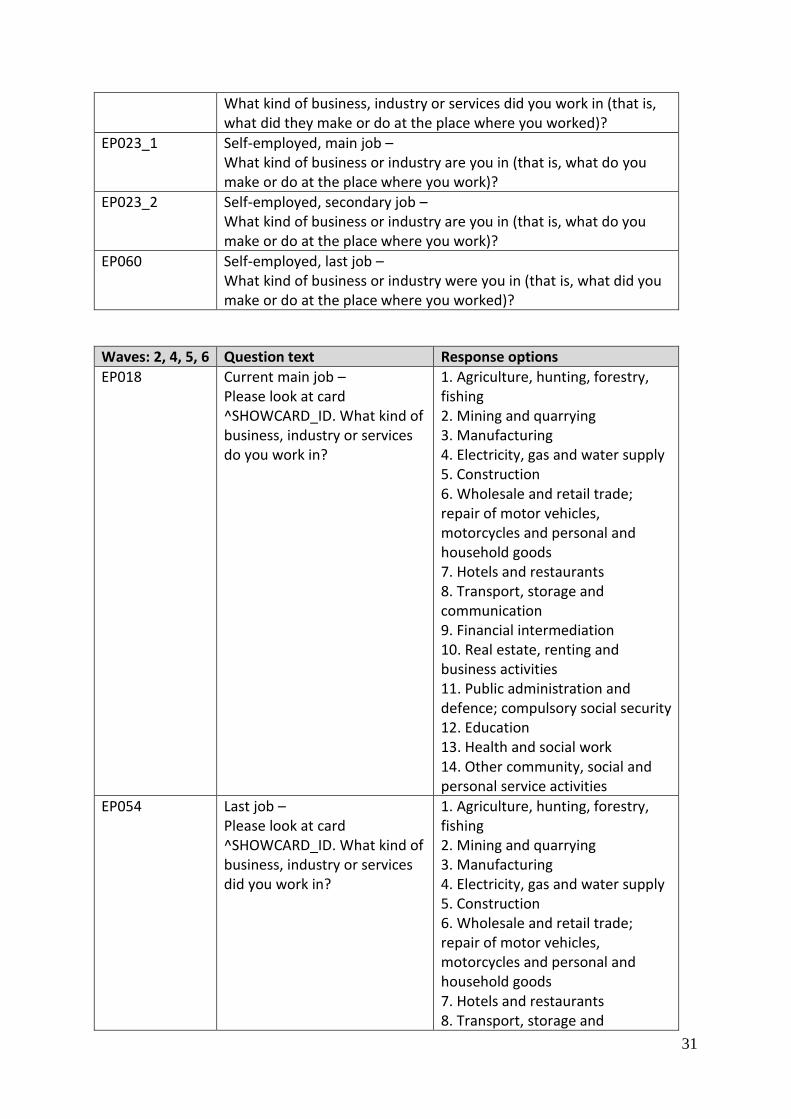
EP054 Employed, last job –
31
What kind of business, industry or services did you work in (that is, what did they make or do at the place where you worked)?
EP023_1 Self-employed, main job – What kind of business or industry are you in (that is, what do you make or do at the place where you work)?
EP023_2 Self-employed, secondary job – What kind of business or industry are you in (that is, what do you make or do at the place where you work)?
EP060 Self-employed, last job – What kind of business or industry were you in (that is, what did you make or do at the place where you worked)?
Waves: 2, 4, 5, 6 Question text Response options
EP018 Current main job – Please look at card ^SHOWCARD_ID. What kind of business, industry or services do you work in?
1. Agriculture, hunting, forestry, fishing 2. Mining and quarrying 3. Manufacturing 4. Electricity, gas and water supply 5. Construction 6. Wholesale and retail trade; repair of motor vehicles, motorcycles and personal and household goods 7. Hotels and restaurants 8. Transport, storage and communication 9. Financial intermediation 10. Real estate, renting and business activities 11. Public administration and defence; compulsory social security 12. Education 13. Health and social work 14. Other community, social and personal service activities
EP054 Last job – Please look at card ^SHOWCARD_ID. What kind of business, industry or services did you work in?
1. Agriculture, hunting, forestry, fishing 2. Mining and quarrying 3. Manufacturing 4. Electricity, gas and water supply 5. Construction 6. Wholesale and retail trade; repair of motor vehicles, motorcycles and personal and household goods 7. Hotels and restaurants 8. Transport, storage and
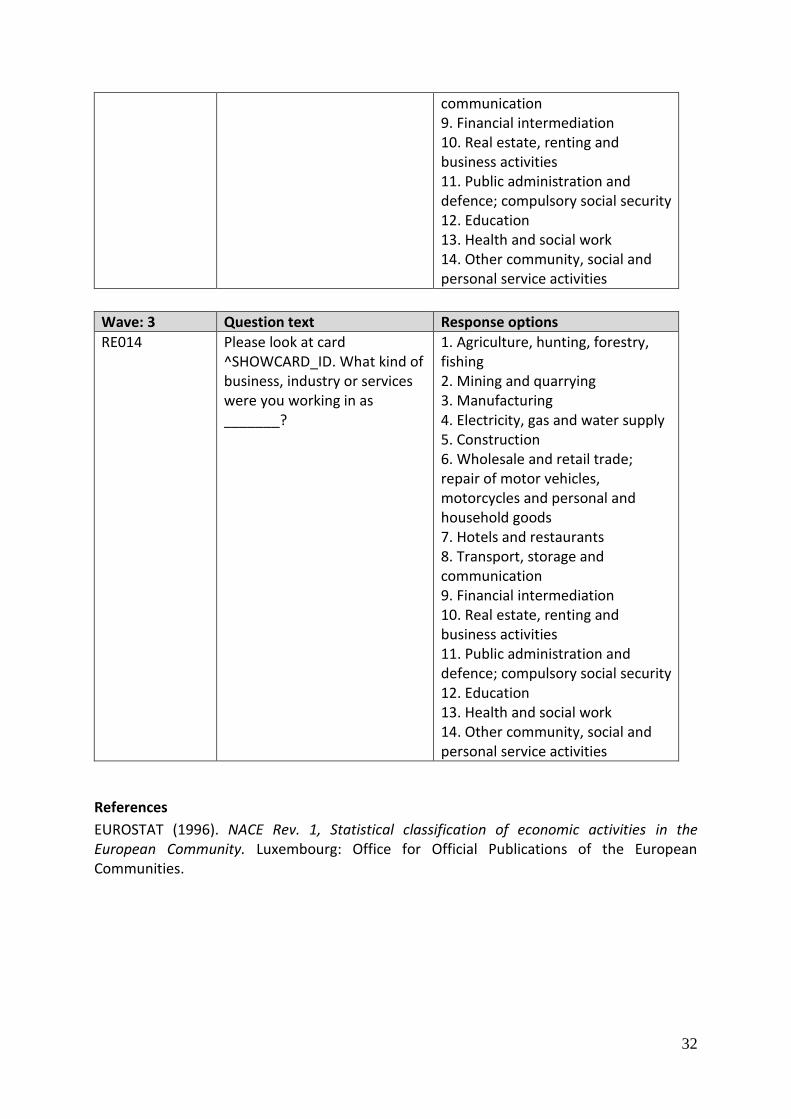
32
communication 9. Financial intermediation 10. Real estate, renting and business activities 11. Public administration and defence; compulsory social security 12. Education 13. Health and social work 14. Other community, social and personal service activities
Wave: 3 Question text Response options
RE014 Please look at card ^SHOWCARD_ID. What kind of business, industry or services were you working in as _______?
1. Agriculture, hunting, forestry, fishing 2. Mining and quarrying 3. Manufacturing 4. Electricity, gas and water supply 5. Construction 6. Wholesale and retail trade; repair of motor vehicles, motorcycles and personal and household goods 7. Hotels and restaurants 8. Transport, storage and communication 9. Financial intermediation 10. Real estate, renting and business activities 11. Public administration and defence; compulsory social security 12. Education 13. Health and social work 14. Other community, social and personal service activities
References
EUROSTAT (1996). NACE Rev. 1, Statistical classification of economic activities in the European Community. Luxembourg: Office for Official Publications of the European Communities.
33
V. Educational measures
1. International Standard Classification of Education (ISCED)
Definition
The International Standard Classification of Education (ISCED) is a statistical standard coding
of education for international and national comparisons, maintained by the UNESCO. The
ISCED is organized in hierarchical education levels. SHARE uses country specific codes based
on the revised versions ISCED-97 (UNESCO, 2006) and ISCED-11 (UNESCO, 2012). Due to the
importance of the duration criteria of educational programs for classification, SHARE also
asks about years of education derived from the ISCED.
Operationalisation in SHARE
In Wave 1, the ISCED-97 is used to code the educational level of the respondent, the
respondent’s former spouse (divorced, widowed, living separated), up to four selected
children of the respondent and the interviewer. The response options are country specific
categories which are comparable across all SHARE countries. SHARE provides the variables
about the education of the respondent (isced1997_r), the respondent’s former spouse
(isced1997_sp), the respondent’s selected child 1 (isced1997_c1), the respondent’s selected
child 2 (isced1997_c2), the respondent’s selected child 3 (isced1997_c3), the respondent’s
selected child 4 (isced1997_c4) and the interviewer (isced1997_iv) as generated variables in
the gv_isced module. The duration of education is derived from the ISCED-97 coding of the
aforementioned variables. SHARE provides the years of education of the respondent
(iscedy_r), the respondent’s former spouse (iscedy_sp), the respondent’s selected child 1
(iscedy_c1), the respondent’s selected child 2 (iscedy_c2), the respondent’s selected child 3
(iscedy_c3), the respondent’s selected child 4 (iscedy_c4) and of the interviewer (iscedy_i) as
generated variables.
In Wave 2, the ISCED-97 is used to code the educational level of the respondent, the
respondent’s former spouse (divorced, widowed, living separated) and up to four selected
children of the respondent. The response options are country specific categories which are
comparable across all SHARE countries. Additionally, the years of education of the
respondent and his/ her former spouse are asked. SHARE provides the variables about the
education of the respondent (isced1997_r), the respondent’s former spouse (isced1997_sp),
the respondent’s selected child 1 (isced1997_c1), the respondent’s selected child 2
(isced1997_c2), the respondent’s selected child 3 (isced1997_c3) and the respondent’s
selected child 4 (isced1997_c4) as generated variables in the gv_isced module.
In Wave 4, the ISCED-97 is used to code the educational level of the respondent, the
respondent’s former spouse (divorced, widowed, living separated) and all the children of the
34
respondent. The response options are country specific categories which are comparable
across all SHARE countries. Additionally, the years of education of the respondent and his/
her former spouse are asked. SHARE provides the variables about the education of the
respondent (isced1997_r), the respondent’s former spouse (isced1997_sp) and all of the
respondent’s children 1-20 (isced1997_c1-c20) as generated variables (see gv_isced
module).
In Wave 5 and 6, both ISCED versions, the ISCED-97 and the ISCED-11, are used to code the
educational level of the respondent, the respondent’s former spouse (divorced, widowed,
living separated), all the children of the respondent, the respondent’s father and the
respondent’s mother. The response options are country specific categories which are
comparable across all SHARE countries. In Wave 5, additionally, the years of education of the
respondent and his/ her former spouse are asked. In Wave 6, additionally, the years of
education of the respondent are asked, and if the respondent has already participated once,
he or she is asked if their child or any of their children obtained a new educational degree
since the last interview and if so, which one.
SHARE provides the variables about the education of the respondent (isced1997_r;
isced_2011_r), the respondent’s former spouse (isced1997_sp; isced2001_sp), all of the
respondent’s children (isced1997_c1-c18; isced2011_c1-c18), the respondent’s mother
(isced1997_m; isced2011_m) and the respondent’s father (isced1997_f; isced2011_f) as
generated variables in the gv_isced module.
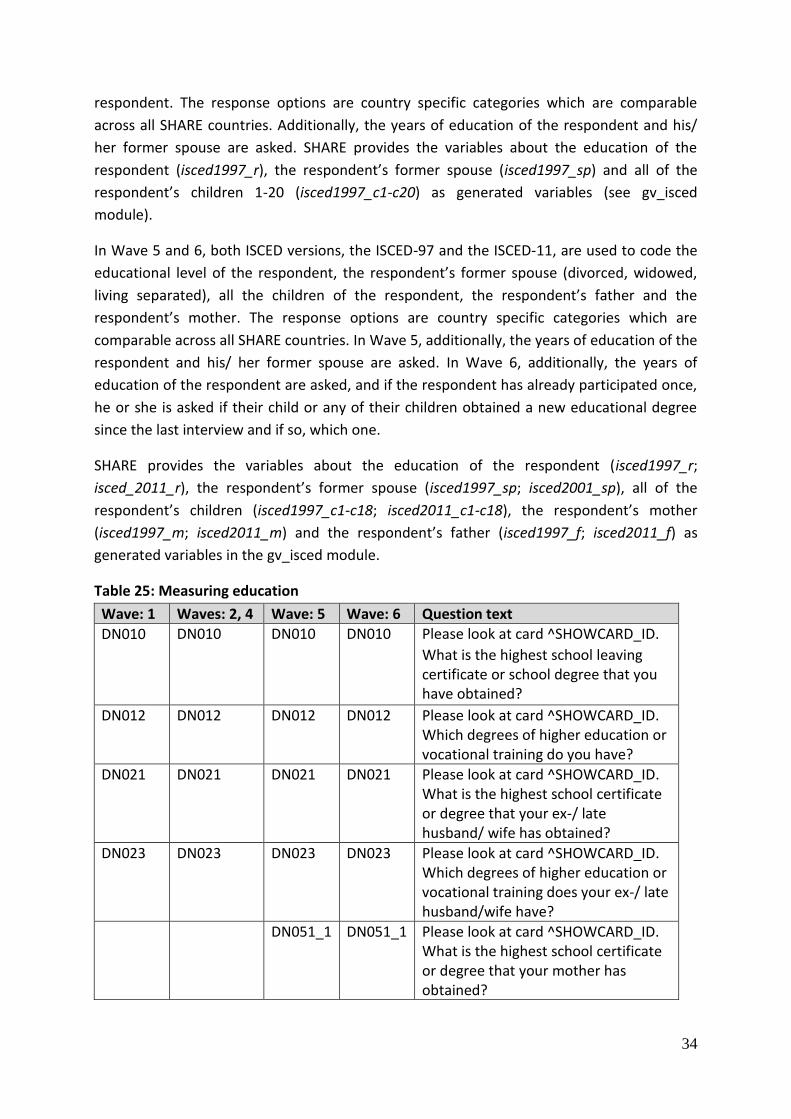
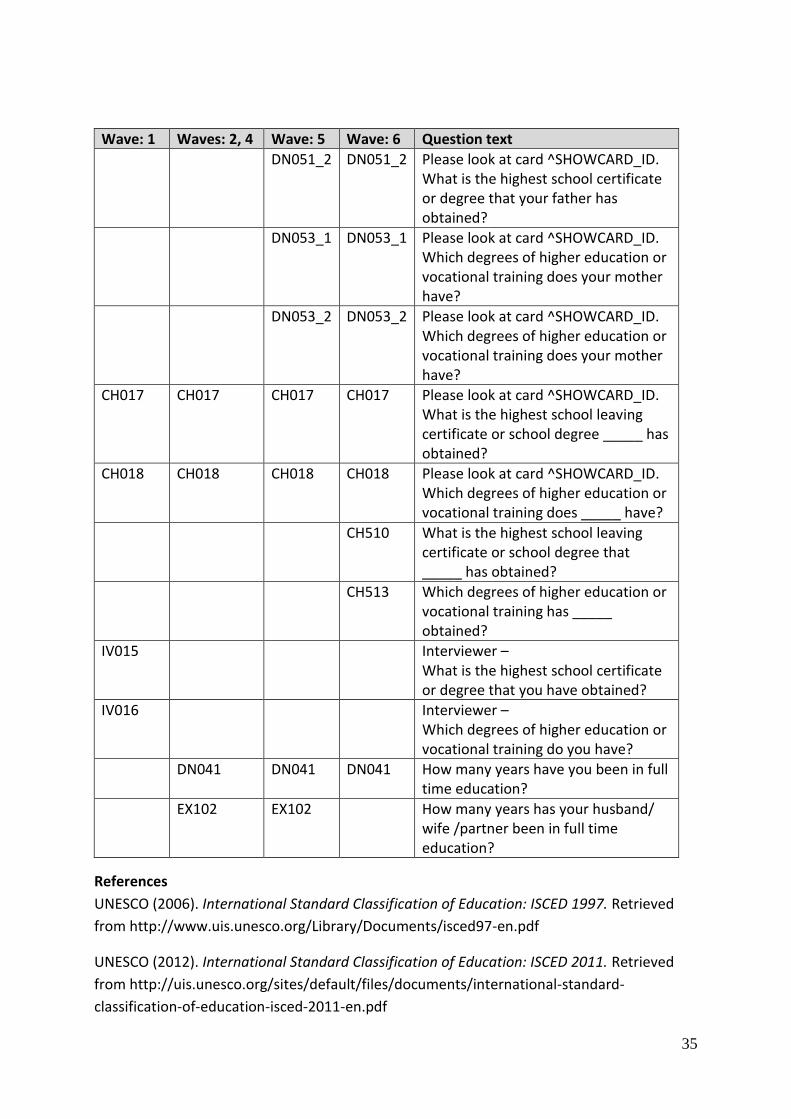
Table 25: Measuring education
Wave: 1 Waves: 2, 4 Wave: 5 Wave: 6 Question text
DN010 DN010 DN010 DN010 Please look at card ^SHOWCARD_ID.
What is the highest school leaving certificate or school degree that you have obtained?
DN012 DN012 DN012 DN012 Please look at card ^SHOWCARD_ID. Which degrees of higher education or vocational training do you have?
DN021 DN021 DN021 DN021 Please look at card ^SHOWCARD_ID. What is the highest school certificate or degree that your ex-/ late husband/ wife has obtained?
DN023 DN023 DN023 DN023 Please look at card ^SHOWCARD_ID. Which degrees of higher education or vocational training does your ex-/ late husband/wife have?
DN051_1 DN051_1 Please look at card ^SHOWCARD_ID. What is the highest school certificate or degree that your mother has obtained?
35
Wave: 1 Waves: 2, 4 Wave: 5 Wave: 6 Question text
DN051_2 DN051_2 Please look at card ^SHOWCARD_ID. What is the highest school certificate or degree that your father has obtained?
DN053_1 DN053_1 Please look at card ^SHOWCARD_ID. Which degrees of higher education or vocational training does your mother have?
DN053_2 DN053_2 Please look at card ^SHOWCARD_ID. Which degrees of higher education or vocational training does your mother have?
CH017 CH017 CH017 CH017 Please look at card ^SHOWCARD_ID. What is the highest school leaving certificate or school degree _____ has obtained?
CH018 CH018 CH018 CH018 Please look at card ^SHOWCARD_ID. Which degrees of higher education or vocational training does _____ have?
CH510 What is the highest school leaving certificate or school degree that _____ has obtained?
CH513 Which degrees of higher education or vocational training has _____ obtained?
IV015 Interviewer – What is the highest school certificate or degree that you have obtained?
IV016 Interviewer – Which degrees of higher education or vocational training do you have?
DN041 DN041 DN041 How many years have you been in full time education?
EX102 EX102 How many years has your husband/ wife /partner been in full time education?
References
UNESCO (2006). International Standard Classification of Education: ISCED 1997. Retrieved
from http://www.uis.unesco.org/Library/Documents/isced97-en.pdf
UNESCO (2012). International Standard Classification of Education: ISCED 2011. Retrieved
from http://uis.unesco.org/sites/default/files/documents/international-standard-
classification-of-education-isced-2011-en.pdf
36
VI. Other
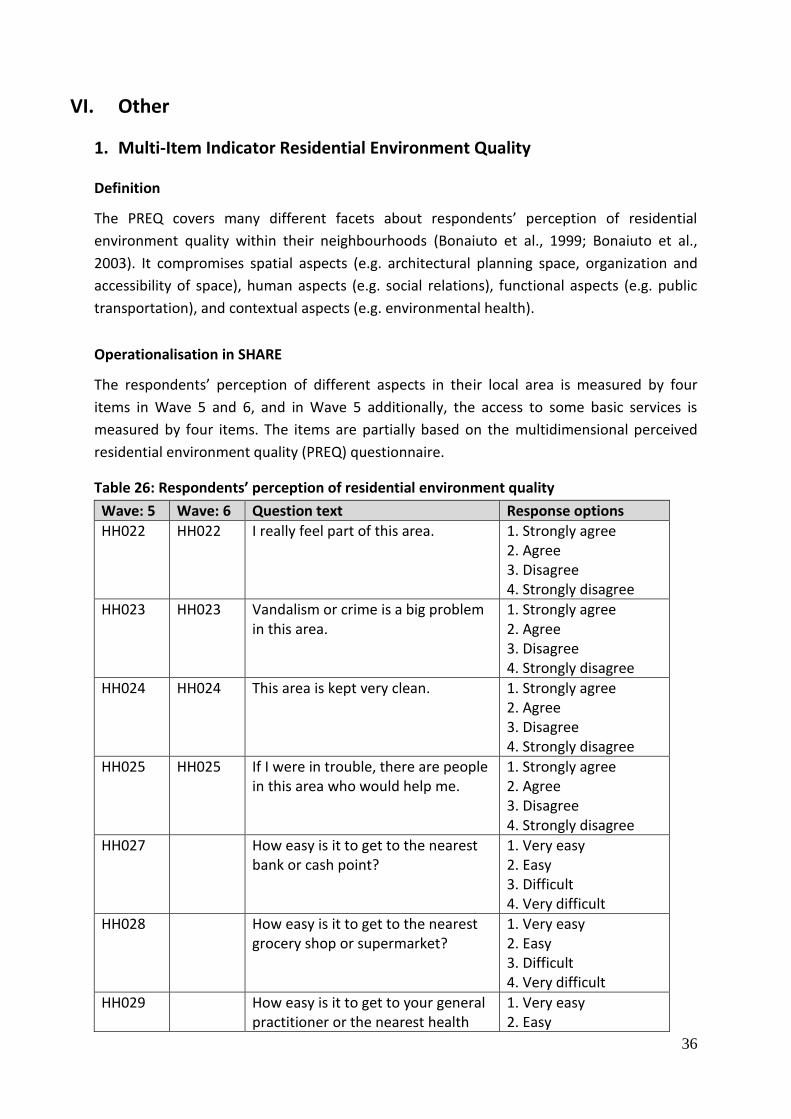
1. Multi-Item Indicator Residential Environment Quality
Definition
The PREQ covers many different facets about respondents’ perception of residential
environment quality within their neighbourhoods (Bonaiuto et al., 1999; Bonaiuto et al.,
2003). It compromises spatial aspects (e.g. architectural planning space, organization and
accessibility of space), human aspects (e.g. social relations), functional aspects (e.g. public
transportation), and contextual aspects (e.g. environmental health).
Operationalisation in SHARE
The respondents’ perception of different aspects in their local area is measured by four
items in Wave 5 and 6, and in Wave 5 additionally, the access to some basic services is
measured by four items. The items are partially based on the multidimensional perceived
residential environment quality (PREQ) questionnaire.
Table 26: Respondents’ perception of residential environment quality
Wave: 5 Wave: 6 Question text Response options
HH022 HH022 I really feel part of this area. 1. Strongly agree 2. Agree 3. Disagree 4. Strongly disagree
HH023 HH023 Vandalism or crime is a big problem in this area.
1. Strongly agree 2. Agree 3. Disagree 4. Strongly disagree
HH024 HH024 This area is kept very clean. 1. Strongly agree 2. Agree 3. Disagree 4. Strongly disagree
HH025 HH025 If I were in trouble, there are people in this area who would help me.
1. Strongly agree 2. Agree 3. Disagree 4. Strongly disagree
HH027 How easy is it to get to the nearest bank or cash point?
1. Very easy 2. Easy 3. Difficult 4. Very difficult
HH028 How easy is it to get to the nearest grocery shop or supermarket?
1. Very easy 2. Easy 3. Difficult 4. Very difficult
HH029 How easy is it to get to your general practitioner or the nearest health
1. Very easy 2. Easy
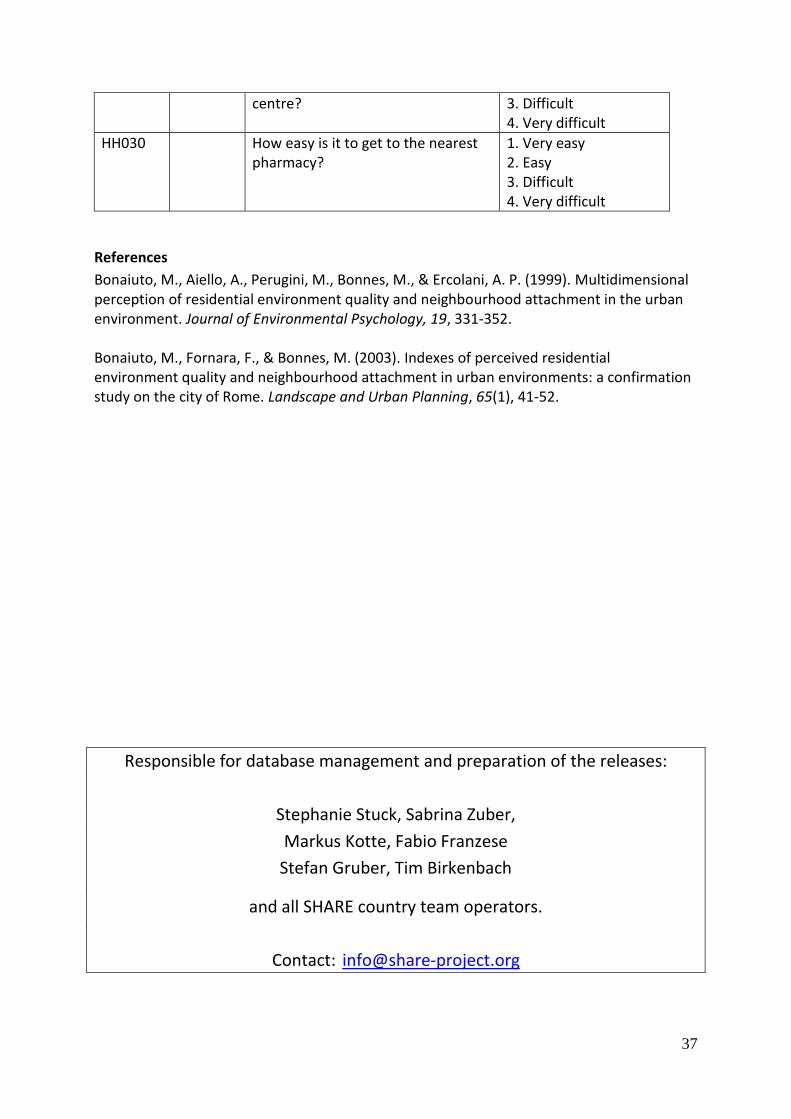
37
centre? 3. Difficult 4. Very difficult
HH030 How easy is it to get to the nearest pharmacy?
1. Very easy 2. Easy 3. Difficult 4. Very difficult
References
Bonaiuto, M., Aiello, A., Perugini, M., Bonnes, M., & Ercolani, A. P. (1999). Multidimensional perception of residential environment quality and neighbourhood attachment in the urban environment. Journal of Environmental Psychology, 19, 331-352. Bonaiuto, M., Fornara, F., & Bonnes, M. (2003). Indexes of perceived residential environment quality and neighbourhood attachment in urban environments: a confirmation study on the city of Rome. Landscape and Urban Planning, 65(1), 41-52.
Responsible for database management and preparation of the releases:
Stephanie Stuck, Sabrina Zuber,
Markus Kotte, Fabio Franzese
Stefan Gruber, Tim Birkenbach
and all SHARE country team operators.
Contact: [email protected]