Embed Size (px)
Citation preview
Mission & VisionI. Demographic Information
II. School Safety & Climate for LearningIII. Academic DataIV. School Completion (secondary schools only)V. Class Size
VI. Teacher & Staff InformationVII. Curriculum & Instruction
VIII. Post-Secondary Preparation (secondary schools only)IX. Fiscal & Expenditure Data
439
Balboa High School
The following information is mandated by the California State Department of Education and is new or revised for the 2002/2003 SARC. For a full discussion andexplanation of the SARC and its requirements, please visit the State’s web site, especially www.cde.ca.gov/ope/sarc/
SFUSD #
1000 Cayuga Avenue, San Francisco, CA 94112
415-469-4090 415-469-0859Phone: FAX:
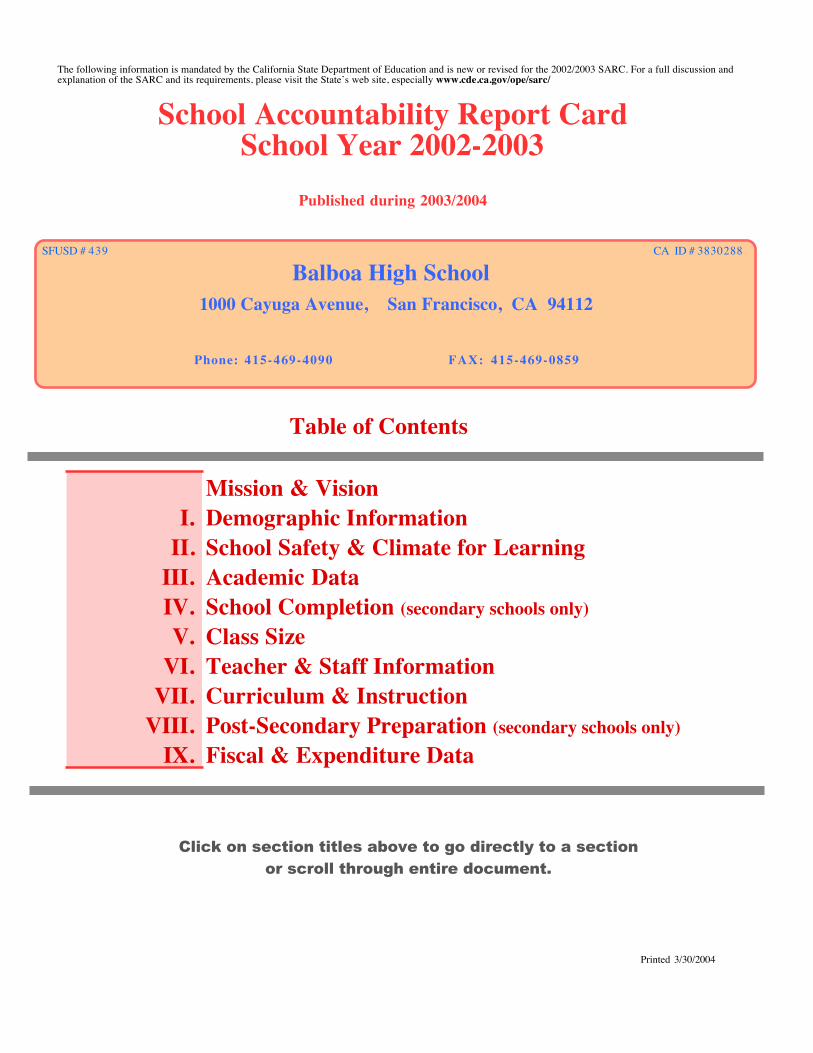
Table of Contents
3830288CA ID #
Click on section titles above to go directly to a section
or scroll through entire document.
School Accountability Report CardSchool Year 2002-2003
Published during 2003/2004
HSSCHTYPE
Printed 3/30/2004
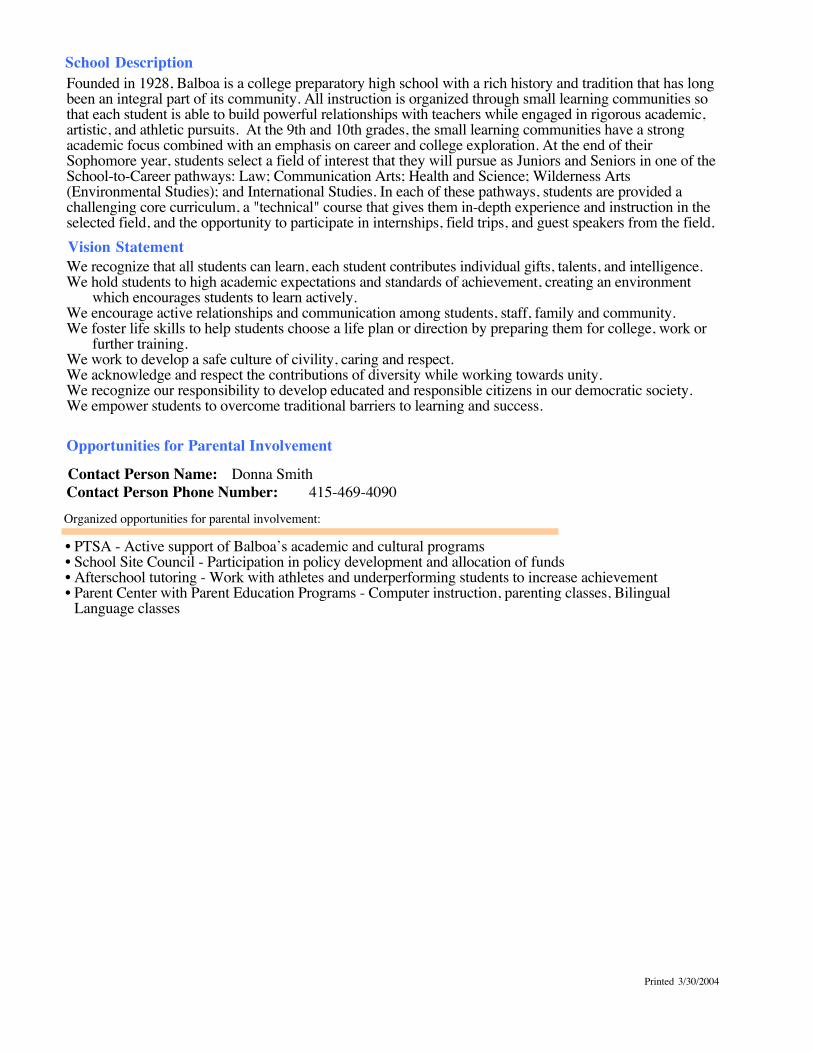
We recognize that all students can learn, each student contributes individual gifts, talents, and intelligence.We hold students to high academic expectations and standards of achievement, creating an environment
which encourages students to learn actively.We encourage active relationships and communication among students, staff, family and community.We foster life skills to help students choose a life plan or direction by preparing them for college, work or
further training.We work to develop a safe culture of civility, caring and respect.We acknowledge and respect the contributions of diversity while working towards unity.We recognize our responsibility to develop educated and responsible citizens in our democratic society.We empower students to overcome traditional barriers to learning and success.
Opportunities for Parental Involvement
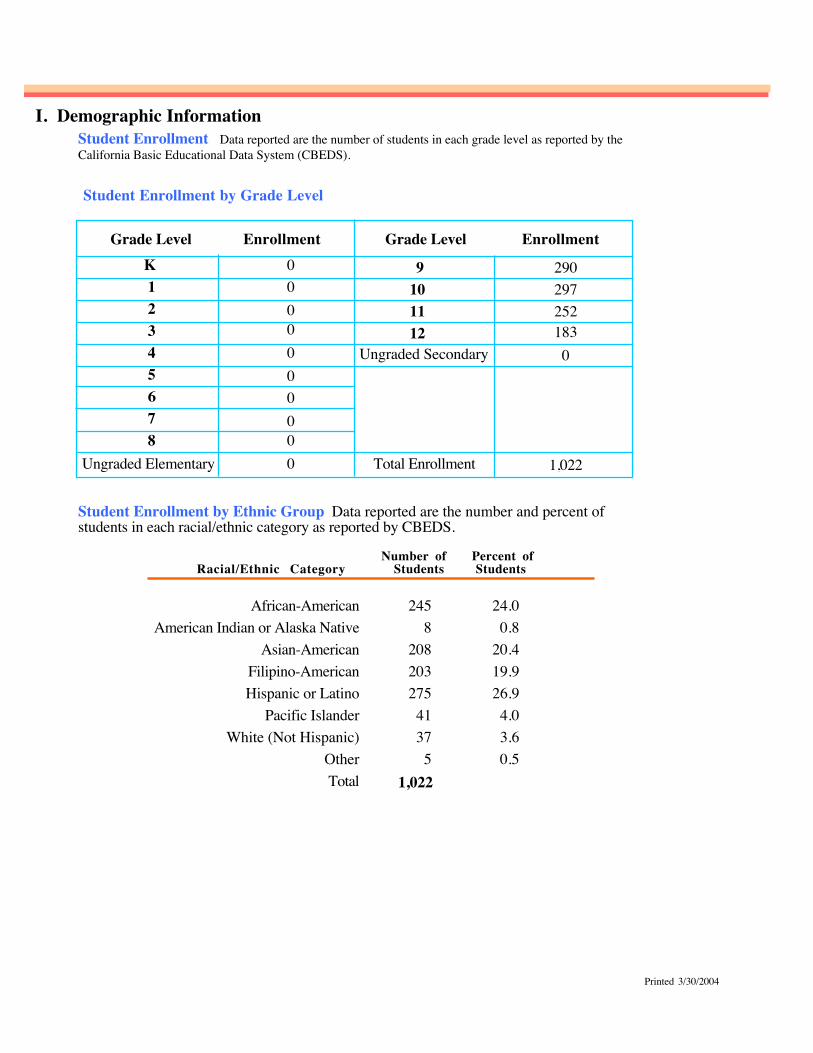
I. Demographic Information
Vision Statement
Organized opportunities for parental involvement:
Contact Person Name:Contact Person Phone Number:
Student Enrollment Data reported are the number of students in each grade level as reported by theCalifornia Basic Educational Data System (CBEDS).
Number of Percent of Students StudentsRacial/Ethnic Category
African-American American Indian or Alaska Native
Asian-American Filipino-American Hispanic or Latino
Pacific Islander White (Not Hispanic)
Other
2458
203275
4137
208
5
439
Balboa High School
The following information is mandated by the California State Department of Education and is new or revised for the 2001/2002 SARC. For a full discussion andexplanation of the SARC and its requirements, please visit the State’s web site, especially www.cde.ca.gov/ope/sarc/
SFUSD #
1000 Cayuga Avenue, San Francisco, CA 94112
415-469-4090
School web site can be accessedthrough the SFUSD home page.
email:
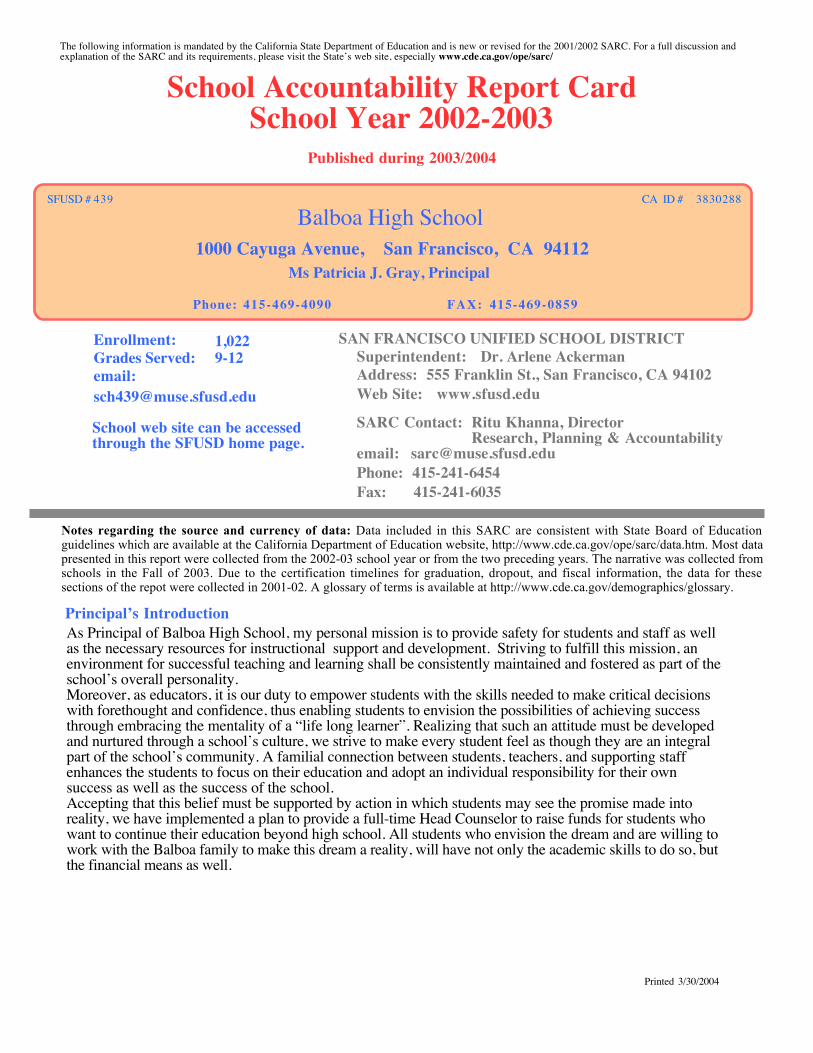
Enrollment:Grades Served:
SAN FRANCISCO UNIFIED SCHOOL DISTRICTSuperintendent:Address:
Phone:Fax:
Web Site:
SARC Contact:
9-12 Dr. Arlene Ackerman555 Franklin St., San Francisco, CA 94102
415-241-6454415-241-6035
Ritu Khanna, DirectorResearch, Planning & Accountability
www.sfusd.edu
415-469-0859Phone: FAX:
1,022
3830288CA ID #
Founded in 1928, Balboa is a college preparatory high school with a rich history and tradition that has longbeen an integral part of its community. All instruction is organized through small learning communities sothat each student is able to build powerful relationships with teachers while engaged in rigorous academic,artistic, and athletic pursuits. At the 9th and 10th grades, the small learning communities have a strongacademic focus combined with an emphasis on career and college exploration. At the end of theirSophomore year, students select a field of interest that they will pursue as Juniors and Seniors in one of theSchool-to-Career pathways: Law; Communication Arts; Health and Science; Wilderness Arts(Environmental Studies); and International Studies. In each of these pathways, students are provided achallenging core curriculum, a "technical" course that gives them in-depth experience and instruction in theselected field, and the opportunity to participate in internships, field trips, and guest speakers from the field.
Donna Smith415-469-4090
• PTSA - Active support of Balboa’s academic and cultural programs• School Site Council - Participation in policy development and allocation of funds• Afterschool tutoring - Work with athletes and underperforming students to increase achievement• Parent Center with Parent Education Programs - Computer instruction, parenting classes, Bilingual
Language classes
Student Enrollment by Ethnic Group Data reported are the number and percent ofstudents in each racial/ethnic category as reported by CBEDS.
Student Enrollment by Grade Level
EnrollmentGrade Level EnrollmentGrade Level
2345678
K1
Ungraded Elementary
Ungraded Secondary
Total Enrollment
101112
900000
290297252183
000000 1,022
24.00.8
19.926.9
4.03.6
20.4
0.51,022
School Accountability Report CardSchool Year 2002-2003
Published during 2003/2004
School Description
Ms Patricia J. Gray, Principal
Total
Notes regarding the source and currency of data: Data included in this SARC are consistent with State Board of Educationguidelines which are available at the California Department of Education website, http://www.cde.ca.gov/ope/sarc/data.htm. Most datapresented in this report were collected from the 2002-03 school year or from the two preceding years. The narrative was collected fromschools in the Fall of 2003. Due to the certification timelines for graduation, dropout, and fiscal information, the data for thesesections of the repot were collected in 2001-02. A glossary of terms is available at http://www.cde.ca.gov/demographics/glossary.
As Principal of Balboa High School, my personal mission is to provide safety for students and staff as wellas the necessary resources for instructional support and development. Striving to fulfill this mission, anenvironment for successful teaching and learning shall be consistently maintained and fostered as part of theschool’s overall personality.Moreover, as educators, it is our duty to empower students with the skills needed to make critical decisionswith forethought and confidence, thus enabling students to envision the possibilities of achieving successthrough embracing the mentality of a “life long learner”. Realizing that such an attitude must be developedand nurtured through a school’s culture, we strive to make every student feel as though they are an integralpart of the school’s community. A familial connection between students, teachers, and supporting staffenhances the students to focus on their education and adopt an individual responsibility for their ownsuccess as well as the success of the school.Accepting that this belief must be supported by action in which students may see the promise made intoreality, we have implemented a plan to provide a full-time Head Counselor to raise funds for students whowant to continue their education beyond high school. All students who envision the dream and are willing towork with the Balboa family to make this dream a reality, will have not only the academic skills to do so, butthe financial means as well.
Principal’s Introduction
Printed 3/30/2004
We recognize that all students can learn, each student contributes individual gifts, talents, and intelligence.We hold students to high academic expectations and standards of achievement, creating an environment
which encourages students to learn actively.We encourage active relationships and communication among students, staff, family and community.We foster life skills to help students choose a life plan or direction by preparing them for college, work or
further training.We work to develop a safe culture of civility, caring and respect.We acknowledge and respect the contributions of diversity while working towards unity.We recognize our responsibility to develop educated and responsible citizens in our democratic society.We empower students to overcome traditional barriers to learning and success.
Opportunities for Parental Involvement
I. Demographic Information
Vision Statement
Organized opportunities for parental involvement:
Contact Person Name:Contact Person Phone Number:
Student Enrollment Data reported are the number of students in each grade level as reported by theCalifornia Basic Educational Data System (CBEDS).
Number of Percent of Students StudentsRacial/Ethnic Category
African-American American Indian or Alaska Native
Asian-American Filipino-American Hispanic or Latino
Pacific Islander White (Not Hispanic)
Other
2458
203275
4137
208
5
439
Balboa High School
The following information is mandated by the California State Department of Education and is new or revised for the 2001/2002 SARC. For a full discussion andexplanation of the SARC and its requirements, please visit the State’s web site, especially www.cde.ca.gov/ope/sarc/
SFUSD #
1000 Cayuga Avenue, San Francisco, CA 94112
415-469-4090
School web site can be accessedthrough the SFUSD home page.
email:
Enrollment:Grades Served:
SAN FRANCISCO UNIFIED SCHOOL DISTRICTSuperintendent:Address:
Phone:Fax:
Web Site:
SARC Contact:
9-12 Dr. Arlene Ackerman555 Franklin St., San Francisco, CA 94102
415-241-6454415-241-6035
Ritu Khanna, DirectorResearch, Planning & Accountability
www.sfusd.edu
415-469-0859Phone: FAX:
1,022
3830288CA ID #
Founded in 1928, Balboa is a college preparatory high school with a rich history and tradition that has longbeen an integral part of its community. All instruction is organized through small learning communities sothat each student is able to build powerful relationships with teachers while engaged in rigorous academic,artistic, and athletic pursuits. At the 9th and 10th grades, the small learning communities have a strongacademic focus combined with an emphasis on career and college exploration. At the end of theirSophomore year, students select a field of interest that they will pursue as Juniors and Seniors in one of theSchool-to-Career pathways: Law; Communication Arts; Health and Science; Wilderness Arts(Environmental Studies); and International Studies. In each of these pathways, students are provided achallenging core curriculum, a "technical" course that gives them in-depth experience and instruction in theselected field, and the opportunity to participate in internships, field trips, and guest speakers from the field.
Donna Smith415-469-4090
• PTSA - Active support of Balboa’s academic and cultural programs• School Site Council - Participation in policy development and allocation of funds• Afterschool tutoring - Work with athletes and underperforming students to increase achievement• Parent Center with Parent Education Programs - Computer instruction, parenting classes, Bilingual
Language classes
Student Enrollment by Ethnic Group Data reported are the number and percent ofstudents in each racial/ethnic category as reported by CBEDS.
Student Enrollment by Grade Level
EnrollmentGrade Level EnrollmentGrade Level
2345678
K1
Ungraded Elementary
Ungraded Secondary
Total Enrollment
101112
900000
290297252183
000000 1,022
24.00.8
19.926.9
4.03.6
20.4
0.51,022
School Accountability Report CardSchool Year 2002-2003
Published during 2003/2004
School Description
Ms Patricia J. Gray, Principal
Total
Notes regarding the source and currency of data: Data included in this SARC are consistent with State Board of Educationguidelines which are available at the California Department of Education website, http://www.cde.ca.gov/ope/sarc/data.htm. Most datapresented in this report were collected from the 2002-03 school year or from the two preceding years. The narrative was collected fromschools in the Fall of 2003. Due to the certification timelines for graduation, dropout, and fiscal information, the data for thesesections of the repot were collected in 2001-02. A glossary of terms is available at http://www.cde.ca.gov/demographics/glossary.
As Principal of Balboa High School, my personal mission is to provide safety for students and staff as wellas the necessary resources for instructional support and development. Striving to fulfill this mission, anenvironment for successful teaching and learning shall be consistently maintained and fostered as part of theschool’s overall personality.Moreover, as educators, it is our duty to empower students with the skills needed to make critical decisionswith forethought and confidence, thus enabling students to envision the possibilities of achieving successthrough embracing the mentality of a “life long learner”. Realizing that such an attitude must be developedand nurtured through a school’s culture, we strive to make every student feel as though they are an integralpart of the school’s community. A familial connection between students, teachers, and supporting staffenhances the students to focus on their education and adopt an individual responsibility for their ownsuccess as well as the success of the school.Accepting that this belief must be supported by action in which students may see the promise made intoreality, we have implemented a plan to provide a full-time Head Counselor to raise funds for students whowant to continue their education beyond high school. All students who envision the dream and are willing towork with the Balboa family to make this dream a reality, will have not only the academic skills to do so, butthe financial means as well.
Principal’s Introduction
Printed 3/30/2004
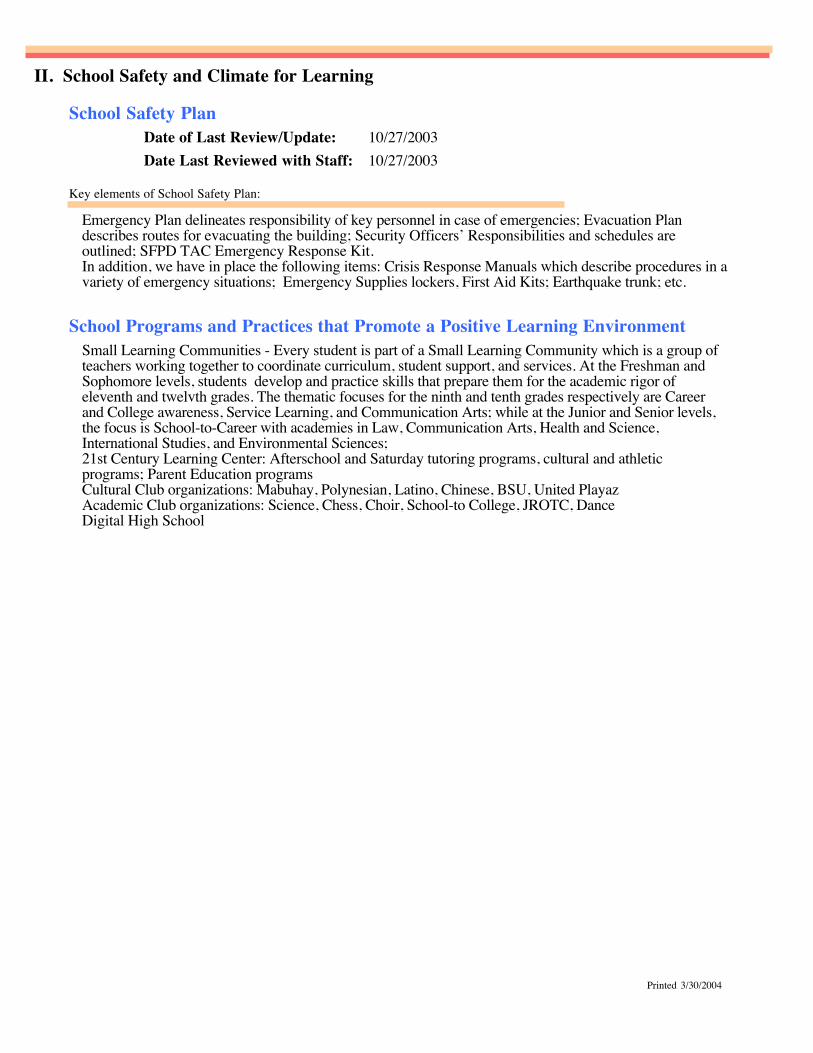
Key elements of School Safety Plan:
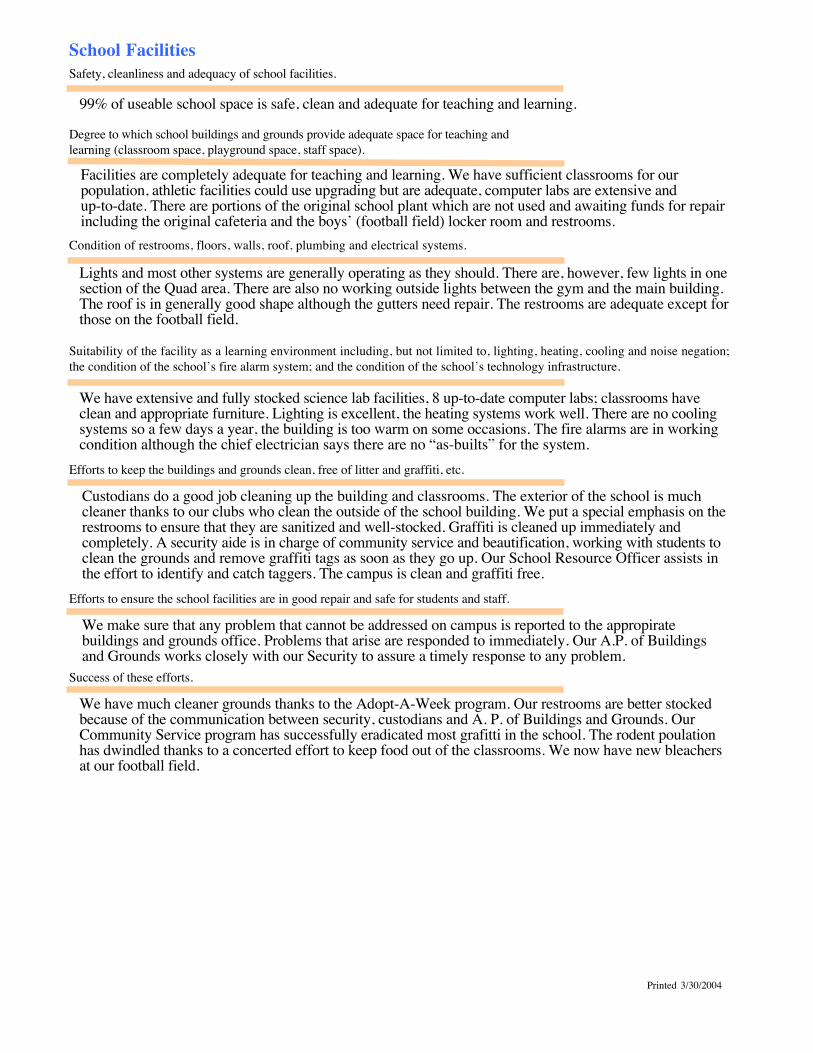
School FacilitiesSafety, cleanliness and adequacy of school facilities.
Degree to which school buildings and grounds provide adequate space for teaching andlearning (classroom space, playground space, staff space).
Condition of restrooms, floors, walls, roof, plumbing and electrical systems.
Suitability of the facility as a learning environment including, but not limited to, lighting, heating, cooling and noise negation;the condition of the school’s fire alarm system; and the condition of the school’s technology infrastructure.
Efforts to keep the buildings and grounds clean, free of litter and graffiti, etc.
Efforts to ensure the school facilities are in good repair and safe for students and staff.
Success of these efforts.
School Programs and Practices that Promote a Positive Learning Environment
School Safety PlanDate of Last Review/Update:Date Last Reviewed with Staff:
II. School Safety and Climate for Learning
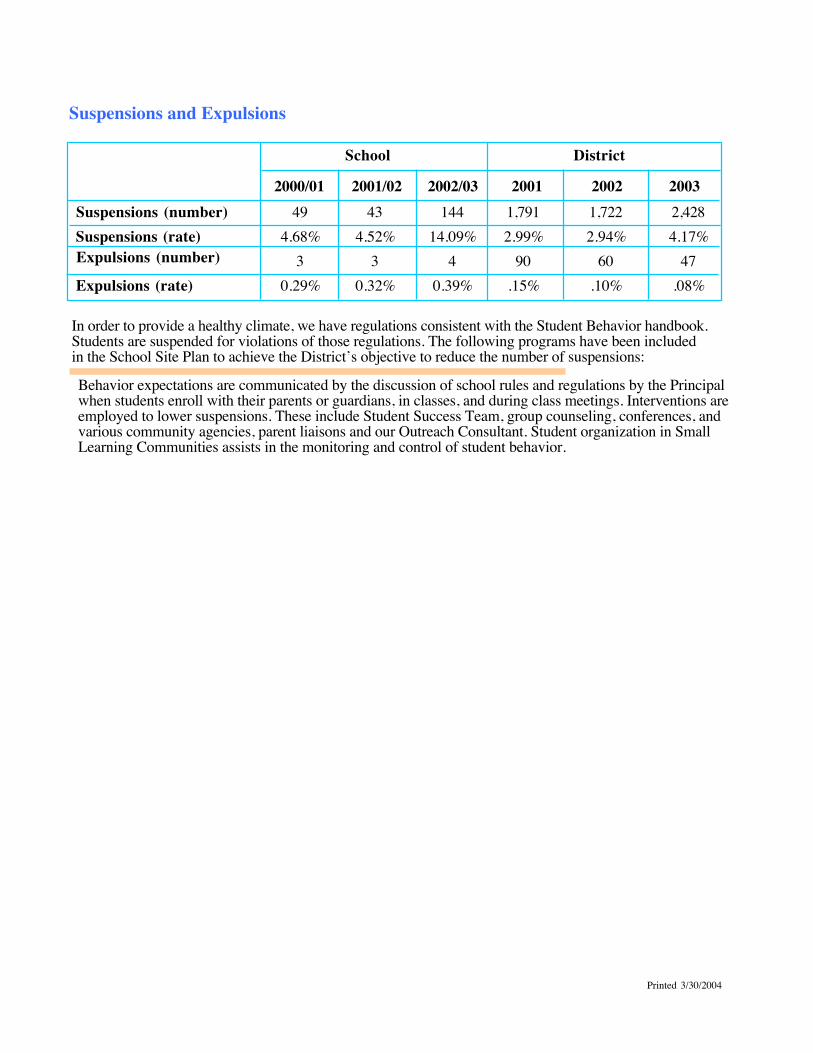
Suspensions and Expulsions
439
Suspensions (number) Suspensions (rate) Expulsions (number)
Expulsions (rate)
School District
2001/02 2002/03 2003200243
34.52%
0.32%
Emergency Plan delineates responsibility of key personnel in case of emergencies; Evacuation Plandescribes routes for evacuating the building; Security Officers’ Responsibilities and schedules areoutlined; SFPD TAC Emergency Response Kit.In addition, we have in place the following items: Crisis Response Manuals which describe procedures in avariety of emergency situations; Emergency Supplies lockers, First Aid Kits; Earthquake trunk; etc.
10/27/200310/27/2003
Small Learning Communities - Every student is part of a Small Learning Community which is a group ofteachers working together to coordinate curriculum, student support, and services. At the Freshman andSophomore levels, students develop and practice skills that prepare them for the academic rigor ofeleventh and twelvth grades. The thematic focuses for the ninth and tenth grades respectively are Careerand College awareness, Service Learning, and Communication Arts; while at the Junior and Senior levels,the focus is School-to-Career with academies in Law, Communication Arts, Health and Science,International Studies, and Environmental Sciences;21st Century Learning Center: Afterschool and Saturday tutoring programs, cultural and athleticprograms; Parent Education programsCultural Club organizations: Mabuhay, Polynesian, Latino, Chinese, BSU, United PlayazAcademic Club organizations: Science, Chess, Choir, School-to College, JROTC, DanceDigital High School
2000/01 2001
99% of useable school space is safe, clean and adequate for teaching and learning.
Facilities are completely adequate for teaching and learning. We have sufficient classrooms for ourpopulation, athletic facilities could use upgrading but are adequate, computer labs are extensive andup-to-date. There are portions of the original school plant which are not used and awaiting funds for repairincluding the original cafeteria and the boys’ (football field) locker room and restrooms.
Lights and most other systems are generally operating as they should. There are, however, few lights in onesection of the Quad area. There are also no working outside lights between the gym and the main building.The roof is in generally good shape although the gutters need repair. The restrooms are adequate except forthose on the football field.
We have extensive and fully stocked science lab facilities, 8 up-to-date computer labs; classrooms haveclean and appropriate furniture. Lighting is excellent, the heating systems work well. There are no coolingsystems so a few days a year, the building is too warm on some occasions. The fire alarms are in workingcondition although the chief electrician says there are no “as-builts” for the system.
Custodians do a good job cleaning up the building and classrooms. The exterior of the school is muchcleaner thanks to our clubs who clean the outside of the school building. We put a special emphasis on therestrooms to ensure that they are sanitized and well-stocked. Graffiti is cleaned up immediately andcompletely. A security aide is in charge of community service and beautification, working with students toclean the grounds and remove graffiti tags as soon as they go up. Our School Resource Officer assists inthe effort to identify and catch taggers. The campus is clean and graffiti free.
We make sure that any problem that cannot be addressed on campus is reported to the appropiratebuildings and grounds office. Problems that arise are responded to immediately. Our A.P. of Buildingsand Grounds works closely with our Security to assure a timely response to any problem.
We have much cleaner grounds thanks to the Adopt-A-Week program. Our restrooms are better stockedbecause of the communication between security, custodians and A. P. of Buildings and Grounds. OurCommunity Service program has successfully eradicated most grafitti in the school. The rodent poulationhas dwindled thanks to a concerted effort to keep food out of the classrooms. We now have new bleachersat our football field.
Behavior expectations are communicated by the discussion of school rules and regulations by the Principalwhen students enroll with their parents or guardians, in classes, and during class meetings. Interventions areemployed to lower suspensions. These include Student Success Team, group counseling, conferences, andvarious community agencies, parent liaisons and our Outreach Consultant. Student organization in SmallLearning Communities assists in the monitoring and control of student behavior.
49
34.68%
0.29%
144
414.09%
0.39%
In order to provide a healthy climate, we have regulations consistent with the Student Behavior handbook.Students are suspended for violations of those regulations. The following programs have been includedin the School Site Plan to achieve the District’s objective to reduce the number of suspensions:
1,791
.15%
2.99%90
1,722
.10%
2.94%60
2,428
.08%
4.17%47
Balboa HS
2/11/2004Printed 3/30/2004
Key elements of School Safety Plan:
School FacilitiesSafety, cleanliness and adequacy of school facilities.
Degree to which school buildings and grounds provide adequate space for teaching andlearning (classroom space, playground space, staff space).
Condition of restrooms, floors, walls, roof, plumbing and electrical systems.
Suitability of the facility as a learning environment including, but not limited to, lighting, heating, cooling and noise negation;the condition of the school’s fire alarm system; and the condition of the school’s technology infrastructure.
Efforts to keep the buildings and grounds clean, free of litter and graffiti, etc.
Efforts to ensure the school facilities are in good repair and safe for students and staff.
Success of these efforts.
School Programs and Practices that Promote a Positive Learning Environment
School Safety PlanDate of Last Review/Update:Date Last Reviewed with Staff:
II. School Safety and Climate for Learning
Suspensions and Expulsions
439
Suspensions (number) Suspensions (rate) Expulsions (number)
Expulsions (rate)
School District
2001/02 2002/03 2003200243
34.52%
0.32%
Emergency Plan delineates responsibility of key personnel in case of emergencies; Evacuation Plandescribes routes for evacuating the building; Security Officers’ Responsibilities and schedules areoutlined; SFPD TAC Emergency Response Kit.In addition, we have in place the following items: Crisis Response Manuals which describe procedures in avariety of emergency situations; Emergency Supplies lockers, First Aid Kits; Earthquake trunk; etc.
10/27/200310/27/2003
Small Learning Communities - Every student is part of a Small Learning Community which is a group ofteachers working together to coordinate curriculum, student support, and services. At the Freshman andSophomore levels, students develop and practice skills that prepare them for the academic rigor ofeleventh and twelvth grades. The thematic focuses for the ninth and tenth grades respectively are Careerand College awareness, Service Learning, and Communication Arts; while at the Junior and Senior levels,the focus is School-to-Career with academies in Law, Communication Arts, Health and Science,International Studies, and Environmental Sciences;21st Century Learning Center: Afterschool and Saturday tutoring programs, cultural and athleticprograms; Parent Education programsCultural Club organizations: Mabuhay, Polynesian, Latino, Chinese, BSU, United PlayazAcademic Club organizations: Science, Chess, Choir, School-to College, JROTC, DanceDigital High School
2000/01 2001
99% of useable school space is safe, clean and adequate for teaching and learning.
Facilities are completely adequate for teaching and learning. We have sufficient classrooms for ourpopulation, athletic facilities could use upgrading but are adequate, computer labs are extensive andup-to-date. There are portions of the original school plant which are not used and awaiting funds for repairincluding the original cafeteria and the boys’ (football field) locker room and restrooms.
Lights and most other systems are generally operating as they should. There are, however, few lights in onesection of the Quad area. There are also no working outside lights between the gym and the main building.The roof is in generally good shape although the gutters need repair. The restrooms are adequate except forthose on the football field.
We have extensive and fully stocked science lab facilities, 8 up-to-date computer labs; classrooms haveclean and appropriate furniture. Lighting is excellent, the heating systems work well. There are no coolingsystems so a few days a year, the building is too warm on some occasions. The fire alarms are in workingcondition although the chief electrician says there are no “as-builts” for the system.
Custodians do a good job cleaning up the building and classrooms. The exterior of the school is muchcleaner thanks to our clubs who clean the outside of the school building. We put a special emphasis on therestrooms to ensure that they are sanitized and well-stocked. Graffiti is cleaned up immediately andcompletely. A security aide is in charge of community service and beautification, working with students toclean the grounds and remove graffiti tags as soon as they go up. Our School Resource Officer assists inthe effort to identify and catch taggers. The campus is clean and graffiti free.
We make sure that any problem that cannot be addressed on campus is reported to the appropiratebuildings and grounds office. Problems that arise are responded to immediately. Our A.P. of Buildingsand Grounds works closely with our Security to assure a timely response to any problem.
We have much cleaner grounds thanks to the Adopt-A-Week program. Our restrooms are better stockedbecause of the communication between security, custodians and A. P. of Buildings and Grounds. OurCommunity Service program has successfully eradicated most grafitti in the school. The rodent poulationhas dwindled thanks to a concerted effort to keep food out of the classrooms. We now have new bleachersat our football field.
Behavior expectations are communicated by the discussion of school rules and regulations by the Principalwhen students enroll with their parents or guardians, in classes, and during class meetings. Interventions areemployed to lower suspensions. These include Student Success Team, group counseling, conferences, andvarious community agencies, parent liaisons and our Outreach Consultant. Student organization in SmallLearning Communities assists in the monitoring and control of student behavior.
49
34.68%
0.29%
144
414.09%
0.39%
In order to provide a healthy climate, we have regulations consistent with the Student Behavior handbook.Students are suspended for violations of those regulations. The following programs have been includedin the School Site Plan to achieve the District’s objective to reduce the number of suspensions:
1,791
.15%
2.99%90
1,722
.10%
2.94%60
2,428
.08%
4.17%47
Balboa HS
2/11/2004Printed 3/30/2004
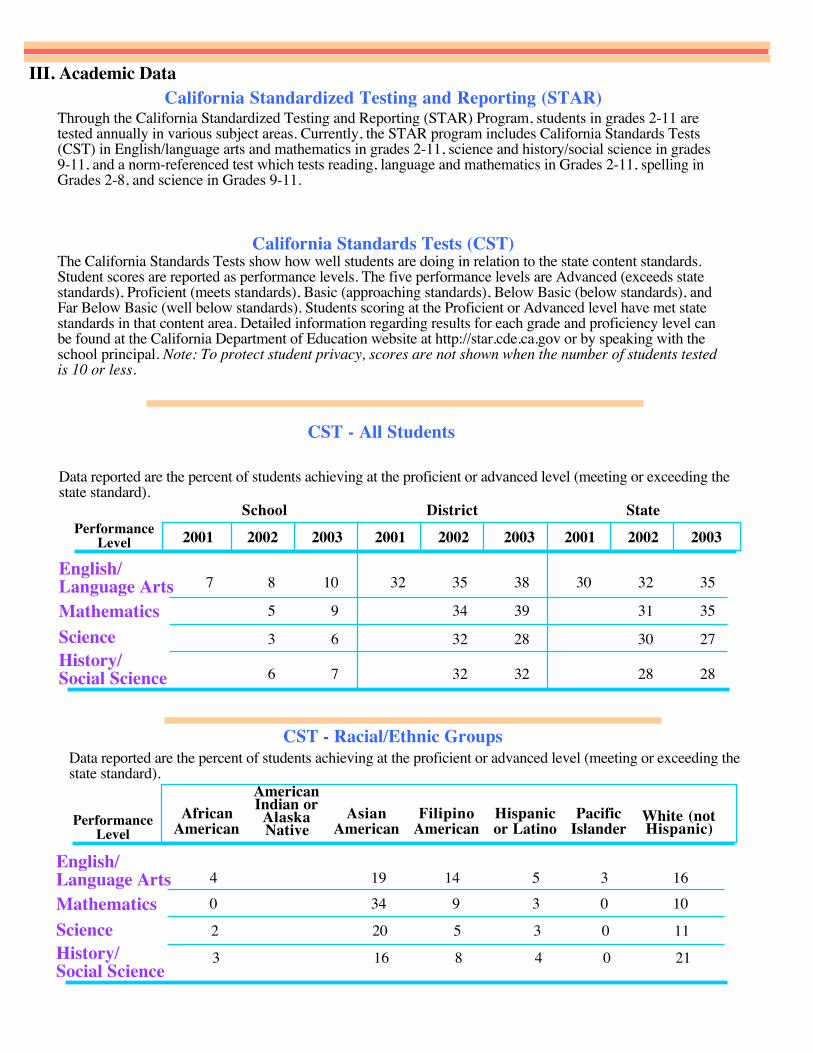
III. Academic DataCalifornia Standardized Testing and Reporting (STAR)
Through the California Standardized Testing and Reporting (STAR) Program, students in grades 2-11 aretested annually in various subject areas. Currently, the STAR program includes California Standards Tests(CST) in English/language arts and mathematics in grades 2-11, science and history/social science in grades9-11, and a norm-referenced test which tests reading, language and mathematics in Grades 2-11, spelling inGrades 2-8, and science in Grades 9-11.
California Standards Tests (CST)The California Standards Tests show how well students are doing in relation to the state content standards.Student scores are reported as performance levels. The five performance levels are Advanced (exceeds statestandards), Proficient (meets standards), Basic (approaching standards), Below Basic (below standards), andFar Below Basic (well below standards). Students scoring at the Proficient or Advanced level have met statestandards in that content area. Detailed information regarding results for each grade and proficiency level canbe found at the California Department of Education website at http://star.cde.ca.gov or by speaking with theschool principal. Note: To protect student privacy, scores are not shown when the number of students testedis 10 or less.
Academic Performance Index (API)The Academic Performance Index (API) is a score on a scale of 200 to 1000 that annually measures the academicperformance and progress of individual schools in California. On an interim basis, the state has set 800 as the APIscore that schools should strive to meet.Growth Targets: The annual growth target for a school is 5% of the distance between its base API and 800. Actualgrowth is the number of API points a school gained bewteen its base and growth years. Schools that reach theirannual targets are eligible for monetary awards. Schools that do not meet their targets and have a statewide APIrank of one to five are eligible to participate in the Immediate Intervention/Underperforming Schools Program(II/USP), which provides resources to schools to improve their academic achievement. There was no moneyallocated to the II/USP Program in 2002 or 2003.Subgroup APIs and Targets: In addition to a schoolwide API, schools also receive API scores for eachnumerically significant subgroup in the school (i.e., racial/ethnic subgroups and socioeconomically disadvantagedsubgroups.) Growth targets, equal to 80% of the school’s target, are also set for each of the subgroups. Eachsubgroup must meet its target in addition to the schoolwide target being met for the school to be identified ashaving met its target.Percentage Tested: In order to be eligible for awards, elementary and middle schools must test at least 95% oftheir students in grades 2-8 and high schools must test at least 90% of their students in grades 9-11 on STAR.Statewide Rank: Schools receiving an API score are ranked in ten categories of equal size (deciles) from one(lowest) to ten (highest), according to type of school (elementary, middle, or high school).Similar Schools Rank: Schools also receive a ranking that compares that school with 100 other schools withsimilar demographic characteristics. Each set of 100 schools is ranked by API score from one (lowest) to ten(highest) to indicate how well the school performed compared to schools most like it.
API criteria are subject to change as new legislation is enacted into law. Detailed information about the API andthe Public Scools Accountability Act (PSAA) can be found at the California Department of Education website athttp://www.cde.ca.gov/psaa/api/ or by speaking with the school principal.
“A” means the school scored at or above the statewide performance target of 800.
API Subgroups - Racial/Ethnic Groups
439
African AmericanBase API ScoreGrowth TargetAmerican Indian or Alaska Native
API Growth DataFr. 2002to 2003
Fr. 2001to 2002
From 2000to 2001
Base API Score
African AmericanGrowth API ScoreActual Growth American Indian or Alaska NativeGrowth API Score
API Base Data200220012000
Growth TargetAsian-AmericanBase API ScoreGrowth TargetFilipino-American
Actual Growth Asian-AmericanGrowth API ScoreActual Growth Filipino-American
Base API ScoreGrowth TargetHispanic or LatinoBase API ScoreGrowth Target
Growth API ScoreActual Growth Hispanic or Latino Growth API ScoreActual Growth
Pacific IslanderBase API ScoreGrowth TargetWhite (Not Hispanic)Base API Score
Pacific IslanderGrowth API ScoreActual Growth White (Not Hispanic)Growth API Score
Growth Target Actual Growth
38214
46114
38714
602
40320
55832
46643
37739
51951
405-4
336-46
4643
40013
38314
52614
42314
588
33814
14
46814
40914
API Subgroups - Socioeconomically Disadvantaged
Base API ScoreGrowth Target
API Growth DataFr. 2002to 2003
Fr. 2001to 2002
From 2000to 2001
Growth API ScoreActual Growth
API Base Data
200220012000
46314
4418
4293
44914
43314
42614
Schoolwide API
Percentage TestedBase API ScoreGrowth TargetStatewide Rank
API Growth DataFrom 2000
to 2001
Similar Schools Rank
Percentage TestedGrowth API ScoreActual Growth
API Base Data200220012000
97496
33
97449
9
89435-10
97463
1711
894401811
6744518
11
Fr. 2001to 2002
Fr. 2002to 2003
Note: # indicates that no growth target was assigned in that year.
Awards and Interventions Programs
California Fitness TestThe percent of students in grades 5, 7, and 9, as appropriate, who scored in the healthy fitness zone on allsix fitness standards on the California Fitness Test. Detailed information regarding the CaliforniaPhysical Fitness Test may be found at the California Department of Education website athtt;:..www.cde.ca.gov/statetests/pe/pe.html. Note: To protect student privacy, asterisks appear in any cellwhenever 10 or fewer students had valid test scores.
57
School DistrictTotal Male Female FemaleMaleTotal
GradeLevel
StateFemaleMaleTotal
27.236.4
31.540.7
23.032.4
23.827.8
25.229.6
22.326.0
9 16.0 16.0 16.0 34.4 35.8 33.2 24.8 23.3 26.2
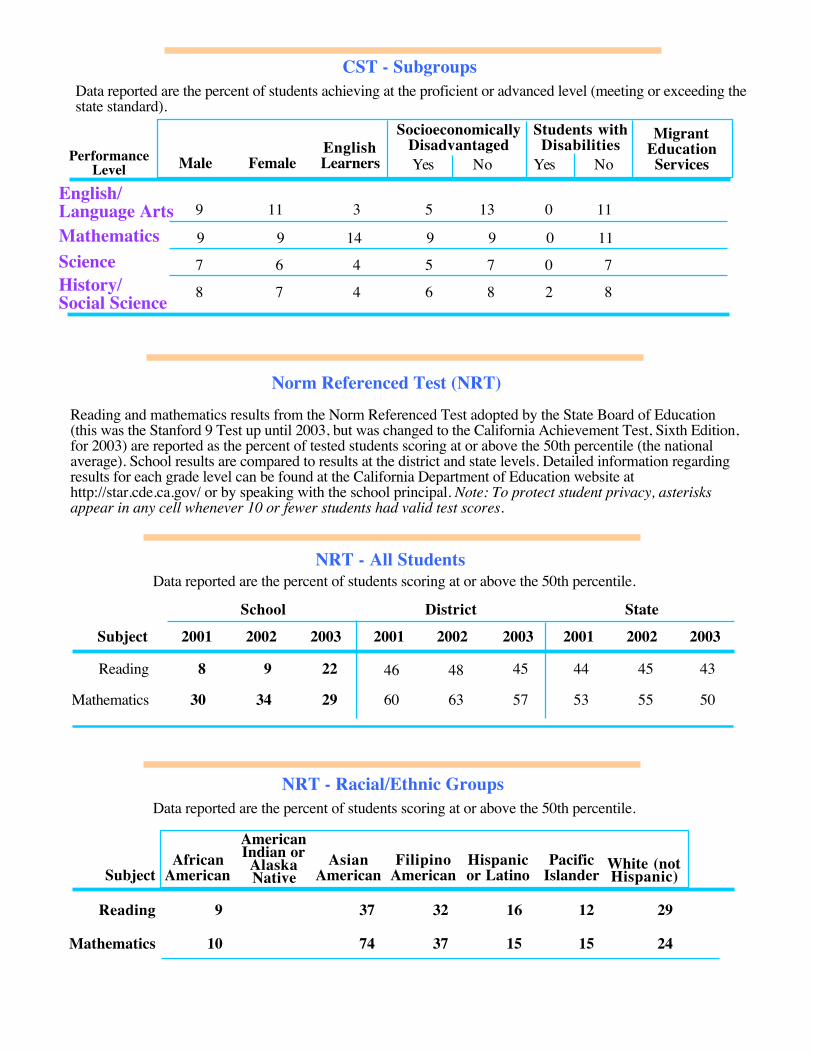
Norm Referenced Test (NRT)Reading and mathematics results from the Norm Referenced Test adopted by the State Board of Education(this was the Stanford 9 Test up until 2003, but was changed to the California Achievement Test, Sixth Edition,for 2003) are reported as the percent of tested students scoring at or above the 50th percentile (the nationalaverage). School results are compared to results at the district and state levels. Detailed information regardingresults for each grade level can be found at the California Department of Education website athttp://star.cde.ca.gov/ or by speaking with the school principal. Note: To protect student privacy, asterisksappear in any cell whenever 10 or fewer students had valid test scores.
Note: # indicates that no growth target was assigned in that year.Local Assessment(Percentage of Students Meeting or Exceeding the District Standard)
2345
Reading Writing
2001 2002 2003
GradeLevel
Mathematics
678
K2001 2002 2003 2001 2002 2003
91011
School District2000 2001 2002
State2000 2001 2002 2000 2001 2002
PerformanceLevel
Advanced
Proficient
Basic
Below Basic
FarBelow Basic
PercentNot Tested
Eligibility for statewide award or intervention programs is based on API growth data from the previousacademic year.
2000 2001 2002
African American(not of Hispanic origin)
All Students
SocioeconomicallyDisadvantagedStudents with
Disabilities
Met Target (Y/N)
White(not of Hispanic origin)
School LEA
Met Target (Y/N)
School LEAAYP Reporting
CategoryAYP Reporting
Category
Disaggregated by Subgroup:
English LanguageLearners
Disaggregated by Race/Ethnicity:
American Indian orAlaska Native
Asian
Filipino
Hispanic or Latino
Pacific Islander
PerformanceLevel
Advanced
School District2001 2002 2003
State2001 2002 2003 2001 2002 2003
Advanced
Data reported are the percent of students achieving at the proficient or advanced level (meeting or exceeding thestate standard).
CST - All Students
PerformanceLevel
School District2001 2002 2003
State2001 2002 2003 2001 2002 2003
English/Language Arts 7 8 10 32 35 38 30 32 35
Mathematics 5 9 34 39 31 35
Science 3 6 32 28 30 27History/Social Science 6 7 32 32 28 28
Proficient or Advanced
Not Tested
School District2001 2002 2003
State2001 2002 2003 2001 2002 2003
8 9 46 48
30 34
44 45
53 55
43
50
45
57
22
29 60 63
Federal Programs
Recognition forAchievement (Title I)Identified for ProgramImprovement (Title 1)
NoNoNo
20022001 2003
Exited Title 1Program Improvement
NoNoNo
NoNoNo
Years Identified forProgram Improvement:
Eligible for Governor’sperformance award
Eligible for II/USP
California Programs
20022001 2003
Applied for II/USPFundingReceived II/USPFunding
YesNoNo
School Programs
Percent of Schools Identifiedfor Program Improvement
Number of Schools Identifiedfor Program Improvement 14011
12.30.09.5
District: Federal Programs20022001 2003
***** *No
***** *No
******No
NRT - All Students
Reading
Mathematics
School District2001 2002 2003
State2001 2002 2003 2001 2002 2003
8 9 46 48
30 34
44 45
53 55
43
50
45
57
22
29 60 63
Subject
Data reported are the percent of students scoring at or above the 50th percentile.
NRT - Racial/Ethnic Groups
SubjectAfrican
American
AmericanIndian orAlaskaNative
AsianAmerican
FilipinoAmerican
Hispanicor Latino
PacificIslander
White (notHispanic)
Reading
Mathematics 10 74 37 15 15 24
9 37 32 16 12 29
Data reported are the percent of students scoring at or above the 50th percentile.
NRT - Subgroups
19 26 11 17 25 2 25
29 29 35 30 28 2 33
Male FemaleEnglishLearners
SocioeconomicallyDisadvantaged
Students withDisabilities
MigrantEducation
ServicesYesYes No NoSubject
Reading
Mathematics
Data reported are the percent of students scoring at or above the 50th percentile.
The federal No Child Left Behind Act requires that all students perform at or above the proficient level onthe State’s standards based assessment by 2014. In order to achieve this goal and meet annual performanceobjectives, districts and schools must improve each year according to set requirements. Data reported showwhether all groups of students in the school made Adequate Yearly Progress. Detailed information aboutAYP can be found at the California Department of Education website at http://www.cde.ca.gov/ayp/ or byspeaking to the school principal.
Adequate Yearly Progress (AYP)
African American(not of Hispanic origin)
All Students
SocioeconomicallyDisadvantaged
Students withDisabilities
White(not of Hispanic origin)
English LanguageLearners
American Indian orAlaska Native
Asian
Filipino
Hispanic or Latino
Pacific Islander
School District2001 2002 2003 2001 2002 2003Groups
YES
NO
YES
YES
YES
YES
YES
YES
YES
YES
NO
NO
NO
N/A
N/A
N/A
NO
N/A
N/A
NO
NO
N/A
3/30/2004Printed:
***The II/USP Program was not funded for the years 2002 or 2003.
Balboa HS
CST - Racial/Ethnic Groups
PerformanceLevel
4 19 14 5 3 160 34 9 3 0 10
2 20 5 3 0 11
3 16 8 4 0 21
AfricanAmerican
AmericanIndian or
AlaskaNative
AsianAmerican
FilipinoAmerican
Hispanicor Latino
PacificIslander
White (notHispanic)
Data reported are the percent of students achieving at the proficient or advanced level (meeting or exceeding thestate standard).
English/Language ArtsMathematicsScienceHistory/Social Science
CST - Subgroups
PerformanceLevel
9 11 3 5 13 0 11
9 9 14 9 9 0 11
7 6 4 5 7 0 7
8 7 4 6 8 2 8
Male FemaleEnglishLearners
SocioeconomicallyDisadvantaged
Students withDisabilities
MigrantEducation
ServicesYesYes No No
Data reported are the percent of students achieving at the proficient or advanced level (meeting or exceeding thestate standard).
English/Language ArtsMathematicsScienceHistory/Social Science
Balboa HS
III. Academic DataCalifornia Standardized Testing and Reporting (STAR)
Through the California Standardized Testing and Reporting (STAR) Program, students in grades 2-11 aretested annually in various subject areas. Currently, the STAR program includes California Standards Tests(CST) in English/language arts and mathematics in grades 2-11, science and history/social science in grades9-11, and a norm-referenced test which tests reading, language and mathematics in Grades 2-11, spelling inGrades 2-8, and science in Grades 9-11.
California Standards Tests (CST)The California Standards Tests show how well students are doing in relation to the state content standards.Student scores are reported as performance levels. The five performance levels are Advanced (exceeds statestandards), Proficient (meets standards), Basic (approaching standards), Below Basic (below standards), andFar Below Basic (well below standards). Students scoring at the Proficient or Advanced level have met statestandards in that content area. Detailed information regarding results for each grade and proficiency level canbe found at the California Department of Education website at http://star.cde.ca.gov or by speaking with theschool principal. Note: To protect student privacy, scores are not shown when the number of students testedis 10 or less.
Academic Performance Index (API)The Academic Performance Index (API) is a score on a scale of 200 to 1000 that annually measures the academicperformance and progress of individual schools in California. On an interim basis, the state has set 800 as the APIscore that schools should strive to meet.Growth Targets: The annual growth target for a school is 5% of the distance between its base API and 800. Actualgrowth is the number of API points a school gained bewteen its base and growth years. Schools that reach theirannual targets are eligible for monetary awards. Schools that do not meet their targets and have a statewide APIrank of one to five are eligible to participate in the Immediate Intervention/Underperforming Schools Program(II/USP), which provides resources to schools to improve their academic achievement. There was no moneyallocated to the II/USP Program in 2002 or 2003.Subgroup APIs and Targets: In addition to a schoolwide API, schools also receive API scores for eachnumerically significant subgroup in the school (i.e., racial/ethnic subgroups and socioeconomically disadvantagedsubgroups.) Growth targets, equal to 80% of the school’s target, are also set for each of the subgroups. Eachsubgroup must meet its target in addition to the schoolwide target being met for the school to be identified ashaving met its target.Percentage Tested: In order to be eligible for awards, elementary and middle schools must test at least 95% oftheir students in grades 2-8 and high schools must test at least 90% of their students in grades 9-11 on STAR.Statewide Rank: Schools receiving an API score are ranked in ten categories of equal size (deciles) from one(lowest) to ten (highest), according to type of school (elementary, middle, or high school).Similar Schools Rank: Schools also receive a ranking that compares that school with 100 other schools withsimilar demographic characteristics. Each set of 100 schools is ranked by API score from one (lowest) to ten(highest) to indicate how well the school performed compared to schools most like it.
API criteria are subject to change as new legislation is enacted into law. Detailed information about the API andthe Public Scools Accountability Act (PSAA) can be found at the California Department of Education website athttp://www.cde.ca.gov/psaa/api/ or by speaking with the school principal.
“A” means the school scored at or above the statewide performance target of 800.
API Subgroups - Racial/Ethnic Groups
439
African AmericanBase API ScoreGrowth TargetAmerican Indian or Alaska Native
API Growth DataFr. 2002to 2003
Fr. 2001to 2002
From 2000to 2001
Base API Score
African AmericanGrowth API ScoreActual Growth American Indian or Alaska NativeGrowth API Score
API Base Data200220012000
Growth TargetAsian-AmericanBase API ScoreGrowth TargetFilipino-American
Actual Growth Asian-AmericanGrowth API ScoreActual Growth Filipino-American
Base API ScoreGrowth TargetHispanic or LatinoBase API ScoreGrowth Target
Growth API ScoreActual Growth Hispanic or Latino Growth API ScoreActual Growth
Pacific IslanderBase API ScoreGrowth TargetWhite (Not Hispanic)Base API Score
Pacific IslanderGrowth API ScoreActual Growth White (Not Hispanic)Growth API Score
Growth Target Actual Growth
38214
46114
38714
602
40320
55832
46643
37739
51951
405-4
336-46
4643
40013
38314
52614
42314
588
33814
14
46814
40914
API Subgroups - Socioeconomically Disadvantaged
Base API ScoreGrowth Target
API Growth DataFr. 2002to 2003
Fr. 2001to 2002
From 2000to 2001
Growth API ScoreActual Growth
API Base Data
200220012000
46314
4418
4293
44914
43314
42614
Schoolwide API
Percentage TestedBase API ScoreGrowth TargetStatewide Rank
API Growth DataFrom 2000
to 2001
Similar Schools Rank
Percentage TestedGrowth API ScoreActual Growth
API Base Data200220012000
97496
33
97449
9
89435-10
97463
1711
894401811
6744518
11
Fr. 2001to 2002
Fr. 2002to 2003
Note: # indicates that no growth target was assigned in that year.
Awards and Interventions Programs
California Fitness TestThe percent of students in grades 5, 7, and 9, as appropriate, who scored in the healthy fitness zone on allsix fitness standards on the California Fitness Test. Detailed information regarding the CaliforniaPhysical Fitness Test may be found at the California Department of Education website athtt;:..www.cde.ca.gov/statetests/pe/pe.html. Note: To protect student privacy, asterisks appear in any cellwhenever 10 or fewer students had valid test scores.
57
School DistrictTotal Male Female FemaleMaleTotal
GradeLevel
StateFemaleMaleTotal
27.236.4
31.540.7
23.032.4
23.827.8
25.229.6
22.326.0
9 16.0 16.0 16.0 34.4 35.8 33.2 24.8 23.3 26.2
Norm Referenced Test (NRT)Reading and mathematics results from the Norm Referenced Test adopted by the State Board of Education(this was the Stanford 9 Test up until 2003, but was changed to the California Achievement Test, Sixth Edition,for 2003) are reported as the percent of tested students scoring at or above the 50th percentile (the nationalaverage). School results are compared to results at the district and state levels. Detailed information regardingresults for each grade level can be found at the California Department of Education website athttp://star.cde.ca.gov/ or by speaking with the school principal. Note: To protect student privacy, asterisksappear in any cell whenever 10 or fewer students had valid test scores.
Note: # indicates that no growth target was assigned in that year.Local Assessment(Percentage of Students Meeting or Exceeding the District Standard)
2345
Reading Writing
2001 2002 2003
GradeLevel
Mathematics
678
K2001 2002 2003 2001 2002 2003
91011
School District2000 2001 2002
State2000 2001 2002 2000 2001 2002
PerformanceLevel
Advanced
Proficient
Basic
Below Basic
FarBelow Basic
PercentNot Tested
Eligibility for statewide award or intervention programs is based on API growth data from the previousacademic year.
2000 2001 2002
African American(not of Hispanic origin)
All Students
SocioeconomicallyDisadvantagedStudents with
Disabilities
Met Target (Y/N)
White(not of Hispanic origin)
School LEA
Met Target (Y/N)
School LEAAYP Reporting
CategoryAYP Reporting
Category
Disaggregated by Subgroup:
English LanguageLearners
Disaggregated by Race/Ethnicity:
American Indian orAlaska Native
Asian
Filipino
Hispanic or Latino
Pacific Islander
PerformanceLevel
Advanced
School District2001 2002 2003
State2001 2002 2003 2001 2002 2003
Advanced
Data reported are the percent of students achieving at the proficient or advanced level (meeting or exceeding thestate standard).
CST - All Students
PerformanceLevel
School District2001 2002 2003
State2001 2002 2003 2001 2002 2003
English/Language Arts 7 8 10 32 35 38 30 32 35
Mathematics 5 9 34 39 31 35
Science 3 6 32 28 30 27History/Social Science 6 7 32 32 28 28
Proficient or Advanced
Not Tested
School District2001 2002 2003
State2001 2002 2003 2001 2002 2003
8 9 46 48
30 34
44 45
53 55
43
50
45
57
22
29 60 63
Federal Programs
Recognition forAchievement (Title I)Identified for ProgramImprovement (Title 1)
NoNoNo
20022001 2003
Exited Title 1Program Improvement
NoNoNo
NoNoNo
Years Identified forProgram Improvement:
Eligible for Governor’sperformance award
Eligible for II/USP
California Programs
20022001 2003
Applied for II/USPFundingReceived II/USPFunding
YesNoNo
School Programs
Percent of Schools Identifiedfor Program Improvement
Number of Schools Identifiedfor Program Improvement 14011
12.30.09.5
District: Federal Programs20022001 2003
***** *No
***** *No
******No
NRT - All Students
Reading
Mathematics
School District2001 2002 2003
State2001 2002 2003 2001 2002 2003
8 9 46 48
30 34
44 45
53 55
43
50
45
57
22
29 60 63
Subject
Data reported are the percent of students scoring at or above the 50th percentile.
NRT - Racial/Ethnic Groups
SubjectAfrican
American
AmericanIndian orAlaskaNative
AsianAmerican
FilipinoAmerican
Hispanicor Latino
PacificIslander
White (notHispanic)
Reading
Mathematics 10 74 37 15 15 24
9 37 32 16 12 29
Data reported are the percent of students scoring at or above the 50th percentile.
NRT - Subgroups
19 26 11 17 25 2 25
29 29 35 30 28 2 33
Male FemaleEnglishLearners
SocioeconomicallyDisadvantaged
Students withDisabilities
MigrantEducation
ServicesYesYes No NoSubject
Reading
Mathematics
Data reported are the percent of students scoring at or above the 50th percentile.
The federal No Child Left Behind Act requires that all students perform at or above the proficient level onthe State’s standards based assessment by 2014. In order to achieve this goal and meet annual performanceobjectives, districts and schools must improve each year according to set requirements. Data reported showwhether all groups of students in the school made Adequate Yearly Progress. Detailed information aboutAYP can be found at the California Department of Education website at http://www.cde.ca.gov/ayp/ or byspeaking to the school principal.
Adequate Yearly Progress (AYP)
African American(not of Hispanic origin)
All Students
SocioeconomicallyDisadvantaged
Students withDisabilities
White(not of Hispanic origin)
English LanguageLearners
American Indian orAlaska Native
Asian
Filipino
Hispanic or Latino
Pacific Islander
School District2001 2002 2003 2001 2002 2003Groups
YES
NO
YES
YES
YES
YES
YES
YES
YES
YES
NO
NO
NO
N/A
N/A
N/A
NO
N/A
N/A
NO
NO
N/A
3/30/2004Printed:
***The II/USP Program was not funded for the years 2002 or 2003.
Balboa HS
CST - Racial/Ethnic Groups
PerformanceLevel
4 19 14 5 3 160 34 9 3 0 10
2 20 5 3 0 11
3 16 8 4 0 21
AfricanAmerican
AmericanIndian or
AlaskaNative
AsianAmerican
FilipinoAmerican
Hispanicor Latino
PacificIslander
White (notHispanic)
Data reported are the percent of students achieving at the proficient or advanced level (meeting or exceeding thestate standard).
English/Language ArtsMathematicsScienceHistory/Social Science
CST - Subgroups
PerformanceLevel
9 11 3 5 13 0 11
9 9 14 9 9 0 11
7 6 4 5 7 0 7
8 7 4 6 8 2 8
Male FemaleEnglishLearners
SocioeconomicallyDisadvantaged
Students withDisabilities
MigrantEducation
ServicesYesYes No No
Data reported are the percent of students achieving at the proficient or advanced level (meeting or exceeding thestate standard).
English/Language ArtsMathematicsScienceHistory/Social Science
Balboa HS
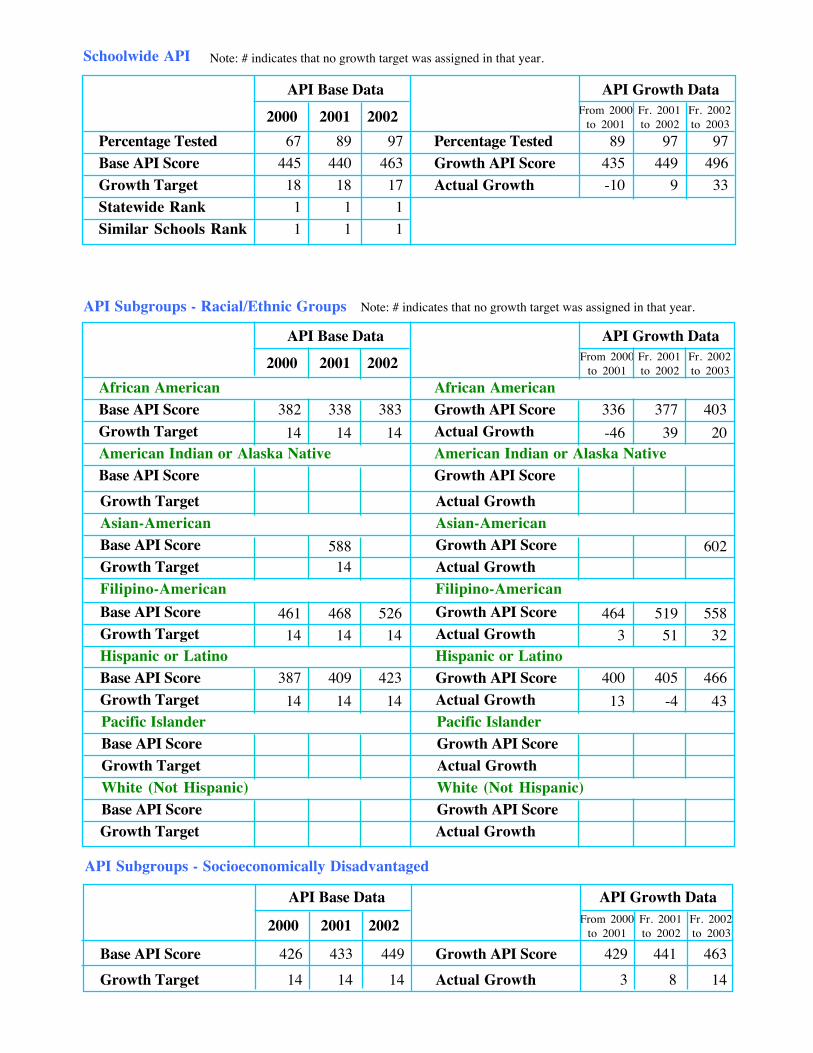
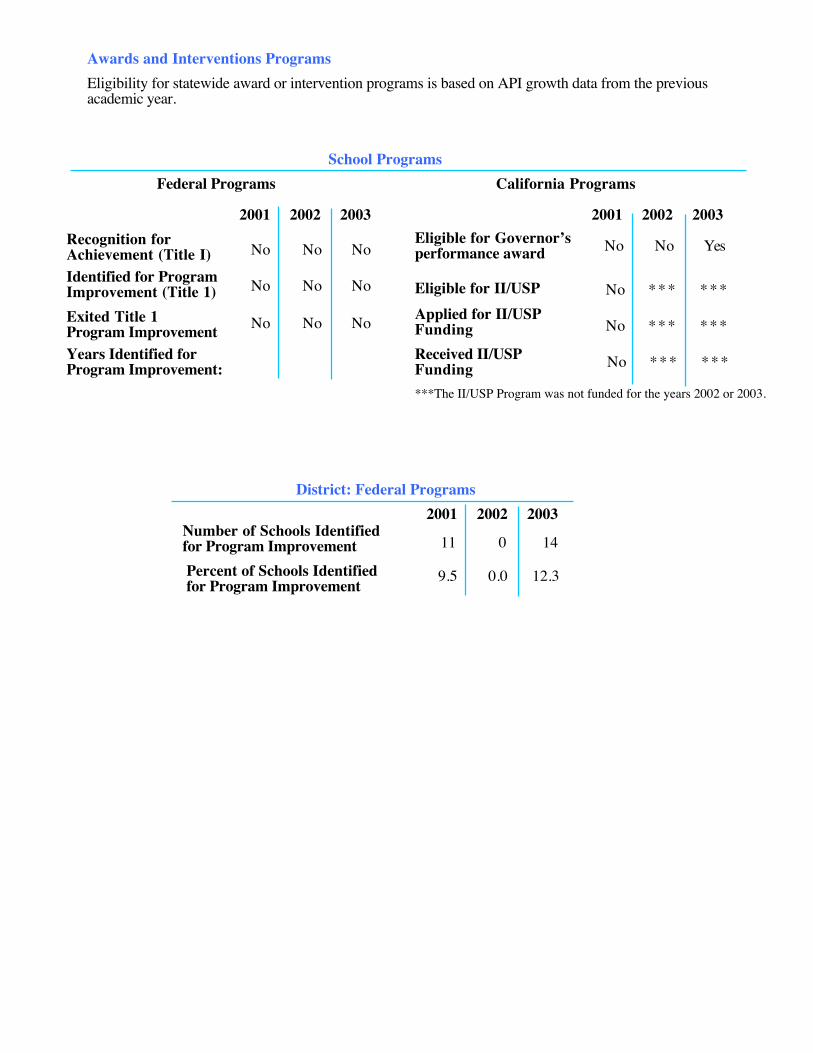
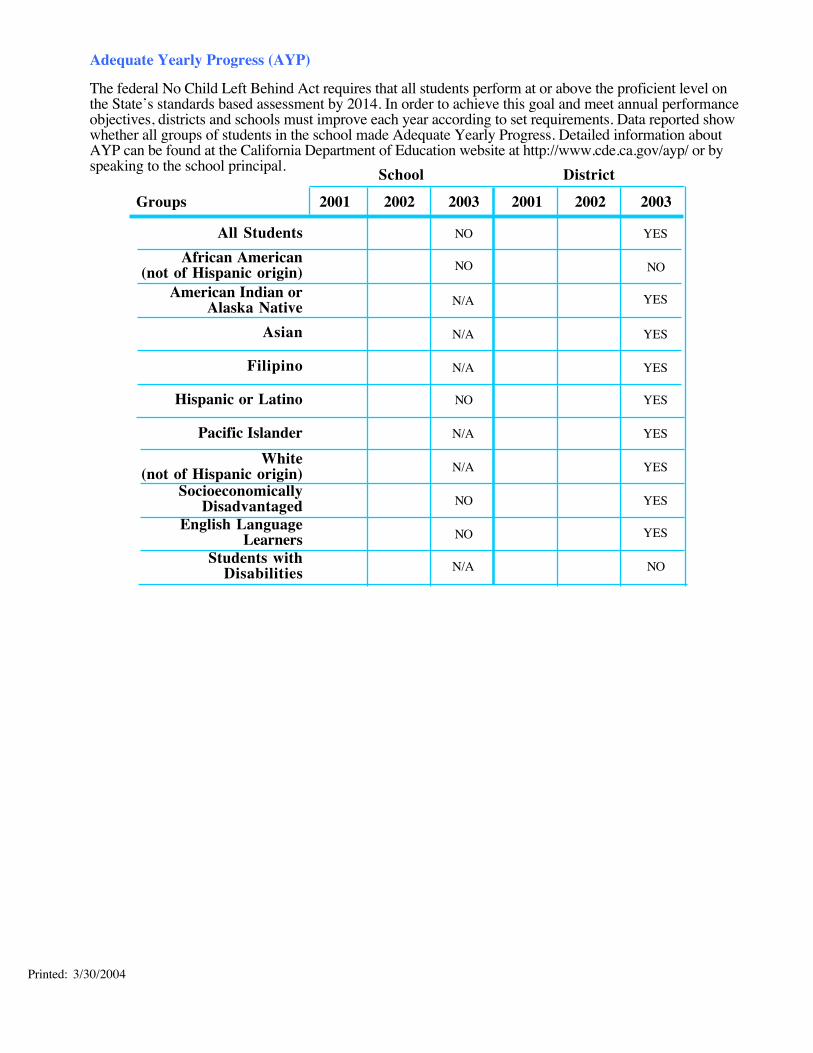
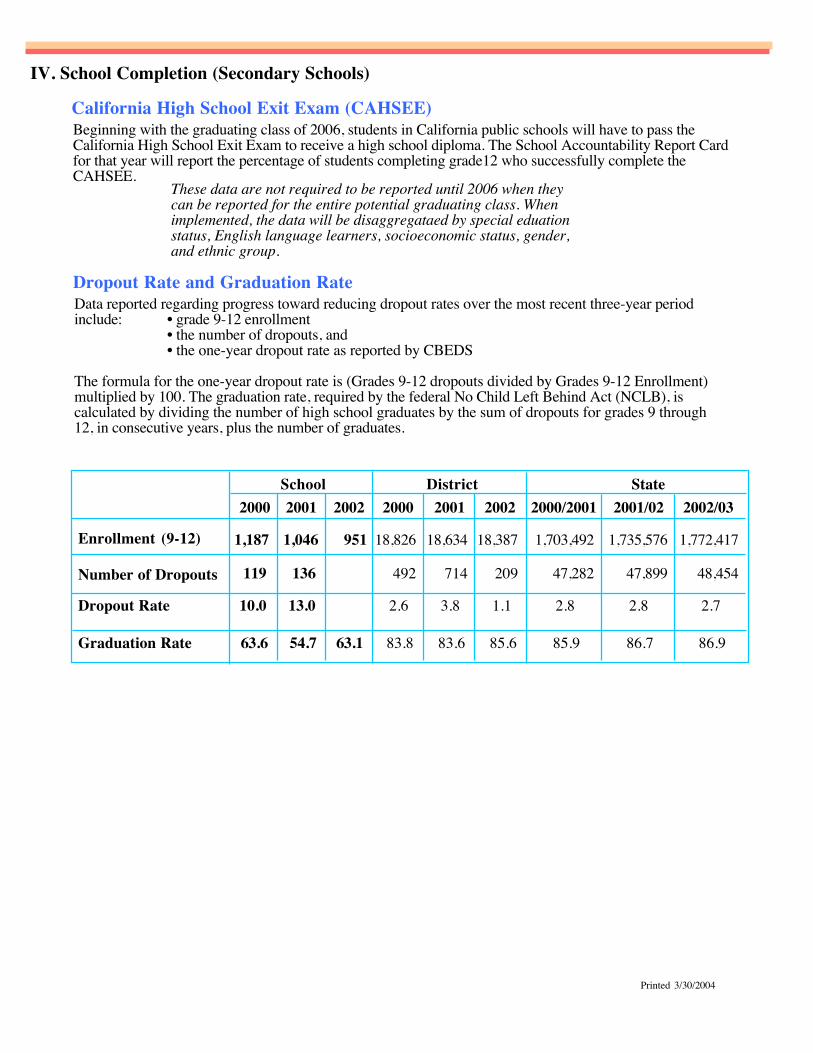
IV. School Completion (Secondary Schools)
California High School Exit Exam (CAHSEE)Beginning with the graduating class of 2006, students in California public schools will have to pass theCalifornia High School Exit Exam to receive a high school diploma. The School Accountability Report Cardfor that year will report the percentage of students completing grade12 who successfully complete theCAHSEE.
These data are not required to be reported until 2006 when theycan be reported for the entire potential graduating class. Whenimplemented, the data will be disaggregataed by special eduationstatus, English language learners, socioeconomic status, gender,and ethnic group.
439
Dropout Rate and Graduation Rate Data reported regarding progress toward reducing dropout rates over the most recent three-year periodinclude: • grade 9-12 enrollment
• the number of dropouts, and• the one-year dropout rate as reported by CBEDS
The formula for the one-year dropout rate is (Grades 9-12 dropouts divided by Grades 9-12 Enrollment)multiplied by 100. The graduation rate, required by the federal No Child Left Behind Act (NCLB), iscalculated by dividing the number of high school graduates by the sum of dropouts for grades 9 through12, in consecutive years, plus the number of graduates.
Number of Dropouts
Dropout Rate
School District2000 2001 2002
State
Enrollment (9-12) 1,187
119
10.0
1,046
136
13.0
951 18,826
492
2.6
18,634
714
3.8
18,387
209
1.1
1,703,492
47,282
2.8
1,735,576
47,899
2.8
1,772,417
48,454
2.7
2000 2001 2002 2000/2001 2001/02 2002/03
Graduation Rate 63.6 54.7 63.1 83.8 83.6 85.6 85.9 86.7 86.9
Balboa HS
2/11/2004Printed 3/30/2004
V. Class Size
Average Class Size and Class Size DistributionData reported are the average class size and the number of classrooms that fall into each category (i.e.,number of students), by grade level, as reported by CBEDS.
Class Size ReductionCalifornia’s K-3 Class Size Reduction program began in 1996 for children in kindergarten and grades1 through 3. Funding is provided to participating school districts to decrease the size of K-3 classes to20 or fewer students per certificated teacher.
439
Grade2001 2002 2003
Avg 1-20 21-32 33+ Avg 21-321-20 33+ Avg 1-20 21-32 33+K123456
K-33-44-8
Other
Grade LevelPercentage of Pupils Participating
K123
2001 2002 200399.399.399.399.3
99.399.399.399.3
99.399.399.399.3
Average Teaching Load andTeaching Load DistributionData reported are the average class size and the number of classrooms for each range of students by gradelevel as reported by CBEDS.
Subject2001 2002 2003
Avg 1-20 21-32 33+ Avg 21-321-20 33+ Avg 1-20 21-32 33+EnglishMathematicsScienceSocial Science
19.623.725.1
332.0
8108
12
101011
6
265
127
22.1128.2826.0329.48
986
10
141011
9
291911
5
21.8523.5126.2928.71
637
11
1411129
351313
1
Grades 6 - 12
Balboa HS
2/11/2004Printed 3/30/2004
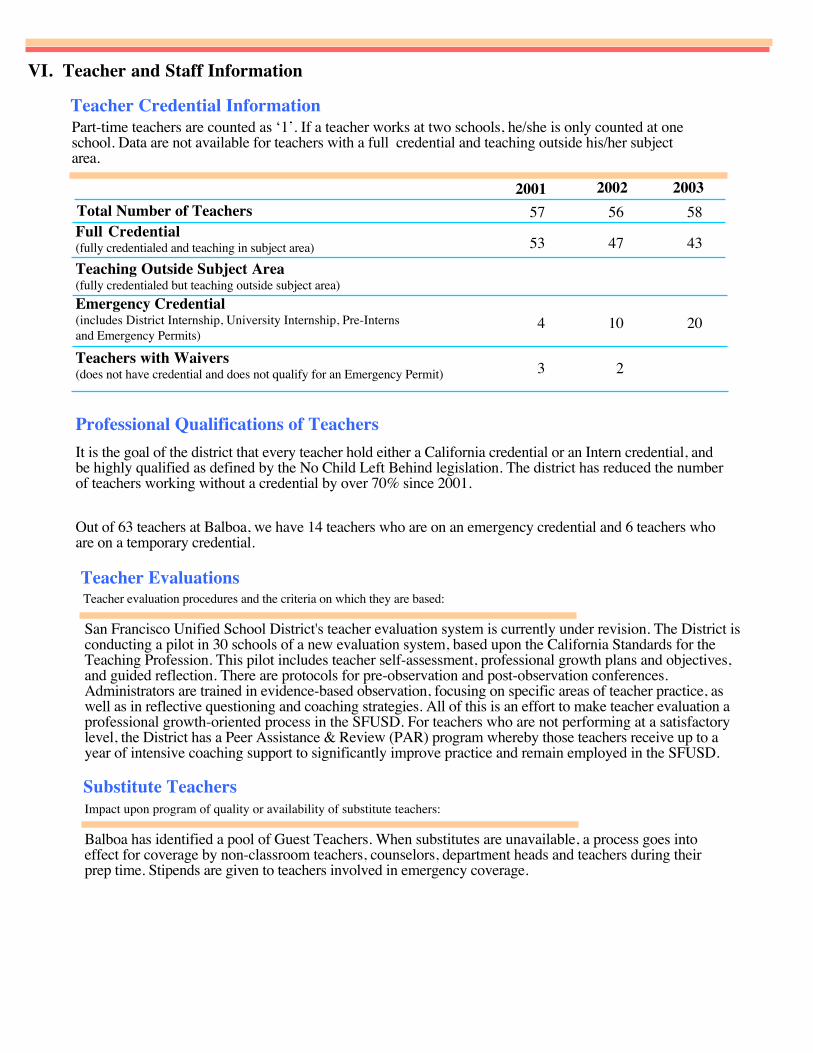
2/11/2004
VI. Teacher and Staff Information
Teacher Credential InformationPart-time teachers are counted as ‘1’. If a teacher works at two schools, he/she is only counted at oneschool. Data are not available for teachers with a full credential and teaching outside his/her subjectarea.
Out of 63 teachers at Balboa, we have 14 teachers who are on an emergency credential and 6 teachers whoare on a temporary credential.
Teacher EvaluationsTeacher evaluation procedures and the criteria on which they are based:
Substitute TeachersImpact upon program of quality or availability of substitute teachers:
Counselors and Other Support StaffData reported are in units of full-time equivalents (FTE). One FTE is defined as a staff person working 100% of full time.Two staff persons working 50% of full time also equals one FTE.
Academic CounselorsData reported are in units of full-time equivalents (FTE). One FTE is defined as a staff person working 100% of full time.Two staff persons working 50% of full time also equals one FTE. The ratio of pupils per academic counselor is enrollmentas reported in the most recent California Basic Educational Data System (CBEDS) data collection divided by the number ofacademic counselors.
Number of Academic Counselors (FTE) Ratio of Pupils per Academic Counselor
6 1 5 8 . 5 0
FTEStaff Category
61
CounselorLibrarian
PsychologistSocial Worker
NurseSpeech/Language/Hearing SpecialistResource Specialist (Non-Teaching)
Other
(K-8 school counselors for grades 6-8 only.)
Balboa has identified a pool of Guest Teachers. When substitutes are unavailable, a process goes intoeffect for coverage by non-classroom teachers, counselors, department heads and teachers during theirprep time. Stipends are given to teachers involved in emergency coverage.
All Balboa students are enrolled in advisory classes to provide each student with a personal advocate forhis/her academic and social development while at Balboa. These Advisories are connected to academiccourses in the students’ Small Learning Community. Our student support services are integrated throughour Coordinated Services Program and include: Balboa Teen Health Center; Peer Resources; UnitedPlayaz; Student Association; 21st Century Learning Center; JROTC; cultural clubs - Choir, Mabuhay,Polynesian, Latino, Chinese, BSU; Academic Clubs - Science, Chess, Debate; Alumni Association
San Francisco Unified School District's teacher evaluation system is currently under revision. The District isconducting a pilot in 30 schools of a new evaluation system, based upon the California Standards for theTeaching Profession. This pilot includes teacher self-assessment, professional growth plans and objectives,and guided reflection. There are protocols for pre-observation and post-observation conferences.Administrators are trained in evidence-based observation, focusing on specific areas of teacher practice, aswell as in reflective questioning and coaching strategies. All of this is an effort to make teacher evaluation aprofessional growth-oriented process in the SFUSD. For teachers who are not performing at a satisfactorylevel, the District has a Peer Assistance & Review (PAR) program whereby those teachers receive up to ayear of intensive coaching support to significantly improve practice and remain employed in the SFUSD.
Elementary: District general funds are not available for counseling services at the elementary school level. However,some schools have added support staff funded through special programs, projects, or grant awards.Middle/High: The District staffing ratio for counselors in middle and high schools is based on enrollment and iscomputed as follows:
Middle Students. : Counselors High Students : Counselors0-650 : 1 0-501 : 1 1501-1751 : 3.5
650-901 : 1.5 501-751 : 1.5 1751-2001 : 4over 901 : 2 751-1001 : 2 2001-2251 : 4.5
1001-1251 : 2.5 over 2251 : 51251-1501 : 3
Full Credential(fully credentialed and teaching in subject area)Teaching Outside Subject Area(fully credentialed but teaching outside subject area)Emergency Credential(includes District Internship, University Internship, Pre-Internsand Emergency Permits)
Teachers with Waivers(does not have credential and does not qualify for an Emergency Permit)
20032001Total Number of Teachers 57
53
4
3
56
47
10
2
58
43
20
2002
Professional Qualifications of TeachersIt is the goal of the district that every teacher hold either a California credential or an Intern credential, andbe highly qualified as defined by the No Child Left Behind legislation. The district has reduced the numberof teachers working without a credential by over 70% since 2001.
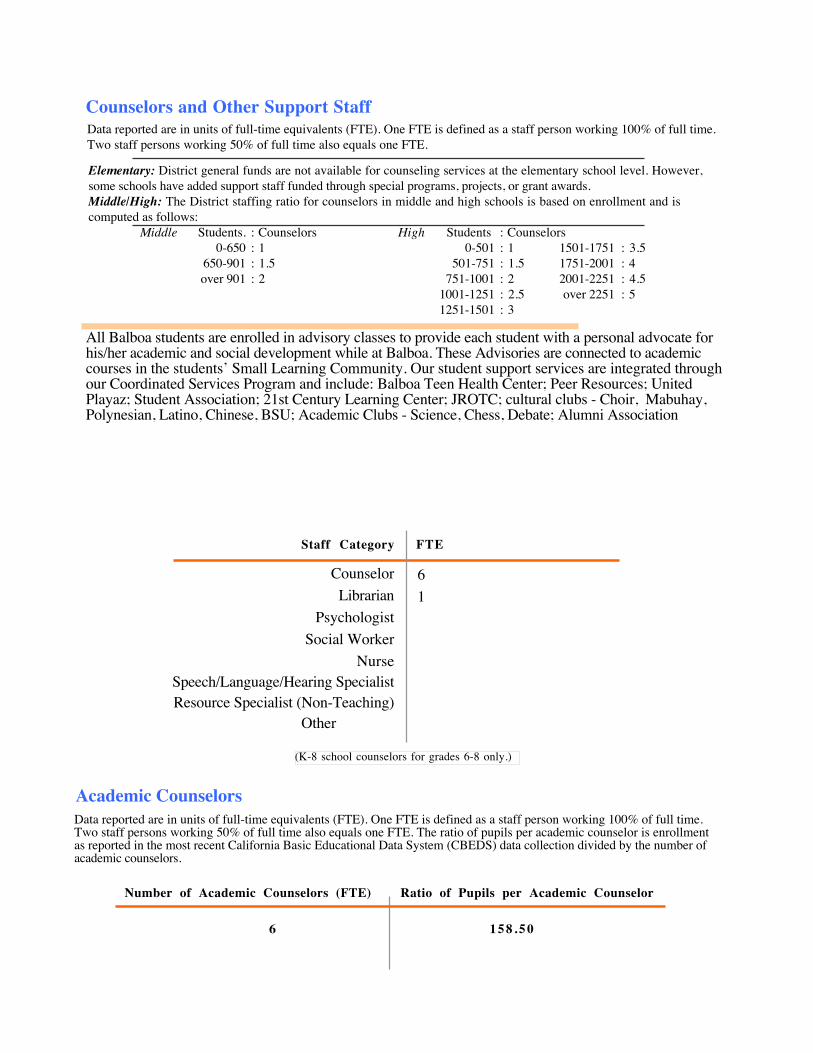
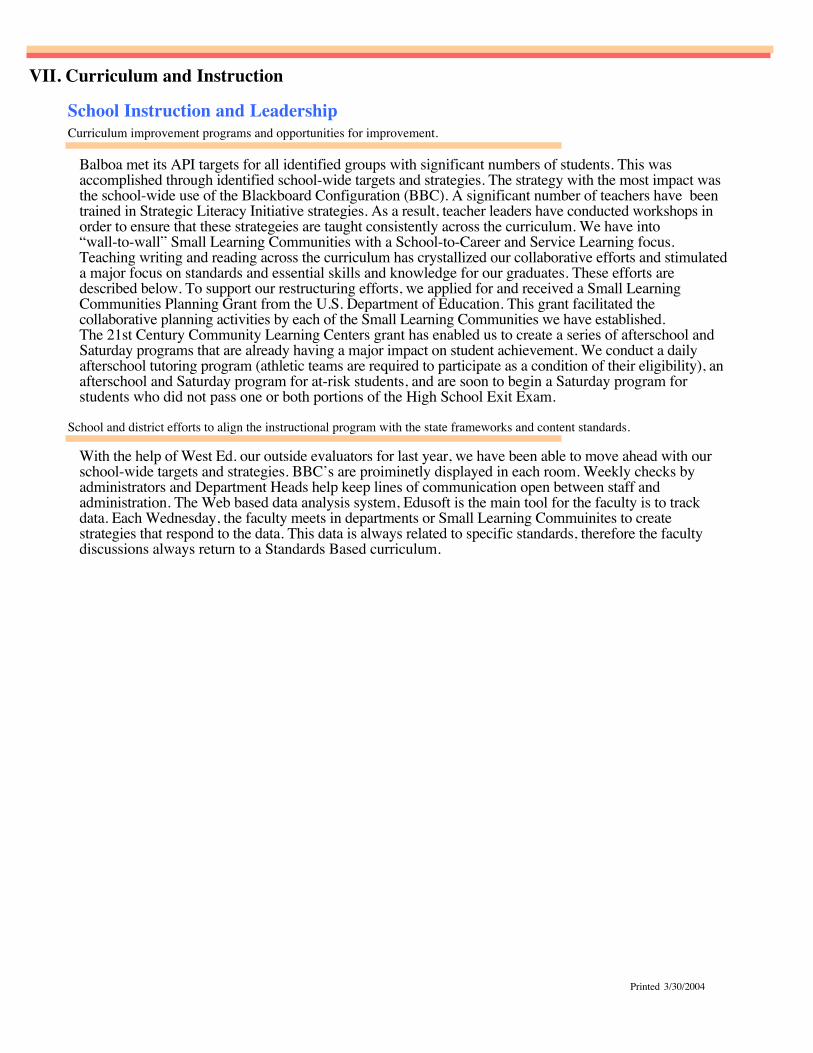
Curriculum improvement programs and opportunities for improvement.
School and district efforts to align the instructional program with the state frameworks and content standards.
VII. Curriculum and Instruction
School Instruction and Leadership
School leadership team at the school site, its role in ensuring the quality of the instructional program and support ofteachers in improving instruction .
How the school staff monitors the progress of underperforming students/student groups.
Supports and interventions that are available to assist special needs students.
Procedures for assessment of the progress of subgroups such as English Learners, Title I students, andnumerically significant API subgroups.
Efforts to ensure equal access to the core curriculum for all students, including students with lower skills, English Learners, andthe placement of individuals with exceptional needs in the least restrictive environment.
Summary of overall achievement by subgroups.
Textbooks are in sufficient supply, are up-to-date according to recent adoptions and in good condition. Wehave sufficient funds to purchase new textbooks to replace lost books and to purchase supplementarymaterials as needed by departments.We have had extensive resources during the past three years to purchase trade books, especially in Literature,to support our schoolwide Literacy focus.
Number of Staff Development Days: 2000-2001 = 3 2001-2002 = 3 2002-2003 = 3
Professional Development
Condition of textbooks and other instructional materials. Include information on supply, quality, and currency.
School educational technology program.
Additional technology resources.
Indicate whether or not textbooks meet state standards and have been adopted by the State Board of Education (SBE).
Report the ratio of textbooks to pupils.
Quality and Currency of Textbooks and Other Instructional Materials
Instructional Minutes (School Year 2002-2003)
Total Number of Minimum DaysNumber of days and reasons
439
Balboa met its API targets for all identified groups with significant numbers of students. This wasaccomplished through identified school-wide targets and strategies. The strategy with the most impact wasthe school-wide use of the Blackboard Configuration (BBC). A significant number of teachers have beentrained in Strategic Literacy Initiative strategies. As a result, teacher leaders have conducted workshops inorder to ensure that these strategeies are taught consistently across the curriculum. We have into“wall-to-wall” Small Learning Communities with a School-to-Career and Service Learning focus.Teaching writing and reading across the curriculum has crystallized our collaborative efforts and stimulateda major focus on standards and essential skills and knowledge for our graduates. These efforts aredescribed below. To support our restructuring efforts, we applied for and received a Small LearningCommunities Planning Grant from the U.S. Department of Education. This grant facilitated thecollaborative planning activities by each of the Small Learning Communities we have established.The 21st Century Community Learning Centers grant has enabled us to create a series of afterschool andSaturday programs that are already having a major impact on student achievement. We conduct a dailyafterschool tutoring program (athletic teams are required to participate as a condition of their eligibility), anafterschool and Saturday program for at-risk students, and are soon to begin a Saturday program forstudents who did not pass one or both portions of the High School Exit Exam.
In addition to the major curricular, standards-based initiatives described above, we are aggressive in ourrecruitment efforts to bring targeted students into higher-level honors and Advanced Placement classes.All Special Education students are enrolled in Small Learning Community programs. Resource Specialiststudents are mainstreamed into General Education communities.
With the help of West Ed. our outside evaluators for last year, we have been able to move ahead with ourschool-wide targets and strategies. BBC’s are proiminetly displayed in each room. Weekly checks byadministrators and Department Heads help keep lines of communication open between staff andadministration. The Web based data analysis system, Edusoft is the main tool for the faculty is to trackdata. Each Wednesday, the faculty meets in departments or Small Learning Commuinites to createstrategies that respond to the data. This data is always related to specific standards, therefore the facultydiscussions always return to a Standards Based curriculum.
Leadership is centered with the Principal and the Assistant Principals for Buildings and Grounds,Curriculum and Instruction, Pupil Services and our Instructional Reform Facilitator. Teachers exertsignificant leadership and influence through the Department Head/Leadership Team and Small LearningCommunities (SLC) and the SLC Coordinators Committee.The PTSA and School Site Council are the major avenue for parent and community influence.Instruction is supported through regular formal and informal classroom visits, peer coaching by teachers,collaborative planning through Small Learning Communities, and professional development particularlyaround literacy issues.
Progress of underperforming students/student groups is monitored through a variety of measuresincluding grades, standardized test scores, Benchmark tests, attendance patterns, disciplinary referrals, andby collaborative consultations within the Small Learning Communities. Underperforming students canalso be referred to our Student Success Team and Student Assistance Program. We also have an OutreachConsultant who works closely with the faculty and the parents/guardians of our most At-Risk students.
Since the vast majority of the Balboa High School population fall into these targeted groups, theprocedures for monitoring progress of underperforming students described above apply here as well.
The Small Learning Community structure facilitates interventions for special needs students. Teacherscollaborate on behalf of individual students, contact caregivers, make referrals for counseling or socialservices, and academic tutoring. We also have a Teen clinic on campus tht helps stduents address issueslike: substance abuse, domestic violenve, teen prgnancy, etc.Special Education services include: Special Day Classes: Learning Disabled, Severely Impaired,Emotionally Disturbed, Speech and Language Impaired; Resource Specialist; School Psychologist; VisionSpecialist; Mobility Specialist; Adaptive Physical Education Therapist; Speech and Language TherapistWe now have 2 parent liaisons, one who is bilingual.
• The Class of 2003 received over 2.4 million dollars in scholarships to attend college.• 96% of the Class of 2003 were accepted to an institution of higher education.• The dropout rate is below the state average (3.8%)• STAR test results - We met our API, we tested at least 90% of eligible students on the CAT/6 and the
CST. We far surpassed our target of moving students in the academic areas at below basic will move tobasic on the CST in Language Arts. We also did the same for students who moved from basic to abovebasic.
Balboa starts each school year with three days of teacher in-service to work together to build effectiveworking relationships through agreed upon school-wide systems and strategies. Master Teachers trainedthrough the Strategic Literacy Intiative provide workshops for the faculty concerning teaching reading andwriting across the curriculum. The Small Learning Communities meet frequently to coordinate studentservices and instructional strategies. Wednesday common planning times are dedicated to school-wideinitiative, targets and strategies. The administration makes frequent visits to classrooms in order to providehelp for struggling teachers.
As a Digital High School, we have made a major investment in technology infrastructure and developingcurriculum to take advantage of the infrastructure. The computer labs described below are used heavily byclasses to create web pages, digital videos, for Internet research, word processing, spreadsheet analysis, andPowerPoint presentations. The Communication Arts Academy, part of our School-to-Career programming, isa leader in the San Francisco Unified School District in infusing technology into the curriculum.
We have on staff a Curriculum and Technology Integration Specialist who works with classroom teachers todevelop lessons that integrate technology as a production and learning tool.We also have a full time technician who works to keep the networks and computers operating smoothly.There are 8 computer labs on campus, 1/2 are PC/Windows labs and 1/2 are Macintosh labs. We also have arolling lab of 25 Macintosh ibooks for use in individual classrooms. All labs have internet access includingthe rolling ibook lab.
All textbooks are on the District approved lists. Trade books are also on the District approved lists.
6:1
NoneAny additional minimum days at this school and reasons:
In all San Francisco Unified District schools: • 10 minimum days make time for parent/teacher conferences during Fall and Spring Parent Conference Weeks • 3 minimum days per year make time for teachers to take part in professional development during Professional Development Institutes
Some schools “bank” additional instructional time to be used for professional development.Banked minutes at this school:
We have a grand total of 1835 minutes of instructional time per week. We have a total of 35 minutes of bankedtime per week.
Grade Level State Instructional Minutes1 through 8 Requirement Offered by
K12345678
36,00050,40050,40050,40054,00054,00054,00054,00054,000
State Requirement for High School: 64,800
Balboa HS
65,19065,19065,19065,190
9101112
Instructional Minutes offered:
Professional development is a part of every school site plan and a major component of instructional supportdepartments. The district's professional development program provides opportunities for teachers toimplement the district's core curriculum for all students, update subject area expertise, use data to planinstructional improvement strategies, and acquire new instructional strategies. Leadership development acrosscontent areas is facilitated centrally, and for educators and parents each school has three full days forprofessional development during the academic year. Additionally, in 2002/2003 there were four weeks of centrally coordinated Professional DevelopmentInstitutes. These week-long, afterschool/Saturday institutes offered professional development in standards,best practices, assessment and diversity. A week-long institute in August offered professional development toall new teachers.
1. Number of Computers Used for Instructionally Related Purposes 2. Number of Computers listed above with CD-ROM (must be less than or equal to #1)3. Number of Classrooms with Internet Access 4. Number of Classrooms with Wide Area Network (WAN) Access
340
335
470
2/11/2004Printed 3/30/2004
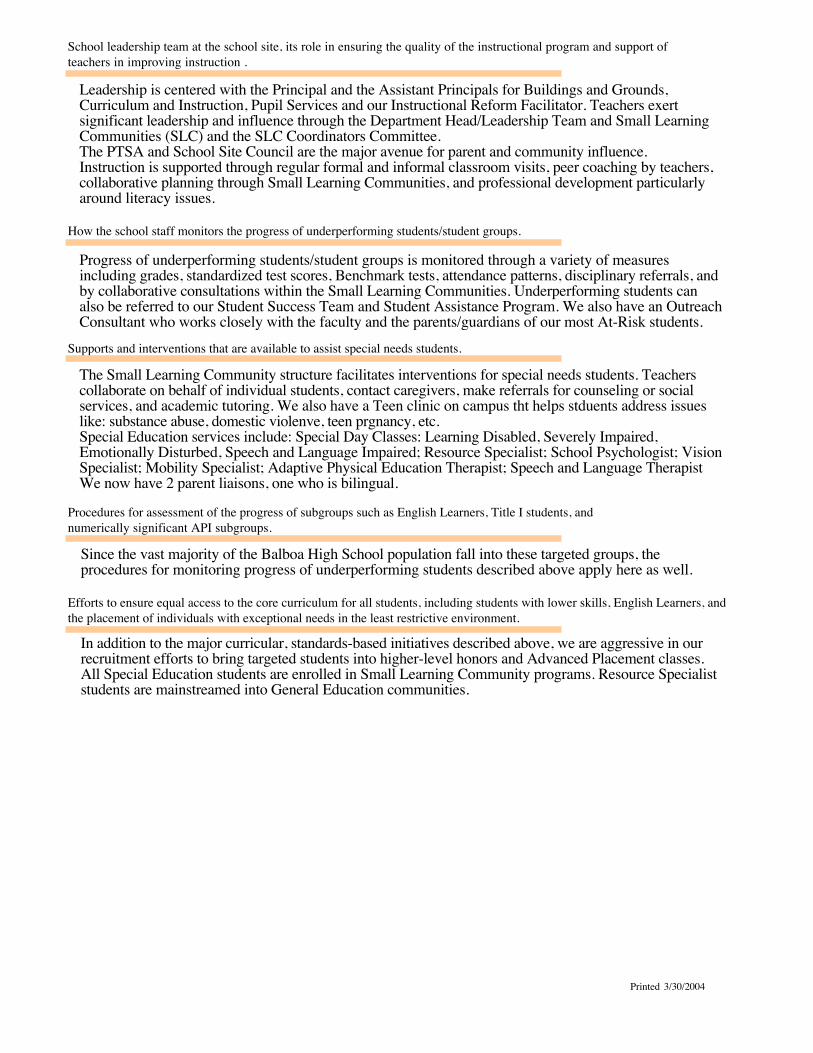
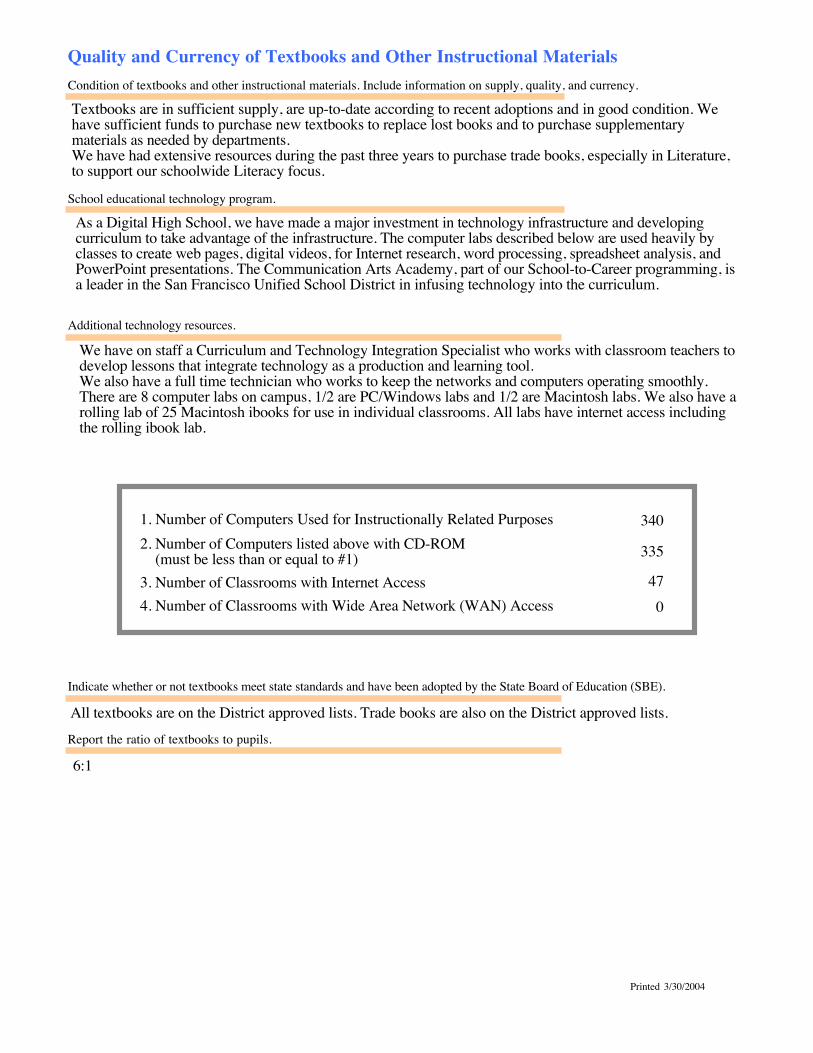
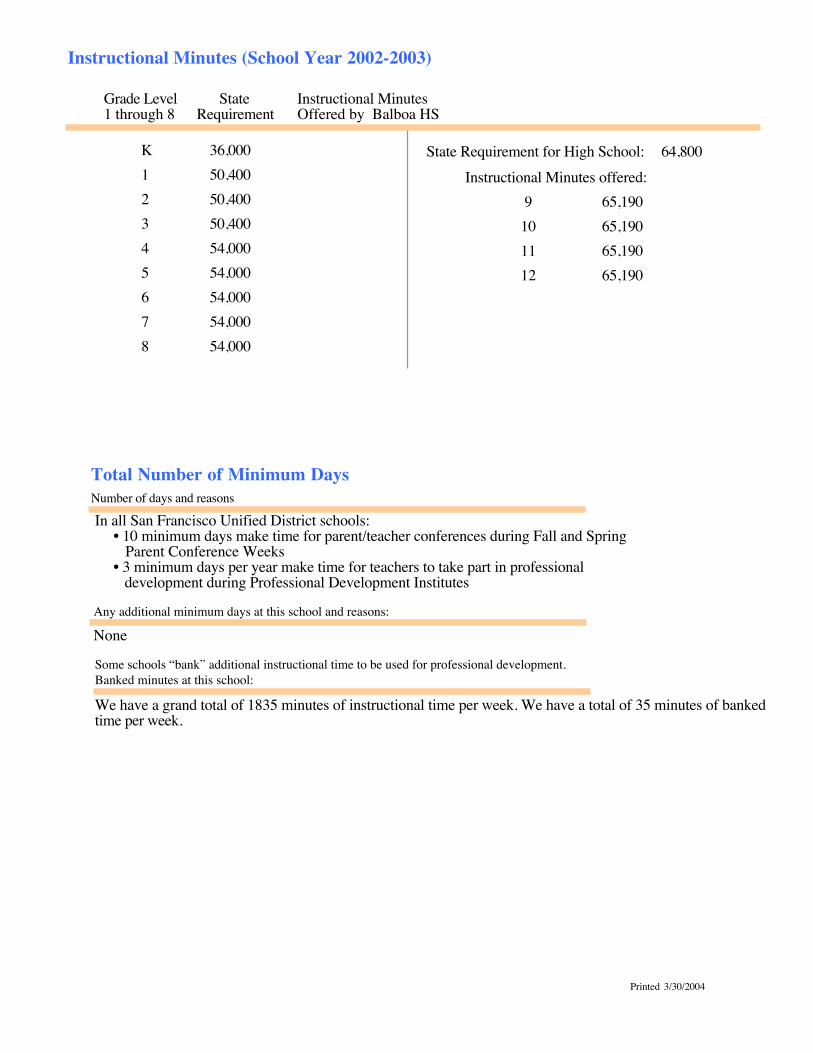
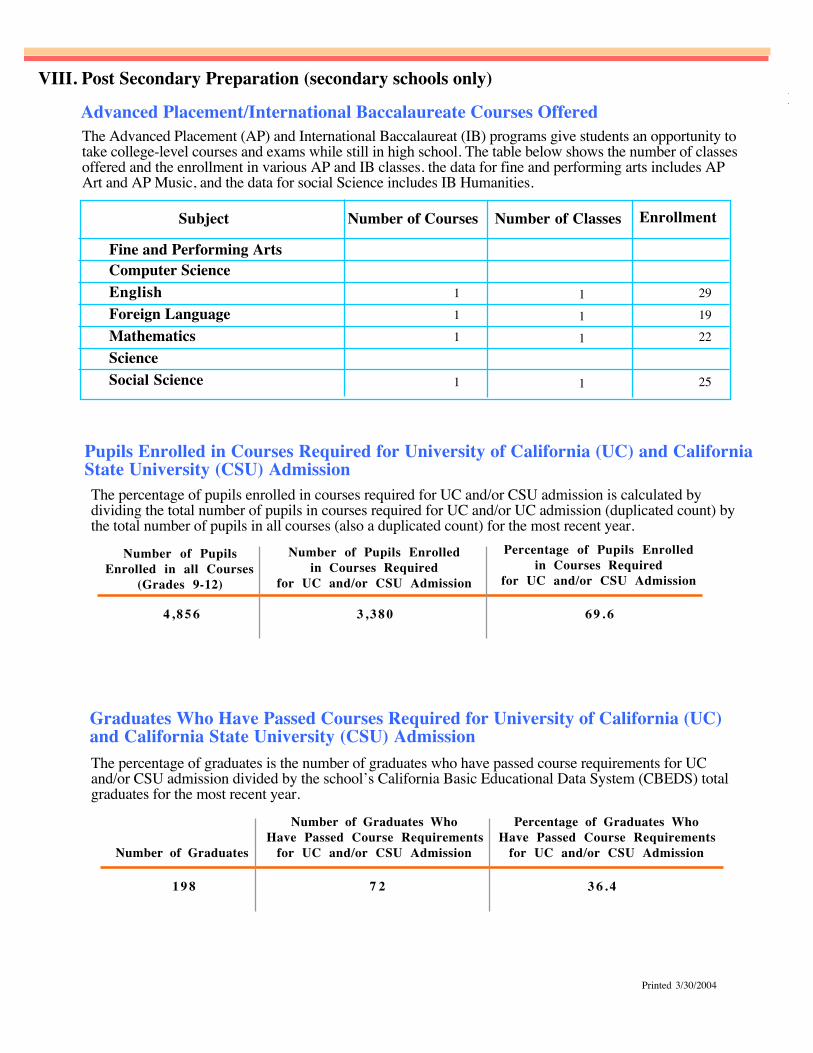
VIII. Post Secondary Preparation (secondary schools only)
How the school makes special efforts to help special student populations in their preparation to enter the work force.
How the school measures the success of its efforts to prepare students for the work force.
How the school's instructional programs foster the acquisition and growth of work readiness skills on the part of the school'sstudents.
All of Balboa’s Juniors and Seniors are enrolled in a Small Learning Community with a School-to-Careeremphasis which means that the core curriculum is presented in the context of the career theme, guestspeakers and field trips are geared to the thematic focus, mentors work with individual students andstudents participate in career-based internships during the Summer. At the Freshman and Sophomorelevels, the core curriculum is presented in the context of a service learning theme with career explorationunits that facilitate the development of work readiness skills.We have aggressively developed a culture of college attendance after high school as an essential step in thecareer development process.
We examine a variety of factors in the School-to-Career pathways, including student achievementindicators, attendance rates, dropout rates, etc.The number of participants in career interest surveys, internships, and field trips to work sites are alsoindicators of our preparation of our students for the work force.
Our International Pathway is comprised of ELL students shadow workers in a variety of occupations.Special Education students are served through the mainstreaming of RSP students into school-to-careerpathways. In addition, we work closely with such organizations as Bridge who facilitate the placement ofSpecial Education students into work environments with support of the student and employer.
Degree to Which Students Are Prepared to Enter Workforce
The Advanced Placement (AP) and International Baccalaureat (IB) programs give students an opportunity totake college-level courses and exams while still in high school. The table below shows the number of classesoffered and the enrollment in various AP and IB classes. the data for fine and performing arts includes APArt and AP Music, and the data for social Science includes IB Humanities.
Advanced Placement/International Baccalaureate Courses Offered
Pupils Enrolled in Courses Required for University of California (UC) and CaliforniaState University (CSU) AdmissionThe percentage of pupils enrolled in courses required for UC and/or CSU admission is calculated bydividing the total number of pupils in courses required for UC and/or UC admission (duplicated count) bythe total number of pupils in all courses (also a duplicated count) for the most recent year.
Graduates Who Have Passed Courses Required for University of California (UC)and California State University (CSU) AdmissionThe percentage of graduates is the number of graduates who have passed course requirements for UCand/or CSU admission divided by the school’s California Basic Educational Data System (CBEDS) totalgraduates for the most recent year.
4 , 8 5 6 6 9 . 6
Number of PupilsEnrolled in all Courses
(Grades 9-12)
Number of Pupils Enrolledin Courses Required
for UC and/or CSU Admission
Percentage of Pupils Enrolledin Courses Required
for UC and/or CSU Admission
3 , 3 8 0
1 9 8 3 6 . 4
Number of Graduates
Number of Graduates WhoHave Passed Course Requirements
for UC and/or CSU Admission
Percentage of Graduates WhoHave Passed Course Requirements
for UC and/or CSU Admission
7 2
SAT I Reasoning Test
Computer ScienceEnglishForeign LanguageMathematics
Subject
ScienceSocial Science
Fine and Performing Arts
Enrollment
291922
25
Number of Courses
111
1
Number of Classes
111
1
439HSBalboa HS
Percentage of Grade 12Enrollment taking testAverage Verbal Score
School District2001 2002 2003
State
Grade 12 Enrollment 191 158 183 3,568 3,704 4,151 357,789 365,907 385,181
2001 2002 2003 2001 2002 2003
Average Math Score
45.6 76.6 56.8 69.0 69.8 63.3 36.7 37.3 36.7
376 363 384 464 464 472 492 490 494
414 410 416 519 522 532 516 516 518
Students may voluntarily take the SAT test for college entrance. The test may or may not be available tostudents at a given school. Students may take the test more than once, but only the highest score is reported atthe year of graduation.
College Admission Test Preparation Course ProgramThe SFUSD administers previous editions of the PSAT and SAT to 10th grade and 11th grade studentsnot only as “practice tests” but also for the purpose of incorporating their individual item responses tothe test questions as part of their classroom learning experience.
In many SFUSD high schools there is a state funded program, the College Preparation PartnershipProgram (CPPP) established by Senate Bill 197. The purpose of this program is to provide preparationcourses for college admissions examinations. The funds are to be used to supplement, and not supplant,other funds available for preparation courses for college admission tests.This school participates in the CPPP program:
Any other test preparation offered by this school:
Through AACE TRIO program there is a SAT I and II prep class given to seniors in the fall semester.School to Career classes meet every Monday with Seniors and Juniors in order to prepare them forcollege. A porton of the class is dedicated to test preparation.
Yes No
Balboa HS
Enrollment and Program Completion in Career/Technical Education Programs(District Level)
Data are available from the Report of Career-Technical Education Enrollment and Program Completion forschool Year 2001/2002 (CDE 101 E-1). Data have been aggregated to the district level.
CTE Participants Secondary CTE Students Grade 12 CTE Students
TotalCourse
Enrollment
Numbero f
Concentrators
Numbero f
CompletersCompletion
Rate
Numbero f
Completers
NumberEarningDiploma
GraduationRate
13,425 1,160 187 16.12% 108 96 88.88%
Balboa HS
2/11/2004Printed 3/30/2004
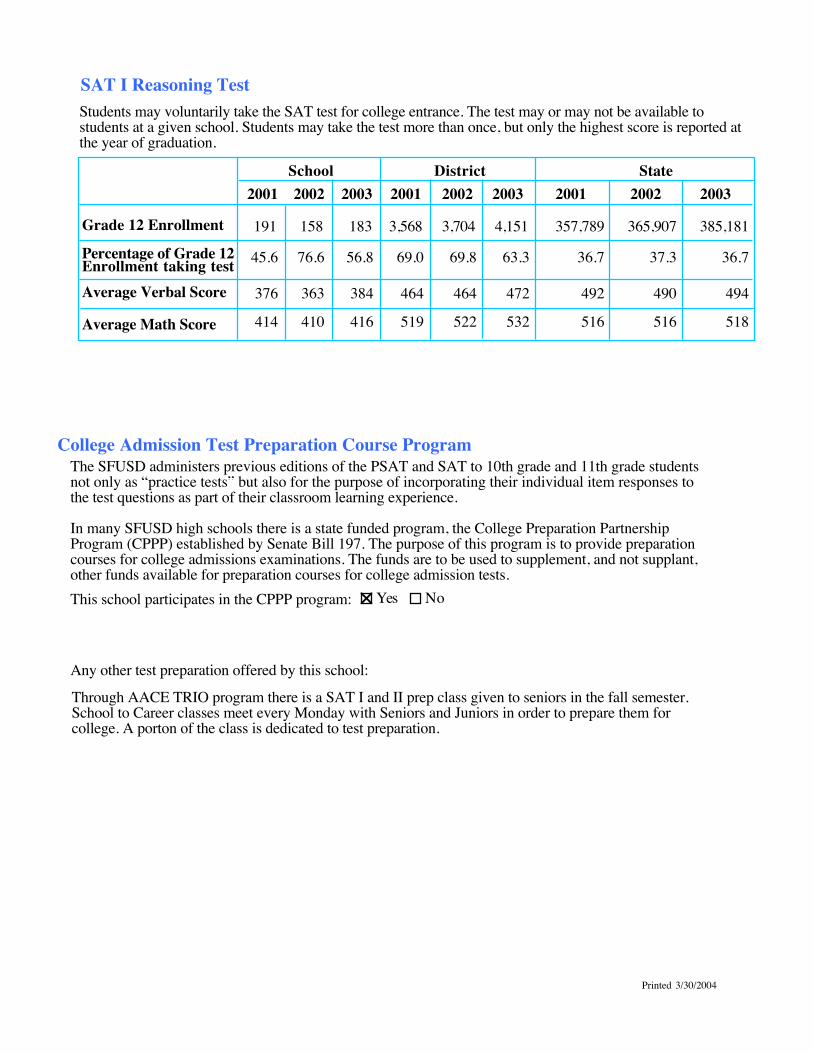
VIII. Post Secondary Preparation (secondary schools only)
How the school makes special efforts to help special student populations in their preparation to enter the work force.
How the school measures the success of its efforts to prepare students for the work force.
How the school's instructional programs foster the acquisition and growth of work readiness skills on the part of the school'sstudents.
All of Balboa’s Juniors and Seniors are enrolled in a Small Learning Community with a School-to-Careeremphasis which means that the core curriculum is presented in the context of the career theme, guestspeakers and field trips are geared to the thematic focus, mentors work with individual students andstudents participate in career-based internships during the Summer. At the Freshman and Sophomorelevels, the core curriculum is presented in the context of a service learning theme with career explorationunits that facilitate the development of work readiness skills.We have aggressively developed a culture of college attendance after high school as an essential step in thecareer development process.
We examine a variety of factors in the School-to-Career pathways, including student achievementindicators, attendance rates, dropout rates, etc.The number of participants in career interest surveys, internships, and field trips to work sites are alsoindicators of our preparation of our students for the work force.
Our International Pathway is comprised of ELL students shadow workers in a variety of occupations.Special Education students are served through the mainstreaming of RSP students into school-to-careerpathways. In addition, we work closely with such organizations as Bridge who facilitate the placement ofSpecial Education students into work environments with support of the student and employer.
Degree to Which Students Are Prepared to Enter Workforce
The Advanced Placement (AP) and International Baccalaureat (IB) programs give students an opportunity totake college-level courses and exams while still in high school. The table below shows the number of classesoffered and the enrollment in various AP and IB classes. the data for fine and performing arts includes APArt and AP Music, and the data for social Science includes IB Humanities.
Advanced Placement/International Baccalaureate Courses Offered
Pupils Enrolled in Courses Required for University of California (UC) and CaliforniaState University (CSU) AdmissionThe percentage of pupils enrolled in courses required for UC and/or CSU admission is calculated bydividing the total number of pupils in courses required for UC and/or UC admission (duplicated count) bythe total number of pupils in all courses (also a duplicated count) for the most recent year.
Graduates Who Have Passed Courses Required for University of California (UC)and California State University (CSU) AdmissionThe percentage of graduates is the number of graduates who have passed course requirements for UCand/or CSU admission divided by the school’s California Basic Educational Data System (CBEDS) totalgraduates for the most recent year.
4 , 8 5 6 6 9 . 6
Number of PupilsEnrolled in all Courses
(Grades 9-12)
Number of Pupils Enrolledin Courses Required
for UC and/or CSU Admission
Percentage of Pupils Enrolledin Courses Required
for UC and/or CSU Admission
3 , 3 8 0
1 9 8 3 6 . 4
Number of Graduates
Number of Graduates WhoHave Passed Course Requirements
for UC and/or CSU Admission
Percentage of Graduates WhoHave Passed Course Requirements
for UC and/or CSU Admission
7 2
SAT I Reasoning Test
Computer ScienceEnglishForeign LanguageMathematics
Subject
ScienceSocial Science
Fine and Performing Arts
Enrollment
291922
25
Number of Courses
111
1
Number of Classes
111
1
439HSBalboa HS
Percentage of Grade 12Enrollment taking testAverage Verbal Score
School District2001 2002 2003
State
Grade 12 Enrollment 191 158 183 3,568 3,704 4,151 357,789 365,907 385,181
2001 2002 2003 2001 2002 2003
Average Math Score
45.6 76.6 56.8 69.0 69.8 63.3 36.7 37.3 36.7
376 363 384 464 464 472 492 490 494
414 410 416 519 522 532 516 516 518
Students may voluntarily take the SAT test for college entrance. The test may or may not be available tostudents at a given school. Students may take the test more than once, but only the highest score is reported atthe year of graduation.
College Admission Test Preparation Course ProgramThe SFUSD administers previous editions of the PSAT and SAT to 10th grade and 11th grade studentsnot only as “practice tests” but also for the purpose of incorporating their individual item responses tothe test questions as part of their classroom learning experience.
In many SFUSD high schools there is a state funded program, the College Preparation PartnershipProgram (CPPP) established by Senate Bill 197. The purpose of this program is to provide preparationcourses for college admissions examinations. The funds are to be used to supplement, and not supplant,other funds available for preparation courses for college admission tests.This school participates in the CPPP program:
Any other test preparation offered by this school:
Through AACE TRIO program there is a SAT I and II prep class given to seniors in the fall semester.School to Career classes meet every Monday with Seniors and Juniors in order to prepare them forcollege. A porton of the class is dedicated to test preparation.
Yes No
Balboa HS
Enrollment and Program Completion in Career/Technical Education Programs(District Level)
Data are available from the Report of Career-Technical Education Enrollment and Program Completion forschool Year 2001/2002 (CDE 101 E-1). Data have been aggregated to the district level.
CTE Participants Secondary CTE Students Grade 12 CTE Students
TotalCourse
Enrollment
Numbero f
Concentrators
Numbero f
CompletersCompletion
Rate
Numbero f
Completers
NumberEarningDiploma
GraduationRate
13,425 1,160 187 16.12% 108 96 88.88%
Balboa HS
2/11/2004Printed 3/30/2004
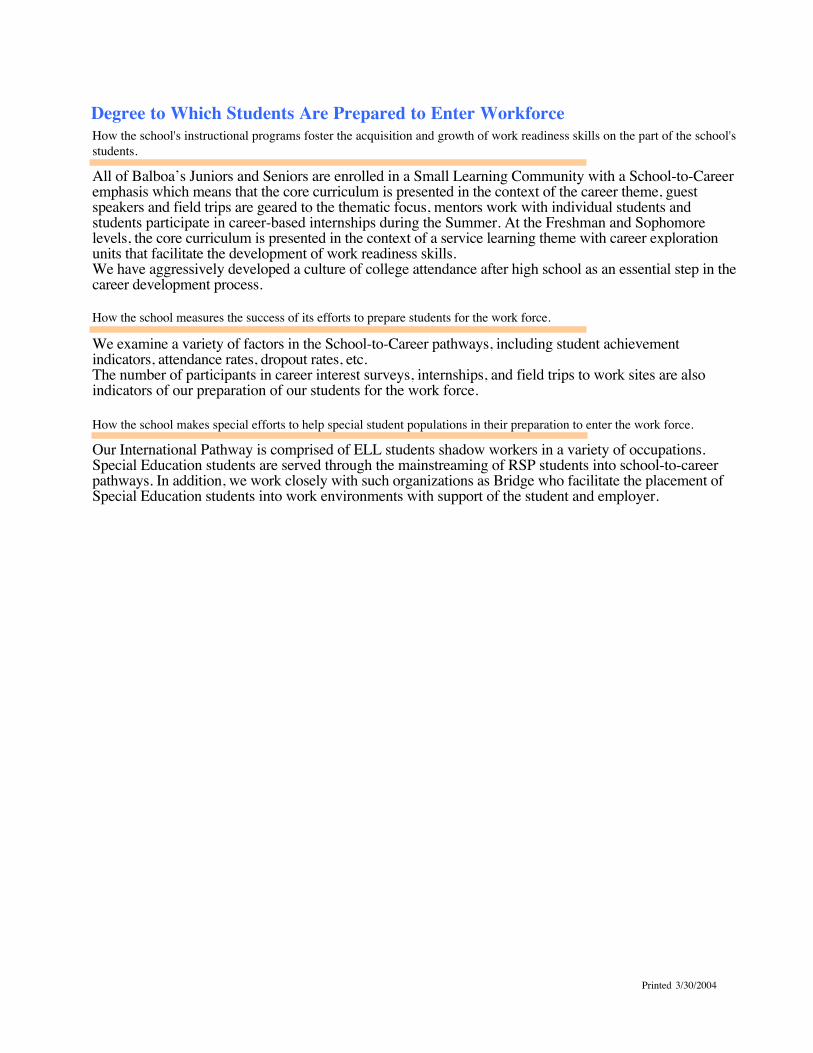
VIII. Post Secondary Preparation (secondary schools only)
How the school makes special efforts to help special student populations in their preparation to enter the work force.
How the school measures the success of its efforts to prepare students for the work force.
How the school's instructional programs foster the acquisition and growth of work readiness skills on the part of the school'sstudents.
All of Balboa’s Juniors and Seniors are enrolled in a Small Learning Community with a School-to-Careeremphasis which means that the core curriculum is presented in the context of the career theme, guestspeakers and field trips are geared to the thematic focus, mentors work with individual students andstudents participate in career-based internships during the Summer. At the Freshman and Sophomorelevels, the core curriculum is presented in the context of a service learning theme with career explorationunits that facilitate the development of work readiness skills.We have aggressively developed a culture of college attendance after high school as an essential step in thecareer development process.
We examine a variety of factors in the School-to-Career pathways, including student achievementindicators, attendance rates, dropout rates, etc.The number of participants in career interest surveys, internships, and field trips to work sites are alsoindicators of our preparation of our students for the work force.
Our International Pathway is comprised of ELL students shadow workers in a variety of occupations.Special Education students are served through the mainstreaming of RSP students into school-to-careerpathways. In addition, we work closely with such organizations as Bridge who facilitate the placement ofSpecial Education students into work environments with support of the student and employer.
Degree to Which Students Are Prepared to Enter Workforce
The Advanced Placement (AP) and International Baccalaureat (IB) programs give students an opportunity totake college-level courses and exams while still in high school. The table below shows the number of classesoffered and the enrollment in various AP and IB classes. the data for fine and performing arts includes APArt and AP Music, and the data for social Science includes IB Humanities.
Advanced Placement/International Baccalaureate Courses Offered
Pupils Enrolled in Courses Required for University of California (UC) and CaliforniaState University (CSU) AdmissionThe percentage of pupils enrolled in courses required for UC and/or CSU admission is calculated bydividing the total number of pupils in courses required for UC and/or UC admission (duplicated count) bythe total number of pupils in all courses (also a duplicated count) for the most recent year.
Graduates Who Have Passed Courses Required for University of California (UC)and California State University (CSU) AdmissionThe percentage of graduates is the number of graduates who have passed course requirements for UCand/or CSU admission divided by the school’s California Basic Educational Data System (CBEDS) totalgraduates for the most recent year.
4 , 8 5 6 6 9 . 6
Number of PupilsEnrolled in all Courses
(Grades 9-12)
Number of Pupils Enrolledin Courses Required
for UC and/or CSU Admission
Percentage of Pupils Enrolledin Courses Required
for UC and/or CSU Admission
3 , 3 8 0
1 9 8 3 6 . 4
Number of Graduates
Number of Graduates WhoHave Passed Course Requirements
for UC and/or CSU Admission
Percentage of Graduates WhoHave Passed Course Requirements
for UC and/or CSU Admission
7 2
SAT I Reasoning Test
Computer ScienceEnglishForeign LanguageMathematics
Subject
ScienceSocial Science
Fine and Performing Arts
Enrollment
291922
25
Number of Courses
111
1
Number of Classes
111
1
439HSBalboa HS
Percentage of Grade 12Enrollment taking testAverage Verbal Score
School District2001 2002 2003
State
Grade 12 Enrollment 191 158 183 3,568 3,704 4,151 357,789 365,907 385,181
2001 2002 2003 2001 2002 2003
Average Math Score
45.6 76.6 56.8 69.0 69.8 63.3 36.7 37.3 36.7
376 363 384 464 464 472 492 490 494
414 410 416 519 522 532 516 516 518
Students may voluntarily take the SAT test for college entrance. The test may or may not be available tostudents at a given school. Students may take the test more than once, but only the highest score is reported atthe year of graduation.
College Admission Test Preparation Course ProgramThe SFUSD administers previous editions of the PSAT and SAT to 10th grade and 11th grade studentsnot only as “practice tests” but also for the purpose of incorporating their individual item responses tothe test questions as part of their classroom learning experience.
In many SFUSD high schools there is a state funded program, the College Preparation PartnershipProgram (CPPP) established by Senate Bill 197. The purpose of this program is to provide preparationcourses for college admissions examinations. The funds are to be used to supplement, and not supplant,other funds available for preparation courses for college admission tests.This school participates in the CPPP program:
Any other test preparation offered by this school:
Through AACE TRIO program there is a SAT I and II prep class given to seniors in the fall semester.School to Career classes meet every Monday with Seniors and Juniors in order to prepare them forcollege. A porton of the class is dedicated to test preparation.
Yes No
Balboa HS
Enrollment and Program Completion in Career/Technical Education Programs(District Level)
Data are available from the Report of Career-Technical Education Enrollment and Program Completion forschool Year 2001/2002 (CDE 101 E-1). Data have been aggregated to the district level.
CTE Participants Secondary CTE Students Grade 12 CTE Students
TotalCourse
Enrollment
Numbero f
Concentrators
Numbero f
CompletersCompletion
Rate
Numbero f
Completers
NumberEarningDiploma
GraduationRate
13,425 1,160 187 16.12% 108 96 88.88%
Balboa HS
2/11/2004Printed 3/30/2004
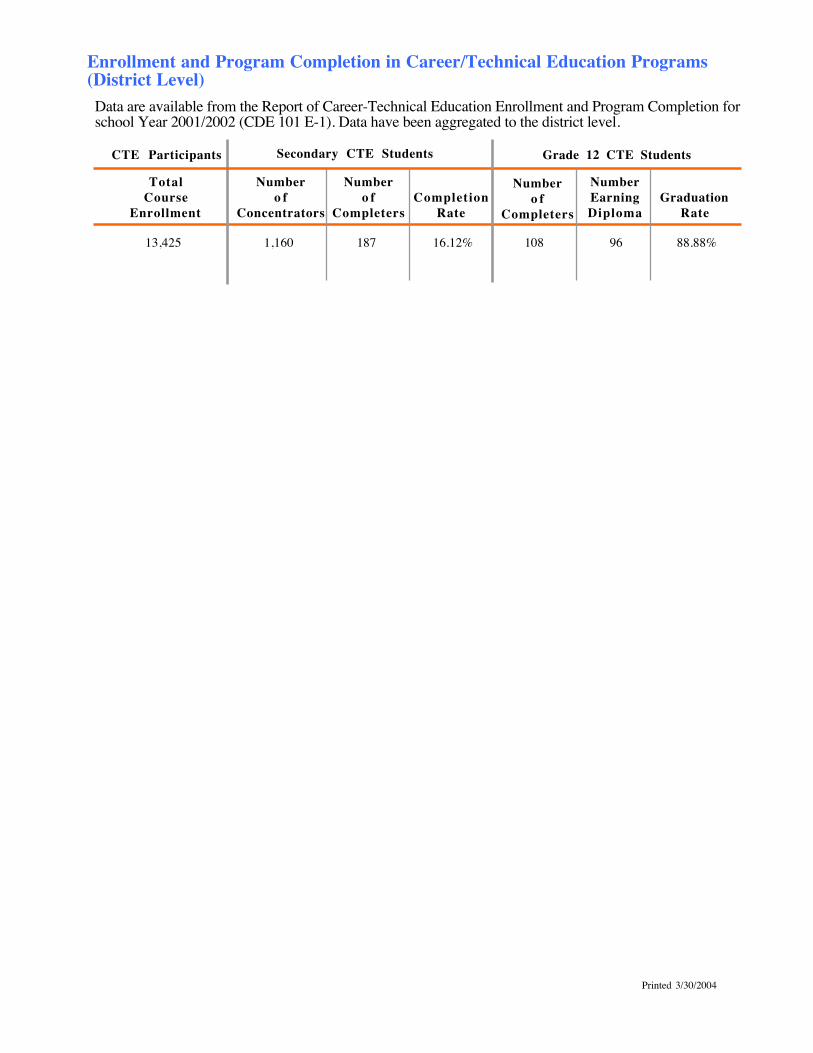
VIII. Post Secondary Preparation (secondary schools only)
How the school makes special efforts to help special student populations in their preparation to enter the work force.
How the school measures the success of its efforts to prepare students for the work force.
How the school's instructional programs foster the acquisition and growth of work readiness skills on the part of the school'sstudents.
All of Balboa’s Juniors and Seniors are enrolled in a Small Learning Community with a School-to-Careeremphasis which means that the core curriculum is presented in the context of the career theme, guestspeakers and field trips are geared to the thematic focus, mentors work with individual students andstudents participate in career-based internships during the Summer. At the Freshman and Sophomorelevels, the core curriculum is presented in the context of a service learning theme with career explorationunits that facilitate the development of work readiness skills.We have aggressively developed a culture of college attendance after high school as an essential step in thecareer development process.
We examine a variety of factors in the School-to-Career pathways, including student achievementindicators, attendance rates, dropout rates, etc.The number of participants in career interest surveys, internships, and field trips to work sites are alsoindicators of our preparation of our students for the work force.
Our International Pathway is comprised of ELL students shadow workers in a variety of occupations.Special Education students are served through the mainstreaming of RSP students into school-to-careerpathways. In addition, we work closely with such organizations as Bridge who facilitate the placement ofSpecial Education students into work environments with support of the student and employer.
Degree to Which Students Are Prepared to Enter Workforce
The Advanced Placement (AP) and International Baccalaureat (IB) programs give students an opportunity totake college-level courses and exams while still in high school. The table below shows the number of classesoffered and the enrollment in various AP and IB classes. the data for fine and performing arts includes APArt and AP Music, and the data for social Science includes IB Humanities.
Advanced Placement/International Baccalaureate Courses Offered
Pupils Enrolled in Courses Required for University of California (UC) and CaliforniaState University (CSU) AdmissionThe percentage of pupils enrolled in courses required for UC and/or CSU admission is calculated bydividing the total number of pupils in courses required for UC and/or UC admission (duplicated count) bythe total number of pupils in all courses (also a duplicated count) for the most recent year.
Graduates Who Have Passed Courses Required for University of California (UC)and California State University (CSU) AdmissionThe percentage of graduates is the number of graduates who have passed course requirements for UCand/or CSU admission divided by the school’s California Basic Educational Data System (CBEDS) totalgraduates for the most recent year.
4 , 8 5 6 6 9 . 6
Number of PupilsEnrolled in all Courses
(Grades 9-12)
Number of Pupils Enrolledin Courses Required
for UC and/or CSU Admission
Percentage of Pupils Enrolledin Courses Required
for UC and/or CSU Admission
3 , 3 8 0
1 9 8 3 6 . 4
Number of Graduates
Number of Graduates WhoHave Passed Course Requirements
for UC and/or CSU Admission
Percentage of Graduates WhoHave Passed Course Requirements
for UC and/or CSU Admission
7 2
SAT I Reasoning Test
Computer ScienceEnglishForeign LanguageMathematics
Subject
ScienceSocial Science
Fine and Performing Arts
Enrollment
291922
25
Number of Courses
111
1
Number of Classes
111
1
439HSBalboa HS
Percentage of Grade 12Enrollment taking testAverage Verbal Score
School District2001 2002 2003
State
Grade 12 Enrollment 191 158 183 3,568 3,704 4,151 357,789 365,907 385,181
2001 2002 2003 2001 2002 2003
Average Math Score
45.6 76.6 56.8 69.0 69.8 63.3 36.7 37.3 36.7
376 363 384 464 464 472 492 490 494
414 410 416 519 522 532 516 516 518
Students may voluntarily take the SAT test for college entrance. The test may or may not be available tostudents at a given school. Students may take the test more than once, but only the highest score is reported atthe year of graduation.
College Admission Test Preparation Course ProgramThe SFUSD administers previous editions of the PSAT and SAT to 10th grade and 11th grade studentsnot only as “practice tests” but also for the purpose of incorporating their individual item responses tothe test questions as part of their classroom learning experience.
In many SFUSD high schools there is a state funded program, the College Preparation PartnershipProgram (CPPP) established by Senate Bill 197. The purpose of this program is to provide preparationcourses for college admissions examinations. The funds are to be used to supplement, and not supplant,other funds available for preparation courses for college admission tests.This school participates in the CPPP program:
Any other test preparation offered by this school:
Through AACE TRIO program there is a SAT I and II prep class given to seniors in the fall semester.School to Career classes meet every Monday with Seniors and Juniors in order to prepare them forcollege. A porton of the class is dedicated to test preparation.
Yes No
Balboa HS
Enrollment and Program Completion in Career/Technical Education Programs(District Level)
Data are available from the Report of Career-Technical Education Enrollment and Program Completion forschool Year 2001/2002 (CDE 101 E-1). Data have been aggregated to the district level.
CTE Participants Secondary CTE Students Grade 12 CTE Students
TotalCourse
Enrollment
Numbero f
Concentrators
Numbero f
CompletersCompletion
Rate
Numbero f
Completers
NumberEarningDiploma
GraduationRate
13,425 1,160 187 16.12% 108 96 88.88%
Balboa HS
2/11/2004Printed 3/30/2004
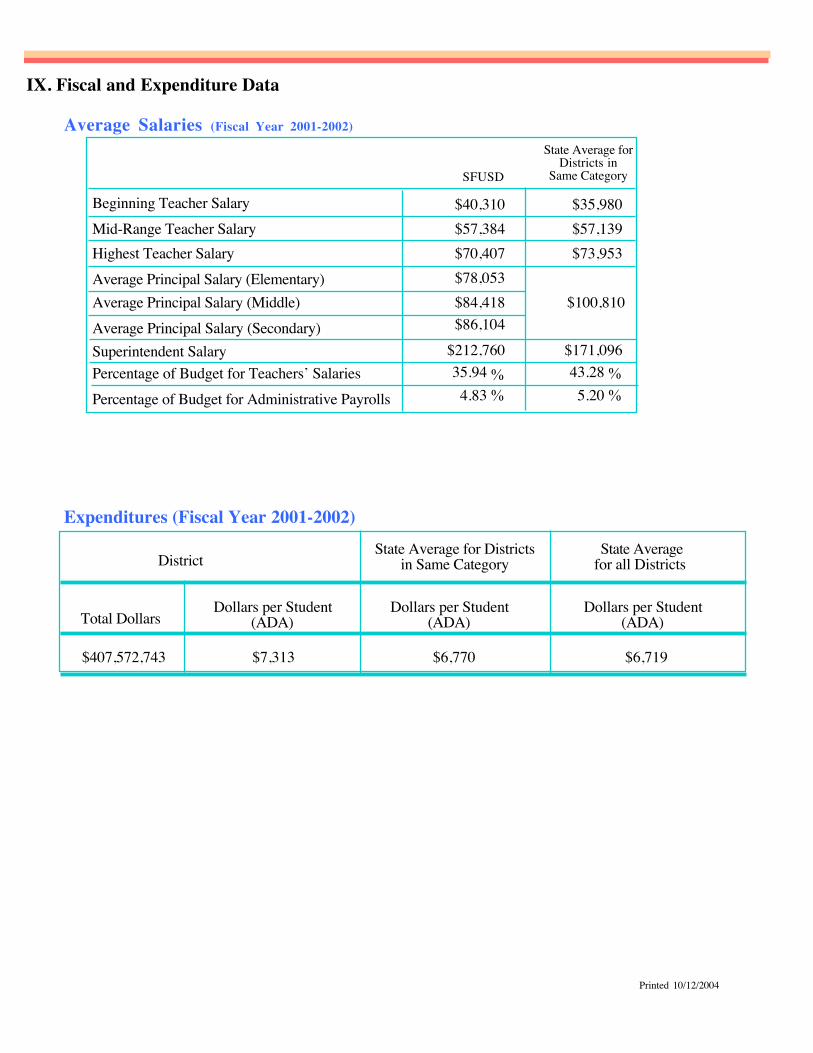
Expenditures (Fiscal Year 2001-2002)
Types of Services Funded
IX. Fiscal and Expenditure Data
District
Total DollarsDollars per Student
(ADA)
State Average for Districtsin Same Category
State Averagefor all Districts
Dollars per Student(ADA)
Dollars per Student(ADA)
$407,572,743 $7,313 $6,770 $6,719
Average Salaries (Fiscal Year 2001-2002)
$40,310 $35,980$57,384 $57,139
$212,760 $171,096$86,104$84,418$78,053
$100,810
$70,407 $73,953
State Average forDistricts in
Same CategorySFUSD
478
4.83 5.2035.94 43.28
Beginning Teacher SalaryMid-Range Teacher SalaryHighest Teacher SalaryAverage Principal Salary (Elementary)Average Principal Salary (Middle)Average Principal Salary (Secondary)Superintendent SalaryPercentage of Budget for Teachers’ SalariesPercentage of Budget for Administrative Payrolls
Beginning Teacher Support & Assessment (BTSA)Conflict Resolution ProgramHealthy StartIntern ProgramMathLand & Beyond
SLAP Grant, Foreign Language Assistance Program (Federal Grant)
%
%
%%
Clarendon ES
2/11/2004Printed 10/12/2004
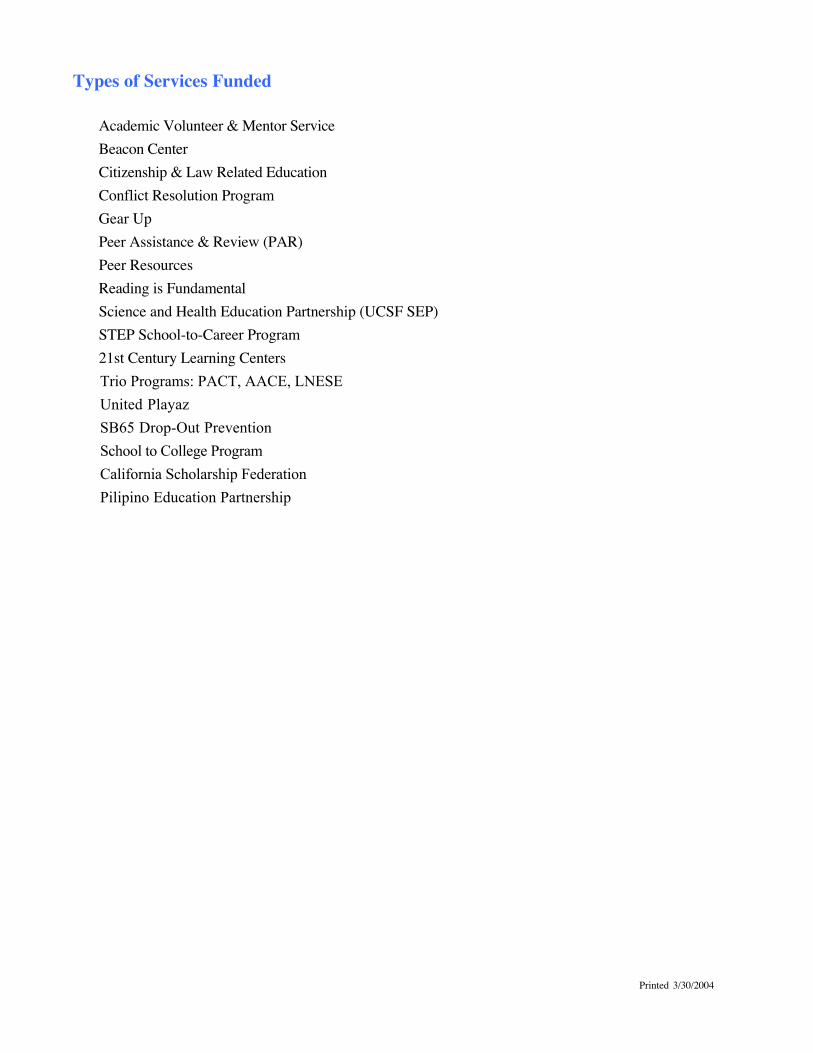
Expenditures (Fiscal Year 2000-2001)
Types of Services Funded
IX. Fiscal and Expenditure Data
District
Total DollarsDollars per Student
(ADA)
State Average for Districtsin Same Category
State Averagefor all Districts
Dollars per Student(ADA)
Dollars per Student(ADA)
$407,572,743 $7,313 $6,770 $6,719
Average Salaries (Fiscal Year 2000-2001)
$40,310 $35,980$57,384 $57,139
$212,760 $171,096$86,104$84,418$78,053
$100,810
$70,407 $73,953
State Average forDistricts in
Same CategorySFUSD
439
4.83 5.2035.94 43.28
Beginning Teacher SalaryMid-Range Teacher SalaryHighest Teacher SalaryAverage Principal Salary (Elementary)Average Principal Salary (Middle)Average Principal Salary (Secondary)Superintendent SalaryPercentage of Budget for Teachers’ SalariesPercentage of Budget for Administrative Payrolls
Academic Volunteer & Mentor ServiceBeacon CenterCitizenship & Law Related EducationConflict Resolution ProgramGear UpPeer Assistance & Review (PAR)Peer ResourcesReading is FundamentalScience and Health Education Partnership (UCSF SEP)STEP School-to-Career Program21st Century Learning Centers
Trio Programs: PACT, AACE, LNESE
United Playaz
SB65 Drop-Out Prevention
School to College Program
California Scholarship Federation
Pilipino Education Partnership
%
%
%%
2/11/2004Printed 3/30/2004


![Bids Fare Well: The Democratic Accountability of Business ... · 374 Imaged with the Permission of N.Y.U. School of Law. April 2003] ACCOUNTABILITY OF BUSINESS IMPROVEMENT DISTRICTS](https://img.pdfslide.net/doc/110x75/5f91918de7ffa62274064a4e/bids-fare-well-the-democratic-accountability-of-business-374-imaged-with-the.jpg)