Embed Size (px)
Citation preview
THE SCHOOL DISTRICT OF PAUL HOUCHENS DAVID W. CHRISTIANSEN, ED.D. PALM BEACH COUNTY, FL DIRECTOR DEPUTY SUPERINTENDENT/CHIEF OF SCHOOLS DEPARTMENT OF RESEARCH, EVALUATION, MARK HOWARD & STATE ASSESSMENTS CHIEF OF PERFORMANCE ACCOUNTABILITY 3300 FOREST HILL BLVD, SUITE B-246 WEST PALM BEACH, FL 33406 PHONE: 561-434-8469 FAX: 561-357-7608 WWW.PALMBEACHSCHOOLS.ORG/DRE/
_______ ______________________________________________________________________________________________ The School District of Palm Beach County
A Top-Rated District by the Florida Department of Education Since 2005 An Equal Education Opportunity Provider and Employer
EXECUTIVE SUMMARY July 31, 2017 TO: Principals FROM: David W. Christiansen, Ed.D., Deputy Superintendent/Chief of Schools Mark Howard, Chief, Performance Accountability SUBJECT: FY17 RESULTS OF THE PARENT & STUDENT VERSIONS OF THE SCHOOL EFFECTIVENESS
QUESTIONNAIRE (SEQ)
The District administered the School Effectiveness Questionnaire (SEQ) from January to February 2017. The SEQ measures perceptions regarding the effectiveness of our District schools.1 The SEQ provides important information to schools and the District to develop and sustain a Positive and Supportive School Climate, which is a central theme in the Strategic Plan. In addition, these results will inform the Strategic Initiative of Single School Culture 2.0 on systems for academics, behavior and climate within schools. The categories for the SEQ were developed from using factor analysis and a review of national school climate surveys.2 The categories in the parent version of the SEQ are: School Climate (16 items), Diverse Community (4 items), High Expectations (4 items), Individual Concerns (4 items), and Parental Involvement (9 items). The categories in the student version of the SEQ are: School Climate (19 items), Challenging Assignment (5 items), Diverse Community (3 items), Parental Involvement (6 items), Individual Concerns (5 items), and College Preparation (7 items), for middle school and high school students only. The following analysis and tables are provided for the Parent and Student SEQ for FY15 through FY17. Response rates for both Parent and Student versions are provided in Table 1. Tables 2 through 5 report the percent of positive Parent and Student responses overall and to each of the categories of the SEQ for the District and by School Level, respectively.
SEQ Response Rates from FY15 to FY17: • Parent response rates remained similar, but critically low for the District and at most schools
o Less than 20% of eligible parents provided feedback, therefore, caution should be used when interpreting results
o Rates were highest at Elementary (27%), followed by Middle (18%), then High schools (11%) o 18 Elementary, 10 Middle and 8 High schools had less than 10% parent participation
• Student response rates remained similar for the District at High schools, decreased in Elementary schools, while Middle school response rates increased by 4 percentage points.
1 There are two versions of the student SEQ, one for elementary and another for secondary levels. The student elementary version is administered
only to Grade 5 students. The student secondary version also exists in order to address levels of readability and for issues like college preparation. 2 Survey items that are highly inter-correlated or loaded more closely together are supposed to measure the same construct or conceptual category.
The average of these item responses composed a category score. This allows the categories to have statistical support. Category labels were taken from research literature related to the structure of school climate.
Page 2 of 16 EXECUTIVE SUMMARY: Results of the Parent and Student School Effectiveness Questionnaire July 31, 2017
_______ ______________________________________________________________________________________________ The School District of Palm Beach County
A Top-Rated District by the Florida Department of Education Since 2005 An Equal Education Opportunity Provider and Employer
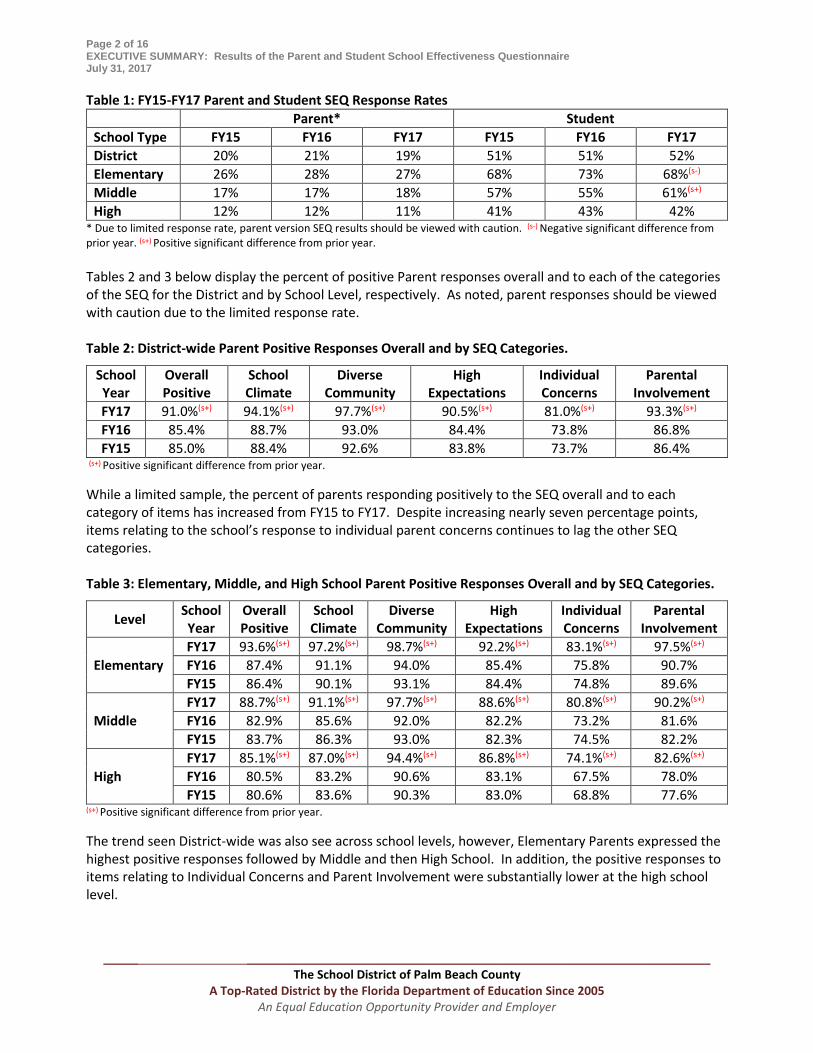
Table 1: FY15-FY17 Parent and Student SEQ Response Rates Parent* Student School Type FY15 FY16 FY17 FY15 FY16 FY17 District 20% 21% 19% 51% 51% 52% Elementary 26% 28% 27% 68% 73% 68%(s-) Middle 17% 17% 18% 57% 55% 61%(s+) High 12% 12% 11% 41% 43% 42%
* Due to limited response rate, parent version SEQ results should be viewed with caution. (s-) Negative significant difference from prior year. (s+) Positive significant difference from prior year. Tables 2 and 3 below display the percent of positive Parent responses overall and to each of the categories of the SEQ for the District and by School Level, respectively. As noted, parent responses should be viewed with caution due to the limited response rate. Table 2: District-wide Parent Positive Responses Overall and by SEQ Categories.
School Year
Overall Positive
School Climate
Diverse Community
High Expectations
Individual Concerns
Parental Involvement
FY17 91.0%(s+) 94.1%(s+) 97.7%(s+) 90.5%(s+) 81.0%(s+) 93.3%(s+) FY16 85.4% 88.7% 93.0% 84.4% 73.8% 86.8% FY15 85.0% 88.4% 92.6% 83.8% 73.7% 86.4%
(s+) Positive significant difference from prior year. While a limited sample, the percent of parents responding positively to the SEQ overall and to each category of items has increased from FY15 to FY17. Despite increasing nearly seven percentage points, items relating to the school’s response to individual parent concerns continues to lag the other SEQ categories. Table 3: Elementary, Middle, and High School Parent Positive Responses Overall and by SEQ Categories.
Level School Year
Overall Positive
School Climate
Diverse Community
High Expectations
Individual Concerns
Parental Involvement
Elementary FY17 93.6%(s+) 97.2%(s+) 98.7%(s+) 92.2%(s+) 83.1%(s+) 97.5%(s+) FY16 87.4% 91.1% 94.0% 85.4% 75.8% 90.7% FY15 86.4% 90.1% 93.1% 84.4% 74.8% 89.6%
Middle FY17 88.7%(s+) 91.1%(s+) 97.7%(s+) 88.6%(s+) 80.8%(s+) 90.2%(s+) FY16 82.9% 85.6% 92.0% 82.2% 73.2% 81.6% FY15 83.7% 86.3% 93.0% 82.3% 74.5% 82.2%
High FY17 85.1%(s+) 87.0%(s+) 94.4%(s+) 86.8%(s+) 74.1%(s+) 82.6%(s+) FY16 80.5% 83.2% 90.6% 83.1% 67.5% 78.0% FY15 80.6% 83.6% 90.3% 83.0% 68.8% 77.6%
(s+) Positive significant difference from prior year. The trend seen District-wide was also see across school levels, however, Elementary Parents expressed the highest positive responses followed by Middle and then High School. In addition, the positive responses to items relating to Individual Concerns and Parent Involvement were substantially lower at the high school level.
Page 3 of 16 EXECUTIVE SUMMARY: Results of the Parent and Student School Effectiveness Questionnaire July 31, 2017
_______ ______________________________________________________________________________________________ The School District of Palm Beach County
A Top-Rated District by the Florida Department of Education Since 2005 An Equal Education Opportunity Provider and Employer
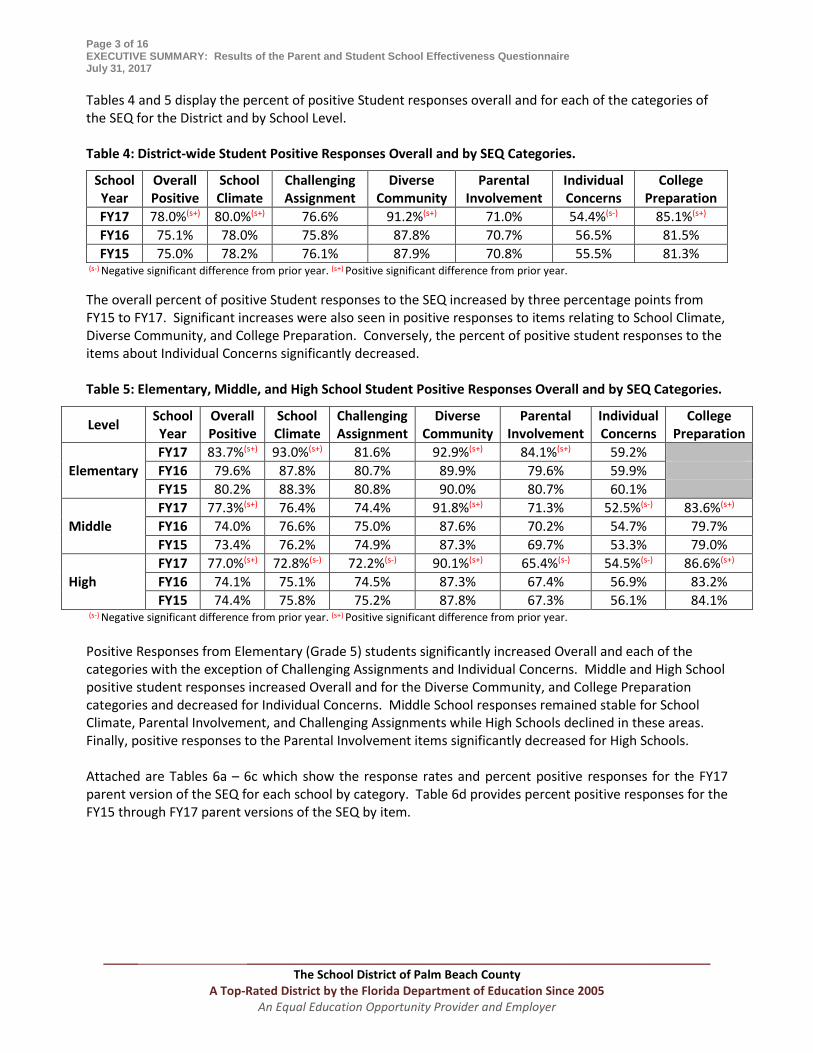
Tables 4 and 5 display the percent of positive Student responses overall and for each of the categories of the SEQ for the District and by School Level. Table 4: District-wide Student Positive Responses Overall and by SEQ Categories.
School Year
Overall Positive
School Climate
Challenging Assignment
Diverse Community
Parental Involvement
Individual Concerns
College Preparation
FY17 78.0%(s+) 80.0%(s+) 76.6% 91.2%(s+) 71.0% 54.4%(s-) 85.1%(s+) FY16 75.1% 78.0% 75.8% 87.8% 70.7% 56.5% 81.5% FY15 75.0% 78.2% 76.1% 87.9% 70.8% 55.5% 81.3%
(s-) Negative significant difference from prior year. (s+) Positive significant difference from prior year. The overall percent of positive Student responses to the SEQ increased by three percentage points from FY15 to FY17. Significant increases were also seen in positive responses to items relating to School Climate, Diverse Community, and College Preparation. Conversely, the percent of positive student responses to the items about Individual Concerns significantly decreased. Table 5: Elementary, Middle, and High School Student Positive Responses Overall and by SEQ Categories.
Level School Year
Overall Positive
School Climate
Challenging Assignment
Diverse Community
Parental Involvement
Individual Concerns
College Preparation
Elementary FY17 83.7%(s+) 93.0%(s+) 81.6% 92.9%(s+) 84.1%(s+) 59.2% FY16 79.6% 87.8% 80.7% 89.9% 79.6% 59.9% FY15 80.2% 88.3% 80.8% 90.0% 80.7% 60.1%
Middle FY17 77.3%(s+) 76.4% 74.4% 91.8%(s+) 71.3% 52.5%(s-) 83.6%(s+) FY16 74.0% 76.6% 75.0% 87.6% 70.2% 54.7% 79.7% FY15 73.4% 76.2% 74.9% 87.3% 69.7% 53.3% 79.0%
High FY17 77.0%(s+) 72.8%(s-) 72.2%(s-) 90.1%(s+) 65.4%(s-) 54.5%(s-) 86.6%(s+) FY16 74.1% 75.1% 74.5% 87.3% 67.4% 56.9% 83.2% FY15 74.4% 75.8% 75.2% 87.8% 67.3% 56.1% 84.1%
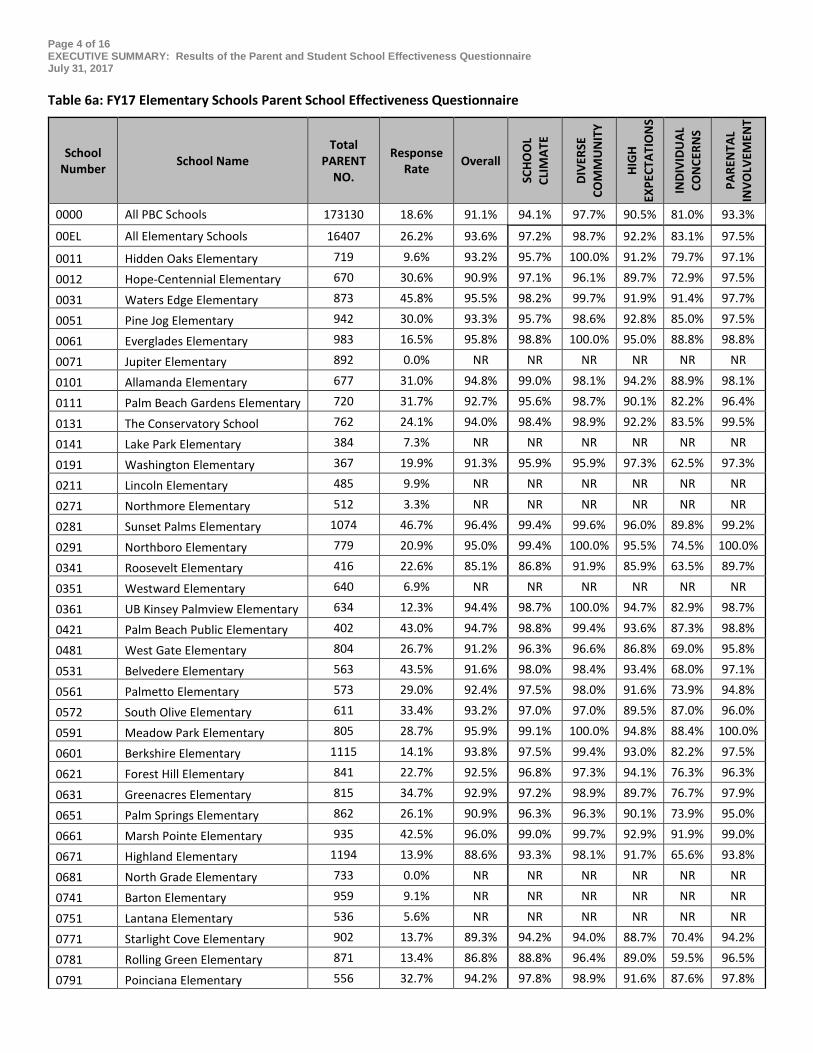
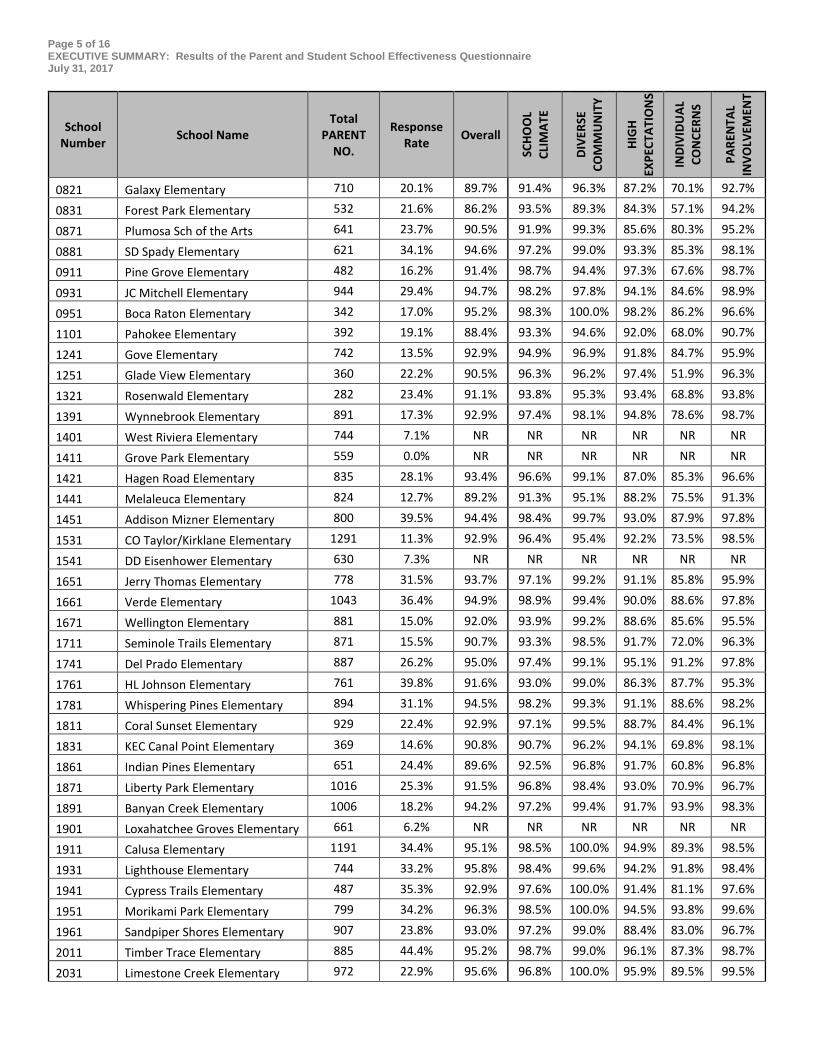
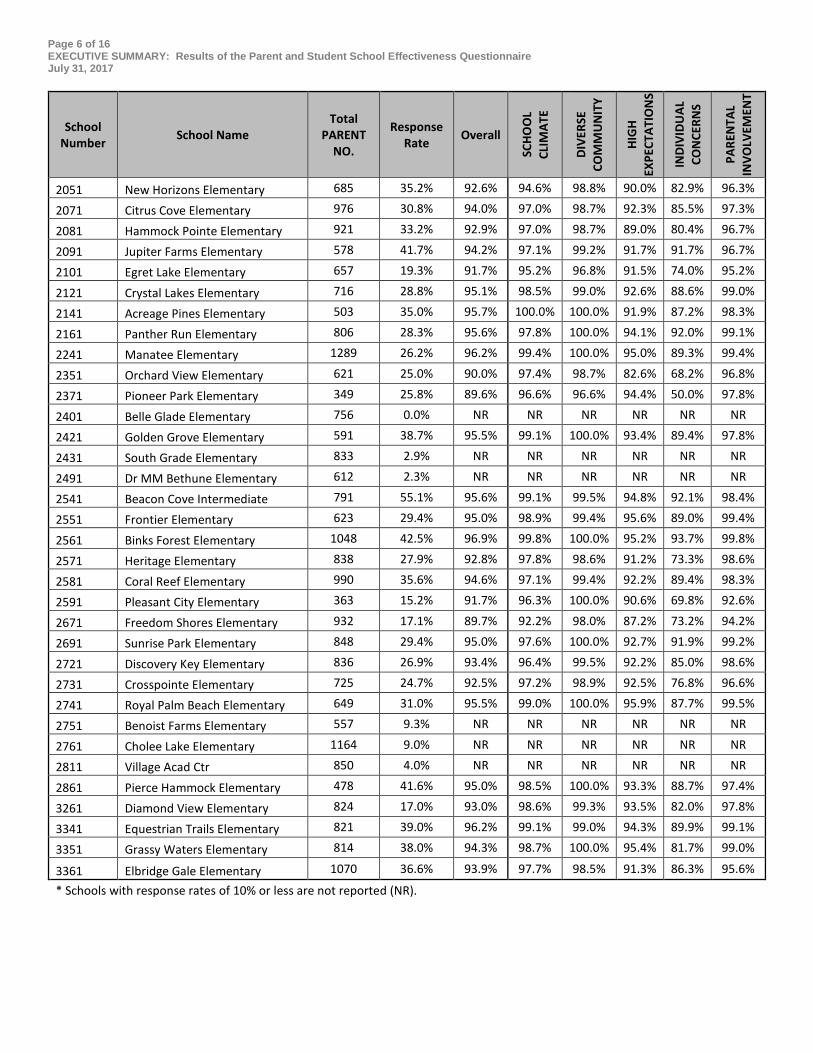
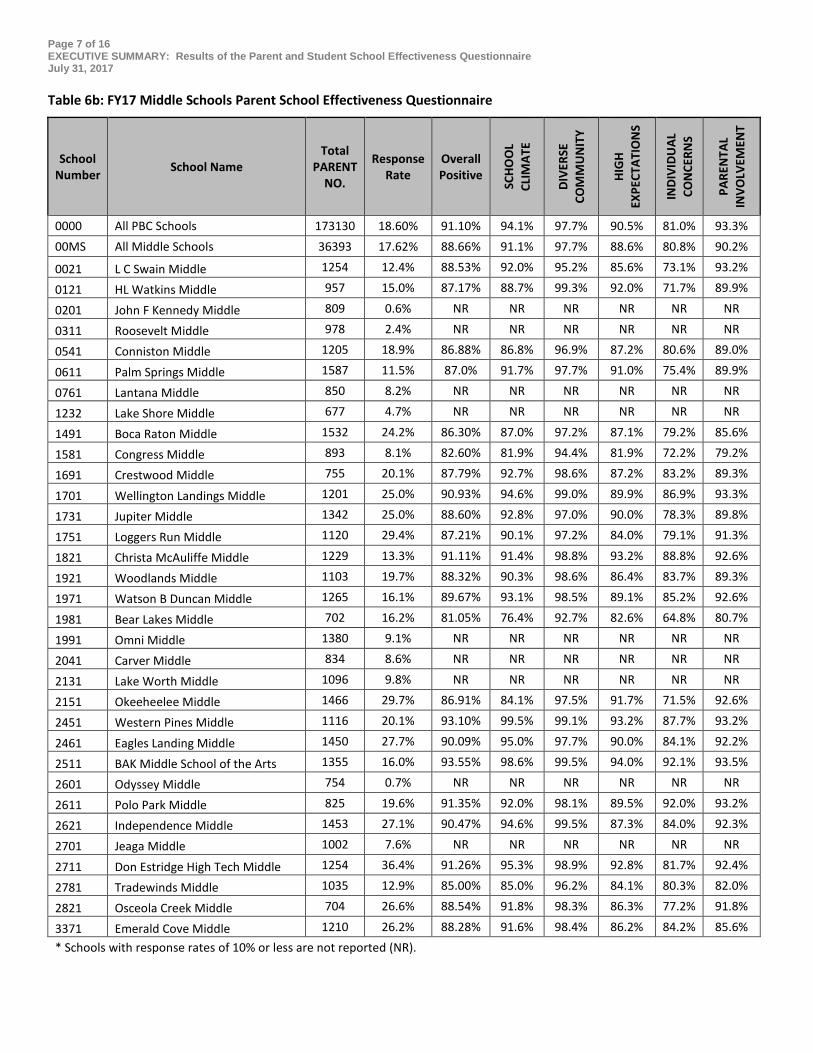
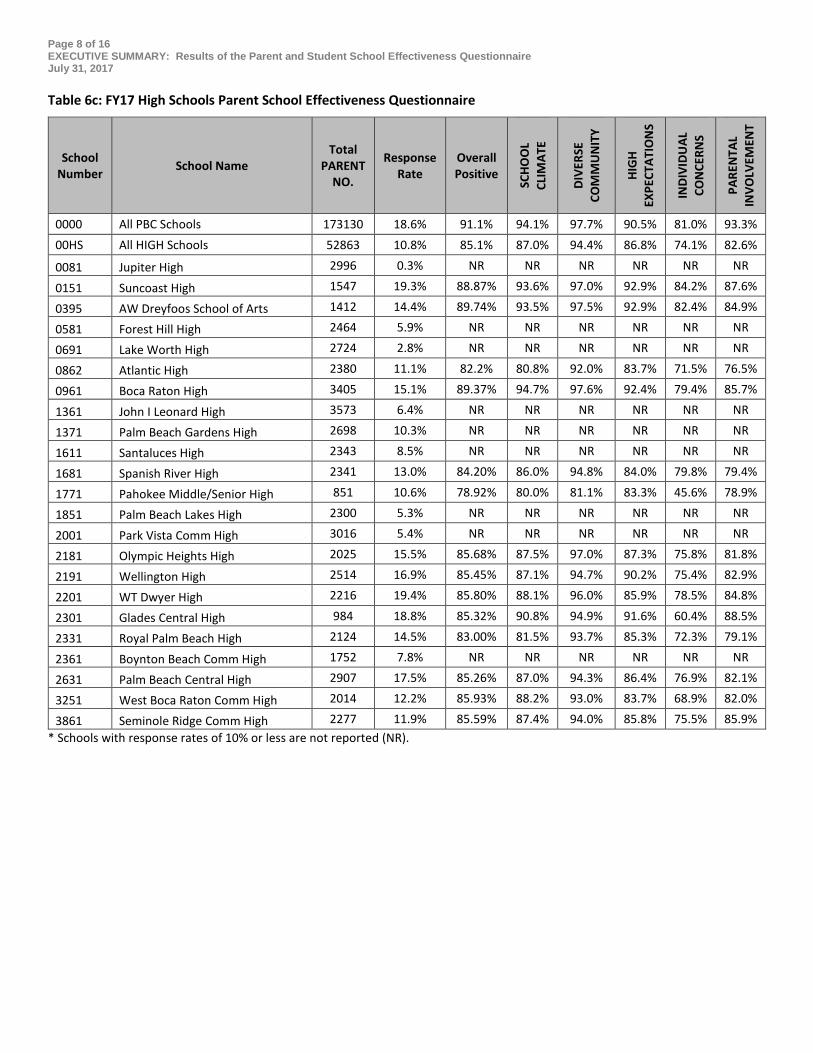
(s-) Negative significant difference from prior year. (s+) Positive significant difference from prior year. Positive Responses from Elementary (Grade 5) students significantly increased Overall and each of the categories with the exception of Challenging Assignments and Individual Concerns. Middle and High School positive student responses increased Overall and for the Diverse Community, and College Preparation categories and decreased for Individual Concerns. Middle School responses remained stable for School Climate, Parental Involvement, and Challenging Assignments while High Schools declined in these areas. Finally, positive responses to the Parental Involvement items significantly decreased for High Schools. Attached are Tables 6a – 6c which show the response rates and percent positive responses for the FY17 parent version of the SEQ for each school by category. Table 6d provides percent positive responses for the FY15 through FY17 parent versions of the SEQ by item.
Page 4 of 16 EXECUTIVE SUMMARY: Results of the Parent and Student School Effectiveness Questionnaire July 31, 2017
_______ ______________________________________________________________________________________________ The School District of Palm Beach County
A Top-Rated District by the Florida Department of Education Since 2005 An Equal Education Opportunity Provider and Employer
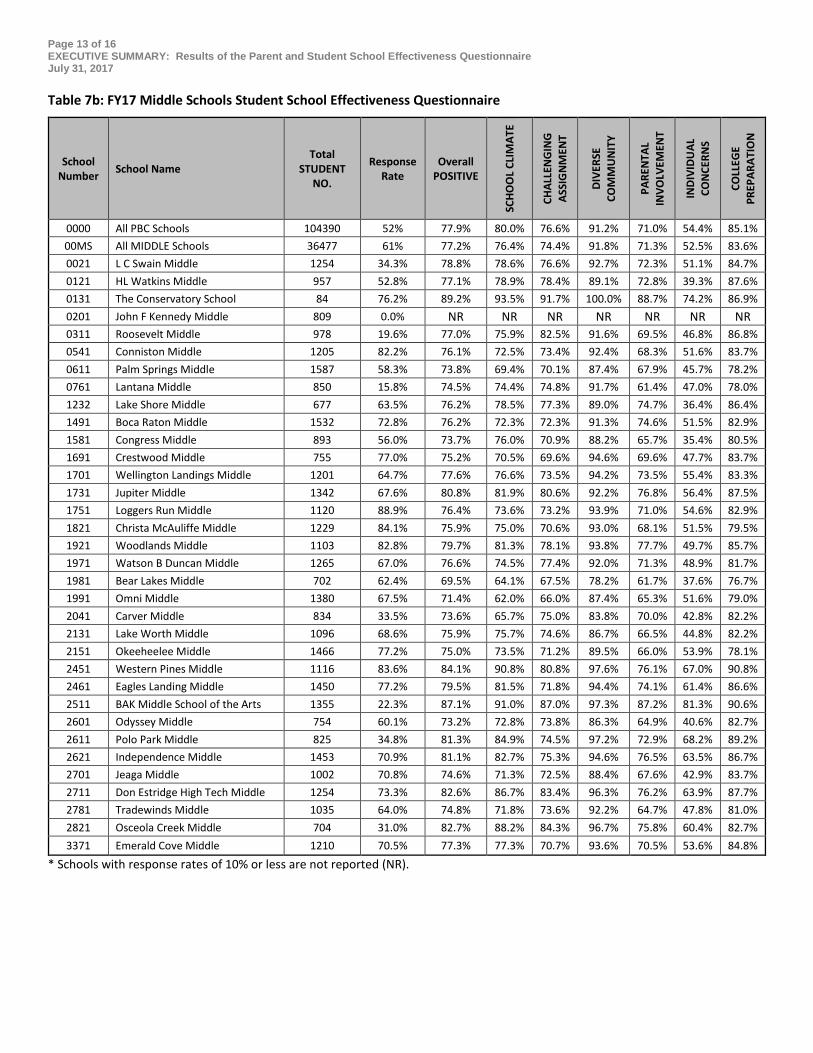
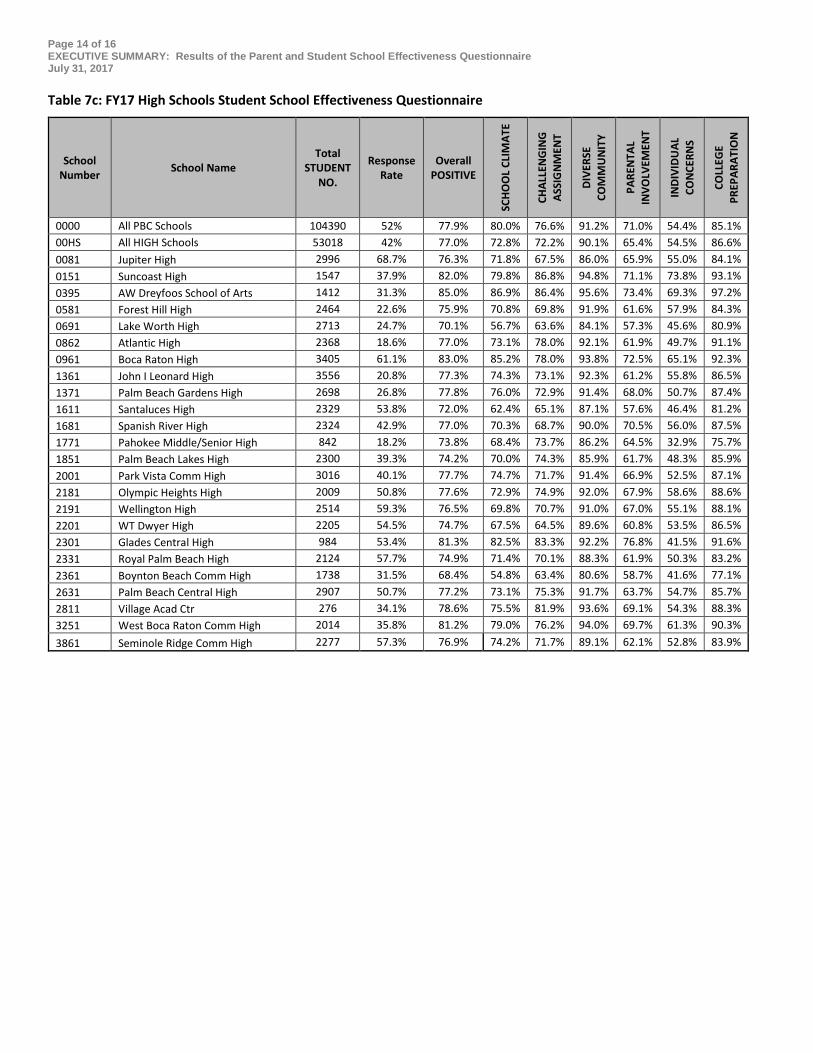
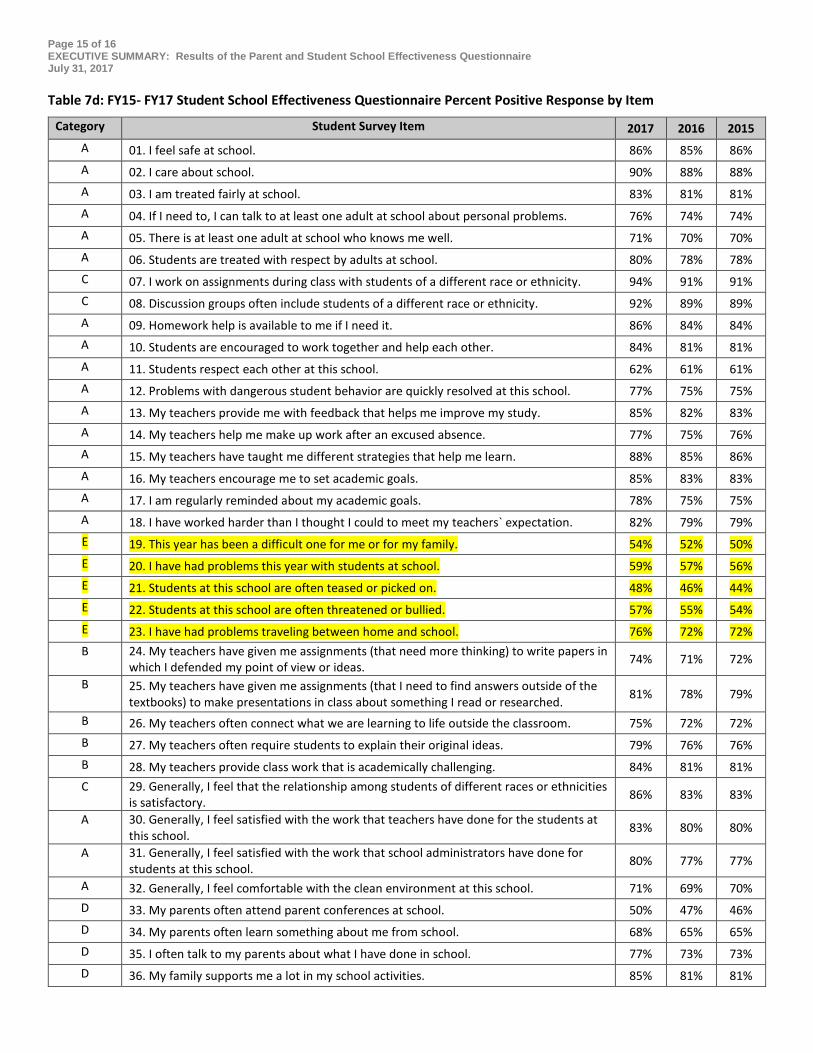
Attached are Tables 7a – 7c which show the response rates and percent positive results for the FY17 student version of the SEQ for each school by category. Table 7d provides percent positive responses for the FY15 through FY17 student versions of the SEQ by item. To access the District summary and school level reports, please use this link: https://www.palmbeachschools.org/dre/seq/ For questions about the SEQ results, please contact Mark Howard, Chief, Performance Accountability (434-8781). For questions about school performance, please contact the Regional or Instructional Superintendent. For more information about District initiatives to support culture and climate, please contact Keith Oswald, Chief Academic Officer (649-6805). RMA/DWC/KO/MH/PH/RP/wl Attachments
Page 4 of 16 EXECUTIVE SUMMARY: Results of the Parent and Student School Effectiveness Questionnaire July 31, 2017
Table 6a: FY17 Elementary Schools Parent School Effectiveness Questionnaire
School Number School Name
Total PARENT
NO.
Response Rate Overall
SCHO
OL
CLIM
ATE
DIVE
RSE
COM
MU
NIT
Y
HIG
H EX
PECT
ATIO
NS
INDI
VIDU
AL
CON
CERN
S
PARE
NTA
L IN
VOLV
EMEN
T
0000 All PBC Schools 173130 18.6% 91.1% 94.1% 97.7% 90.5% 81.0% 93.3%
00EL All Elementary Schools 16407 26.2% 93.6% 97.2% 98.7% 92.2% 83.1% 97.5%
0011 Hidden Oaks Elementary 719 9.6% 93.2% 95.7% 100.0% 91.2% 79.7% 97.1%
0012 Hope-Centennial Elementary 670 30.6% 90.9% 97.1% 96.1% 89.7% 72.9% 97.5%
0031 Waters Edge Elementary 873 45.8% 95.5% 98.2% 99.7% 91.9% 91.4% 97.7%
0051 Pine Jog Elementary 942 30.0% 93.3% 95.7% 98.6% 92.8% 85.0% 97.5%
0061 Everglades Elementary 983 16.5% 95.8% 98.8% 100.0% 95.0% 88.8% 98.8%
0071 Jupiter Elementary 892 0.0% NR NR NR NR NR NR
0101 Allamanda Elementary 677 31.0% 94.8% 99.0% 98.1% 94.2% 88.9% 98.1%
0111 Palm Beach Gardens Elementary 720 31.7% 92.7% 95.6% 98.7% 90.1% 82.2% 96.4%
0131 The Conservatory School 762 24.1% 94.0% 98.4% 98.9% 92.2% 83.5% 99.5%
0141 Lake Park Elementary 384 7.3% NR NR NR NR NR NR
0191 Washington Elementary 367 19.9% 91.3% 95.9% 95.9% 97.3% 62.5% 97.3%
0211 Lincoln Elementary 485 9.9% NR NR NR NR NR NR
0271 Northmore Elementary 512 3.3% NR NR NR NR NR NR
0281 Sunset Palms Elementary 1074 46.7% 96.4% 99.4% 99.6% 96.0% 89.8% 99.2%
0291 Northboro Elementary 779 20.9% 95.0% 99.4% 100.0% 95.5% 74.5% 100.0%
0341 Roosevelt Elementary 416 22.6% 85.1% 86.8% 91.9% 85.9% 63.5% 89.7%
0351 Westward Elementary 640 6.9% NR NR NR NR NR NR
0361 UB Kinsey Palmview Elementary 634 12.3% 94.4% 98.7% 100.0% 94.7% 82.9% 98.7%
0421 Palm Beach Public Elementary 402 43.0% 94.7% 98.8% 99.4% 93.6% 87.3% 98.8%
0481 West Gate Elementary 804 26.7% 91.2% 96.3% 96.6% 86.8% 69.0% 95.8%
0531 Belvedere Elementary 563 43.5% 91.6% 98.0% 98.4% 93.4% 68.0% 97.1%
0561 Palmetto Elementary 573 29.0% 92.4% 97.5% 98.0% 91.6% 73.9% 94.8%
0572 South Olive Elementary 611 33.4% 93.2% 97.0% 97.0% 89.5% 87.0% 96.0%
0591 Meadow Park Elementary 805 28.7% 95.9% 99.1% 100.0% 94.8% 88.4% 100.0%
0601 Berkshire Elementary 1115 14.1% 93.8% 97.5% 99.4% 93.0% 82.2% 97.5%
0621 Forest Hill Elementary 841 22.7% 92.5% 96.8% 97.3% 94.1% 76.3% 96.3%
0631 Greenacres Elementary 815 34.7% 92.9% 97.2% 98.9% 89.7% 76.7% 97.9%
0651 Palm Springs Elementary 862 26.1% 90.9% 96.3% 96.3% 90.1% 73.9% 95.0%
0661 Marsh Pointe Elementary 935 42.5% 96.0% 99.0% 99.7% 92.9% 91.9% 99.0%
0671 Highland Elementary 1194 13.9% 88.6% 93.3% 98.1% 91.7% 65.6% 93.8%
0681 North Grade Elementary 733 0.0% NR NR NR NR NR NR
0741 Barton Elementary 959 9.1% NR NR NR NR NR NR
0751 Lantana Elementary 536 5.6% NR NR NR NR NR NR
0771 Starlight Cove Elementary 902 13.7% 89.3% 94.2% 94.0% 88.7% 70.4% 94.2%
0781 Rolling Green Elementary 871 13.4% 86.8% 88.8% 96.4% 89.0% 59.5% 96.5%
0791 Poinciana Elementary 556 32.7% 94.2% 97.8% 98.9% 91.6% 87.6% 97.8%
Page 5 of 16 EXECUTIVE SUMMARY: Results of the Parent and Student School Effectiveness Questionnaire July 31, 2017
School Number School Name
Total PARENT
NO.
Response Rate Overall
SCHO
OL
CLIM
ATE
DIVE
RSE
COM
MU
NIT
Y
HIG
H EX
PECT
ATIO
NS
INDI
VIDU
AL
CON
CERN
S
PARE
NTA
L IN
VOLV
EMEN
T
0821 Galaxy Elementary 710 20.1% 89.7% 91.4% 96.3% 87.2% 70.1% 92.7%
0831 Forest Park Elementary 532 21.6% 86.2% 93.5% 89.3% 84.3% 57.1% 94.2%
0871 Plumosa Sch of the Arts 641 23.7% 90.5% 91.9% 99.3% 85.6% 80.3% 95.2%
0881 SD Spady Elementary 621 34.1% 94.6% 97.2% 99.0% 93.3% 85.3% 98.1%
0911 Pine Grove Elementary 482 16.2% 91.4% 98.7% 94.4% 97.3% 67.6% 98.7%
0931 JC Mitchell Elementary 944 29.4% 94.7% 98.2% 97.8% 94.1% 84.6% 98.9%
0951 Boca Raton Elementary 342 17.0% 95.2% 98.3% 100.0% 98.2% 86.2% 96.6%
1101 Pahokee Elementary 392 19.1% 88.4% 93.3% 94.6% 92.0% 68.0% 90.7%
1241 Gove Elementary 742 13.5% 92.9% 94.9% 96.9% 91.8% 84.7% 95.9%
1251 Glade View Elementary 360 22.2% 90.5% 96.3% 96.2% 97.4% 51.9% 96.3%
1321 Rosenwald Elementary 282 23.4% 91.1% 93.8% 95.3% 93.4% 68.8% 93.8%
1391 Wynnebrook Elementary 891 17.3% 92.9% 97.4% 98.1% 94.8% 78.6% 98.7%
1401 West Riviera Elementary 744 7.1% NR NR NR NR NR NR
1411 Grove Park Elementary 559 0.0% NR NR NR NR NR NR
1421 Hagen Road Elementary 835 28.1% 93.4% 96.6% 99.1% 87.0% 85.3% 96.6%
1441 Melaleuca Elementary 824 12.7% 89.2% 91.3% 95.1% 88.2% 75.5% 91.3%
1451 Addison Mizner Elementary 800 39.5% 94.4% 98.4% 99.7% 93.0% 87.9% 97.8%
1531 CO Taylor/Kirklane Elementary 1291 11.3% 92.9% 96.4% 95.4% 92.2% 73.5% 98.5%
1541 DD Eisenhower Elementary 630 7.3% NR NR NR NR NR NR
1651 Jerry Thomas Elementary 778 31.5% 93.7% 97.1% 99.2% 91.1% 85.8% 95.9%
1661 Verde Elementary 1043 36.4% 94.9% 98.9% 99.4% 90.0% 88.6% 97.8%
1671 Wellington Elementary 881 15.0% 92.0% 93.9% 99.2% 88.6% 85.6% 95.5%
1711 Seminole Trails Elementary 871 15.5% 90.7% 93.3% 98.5% 91.7% 72.0% 96.3%
1741 Del Prado Elementary 887 26.2% 95.0% 97.4% 99.1% 95.1% 91.2% 97.8%
1761 HL Johnson Elementary 761 39.8% 91.6% 93.0% 99.0% 86.3% 87.7% 95.3%
1781 Whispering Pines Elementary 894 31.1% 94.5% 98.2% 99.3% 91.1% 88.6% 98.2%
1811 Coral Sunset Elementary 929 22.4% 92.9% 97.1% 99.5% 88.7% 84.4% 96.1%
1831 KEC Canal Point Elementary 369 14.6% 90.8% 90.7% 96.2% 94.1% 69.8% 98.1%
1861 Indian Pines Elementary 651 24.4% 89.6% 92.5% 96.8% 91.7% 60.8% 96.8%
1871 Liberty Park Elementary 1016 25.3% 91.5% 96.8% 98.4% 93.0% 70.9% 96.7%
1891 Banyan Creek Elementary 1006 18.2% 94.2% 97.2% 99.4% 91.7% 93.9% 98.3%
1901 Loxahatchee Groves Elementary 661 6.2% NR NR NR NR NR NR
1911 Calusa Elementary 1191 34.4% 95.1% 98.5% 100.0% 94.9% 89.3% 98.5%
1931 Lighthouse Elementary 744 33.2% 95.8% 98.4% 99.6% 94.2% 91.8% 98.4%
1941 Cypress Trails Elementary 487 35.3% 92.9% 97.6% 100.0% 91.4% 81.1% 97.6%
1951 Morikami Park Elementary 799 34.2% 96.3% 98.5% 100.0% 94.5% 93.8% 99.6%
1961 Sandpiper Shores Elementary 907 23.8% 93.0% 97.2% 99.0% 88.4% 83.0% 96.7%
2011 Timber Trace Elementary 885 44.4% 95.2% 98.7% 99.0% 96.1% 87.3% 98.7%
2031 Limestone Creek Elementary 972 22.9% 95.6% 96.8% 100.0% 95.9% 89.5% 99.5%
Page 6 of 16 EXECUTIVE SUMMARY: Results of the Parent and Student School Effectiveness Questionnaire July 31, 2017
School Number School Name
Total PARENT
NO.
Response Rate Overall
SCHO
OL
CLIM
ATE
DIVE
RSE
COM
MU
NIT
Y
HIG
H EX
PECT
ATIO
NS
INDI
VIDU
AL
CON
CERN
S
PARE
NTA
L IN
VOLV
EMEN
T
2051 New Horizons Elementary 685 35.2% 92.6% 94.6% 98.8% 90.0% 82.9% 96.3%
2071 Citrus Cove Elementary 976 30.8% 94.0% 97.0% 98.7% 92.3% 85.5% 97.3%
2081 Hammock Pointe Elementary 921 33.2% 92.9% 97.0% 98.7% 89.0% 80.4% 96.7%
2091 Jupiter Farms Elementary 578 41.7% 94.2% 97.1% 99.2% 91.7% 91.7% 96.7%
2101 Egret Lake Elementary 657 19.3% 91.7% 95.2% 96.8% 91.5% 74.0% 95.2%
2121 Crystal Lakes Elementary 716 28.8% 95.1% 98.5% 99.0% 92.6% 88.6% 99.0%
2141 Acreage Pines Elementary 503 35.0% 95.7% 100.0% 100.0% 91.9% 87.2% 98.3%
2161 Panther Run Elementary 806 28.3% 95.6% 97.8% 100.0% 94.1% 92.0% 99.1%
2241 Manatee Elementary 1289 26.2% 96.2% 99.4% 100.0% 95.0% 89.3% 99.4%
2351 Orchard View Elementary 621 25.0% 90.0% 97.4% 98.7% 82.6% 68.2% 96.8%
2371 Pioneer Park Elementary 349 25.8% 89.6% 96.6% 96.6% 94.4% 50.0% 97.8%
2401 Belle Glade Elementary 756 0.0% NR NR NR NR NR NR
2421 Golden Grove Elementary 591 38.7% 95.5% 99.1% 100.0% 93.4% 89.4% 97.8%
2431 South Grade Elementary 833 2.9% NR NR NR NR NR NR
2491 Dr MM Bethune Elementary 612 2.3% NR NR NR NR NR NR
2541 Beacon Cove Intermediate 791 55.1% 95.6% 99.1% 99.5% 94.8% 92.1% 98.4%
2551 Frontier Elementary 623 29.4% 95.0% 98.9% 99.4% 95.6% 89.0% 99.4%
2561 Binks Forest Elementary 1048 42.5% 96.9% 99.8% 100.0% 95.2% 93.7% 99.8%
2571 Heritage Elementary 838 27.9% 92.8% 97.8% 98.6% 91.2% 73.3% 98.6%
2581 Coral Reef Elementary 990 35.6% 94.6% 97.1% 99.4% 92.2% 89.4% 98.3%
2591 Pleasant City Elementary 363 15.2% 91.7% 96.3% 100.0% 90.6% 69.8% 92.6%
2671 Freedom Shores Elementary 932 17.1% 89.7% 92.2% 98.0% 87.2% 73.2% 94.2%
2691 Sunrise Park Elementary 848 29.4% 95.0% 97.6% 100.0% 92.7% 91.9% 99.2%
2721 Discovery Key Elementary 836 26.9% 93.4% 96.4% 99.5% 92.2% 85.0% 98.6%
2731 Crosspointe Elementary 725 24.7% 92.5% 97.2% 98.9% 92.5% 76.8% 96.6%
2741 Royal Palm Beach Elementary 649 31.0% 95.5% 99.0% 100.0% 95.9% 87.7% 99.5%
2751 Benoist Farms Elementary 557 9.3% NR NR NR NR NR NR
2761 Cholee Lake Elementary 1164 9.0% NR NR NR NR NR NR
2811 Village Acad Ctr 850 4.0% NR NR NR NR NR NR
2861 Pierce Hammock Elementary 478 41.6% 95.0% 98.5% 100.0% 93.3% 88.7% 97.4%
3261 Diamond View Elementary 824 17.0% 93.0% 98.6% 99.3% 93.5% 82.0% 97.8%
3341 Equestrian Trails Elementary 821 39.0% 96.2% 99.1% 99.0% 94.3% 89.9% 99.1%
3351 Grassy Waters Elementary 814 38.0% 94.3% 98.7% 100.0% 95.4% 81.7% 99.0%
3361 Elbridge Gale Elementary 1070 36.6% 93.9% 97.7% 98.5% 91.3% 86.3% 95.6%
* Schools with response rates of 10% or less are not reported (NR).
Page 7 of 16 EXECUTIVE SUMMARY: Results of the Parent and Student School Effectiveness Questionnaire July 31, 2017
Table 6b: FY17 Middle Schools Parent School Effectiveness Questionnaire
School Number School Name
Total PARENT
NO.
Response Rate
Overall Positive
SCHO
OL
CLIM
ATE
DIVE
RSE
COM
MU
NIT
Y
HIG
H EX
PECT
ATIO
NS
INDI
VIDU
AL
CON
CERN
S
PARE
NTA
L IN
VOLV
EMEN
T
0000 All PBC Schools 173130 18.60% 91.10% 94.1% 97.7% 90.5% 81.0% 93.3% 00MS All Middle Schools 36393 17.62% 88.66% 91.1% 97.7% 88.6% 80.8% 90.2%
0021 L C Swain Middle 1254 12.4% 88.53% 92.0% 95.2% 85.6% 73.1% 93.2%
0121 HL Watkins Middle 957 15.0% 87.17% 88.7% 99.3% 92.0% 71.7% 89.9%
0201 John F Kennedy Middle 809 0.6% NR NR NR NR NR NR
0311 Roosevelt Middle 978 2.4% NR NR NR NR NR NR
0541 Conniston Middle 1205 18.9% 86.88% 86.8% 96.9% 87.2% 80.6% 89.0%
0611 Palm Springs Middle 1587 11.5% 87.0% 91.7% 97.7% 91.0% 75.4% 89.9%
0761 Lantana Middle 850 8.2% NR NR NR NR NR NR
1232 Lake Shore Middle 677 4.7% NR NR NR NR NR NR
1491 Boca Raton Middle 1532 24.2% 86.30% 87.0% 97.2% 87.1% 79.2% 85.6%
1581 Congress Middle 893 8.1% 82.60% 81.9% 94.4% 81.9% 72.2% 79.2%
1691 Crestwood Middle 755 20.1% 87.79% 92.7% 98.6% 87.2% 83.2% 89.3%
1701 Wellington Landings Middle 1201 25.0% 90.93% 94.6% 99.0% 89.9% 86.9% 93.3%
1731 Jupiter Middle 1342 25.0% 88.60% 92.8% 97.0% 90.0% 78.3% 89.8%
1751 Loggers Run Middle 1120 29.4% 87.21% 90.1% 97.2% 84.0% 79.1% 91.3%
1821 Christa McAuliffe Middle 1229 13.3% 91.11% 91.4% 98.8% 93.2% 88.8% 92.6%
1921 Woodlands Middle 1103 19.7% 88.32% 90.3% 98.6% 86.4% 83.7% 89.3%
1971 Watson B Duncan Middle 1265 16.1% 89.67% 93.1% 98.5% 89.1% 85.2% 92.6%
1981 Bear Lakes Middle 702 16.2% 81.05% 76.4% 92.7% 82.6% 64.8% 80.7%
1991 Omni Middle 1380 9.1% NR NR NR NR NR NR
2041 Carver Middle 834 8.6% NR NR NR NR NR NR
2131 Lake Worth Middle 1096 9.8% NR NR NR NR NR NR
2151 Okeeheelee Middle 1466 29.7% 86.91% 84.1% 97.5% 91.7% 71.5% 92.6%
2451 Western Pines Middle 1116 20.1% 93.10% 99.5% 99.1% 93.2% 87.7% 93.2%
2461 Eagles Landing Middle 1450 27.7% 90.09% 95.0% 97.7% 90.0% 84.1% 92.2%
2511 BAK Middle School of the Arts 1355 16.0% 93.55% 98.6% 99.5% 94.0% 92.1% 93.5%
2601 Odyssey Middle 754 0.7% NR NR NR NR NR NR
2611 Polo Park Middle 825 19.6% 91.35% 92.0% 98.1% 89.5% 92.0% 93.2%
2621 Independence Middle 1453 27.1% 90.47% 94.6% 99.5% 87.3% 84.0% 92.3%
2701 Jeaga Middle 1002 7.6% NR NR NR NR NR NR
2711 Don Estridge High Tech Middle 1254 36.4% 91.26% 95.3% 98.9% 92.8% 81.7% 92.4%
2781 Tradewinds Middle 1035 12.9% 85.00% 85.0% 96.2% 84.1% 80.3% 82.0%
2821 Osceola Creek Middle 704 26.6% 88.54% 91.8% 98.3% 86.3% 77.2% 91.8%
3371 Emerald Cove Middle 1210 26.2% 88.28% 91.6% 98.4% 86.2% 84.2% 85.6% * Schools with response rates of 10% or less are not reported (NR).
Page 8 of 16 EXECUTIVE SUMMARY: Results of the Parent and Student School Effectiveness Questionnaire July 31, 2017
Table 6c: FY17 High Schools Parent School Effectiveness Questionnaire
School Number School Name
Total PARENT
NO.
Response Rate
Overall Positive
SCHO
OL
CLIM
ATE
DIVE
RSE
COM
MU
NIT
Y
HIG
H EX
PECT
ATIO
NS
INDI
VIDU
AL
CON
CERN
S
PARE
NTA
L IN
VOLV
EMEN
T
0000 All PBC Schools 173130 18.6% 91.1% 94.1% 97.7% 90.5% 81.0% 93.3% 00HS All HIGH Schools 52863 10.8% 85.1% 87.0% 94.4% 86.8% 74.1% 82.6%
0081 Jupiter High 2996 0.3% NR NR NR NR NR NR
0151 Suncoast High 1547 19.3% 88.87% 93.6% 97.0% 92.9% 84.2% 87.6%
0395 AW Dreyfoos School of Arts 1412 14.4% 89.74% 93.5% 97.5% 92.9% 82.4% 84.9%
0581 Forest Hill High 2464 5.9% NR NR NR NR NR NR
0691 Lake Worth High 2724 2.8% NR NR NR NR NR NR
0862 Atlantic High 2380 11.1% 82.2% 80.8% 92.0% 83.7% 71.5% 76.5%
0961 Boca Raton High 3405 15.1% 89.37% 94.7% 97.6% 92.4% 79.4% 85.7%
1361 John I Leonard High 3573 6.4% NR NR NR NR NR NR
1371 Palm Beach Gardens High 2698 10.3% NR NR NR NR NR NR
1611 Santaluces High 2343 8.5% NR NR NR NR NR NR
1681 Spanish River High 2341 13.0% 84.20% 86.0% 94.8% 84.0% 79.8% 79.4%
1771 Pahokee Middle/Senior High 851 10.6% 78.92% 80.0% 81.1% 83.3% 45.6% 78.9%
1851 Palm Beach Lakes High 2300 5.3% NR NR NR NR NR NR
2001 Park Vista Comm High 3016 5.4% NR NR NR NR NR NR
2181 Olympic Heights High 2025 15.5% 85.68% 87.5% 97.0% 87.3% 75.8% 81.8%
2191 Wellington High 2514 16.9% 85.45% 87.1% 94.7% 90.2% 75.4% 82.9%
2201 WT Dwyer High 2216 19.4% 85.80% 88.1% 96.0% 85.9% 78.5% 84.8%
2301 Glades Central High 984 18.8% 85.32% 90.8% 94.9% 91.6% 60.4% 88.5%
2331 Royal Palm Beach High 2124 14.5% 83.00% 81.5% 93.7% 85.3% 72.3% 79.1%
2361 Boynton Beach Comm High 1752 7.8% NR NR NR NR NR NR
2631 Palm Beach Central High 2907 17.5% 85.26% 87.0% 94.3% 86.4% 76.9% 82.1%
3251 West Boca Raton Comm High 2014 12.2% 85.93% 88.2% 93.0% 83.7% 68.9% 82.0%
3861 Seminole Ridge Comm High 2277 11.9% 85.59% 87.4% 94.0% 85.8% 75.5% 85.9% * Schools with response rates of 10% or less are not reported (NR).
Page 9 of 16 EXECUTIVE SUMMARY: Results of the Parent and Student School Effectiveness Questionnaire July 31, 2017
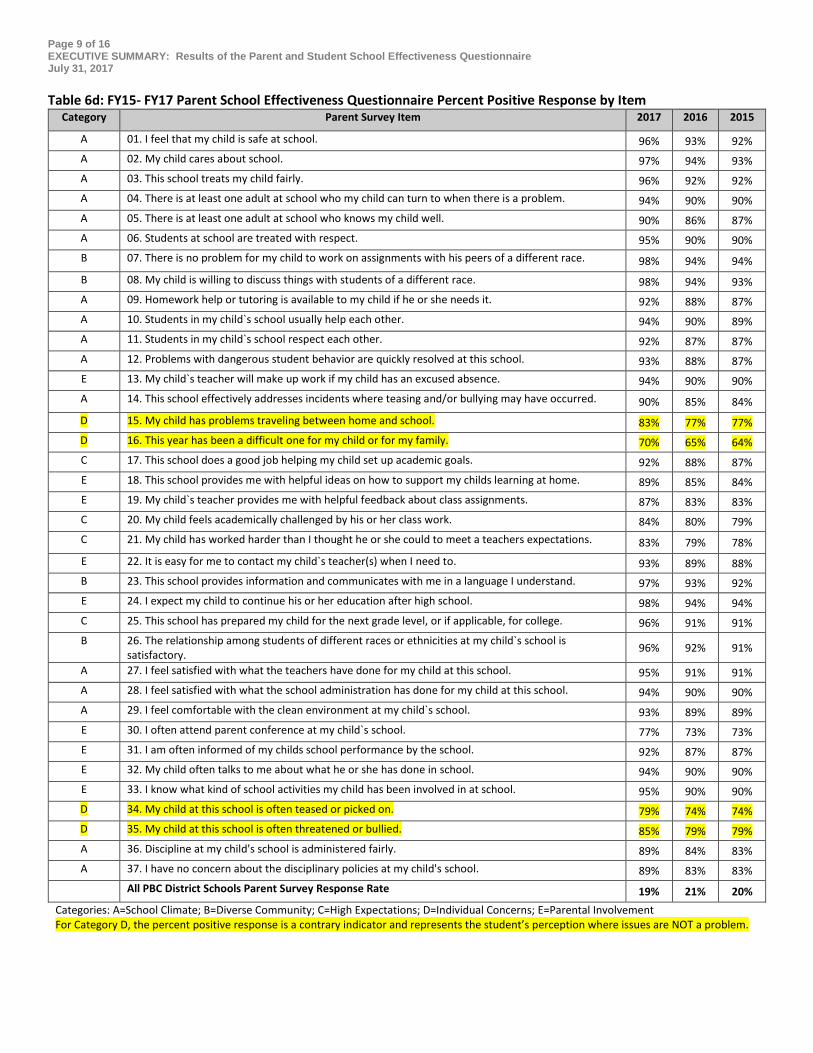
Table 6d: FY15- FY17 Parent School Effectiveness Questionnaire Percent Positive Response by Item Category Parent Survey Item 2017 2016 2015
A 01. I feel that my child is safe at school. 96% 93% 92% A 02. My child cares about school. 97% 94% 93% A 03. This school treats my child fairly. 96% 92% 92% A 04. There is at least one adult at school who my child can turn to when there is a problem. 94% 90% 90% A 05. There is at least one adult at school who knows my child well. 90% 86% 87% A 06. Students at school are treated with respect. 95% 90% 90% B 07. There is no problem for my child to work on assignments with his peers of a different race. 98% 94% 94% B 08. My child is willing to discuss things with students of a different race. 98% 94% 93% A 09. Homework help or tutoring is available to my child if he or she needs it. 92% 88% 87% A 10. Students in my child`s school usually help each other. 94% 90% 89% A 11. Students in my child`s school respect each other. 92% 87% 87% A 12. Problems with dangerous student behavior are quickly resolved at this school. 93% 88% 87% E 13. My child`s teacher will make up work if my child has an excused absence. 94% 90% 90% A 14. This school effectively addresses incidents where teasing and/or bullying may have occurred. 90% 85% 84% D 15. My child has problems traveling between home and school. 83% 77% 77% D 16. This year has been a difficult one for my child or for my family. 70% 65% 64% C 17. This school does a good job helping my child set up academic goals. 92% 88% 87% E 18. This school provides me with helpful ideas on how to support my childs learning at home. 89% 85% 84% E 19. My child`s teacher provides me with helpful feedback about class assignments. 87% 83% 83% C 20. My child feels academically challenged by his or her class work. 84% 80% 79% C 21. My child has worked harder than I thought he or she could to meet a teachers expectations. 83% 79% 78% E 22. It is easy for me to contact my child`s teacher(s) when I need to. 93% 89% 88% B 23. This school provides information and communicates with me in a language I understand. 97% 93% 92% E 24. I expect my child to continue his or her education after high school. 98% 94% 94% C 25. This school has prepared my child for the next grade level, or if applicable, for college. 96% 91% 91% B 26. The relationship among students of different races or ethnicities at my child`s school is
satisfactory. 96% 92% 91%
A 27. I feel satisfied with what the teachers have done for my child at this school. 95% 91% 91% A 28. I feel satisfied with what the school administration has done for my child at this school. 94% 90% 90% A 29. I feel comfortable with the clean environment at my child`s school. 93% 89% 89% E 30. I often attend parent conference at my child`s school. 77% 73% 73% E 31. I am often informed of my childs school performance by the school. 92% 87% 87% E 32. My child often talks to me about what he or she has done in school. 94% 90% 90% E 33. I know what kind of school activities my child has been involved in at school. 95% 90% 90% D 34. My child at this school is often teased or picked on. 79% 74% 74% D 35. My child at this school is often threatened or bullied. 85% 79% 79% A 36. Discipline at my child's school is administered fairly. 89% 84% 83% A 37. I have no concern about the disciplinary policies at my child's school. 89% 83% 83%
All PBC District Schools Parent Survey Response Rate 19% 21% 20% Categories: A=School Climate; B=Diverse Community; C=High Expectations; D=Individual Concerns; E=Parental Involvement For Category D, the percent positive response is a contrary indicator and represents the student’s perception where issues are NOT a problem.
Page 10 of 16 EXECUTIVE SUMMARY: Results of the Parent and Student School Effectiveness Questionnaire July 31, 2017
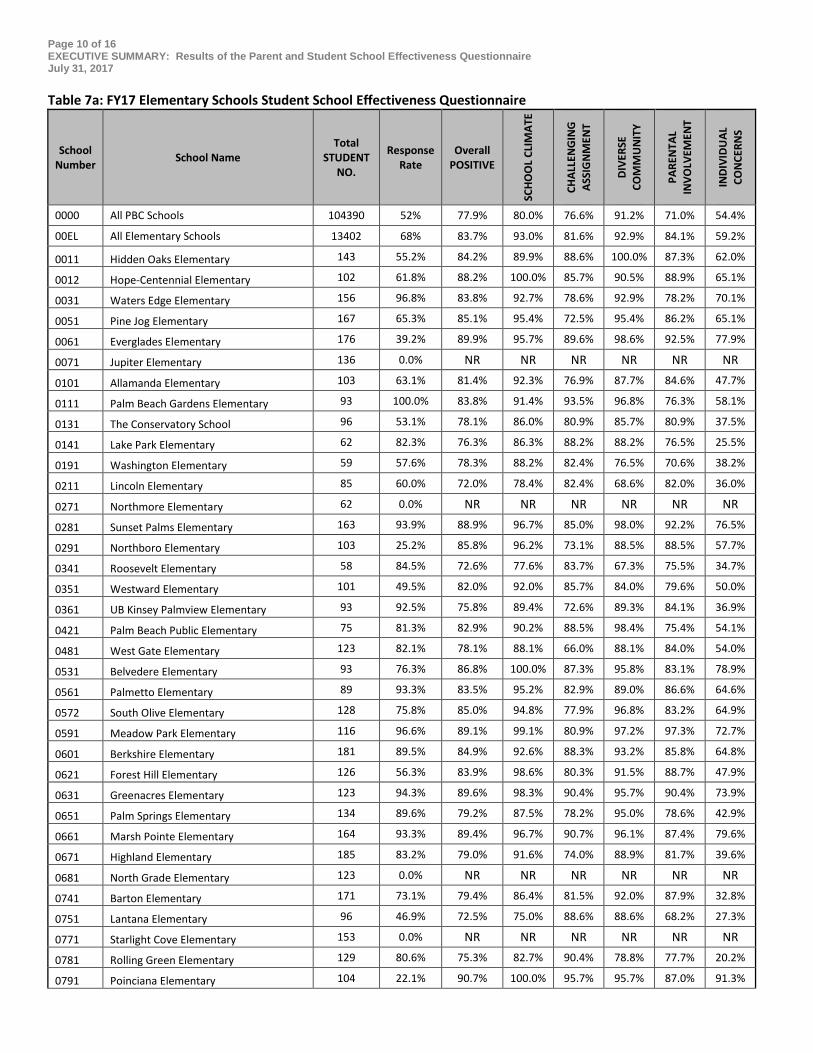
Table 7a: FY17 Elementary Schools Student School Effectiveness Questionnaire
School Number School Name
Total STUDENT
NO.
Response Rate
Overall POSITIVE
SCHO
OL
CLIM
ATE
CHAL
LEN
GIN
G
ASSI
GN
MEN
T
DIVE
RSE
COM
MU
NIT
Y
PARE
NTA
L IN
VOLV
EMEN
T
INDI
VIDU
AL
CON
CERN
S
0000 All PBC Schools 104390 52% 77.9% 80.0% 76.6% 91.2% 71.0% 54.4%
00EL All Elementary Schools 13402 68% 83.7% 93.0% 81.6% 92.9% 84.1% 59.2%
0011 Hidden Oaks Elementary 143 55.2% 84.2% 89.9% 88.6% 100.0% 87.3% 62.0%
0012 Hope-Centennial Elementary 102 61.8% 88.2% 100.0% 85.7% 90.5% 88.9% 65.1%
0031 Waters Edge Elementary 156 96.8% 83.8% 92.7% 78.6% 92.9% 78.2% 70.1%
0051 Pine Jog Elementary 167 65.3% 85.1% 95.4% 72.5% 95.4% 86.2% 65.1%
0061 Everglades Elementary 176 39.2% 89.9% 95.7% 89.6% 98.6% 92.5% 77.9%
0071 Jupiter Elementary 136 0.0% NR NR NR NR NR NR
0101 Allamanda Elementary 103 63.1% 81.4% 92.3% 76.9% 87.7% 84.6% 47.7%
0111 Palm Beach Gardens Elementary 93 100.0% 83.8% 91.4% 93.5% 96.8% 76.3% 58.1%
0131 The Conservatory School 96 53.1% 78.1% 86.0% 80.9% 85.7% 80.9% 37.5%
0141 Lake Park Elementary 62 82.3% 76.3% 86.3% 88.2% 88.2% 76.5% 25.5%
0191 Washington Elementary 59 57.6% 78.3% 88.2% 82.4% 76.5% 70.6% 38.2%
0211 Lincoln Elementary 85 60.0% 72.0% 78.4% 82.4% 68.6% 82.0% 36.0%
0271 Northmore Elementary 62 0.0% NR NR NR NR NR NR
0281 Sunset Palms Elementary 163 93.9% 88.9% 96.7% 85.0% 98.0% 92.2% 76.5%
0291 Northboro Elementary 103 25.2% 85.8% 96.2% 73.1% 88.5% 88.5% 57.7%
0341 Roosevelt Elementary 58 84.5% 72.6% 77.6% 83.7% 67.3% 75.5% 34.7%
0351 Westward Elementary 101 49.5% 82.0% 92.0% 85.7% 84.0% 79.6% 50.0%
0361 UB Kinsey Palmview Elementary 93 92.5% 75.8% 89.4% 72.6% 89.3% 84.1% 36.9%
0421 Palm Beach Public Elementary 75 81.3% 82.9% 90.2% 88.5% 98.4% 75.4% 54.1%
0481 West Gate Elementary 123 82.1% 78.1% 88.1% 66.0% 88.1% 84.0% 54.0%
0531 Belvedere Elementary 93 76.3% 86.8% 100.0% 87.3% 95.8% 83.1% 78.9%
0561 Palmetto Elementary 89 93.3% 83.5% 95.2% 82.9% 89.0% 86.6% 64.6%
0572 South Olive Elementary 128 75.8% 85.0% 94.8% 77.9% 96.8% 83.2% 64.9%
0591 Meadow Park Elementary 116 96.6% 89.1% 99.1% 80.9% 97.2% 97.3% 72.7%
0601 Berkshire Elementary 181 89.5% 84.9% 92.6% 88.3% 93.2% 85.8% 64.8%
0621 Forest Hill Elementary 126 56.3% 83.9% 98.6% 80.3% 91.5% 88.7% 47.9%
0631 Greenacres Elementary 123 94.3% 89.6% 98.3% 90.4% 95.7% 90.4% 73.9%
0651 Palm Springs Elementary 134 89.6% 79.2% 87.5% 78.2% 95.0% 78.6% 42.9%
0661 Marsh Pointe Elementary 164 93.3% 89.4% 96.7% 90.7% 96.1% 87.4% 79.6%
0671 Highland Elementary 185 83.2% 79.0% 91.6% 74.0% 88.9% 81.7% 39.6%
0681 North Grade Elementary 123 0.0% NR NR NR NR NR NR
0741 Barton Elementary 171 73.1% 79.4% 86.4% 81.5% 92.0% 87.9% 32.8%
0751 Lantana Elementary 96 46.9% 72.5% 75.0% 88.6% 88.6% 68.2% 27.3%
0771 Starlight Cove Elementary 153 0.0% NR NR NR NR NR NR
0781 Rolling Green Elementary 129 80.6% 75.3% 82.7% 90.4% 78.8% 77.7% 20.2%
0791 Poinciana Elementary 104 22.1% 90.7% 100.0% 95.7% 95.7% 87.0% 91.3%
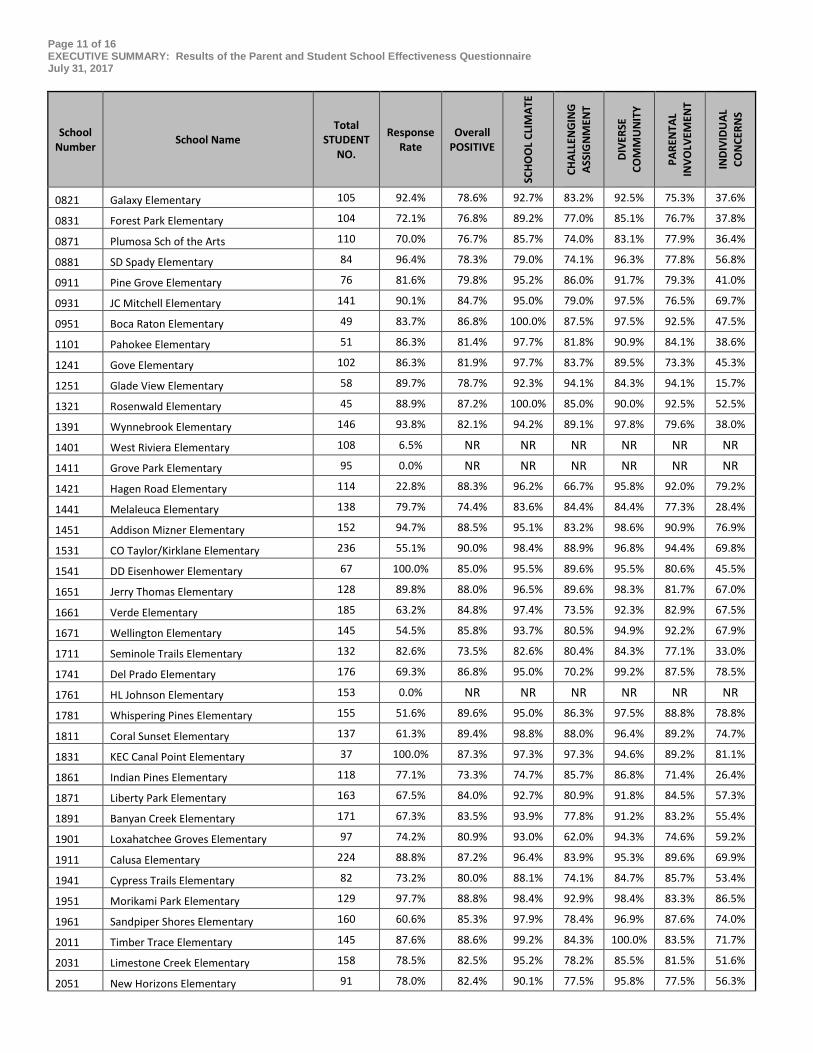
Page 11 of 16 EXECUTIVE SUMMARY: Results of the Parent and Student School Effectiveness Questionnaire July 31, 2017
School Number School Name
Total STUDENT
NO.
Response Rate
Overall POSITIVE
SCHO
OL
CLIM
ATE
CHAL
LEN
GIN
G
ASSI
GN
MEN
T
DIVE
RSE
COM
MU
NIT
Y
PARE
NTA
L IN
VOLV
EMEN
T
INDI
VIDU
AL
CON
CERN
S
0821 Galaxy Elementary 105 92.4% 78.6% 92.7% 83.2% 92.5% 75.3% 37.6%
0831 Forest Park Elementary 104 72.1% 76.8% 89.2% 77.0% 85.1% 76.7% 37.8%
0871 Plumosa Sch of the Arts 110 70.0% 76.7% 85.7% 74.0% 83.1% 77.9% 36.4%
0881 SD Spady Elementary 84 96.4% 78.3% 79.0% 74.1% 96.3% 77.8% 56.8%
0911 Pine Grove Elementary 76 81.6% 79.8% 95.2% 86.0% 91.7% 79.3% 41.0%
0931 JC Mitchell Elementary 141 90.1% 84.7% 95.0% 79.0% 97.5% 76.5% 69.7%
0951 Boca Raton Elementary 49 83.7% 86.8% 100.0% 87.5% 97.5% 92.5% 47.5%
1101 Pahokee Elementary 51 86.3% 81.4% 97.7% 81.8% 90.9% 84.1% 38.6%
1241 Gove Elementary 102 86.3% 81.9% 97.7% 83.7% 89.5% 73.3% 45.3%
1251 Glade View Elementary 58 89.7% 78.7% 92.3% 94.1% 84.3% 94.1% 15.7%
1321 Rosenwald Elementary 45 88.9% 87.2% 100.0% 85.0% 90.0% 92.5% 52.5%
1391 Wynnebrook Elementary 146 93.8% 82.1% 94.2% 89.1% 97.8% 79.6% 38.0%
1401 West Riviera Elementary 108 6.5% NR NR NR NR NR NR
1411 Grove Park Elementary 95 0.0% NR NR NR NR NR NR
1421 Hagen Road Elementary 114 22.8% 88.3% 96.2% 66.7% 95.8% 92.0% 79.2%
1441 Melaleuca Elementary 138 79.7% 74.4% 83.6% 84.4% 84.4% 77.3% 28.4%
1451 Addison Mizner Elementary 152 94.7% 88.5% 95.1% 83.2% 98.6% 90.9% 76.9%
1531 CO Taylor/Kirklane Elementary 236 55.1% 90.0% 98.4% 88.9% 96.8% 94.4% 69.8%
1541 DD Eisenhower Elementary 67 100.0% 85.0% 95.5% 89.6% 95.5% 80.6% 45.5%
1651 Jerry Thomas Elementary 128 89.8% 88.0% 96.5% 89.6% 98.3% 81.7% 67.0%
1661 Verde Elementary 185 63.2% 84.8% 97.4% 73.5% 92.3% 82.9% 67.5%
1671 Wellington Elementary 145 54.5% 85.8% 93.7% 80.5% 94.9% 92.2% 67.9%
1711 Seminole Trails Elementary 132 82.6% 73.5% 82.6% 80.4% 84.3% 77.1% 33.0%
1741 Del Prado Elementary 176 69.3% 86.8% 95.0% 70.2% 99.2% 87.5% 78.5%
1761 HL Johnson Elementary 153 0.0% NR NR NR NR NR NR
1781 Whispering Pines Elementary 155 51.6% 89.6% 95.0% 86.3% 97.5% 88.8% 78.8%
1811 Coral Sunset Elementary 137 61.3% 89.4% 98.8% 88.0% 96.4% 89.2% 74.7%
1831 KEC Canal Point Elementary 37 100.0% 87.3% 97.3% 97.3% 94.6% 89.2% 81.1%
1861 Indian Pines Elementary 118 77.1% 73.3% 74.7% 85.7% 86.8% 71.4% 26.4%
1871 Liberty Park Elementary 163 67.5% 84.0% 92.7% 80.9% 91.8% 84.5% 57.3%
1891 Banyan Creek Elementary 171 67.3% 83.5% 93.9% 77.8% 91.2% 83.2% 55.4%
1901 Loxahatchee Groves Elementary 97 74.2% 80.9% 93.0% 62.0% 94.3% 74.6% 59.2%
1911 Calusa Elementary 224 88.8% 87.2% 96.4% 83.9% 95.3% 89.6% 69.9%
1941 Cypress Trails Elementary 82 73.2% 80.0% 88.1% 74.1% 84.7% 85.7% 53.4%
1951 Morikami Park Elementary 129 97.7% 88.8% 98.4% 92.9% 98.4% 83.3% 86.5%
1961 Sandpiper Shores Elementary 160 60.6% 85.3% 97.9% 78.4% 96.9% 87.6% 74.0%
2011 Timber Trace Elementary 145 87.6% 88.6% 99.2% 84.3% 100.0% 83.5% 71.7%
2031 Limestone Creek Elementary 158 78.5% 82.5% 95.2% 78.2% 85.5% 81.5% 51.6%
2051 New Horizons Elementary 91 78.0% 82.4% 90.1% 77.5% 95.8% 77.5% 56.3%
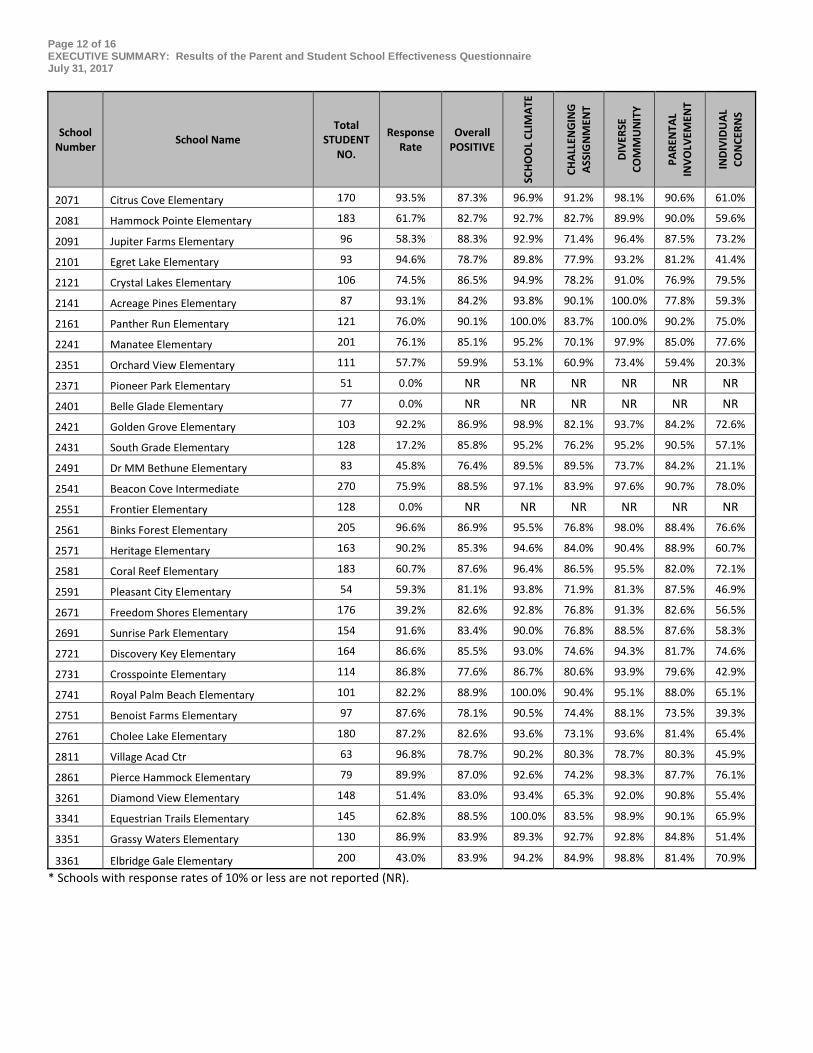
Page 12 of 16 EXECUTIVE SUMMARY: Results of the Parent and Student School Effectiveness Questionnaire July 31, 2017
School Number School Name
Total STUDENT
NO.
Response Rate
Overall POSITIVE
SCHO
OL
CLIM
ATE
CHAL
LEN
GIN
G
ASSI
GN
MEN
T
DIVE
RSE
COM
MU
NIT
Y
PARE
NTA
L IN
VOLV
EMEN
T
INDI
VIDU
AL
CON
CERN
S
2071 Citrus Cove Elementary 170 93.5% 87.3% 96.9% 91.2% 98.1% 90.6% 61.0%
2081 Hammock Pointe Elementary 183 61.7% 82.7% 92.7% 82.7% 89.9% 90.0% 59.6%
2091 Jupiter Farms Elementary 96 58.3% 88.3% 92.9% 71.4% 96.4% 87.5% 73.2%
2101 Egret Lake Elementary 93 94.6% 78.7% 89.8% 77.9% 93.2% 81.2% 41.4%
2121 Crystal Lakes Elementary 106 74.5% 86.5% 94.9% 78.2% 91.0% 76.9% 79.5%
2141 Acreage Pines Elementary 87 93.1% 84.2% 93.8% 90.1% 100.0% 77.8% 59.3%
2161 Panther Run Elementary 121 76.0% 90.1% 100.0% 83.7% 100.0% 90.2% 75.0%
2241 Manatee Elementary 201 76.1% 85.1% 95.2% 70.1% 97.9% 85.0% 77.6%
2351 Orchard View Elementary 111 57.7% 59.9% 53.1% 60.9% 73.4% 59.4% 20.3%
2371 Pioneer Park Elementary 51 0.0% NR NR NR NR NR NR
2401 Belle Glade Elementary 77 0.0% NR NR NR NR NR NR
2421 Golden Grove Elementary 103 92.2% 86.9% 98.9% 82.1% 93.7% 84.2% 72.6%
2431 South Grade Elementary 128 17.2% 85.8% 95.2% 76.2% 95.2% 90.5% 57.1%
2491 Dr MM Bethune Elementary 83 45.8% 76.4% 89.5% 89.5% 73.7% 84.2% 21.1%
2541 Beacon Cove Intermediate 270 75.9% 88.5% 97.1% 83.9% 97.6% 90.7% 78.0%
2551 Frontier Elementary 128 0.0% NR NR NR NR NR NR
2561 Binks Forest Elementary 205 96.6% 86.9% 95.5% 76.8% 98.0% 88.4% 76.6%
2571 Heritage Elementary 163 90.2% 85.3% 94.6% 84.0% 90.4% 88.9% 60.7%
2581 Coral Reef Elementary 183 60.7% 87.6% 96.4% 86.5% 95.5% 82.0% 72.1%
2591 Pleasant City Elementary 54 59.3% 81.1% 93.8% 71.9% 81.3% 87.5% 46.9%
2671 Freedom Shores Elementary 176 39.2% 82.6% 92.8% 76.8% 91.3% 82.6% 56.5%
2691 Sunrise Park Elementary 154 91.6% 83.4% 90.0% 76.8% 88.5% 87.6% 58.3%
2721 Discovery Key Elementary 164 86.6% 85.5% 93.0% 74.6% 94.3% 81.7% 74.6%
2731 Crosspointe Elementary 114 86.8% 77.6% 86.7% 80.6% 93.9% 79.6% 42.9%
2741 Royal Palm Beach Elementary 101 82.2% 88.9% 100.0% 90.4% 95.1% 88.0% 65.1%
2751 Benoist Farms Elementary 97 87.6% 78.1% 90.5% 74.4% 88.1% 73.5% 39.3%
2761 Cholee Lake Elementary 180 87.2% 82.6% 93.6% 73.1% 93.6% 81.4% 65.4%
2811 Village Acad Ctr 63 96.8% 78.7% 90.2% 80.3% 78.7% 80.3% 45.9%
2861 Pierce Hammock Elementary 79 89.9% 87.0% 92.6% 74.2% 98.3% 87.7% 76.1%
3261 Diamond View Elementary 148 51.4% 83.0% 93.4% 65.3% 92.0% 90.8% 55.4%
3341 Equestrian Trails Elementary 145 62.8% 88.5% 100.0% 83.5% 98.9% 90.1% 65.9%
3351 Grassy Waters Elementary 130 86.9% 83.9% 89.3% 92.7% 92.8% 84.8% 51.4%
3361 Elbridge Gale Elementary 200 43.0% 83.9% 94.2% 84.9% 98.8% 81.4% 70.9%
* Schools with response rates of 10% or less are not reported (NR).
Page 13 of 16 EXECUTIVE SUMMARY: Results of the Parent and Student School Effectiveness Questionnaire July 31, 2017
Table 7b: FY17 Middle Schools Student School Effectiveness Questionnaire
School Number School Name
Total STUDENT
NO.
Response Rate
Overall POSITIVE
SCHO
OL
CLIM
ATE
CHAL
LEN
GIN
G
ASSI
GN
MEN
T
DIVE
RSE
COM
MU
NIT
Y
PARE
NTA
L IN
VOLV
EMEN
T
INDI
VIDU
AL
CON
CERN
S
COLL
EGE
PREP
ARAT
ION
0000 All PBC Schools 104390 52% 77.9% 80.0% 76.6% 91.2% 71.0% 54.4% 85.1% 00MS All MIDDLE Schools 36477 61% 77.2% 76.4% 74.4% 91.8% 71.3% 52.5% 83.6% 0021 L C Swain Middle 1254 34.3% 78.8% 78.6% 76.6% 92.7% 72.3% 51.1% 84.7% 0121 HL Watkins Middle 957 52.8% 77.1% 78.9% 78.4% 89.1% 72.8% 39.3% 87.6% 0131 The Conservatory School 84 76.2% 89.2% 93.5% 91.7% 100.0% 88.7% 74.2% 86.9% 0201 John F Kennedy Middle 809 0.0% NR NR NR NR NR NR NR 0311 Roosevelt Middle 978 19.6% 77.0% 75.9% 82.5% 91.6% 69.5% 46.8% 86.8% 0541 Conniston Middle 1205 82.2% 76.1% 72.5% 73.4% 92.4% 68.3% 51.6% 83.7% 0611 Palm Springs Middle 1587 58.3% 73.8% 69.4% 70.1% 87.4% 67.9% 45.7% 78.2% 0761 Lantana Middle 850 15.8% 74.5% 74.4% 74.8% 91.7% 61.4% 47.0% 78.0% 1232 Lake Shore Middle 677 63.5% 76.2% 78.5% 77.3% 89.0% 74.7% 36.4% 86.4% 1491 Boca Raton Middle 1532 72.8% 76.2% 72.3% 72.3% 91.3% 74.6% 51.5% 82.9% 1581 Congress Middle 893 56.0% 73.7% 76.0% 70.9% 88.2% 65.7% 35.4% 80.5% 1691 Crestwood Middle 755 77.0% 75.2% 70.5% 69.6% 94.6% 69.6% 47.7% 83.7% 1701 Wellington Landings Middle 1201 64.7% 77.6% 76.6% 73.5% 94.2% 73.5% 55.4% 83.3% 1731 Jupiter Middle 1342 67.6% 80.8% 81.9% 80.6% 92.2% 76.8% 56.4% 87.5% 1751 Loggers Run Middle 1120 88.9% 76.4% 73.6% 73.2% 93.9% 71.0% 54.6% 82.9% 1821 Christa McAuliffe Middle 1229 84.1% 75.9% 75.0% 70.6% 93.0% 68.1% 51.5% 79.5% 1921 Woodlands Middle 1103 82.8% 79.7% 81.3% 78.1% 93.8% 77.7% 49.7% 85.7% 1971 Watson B Duncan Middle 1265 67.0% 76.6% 74.5% 77.4% 92.0% 71.3% 48.9% 81.7% 1981 Bear Lakes Middle 702 62.4% 69.5% 64.1% 67.5% 78.2% 61.7% 37.6% 76.7% 1991 Omni Middle 1380 67.5% 71.4% 62.0% 66.0% 87.4% 65.3% 51.6% 79.0% 2041 Carver Middle 834 33.5% 73.6% 65.7% 75.0% 83.8% 70.0% 42.8% 82.2% 2131 Lake Worth Middle 1096 68.6% 75.9% 75.7% 74.6% 86.7% 66.5% 44.8% 82.2% 2151 Okeeheelee Middle 1466 77.2% 75.0% 73.5% 71.2% 89.5% 66.0% 53.9% 78.1% 2451 Western Pines Middle 1116 83.6% 84.1% 90.8% 80.8% 97.6% 76.1% 67.0% 90.8% 2461 Eagles Landing Middle 1450 77.2% 79.5% 81.5% 71.8% 94.4% 74.1% 61.4% 86.6% 2511 BAK Middle School of the Arts 1355 22.3% 87.1% 91.0% 87.0% 97.3% 87.2% 81.3% 90.6% 2601 Odyssey Middle 754 60.1% 73.2% 72.8% 73.8% 86.3% 64.9% 40.6% 82.7% 2611 Polo Park Middle 825 34.8% 81.3% 84.9% 74.5% 97.2% 72.9% 68.2% 89.2% 2621 Independence Middle 1453 70.9% 81.1% 82.7% 75.3% 94.6% 76.5% 63.5% 86.7% 2701 Jeaga Middle 1002 70.8% 74.6% 71.3% 72.5% 88.4% 67.6% 42.9% 83.7% 2711 Don Estridge High Tech Middle 1254 73.3% 82.6% 86.7% 83.4% 96.3% 76.2% 63.9% 87.7% 2781 Tradewinds Middle 1035 64.0% 74.8% 71.8% 73.6% 92.2% 64.7% 47.8% 81.0% 2821 Osceola Creek Middle 704 31.0% 82.7% 88.2% 84.3% 96.7% 75.8% 60.4% 82.7% 3371 Emerald Cove Middle 1210 70.5% 77.3% 77.3% 70.7% 93.6% 70.5% 53.6% 84.8%
* Schools with response rates of 10% or less are not reported (NR).
Page 14 of 16 EXECUTIVE SUMMARY: Results of the Parent and Student School Effectiveness Questionnaire July 31, 2017
Table 7c: FY17 High Schools Student School Effectiveness Questionnaire
School Number School Name
Total STUDENT
NO.
Response Rate
Overall POSITIVE
SCHO
OL
CLIM
ATE
CHAL
LEN
GIN
G
ASSI
GN
MEN
T
DIVE
RSE
COM
MU
NIT
Y
PARE
NTA
L IN
VOLV
EMEN
T
INDI
VIDU
AL
CON
CERN
S
COLL
EGE
PREP
ARAT
ION
0000 All PBC Schools 104390 52% 77.9% 80.0% 76.6% 91.2% 71.0% 54.4% 85.1% 00HS All HIGH Schools 53018 42% 77.0% 72.8% 72.2% 90.1% 65.4% 54.5% 86.6% 0081 Jupiter High 2996 68.7% 76.3% 71.8% 67.5% 86.0% 65.9% 55.0% 84.1% 0151 Suncoast High 1547 37.9% 82.0% 79.8% 86.8% 94.8% 71.1% 73.8% 93.1% 0395 AW Dreyfoos School of Arts 1412 31.3% 85.0% 86.9% 86.4% 95.6% 73.4% 69.3% 97.2% 0581 Forest Hill High 2464 22.6% 75.9% 70.8% 69.8% 91.9% 61.6% 57.9% 84.3% 0691 Lake Worth High 2713 24.7% 70.1% 56.7% 63.6% 84.1% 57.3% 45.6% 80.9% 0862 Atlantic High 2368 18.6% 77.0% 73.1% 78.0% 92.1% 61.9% 49.7% 91.1% 0961 Boca Raton High 3405 61.1% 83.0% 85.2% 78.0% 93.8% 72.5% 65.1% 92.3% 1361 John I Leonard High 3556 20.8% 77.3% 74.3% 73.1% 92.3% 61.2% 55.8% 86.5% 1371 Palm Beach Gardens High 2698 26.8% 77.8% 76.0% 72.9% 91.4% 68.0% 50.7% 87.4% 1611 Santaluces High 2329 53.8% 72.0% 62.4% 65.1% 87.1% 57.6% 46.4% 81.2% 1681 Spanish River High 2324 42.9% 77.0% 70.3% 68.7% 90.0% 70.5% 56.0% 87.5% 1771 Pahokee Middle/Senior High 842 18.2% 73.8% 68.4% 73.7% 86.2% 64.5% 32.9% 75.7% 1851 Palm Beach Lakes High 2300 39.3% 74.2% 70.0% 74.3% 85.9% 61.7% 48.3% 85.9% 2001 Park Vista Comm High 3016 40.1% 77.7% 74.7% 71.7% 91.4% 66.9% 52.5% 87.1% 2181 Olympic Heights High 2009 50.8% 77.6% 72.9% 74.9% 92.0% 67.9% 58.6% 88.6% 2191 Wellington High 2514 59.3% 76.5% 69.8% 70.7% 91.0% 67.0% 55.1% 88.1% 2201 WT Dwyer High 2205 54.5% 74.7% 67.5% 64.5% 89.6% 60.8% 53.5% 86.5% 2301 Glades Central High 984 53.4% 81.3% 82.5% 83.3% 92.2% 76.8% 41.5% 91.6% 2331 Royal Palm Beach High 2124 57.7% 74.9% 71.4% 70.1% 88.3% 61.9% 50.3% 83.2% 2361 Boynton Beach Comm High 1738 31.5% 68.4% 54.8% 63.4% 80.6% 58.7% 41.6% 77.1% 2631 Palm Beach Central High 2907 50.7% 77.2% 73.1% 75.3% 91.7% 63.7% 54.7% 85.7% 2811 Village Acad Ctr 276 34.1% 78.6% 75.5% 81.9% 93.6% 69.1% 54.3% 88.3% 3251 West Boca Raton Comm High 2014 35.8% 81.2% 79.0% 76.2% 94.0% 69.7% 61.3% 90.3% 3861 Seminole Ridge Comm High 2277 57.3% 76.9% 74.2% 71.7% 89.1% 62.1% 52.8% 83.9%
Page 15 of 16 EXECUTIVE SUMMARY: Results of the Parent and Student School Effectiveness Questionnaire July 31, 2017
Table 7d: FY15- FY17 Student School Effectiveness Questionnaire Percent Positive Response by Item
Category Student Survey Item 2017 2016 2015 A 01. I feel safe at school. 86% 85% 86% A 02. I care about school. 90% 88% 88% A 03. I am treated fairly at school. 83% 81% 81% A 04. If I need to, I can talk to at least one adult at school about personal problems. 76% 74% 74% A 05. There is at least one adult at school who knows me well. 71% 70% 70% A 06. Students are treated with respect by adults at school. 80% 78% 78% C 07. I work on assignments during class with students of a different race or ethnicity. 94% 91% 91% C 08. Discussion groups often include students of a different race or ethnicity. 92% 89% 89% A 09. Homework help is available to me if I need it. 86% 84% 84% A 10. Students are encouraged to work together and help each other. 84% 81% 81% A 11. Students respect each other at this school. 62% 61% 61% A 12. Problems with dangerous student behavior are quickly resolved at this school. 77% 75% 75% A 13. My teachers provide me with feedback that helps me improve my study. 85% 82% 83% A 14. My teachers help me make up work after an excused absence. 77% 75% 76% A 15. My teachers have taught me different strategies that help me learn. 88% 85% 86% A 16. My teachers encourage me to set academic goals. 85% 83% 83% A 17. I am regularly reminded about my academic goals. 78% 75% 75% A 18. I have worked harder than I thought I could to meet my teachers` expectation. 82% 79% 79% E 19. This year has been a difficult one for me or for my family. 54% 52% 50% E 20. I have had problems this year with students at school. 59% 57% 56% E 21. Students at this school are often teased or picked on. 48% 46% 44% E 22. Students at this school are often threatened or bullied. 57% 55% 54% E 23. I have had problems traveling between home and school. 76% 72% 72% B 24. My teachers have given me assignments (that need more thinking) to write papers in
which I defended my point of view or ideas. 74% 71% 72%
B 25. My teachers have given me assignments (that I need to find answers outside of the textbooks) to make presentations in class about something I read or researched. 81% 78% 79%
B 26. My teachers often connect what we are learning to life outside the classroom. 75% 72% 72% B 27. My teachers often require students to explain their original ideas. 79% 76% 76% B 28. My teachers provide class work that is academically challenging. 84% 81% 81% C 29. Generally, I feel that the relationship among students of different races or ethnicities
is satisfactory. 86% 83% 83%
A 30. Generally, I feel satisfied with the work that teachers have done for the students at this school. 83% 80% 80%
A 31. Generally, I feel satisfied with the work that school administrators have done for students at this school. 80% 77% 77%
A 32. Generally, I feel comfortable with the clean environment at this school. 71% 69% 70% D 33. My parents often attend parent conferences at school. 50% 47% 46% D 34. My parents often learn something about me from school. 68% 65% 65% D 35. I often talk to my parents about what I have done in school. 77% 73% 73% D 36. My family supports me a lot in my school activities. 85% 81% 81%
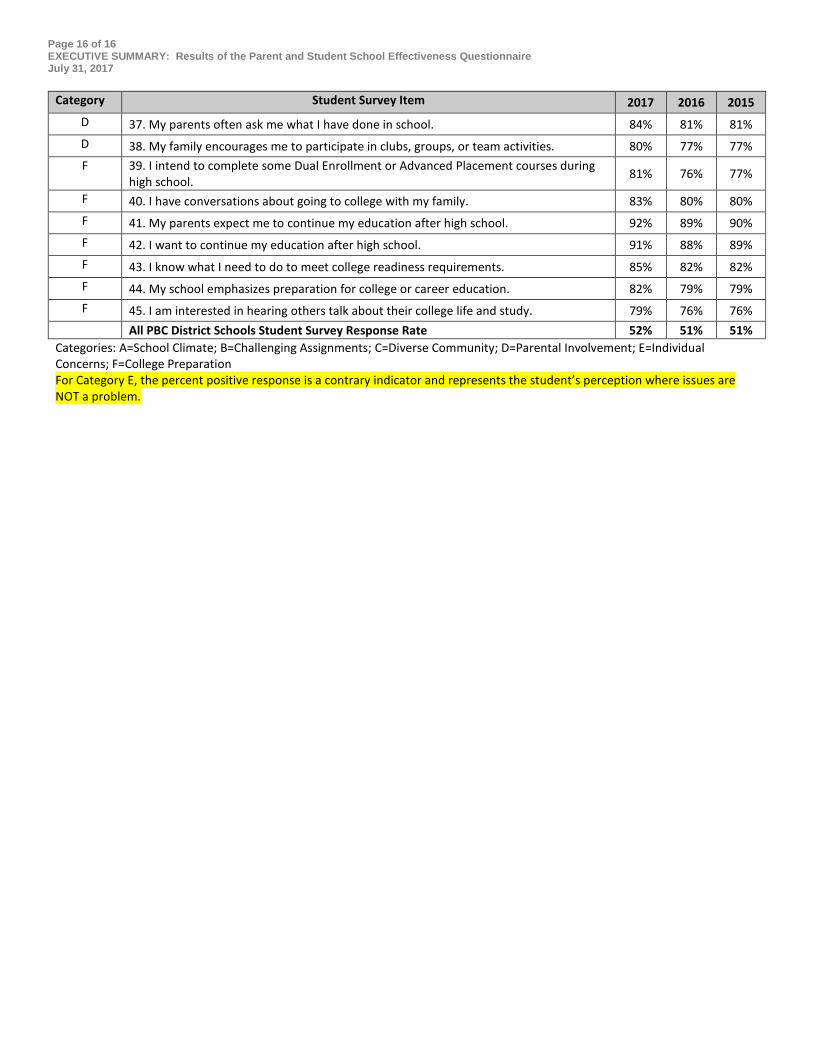
Page 16 of 16 EXECUTIVE SUMMARY: Results of the Parent and Student School Effectiveness Questionnaire July 31, 2017
Category Student Survey Item 2017 2016 2015 D 37. My parents often ask me what I have done in school. 84% 81% 81% D 38. My family encourages me to participate in clubs, groups, or team activities. 80% 77% 77% F 39. I intend to complete some Dual Enrollment or Advanced Placement courses during
high school. 81% 76% 77%
F 40. I have conversations about going to college with my family. 83% 80% 80% F 41. My parents expect me to continue my education after high school. 92% 89% 90% F 42. I want to continue my education after high school. 91% 88% 89% F 43. I know what I need to do to meet college readiness requirements. 85% 82% 82% F 44. My school emphasizes preparation for college or career education. 82% 79% 79% F 45. I am interested in hearing others talk about their college life and study. 79% 76% 76%
All PBC District Schools Student Survey Response Rate 52% 51% 51% Categories: A=School Climate; B=Challenging Assignments; C=Diverse Community; D=Parental Involvement; E=Individual Concerns; F=College Preparation For Category E, the percent positive response is a contrary indicator and represents the student’s perception where issues are NOT a problem.