Embed Size (px)
Citation preview
Schools Survey Report: SLP Annual Salary and Hourly Wage Trends 2004–2016
Gail Brook, Surveys and Analysis American Speech-Language-Hearing Association December 10, 2016
ASHA Schools Survey Report: SLP Annual Salary and Hourly Wage Trends, 2004–2016 Page 1 of 18
Contents
Introduction 2
Survey Report Highlights 2
Salary Basis 3
Limitations of Survey Analysis 4
Academic Year Salaries 5
Calendar Year Salaries 8
Hourly Wages 9
Salary Supplements 10
Student Debt 10
Survey Methodology and Response Rates 11
Suggested Citation 11
Additional Information 11
Questions? 11
Acknowledgment 11
Appendix 12
ASHA Schools Survey Report: SLP Annual Salary and Hourly Wage Trends, 2004–2016 Page 2 of 18
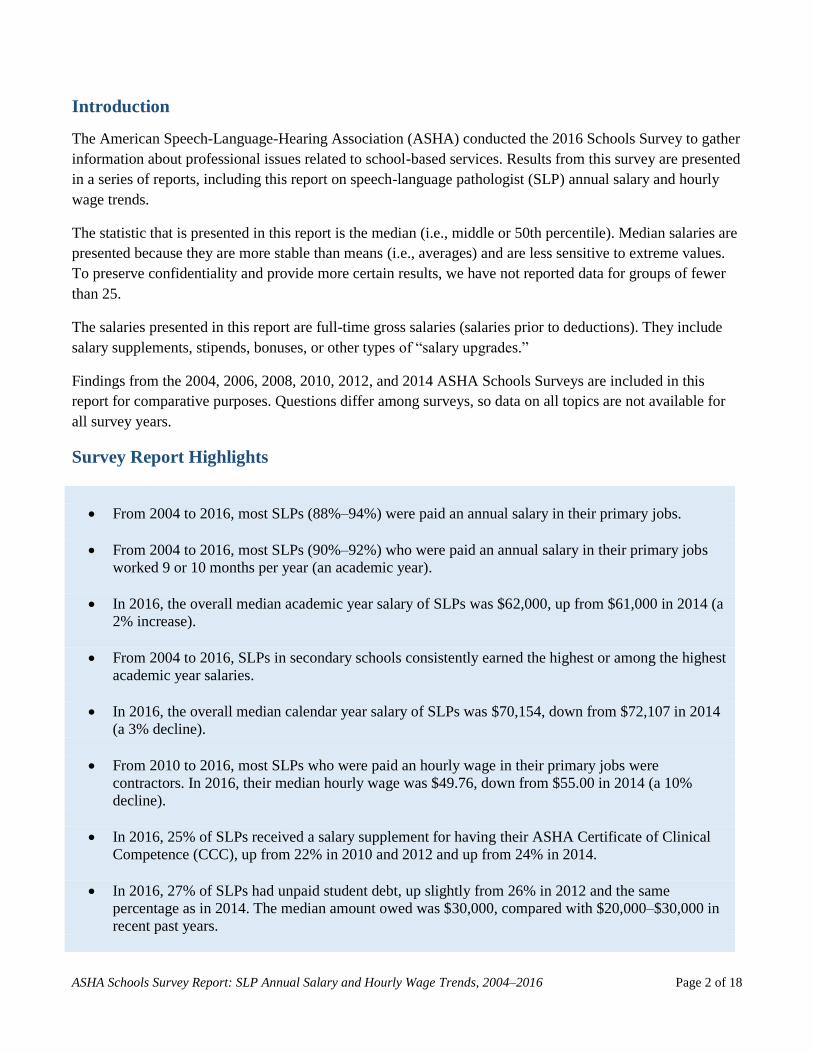
Introduction
The American Speech-Language-Hearing Association (ASHA) conducted the 2016 Schools Survey to gather
information about professional issues related to school-based services. Results from this survey are presented
in a series of reports, including this report on speech-language pathologist (SLP) annual salary and hourly
wage trends.
The statistic that is presented in this report is the median (i.e., middle or 50th percentile). Median salaries are
presented because they are more stable than means (i.e., averages) and are less sensitive to extreme values.
To preserve confidentiality and provide more certain results, we have not reported data for groups of fewer
than 25.
The salaries presented in this report are full-time gross salaries (salaries prior to deductions). They include
salary supplements, stipends, bonuses, or other types of “salary upgrades.”
Findings from the 2004, 2006, 2008, 2010, 2012, and 2014 ASHA Schools Surveys are included in this
report for comparative purposes. Questions differ among surveys, so data on all topics are not available for
all survey years.
Survey Report Highlights
From 2004 to 2016, most SLPs (88%–94%) were paid an annual salary in their primary jobs.
From 2004 to 2016, most SLPs (90%–92%) who were paid an annual salary in their primary jobs
worked 9 or 10 months per year (an academic year).
In 2016, the overall median academic year salary of SLPs was $62,000, up from $61,000 in 2014 (a
2% increase).
From 2004 to 2016, SLPs in secondary schools consistently earned the highest or among the highest
academic year salaries.
In 2016, the overall median calendar year salary of SLPs was $70,154, down from $72,107 in 2014
(a 3% decline).
From 2010 to 2016, most SLPs who were paid an hourly wage in their primary jobs were
contractors. In 2016, their median hourly wage was $49.76, down from $55.00 in 2014 (a 10%
decline).
In 2016, 25% of SLPs received a salary supplement for having their ASHA Certificate of Clinical
Competence (CCC), up from 22% in 2010 and 2012 and up from 24% in 2014.
In 2016, 27% of SLPs had unpaid student debt, up slightly from 26% in 2012 and the same
percentage as in 2014. The median amount owed was $30,000, compared with $20,000–$30,000 in
recent past years.
ASHA Schools Survey Report: SLP Annual Salary and Hourly Wage Trends, 2004–2016 Page 3 of 18
Salary Basis
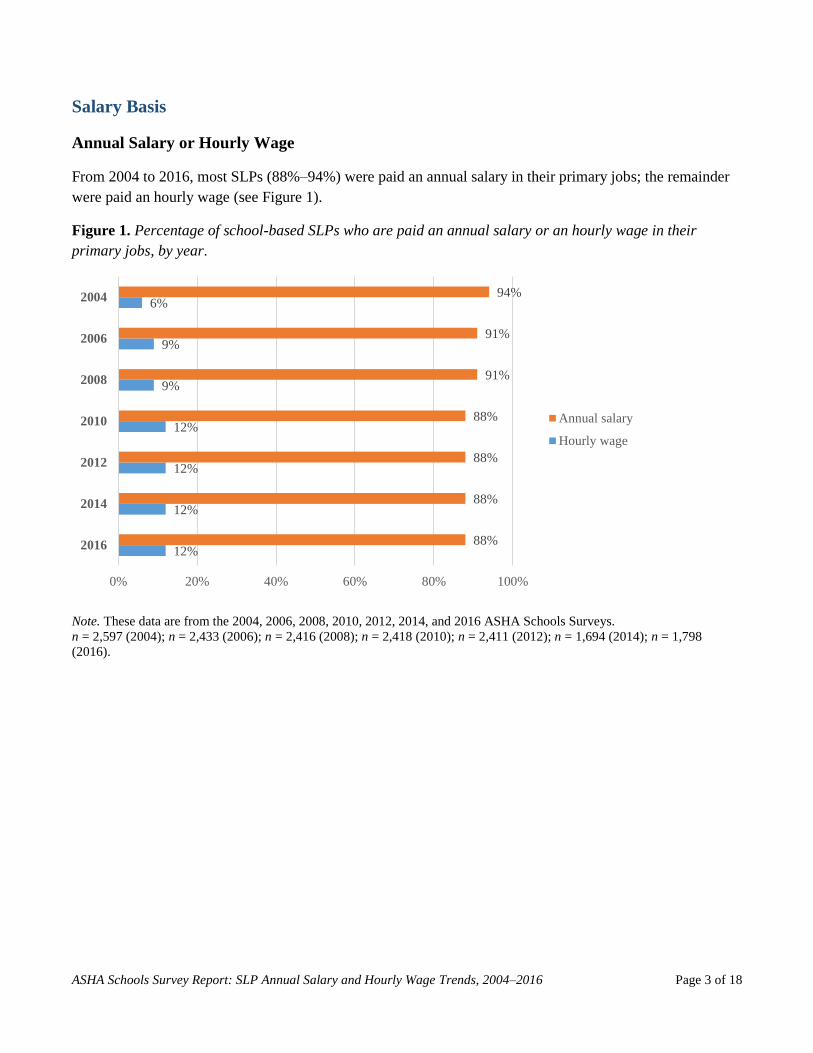
Annual Salary or Hourly Wage
From 2004 to 2016, most SLPs (88%–94%) were paid an annual salary in their primary jobs; the remainder
were paid an hourly wage (see Figure 1).
Figure 1. Percentage of school-based SLPs who are paid an annual salary or an hourly wage in their
primary jobs, by year.
Note. These data are from the 2004, 2006, 2008, 2010, 2012, 2014, and 2016 ASHA Schools Surveys.
n = 2,597 (2004); n = 2,433 (2006); n = 2,416 (2008); n = 2,418 (2010); n = 2,411 (2012); n = 1,694 (2014); n = 1,798
(2016).
12%
12%
12%
12%
9%
9%
6%
88%
88%
88%
88%
91%
91%
94%
0% 20% 40% 60% 80% 100%
2016
2014
2012
2010
2008
2006
2004
Annual salary
Hourly wage
ASHA Schools Survey Report: SLP Annual Salary and Hourly Wage Trends, 2004–2016 Page 4 of 18
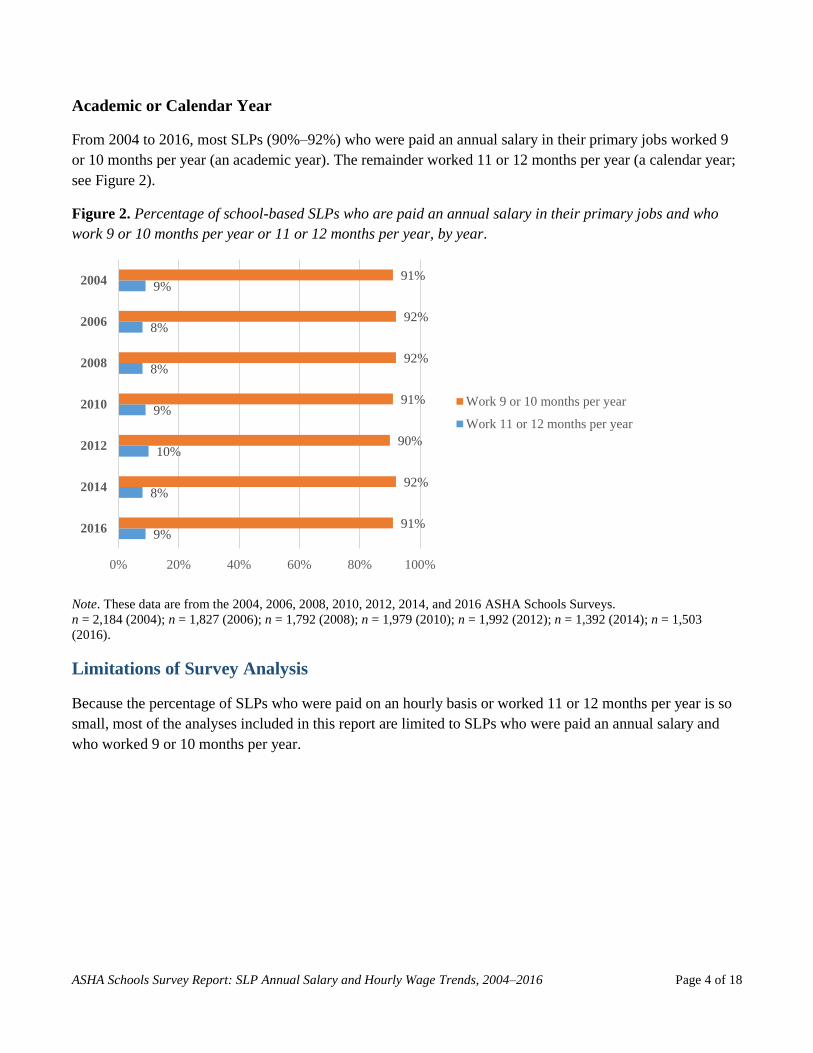
Academic or Calendar Year
From 2004 to 2016, most SLPs (90%–92%) who were paid an annual salary in their primary jobs worked 9
or 10 months per year (an academic year). The remainder worked 11 or 12 months per year (a calendar year;
see Figure 2).
Figure 2. Percentage of school-based SLPs who are paid an annual salary in their primary jobs and who
work 9 or 10 months per year or 11 or 12 months per year, by year.
Note. These data are from the 2004, 2006, 2008, 2010, 2012, 2014, and 2016 ASHA Schools Surveys.
n = 2,184 (2004); n = 1,827 (2006); n = 1,792 (2008); n = 1,979 (2010); n = 1,992 (2012); n = 1,392 (2014); n = 1,503
(2016).
Limitations of Survey Analysis
Because the percentage of SLPs who were paid on an hourly basis or worked 11 or 12 months per year is so
small, most of the analyses included in this report are limited to SLPs who were paid an annual salary and
who worked 9 or 10 months per year.
9%
8%
10%
9%
8%
8%
9%
91%
92%
90%
91%
92%
92%
91%
0% 20% 40% 60% 80% 100%
2016
2014
2012
2010
2008
2006
2004
Work 9 or 10 months per year
Work 11 or 12 months per year
ASHA Schools Survey Report: SLP Annual Salary and Hourly Wage Trends, 2004–2016 Page 5 of 18
Academic Year Salaries
In 2016, SLPs earned an overall median academic year salary of $62,000, up from $61,000 in 2014 (a 2%
increase; see Appendix Table 1).
Academic Year Salaries, by School Setting
The median academic year salary of SLPs typically varied by school setting. From 2004 to 2016, SLPs in
secondary schools consistently earned the highest or among the highest salaries (see Appendix Table 1).
Academic Year Salaries, by Work Role
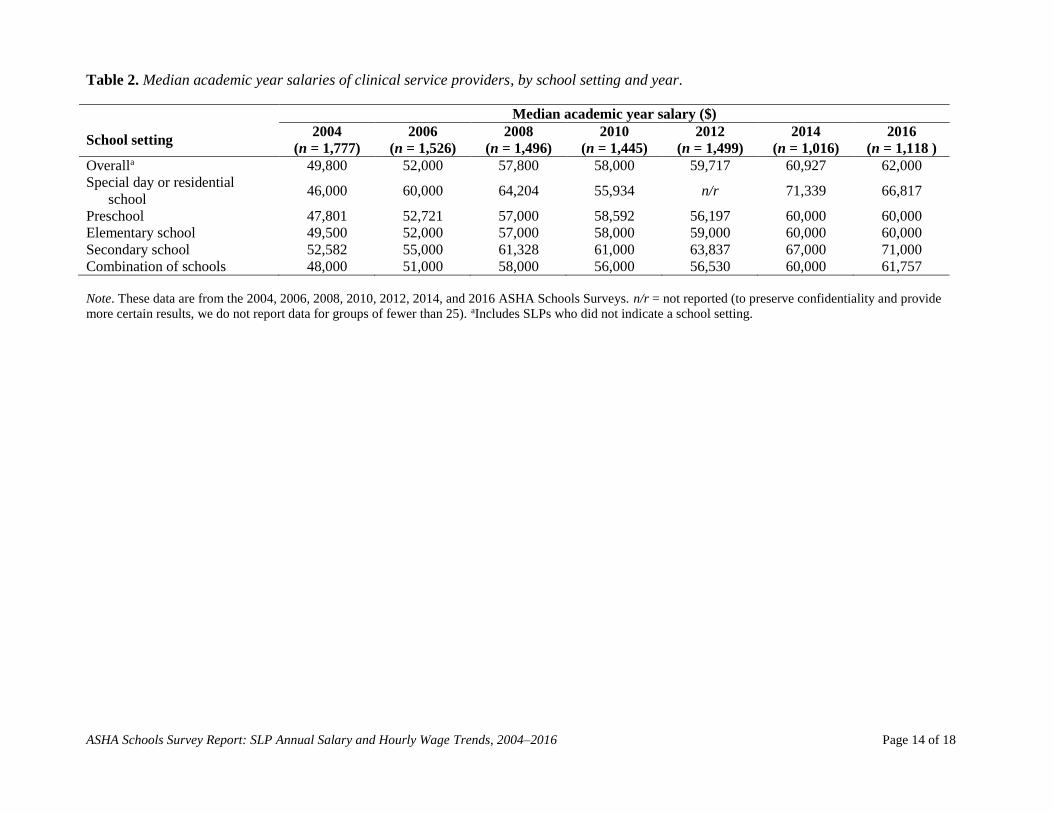
Clinical Service Providers
In 2016, SLPs who were clinical service providers earned a median academic year salary of $62,000, up
from $60,927 in 2014 (a 2% increase; see Appendix Table 2).
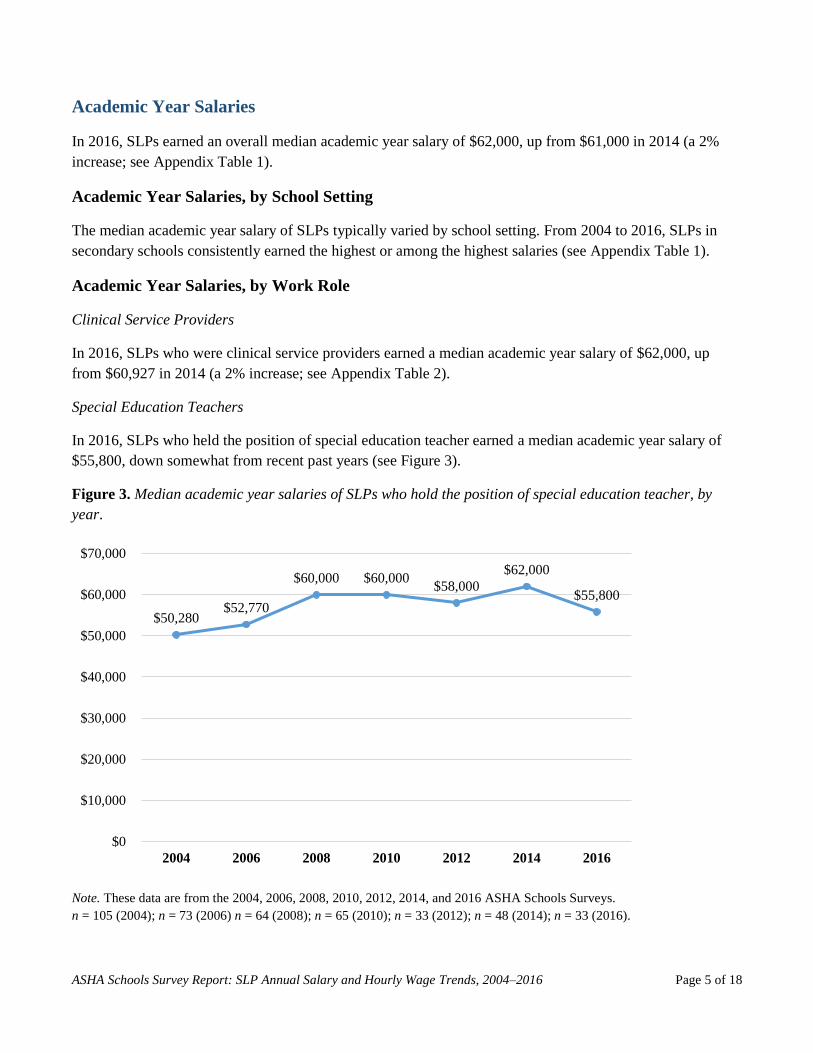
Special Education Teachers
In 2016, SLPs who held the position of special education teacher earned a median academic year salary of
$55,800, down somewhat from recent past years (see Figure 3).
Figure 3. Median academic year salaries of SLPs who hold the position of special education teacher, by
year.
Note. These data are from the 2004, 2006, 2008, 2010, 2012, 2014, and 2016 ASHA Schools Surveys.
n = 105 (2004); n = 73 (2006) n = 64 (2008); n = 65 (2010); n = 33 (2012); n = 48 (2014); n = 33 (2016).
$50,280 $52,770
$60,000 $60,000 $58,000
$62,000
$55,800
$0
$10,000
$20,000
$30,000
$40,000
$50,000
$60,000
$70,000
2004 2006 2008 2010 2012 2014 2016
ASHA Schools Survey Report: SLP Annual Salary and Hourly Wage Trends, 2004–2016 Page 6 of 18
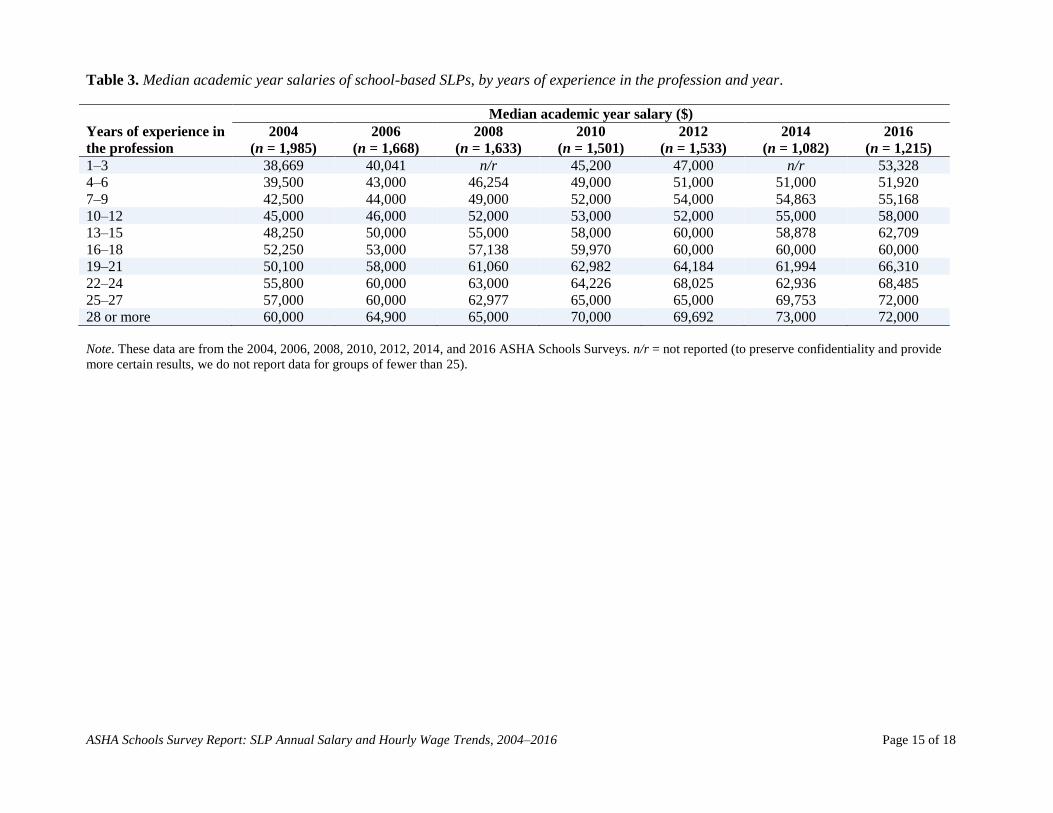
Academic Year Salaries, by Years of Experience in the Profession
As would be expected, the median academic year salary of SLPs tended to increase with years of experience
in the profession. From 2004 to 2016, the most seasoned SLPs earned about $20,000 per year more than
those SLPs who were just starting out (see Appendix Table 3).
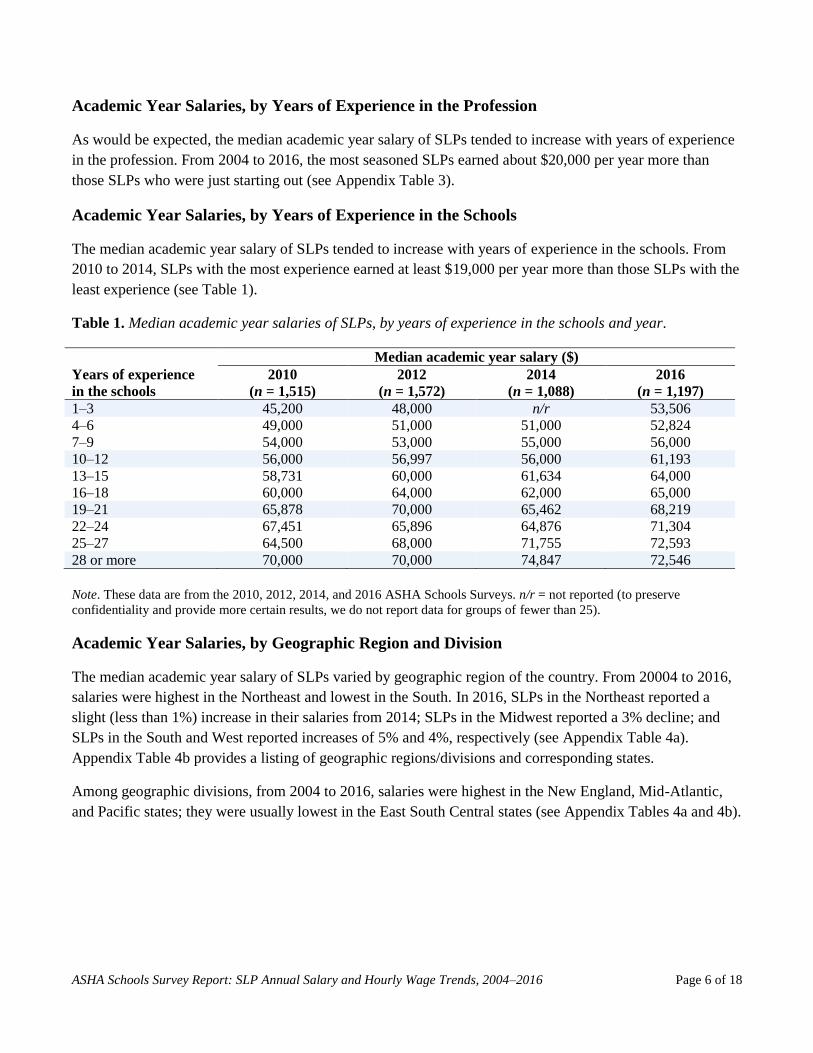
Academic Year Salaries, by Years of Experience in the Schools
The median academic year salary of SLPs tended to increase with years of experience in the schools. From
2010 to 2014, SLPs with the most experience earned at least $19,000 per year more than those SLPs with the
least experience (see Table 1).
Table 1. Median academic year salaries of SLPs, by years of experience in the schools and year.
Median academic year salary ($)
Years of experience
in the schools
2010
(n = 1,515)
2012
(n = 1,572)
2014
(n = 1,088)
2016
(n = 1,197)
1–3 45,200 48,000 n/r 53,506
4–6 49,000 51,000 51,000 52,824
7–9 54,000 53,000 55,000 56,000
10–12 56,000 56,997 56,000 61,193
13–15 58,731 60,000 61,634 64,000
16–18 60,000 64,000 62,000 65,000
19–21 65,878 70,000 65,462 68,219
22–24 67,451 65,896 64,876 71,304
25–27 64,500 68,000 71,755 72,593
28 or more 70,000 70,000 74,847 72,546
Note. These data are from the 2010, 2012, 2014, and 2016 ASHA Schools Surveys. n/r = not reported (to preserve
confidentiality and provide more certain results, we do not report data for groups of fewer than 25).
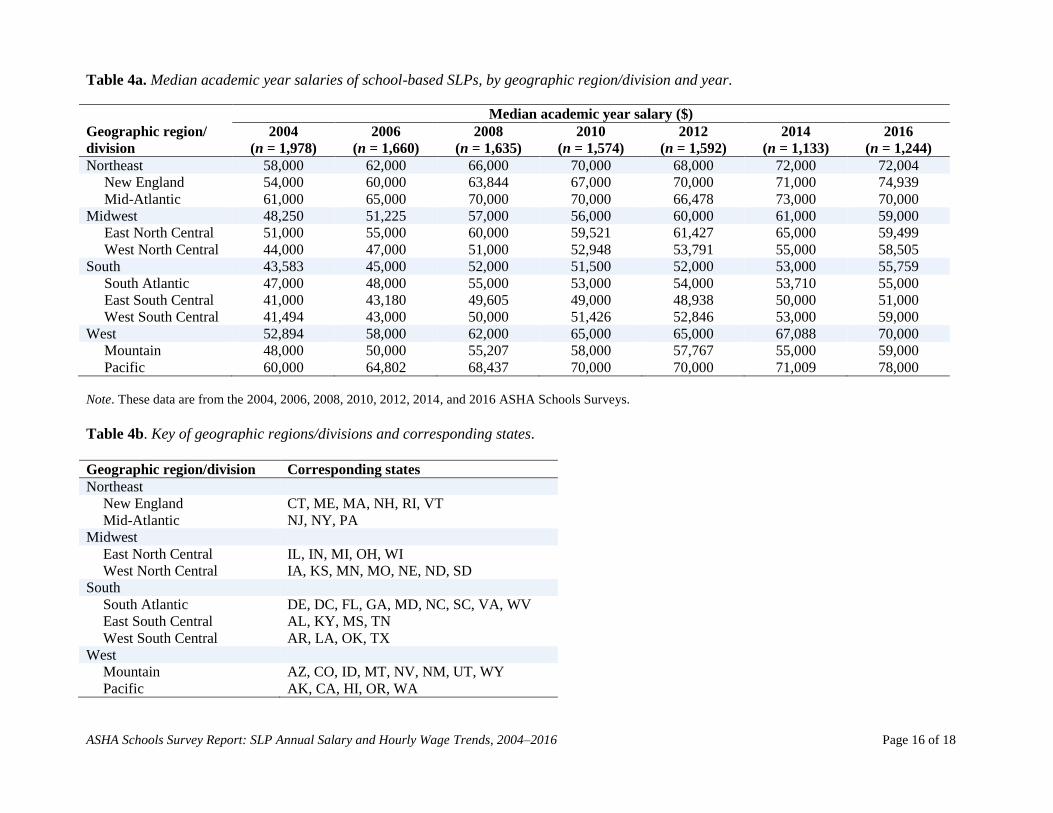
Academic Year Salaries, by Geographic Region and Division
The median academic year salary of SLPs varied by geographic region of the country. From 20004 to 2016,
salaries were highest in the Northeast and lowest in the South. In 2016, SLPs in the Northeast reported a
slight (less than 1%) increase in their salaries from 2014; SLPs in the Midwest reported a 3% decline; and
SLPs in the South and West reported increases of 5% and 4%, respectively (see Appendix Table 4a).
Appendix Table 4b provides a listing of geographic regions/divisions and corresponding states.
Among geographic divisions, from 2004 to 2016, salaries were highest in the New England, Mid-Atlantic,
and Pacific states; they were usually lowest in the East South Central states (see Appendix Tables 4a and 4b).
ASHA Schools Survey Report: SLP Annual Salary and Hourly Wage Trends, 2004–2016 Page 7 of 18
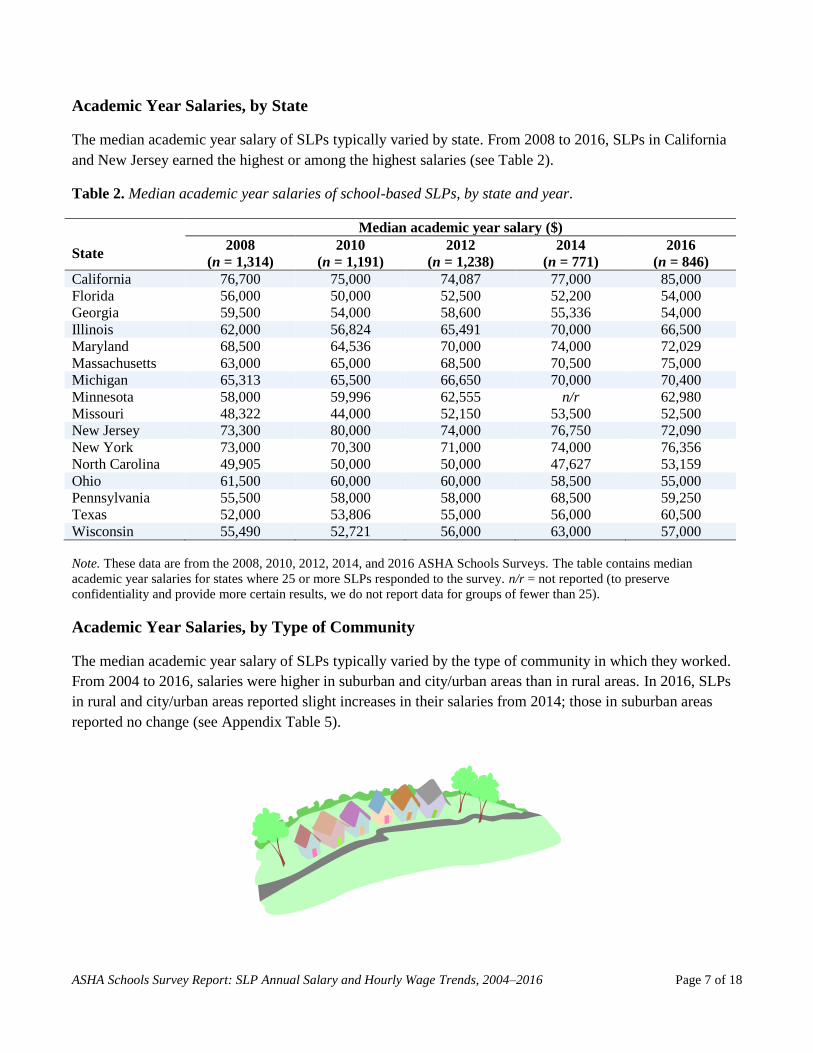
Academic Year Salaries, by State
The median academic year salary of SLPs typically varied by state. From 2008 to 2016, SLPs in California
and New Jersey earned the highest or among the highest salaries (see Table 2).
Table 2. Median academic year salaries of school-based SLPs, by state and year.
Median academic year salary ($)
State 2008
(n = 1,314)
2010
(n = 1,191)
2012
(n = 1,238)
2014
(n = 771)
2016
(n = 846)
California 76,700 75,000 74,087 77,000 85,000
Florida 56,000 50,000 52,500 52,200 54,000
Georgia 59,500 54,000 58,600 55,336 54,000
Illinois 62,000 56,824 65,491 70,000 66,500
Maryland 68,500 64,536 70,000 74,000 72,029
Massachusetts 63,000 65,000 68,500 70,500 75,000
Michigan 65,313 65,500 66,650 70,000 70,400
Minnesota 58,000 59,996 62,555 n/r 62,980
Missouri 48,322 44,000 52,150 53,500 52,500
New Jersey 73,300 80,000 74,000 76,750 72,090
New York 73,000 70,300 71,000 74,000 76,356
North Carolina 49,905 50,000 50,000 47,627 53,159
Ohio 61,500 60,000 60,000 58,500 55,000
Pennsylvania 55,500 58,000 58,000 68,500 59,250
Texas 52,000 53,806 55,000 56,000 60,500
Wisconsin 55,490 52,721 56,000 63,000 57,000
Note. These data are from the 2008, 2010, 2012, 2014, and 2016 ASHA Schools Surveys. The table contains median
academic year salaries for states where 25 or more SLPs responded to the survey. n/r = not reported (to preserve
confidentiality and provide more certain results, we do not report data for groups of fewer than 25).
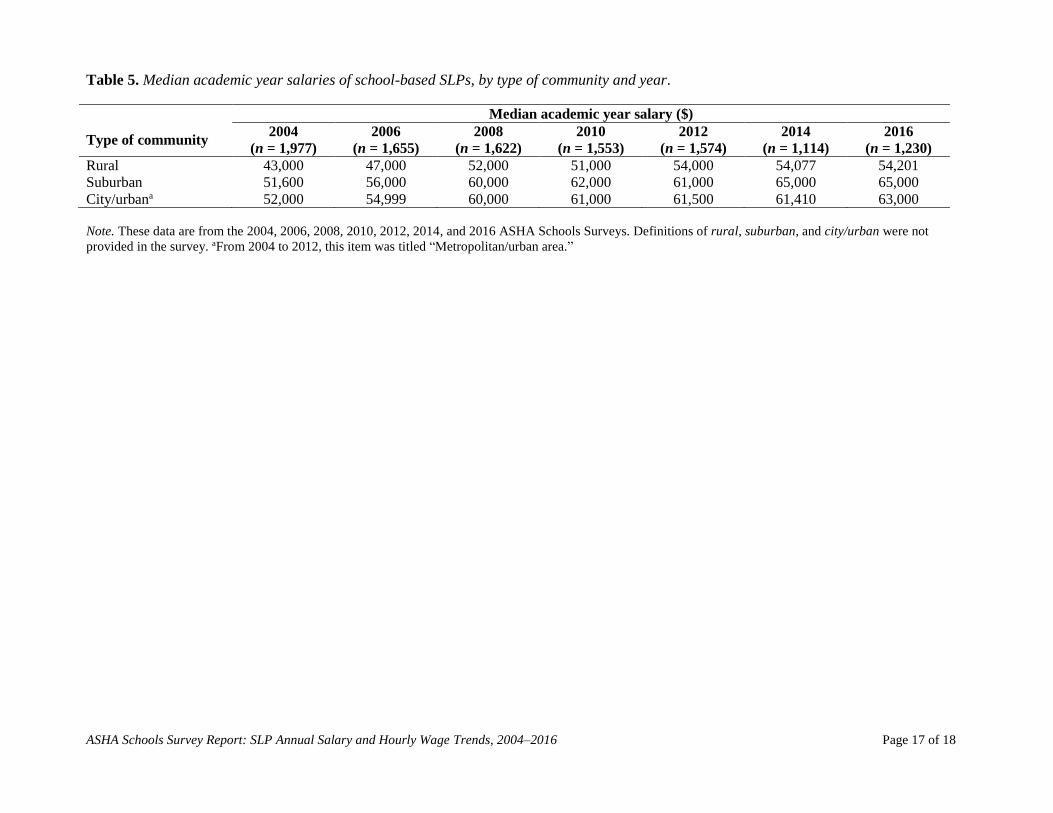
Academic Year Salaries, by Type of Community
The median academic year salary of SLPs typically varied by the type of community in which they worked.
From 2004 to 2016, salaries were higher in suburban and city/urban areas than in rural areas. In 2016, SLPs
in rural and city/urban areas reported slight increases in their salaries from 2014; those in suburban areas
reported no change (see Appendix Table 5).
ASHA Schools Survey Report: SLP Annual Salary and Hourly Wage Trends, 2004–2016 Page 8 of 18
Calendar Year Salaries
In 2016, SLPs earned an overall median calendar year salary of $70,154, down from $72,107 in 2014 (a 3%
decline; see Appendix Table 6).
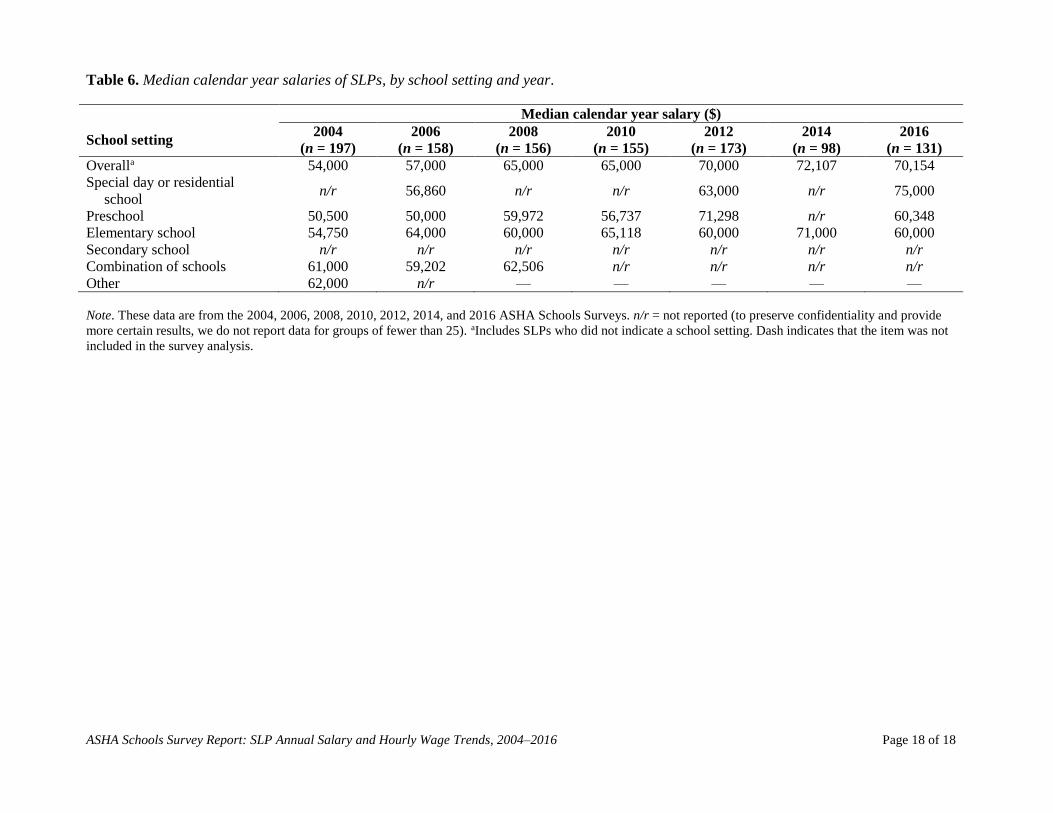
Calendar Year Salaries, by School Setting
The median calendar year salary of SLPs varied by school setting (see Appendix Table 6).
Calendar Year Salaries, by Work Role
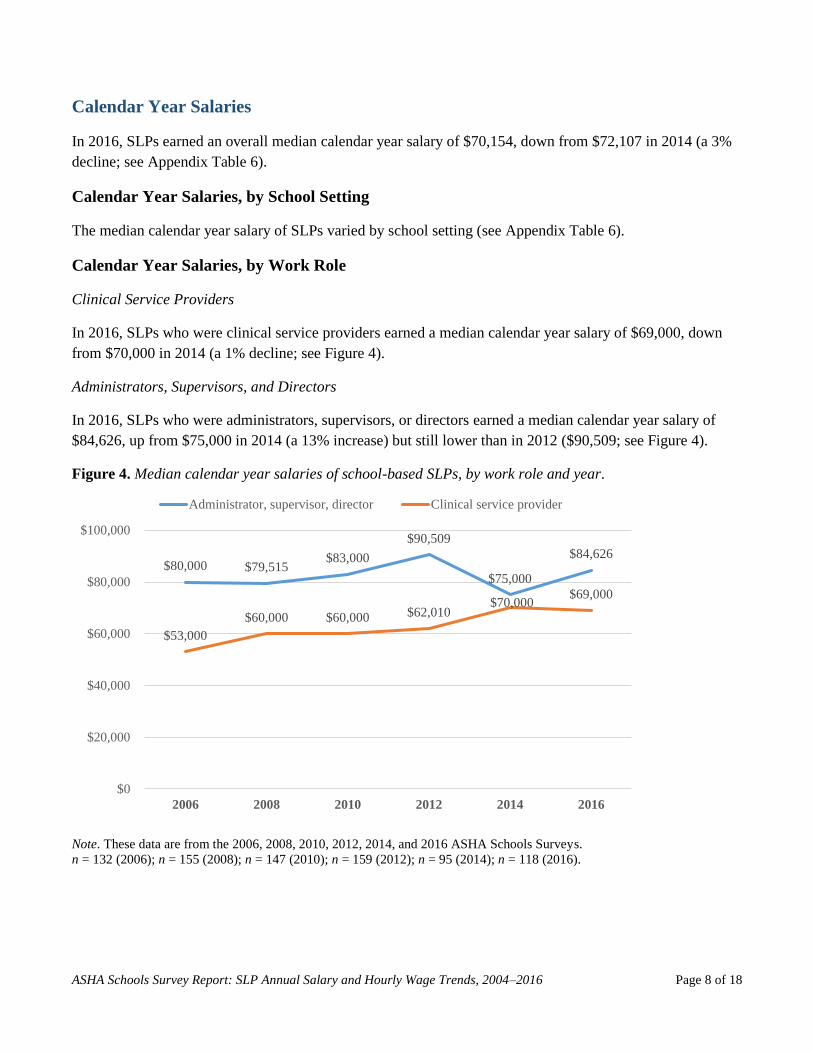
Clinical Service Providers
In 2016, SLPs who were clinical service providers earned a median calendar year salary of $69,000, down
from $70,000 in 2014 (a 1% decline; see Figure 4).
Administrators, Supervisors, and Directors
In 2016, SLPs who were administrators, supervisors, or directors earned a median calendar year salary of
$84,626, up from $75,000 in 2014 (a 13% increase) but still lower than in 2012 ($90,509; see Figure 4).
Figure 4. Median calendar year salaries of school-based SLPs, by work role and year.
Note. These data are from the 2006, 2008, 2010, 2012, 2014, and 2016 ASHA Schools Surveys.
n = 132 (2006); n = 155 (2008); n = 147 (2010); n = 159 (2012); n = 95 (2014); n = 118 (2016).
$80,000 $79,515 $83,000
$90,509
$75,000
$84,626
$53,000
$60,000 $60,000 $62,010 $70,000
$69,000
$0
$20,000
$40,000
$60,000
$80,000
$100,000
2006 2008 2010 2012 2014 2016
Administrator, supervisor, director Clinical service provider
ASHA Schools Survey Report: SLP Annual Salary and Hourly Wage Trends, 2004–2016 Page 9 of 18
Hourly Wages
In 2016, SLPs earned an overall median hourly wage of $49.50, down from $50.00 in 2010 and 2012 and
down from $53.76 in 2014 (see Table 3). They worked a median of 21 hours per week, down somewhat from
previous years (24 hours in 2010, 22 hours in 2012, and 23 hours in 2014).
Hourly Wages, by School Setting
Median hourly wages of SLPs typically varied by school setting (see Table 3).
Table 3. Median hourly wage of SLPs, by school setting and year.
Median hourly wage ($)
School Setting 2010
(n = 248)
2012
(n = 280)
2014
(n = 165)
2016
(n = 212)
Overalla 50.00 50.00 53.76 49.50
Special day or residential school n/r n/r n/r n/r
Preschool 51.50 54.74 48.00 n/r
Elementary school 50.00 50.00 55.00 52.00
Secondary school n/r 50.00 46.81 n/r
Combination of schools 50.00 50.07 n/r 45.00
Note. These data are from the 2010, 2012, 2014, and 2016 ASHA Schools Surveys. n/r = not reported (to preserve
confidentiality and provide more certain results, we do not report data for groups of fewer than 25). aIncludes SLPs who did
not indicate a school setting.
Hourly Wages of Contractors From 2010 to 2016, most SLPs who were paid an hourly wage were contractors. In 2016, their median
hourly wage was $49.76, down from recent past years (see Table 4).
Hourly Wages of Contractors, by Geographic Region
Median hourly wages of SLPs who are contractors varied by geographic region of the country. From 2010 to
2016, wages were highest in the Northeast (see Table 4).
Table 4. Median hourly wages of SLPs who are contractors, by region of the country and year.
Median hourly wage ($)
Region 2010
(n = 191)
2012
(n = 236)
2014
(n = 159)
2016
(n = 212)
Overall 50.00 52.55 55.00 49.76
Northeast — 63.93 63.00 59.23
Midwest — 49.46 n/r 40.00
South — 51.27 50.00 49.00
West — 51.00 60.00 52.56
Note. These data are from the 2010, 2012, 2014, and 2016 ASHA Schools Surveys. n/r = not reported (to preserve
confidentiality and provide more certain results, we do not report data for groups of fewer than 25. Dash indicates that the
item was not included in the survey analysis.
ASHA Schools Survey Report: SLP Annual Salary and Hourly Wage Trends, 2004–2016 Page 10 of 18
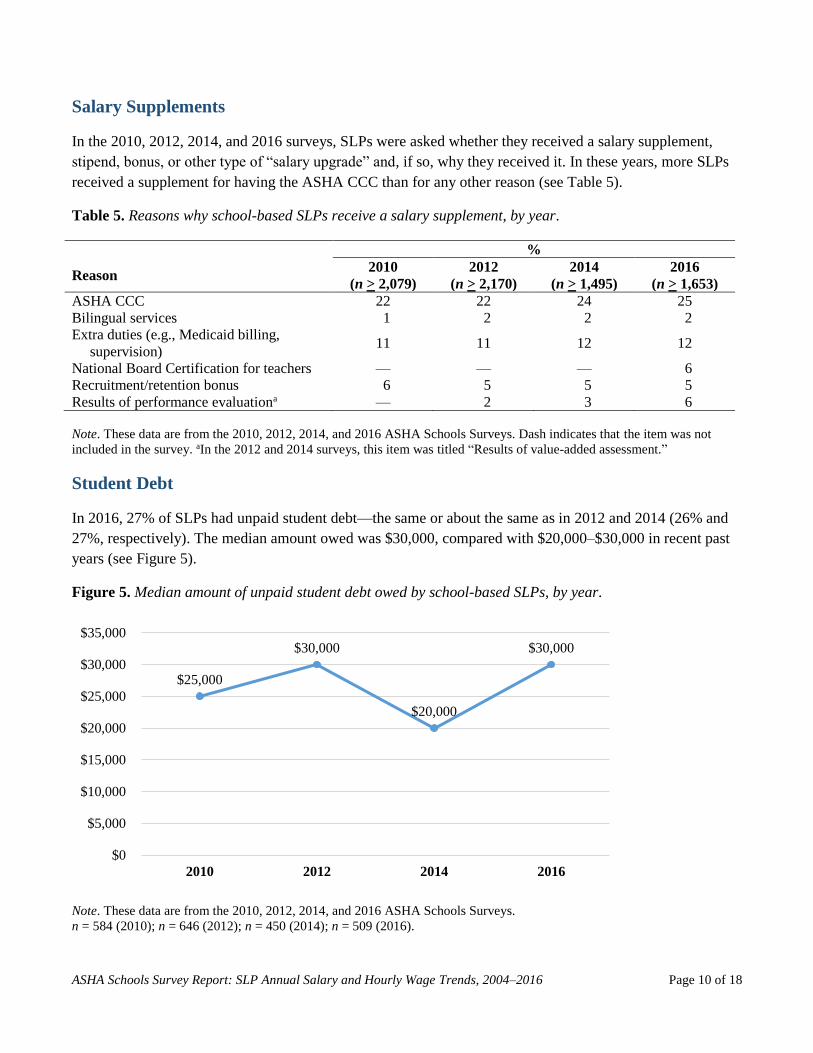
Salary Supplements
In the 2010, 2012, 2014, and 2016 surveys, SLPs were asked whether they received a salary supplement,
stipend, bonus, or other type of “salary upgrade” and, if so, why they received it. In these years, more SLPs
received a supplement for having the ASHA CCC than for any other reason (see Table 5).
Table 5. Reasons why school-based SLPs receive a salary supplement, by year.
%
Reason 2010
(n > 2,079)
2012
(n > 2,170)
2014
(n > 1,495)
2016
(n > 1,653)
ASHA CCC 22 22 24 25
Bilingual services 1 2 2 2
Extra duties (e.g., Medicaid billing,
supervision) 11 11 12 12
National Board Certification for teachers — — — 6
Recruitment/retention bonus 6 5 5 5
Results of performance evaluationa — 2 3 6
Note. These data are from the 2010, 2012, 2014, and 2016 ASHA Schools Surveys. Dash indicates that the item was not
included in the survey. aIn the 2012 and 2014 surveys, this item was titled “Results of value-added assessment.”
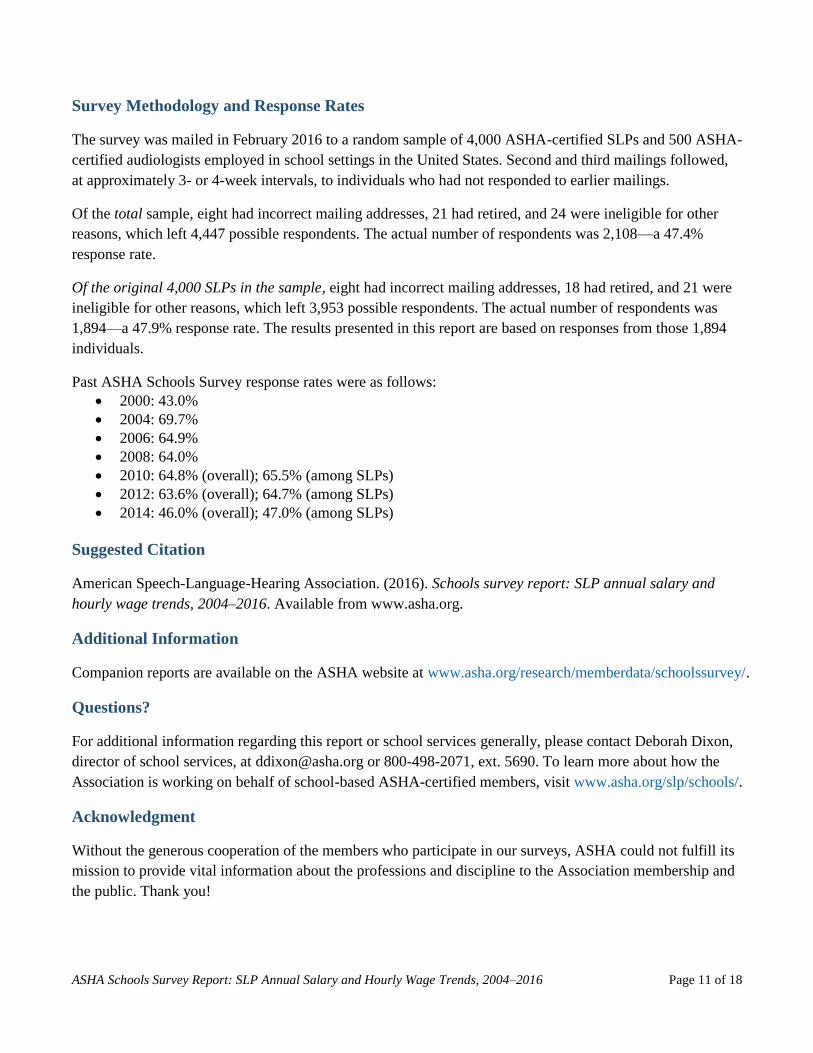
Student Debt
In 2016, 27% of SLPs had unpaid student debt—the same or about the same as in 2012 and 2014 (26% and
27%, respectively). The median amount owed was $30,000, compared with $20,000–$30,000 in recent past
years (see Figure 5).
Figure 5. Median amount of unpaid student debt owed by school-based SLPs, by year.
Note. These data are from the 2010, 2012, 2014, and 2016 ASHA Schools Surveys.
n = 584 (2010); n = 646 (2012); n = 450 (2014); n = 509 (2016).
$25,000
$30,000
$20,000
$30,000
$0
$5,000
$10,000
$15,000
$20,000
$25,000
$30,000
$35,000
2010 2012 2014 2016
ASHA Schools Survey Report: SLP Annual Salary and Hourly Wage Trends, 2004–2016 Page 11 of 18
Survey Methodology and Response Rates
The survey was mailed in February 2016 to a random sample of 4,000 ASHA-certified SLPs and 500 ASHA-
certified audiologists employed in school settings in the United States. Second and third mailings followed,
at approximately 3- or 4-week intervals, to individuals who had not responded to earlier mailings.
Of the total sample, eight had incorrect mailing addresses, 21 had retired, and 24 were ineligible for other
reasons, which left 4,447 possible respondents. The actual number of respondents was 2,108—a 47.4%
response rate.
Of the original 4,000 SLPs in the sample, eight had incorrect mailing addresses, 18 had retired, and 21 were
ineligible for other reasons, which left 3,953 possible respondents. The actual number of respondents was
1,894—a 47.9% response rate. The results presented in this report are based on responses from those 1,894
individuals.
Past ASHA Schools Survey response rates were as follows:
2000: 43.0%
2004: 69.7%
2006: 64.9%
2008: 64.0%
2010: 64.8% (overall); 65.5% (among SLPs)
2012: 63.6% (overall); 64.7% (among SLPs)
2014: 46.0% (overall); 47.0% (among SLPs)
Suggested Citation
American Speech-Language-Hearing Association. (2016). Schools survey report: SLP annual salary and
hourly wage trends, 2004–2016. Available from www.asha.org.
Additional Information
Companion reports are available on the ASHA website at www.asha.org/research/memberdata/schoolssurvey/.
Questions?
For additional information regarding this report or school services generally, please contact Deborah Dixon,
director of school services, at [email protected] or 800-498-2071, ext. 5690. To learn more about how the
Association is working on behalf of school-based ASHA-certified members, visit www.asha.org/slp/schools/.
Acknowledgment
Without the generous cooperation of the members who participate in our surveys, ASHA could not fulfill its
mission to provide vital information about the professions and discipline to the Association membership and
the public. Thank you!
ASHA Schools Survey Report: SLP Annual Salary and Hourly Wage Trends, 2004–2016 Page 12 of 18
Appendix
ASHA Schools Survey Report: SLP Annual Salary and Hourly Wage Trends, 2004–2016 Page 13 of 18
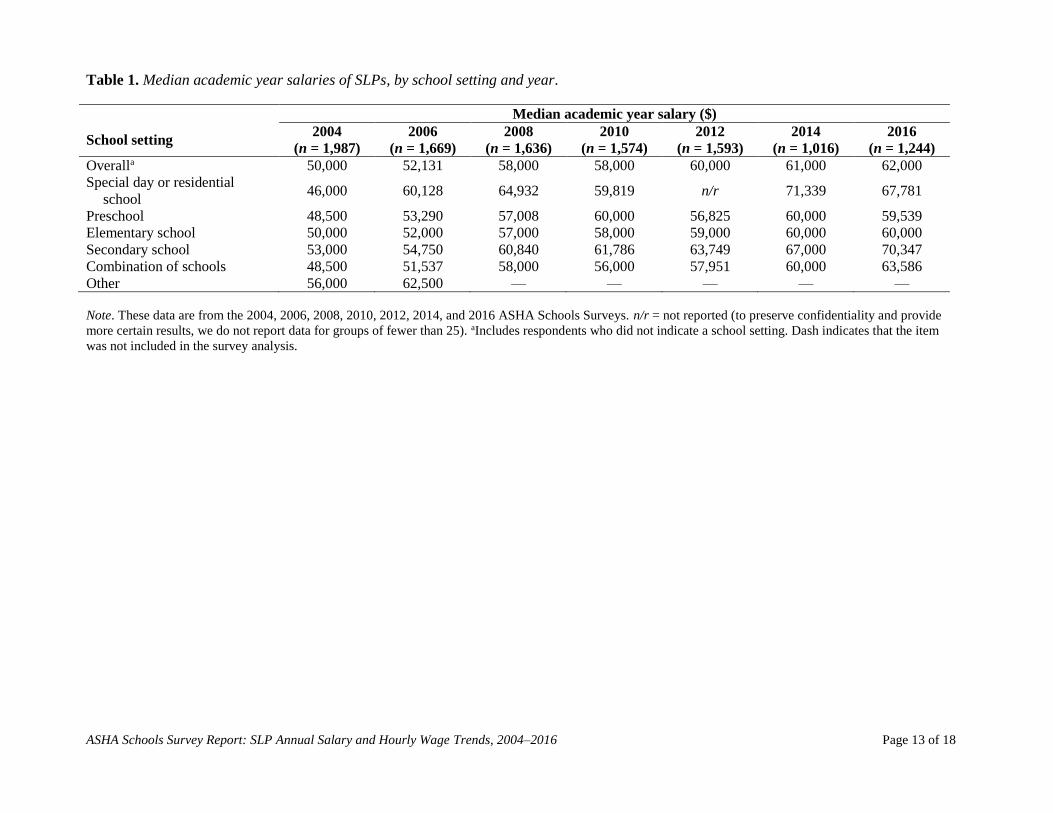
Table 1. Median academic year salaries of SLPs, by school setting and year.
Median academic year salary ($)
School setting 2004
(n = 1,987)
2006
(n = 1,669)
2008
(n = 1,636)
2010
(n = 1,574)
2012
(n = 1,593)
2014
(n = 1,016)
2016
(n = 1,244)
Overalla 50,000 52,131 58,000 58,000 60,000 61,000 62,000
Special day or residential
school 46,000 60,128 64,932 59,819 n/r 71,339 67,781
Preschool 48,500 53,290 57,008 60,000 56,825 60,000 59,539
Elementary school 50,000 52,000 57,000 58,000 59,000 60,000 60,000
Secondary school 53,000 54,750 60,840 61,786 63,749 67,000 70,347
Combination of schools 48,500 51,537 58,000 56,000 57,951 60,000 63,586
Other 56,000 62,500 — — — — —
Note. These data are from the 2004, 2006, 2008, 2010, 2012, 2014, and 2016 ASHA Schools Surveys. n/r = not reported (to preserve confidentiality and provide
more certain results, we do not report data for groups of fewer than 25). aIncludes respondents who did not indicate a school setting. Dash indicates that the item
was not included in the survey analysis.
ASHA Schools Survey Report: SLP Annual Salary and Hourly Wage Trends, 2004–2016 Page 14 of 18
Table 2. Median academic year salaries of clinical service providers, by school setting and year.
Median academic year salary ($)
School setting 2004
(n = 1,777)
2006
(n = 1,526)
2008
(n = 1,496)
2010
(n = 1,445)
2012
(n = 1,499)
2014
(n = 1,016)
2016
(n = 1,118 )
Overalla 49,800 52,000 57,800 58,000 59,717 60,927 62,000
Special day or residential
school 46,000 60,000 64,204 55,934 n/r 71,339 66,817
Preschool 47,801 52,721 57,000 58,592 56,197 60,000 60,000
Elementary school 49,500 52,000 57,000 58,000 59,000 60,000 60,000
Secondary school 52,582 55,000 61,328 61,000 63,837 67,000 71,000
Combination of schools 48,000 51,000 58,000 56,000 56,530 60,000 61,757
Note. These data are from the 2004, 2006, 2008, 2010, 2012, 2014, and 2016 ASHA Schools Surveys. n/r = not reported (to preserve confidentiality and provide
more certain results, we do not report data for groups of fewer than 25). aIncludes SLPs who did not indicate a school setting.
ASHA Schools Survey Report: SLP Annual Salary and Hourly Wage Trends, 2004–2016 Page 15 of 18
Table 3. Median academic year salaries of school-based SLPs, by years of experience in the profession and year.
Median academic year salary ($)
Years of experience in
the profession
2004
(n = 1,985)
2006
(n = 1,668)
2008
(n = 1,633)
2010
(n = 1,501)
2012
(n = 1,533)
2014
(n = 1,082)
2016
(n = 1,215)
1–3 38,669 40,041 n/r 45,200 47,000 n/r 53,328
4–6 39,500 43,000 46,254 49,000 51,000 51,000 51,920
7–9 42,500 44,000 49,000 52,000 54,000 54,863 55,168
10–12 45,000 46,000 52,000 53,000 52,000 55,000 58,000
13–15 48,250 50,000 55,000 58,000 60,000 58,878 62,709
16–18 52,250 53,000 57,138 59,970 60,000 60,000 60,000
19–21 50,100 58,000 61,060 62,982 64,184 61,994 66,310
22–24 55,800 60,000 63,000 64,226 68,025 62,936 68,485
25–27 57,000 60,000 62,977 65,000 65,000 69,753 72,000
28 or more 60,000 64,900 65,000 70,000 69,692 73,000 72,000
Note. These data are from the 2004, 2006, 2008, 2010, 2012, 2014, and 2016 ASHA Schools Surveys. n/r = not reported (to preserve confidentiality and provide
more certain results, we do not report data for groups of fewer than 25).
ASHA Schools Survey Report: SLP Annual Salary and Hourly Wage Trends, 2004–2016 Page 16 of 18
Table 4a. Median academic year salaries of school-based SLPs, by geographic region/division and year.
Median academic year salary ($)
Geographic region/
division
2004
(n = 1,978)
2006
(n = 1,660)
2008
(n = 1,635)
2010
(n = 1,574)
2012
(n = 1,592)
2014
(n = 1,133)
2016
(n = 1,244)
Northeast 58,000 62,000 66,000 70,000 68,000 72,000 72,004
New England 54,000 60,000 63,844 67,000 70,000 71,000 74,939
Mid-Atlantic 61,000 65,000 70,000 70,000 66,478 73,000 70,000
Midwest 48,250 51,225 57,000 56,000 60,000 61,000 59,000
East North Central 51,000 55,000 60,000 59,521 61,427 65,000 59,499
West North Central 44,000 47,000 51,000 52,948 53,791 55,000 58,505
South 43,583 45,000 52,000 51,500 52,000 53,000 55,759
South Atlantic 47,000 48,000 55,000 53,000 54,000 53,710 55,000
East South Central 41,000 43,180 49,605 49,000 48,938 50,000 51,000
West South Central 41,494 43,000 50,000 51,426 52,846 53,000 59,000
West 52,894 58,000 62,000 65,000 65,000 67,088 70,000
Mountain 48,000 50,000 55,207 58,000 57,767 55,000 59,000
Pacific 60,000 64,802 68,437 70,000 70,000 71,009 78,000
Note. These data are from the 2004, 2006, 2008, 2010, 2012, 2014, and 2016 ASHA Schools Surveys.
Table 4b. Key of geographic regions/divisions and corresponding states.
Geographic region/division Corresponding states
Northeast
New England CT, ME, MA, NH, RI, VT
Mid-Atlantic NJ, NY, PA
Midwest
East North Central IL, IN, MI, OH, WI
West North Central IA, KS, MN, MO, NE, ND, SD
South
South Atlantic DE, DC, FL, GA, MD, NC, SC, VA, WV
East South Central AL, KY, MS, TN
West South Central AR, LA, OK, TX
West
Mountain AZ, CO, ID, MT, NV, NM, UT, WY
Pacific AK, CA, HI, OR, WA
ASHA Schools Survey Report: SLP Annual Salary and Hourly Wage Trends, 2004–2016 Page 17 of 18
Table 5. Median academic year salaries of school-based SLPs, by type of community and year.
Median academic year salary ($)
Type of community 2004
(n = 1,977)
2006
(n = 1,655)
2008
(n = 1,622)
2010
(n = 1,553)
2012
(n = 1,574)
2014
(n = 1,114)
2016
(n = 1,230)
Rural 43,000 47,000 52,000 51,000 54,000 54,077 54,201
Suburban 51,600 56,000 60,000 62,000 61,000 65,000 65,000
City/urbana 52,000 54,999 60,000 61,000 61,500 61,410 63,000
Note. These data are from the 2004, 2006, 2008, 2010, 2012, 2014, and 2016 ASHA Schools Surveys. Definitions of rural, suburban, and city/urban were not
provided in the survey. aFrom 2004 to 2012, this item was titled “Metropolitan/urban area.”
ASHA Schools Survey Report: SLP Annual Salary and Hourly Wage Trends, 2004–2016 Page 18 of 18
Table 6. Median calendar year salaries of SLPs, by school setting and year.
Median calendar year salary ($)
School setting 2004
(n = 197)
2006
(n = 158)
2008
(n = 156)
2010
(n = 155)
2012
(n = 173)
2014
(n = 98)
2016
(n = 131)
Overalla 54,000 57,000 65,000 65,000 70,000 72,107 70,154
Special day or residential
school n/r 56,860 n/r n/r 63,000 n/r 75,000
Preschool 50,500 50,000 59,972 56,737 71,298 n/r 60,348
Elementary school 54,750 64,000 60,000 65,118 60,000 71,000 60,000
Secondary school n/r n/r n/r n/r n/r n/r n/r
Combination of schools 61,000 59,202 62,506 n/r n/r n/r n/r
Other 62,000 n/r — — — — —
Note. These data are from the 2004, 2006, 2008, 2010, 2012, 2014, and 2016 ASHA Schools Surveys. n/r = not reported (to preserve confidentiality and provide
more certain results, we do not report data for groups of fewer than 25). aIncludes SLPs who did not indicate a school setting. Dash indicates that the item was not
included in the survey analysis.