Embed Size (px)
Citation preview
ISSN 8755-6839
SCIENCE OF TSUNAMI HAZARDS
Journal of Tsunami Society International
Volume 35 Number 2 2016
METHODS OF TSUNAMI DETECTION AND OF POST-TSUNAMI SURVEYS
A. Kurkin1, V. Belyakov1, V. Makarov1), D. Zeziulin1, and E. Pelinovsky1,2,3
1 Nizhny Novgorod State Technical University, Nizhny Novgorod, Russia 2 Institute of Applied Physics, Nizhny Novgorod, Russia 3 National Research University – Higher School of Economics, Nizhny Novgorod, Russia
ABSTRACT
In our paper we describe some of the methods of the last 25 years which have been used extensively to examine and register tsunami traces - particularly by satellite imaging of coastal zones before and after a tsunami has struck, thus assessing quickly the extent of coastal inundation over large areas without the need of a site visit. Nearly all countries bordering oceans, seas and bodies of water have established digital systems of water level registration in the range of tsunami waves. In this article we describe methods of tsunami detection and runup measurements, some based on our own participation in post-tsunami surveys. Also, we discuss the possibility of using robotic systems to survey tsunami traces in hard-to- reach places.
Vol. 35, No. 2, Page 68, (2016)
1. INTRODUCTION
In the 21st century destructive tsunamis caused maximum number of casualties compared to other natural disasters (Pararas-Carayannis, 2006; Bernard et al, 2006; Gusiakov, 2009, 2014). The great earthquake of December 26, 2004, near Sumatra in Indonesia which had moment magnitude (Mw) of 9.3, generated a devastating tsunami in the Indian Ocean, and resulted it the deaths of about 300,000 people (Titov et al, 2005a; Choi et al, 2006). The maximum height of the tsunami wave runup on the shore exceeded 50 meters in certain coastal areas (Kim et al, 2013a). Also, the earthquake of March 11, 2011 off the Island of Honshu in Japan, with moment magnitude of 9.0, triggered another devastating tsunami with the maximum height of about 40 m (Mori et al, 2012; Choi et al, 2012; Kim et al, 2013b; Pararas-Carayannis, G. 2014), resulting also in the destruction of the Fukushima-Daichi nuclear power plant. On the average, tsunamis occur globally almost every month, but only one in ten (about once a year) leads to damage. On July 9, 1958 a large earthquake along the Fairweather Fault struck Southeastern Alaska. A combination of disturbances triggered by the earthquake triggered a giant rockfall of about 80 million cubic meters off the slopes of a mountain into the Gilbert Inlet of Lituya Bay, Alaska, resulting in the greatest tsunami runup height of 524 m (1,720 feet) on the opposite side (Pararas-Carayannis, 1999; Gusiakov, 2009). Fortunately, since then, national and international tsunami warning services have been created and their effectiveness is constantly improving, especially in predicting distant tsunamis (Titov, 2009). Presently, forecasting tsunamis and their potential impact, has improved considerably and timely-issued warnings are communicated to residents of threatened coastal areas where preparedness includes programs of public education, training of civil defense officials, the designation of safe evacuation zones and other disaster mitigation schemes. Also, Russia has been impacted in the past by several tsunami disasters. The most destructive tsunami in the post-war history, occurred on November 4-5, 1952 off the coast of Kamchatka and had wave heights of about 10 meters, significantly inflicted destruction at Severo-Kurilsk on Paramushir Island (Kuril Islands) and resulting in the deaths of many of its residents (Gusiakov, 2009). Already in the present century several other large tsunamis occured in the Far East of Russia. In the Kuril Islands, tsunamis on November 15, 2006 and January 13, 2007, had heights of over 10 meters and even had far reaching impact, inflicted damage on the US coast (Laverov et al, 2009). The Nevelsky earthquake of 2007 generated a tsunami of 2 meters in height and was recorded in Sakhalin (Zaitsev et al., 2008). Tsunamis from distant sources originated from Samoa in 2009 and from Chile in 2010 and were recorded by tide-gauges in Russia (Shevchenko et al, 2013). Finally, the 2011 tsunami from Japan caused cracking of the ice cover in the Kuril Islands (Kaistrenko et al, 2013). Tsunamis have not been limited only to the Far East region of Russia. More than 20 tsunamis were recorded in the Black Sea (Dotsenko, 1995; Yalciner et al, 2004; Papadopoulos, 2011; Zaitsev and Pelinovsky, 2011) and about ten more in the Caspian Sea (Dotsenko et al, 2000). Also tsunami-like phenomena have occurred in inland bodies of waters, such as rivers, lakes and reservoirs (Didenkulova and Pelinovsky, 2006; Torsvik et al, 2010).
Vol. 35, No. 2, Page 69, (2016)
A variety of information about tsunamis, the mechanisms of their occurrence and their impact on coastal areas can be found in several books and historical tsunami catalogs (Murty, 1977; Pelinovsky, 1996a; Pararas-Carayannis, 2000; Bryant, 2008; Levin and Nosov, 2009, 2016), as well as on a number of web sites. To understand the physics of tsunamis and the development of methods needed to mitigate their potential damage, it is very important to have reliable data of tsunami terminal characteristics on the coast. After the occurrence of a damaging tsunami, surveys are usually being carried out by national teams using different methodologies to measure inundation and maximum wave heights. Initial guidelines for the conduct of tsunamis surveys were formulated by scientists at ITIC and at the Joint Institute of Marine and Atmospheric Research (JIMAR) of the University of Hawaii (Loomis, 1981; Curtis, 1982). Earlier versions of guidelines for field surveys were used by international teams after the tsunami of 1992 on Baby Island in Indonesia. Since then, guidelines were further developed with unified standards and specific lists of characteristics that needed to be gathered and documented. Finally, such guidelines for the conduct of tsunamis surveys were subsequently expanded and incorporated in 1998 by ITIC’s Director (Pararas-Carayannis, 1998) into IOC manuals and guides #37 (Intergovernmental Oceanographic Commission (of UNESCO), 1998) and subsequently internationally adopted by the member states of the IOC-ITSU Group, including Russia. Over the years the conduct of such surveys has been summarized in several other scientific publications (Farreras, 1998, 2000; Synolakis and Okal, 2005; Dominey-Howes, 2014). One of the authors of the present paper (EP) participated in international tsunami surveys since 1993 (tsunami in the Sea of Japan), and gained experience which was summarized in Russian in an unpublished document (Pelinovsky, 1996b).
During surveys, accounts of observations from local residents are gathered and measurements are made of the tsunami’s, arrival time, the number and polarity of the waves and of the maximum run-up heights. However, as a rule, the managers of the survey get to the stricken area a week or two after the event, when part of the local witnesses have already left the disaster area, and some of the visible traces of the tsunami are lost due to storms, rainfall or recovery work. Nevertheless, the data obtained by each expedition is very useful as the main source for further action to be taken in order to improve tsunami prediction and preparedness for hazard mitigation. Also over the past 20 years, “non-traditional” methods have been developed for tsunami surveys which enable better planning in studying each tsunami and collection more efficiently of data in remote places. An overview of such methods is the subject of the present article. 2. SATELLITE IMAGERY Aerial and satellite data is now routinely used to provide timely information about a tsunami, particularly when it is difficult to plan and execute an in situ survey at a remote impact area – given also the shortage of time and funding. During the expedition to the Kuril Islands to document the 1994 Shikotan tsunami (Kaistrenko et al., 2014), for the first time the Russian team used aerial photography, thus allowing the evaluation and determination of the extent of inundation along the entire length of the coastal zone, as well as obtaining an approximation of the runup by using
Vol. 35, No. 2, Page 70, (2016)
topographic maps. Such methods were used to collect tsunami data on the Island of Kunashir, subsequently followed by field survey which confirmed the reliability of the images. The United States also had used analysis of satellite imagery of the coast of Japan to assess water runup heights for the 1993 Okushiri tsunami in the Sea of Japan. The images were in good agreement with the data collected by direct measurements of the field investigation (Synolakis and Okal, 2005; Bernard et al, 2006). These experiences show the validity of quickly obtaining “spatial” information after the occurrence of a tsunami event and the impact of the hazard. Best known are the satellite images which were obtained for the 2004 tsunami in the Indian Ocean, aince it was possible to get before and after imagery from vast areas which was made available via the Internet. Some of the images are unique, such as the picture of the exposed bottom on the west coast of Sri Lanka during the 2004 tsunami (http://www.hanselman.com/blog/content/binary/srilanka_ kalutara_beach2_ dec26_2004_dg.jpg).
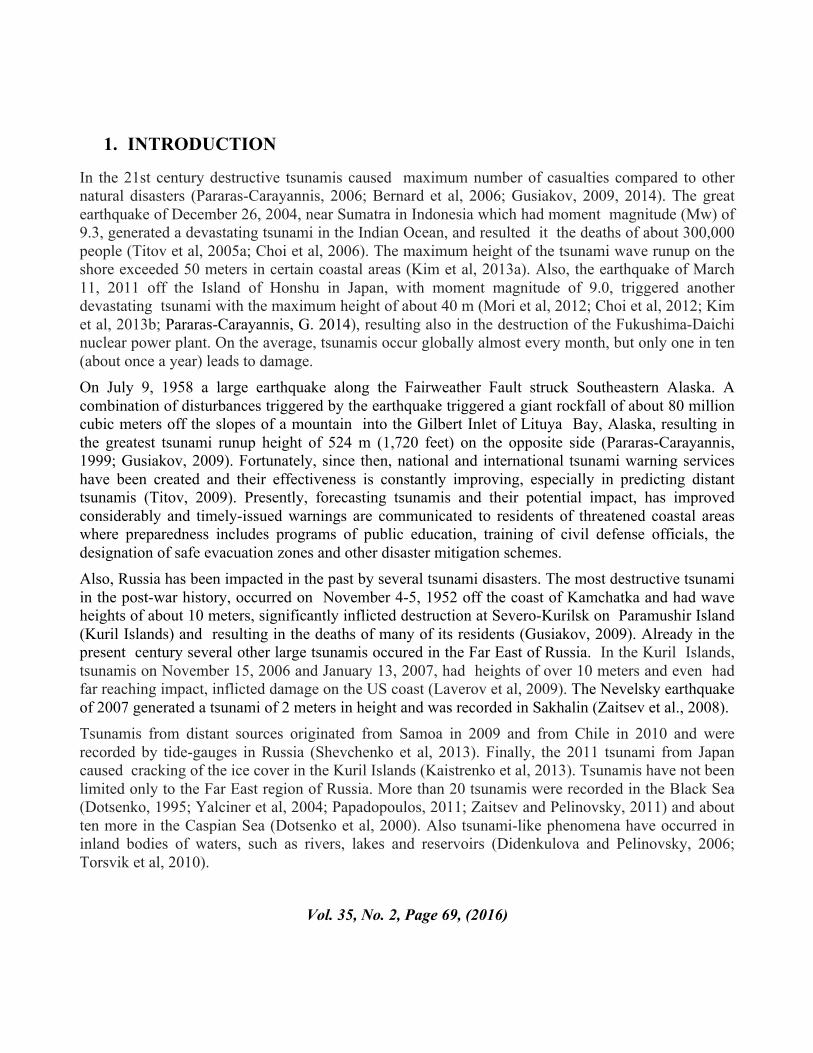
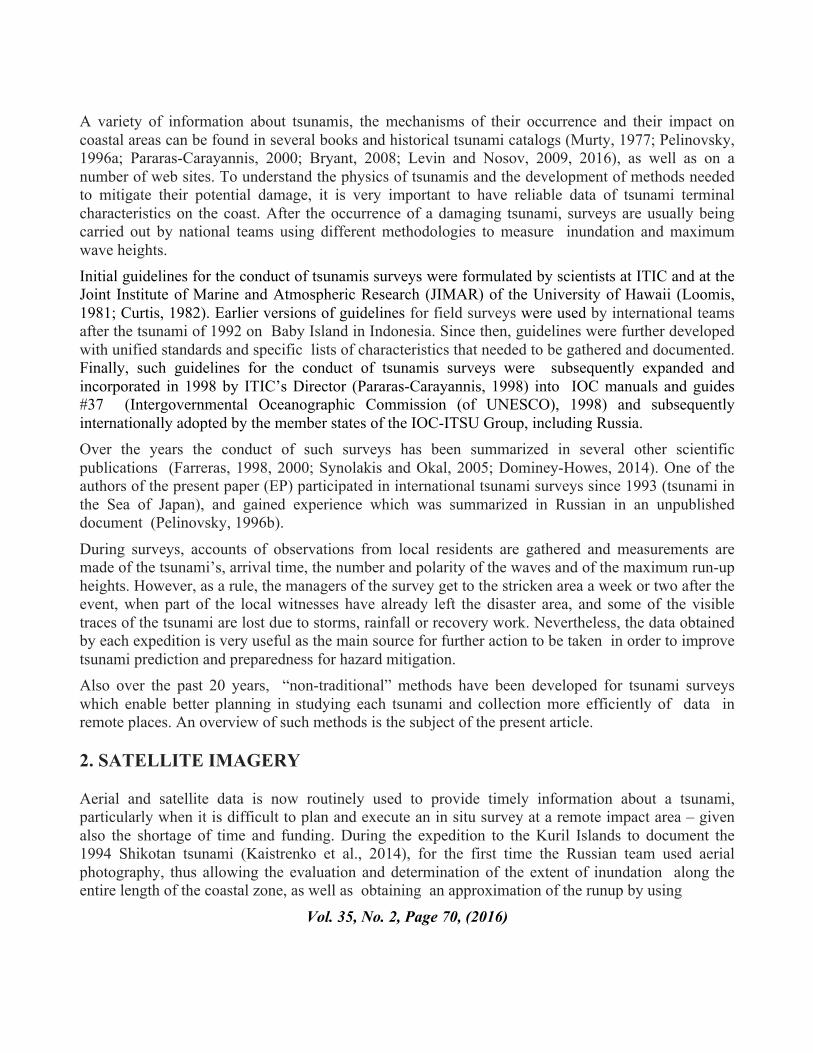
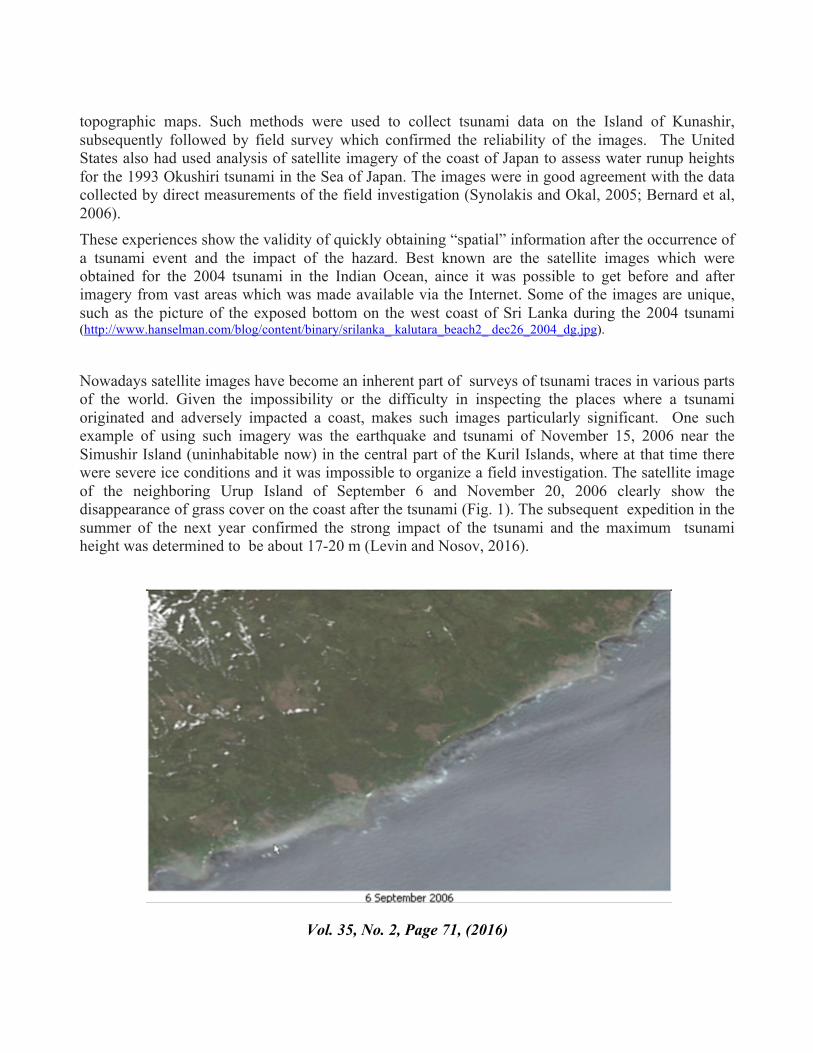
Nowadays satellite images have become an inherent part of surveys of tsunami traces in various parts of the world. Given the impossibility or the difficulty in inspecting the places where a tsunami originated and adversely impacted a coast, makes such images particularly significant. One such example of using such imagery was the earthquake and tsunami of November 15, 2006 near the Simushir Island (uninhabitable now) in the central part of the Kuril Islands, where at that time there were severe ice conditions and it was impossible to organize a field investigation. The satellite image of the neighboring Urup Island of September 6 and November 20, 2006 clearly show the disappearance of grass cover on the coast after the tsunami (Fig. 1). The subsequent expedition in the summer of the next year confirmed the strong impact of the tsunami and the maximum tsunami height was determined to be about 17-20 m (Levin and Nosov, 2016).
Vol. 35, No. 2, Page 71, (2016)
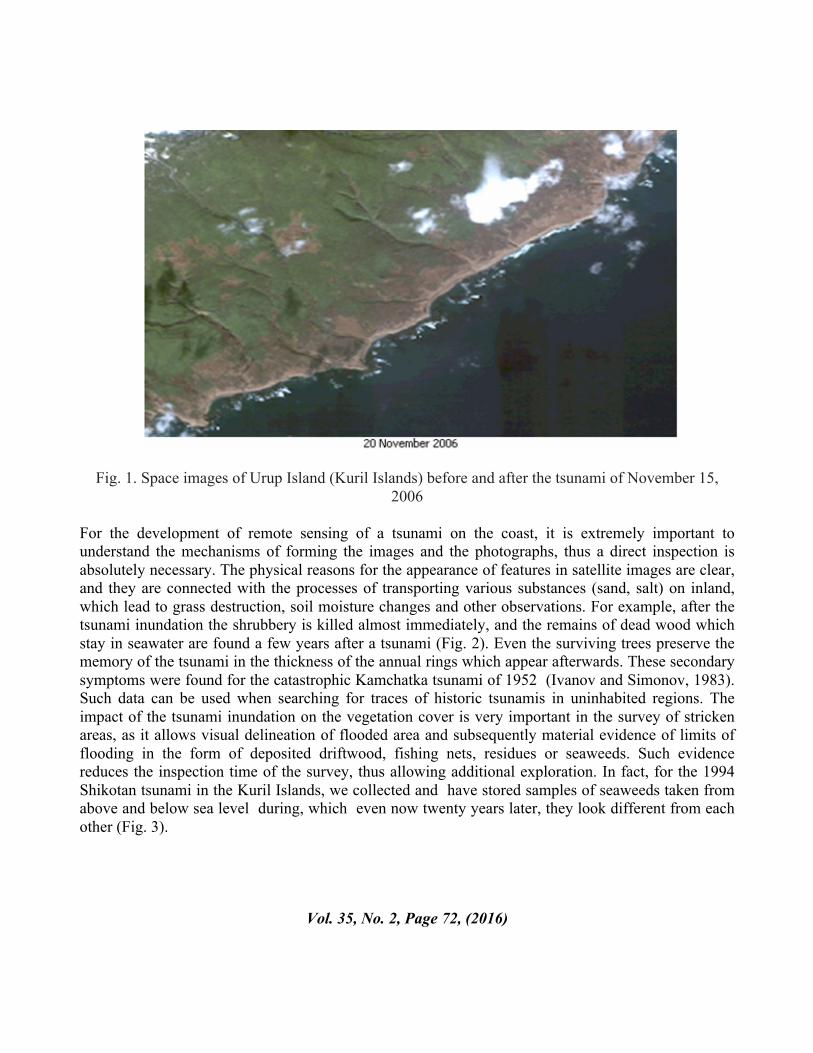
Fig. 1. Space images of Urup Island (Kuril Islands) before and after the tsunami of November 15, 2006
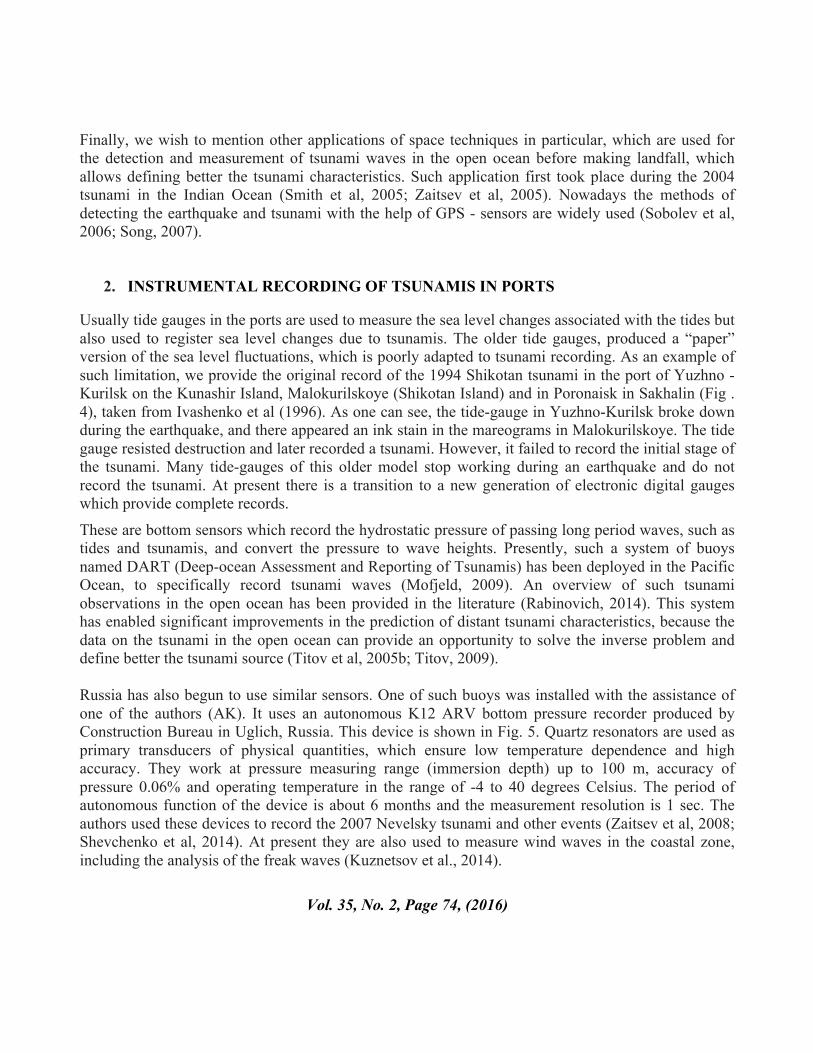
For the development of remote sensing of a tsunami on the coast, it is extremely important to understand the mechanisms of forming the images and the photographs, thus a direct inspection is absolutely necessary. The physical reasons for the appearance of features in satellite images are clear, and they are connected with the processes of transporting various substances (sand, salt) on inland, which lead to grass destruction, soil moisture changes and other observations. For example, after the tsunami inundation the shrubbery is killed almost immediately, and the remains of dead wood which stay in seawater are found a few years after a tsunami (Fig. 2). Even the surviving trees preserve the memory of the tsunami in the thickness of the annual rings which appear afterwards. These secondary symptoms were found for the catastrophic Kamchatka tsunami of 1952 (Ivanov and Simonov, 1983). Such data can be used when searching for traces of historic tsunamis in uninhabited regions. The impact of the tsunami inundation on the vegetation cover is very important in the survey of stricken areas, as it allows visual delineation of flooded area and subsequently material evidence of limits of flooding in the form of deposited driftwood, fishing nets, residues or seaweeds. Such evidence reduces the inspection time of the survey, thus allowing additional exploration. In fact, for the 1994 Shikotan tsunami in the Kuril Islands, we collected and have stored samples of seaweeds taken from above and below sea level during, which even now twenty years later, they look different from each other (Fig. 3).
Vol. 35, No. 2, Page 72, (2016)
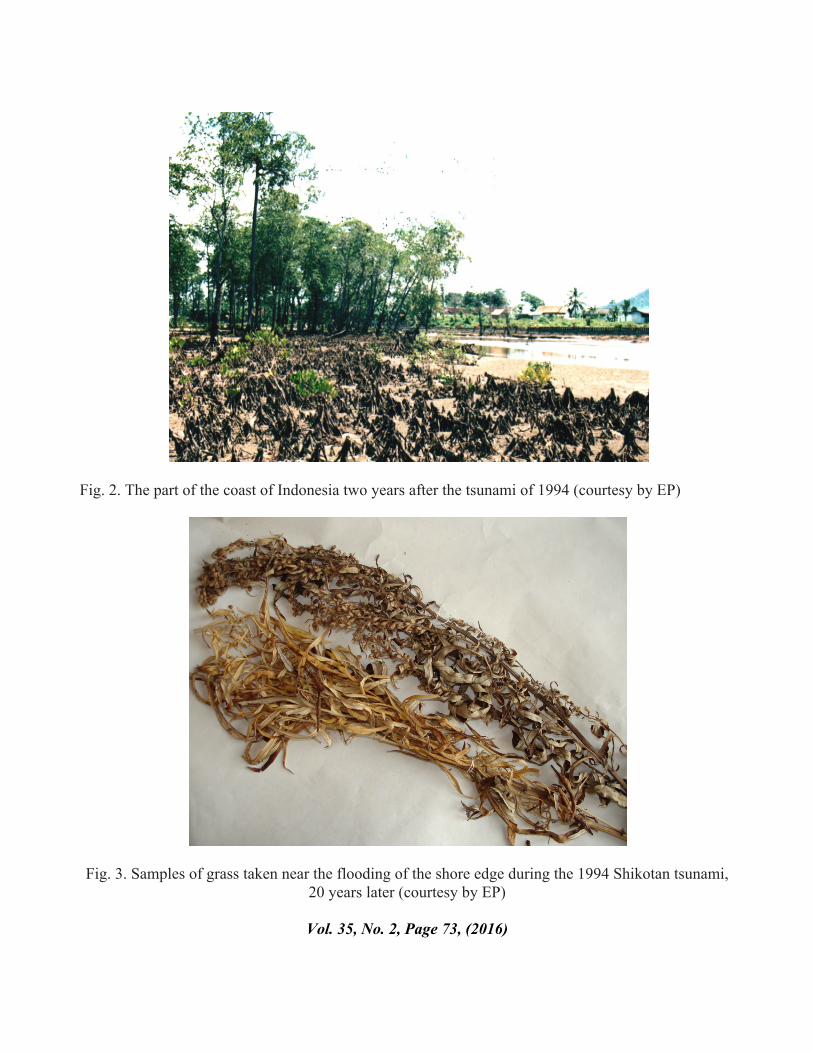
Fig. 2. The part of the coast of Indonesia two years after the tsunami of 1994 (courtesy by EP)
Fig. 3. Samples of grass taken near the flooding of the shore edge during the 1994 Shikotan tsunami, 20 years later (courtesy by EP)
Vol. 35, No. 2, Page 73, (2016)
Finally, we wish to mention other applications of space techniques in particular, which are used for the detection and measurement of tsunami waves in the open ocean before making landfall, which allows defining better the tsunami characteristics. Such application first took place during the 2004 tsunami in the Indian Ocean (Smith et al, 2005; Zaitsev et al, 2005). Nowadays the methods of detecting the earthquake and tsunami with the help of GPS - sensors are widely used (Sobolev et al, 2006; Song, 2007).
2. INSTRUMENTAL RECORDING OF TSUNAMIS IN PORTS
Usually tide gauges in the ports are used to measure the sea level changes associated with the tides but also used to register sea level changes due to tsunamis. The older tide gauges, produced a “paper” version of the sea level fluctuations, which is poorly adapted to tsunami recording. As an example of such limitation, we provide the original record of the 1994 Shikotan tsunami in the port of Yuzhno - Kurilsk on the Kunashir Island, Malokurilskoye (Shikotan Island) and in Poronaisk in Sakhalin (Fig . 4), taken from Ivashenko et al (1996). As one can see, the tide-gauge in Yuzhno-Kurilsk broke down during the earthquake, and there appeared an ink stain in the mareograms in Malokurilskoye. The tide gauge resisted destruction and later recorded a tsunami. However, it failed to record the initial stage of the tsunami. Many tide-gauges of this older model stop working during an earthquake and do not record the tsunami. At present there is a transition to a new generation of electronic digital gauges which provide complete records.
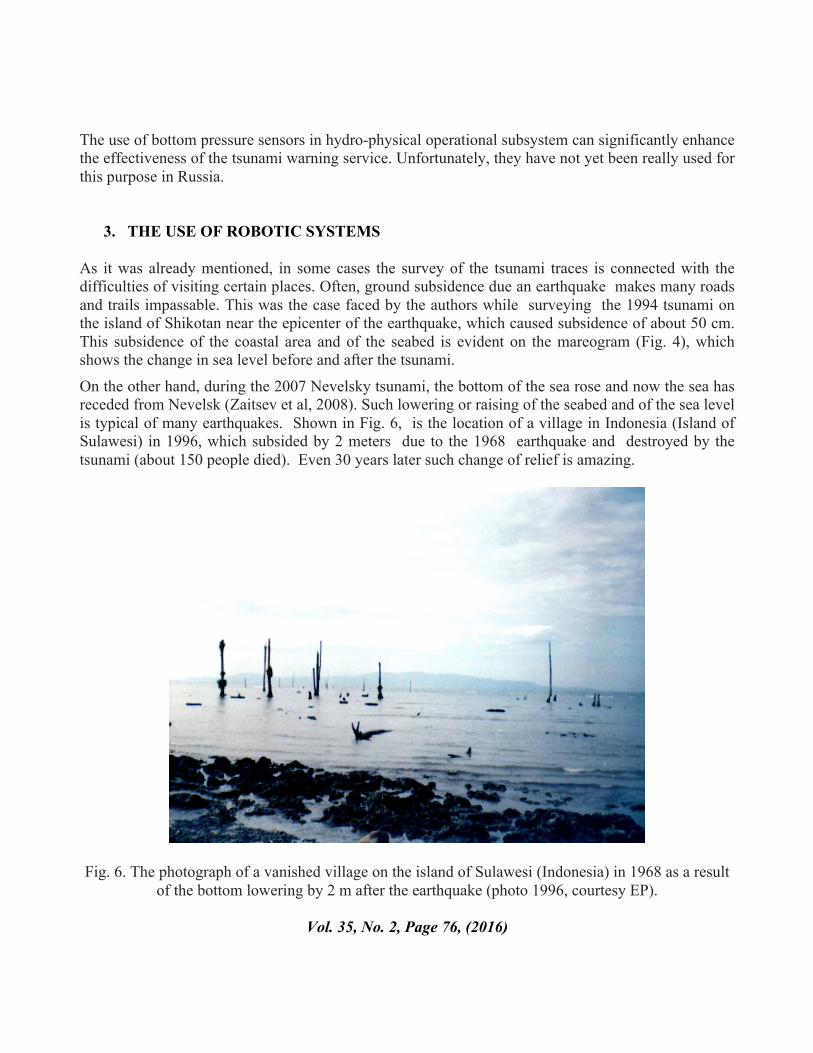
These are bottom sensors which record the hydrostatic pressure of passing long period waves, such as tides and tsunamis, and convert the pressure to wave heights. Presently, such a system of buoys named DART (Deep-ocean Assessment and Reporting of Tsunamis) has been deployed in the Pacific Ocean, to specifically record tsunami waves (Mofjeld, 2009). An overview of such tsunami observations in the open ocean has been provided in the literature (Rabinovich, 2014). This system has enabled significant improvements in the prediction of distant tsunami characteristics, because the data on the tsunami in the open ocean can provide an opportunity to solve the inverse problem and define better the tsunami source (Titov et al, 2005b; Titov, 2009). Russia has also begun to use similar sensors. One of such buoys was installed with the assistance of one of the authors (AK). It uses an autonomous K12 ARV bottom pressure recorder produced by Construction Bureau in Uglich, Russia. This device is shown in Fig. 5. Quartz resonators are used as primary transducers of physical quantities, which ensure low temperature dependence and high accuracy. They work at pressure measuring range (immersion depth) up to 100 m, accuracy of pressure 0.06% and operating temperature in the range of -4 to 40 degrees Celsius. The period of autonomous function of the device is about 6 months and the measurement resolution is 1 sec. The authors used these devices to record the 2007 Nevelsky tsunami and other events (Zaitsev et al, 2008; Shevchenko et al, 2014). At present they are also used to measure wind waves in the coastal zone, including the analysis of the freak waves (Kuznetsov et al., 2014).
Vol. 35, No. 2, Page 74, (2016)
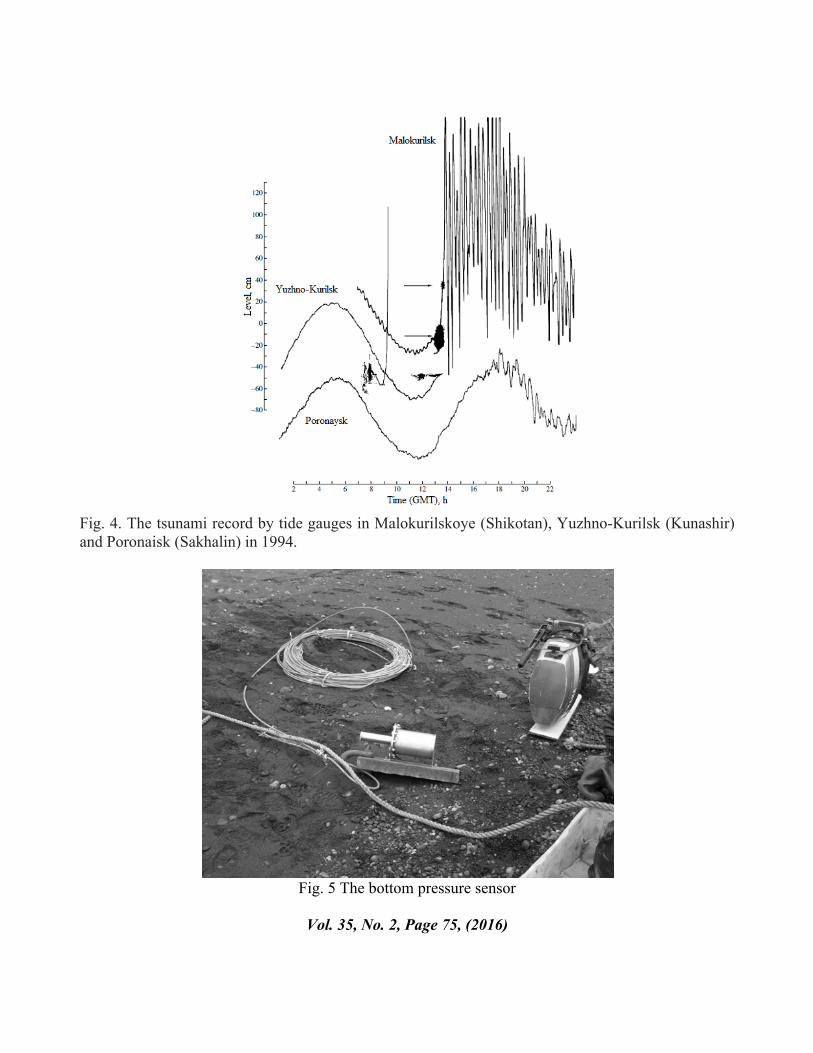
Fig. 4. The tsunami record by tide gauges in Malokurilskoye (Shikotan), Yuzhno-Kurilsk (Kunashir) and Poronaisk (Sakhalin) in 1994.
Fig. 5 The bottom pressure sensor
Vol. 35, No. 2, Page 75, (2016)
The use of bottom pressure sensors in hydro-physical operational subsystem can significantly enhance the effectiveness of the tsunami warning service. Unfortunately, they have not yet been really used for this purpose in Russia.
3. THE USE OF ROBOTIC SYSTEMS
As it was already mentioned, in some cases the survey of the tsunami traces is connected with the difficulties of visiting certain places. Often, ground subsidence due an earthquake makes many roads and trails impassable. This was the case faced by the authors while surveying the 1994 tsunami on the island of Shikotan near the epicenter of the earthquake, which caused subsidence of about 50 cm. This subsidence of the coastal area and of the seabed is evident on the mareogram (Fig. 4), which shows the change in sea level before and after the tsunami.
On the other hand, during the 2007 Nevelsky tsunami, the bottom of the sea rose and now the sea has receded from Nevelsk (Zaitsev et al, 2008). Such lowering or raising of the seabed and of the sea level is typical of many earthquakes. Shown in Fig. 6, is the location of a village in Indonesia (Island of Sulawesi) in 1996, which subsided by 2 meters due to the 1968 earthquake and destroyed by the tsunami (about 150 people died). Even 30 years later such change of relief is amazing.
Fig. 6. The photograph of a vanished village on the island of Sulawesi (Indonesia) in 1968 as a result of the bottom lowering by 2 m after the earthquake (photo 1996, courtesy EP).
Vol. 35, No. 2, Page 76, (2016)
There are many other difficulties in conducting coastal surveys besides the previously-mentioned problems of inaccessibility after an earthquake and tsunami. These include the following: 1. The presence of explosive mines not shown on maps. The survey of the 2004 tsunami along the coastal zone of Sri Lanka was hindered by scattered “old” mines, where for many years a civil war had raged. As a result, the tsunami traces for this part of the island were not measured at all.
2. Radioactive contamination. As it is known, the tsunami of March 11, 2011 off the coast of Japan destroyed the Fukushima-Daichi nuclear power plant and there was extensive coastal radioactive contamination. The radiation prevented the timely examination of the tsunami traces. Thus, data of the tsunami wave heights for this region was received later, when the degree of radioactive contamination was lower.
3. Landslides and avalanches resulting from a main earthquake and its numerous aftershocks in seismically active zones, as well as a tsunami, also hinder the conduct of a survey team . On the basis of personal experience of one of the authors (EP), it was uncomfortable to stand at the foot of a mountain, where coastal flooding by tsunami waves had occurred, while at the same time sufficiently large rocks were sliding down the mountain during aftershocks. 4. Danger to life in remote places. Thus, when surveying the tsunami traces, which occurred after the earthquake of July 17, 1998 on the Papua-New Guinea, many land areas were inaccessible due huge salt-crocodiles inhabiting the island.
5. Malarial and epidemic danger. Dangerous mosquitoes are common in Africa and other tropical locations. To visit these areas a special vaccination is needed. On the basis of the author’s own experience, it can be said that working conditions were relatively comfortable on the edge of the shore where the wind did not allow mosquitoes to gather. But the extent of tsunami inland flooding went far away from the coast, where there was no wind, so mosquitoes made it difficult to work. Based on such difficulties and limitations, it can be concluded that it is a good idea to use robots for the conduct surveys of tsunami and of other natural disasters. The robots can be used to survey the traces of the tsunami, which already happened, as well as to track sea level variations in hard-to- reach places. Ground-based robotic systems can transport radars, with the help of which it is possible to conduct the measurements of sea wave characteristics in the coastal zone. These systems are ideally suited for long-term deployment, since they make it possible to obtain continuous data, spanning several hundred meters from the coastline and allow studying the coastal areas in the different temporal and spatial scales.
In general, the design of mobile systems is to be determined mainly on the basis of terrestrial band configurations. In designing platforms of this class, the relief of the coastline dissected by bays and coves, must be considered as well as the types of ground base (sandy, sandy- rocky, gravel, silt and rocky).
If working in the Arctic regions, the state of freezing of the components of the shore rocks and their dustiness msut be considered, as well as massive ice inclusions, general ice phenomena and the dynamics of the icy shores. Thus, in creating autonomous mobile systems to monitor coastal zones,
Vol. 35, No. 2, Page 77, (2016)
must be based on additional fitting of existing transport and technological complexes and mass-produced ground vehicles by modular attachment - which is not yet very feasible. More important is the development of special multi-purpose base chassis on which a particular version of the control and information systems can be placed. At the same time there is a serious gap in the field of transport robotics, because there are no domestic mobile systems that fit the task at hand in the market. However, this can be achieved by developing the chassis of modular design with the possibility of re-equipment by various types of propulsion (wheeled, tracked, rotary- screw).
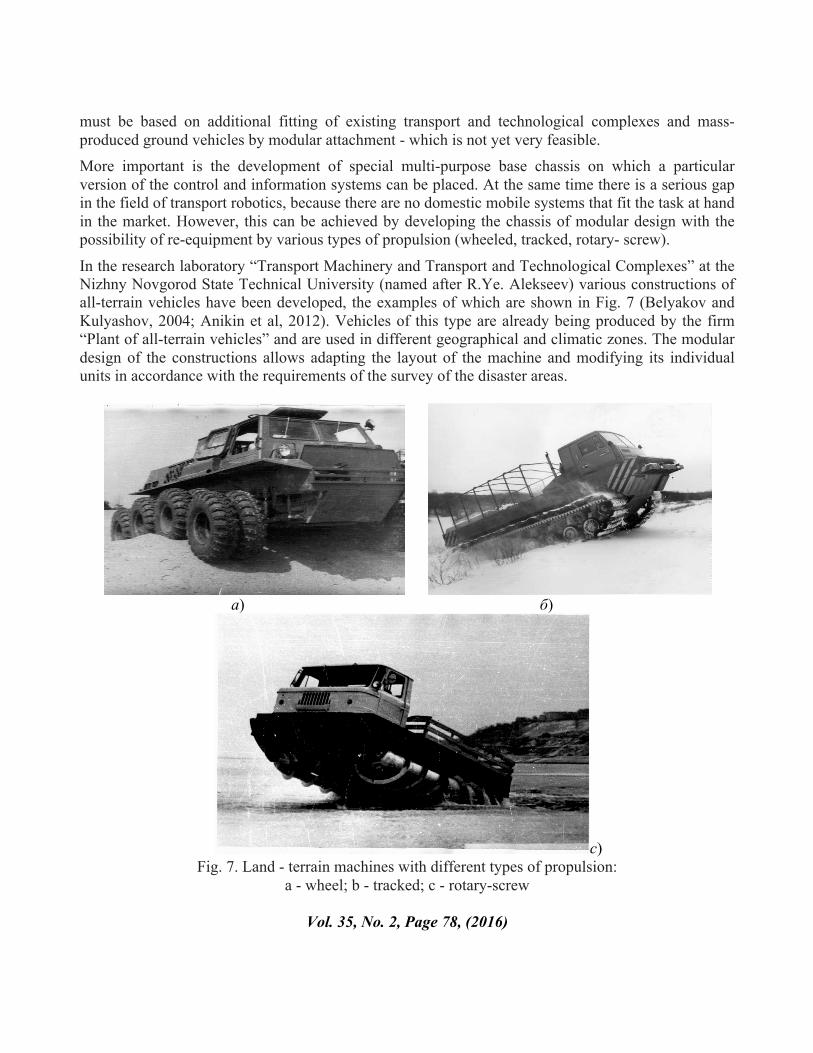
In the research laboratory “Transport Machinery and Transport and Technological Complexes” at the Nizhny Novgorod State Technical University (named after R.Ye. Alekseev) various constructions of all-terrain vehicles have been developed, the examples of which are shown in Fig. 7 (Belyakov and Kulyashov, 2004; Anikin et al, 2012). Vehicles of this type are already being produced by the firm “Plant of all-terrain vehicles” and are used in different geographical and climatic zones. The modular design of the constructions allows adapting the layout of the machine and modifying its individual units in accordance with the requirements of the survey of the disaster areas.
а) б)
c) Fig. 7. Land - terrain machines with different types of propulsion:
a - wheel; b - tracked; c - rotary-screw
Vol. 35, No. 2, Page 78, (2016)
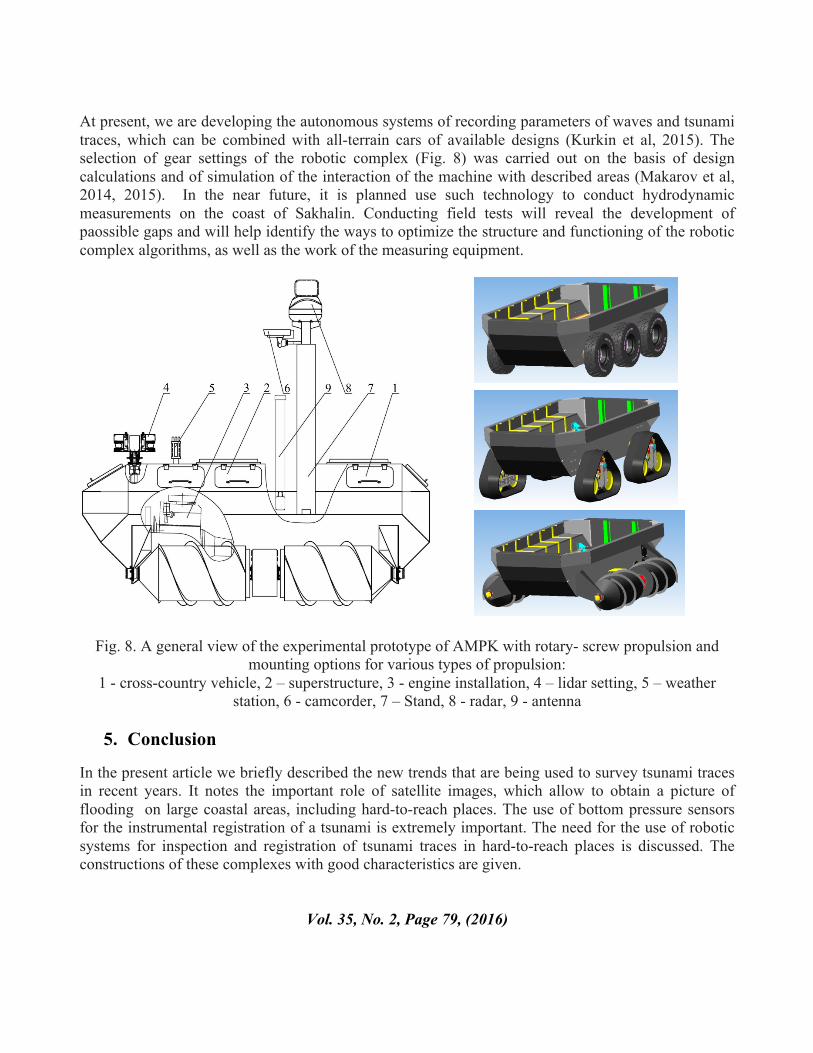
At present, we are developing the autonomous systems of recording parameters of waves and tsunami traces, which can be combined with all-terrain cars of available designs (Kurkin et al, 2015). The selection of gear settings of the robotic complex (Fig. 8) was carried out on the basis of design calculations and of simulation of the interaction of the machine with described areas (Makarov et al, 2014, 2015). In the near future, it is planned use such technology to conduct hydrodynamic measurements on the coast of Sakhalin. Conducting field tests will reveal the development of paossible gaps and will help identify the ways to optimize the structure and functioning of the robotic complex algorithms, as well as the work of the measuring equipment.
Fig. 8. A general view of the experimental prototype of AMPK with rotary- screw propulsion and mounting options for various types of propulsion:
1 - cross-country vehicle, 2 – superstructure, 3 - engine installation, 4 – lidar setting, 5 – weather station, 6 - camcorder, 7 – Stand, 8 - radar, 9 - antenna
5. Conclusion
In the present article we briefly described the new trends that are being used to survey tsunami traces in recent years. It notes the important role of satellite images, which allow to obtain a picture of flooding on large coastal areas, including hard-to-reach places. The use of bottom pressure sensors for the instrumental registration of a tsunami is extremely important. The need for the use of robotic systems for inspection and registration of tsunami traces in hard-to-reach places is discussed. The constructions of these complexes with good characteristics are given.
Vol. 35, No. 2, Page 79, (2016)
Acknowledgements The results of the given study have been obtained at the Nizhny Novgorod State Technical University (named after R. Alekseev) with financial support for applied scientific research by the Ministry of Education and Science of the Russian Federation Agreement No 14.574.21.0089 (unique identifier of agreement – RFMEFI57414X0089).
REFERENCES
1. Anikin, A.A., Barakhtanov, L.V., Belyakov, V.V., Makarov, V.S. and Maslennikov, V.A. Applied-Research Laboratory of Terrain (snow) Vehicles. On the 50th anniversary (1962 -2012.) Nizhny Novgorod. NNSTU, 2012 272 (in Russian).
2. Belyakov, V.V., and Kulyashov, A.P. All-terrain and technological vehicles. Basic of motion theory. Nizhny Novgorod, TALAM, 2004 (in Russian).
3. Bryant, E. Tsunami – The Underrated Hazard. Springer, 2008. 4. Choi, B.H., Hong, S.J., and Pelinovsky, E. Distribution of runup heights of the December 26,
2004 tsunami in the Indian Ocean. Geophysical Research Letters, 2006, vol. 33, No. 13, L13601. 5. Choi, B.H., Min, B.I., Pelinovsky, E. Tsuji, Y., and Kim, K.O. Comparable analysis of the
distribution functions of runup heights of the 1896, 1933 and 2011 Japanese Tsunamis in the Sanriku Area. Natural Hazards and Earth System Sciences, 2012, vol. 12, 1463-1467.
6. Curtis, G.D., 1982. Post-tsunami survey procedures, Joint Institute of Marine and Atmospheric Research Report, University of Hawaii at Manoa, Honolulu Hawaii.
7. Didenkulova, I.I., and Pelinovsky, E.N. Phenomena similar to tsunami in Russian internal basins. Russian Journal of Earth Sciences. 2006, vol. 8, No. 6, ES6002, 9 pages.
8. Dominey-Howes, D., and Dengler, L. International Tsunami Survey Team (ITST) Post-Tsunami Survey Field Guide. 2nd Edition. IOC Manuals and Guides No. 37, Paris: UNESCO 2014
9. Dotsenko, S. F. The Black Sea tsunamis, Izvestiya Atmospheric and Oceanic Physics, 1995, vol. 30(4), 483–489.
10. Dotsenko, S.F., Kuzin, A.P., Levin, B.V., and Solovieva, O.N. Tsunami in the Caspian Sea: seismic sources and features of propagation. Oceanology, 2000, vol. 40, No. 4, 474-482.
11. Farreras, S. Post-tsunami survey field guide. IOS, Manuals and Guides, No. 30. Paris, UNESCO, 1998.
12. Farreras, S. Post-tsunami field survey procedures: An Outline. Natural Hazards 2000, vol. 21, 207–214.
13. Gusiakov, V.K. Tsunami history – recorded. A.Robinson, E.Bernard (Eds.). The Sea, V. 15. Tsunamis. Cambridge, USA: Harvard University Press, 2009, 23-53.
14. Gusiakov, V.K. Strongest tsunamis in the World Ocean and the problem of marine coastal security. Izvestiya, Atmospheric and Oceanic Physics, 2014, vol. 50, No. 5, 435-444.
15. Intrergovernmental Oceanographic Commission (of UNESCO), 1998. Post-Tsunami Survey Field Guide (1st edn), Manuals and Guides #37, (initially compiled by ITIC / G. Pararas-Carayannis). Paris, France.
Vol. 35, No. 2, Page 80, (2016)
16. Ivanov, V.V., and Simonov, K.V. Traces of tsunamis in the coastal zone of the Second Kuril Strait. In book: Operative and long-term forecast of tsunamis. DVO АN SSSR. Vladivostok. 1983, 163-170 (in Russian).
17. Ivashenko, A.I., Gusyakov, V.K., Dzhumgaliev, A., Yeh, H., Zhukov, L.D., Zolotukhin, N.D., Kaistrenko. V.M., Kato, L.N., Klochkov, A.A., Korolev, Yu.P., Kruglyakov, A.A., Kulikov, E.A., Kurakin, V.M., Levin. B.V., Pelinovskii, E.N., Poplavskii, A.A., Titov, V.V., Kharlamov, A.A., Khramushin, V.M., and Shelting, E.V. The Shikotan tsunami of October 5, 1994. Transactions (Doklady of the Russian Academy of Sciences) Earth Science Sections, 1996, vol. 348, No. 4, 693-699.
18. Kaistrenko, V., Razjigaeva, N., Kharlamov, A. and Shishkin, A. Manifestation of the 2011 Great Tohoku Tsunami on the Coast of the Kuril Islands: A tsunami with ice. Pure Appl. Geophys., 2013, vol. 170. 1103-1114.
19. Kaistrenko, V., Gusiakov, V., Djumagaliev, V., Dykhan, G., Ivashenko, A., Yeh, H., Kato, L., Klochkov, A., and Pelinovsky, E., 2014. Tsunami manifestation on Shikotan Island based on field survey data. In book: Shikotan earthquake and tsunami on 4(5) October 1994 (Eds: Tikhonov I., Shevchenko G.). Yuzhno-Sakhalinsk: Institute of Marine Geology and Geophysics. 2014. Chapter 10, 59-64.
20. Kim, D.C., Kim, K.O., Choi, B.H., Kim, K.H., and Pelinovsky, E., 2013a. Three-dimensional runup simulation of the 2004 Indian Ocean tsunami at the Lhok Nga Twin Peaks. Journal of Coastal Research, SI, 2013a, 65, 272-277.
21. Kim, D.C., Kim, K.O., Pelinovsky, E., Didenkulova, I., and Choi, B.H., 2013b. Three-dimensional tsunami runup simulation at the Koborinai port, Sanriku coast, Japan. Journal of Coastal Research, SI, 2013b, vol.65, 266-271
22. Kurkin, A., Pelinovsky, E., Tyugin, D., Giniyatullin, A., Kurkina, O., Belyakov, V., Makarov, V., Zeziulin, D., and Kuznetsov, K., 2015. Autonomous robotic system for coastal monitoring. Proc. Twelfth Int. Conf. on the Mediterranean Coastal Environment Medcoast -2015 (06-10 October 2015, Varna, Bulgaria). Ed. E. Ozhan. 933-943.
23. Kuznetsov, K.I., Kurkin, A.A., Pelinovsky, E.N., and Kovalev, P.D., 2014. Features of wind waves at the southern coast of Sakhalin according to bottom-pressure measurements. Izvestiya, Atmospheric and Ocean Physics, 2014, vol. 50, No. 2, 213-220.
24. Laverov, N.P., Lobkovsky, L.I., Levin, B.W., Rabinovich, A.B., Kulikov, E.A., Fine, I.V., and Thomson, R.E., 2009. The Kuril Tsunamis of November 15, 2006, and January 13, 2007: two trans-Pacific events. Doklady Earth Sciences, 2009, vol. 426, No. 4, 658–664.
25. Levin, B., and Nosov, M., 2009. Physics of Tsunamis. Springer, 2009 (1st Ed), 2016 (2d Ed). 26. Loomis H., 1981. Notes on making a tsunami survey, Joint Tsunami Research Effort report,
Honolulu, Hawaii, U.S.A. 27. Makarov, V., Kurkin. A., Zeziulin, D. and Belyakov, V., 2015. Development of chassis of robotic
system for coastal monitoring. Proc. 13th European Conference of the Int. Society for Terrain-Vehicle Systems, (21-23 October 2015, Rome, Italy), 2015, 524-529.
Vol. 35, No. 2, Page 81, (2016)
28. Makarov, V., Zeziulin, D. and Belyakov, V., 2014. Prediction of all-terrain vehicles mobility in snowscape scenes. Proc. 18th Int. Conference of the Int. Society for Terrain-Vehicle Systems, ISTVS (22-25 September 2014, Seoul National University, South Korea), 2014.
29. Mofjeld, H.O., 2009. Tsunami measurements. In: The Sea, Vol. 15, Tsunamis, A.Robinson, E.Bernard (Eds.). USA, Harvard University Press, Cambridge, 2009, 201–235.
30. Mori, N, and Takahashi, T., 2012. The 2011 Tohoku Earthquake Tsunami Joint Survey Group. Nationalwide post event survey and analysis of the 2011 Tohoku Earthquake Tsunami. Coast. Eng. J., 2012, vol. 54, 1-27.
31. Murty, T.S. , 1977. Seismic Sea Waves – Tsunamis. Ottawa, Canada, 1977. 32. Pararas-Carayannis, G., 1999. Analysis of mechanism of tsunami generation in Lituya Bay.
Science of Tsunami Hazards 17(3): 193-206. Also, The Mega-Tsunami of July 9, 1958 in Lituya Bay, Alaska - Analysis of Mechanism http://www.drgeorgepc.com/Tsunami1958LituyaB.html
33. Pararas-Caraynnis, G., 2000. The Big One. Aston Forbes Press, ISBN: 0-9709725-0-4. 34. Pararas-Carayannis, G., 2006. Disaster risk assessment - Overview of basic principles and
methodology. Natural Disaster Risks, 2006, No. 3, 17-73. 35. Pararas-Carayannis, G., 2014. The Great Tohoku-Oki Earthquake and Tsunami of March 11, 2011
in Japan: A critical Review and Evaluation of theTsunami Source Mechanism. Pure and Applied Geophysics, 171 (2014, 3257-3278 DOI 10.1007.
36. Pelinovsky, E.N. 1996a Tsunami Wave Hydrodynamics. Institute Applied Physics Press, Nizhny Novgorod. 1996a (in Russian).
37. Pelinovsky E. N., 1996b. International tsunami expeditions. Vestnik RFFI (Herald of Russian Fund for Basic Research), 1996b, No 5, 26 – 30 (in Russian).
38. Papadopoulos, G.A., Diakogianni, G., Fokaefs, A., and Ranguelov, B., 2011. Tsunami hazard in the Black Sea and the Azov Sea: a new tsunami catalogue Nat. Hazards Earth Syst. Sci., 2011, vol. 11, 945–963.
39. Rabinovich, A.B., 2014. Tsunami observations in the open ocean. Izvestiya, Atmospheric and Oceanic Physics, 2014, vol. 50, No. 5, 445–458.
40. Shevchenko, G., Ivelskaya, T., Loskutov, A., and Shishkin, A., 2013. The 2009 Samoan and 2010 Chilean tsunamis recorded on the Pacific coast of Russia. Pure Appl. Geophys. 2013, vol. 170, 1511-1527.
41. Shevchenko, G.V., Ivelskaya, T.N., and Loskutov, A.V., 2014. Instrumental measurements of 2009-2011 tsunamis on the Russian Pacific Coast. Izvestiya, Atmospheric and Oceanic Physics, 2014, vol. 50, No. 5, 459-473.
42. Smith, W.H.F, Scharroo, R., Titov, V.V., Arcas, D., Arbic, B.K.. 2005. Satellite altimeters measure tsunami. Oceanography, 2005, vol. 18, 10-12.
43. Sobolev, S. V., Babeyko, A.Y., Wang, R., Hoechner, A., Galas, R., Rothacher, M., Sein, D.V., Schroter, J., Lauterjung, J., and Subarya, C., 2007. Tsunami early warning using GPS-Shield arrays, J. Geophys. Res., 2007, 112, B08415
44. Song, Y.T., 2007. Detecting tsunami genesis and scales directly from coastal GPS stations, Geophys. Res. Lett., 2007, 34, L19602
45. Synolakis, C.E., and Okal E.A., 2005. 1992−2002: Perspective on decade of post-tsunami surveys. Tsunamis: Case Studies and Recent Developments (Ed. K. Satake), Springer, 2005, 1-29.
Vol. 35, No. 2, Page 82, (2016)
46. Titov, V., Rabinovich, A., Mofjeld, H., Thomson, R, and Gonzalez, F., 2005a. The global reach of the 26 December, 2004 Sumatra tsunami, Science, 2005a, 309, P. 2045–2048.
47. Titov, V.V., González, F.I., Bernard, E.N., Eble, M.C., Mofjeld, H.O., Newman, J.C., and Venturato, A.J., 2005b. Real-time tsunami forecasting: Challenges and solutions. Nat. Hazards, vol. 35(1), 2005b, 41–58.
48. Titov, V.V., 2009. Tsunami forecasting. In: The Sea, Vol.15, Tsunamis, Eds.: A. Robinson, E. Bernard, Harvard Univ. Press, Cambridge. 2009, 371–400.
49. Torsvik, T., Paris, R., Didenkulova, I., Pelinovsky, E., Belousov, A., and Belousova, M., 2010. Numerical simulation of tsunami event during the 1996 volcanic eruption in Karymskoe lake, Kamchatka, Russia. Natural Hazards and Earth System Sciences, 2010, vol. 10, 2359-2369.
50. Yalciner, A., Pelinovsky, E., Talipova, T., Kurkin, A., Kozelkov, A., and Zaitsev, A. 2004. Tsunamis in the Black Sea: comparison of the historical, instrumental and numerical data. J. Geophys. Research, 2004, vol. 109, No. C12, C12023.
51. Wübbold, F., Hentschel, M., Vousdoukas, M., and Wagner, B., 2012. Application of an autonomous robot for the collection of nearshore topographic and hydrodynamic measurements. Coastal Engineering Proceedings, 2012, vol. 33, management. 53 (ISBN 978-0-9896611-1-9).
52. Zaitsev, A.I., Kurkin, A.A., Levin, B.V., Pelinovsky, E.N., Yalciner, A., Troitskaya, Yu.I., and Ermakov, S.A., 2005. Numerical simulation of catastrophic tsunami propagation in the Indian Ocean. Doklady Earth Sciences, 2005, vol. 402, No. 4, 614-618.
53. Zaitsev, A.I., Kovalev, D.P., Kurkin, A.A., Levin, B.W., Pelinovsky, E.N., Chernov, A.G., and Yalciner, A., 2008. The Nevelsk tsunami on August 2, 2007: Instrumental data and numerical modeling. Doklady Earth Sciences, 2008, vol. 421, No. 1, 867-870.
54. Zaitsev, A.I., and Pelinovsky, E.N., 2011. Forecasting of tsunami wave heights at the Russian Coast of the Black Sea. Oceanology, 2011, vol. 51, No. 6, 907-915.
Vol. 35, No. 2, Page 83, (2016)