Embed Size (px)
Citation preview
Scotland The key facts on tourism in 2012
IIScotland: The key facts on tourism 2012
visitscotland.org
It gathers information from a suite of tourism monitors managed by the Insight Department, VisitScotland and from other national statistics and commissioned research.
These include:
• Great Britain Tourism Survey (GBTS) 2012
• International Passenger Survey (IPS) 2012
• Scottish Accommodation Occupancy Survey 2012
• Moffat Centre Visitor Attraction Monitor 2012
• VisitScotland’s GB Day Visits Survey 2012
• Scottish Annual Business Survey: Sustainable Tourism by Local Authority Area 2010 http://www.scotland.gov.uk/Topics/Statistics/Browse/Business/SABS/LATables/Tourism-by-LA
• Northern Ireland Statistical and Research Agency (NISRA)
StatisticsThis report presents statistical insight on the volume and value of domestic and international tourism in Scotland. For the years to 2011 the focus of the statutory tourism monitor for domestic overnight tourism was recording the resident population of the United Kingdom to destinations within the UK and the Republic of Ireland. Since 2011 the scope changed to only cover the resident populations of Great Britain (England, Scotland and Wales) and trips within these jurisdictions. Northern Ireland data is now collected in a separate survey by Northern Ireland Tourist Board. In this publication, percentage figures may not add up to 100% due to rounding. As with all surveys the data at sub-levels are based on smaller sample sizes and therefore incur a larger margin of statistical error reducing data reliability.
This report provides a summary of statistics on tourism in Scotland, including the volume and value of tourism and information on our major markets.
Introduction
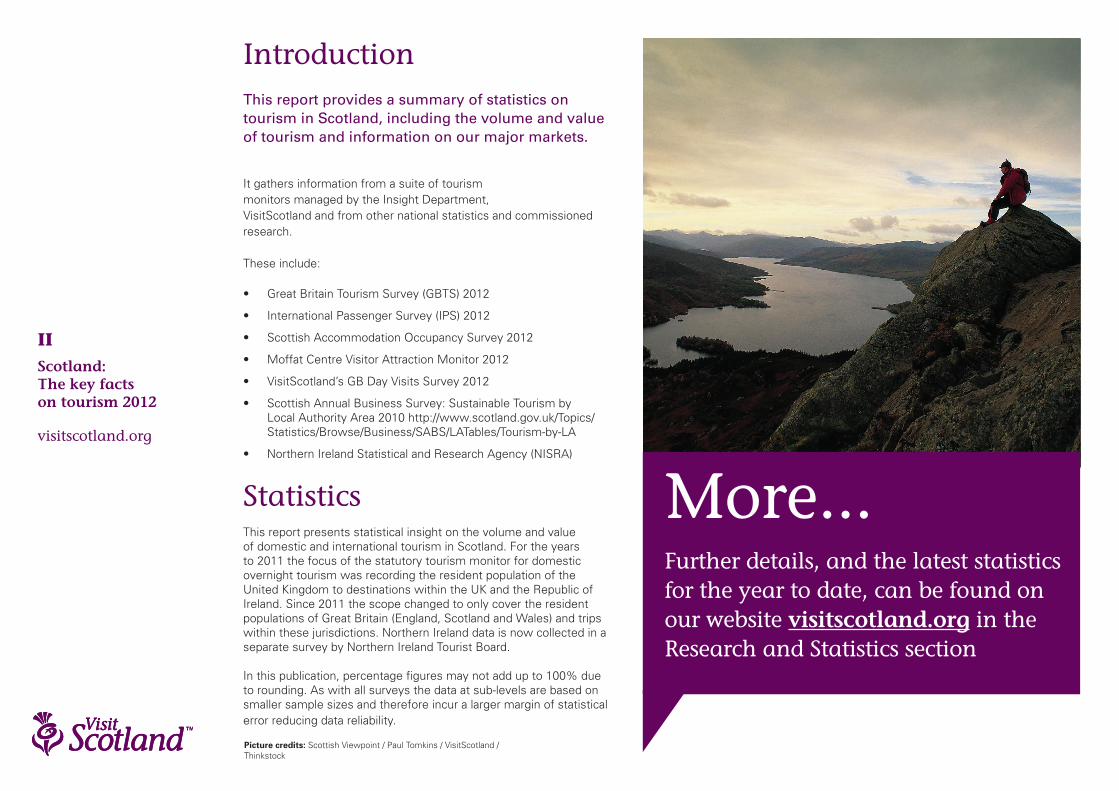
Picture credits: Scottish Viewpoint / Paul Tomkins / VisitScotland / Thinkstock
More...Further details, and the latest statistics for the year to date, can be found on our website visitscotland.org in the Research and Statistics section
IIIScotland: The key facts on tourism 2012
visitscotland.org
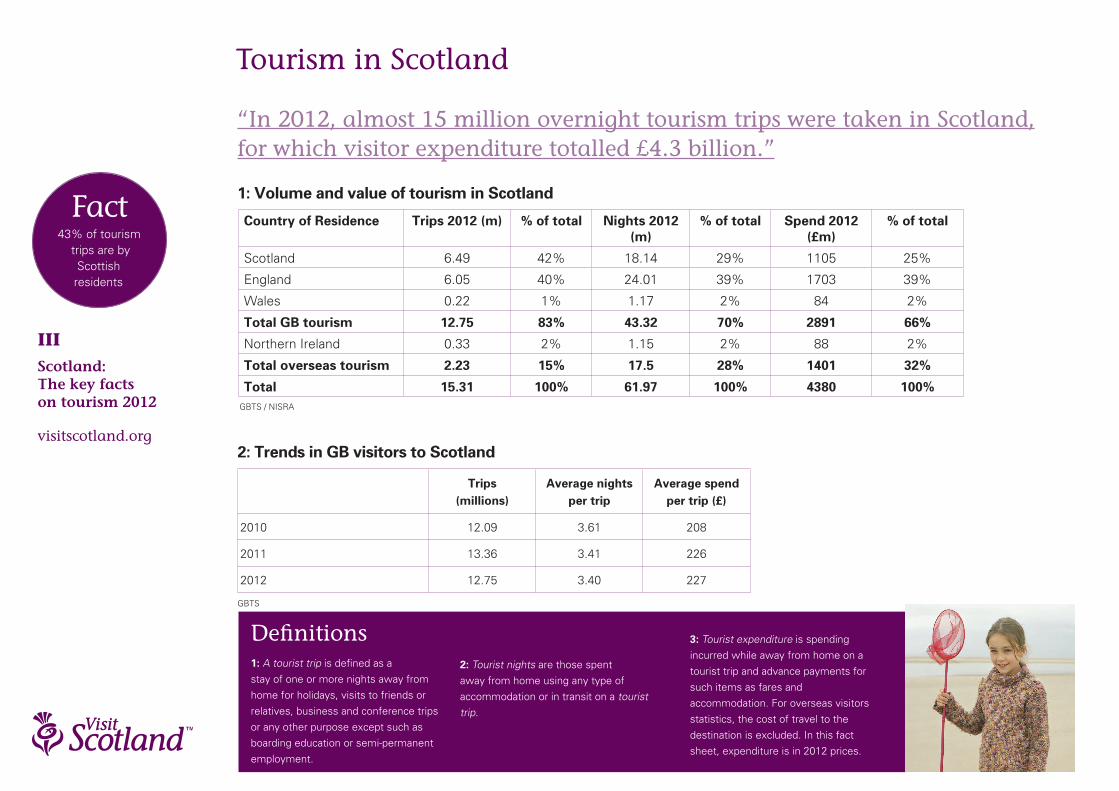
“In 2012, almost 15 million overnight tourism trips were taken in Scotland,for which visitor expenditure totalled £4.3 billion.”
Tourism in Scotland
Country of Residence Trips 2012 (m) % of total Nights 2012 (m)
% of total Spend 2012 (£m)
% of total
Scotland 6.49 42% 18.14 29% 1105 25%
England 6.05 40% 24.01 39% 1703 39%
Wales 0.22 1% 1.17 2% 84 2%
Total GB tourism 12.75 83% 43.32 70% 2891 66%
Northern Ireland 0.33 2% 1.15 2% 88 2%
Total overseas tourism 2.23 15% 17.5 28% 1401 32%
Total 15.31 100% 61.97 100% 4380 100%
Trips (millions)
Average nights per trip
Average spend per trip (£)
2010 12.09 3.61 208
2011 13.36 3.41 226
2012 12.75 3.40 227
1: Volume and value of tourism in ScotlandFact43% of tourism
trips are by Scottish residents
Definitions1: A tourist trip is defined as a
stay of one or more nights away from
home for holidays, visits to friends or
relatives, business and conference trips
or any other purpose except such as
boarding education or semi-permanent
employment.
2: Tourist nights are those spent
away from home using any type of
accommodation or in transit on a tourist
trip.
3: Tourist expenditure is spending
incurred while away from home on a
tourist trip and advance payments for
such items as fares and
accommodation. For overseas visitors
statistics, the cost of travel to the
destination is excluded. In this fact
sheet, expenditure is in 2012 prices.
2: Trends in GB visitors to Scotland
GBTS / NISRA
GBTS
IVScotland: The key facts on tourism 2012
visitscotland.org
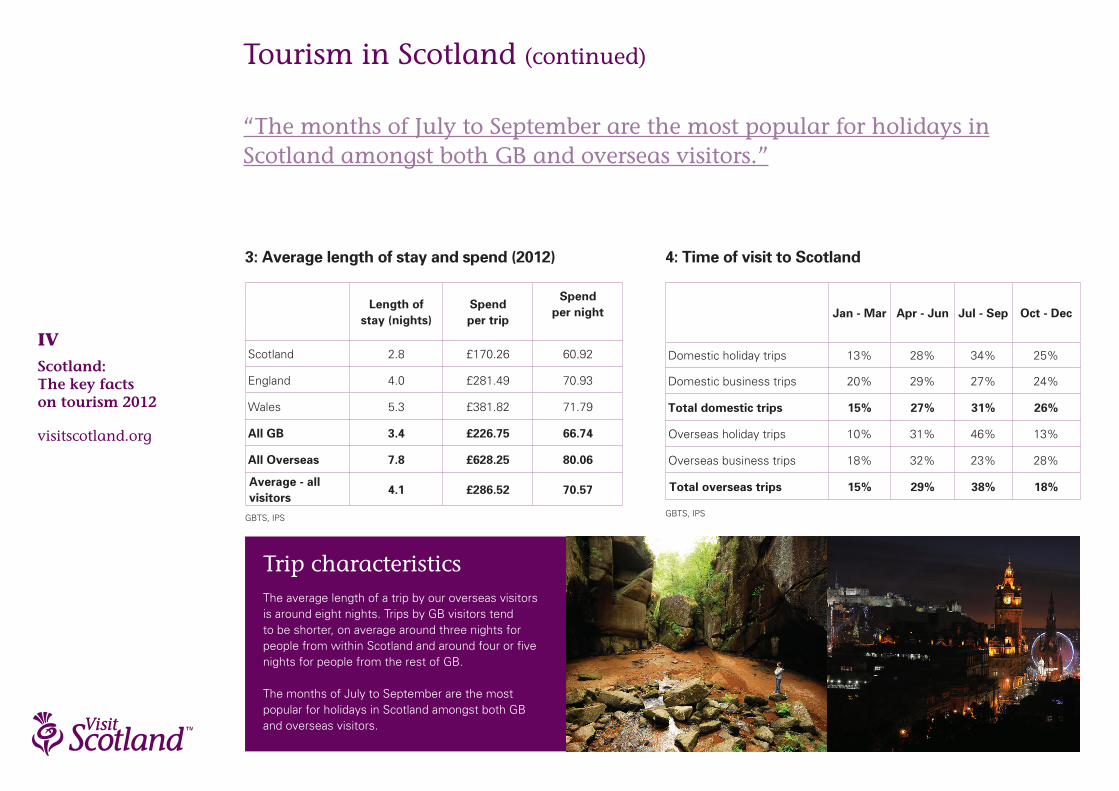
Tourism in Scotland (continued)
Length of stay (nights)
Spend per trip
Spend per night
Scotland 2.8 £170.26 60.92
England 4.0 £281.49 70.93
Wales 5.3 £381.82 71.79
All GB 3.4 £226.75 66.74
All Overseas 7.8 £628.25 80.06
Average - all visitors
4.1 £286.52 70.57
3: Average length of stay and spend (2012)
Jan - Mar Apr - Jun Jul - Sep Oct - Dec
Domestic holiday trips 13% 28% 34% 25%
Domestic business trips 20% 29% 27% 24%
Total domestic trips 15% 27% 31% 26%
Overseas holiday trips 10% 31% 46% 13%
Overseas business trips 18% 32% 23% 28%
Total overseas trips 15% 29% 38% 18%
4: Time of visit to Scotland
“The months of July to September are the most popular for holidays inScotland amongst both GB and overseas visitors.”
Trip characteristicsThe average length of a trip by our overseas visitors is around eight nights. Trips by GB visitors tend to be shorter, on average around three nights for people from within Scotland and around four or five nights for people from the rest of GB.
The months of July to September are the most popular for holidays in Scotland amongst both GB and overseas visitors.
GBTS, IPS GBTS, IPS
VScotland: The key facts on tourism 2012
visitscotland.org
Tourism in Scotland (continued)
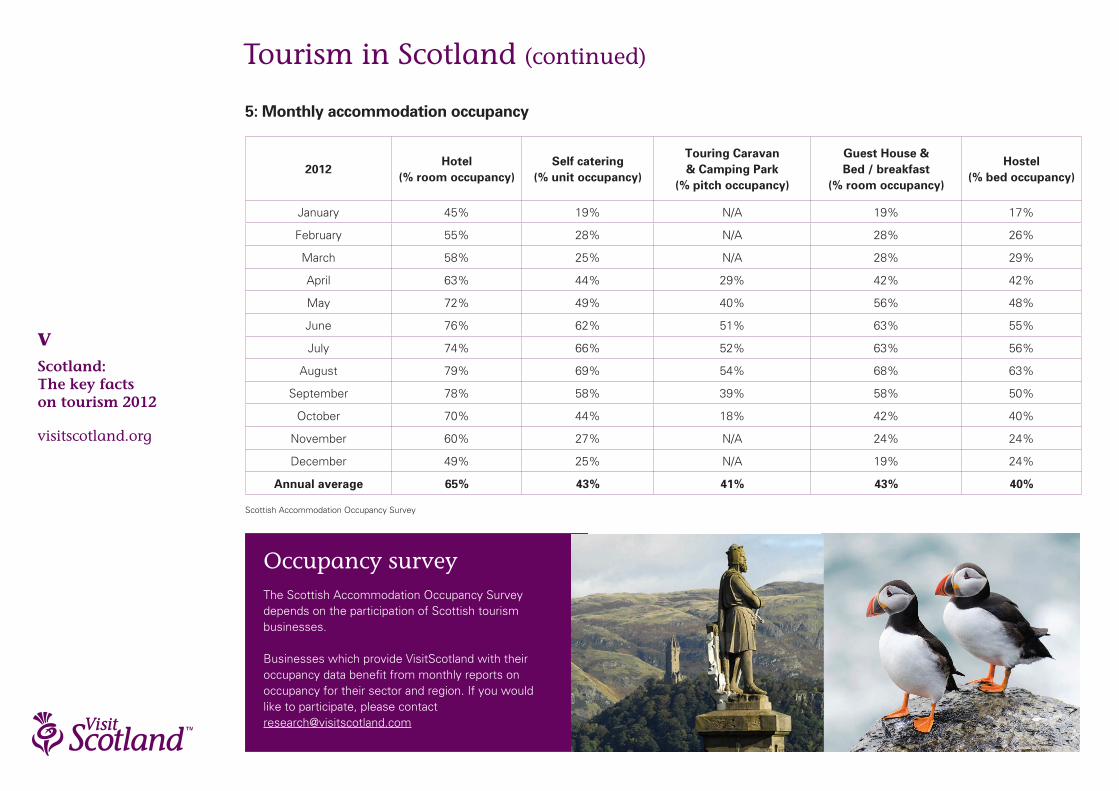
2012Hotel
(% room occupancy)Self catering
(% unit occupancy)
Touring Caravan & Camping Park
(% pitch occupancy)
Guest House & Bed / breakfast
(% room occupancy)
Hostel (% bed occupancy)
January 45% 19% N/A 19% 17%
February 55% 28% N/A 28% 26%
March 58% 25% N/A 28% 29%
April 63% 44% 29% 42% 42%
May 72% 49% 40% 56% 48%
June 76% 62% 51% 63% 55%
July 74% 66% 52% 63% 56%
August 79% 69% 54% 68% 63%
September 78% 58% 39% 58% 50%
October 70% 44% 18% 42% 40%
November 60% 27% N/A 24% 24%
December 49% 25% N/A 19% 24%
Annual average 65% 43% 41% 43% 40%
5: Monthly accommodation occupancy
Occupancy surveyThe Scottish Accommodation Occupancy Survey depends on the participation of Scottish tourism businesses.
Businesses which provide VisitScotland with their occupancy data benefit from monthly reports on occupancy for their sector and region. If you would like to participate, please contact [email protected]
Scottish Accommodation Occupancy Survey
VIScotland: The key facts on tourism 2012
visitscotland.org
Tourism in Scotland (continued)
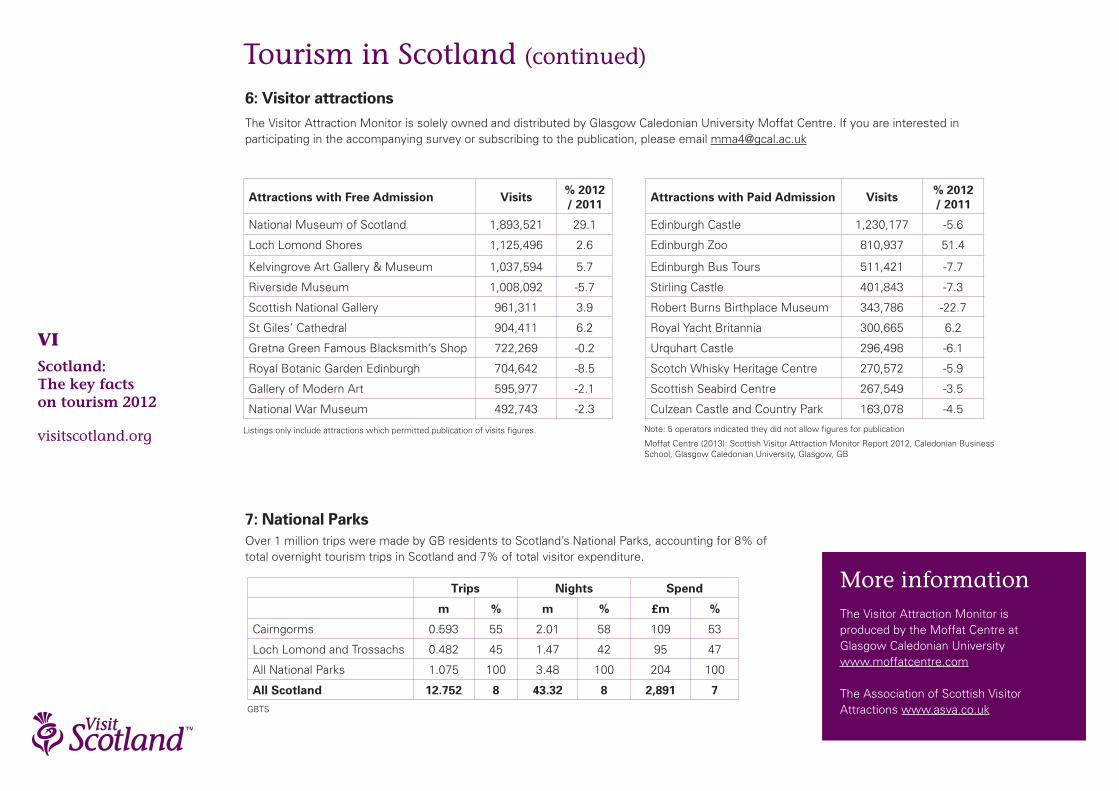
6: Visitor attractions
7: National Parks
More informationThe Visitor Attraction Monitor is produced by the Moffat Centre at Glasgow Caledonian University www.moffatcentre.com
The Association of Scottish Visitor Attractions www.asva.co.uk
The Visitor Attraction Monitor is solely owned and distributed by Glasgow Caledonian University Moffat Centre. If you are interested in participating in the accompanying survey or subscribing to the publication, please email [email protected]
Over 1 million trips were made by GB residents to Scotland’s National Parks, accounting for 8% of total overnight tourism trips in Scotland and 7% of total visitor expenditure.
GBTS
Attractions with Free Admission Visits % 2012 / 2011 Attractions with Paid Admission Visits % 2012
/ 2011
National Museum of Scotland 1,893,521 29.1 Edinburgh Castle 1,230,177 -5.6
Loch Lomond Shores 1,125,496 2.6 Edinburgh Zoo 810,937 51.4
Kelvingrove Art Gallery & Museum 1,037,594 5.7 Edinburgh Bus Tours 511,421 -7.7
Riverside Museum 1,008,092 -5.7 Stirling Castle 401,843 -7.3
Scottish National Gallery 961,311 3.9 Robert Burns Birthplace Museum 343,786 -22.7
St Giles’ Cathedral 904,411 6.2 Royal Yacht Britannia 300,665 6.2
Gretna Green Famous Blacksmith’s Shop 722,269 -0.2 Urquhart Castle 296,498 -6.1
Royal Botanic Garden Edinburgh 704,642 -8.5 Scotch Whisky Heritage Centre 270,572 -5.9
Gallery of Modern Art 595,977 -2.1 Scottish Seabird Centre 267,549 -3.5
National War Museum 492,743 -2.3 Culzean Castle and Country Park 163,078 -4.5
Note: 5 operators indicated they did not allow figures for publication
Moffat Centre (2013): Scottish Visitor Attraction Monitor Report 2012, Caledonian Business School, Glasgow Caledonian University, Glasgow, GB
Listings only include attractions which permitted publication of visits figures.
Trips Nights Spend
m % m % £m %
Cairngorms 0.593 55 2.01 58 109 53
Loch Lomond and Trossachs 0.482 45 1.47 42 95 47
All National Parks 1.075 100 3.48 100 204 100
All Scotland 12.752 8 43.32 8 2,891 7
VIIScotland: The key facts on tourism 2012
visitscotland.org
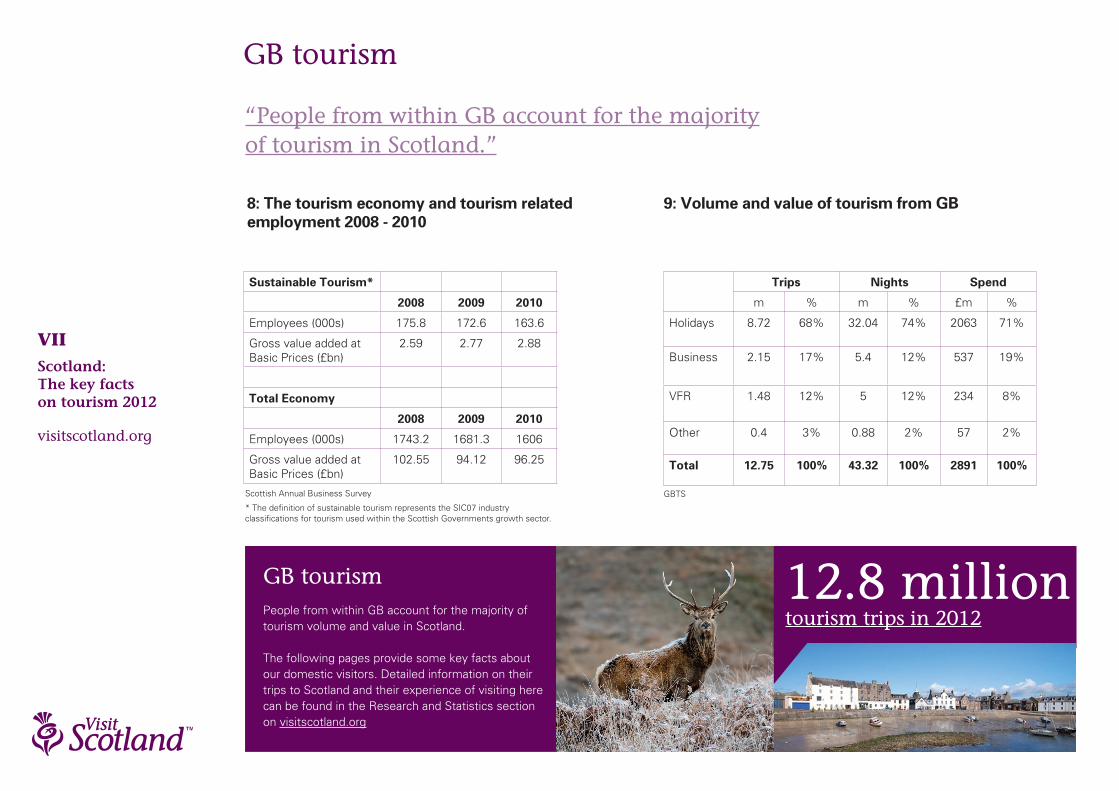
GB tourism
“People from within GB account for the majorityof tourism in Scotland.”
9: Volume and value of tourism from GB
GB tourismPeople from within GB account for the majority of tourism volume and value in Scotland.
The following pages provide some key facts about our domestic visitors. Detailed information on their trips to Scotland and their experience of visiting here can be found in the Research and Statistics section on visitscotland.org
12.8 milliontourism trips in 2012
8: The tourism economy and tourism related employment 2008 - 2010
GBTSScottish Annual Business Survey
* The definition of sustainable tourism represents the SIC07 industry classifications for tourism used within the Scottish Governments growth sector.
Sustainable Tourism*
2008 2009 2010
Employees (000s) 175.8 172.6 163.6
Gross value added at Basic Prices (£bn)
2.59 2.77 2.88
Total Economy
2008 2009 2010
Employees (000s) 1743.2 1681.3 1606
Gross value added at Basic Prices (£bn)
102.55 94.12 96.25
Trips Nights Spend
m % m % £m %
Holidays 8.72 68% 32.04 74% 2063 71%
Business 2.15 17% 5.4 12% 537 19%
VFR 1.48 12% 5 12% 234 8%
Other 0.4 3% 0.88 2% 57 2%
Total 12.75 100% 43.32 100% 2891 100%
VIIIScotland: The key facts on tourism 2012
visitscotland.org
GB tourism (continued)
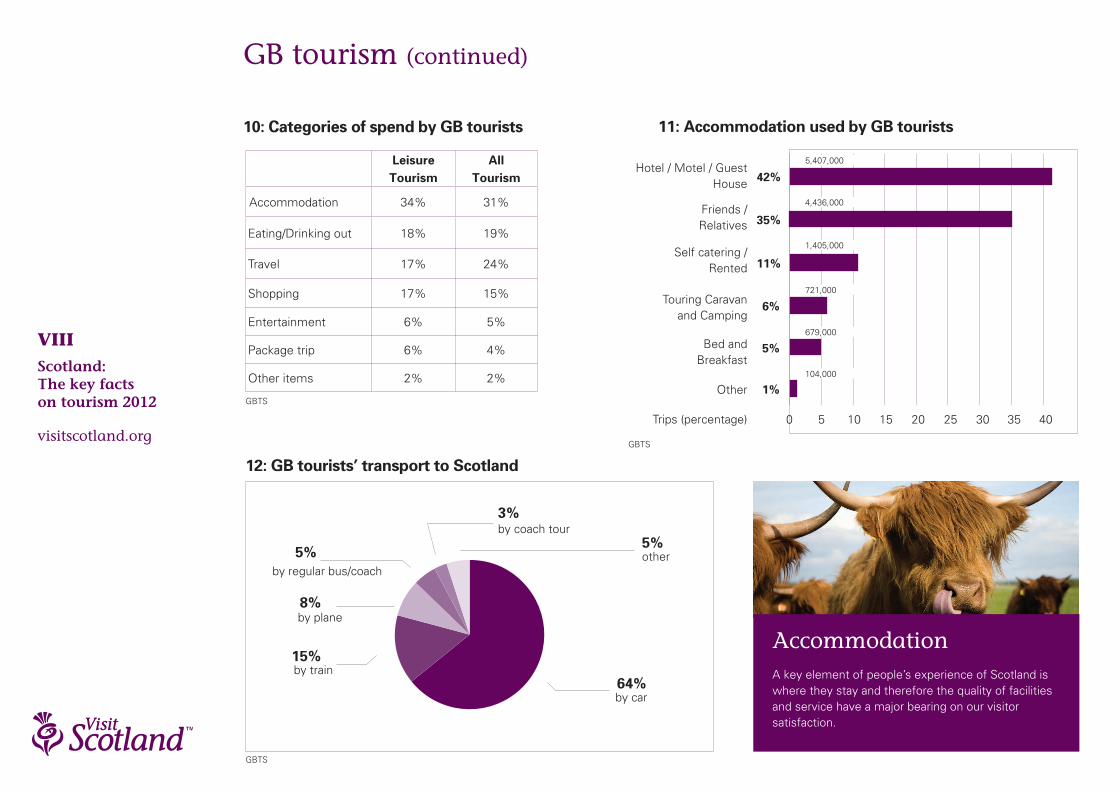
10: Categories of spend by GB tourists 11: Accommodation used by GB tourists
Hotel / Motel / Guest House
Friends / Relatives
Touring Caravan and Camping
Bed and Breakfast
Other
6%
5%
1%
Self catering / Rented
42%
35%
11%
12: GB tourists’ transport to Scotland
other5%
by car64%
by train15%
by plane8%
by regular bus/coach
5%
by coach tour3%
AccommodationA key element of people’s experience of Scotland is where they stay and therefore the quality of facilities and service have a major bearing on our visitor satisfaction.
5,407,000
4,436,000
679,000
104,000
721,000
1,405,000
0 5 10 15 20 25 30 35 40Trips (percentage)
GBTS
GBTS
GBTS
Leisure Tourism
All Tourism
Accommodation 34% 31%
Eating/Drinking out 18% 19%
Travel 17% 24%
Shopping 17% 15%
Entertainment 6% 5%
Package trip 6% 4%
Other items 2% 2%
IXScotland: The key facts on tourism 2012
visitscotland.org
GB tourism (continued)
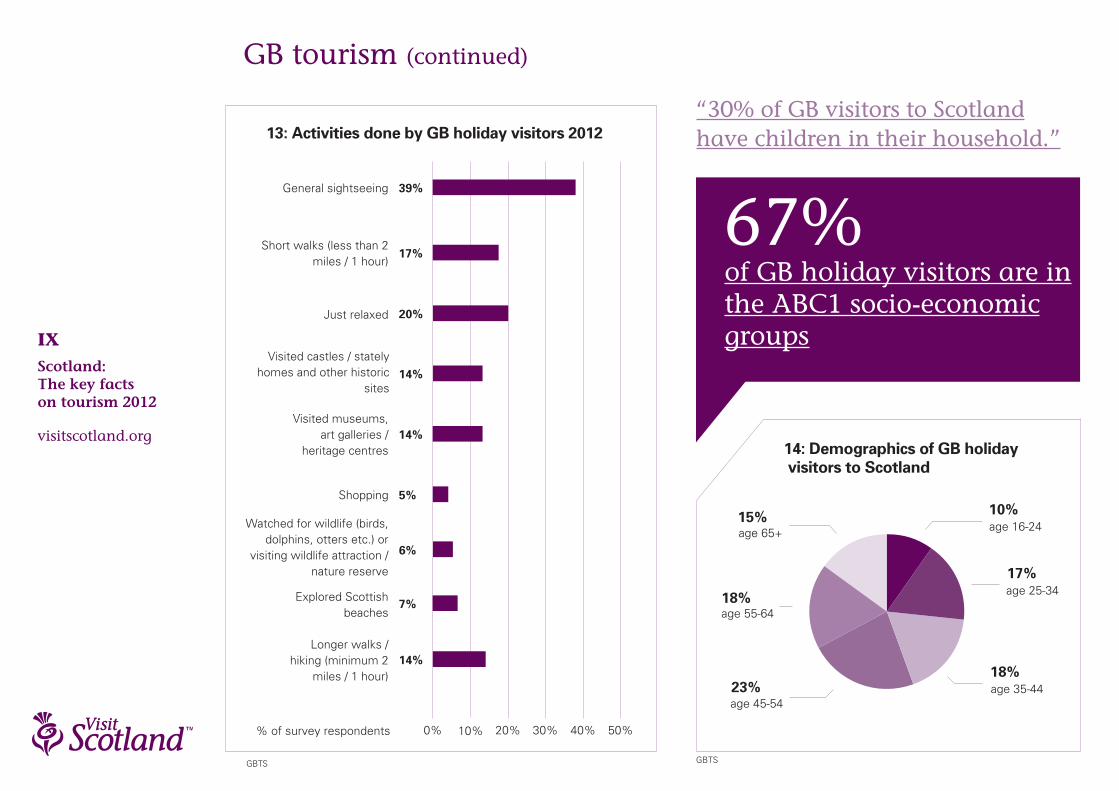
67%of GB holiday visitors are inthe ABC1 socio-economicgroups
% of survey respondents
13: Activities done by GB holiday visitors 2012
0% 10% 20% 30% 40% 50%
Just relaxed
Short walks (less than 2 miles / 1 hour)
General sightseeing
20%
17%
39%
age 55-64
14: Demographics of GB holiday visitors to Scotland
age 25-3417%
age 16-2410%
age 35-4418%
age 45-5423%
18%
age 65+15%
14%
14%
14%
5%
Visited castles / stately homes and other historic
sites
Visited museums, art galleries /
heritage centres
Shopping
Watched for wildlife (birds, dolphins, otters etc.) or
visiting wildlife attraction / nature reserve
Explored Scottish beaches
Longer walks / hiking (minimum 2
miles / 1 hour)
7%
6%
“30% of GB visitors to Scotlandhave children in their household.”
GBTS GBTS
XScotland: The key facts on tourism 2012
visitscotland.org
GB tourism (continued) Tourism in Scotland
Activitynumber oftrips (m)
% of total day trips
Visiting friends or family 33 23%
Going out for a meal 16 11%
Undertaking outdoor activities 12 8%
Going on a night out 12 8%
General day out 9 6%
Total day trips 142 100%
VisitScotland: GB Day Visits Survey
Year of Creative Scotland 2012The Year of Creative Scotland campaign aimed to promote and celebrate Scotland as a culturally vibrant and creative nation to the people of Scotland and our visitors.
• Promotion: to raise the profile of Scotland nationally and internationally as a creatively vibrant country and a world class cultural tourism destination.
• Celebration: support events and programmes to celebrate the contribution of Scotland’s places and people in making us a leading creative nation.
• Participation: inspire the people of Scotland and our visitors to participate in the arts, with particular emphasis on removing barriers to participation.
• Collaboration: encourage collaborative working between the creative and tourism sectors.
The Year of Creative Scotland was supported by £6.5 million of Creative Scotland National Lottery funding. Over 100 projects were supported via the Year of Creative Scotland investment programmes.
When asked how they would rate Scotland ‘as a destination for holidays or short breaks that might involve any kind of creative or cultural activities’ over 70% of UK respondents rated Scotland positively. 96% of international respondents said they gained a positive impression of Scotland as a great place to enjoy cultural events, festivals and activities from the VisitScotland website.
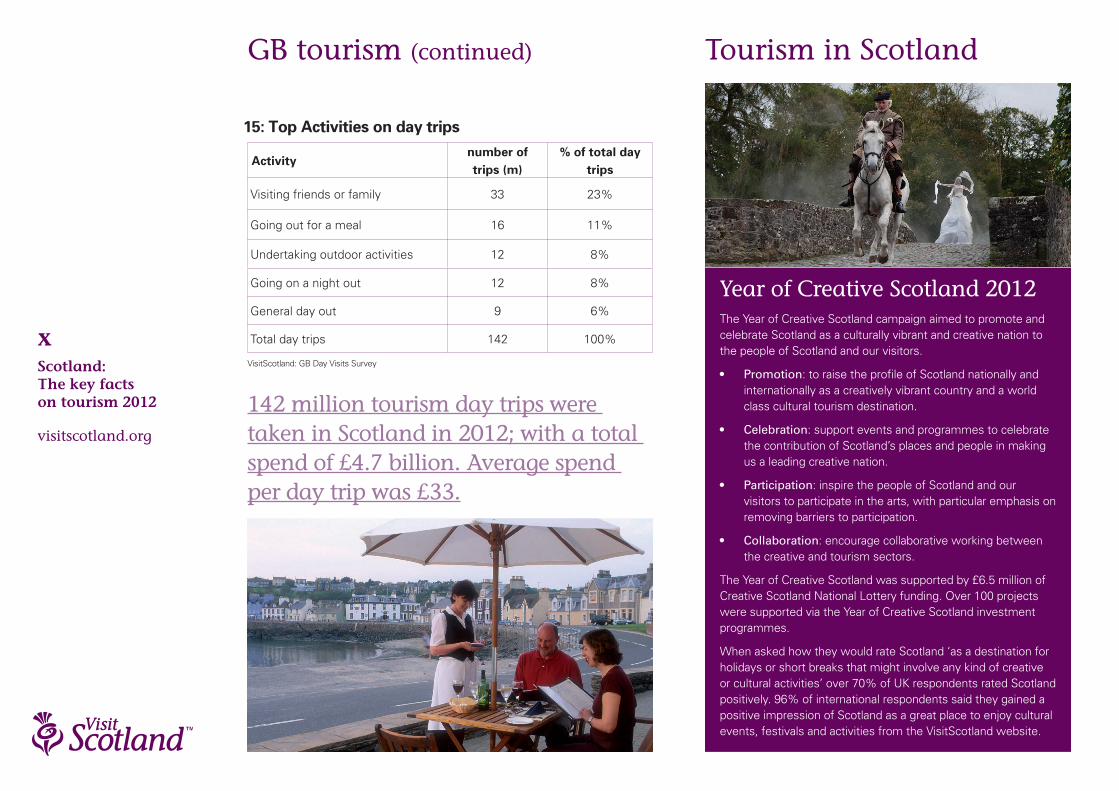
15: Top Activities on day trips
142 million tourism day trips were taken in Scotland in 2012; with a total spend of £4.7 billion. Average spend per day trip was £33.
XIScotland: The key facts on tourism 2012
visitscotland.org
Overseas tourism
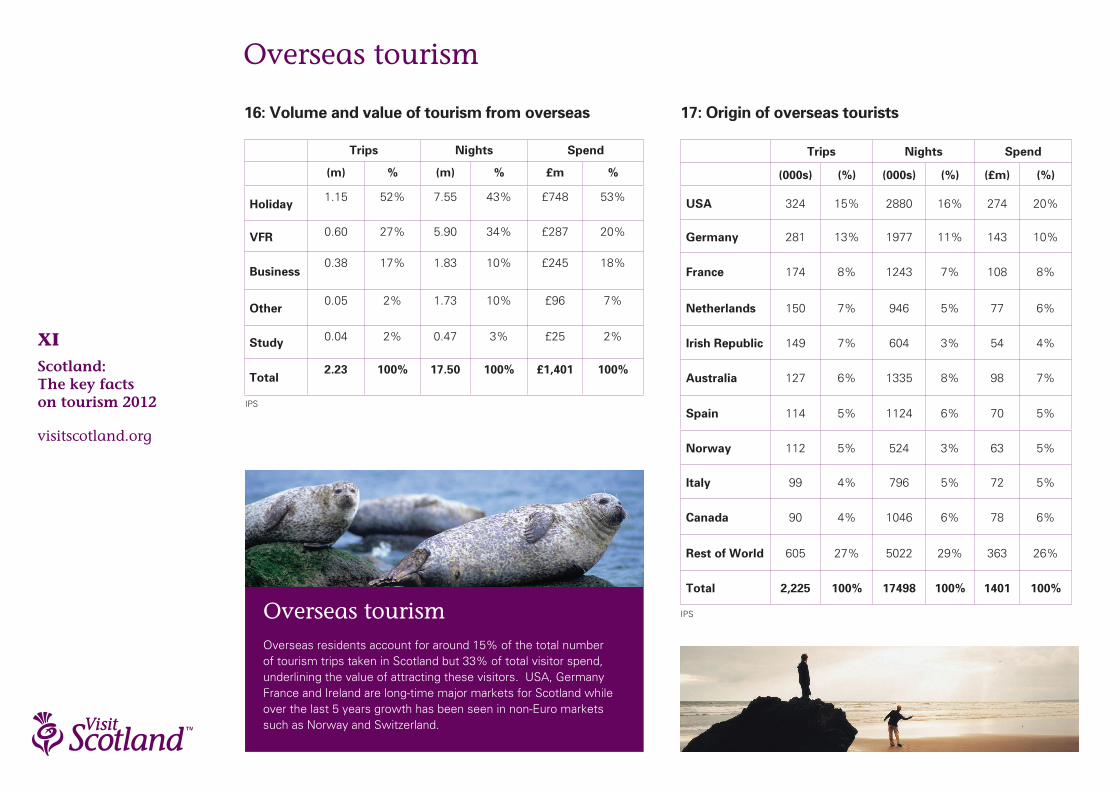
16: Volume and value of tourism from overseas 17: Origin of overseas tourists
Overseas tourismOverseas residents account for around 15% of the total number of tourism trips taken in Scotland but 33% of total visitor spend, underlining the value of attracting these visitors. USA, Germany France and Ireland are long-time major markets for Scotland while over the last 5 years growth has been seen in non-Euro markets such as Norway and Switzerland.
IPS
IPS
Trips Nights Spend
(m) % (m) % £m %
Holiday1.15 52% 7.55 43% £748 53%
VFR 0.60 27% 5.90 34% £287 20%
Business0.38 17% 1.83 10% £245 18%
Other0.05 2% 1.73 10% £96 7%
Study 0.04 2% 0.47 3% £25 2%
Total2.23 100% 17.50 100% £1,401 100%
Trips Nights Spend
(000s) (%) (000s) (%) (£m) (%)
USA 324 15% 2880 16% 274 20%
Germany 281 13% 1977 11% 143 10%
France 174 8% 1243 7% 108 8%
Netherlands 150 7% 946 5% 77 6%
Irish Republic 149 7% 604 3% 54 4%
Australia 127 6% 1335 8% 98 7%
Spain 114 5% 1124 6% 70 5%
Norway 112 5% 524 3% 63 5%
Italy 99 4% 796 5% 72 5%
Canada 90 4% 1046 6% 78 6%
Rest of World 605 27% 5022 29% 363 26%
Total 2,225 100% 17498 100% 1401 100%
XIIScotland: The key facts on tourism 2012
visitscotland.org
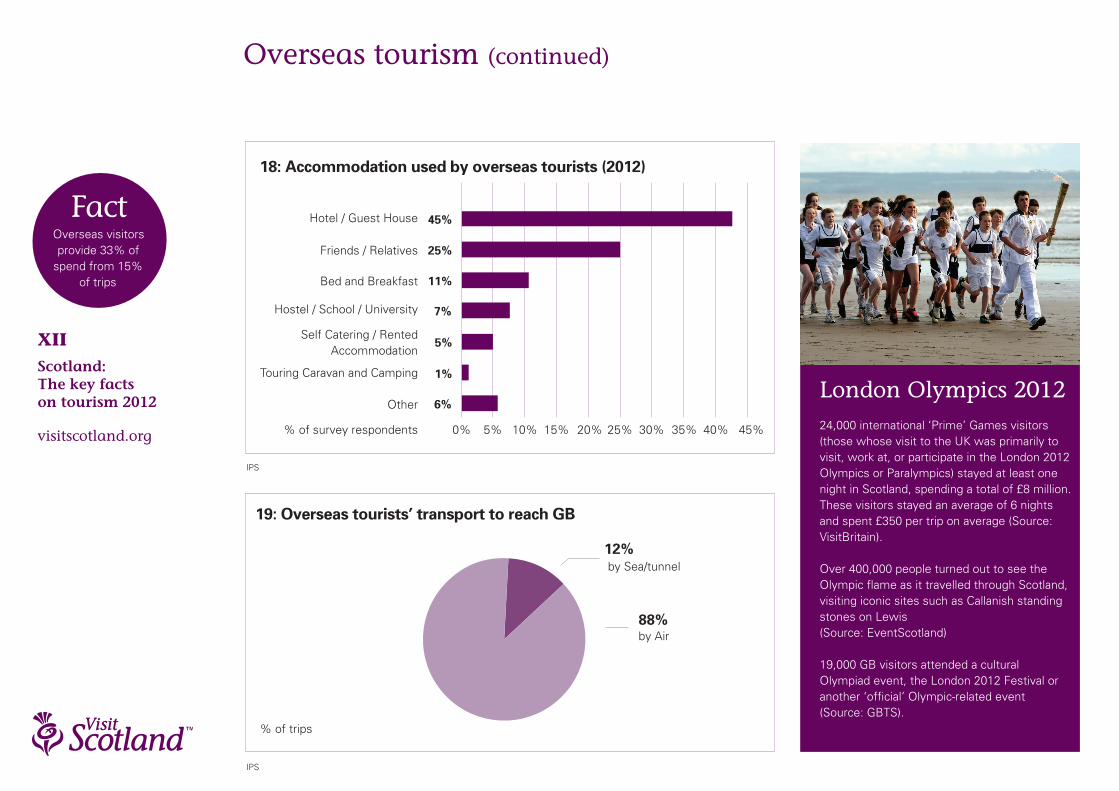
by Air88%
by Sea/tunnel12%
% of trips
Overseas tourism (continued)
18: Accommodation used by overseas tourists (2012)
Hotel / Guest House
Friends / Relatives
Bed and Breakfast
Hostel / School / University
Self Catering / Rented Accommodation
Touring Caravan and Camping
Other
5%
1%
6%
0% 5% 10% 15% 20% 25% 30%
45%
25%
11%
7%
35% 40% 45%
FactOverseas visitors provide 33% of
spend from 15% of trips
London Olympics 201224,000 international ‘Prime’ Games visitors (those whose visit to the UK was primarily to visit, work at, or participate in the London 2012 Olympics or Paralympics) stayed at least one night in Scotland, spending a total of £8 million. These visitors stayed an average of 6 nights and spent £350 per trip on average (Source: VisitBritain).
Over 400,000 people turned out to see the Olympic flame as it travelled through Scotland, visiting iconic sites such as Callanish standing stones on Lewis (Source: EventScotland)
19,000 GB visitors attended a cultural Olympiad event, the London 2012 Festival or another ‘official’ Olympic-related event (Source: GBTS).
% of survey respondents
IPS
IPS
19: Overseas tourists’ transport to reach GB
Insight DepartmentVisitScotlandOcean Point One94 Ocean DriveEdinburgh EH6 6JH
T: 0131 472 [email protected]
Contact us
Disclaimer: VisitScotland has published this report in good faith to update stakeholders on its activity. VisitScotland has taken all reasonable steps to confirm the information contained in the publication is correct. However, VisitScotland does not warrant or assume any legal liability for the accuracy of any information disclosed and accepts no responsibility for any errors or omissions.