Embed Size (px)
Citation preview
Scottsdale
Tourism Study - Visitor Statistics
September 2018
Tourism and Events Department
September 2018 Visitor Statistics City of Scottsdale/Applied Economics 2
Scottsdale Visitor Statistics
September 2018
An annual publication of:
The City of Scottsdale
Tourism and Events Department
7506 E. Indian School Rd.
Scottsdale, AZ 85251
Phone: (480) 312-4013
www.scottsdaleaz.gov/tourism
Last updated: August 29, 2018
Scottsdale City Council
Linda Milhaven
Kathy Littlefield
Suzanne Klapp
David Smith
Virginia Korte
Guy Phillips, Vice Mayor
Jim Thompson
City Manager
W.J. “Jim” Lane
Mayor
September 2018 Visitor Statistics City of Scottsdale/Applied Economics 3
Table of Contents
Study: Introduction 4
Executive Summary 5
Domestic Visitors to Scottsdale 6
Domestic Visitor Spending Patterns 7
Domestic Visitor Economic Impacts 8
Domestic Visitors Fiscal Contributions 10
Domestic Visitor Fiscal Costs 12
September 2018 Visitor Statistics City of Scottsdale/Applied Economics 4
Introduction
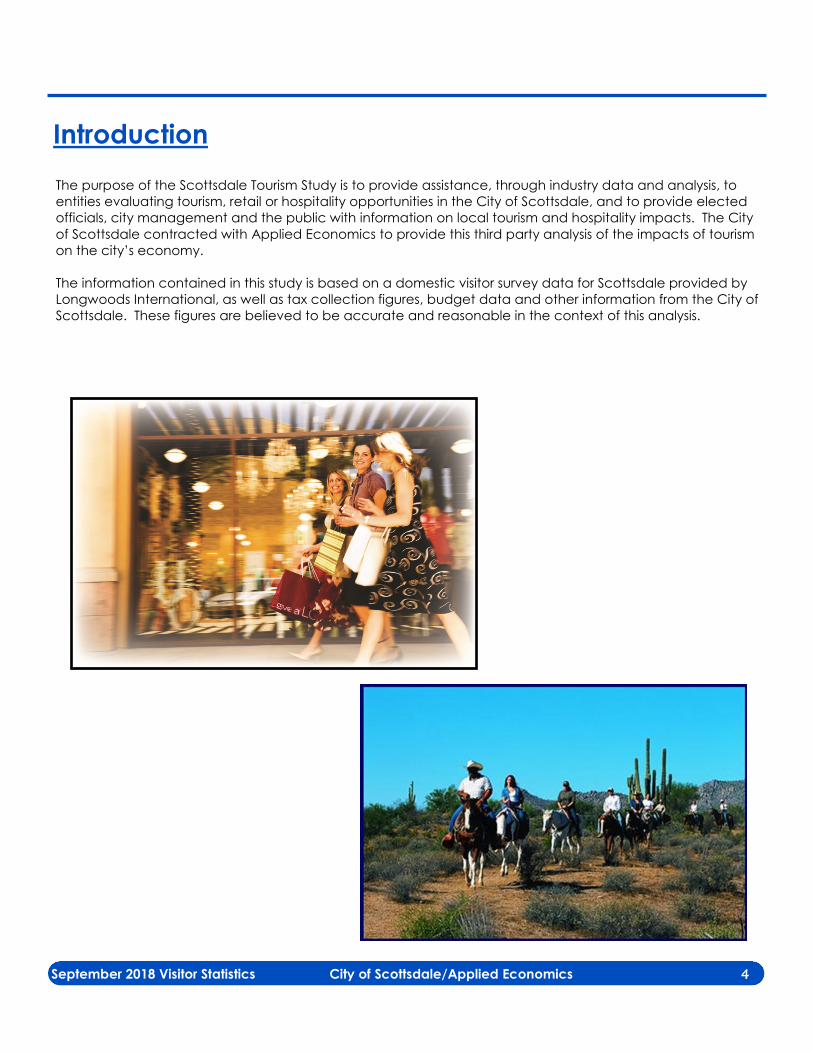
The purpose of the Scottsdale Tourism Study is to provide assistance, through industry data and analysis, to
entities evaluating tourism, retail or hospitality opportunities in the City of Scottsdale, and to provide elected
officials, city management and the public with information on local tourism and hospitality impacts. The City
of Scottsdale contracted with Applied Economics to provide this third party analysis of the impacts of tourism
on the city’s economy.
The information contained in this study is based on a domestic visitor survey data for Scottsdale provided by
Longwoods International, as well as tax collection figures, budget data and other information from the City of
Scottsdale. These figures are believed to be accurate and reasonable in the context of this analysis.
September 2018 Visitor Statistics City of Scottsdale/Applied Economics 5
Executive Summary
Scottsdale hosted an estimated 4.5 million overnight visitors and 4.4 million day trip visitors in 2017.
These visitors, through their local spending, created an annual economic impact of $2.4 billion in the City
of Scottsdale.
A typical overnight traveler to Scottsdale spends approximately $279 and a typical day trip visitor spends
$68, according to the Scottsdale 2017 Visitor Research by Longwoods International. Overnight visitors stay
an average of 4.0 nights in Scottsdale and have an average party size of 2.6 people.
The top ten activities for Scottsdale visitors are (in order): shopping, dining, swimming, visiting historic sites
and parks, night clubs, hiking, museums, golf, casinos and breweries.
The total number of visitor-nights spent in hotels in Scottsdale in 2017 was 3.1 million. An additional 1.4 mil-
lion visitors stayed overnight in Scottsdale in other types of accommodations.
About 69 percent of overnight visitors stay in a resort, hotel or motel in Scottsdale. The average occupan-
cy rate for market area hotels in 2017 was 68.3 percent, up from 68.1 percent in 2016 and 67.7 in 2015.
Tourists have a tremendous impact on tax revenues to the city. Privilege tax collections attributable to
visitors in FY 2017/18 are estimated at $43.9 million, including bed taxes. An additional $1.8 million per year
in taxes are generated by employees in the hospitality industry living in Scottsdale.
Scottsdale received a fiscal return of about $1.25 from visitors, meaning that for every $1 of municipal ser-
vice costs attributable to visitors, they received $1.25 in revenues.
September 2018 Visitor Statistics City of Scottsdale/Applied Economics 6
Domestic Visitors to Scottsdale
This section provides estimates of the number of visitors by type to Scottsdale. It also includes information on
hotel inventory and available room nights.
Number of Visitors
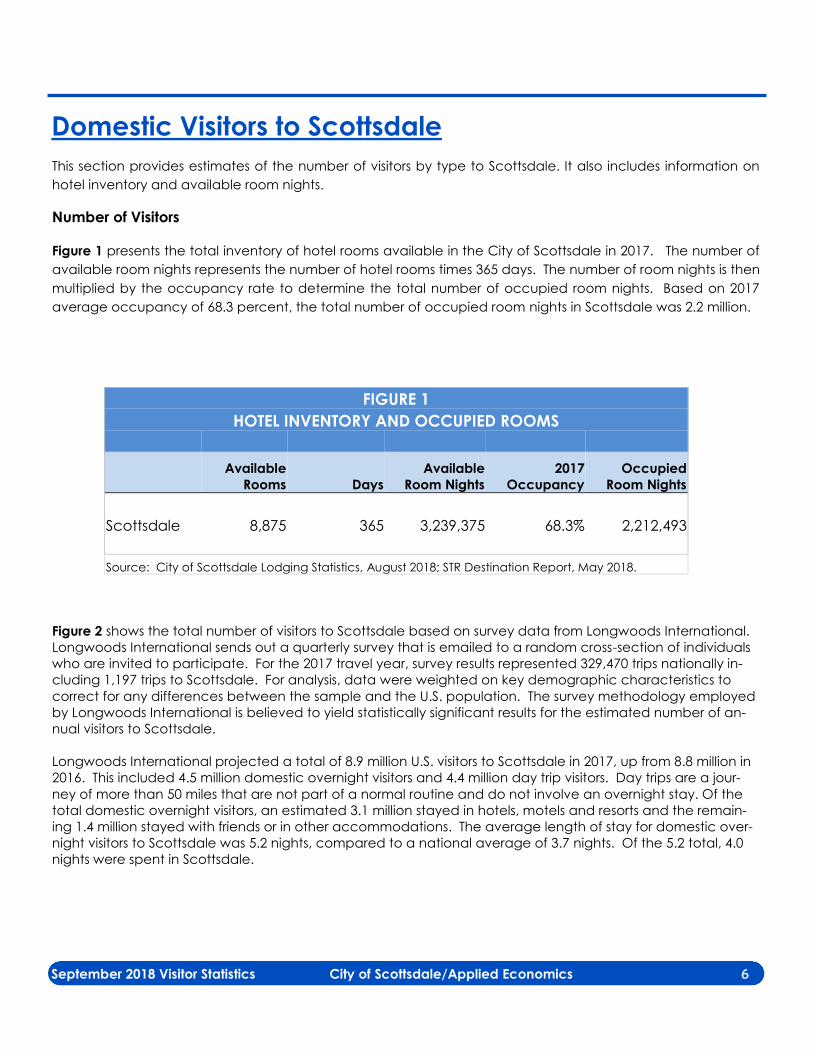
Figure 1 presents the total inventory of hotel rooms available in the City of Scottsdale in 2017. The number of
available room nights represents the number of hotel rooms times 365 days. The number of room nights is then
multiplied by the occupancy rate to determine the total number of occupied room nights. Based on 2017
average occupancy of 68.3 percent, the total number of occupied room nights in Scottsdale was 2.2 million.
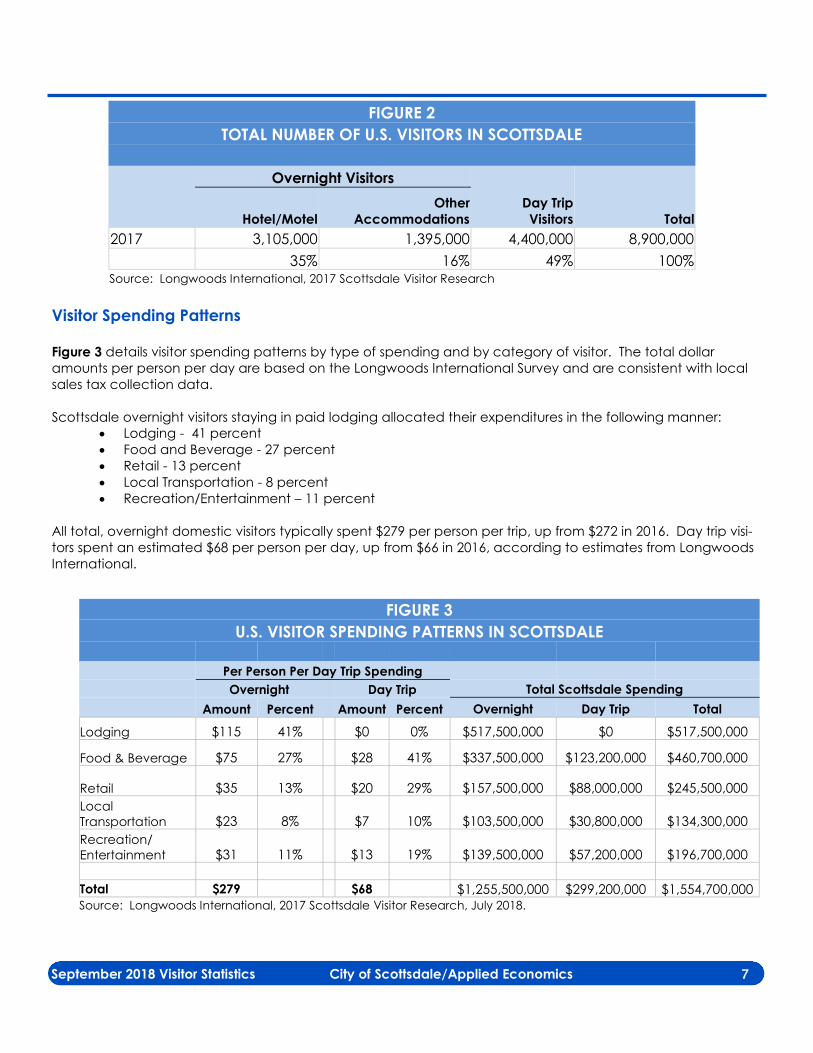
Figure 2 shows the total number of visitors to Scottsdale based on survey data from Longwoods International.
Longwoods International sends out a quarterly survey that is emailed to a random cross-section of individuals
who are invited to participate. For the 2017 travel year, survey results represented 329,470 trips nationally in-
cluding 1,197 trips to Scottsdale. For analysis, data were weighted on key demographic characteristics to
correct for any differences between the sample and the U.S. population. The survey methodology employed
by Longwoods International is believed to yield statistically significant results for the estimated number of an-
nual visitors to Scottsdale.
Longwoods International projected a total of 8.9 million U.S. visitors to Scottsdale in 2017, up from 8.8 million in
2016. This included 4.5 million domestic overnight visitors and 4.4 million day trip visitors. Day trips are a jour-
ney of more than 50 miles that are not part of a normal routine and do not involve an overnight stay. Of the
total domestic overnight visitors, an estimated 3.1 million stayed in hotels, motels and resorts and the remain-
ing 1.4 million stayed with friends or in other accommodations. The average length of stay for domestic over-
night visitors to Scottsdale was 5.2 nights, compared to a national average of 3.7 nights. Of the 5.2 total, 4.0
nights were spent in Scottsdale.
FIGURE 1
HOTEL INVENTORY AND OCCUPIED ROOMS
Available
Rooms Days
Available
Room Nights
2017
Occupancy
Occupied
Room Nights
Scottsdale 8,875 365 3,239,375 68.3% 2,212,493
Source: City of Scottsdale Lodging Statistics, August 2018; STR Destination Report, May 2018.
September 2018 Visitor Statistics City of Scottsdale/Applied Economics 7
Visitor Spending Patterns Figure 3 details visitor spending patterns by type of spending and by category of visitor. The total dollar
amounts per person per day are based on the Longwoods International Survey and are consistent with local
sales tax collection data.
Scottsdale overnight visitors staying in paid lodging allocated their expenditures in the following manner:
• Lodging - 41 percent
• Food and Beverage - 27 percent
• Retail - 13 percent
• Local Transportation - 8 percent
• Recreation/Entertainment – 11 percent
All total, overnight domestic visitors typically spent $279 per person per trip, up from $272 in 2016. Day trip visi-
tors spent an estimated $68 per person per day, up from $66 in 2016, according to estimates from Longwoods
International.
FIGURE 2
TOTAL NUMBER OF U.S. VISITORS IN SCOTTSDALE
Overnight Visitors
Hotel/Motel
Other
Accommodations
Day Trip
Visitors Total
2017 3,105,000 1,395,000 4,400,000 8,900,000
35% 16% 49% 100% Source: Longwoods International, 2017 Scottsdale Visitor Research
FIGURE 3
U.S. VISITOR SPENDING PATTERNS IN SCOTTSDALE
Per Person Per Day Trip Spending
Overnight Day Trip Total Scottsdale Spending
Amount Percent Amount Percent Overnight Day Trip Total
Lodging $115 41% $0 0% $517,500,000 $0 $517,500,000
Food & Beverage $75 27% $28 41% $337,500,000 $123,200,000 $460,700,000
Retail $35 13% $20 29% $157,500,000 $88,000,000 $245,500,000
Local
Transportation $23 8% $7 10% $103,500,000 $30,800,000 $134,300,000
Recreation/
Entertainment $31 11% $13 19% $139,500,000 $57,200,000 $196,700,000
Total $279 $68 $1,255,500,000 $299,200,000 $1,554,700,000 Source: Longwoods International, 2017 Scottsdale Visitor Research, July 2018.
September 2018 Visitor Statistics City of Scottsdale/Applied Economics 8
Domestic Visitor Economic Impacts
Economic impacts measure the effects of economic stimuli or expenditures in the local economy. Indirect
impacts are the result of the multiplier effect and capture supported supplier and consumer businesses and
their employees in Scottsdale that benefit from this economic stimuli. Direct impacts include actual visitor
spending at hotels, restaurants, shops, etc. Indirect impacts include the jobs and payroll supported by suppli-
er purchases made by these hotels, restaurants and shops as well as the household purchases made by their
employees. The total impact includes both the direct impacts of visitor spending and the secondary or indi-
rect impacts created by other local businesses and their employees.
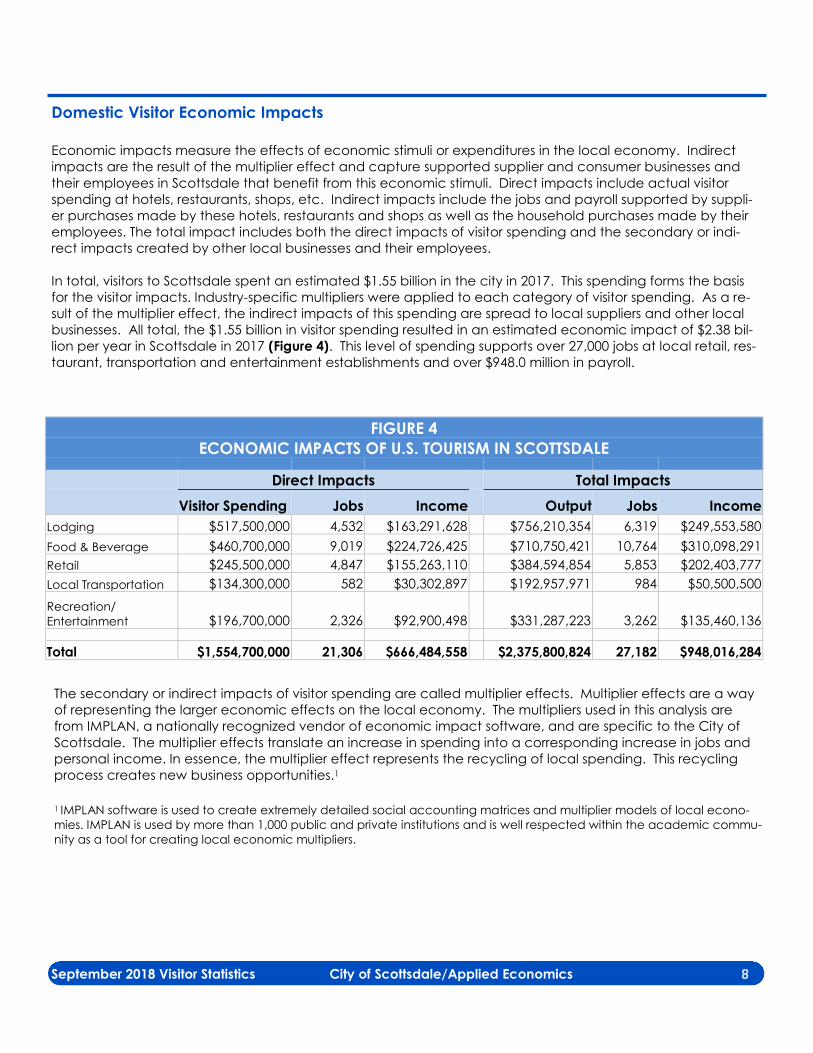
In total, visitors to Scottsdale spent an estimated $1.55 billion in the city in 2017. This spending forms the basis
for the visitor impacts. Industry-specific multipliers were applied to each category of visitor spending. As a re-
sult of the multiplier effect, the indirect impacts of this spending are spread to local suppliers and other local
businesses. All total, the $1.55 billion in visitor spending resulted in an estimated economic impact of $2.38 bil-
lion per year in Scottsdale in 2017 (Figure 4). This level of spending supports over 27,000 jobs at local retail, res-
taurant, transportation and entertainment establishments and over $948.0 million in payroll.
The secondary or indirect impacts of visitor spending are called multiplier effects. Multiplier effects are a way
of representing the larger economic effects on the local economy. The multipliers used in this analysis are
from IMPLAN, a nationally recognized vendor of economic impact software, and are specific to the City of
Scottsdale. The multiplier effects translate an increase in spending into a corresponding increase in jobs and
personal income. In essence, the multiplier effect represents the recycling of local spending. This recycling
process creates new business opportunities.1
1 IMPLAN software is used to create extremely detailed social accounting matrices and multiplier models of local econo-
mies. IMPLAN is used by more than 1,000 public and private institutions and is well respected within the academic commu-
nity as a tool for creating local economic multipliers.
FIGURE 4
ECONOMIC IMPACTS OF U.S. TOURISM IN SCOTTSDALE
Direct Impacts Total Impacts
Visitor Spending Jobs Income Output Jobs Income
Lodging $517,500,000 4,532 $163,291,628 $756,210,354 6,319 $249,553,580
Food & Beverage $460,700,000 9,019 $224,726,425 $710,750,421 10,764 $310,098,291
Retail $245,500,000 4,847 $155,263,110 $384,594,854 5,853 $202,403,777
Local Transportation $134,300,000 582 $30,302,897 $192,957,971 984 $50,500,500
Recreation/
Entertainment $196,700,000 2,326 $92,900,498 $331,287,223 3,262 $135,460,136
Total $1,554,700,000 21,306 $666,484,558 $2,375,800,824 27,182 $948,016,284
September 2018 Visitor Statistics City of Scottsdale/Applied Economics 9
The output multiplier for U.S. tourism spending in Scottsdale is 1.53; meaning that for every dollar that is spent
by domestic visitors in Scottsdale, an additional $0.53 is created in sales to other local businesses that support
the hospitality industry.2
2 The output multiplier of 1.53 can be calculated by dividing total output (shown in Figure 4) by direct output. This multiplier
represents the combined impacts of the five different industry-specific multipliers used in the economic impact calcula-
tions.
September 2018 Visitor Statistics City of Scottsdale/Applied Economics 10
Visitors Fiscal Contributions
The tourism industry is an integral part of the economic base in the City of Scottsdale, generating close to $2.4
billion in total economic activity in the city’s private sector in 2017. The tourism industry is also one of the most
significant sources of revenue for the City of Scottsdale.
The visitor industry generates a substantial portion of the city’s sales and bed tax revenues. Bed taxes are paid
directly on room sales, while sales taxes apply to spending at restaurants, hotels, retailers, entertainment and
recreation venues as well as car rentals. This section of the report looks at actual tax collections by type for
the City of Scottsdale and compares total collections to estimated collections from domestic visitors.
The collections attributable to domestic visitors shown in Figure 5 are calculated based on estimated visitor
spending by type in Figure 3 (last column) times the 1.65 percent local sales tax rate. The hotel/motel catego-
ry includes the 1.65 percent sales tax on hotel room sales. For food and beverage spending, 85 percent of the
spending is allocated to the restaurant category while 15 percent are allocated to food stores. For retail
spending by visitors, 65 percent is allocated to miscellaneous retail, 30 percent to department stores and 5
percent to auto purchases. Sales taxes on admissions and fees for entertainment and recreation are included
in the “other taxable” category. Sales taxes on local transportation spending (car rentals) are included in the
rental category.
Overall, about 14 percent of sales tax collections in the city are attributed to visitors along with 90 percent of
bed tax collections. Visitors generated an estimated $43.9 million in tax revenues to the City of Scottsdale in
FY 2017/18, up from $41.9 million in FY 2016/17. Property taxes collected from hotels and resorts are an addi-
tional tourism revenue source and were not used in calculating visitor fiscal contributions.
There are additional revenues generated by hospitality industry employees living in Scottsdale. Based on the
results of the economic impact analysis, direct personal income in Scottsdale is estimated at $666.5 million in
FY 2017/18 (see Figure 4). This represents payroll to workers at hotels, restaurants, shops, entertainment and
recreation venues, etc. Based on Maricopa County Rideshare data, an estimated 33 percent of these people
who work in Scottsdale also live in Scottsdale. Applying that percentage to the personal income figure and
distributing that spending based on typical household spending patterns, hospitality employees living in Scotts-
dale spend about 50 percent of their income on taxable goods.3 This in turn generates about $1.8 million in
additional annual sales tax revenues to the city.
3 Percent of income spent on taxable goods based on Bureau of Labor Statistics, Consumer Expenditure Survey.
September 2018 Visitor Statistics City of Scottsdale/Applied Economics 11
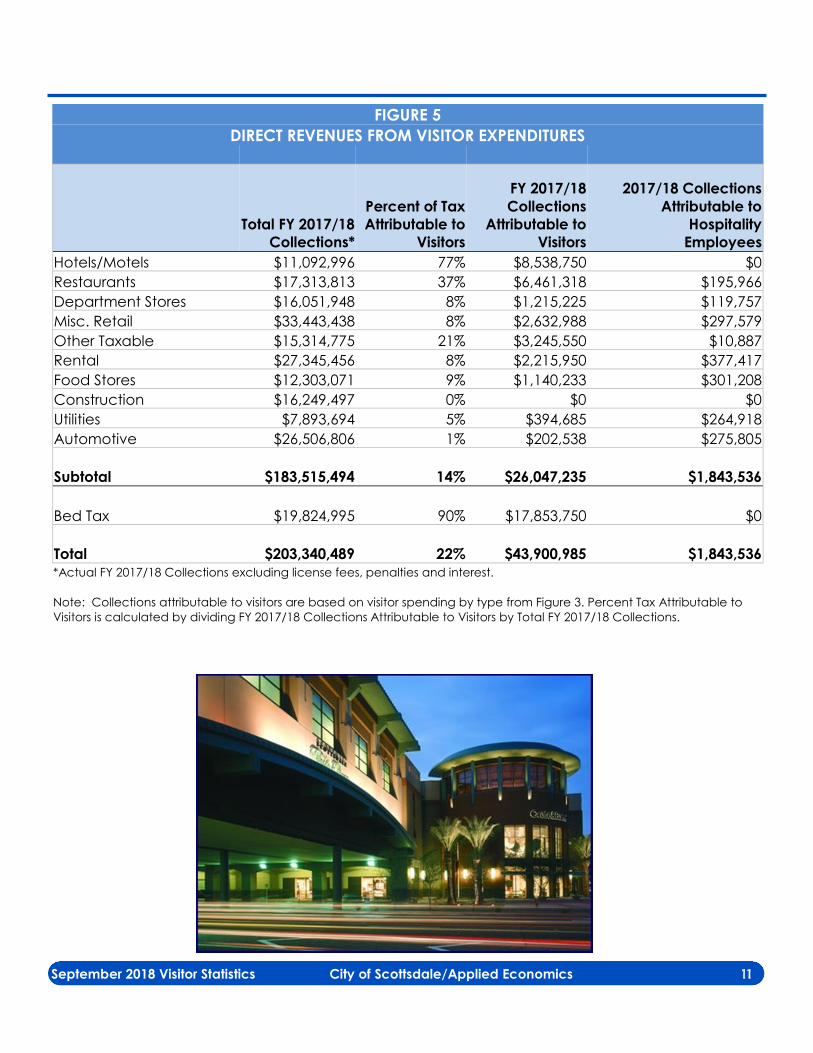
FIGURE 5
DIRECT REVENUES FROM VISITOR EXPENDITURES
Total FY 2017/18
Collections*
Percent of Tax
Attributable to
Visitors
FY 2017/18
Collections
Attributable to
Visitors
2017/18 Collections
Attributable to
Hospitality
Employees
Hotels/Motels $11,092,996 77% $8,538,750 $0
Restaurants $17,313,813 37% $6,461,318 $195,966
Department Stores $16,051,948 8% $1,215,225 $119,757
Misc. Retail $33,443,438 8% $2,632,988 $297,579
Other Taxable $15,314,775 21% $3,245,550 $10,887
Rental $27,345,456 8% $2,215,950 $377,417
Food Stores $12,303,071 9% $1,140,233 $301,208
Construction $16,249,497 0% $0 $0
Utilities $7,893,694 5% $394,685 $264,918
Automotive $26,506,806 1% $202,538 $275,805
Subtotal $183,515,494 14% $26,047,235 $1,843,536
Bed Tax $19,824,995 90% $17,853,750 $0
Total $203,340,489 22% $43,900,985 $1,843,536 *Actual FY 2017/18 Collections excluding license fees, penalties and interest.
Note: Collections attributable to visitors are based on visitor spending by type from Figure 3. Percent Tax Attributable to
Visitors is calculated by dividing FY 2017/18 Collections Attributable to Visitors by Total FY 2017/18 Collections.
September 2018 Visitor Statistics City of Scottsdale/Applied Economics 12
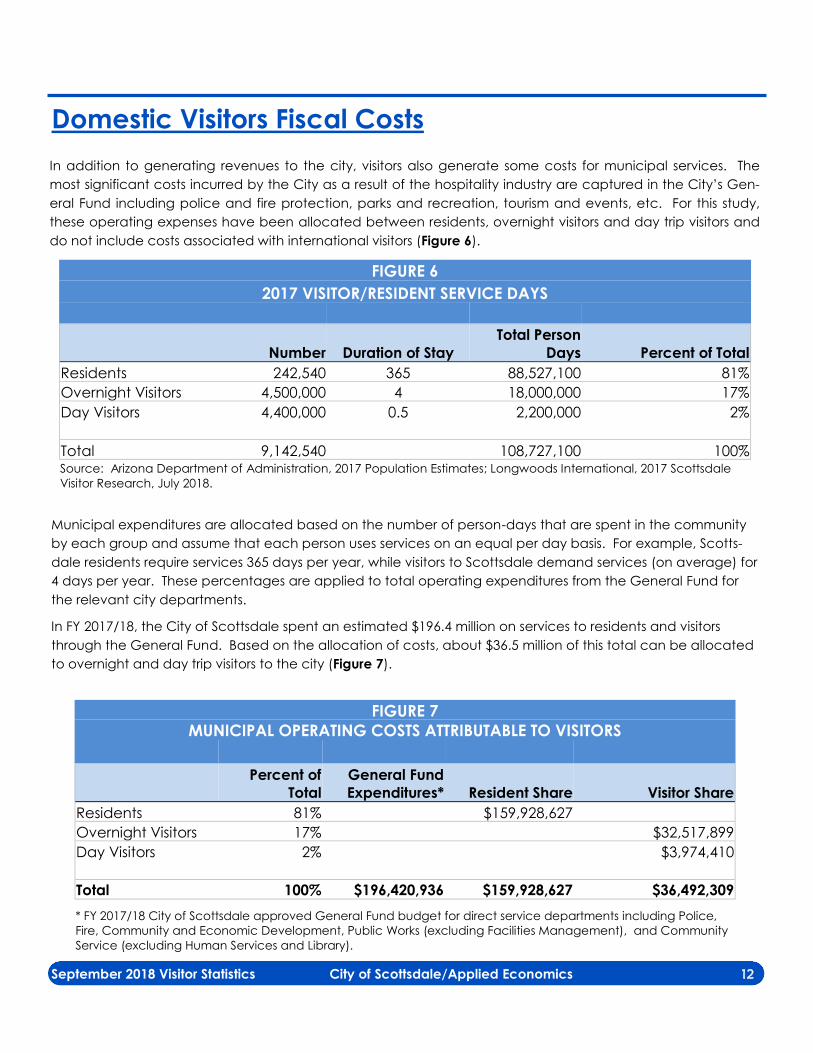
Domestic Visitors Fiscal Costs
In addition to generating revenues to the city, visitors also generate some costs for municipal services. The
most significant costs incurred by the City as a result of the hospitality industry are captured in the City’s Gen-
eral Fund including police and fire protection, parks and recreation, tourism and events, etc. For this study,
these operating expenses have been allocated between residents, overnight visitors and day trip visitors and
do not include costs associated with international visitors (Figure 6).
Municipal expenditures are allocated based on the number of person-days that are spent in the community
by each group and assume that each person uses services on an equal per day basis. For example, Scotts-
dale residents require services 365 days per year, while visitors to Scottsdale demand services (on average) for
4 days per year. These percentages are applied to total operating expenditures from the General Fund for
the relevant city departments.
In FY 2017/18, the City of Scottsdale spent an estimated $196.4 million on services to residents and visitors
through the General Fund. Based on the allocation of costs, about $36.5 million of this total can be allocated
to overnight and day trip visitors to the city (Figure 7).
FIGURE 6
2017 VISITOR/RESIDENT SERVICE DAYS
Number Duration of Stay
Total Person
Days Percent of Total
Residents 242,540 365 88,527,100 81%
Overnight Visitors 4,500,000 4 18,000,000 17%
Day Visitors 4,400,000 0.5 2,200,000 2%
Total 9,142,540 108,727,100 100% Source: Arizona Department of Administration, 2017 Population Estimates; Longwoods International, 2017 Scottsdale
Visitor Research, July 2018.
FIGURE 7
MUNICIPAL OPERATING COSTS ATTRIBUTABLE TO VISITORS
Percent of
Total
General Fund
Expenditures* Resident Share Visitor Share
Residents 81% $159,928,627
Overnight Visitors 17% $32,517,899
Day Visitors 2% $3,974,410
Total 100% $196,420,936 $159,928,627 $36,492,309
* FY 2017/18 City of Scottsdale approved General Fund budget for direct service departments including Police,
Fire, Community and Economic Development, Public Works (excluding Facilities Management), and Community
Service (excluding Human Services and Library).
September 2018 Visitor Statistics City of Scottsdale/Applied Economics 13
Cost Benefit Results
Scottsdale visitors make a significant contribution to the community’s economy. Direct expenditures by do-
mestic visitors in Scottsdale totaled an estimated $1.6 billion for 2017 and created an annual economic im-
pact of $2.4 billion in revenues to local businesses. As a result of these direct expenditures, visitors and hospital-
ity employees generated an estimated $45.7 million in sales and bed taxes to the City of Scottsdale. This rep-
resents 22 percent of total sales and bed tax collections by the city.
In FY 2017/18, the City also spent $36.5 million in operating costs to support visitors through the provision of vari-
ous services. However, the amount of annual tax revenues generated by visitors exceeds the operating costs
for municipal services attributed to visitors by $9.3 million. This resulted in a cost benefit ratio of 1.25.
These calculations take a broad overall view of bed and sales tax collections in order to draw assumptions re-
lated to the fiscal contribution of visitors, in comparison to city expenditures related to visitors. Portions of total
bed tax collections are allocated toward the city’s general fund to offset expenditures related to services to
visitors. There are also portions of visitor-related sales tax collections that are allocated to non-General Fund
operating expenditures such Preserve land acquisitions and transportation.
The hospitality industry is a net generator of revenues for the community. Per Figures 4 and 5, visitors not only
create positive net fiscal impacts for the city, but also support thousands of jobs and payroll at local business-
es, creating significant benefits to the city and the region.