Embed Size (px)
Citation preview
Sean Carey
Tafe No. 366851615
Lab Report:
Schenck Tensile
Test
October 2012
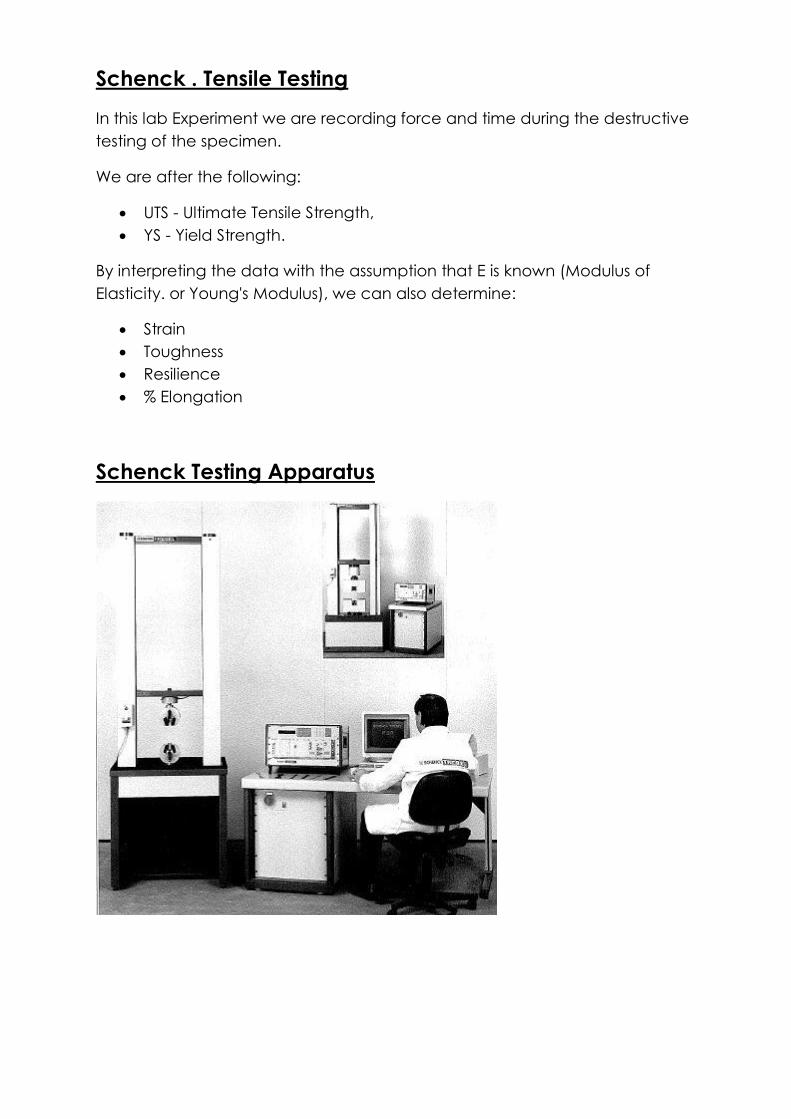
Schenck . Tensile Testing
In this lab Experiment we are recording force and time during the destructive
testing of the specimen.
We are after the following:
UTS - Ultimate Tensile Strength,
YS - Yield Strength.
By interpreting the data with the assumption that E is known (Modulus of
Elasticity. or Young's Modulus), we can also determine:
Strain
Toughness
Resilience
% Elongation
Schenck Testing Apparatus
Schenck Laboratory Procedure
Before starting the lab, you must calculate the maximum load that can be
applied to the specimen, assuming a sensible UTS of the material. Note that in
practice, the UTS is nearly always higher than the published values. This is
because the published data is usually a 'guaranteed' value, or the lowest
value you would rarely, if ever, encounter. See Materials.htm for our list of
material data.
1. Take measurements of the specimen. Diameter, Length, etc. Ascertain
the material as best you can.
2. Load the specimen into the machine and set the strain rate
3. Run the test while recording force values.
Tensile / Axial Stress: = F /A
Tensile / Axial Strain: = x / L
Modulus of Elasticity: E = s / s
= Axial Stress (MPa)
A = Cross-sectional Area (mm2)
F = Force (N)
= Axial strain (no units)
L = Gauge length - originally (mm)
x = extension (mm)
E = Modulus of Elasticity (MPa)
Using the Formulas Below & graphing the results we can determine
• Ultimate Tensile Stress (UTS), MPa
• Yield Stress (YS), MPa
• Use Modulus of Elasticity (E), to determine Yield Strain
• Plot F/x and Stress/Strain graphs with calibrated axes
• Quantify resilience and toughness
In this Experiment we are using:
Diam 6 x 80mm long, Mild steel, 0.4%C, normalised at 900°C
The Data Sheet For this Steel is available at:
http://asm.matweb.com/search/SpecificMaterial.asp?bassnum=m4130r
Calculating Machine settings:
We must first estimate a value to pre-set the tester to:
Using Tensile Strength = Force / Cross sectional Area to determine this
Ultimate Tensile Strength = 670MPa (from data sheet)
C.S.A. = π(6/2)² = 28.278mm²
Therefore Max Force = Tensile Strength x C.S.A.
= 670 x 28.278 = 18946.26N
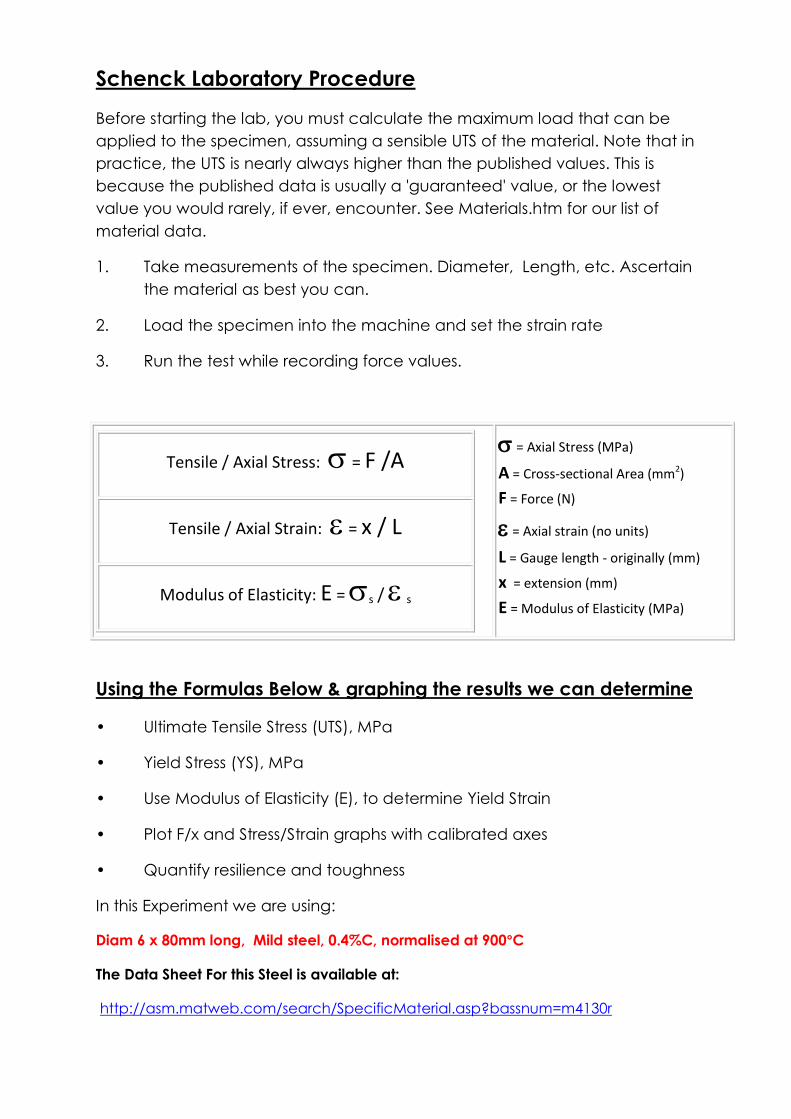
Machine Results:
From the Schneck Machine we get a series of force values which can be
plotted on a graph as follows.
We can then go on to plot Stress / Strain. However this is not a true
representation as the reduction in C.S.A and elongation of the test piece is
not uniform throughout the duration of the test.
0
5000
10000
15000
20000
25000
0 100 200 300 400 500 600
Forc
e A
pp
lied
(N
)
Time (t)
Schneck Results Force/ Unit Time
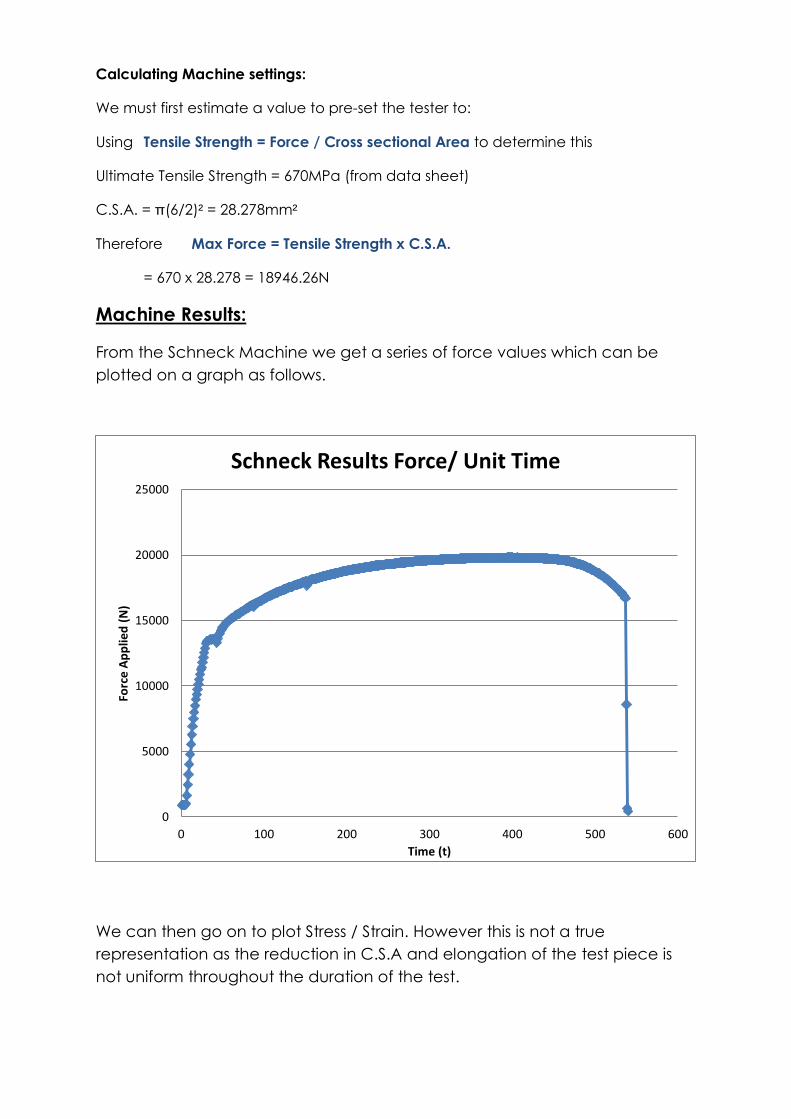
Yield Point:
From these results we can determine the yield point, the point at which the
test piece will no longer return to its original size as approx. 45 units on the x-
axis. Zooming into our graph or checking our machine results will give us an
accurate value.
Force Unit Time Stress
13612.72 40 481.3891718
13612.72 41 481.3891718
13593.1 42 480.6952401
13298.76 43 470.2862649
13593.1 44 480.6952401
13867.82 45 490.4102836
13946.31 46 493.1860103
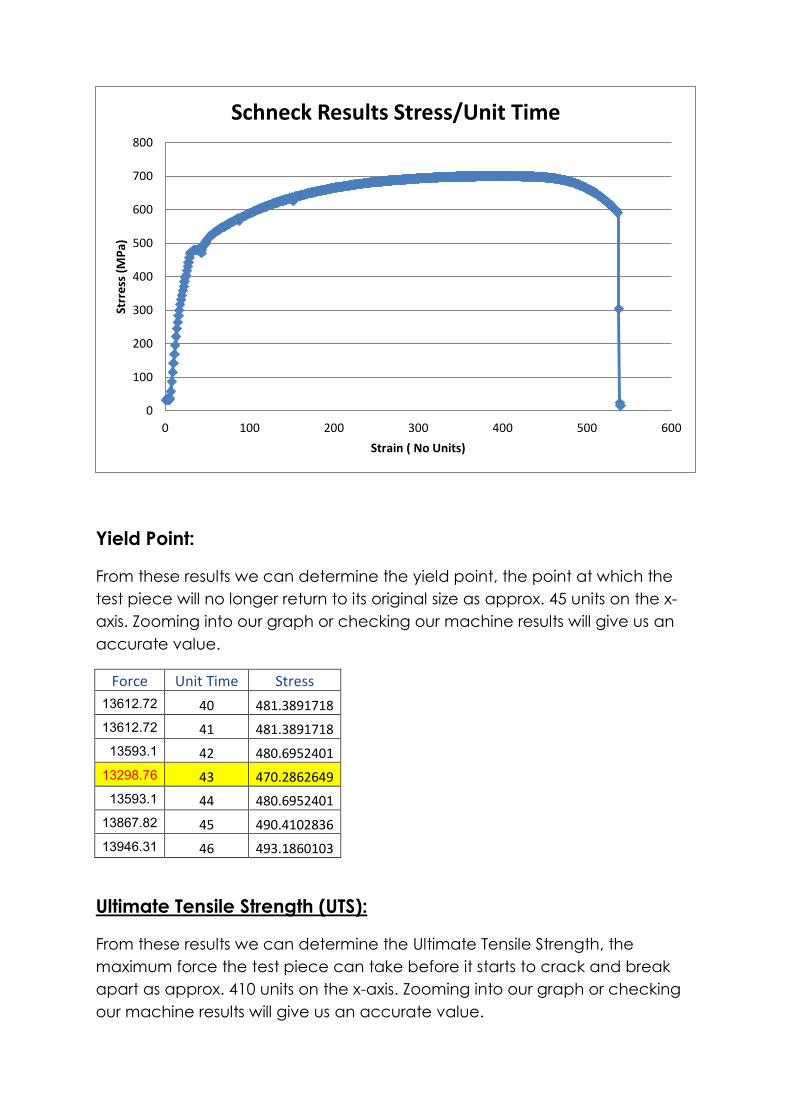
Ultimate Tensile Strength (UTS):
From these results we can determine the Ultimate Tensile Strength, the
maximum force the test piece can take before it starts to crack and break
apart as approx. 410 units on the x-axis. Zooming into our graph or checking
our machine results will give us an accurate value.
0
100
200
300
400
500
600
700
800
0 100 200 300 400 500 600
Strr
ess
(M
Pa)
Strain ( No Units)
Schneck Results Stress/Unit Time
Force Unit Time Stress
19793.97 403 699.9776505
19793.97 404 699.9776505
19793.97 405 699.9776505
19813.59 406 700.6715821
19793.97 407 699.9776505
19793.97 408 699.9776505
19793.97 409 699.9776505
The limitations of this experiment are that without an accurate means of
measuring an accurate value at the necking point, we are unable to get a
true Cross Sectional Area value throughout the experiment. This also applies
to the elongation of the test piece which also is not uniform throughout the
experiment.
Therefore we are unable to ascertain true values for Strain and Modulus of
Elasticity as these values are required. We are limited to “calculated
estimates”.
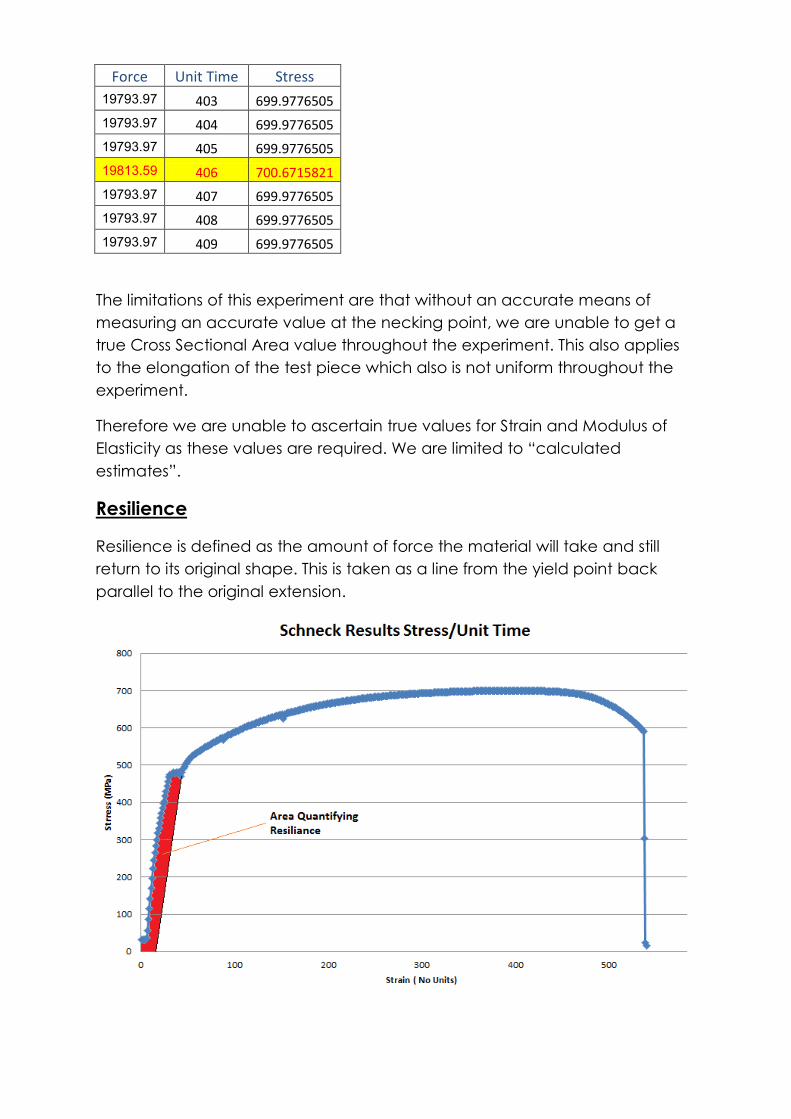
Resilience
Resilience is defined as the amount of force the material will take and still
return to its original shape. This is taken as a line from the yield point back
parallel to the original extension.
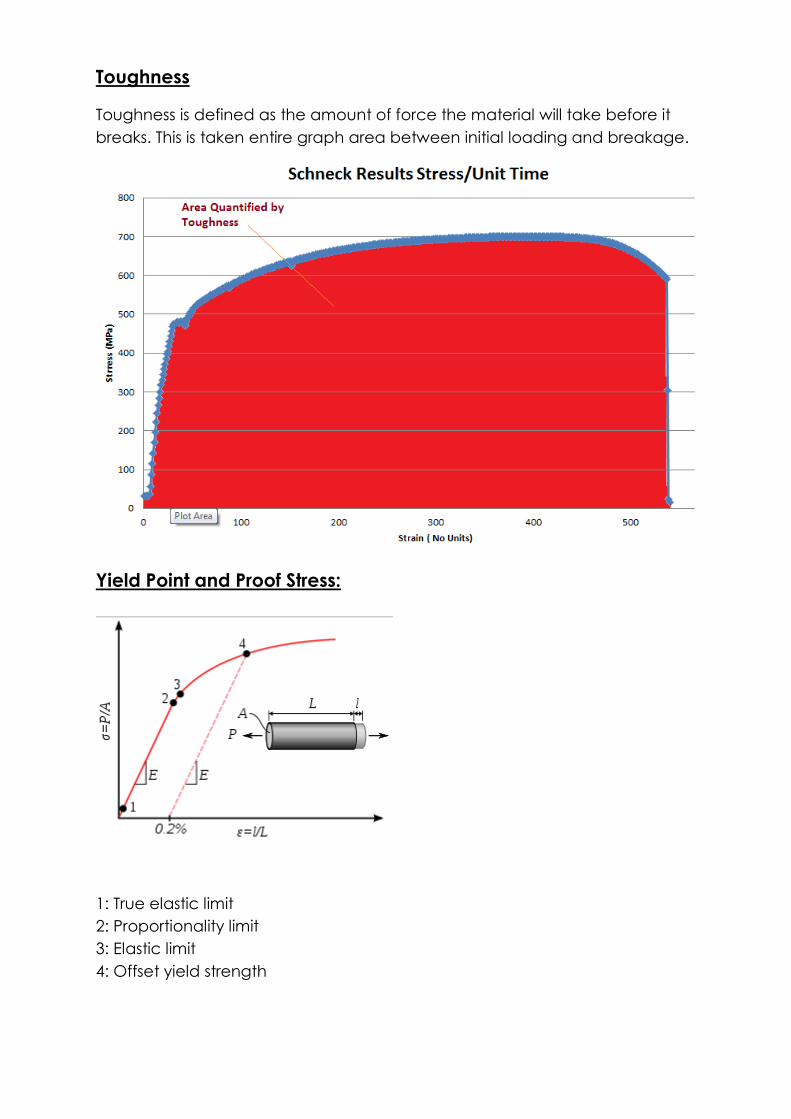
Toughness
Toughness is defined as the amount of force the material will take before it
breaks. This is taken entire graph area between initial loading and breakage.
Yield Point and Proof Stress:
1: True elastic limit
2: Proportionality limit
3: Elastic limit
4: Offset yield strength
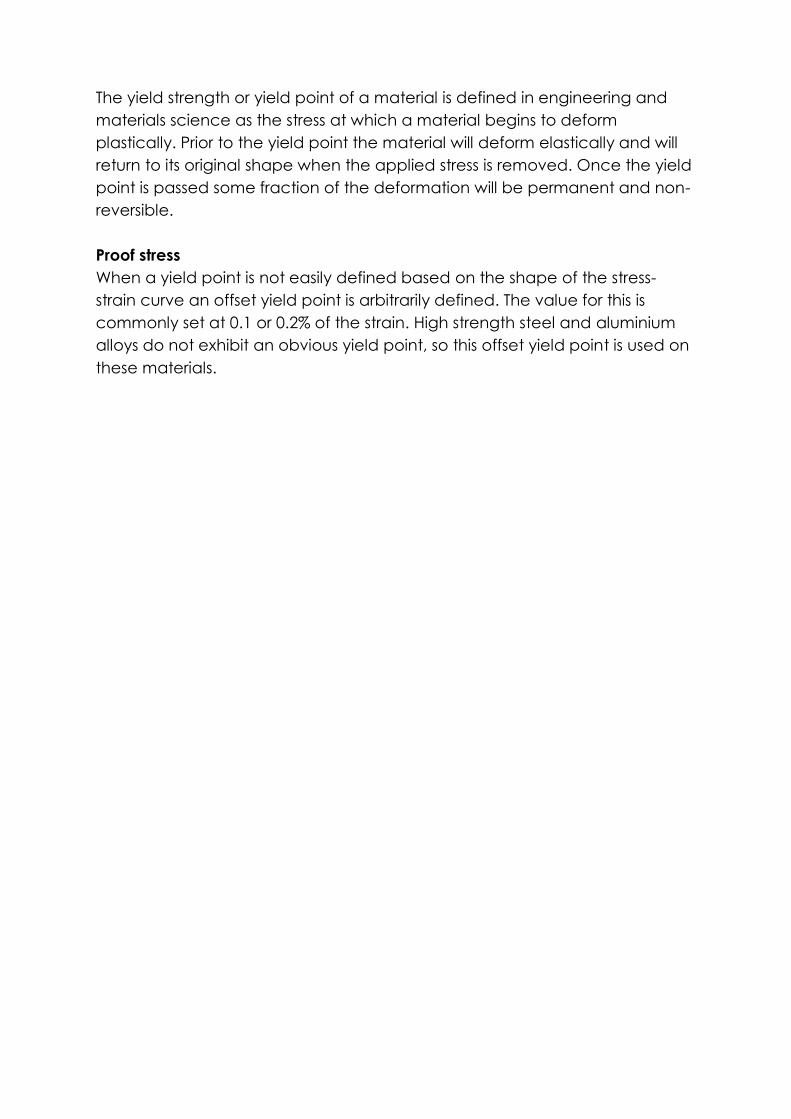
The yield strength or yield point of a material is defined in engineering and
materials science as the stress at which a material begins to deform
plastically. Prior to the yield point the material will deform elastically and will
return to its original shape when the applied stress is removed. Once the yield
point is passed some fraction of the deformation will be permanent and non-
reversible.
Proof stress
When a yield point is not easily defined based on the shape of the stress-
strain curve an offset yield point is arbitrarily defined. The value for this is
commonly set at 0.1 or 0.2% of the strain. High strength steel and aluminium
alloys do not exhibit an obvious yield point, so this offset yield point is used on
these materials.


![A. S.Johann (Giovanni) SCHENCK (c.1660-c.1712) SCHENCK L contains a useful summary, by Luttman, of Schenck’s music. SCHENCK [1703], of which a copy is held …](https://img.pdfslide.net/doc/110x75/606cefc8db0f366c206961a2/a-s-johann-giovanni-schenck-c1660-c1712-schenck-l-contains-a-useful-summary.jpg)