Embed Size (px)
Citation preview
SEARCH AND RESCUE
Annual Report
for
2014
Office of Emergency Management
Oregon Military Department
-i-
TABLE OF CONTENTS
SAR Report........................................................................................................................... 1
Transportation and Work Hours for 2014............................................................................ 21
Missions per County.……………………….......................................................................... 22
Missions per Month..................................................................……………......................... 23
Missions and per Year......................................................................................................... 24
Transportation and Work Hours for 2014 Training Only...................................................... 25
Operational Missions by County.......................................................................................... 26
Transportation and Work Hours for 2014 No Training or Civic Missions............................. 27
Searches 2014……..…….................................................................................................... 28
Rescues 2014………......................................................................................................... 29
Mission Results (Mt Hood Region)...................................................................................... 30
Water Missions (Eugene-Springfield).................................................................................. 31
Missions by Type and by County 2014................................................................................ 32
Missions by Type and by County (without training and civic missions)............................... 33
Mission Breakdown............................................................................................................. 34
Chart for Mission Breakdown.............................................................................................. 36
Transportation and Work by Mission and by County........................................................... 37
Data for Multiple Missions................................................................................................... 41
Subject Activity by County................................................................................................... 42
Mission Results (SAR Only)................................................................................................ 44
Assets Locating Subjects (Searches Only) 2014................................................................ 48
Assets Locating Subjects (Searches Only) 1997-2014....................................................... 49
Cell Phone Use (Land Searches Only)............................................................................... 50
Subject Status by Age (SAR Only)...................................................................................... 51
All SAR Subjects by Age..................................................................................................... 52
Searches for Females........................……………………………...……….……………......... 53
Searches for Males.....................……………………………………..……..……………......... 54
Searches for Male and Female (Solo).……….………………………..……..……………...... 55
Searches for Male and Female (Groups).………………………………..…..……………...... 56
Subjects and Average (SAR Only)..................................................................…................. 57
Subjects Comparison (SAR Only)....................................................................................... 58
Oregon’s Population and SAR.……………………………………………..……...………....... 59
-ii-
Number of Subjects by Age Group (SAR Only)................................................................... 60
Proportion of Subjects by Age Group (SAR Only)............................................................... 61
Home of Missing Subjects.........................................................................................…...... 62
Home of Rescued Subjects................................................................................................. 63
Land Use for Rescues (Land and Water)............................................................................ 64
Land Use for Searches (Land and Water)........................................................................... 65
Work Hours (SAR Only)...................................................................................................... 66
Mission Hours (SAR Only).................................................................................................. 67
Hours to Find a Subject on Land......................................................................................... 68
Time to Find a Subject on Land (Alive)............................................................................... 69
Time to Find a Subject on Land (Deceased)....................................................................... 70
Distance Traveled by Lost Subjects.................................................................................... 71
Distance Climbed or Descended (Search Only).................................................................. 72
Deaths by Age Group.......................................................................................................... 73
Deaths by Age..................................................................................................................... 74
Suicides............................................................................................................................... 75
Mission Results................................................................................................................... 76
Aviation............................................................................................…………..................... 77
Aviation Mishaps and Injuries by Month.............................................................................. 78
General Aviation Mishaps by Month.....…………................................................................ 79
Number of Aviation Injuries.…............................................................................……........ 80
Percentage of Aviation Injuries.………................................................................................ 71
Annual Number of General Aviation Mishaps...................................................................... 82
Beacons.……………………………………………….....…...………………………………...... 83
Annual Number of ELTs.……………………………...………………..…………….…..…....... 84
ELTs by Month and by County......................………............................................................ 85
Number of ELTs per Month.……………………...……………….....…………….……...…..... 86
ELT from 1996-2014............................................................................................................ 87
ELT Notification Times......................................................................................................... 88
Percentage of ELTs Occurring per Hour of the Day............................................................ 89
Assistance Provided to OEM on ELTs................................................................................. 90
ELT Mission Results…………………………………………….....………………….……........ 91
ELTs vs. Aircraft Mishaps.................................................................................................... 92
Search and Rescue Coverage............................................................................................ 93
-iii-
County Reports (alphabetical order)...................................................................starting on 94
SAR Incident Summary Form (Version 7) with Instructions.............................................. 129
Contact.............................................................................................................................. 133
-1-
SEARCH AND RESCUE
Annual Report for 2014 Introduction In Oregon, the State assigns SAR incident numbers to all reported events. The requestor gets an incident number from the Oregon Emergency Response System (OERS). Reports of the incidents are entered into the SAR database maintained by the Office of Emergency Management (OEM) and used to generate the statistics in this report. Copyright, Reproduction, and Data Use The information in this report is not copyrighted. Reproduction and use of these statistics are free to all users. If you use or reproduce the data in this report, please credit the source. Data There are several sources for the data in this report. The primary comes from the County Sheriffs’ Offices who are the responsible agencies for the majority of the missions in the state. OEM generates its own data while locating missing aircraft and tracking down the source of electronic beacons (ELT and EPIRB) as it is the responsible agency for these events. Data on aircraft accidents and injuries comes from the National Transportation Safety Board. The data on Oregon deaths and suicides come from the Oregon Health Authority, Oregon Vital Statistics, Annual Report 2013, Volume 2. All maps were made using ESRI ArcMap 10.0 Individual agencies assisting on a mission usually provide their figures directly to the Incident Commander. If any agency did not report their mission data, its inclusion here is doubtful. In 2014, 90% of the reports were sent in; a good year. Charts and Graphs Each chart and graph in this report is named. By convention, all chart and graph titles in the report are underlined for easier reference. Words in italics identify specific categories within any chart. With a few exceptions, numbers in the figures are rounded off to whole numbers. This means that anything less than 0.5 is rounded off to 0. Because of this, three entries of 0.25 will each show 0, although their sum will show 1. Following the Overview of 2014 is a description of each chart, graph, and statistics page along with a discussion, if necessary. What’s new in the 2014 Report There are changes every year this report comes out. Here are the major changes in the report. 1) A new chart called Totals for 2014 Training Only was added. 2) A new chart called Totals for 2014 No Training was added. 3) Some minor changes were made in the chart on Drugs 4) A new chart called All SAR Subjects by Age 1997-2014 was added. 5) A new chart called Deaths by Age 1997-2014 was added.
-2-
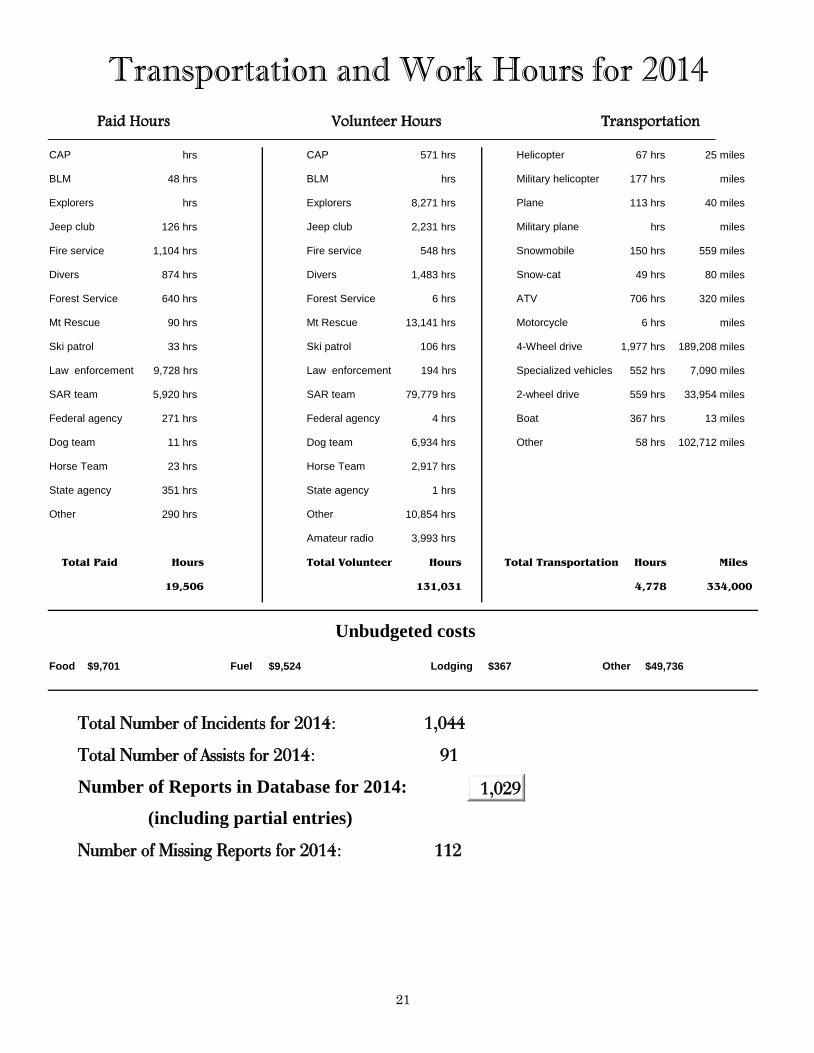
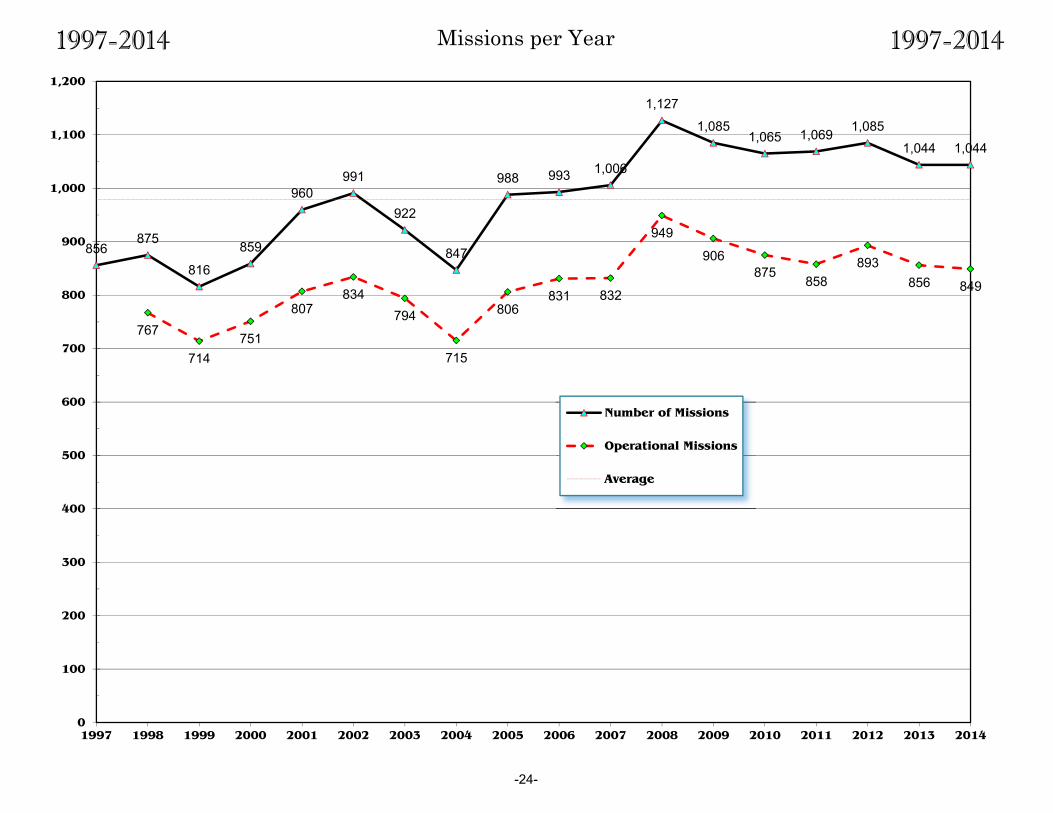
Overview of 2014 2014 was a moderately busy year. Even so, there were record high numbers of missions in March, July and October. There were 1,044 missions in 2014, exactly the same as 2013. This increases the average number of missions to 980 per year. 2014 was 7% above the average annual number of missions. Transportation and Work Hours for 2014, page 21 These are the totals for all agencies for the year. This information is derived solely from filed reports entered into the SAR database. Including county assists, there was only 1 mission less than last year. Despite this, there were substantial increases in the work over last year.
Change From Last Year Paid hours - 4% Volunteer hours +17% Equipment hours +35% Equipment miles +10%
The total number of incidents does not include the total number of responses. On many occasions, more than one county assists another county on a mission. For this reason, there are always more reports than the number of incidents. In 2014, there were 91 requests for assistance compared to 92 in 2013. The chart below shows the number of missions and the number of assists for the last 10 years. For the last 10 years, you can see that 2014 was an average year. The database has 1,029 incidents entered in 2014.
2005 2006 2007 2008 2009 2010 2011 2012 2013 2014 Missions 998 993 1,006 1,127 1,085 1,065 1,069 1,085 1,044 1,044 Assists 65 89 81 80 107 143 136 139 92 91
Total 1,060 1,082 1,087 1,207 1,192 1,208 1,205 1,224 1,136 1,135 Missing reports are generated anytime a county requests a mission number or is known to assist on a mission, but does not send in a report. There were 112 missing reports (10%) in 2014. As in previous years, several counties use the category called Other Transportation to track their use of Privately Owned Vehicles (POV). POV mileage constituted 30% of all vehicle miles. The breakdown for POV miles is as follows:
County Miles driven Deschutes 2,529 Douglas 5,197 Jackson 90,132

-3-
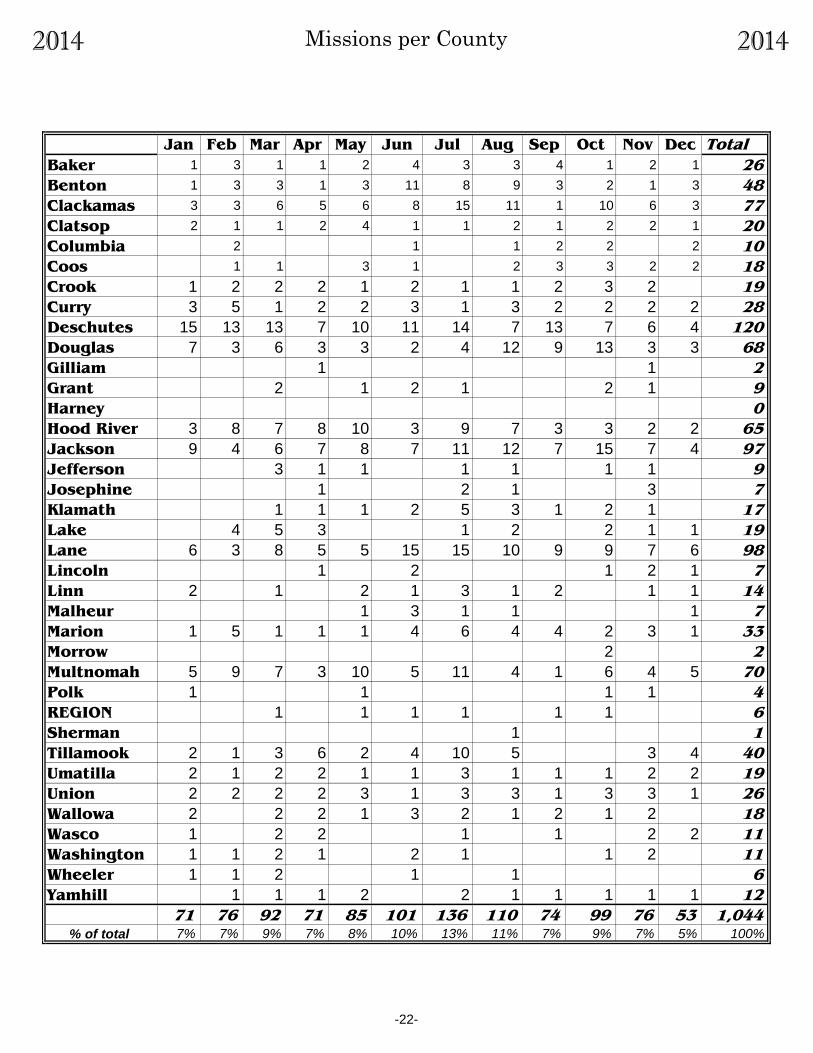
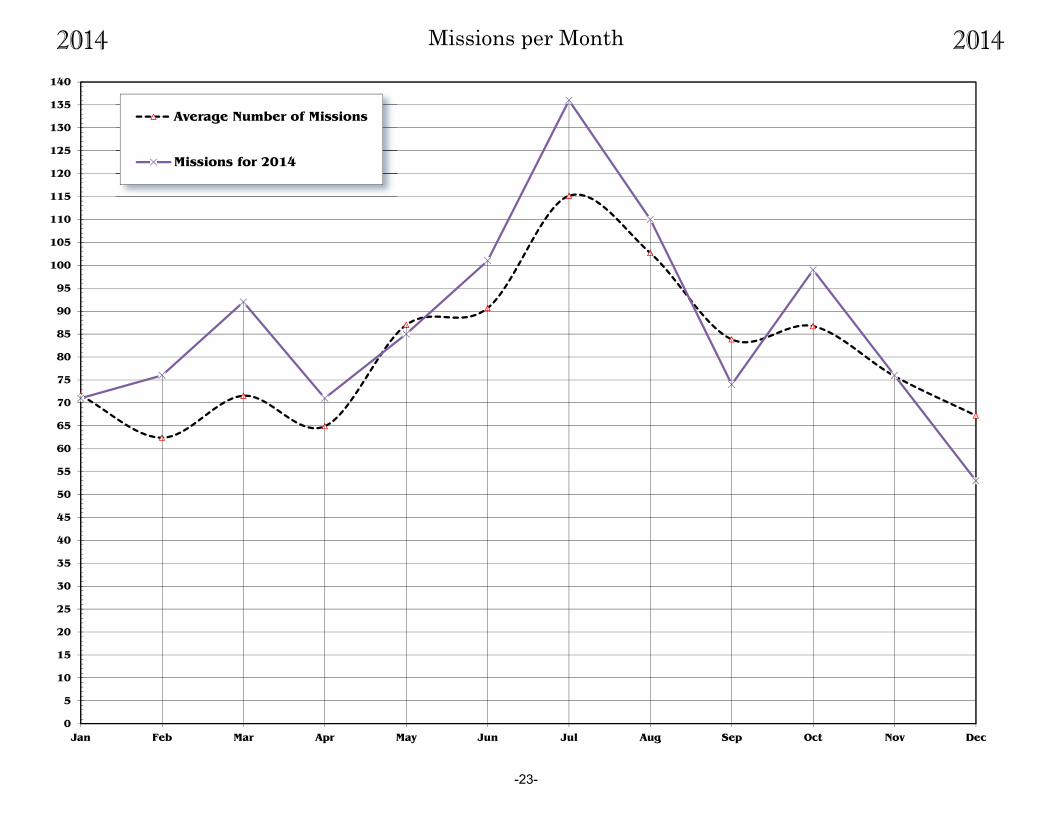
Missions per County, page 22 This chart shows the number of missions occurring in each county. It includes all types of missions grouped by month of occurrence. The Region block is used when the location of the mission’s subject is in more than one county or occurs out of state. These figures do not include every response. This means that when several counties respond to a single incident, the chart shows an entry only for the county requesting the initial incident number. For example, County A calls for an incident number. Later Counties B and C assist the first county. Although three counties responded, the chart shows an entry only for County A in the month it occurred. The bottom line of the chart is a calculation of each month’s percentage of the total. So, for example, we can see that 9% of 2014’s missions occurred in March. Missions Per Month, page 23 This graph shows the number of missions in 2014 per month with the average number of missions. There were record high number of missions in March, July, and October. Missions per Year, page 24 This chart shows the number of missions and operational missions from 1997 to 2014. The term “operational missions” is used to describe any SAR incident that is not training or a civic type of event. Many people want to know how many SAR missions there are in any given year. What they are not interested in is every training event, parade, public education, SAR meeting, et cetera, that occurs. Additionally, training and civic missions are artificially set at 1 each per month per county. The removal of training and civic missions leaves what most people consider Search and Rescue, i.e., looking for people and objects and assisting those in distress. The number of Operational Missions for 1997 could not be determined. We can see from the graph that 2014 had the fewest mission since 2007. On the average, there are 826 operational missions per year. The 849 operational missions in 2014 are only 3% above normal. Training and Civic missions include much of the year’s resources. Specifically, the following shows the percentage of the year’s resources used only by training and civic events.
Used by Training and Civic Missions Paid hours 13% Volunteer hours 69% Equipment hours 22% Equipment miles 46%
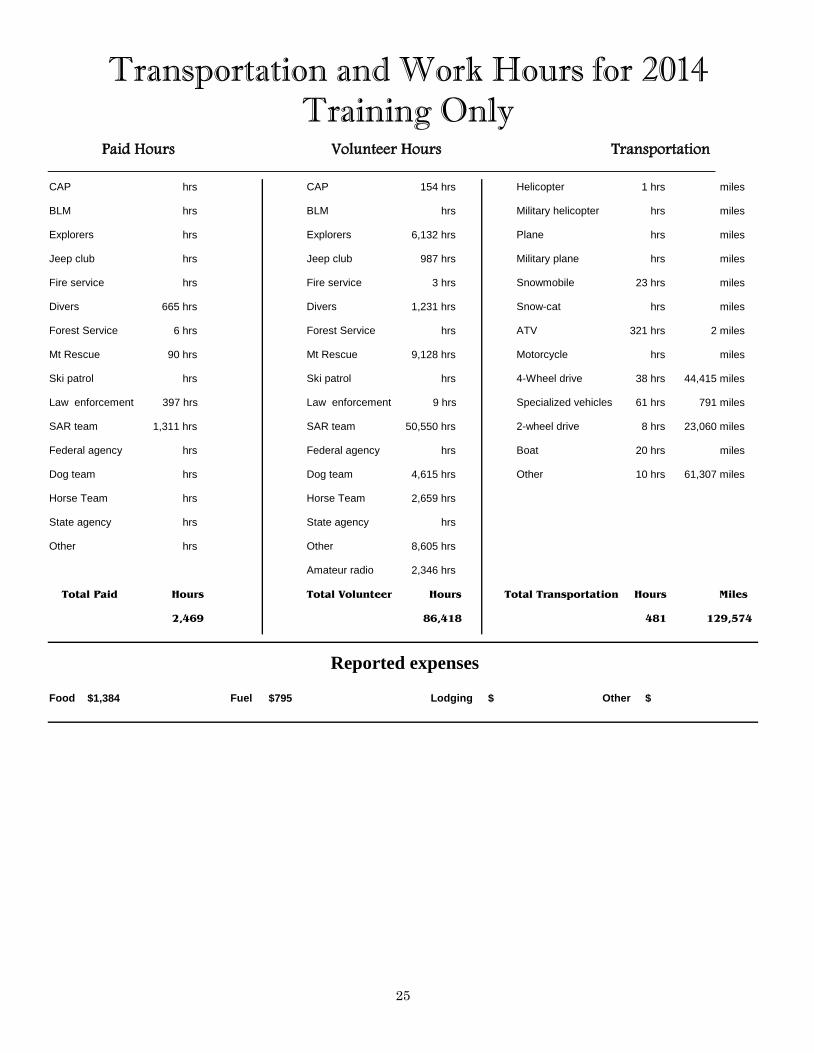
From this data, you can see that in 2014, 69% of all volunteer work and 46% of all vehicles driven were used only for training and public events. Transportation and Work Hours for 2014, Training Only, page 25 This shows the breakdown of all the training received in 2014. Training is the single

-4-
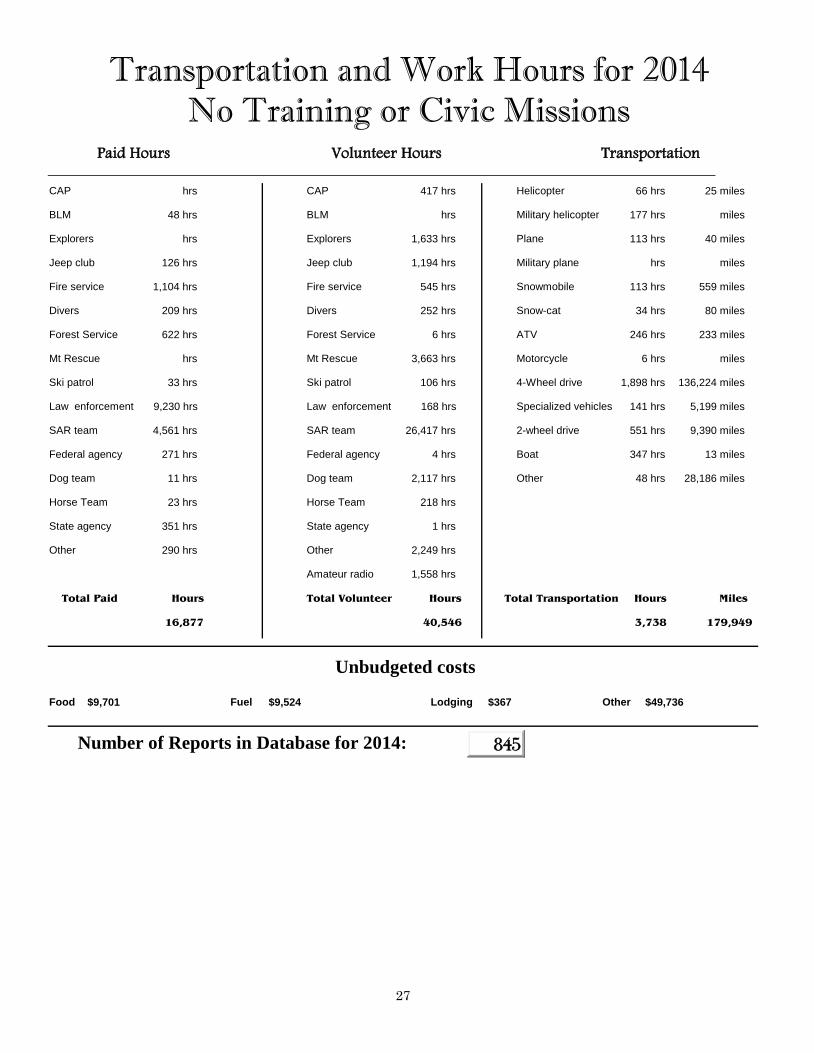
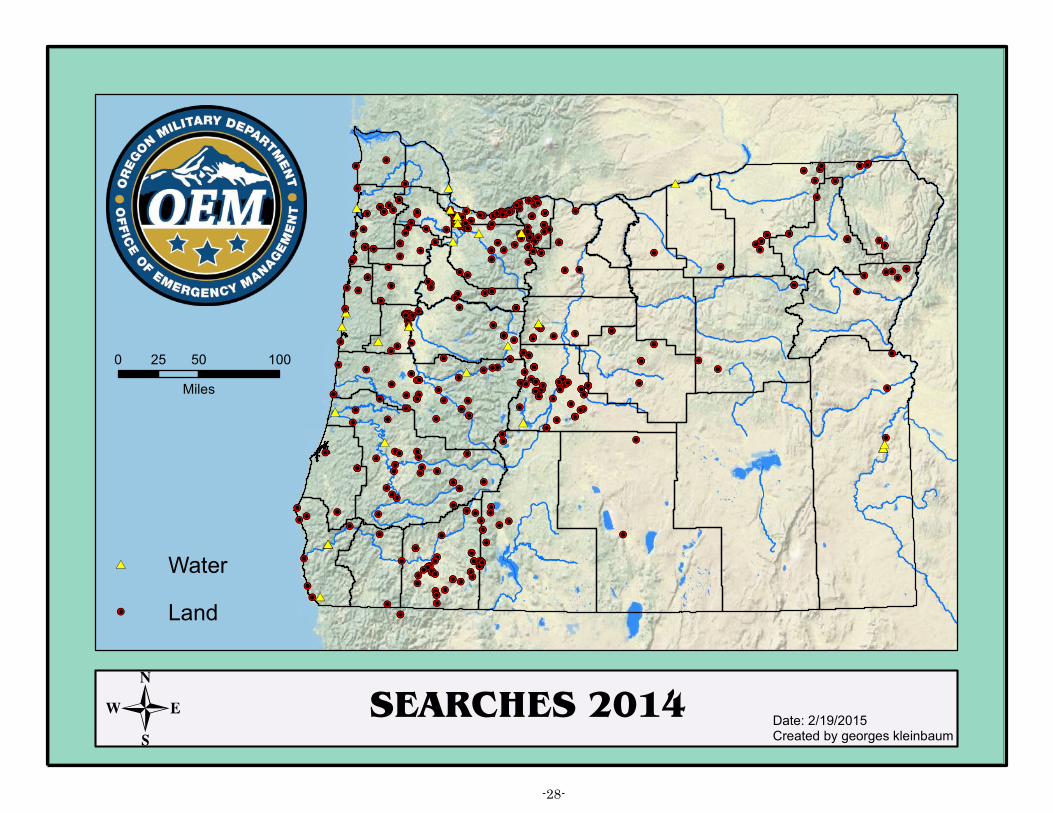
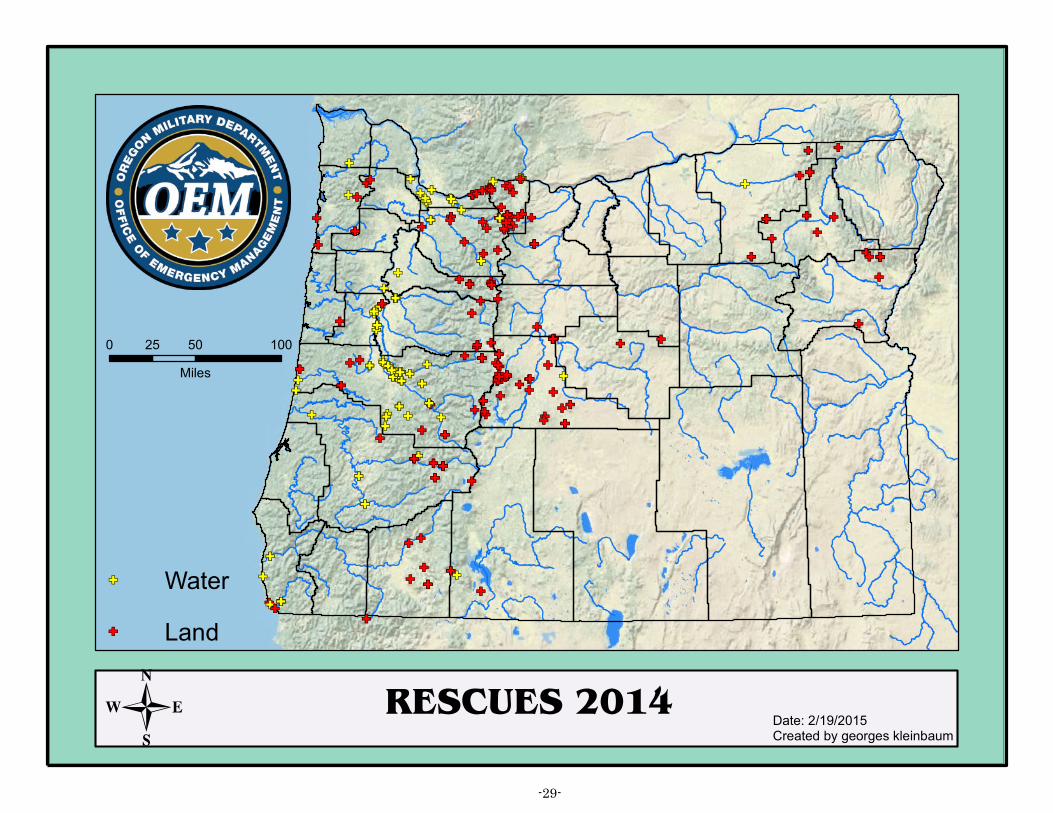
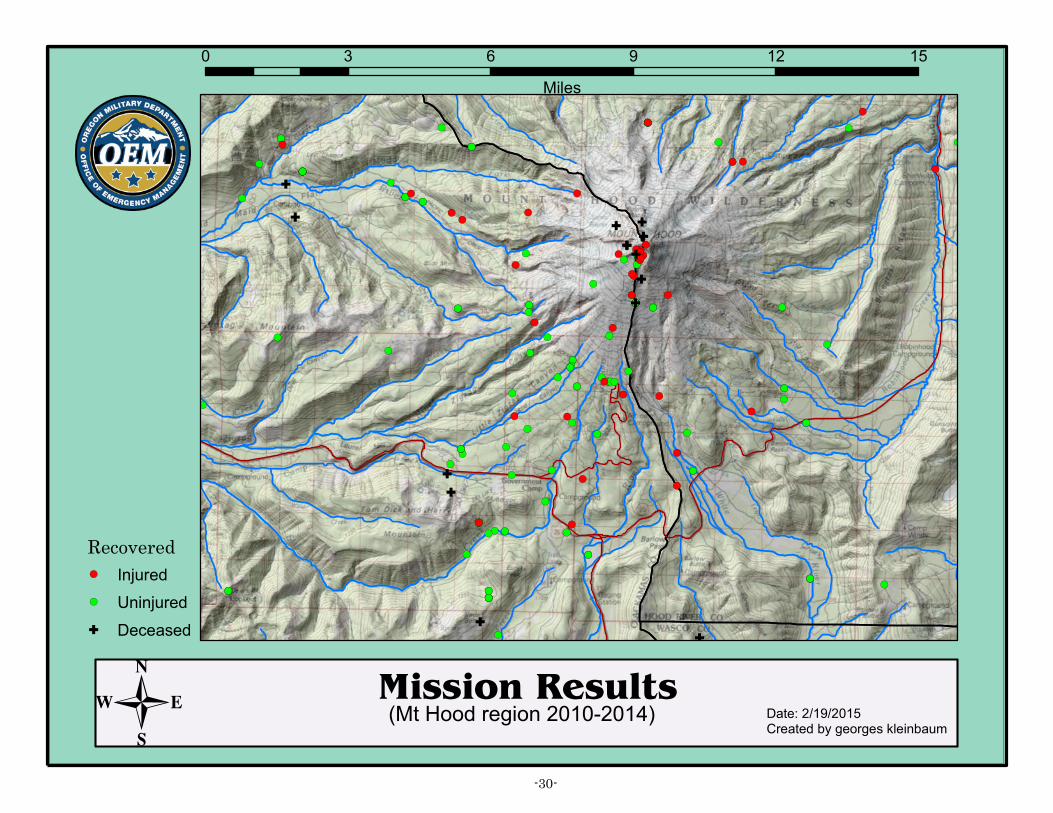
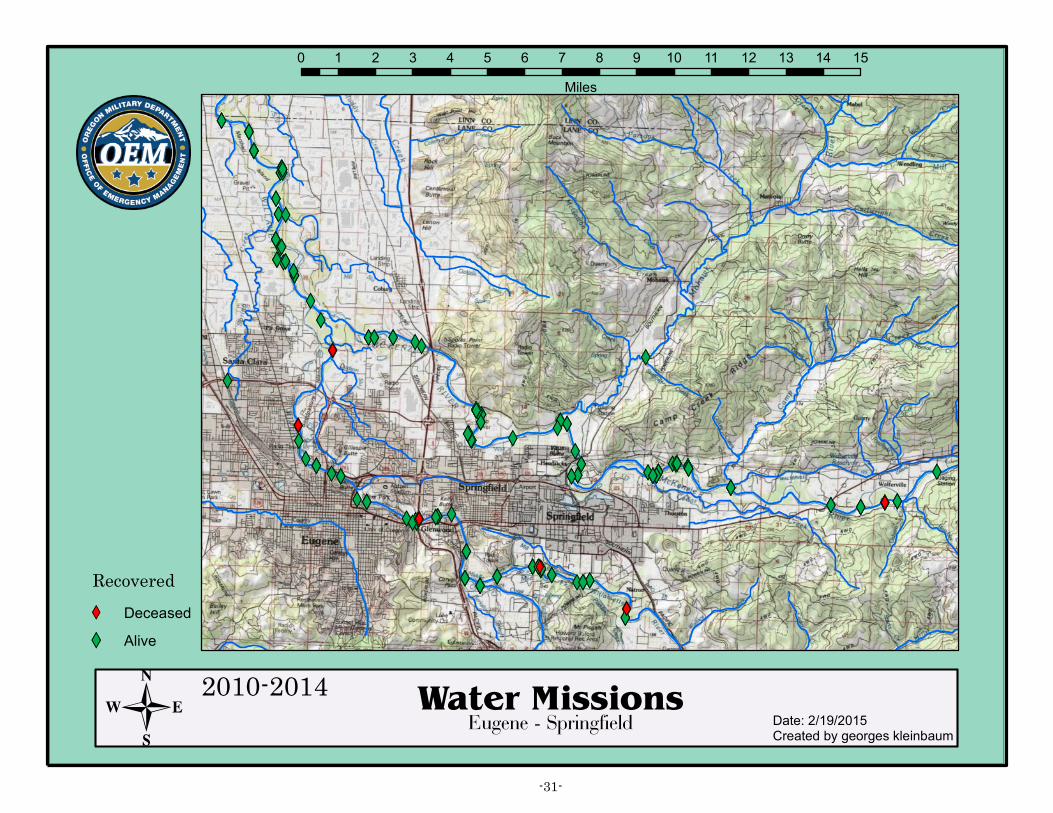
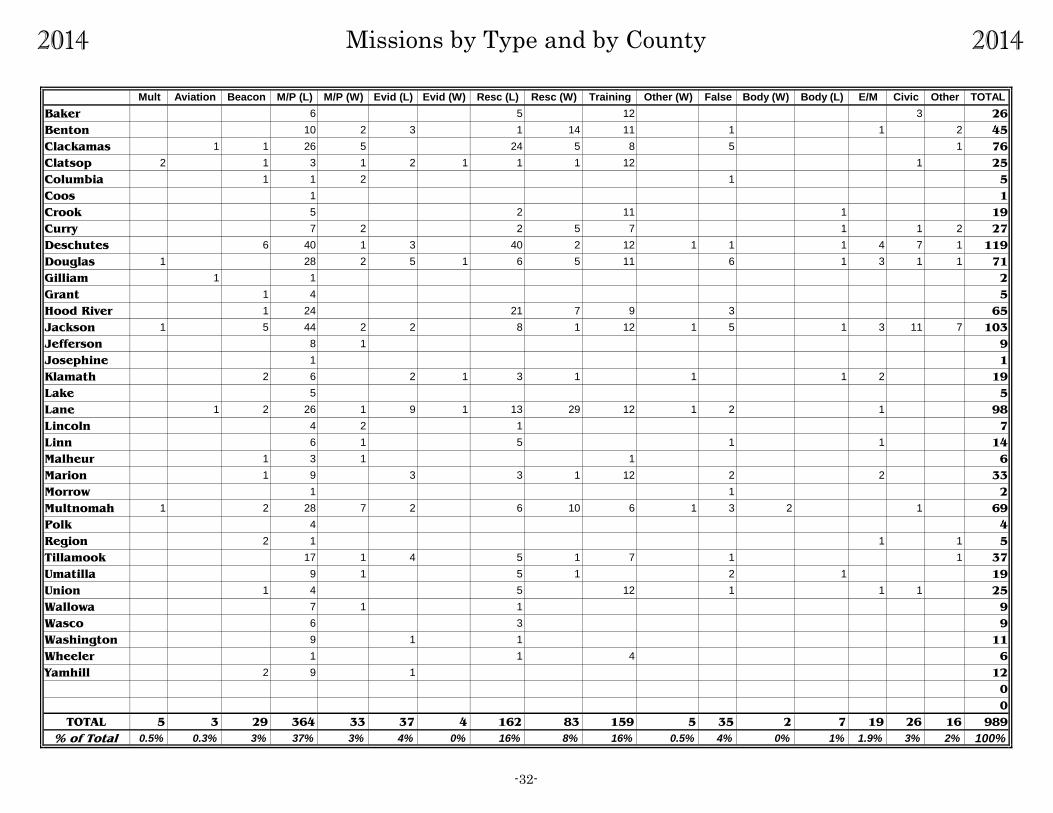
biggest user of SAR personnel in the State. Over 86,000 volunteer hours were spent in training in 2014. Operational Missions by County, page 26 Operational missions constitute all the SAR missions for the year minus the training and civic events. The chart shows the number of operational missions by month for each county in 2014. It does not include any assistance provide by one county to another. This gives a good view of how busy each county was with unplanned SAR events for the year. Transportation and Work for 2014, No Training or Civic Missions, page 27 This shows the breakdown for all the SAR missions for the year with training and civic (public events) missions removed. Searches 2014, page 28 Rescues 2014, page 29 These maps show the location of every search and rescue in Oregon in 2014. The data for these maps come from the coordinates provided by the Counties. The “find coordinates” were used for these maps unless none were provided, in which case the IPP coordinates were used. The maps display 222 rescues out of 245 (91%) and 335 searches out of 391 (86%). Only the missions where coordinates were provided could be included. Mission Results (Mt Hood Region), page 30 Mount Hood is Oregon’s tallest mountain and is easily accessible from the state’s biggest city. This combination makes it ideal as a recreation area and sees a lot of use throughout the year. Due to the interest in Mt Hood and the numerous missions that occur there, this map was created showing the results of all the missions since 2010 for which coordinates were provided. Water Missions (Eugene-Springfield), page 31 Another region showing inordinate use is in the Eugene-Springfield area. Especially during the summer months, more water related missions occur there than any other part of the state. The map displays the results of the water missions for which coordinates were provided from 2010 to 2014. Missions by Type and by County, page 32 This is a breakdown of all of 2014’s missions by type. The figures were derived only from reports received. This chart does not show every mutual assist in the database. Abbreviations used in the headings allow enough room to include all the information on a single page. (L) and (W) stand for land and water, respectively. Totals for each county and each type of mission are included. The percentage at the bottom shows what portion of the year’s total each mission comprises. Following is a description of each mission. Mult Multiple mission. A special category used when more than one type of mission
occurred during the same incident. Each type of mission is not shown on this chart to prevent redundancy. A breakdown of Multiple Missions is found later in this report.
-5-
Aviation All missing aircraft and reports of crashes. They may or may not involve the county. These include only incidents reported directly to OEM. Therefore, the number is not the same as that reported by the NTSB, found later in this report.
Beacons Activations of ELTs and EPIRBs. (PLBs are not included as they are considered a land search or rescue.) May or may not involve the county.
M/P Missing Person. These are search missions, split into land and water. Evid Evidence search. Searches for anything that is not a person. This is also split
into land and water categories. Resc Rescue and MEDEVAC, split into land and water. These are missions for people
in distress in a known location. Other water Missions involving water that do not fit into any of the previous categories,
e.g., vehicle recovery from a body of water. Training Self-explanatory. Body Land and water body recovery. This category describes missions to remove
bodies as opposed to a search (or a rescue) resulting in a deceased subject. This is a mission type, not a mission result.
Civic Public and municipal events with SAR assistance or representation. E/M Emergency Management. General classification for all disasters, natural hazard
responses, and widespread emergencies. The only missions included are those actively involving SAR personnel.
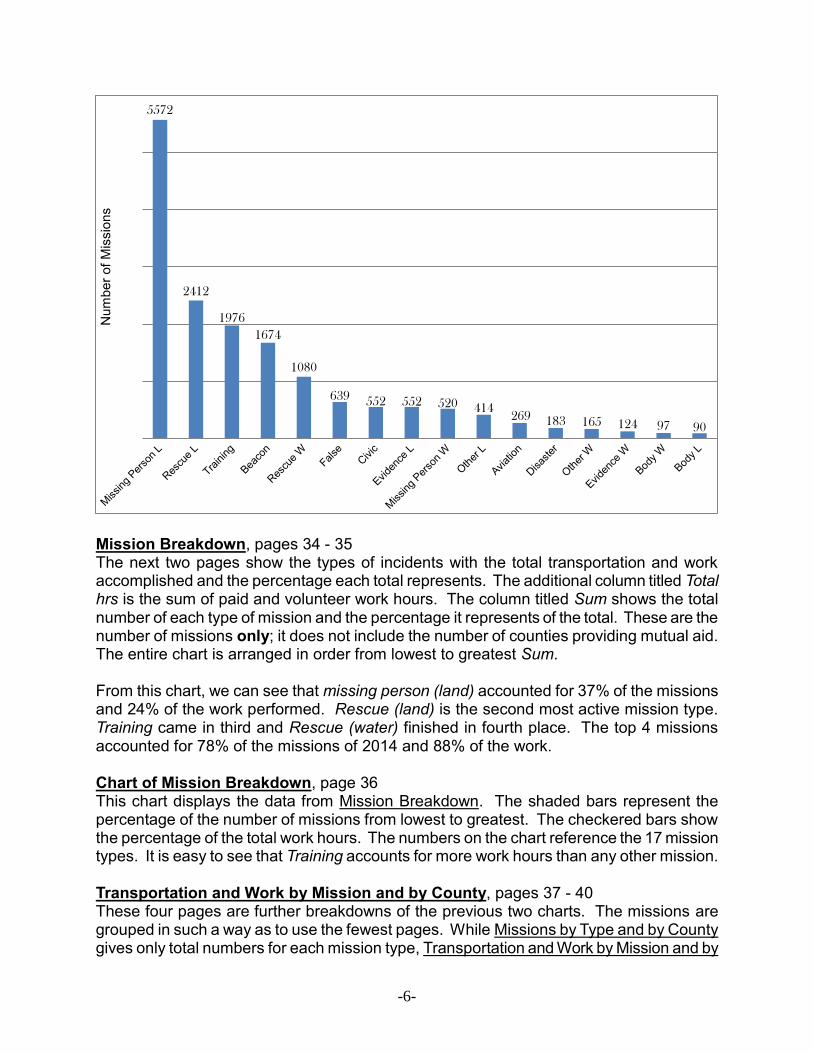
False Missions launched when the subject was never lost or in distress. Other Any mission not classifiable in one of the other types. Missions by Type and by County 1997-2014, page 33 This chart is similar to the previous one with the following differences. The time span for this chart is 1997-2014. The categories Training and Civic have been removed. This results in looking at only Operational Missions, which changes the percentage of all other missions on the chart. We can now see that Missing People (land) account for 40% of the state’s missions. The second busiest mission is Rescues (land), accounting for 17% of all missions. Looking at the counties, we see that Clackamas, Deschutes, and Lane are the busiest counties over the last 18 years. We can also see that Lane County has well over double the number of water rescues than the next highest county. The data from this chart is represented below for comparison.
-6-
Mission Breakdown, pages 34 - 35 The next two pages show the types of incidents with the total transportation and work accomplished and the percentage each total represents. The additional column titled Total hrs is the sum of paid and volunteer work hours. The column titled Sum shows the total number of each type of mission and the percentage it represents of the total. These are the number of missions only; it does not include the number of counties providing mutual aid. The entire chart is arranged in order from lowest to greatest Sum. From this chart, we can see that missing person (land) accounted for 37% of the missions and 24% of the work performed. Rescue (land) is the second most active mission type. Training came in third and Rescue (water) finished in fourth place. The top 4 missions accounted for 78% of the missions of 2014 and 88% of the work. Chart of Mission Breakdown, page 36 This chart displays the data from Mission Breakdown. The shaded bars represent the percentage of the number of missions from lowest to greatest. The checkered bars show the percentage of the total work hours. The numbers on the chart reference the 17 mission types. It is easy to see that Training accounts for more work hours than any other mission. Transportation and Work by Mission and by County, pages 37 - 40 These four pages are further breakdowns of the previous two charts. The missions are grouped in such a way as to use the fewest pages. While Missions by Type and by County gives only total numbers for each mission type, Transportation and Work by Mission and by
5572
2412
1976
1674
1080
639 552 552 520 414 269 183 165 124 97 90
Num
ber o
f Mis
sion
s
-7-
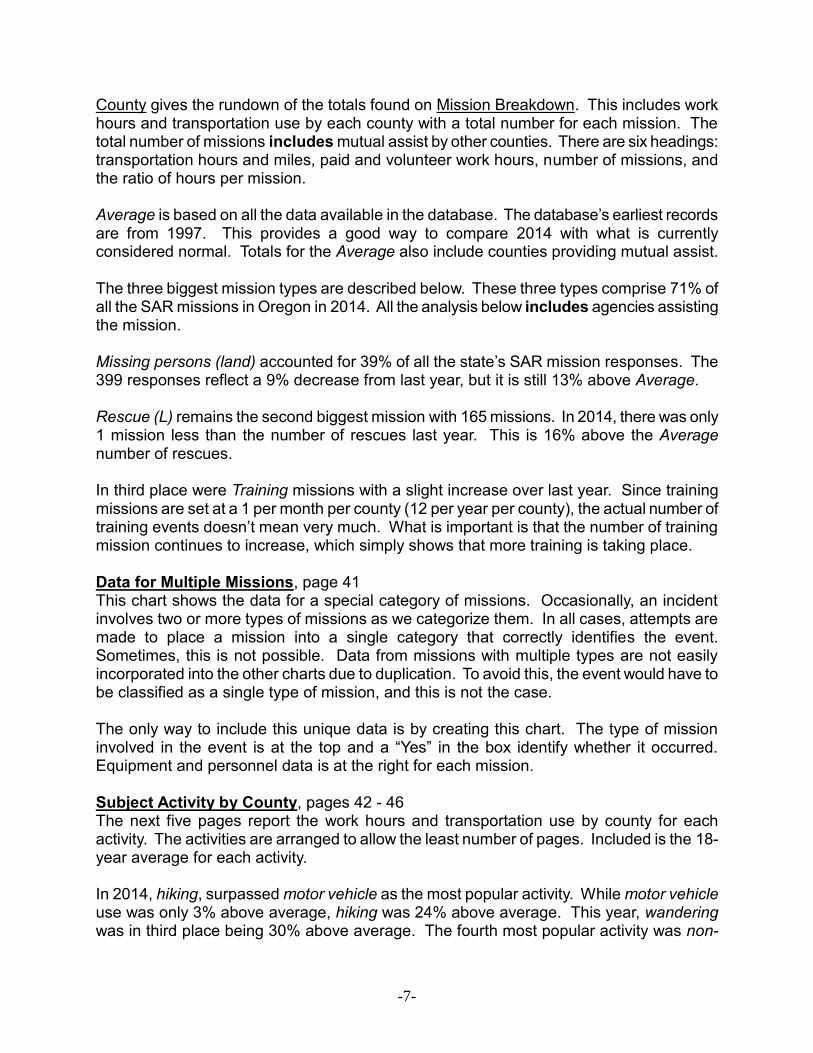
County gives the rundown of the totals found on Mission Breakdown. This includes work hours and transportation use by each county with a total number for each mission. The total number of missions includes mutual assist by other counties. There are six headings: transportation hours and miles, paid and volunteer work hours, number of missions, and the ratio of hours per mission. Average is based on all the data available in the database. The database’s earliest records are from 1997. This provides a good way to compare 2014 with what is currently considered normal. Totals for the Average also include counties providing mutual assist. The three biggest mission types are described below. These three types comprise 71% of all the SAR missions in Oregon in 2014. All the analysis below includes agencies assisting the mission. Missing persons (land) accounted for 39% of all the state’s SAR mission responses. The 399 responses reflect a 9% decrease from last year, but it is still 13% above Average. Rescue (L) remains the second biggest mission with 165 missions. In 2014, there was only 1 mission less than the number of rescues last year. This is 16% above the Average number of rescues. In third place were Training missions with a slight increase over last year. Since training missions are set at a 1 per month per county (12 per year per county), the actual number of training events doesn’t mean very much. What is important is that the number of training mission continues to increase, which simply shows that more training is taking place. Data for Multiple Missions, page 41 This chart shows the data for a special category of missions. Occasionally, an incident involves two or more types of missions as we categorize them. In all cases, attempts are made to place a mission into a single category that correctly identifies the event. Sometimes, this is not possible. Data from missions with multiple types are not easily incorporated into the other charts due to duplication. To avoid this, the event would have to be classified as a single type of mission, and this is not the case. The only way to include this unique data is by creating this chart. The type of mission involved in the event is at the top and a “Yes” in the box identify whether it occurred. Equipment and personnel data is at the right for each mission. Subject Activity by County, pages 42 - 46 The next five pages report the work hours and transportation use by county for each activity. The activities are arranged to allow the least number of pages. Included is the 18-year average for each activity. In 2014, hiking, surpassed motor vehicle as the most popular activity. While motor vehicle use was only 3% above average, hiking was 24% above average. This year, wandering was in third place being 30% above average. The fourth most popular activity was non-
-8-
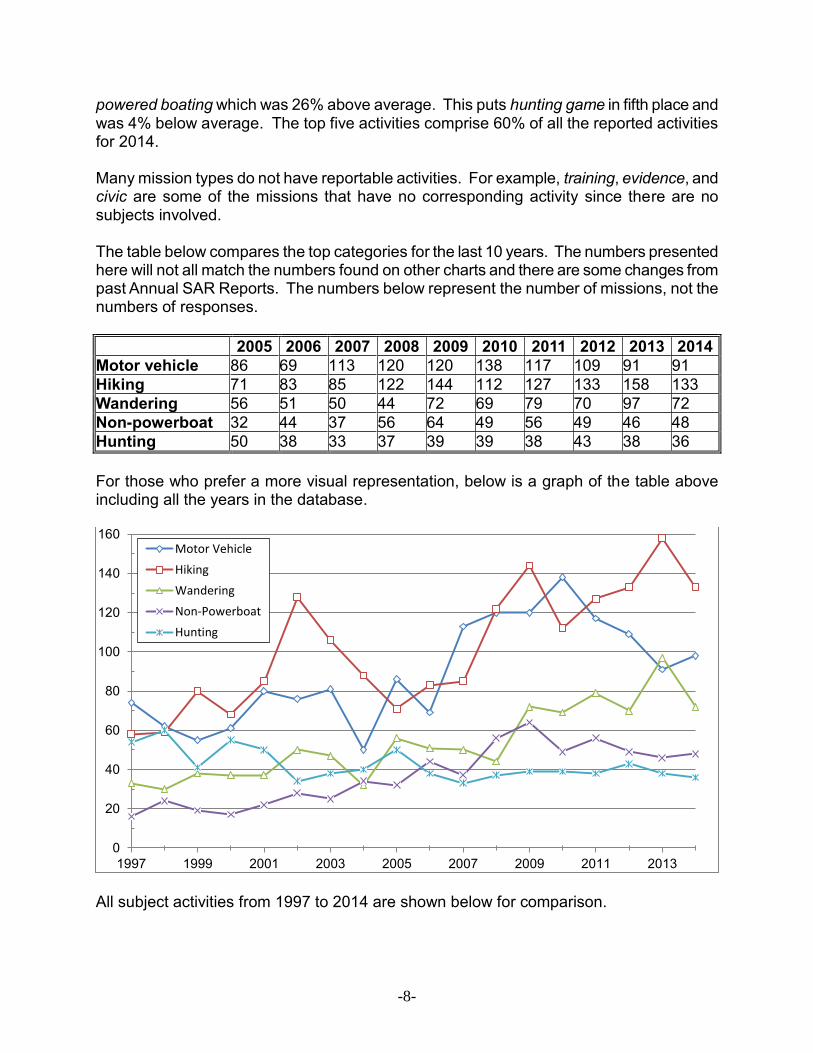
powered boating which was 26% above average. This puts hunting game in fifth place and was 4% below average. The top five activities comprise 60% of all the reported activities for 2014. Many mission types do not have reportable activities. For example, training, evidence, and civic are some of the missions that have no corresponding activity since there are no subjects involved. The table below compares the top categories for the last 10 years. The numbers presented here will not all match the numbers found on other charts and there are some changes from past Annual SAR Reports. The numbers below represent the number of missions, not the numbers of responses.
2005 2006 2007 2008 2009 2010 2011 2012 2013 2014 Motor vehicle 86 69 113 120 120 138 117 109 91 91 Hiking 71 83 85 122 144 112 127 133 158 133 Wandering 56 51 50 44 72 69 79 70 97 72 Non-powerboat 32 44 37 56 64 49 56 49 46 48 Hunting 50 38 33 37 39 39 38 43 38 36 For those who prefer a more visual representation, below is a graph of the table above including all the years in the database.
All subject activities from 1997 to 2014 are shown below for comparison.
0
20
40
60
80
100
120
140
160
1997 1999 2001 2003 2005 2007 2009 2011 2013
Motor Vehicle
Hiking
Wandering
Non-Powerboat
Hunting
-9-
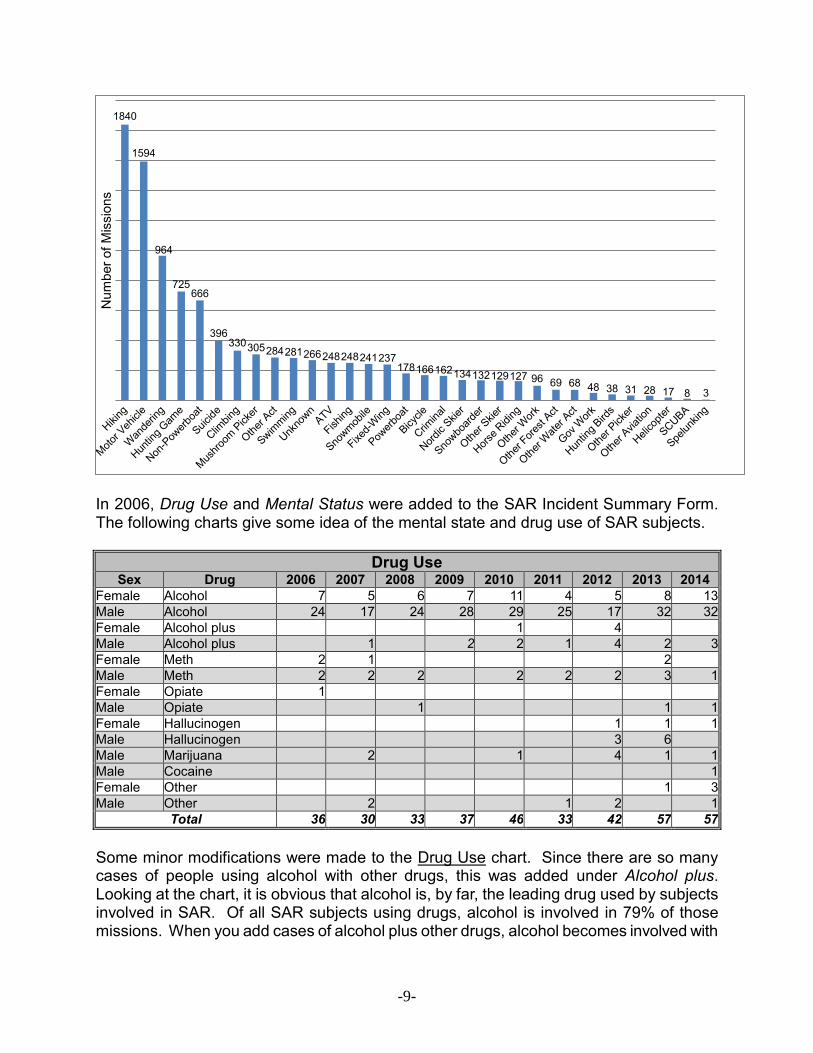
In 2006, Drug Use and Mental Status were added to the SAR Incident Summary Form. The following charts give some idea of the mental state and drug use of SAR subjects.
Drug Use Sex Drug 2006 2007 2008 2009 2010 2011 2012 2013 2014
Female Alcohol 7 5 6 7 11 4 5 8 13 Male Alcohol 24 17 24 28 29 25 17 32 32 Female Alcohol plus 1 4 Male Alcohol plus 1 2 2 1 4 2 3 Female Meth 2 1 2 Male Meth 2 2 2 2 2 2 3 1 Female Opiate 1 Male Opiate 1 1 1 Female Hallucinogen 1 1 1 Male Hallucinogen 3 6 Male Marijuana 2 1 4 1 1 Male Cocaine 1 Female Other 1 3 Male Other 2 1 2 1
Total 36 30 33 37 46 33 42 57 57 Some minor modifications were made to the Drug Use chart. Since there are so many cases of people using alcohol with other drugs, this was added under Alcohol plus. Looking at the chart, it is obvious that alcohol is, by far, the leading drug used by subjects involved in SAR. Of all SAR subjects using drugs, alcohol is involved in 79% of those missions. When you add cases of alcohol plus other drugs, alcohol becomes involved with
1840
1594
964
725 666
396 330 305 284 281 266 248 248 241 237
178 166 162 134 132 129 127 96 69 68 48 38 31 28 17 8 3
Num
ber o
f Mis
sion
s
-10-
85% of all drug use. The label “Other” refers to less common drugs or use of more than one drug at the same time. Overall, drug use is involved in 4% of all SAR missions.
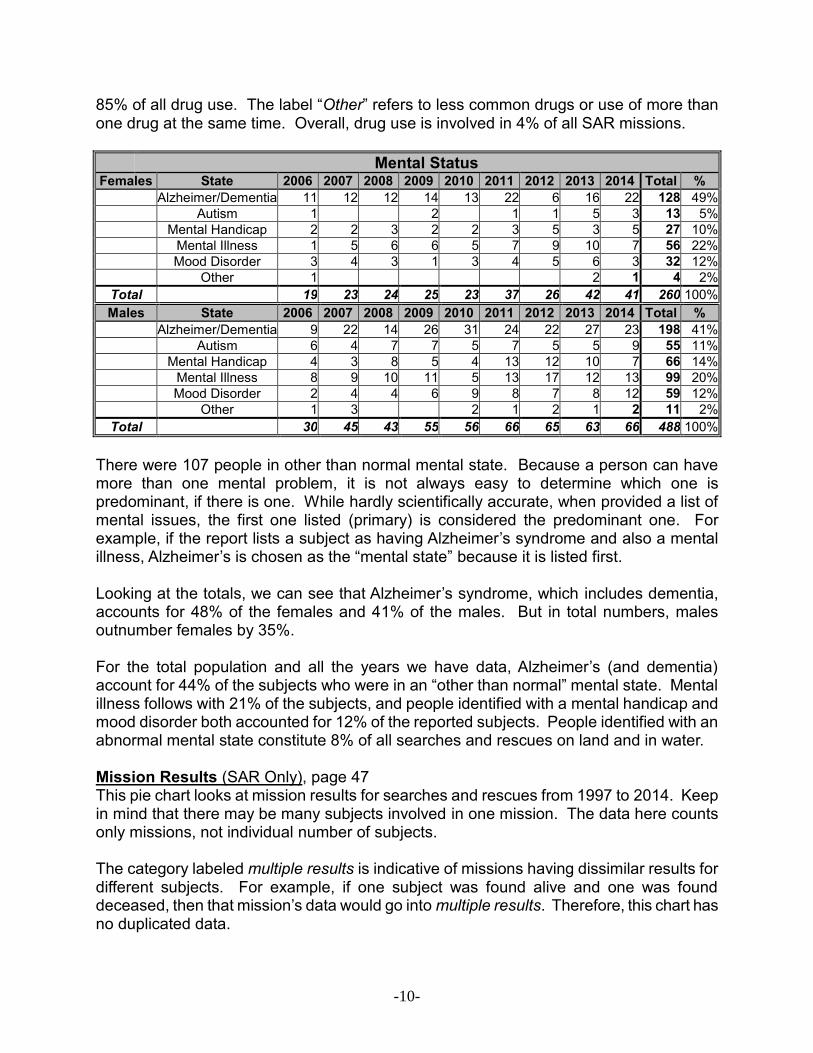
Mental Status Females State 2006 2007 2008 2009 2010 2011 2012 2013 2014 Total %
Alzheimer/Dementia 11 12 12 14 13 22 6 16 22 128 49% Autism 1 2 1 1 5 3 13 5% Mental Handicap 2 2 3 2 2 3 5 3 5 27 10% Mental Illness 1 5 6 6 5 7 9 10 7 56 22% Mood Disorder 3 4 3 1 3 4 5 6 3 32 12% Other 1 2 1 4 2%
Total 19 23 24 25 23 37 26 42 41 260 100% Males State 2006 2007 2008 2009 2010 2011 2012 2013 2014 Total %
Alzheimer/Dementia 9 22 14 26 31 24 22 27 23 198 41% Autism 6 4 7 7 5 7 5 5 9 55 11% Mental Handicap 4 3 8 5 4 13 12 10 7 66 14% Mental Illness 8 9 10 11 5 13 17 12 13 99 20% Mood Disorder 2 4 4 6 9 8 7 8 12 59 12% Other 1 3 2 1 2 1 2 11 2%
Total 30 45 43 55 56 66 65 63 66 488 100% There were 107 people in other than normal mental state. Because a person can have more than one mental problem, it is not always easy to determine which one is predominant, if there is one. While hardly scientifically accurate, when provided a list of mental issues, the first one listed (primary) is considered the predominant one. For example, if the report lists a subject as having Alzheimer’s syndrome and also a mental illness, Alzheimer’s is chosen as the “mental state” because it is listed first. Looking at the totals, we can see that Alzheimer’s syndrome, which includes dementia, accounts for 48% of the females and 41% of the males. But in total numbers, males outnumber females by 35%. For the total population and all the years we have data, Alzheimer’s (and dementia) account for 44% of the subjects who were in an “other than normal” mental state. Mental illness follows with 21% of the subjects, and people identified with a mental handicap and mood disorder both accounted for 12% of the reported subjects. People identified with an abnormal mental state constitute 8% of all searches and rescues on land and in water. Mission Results (SAR Only), page 47 This pie chart looks at mission results for searches and rescues from 1997 to 2014. Keep in mind that there may be many subjects involved in one mission. The data here counts only missions, not individual number of subjects. The category labeled multiple results is indicative of missions having dissimilar results for different subjects. For example, if one subject was found alive and one was found deceased, then that mission’s data would go into multiple results. Therefore, this chart has no duplicated data.
-11-
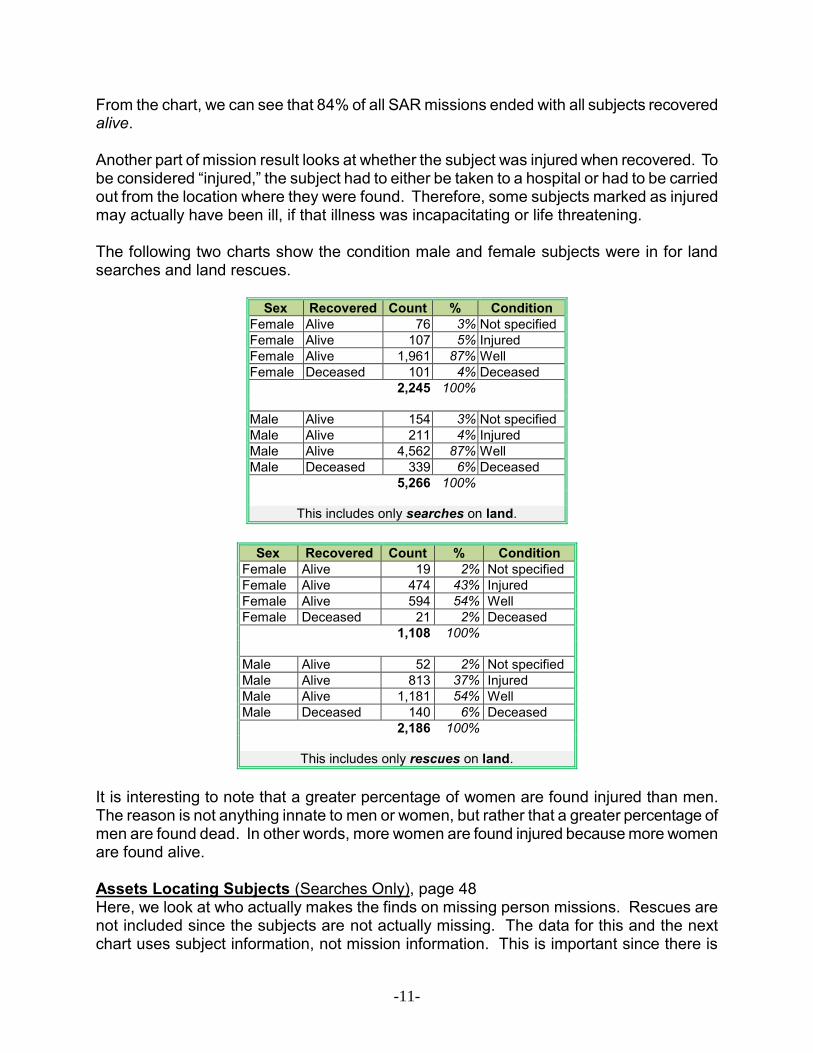
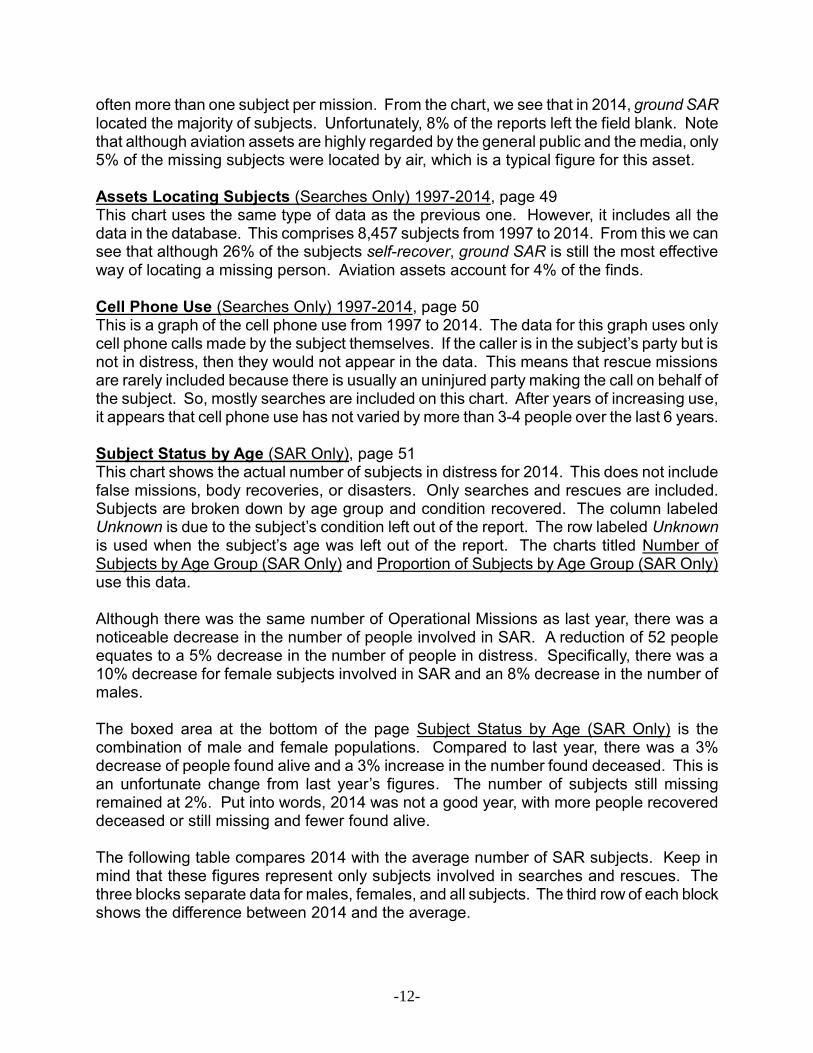
From the chart, we can see that 84% of all SAR missions ended with all subjects recovered alive. Another part of mission result looks at whether the subject was injured when recovered. To be considered “injured,” the subject had to either be taken to a hospital or had to be carried out from the location where they were found. Therefore, some subjects marked as injured may actually have been ill, if that illness was incapacitating or life threatening. The following two charts show the condition male and female subjects were in for land searches and land rescues.
Sex Recovered Count % Condition Female Alive 76 3% Not specified Female Alive 107 5% Injured Female Alive 1,961 87% Well Female Deceased 101 4% Deceased 2,245 100% Male Alive 154 3% Not specified Male Alive 211 4% Injured Male Alive 4,562 87% Well Male Deceased 339 6% Deceased 5,266 100%
This includes only searches on land.
Sex Recovered Count % Condition Female Alive 19 2% Not specified Female Alive 474 43% Injured Female Alive 594 54% Well Female Deceased 21 2% Deceased 1,108 100% Male Alive 52 2% Not specified Male Alive 813 37% Injured Male Alive 1,181 54% Well Male Deceased 140 6% Deceased
2,186 100%
This includes only rescues on land.
It is interesting to note that a greater percentage of women are found injured than men. The reason is not anything innate to men or women, but rather that a greater percentage of men are found dead. In other words, more women are found injured because more women are found alive. Assets Locating Subjects (Searches Only), page 48 Here, we look at who actually makes the finds on missing person missions. Rescues are not included since the subjects are not actually missing. The data for this and the next chart uses subject information, not mission information. This is important since there is
-12-
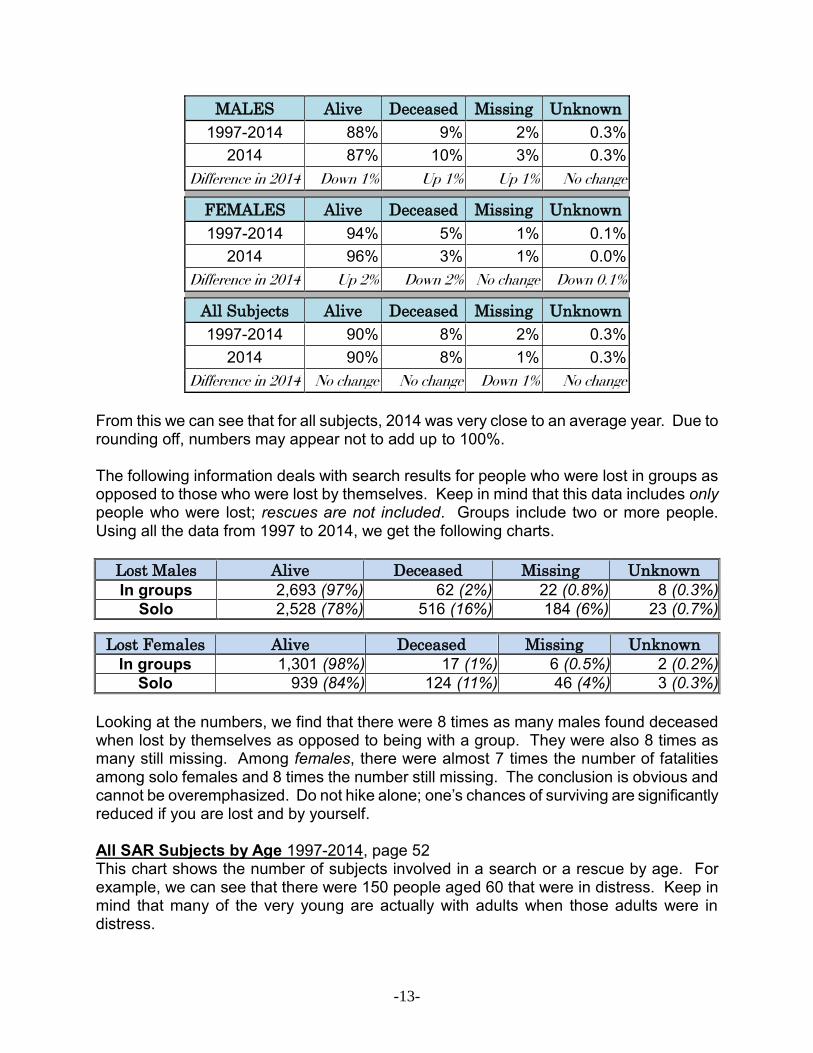
often more than one subject per mission. From the chart, we see that in 2014, ground SAR located the majority of subjects. Unfortunately, 8% of the reports left the field blank. Note that although aviation assets are highly regarded by the general public and the media, only 5% of the missing subjects were located by air, which is a typical figure for this asset. Assets Locating Subjects (Searches Only) 1997-2014, page 49 This chart uses the same type of data as the previous one. However, it includes all the data in the database. This comprises 8,457 subjects from 1997 to 2014. From this we can see that although 26% of the subjects self-recover, ground SAR is still the most effective way of locating a missing person. Aviation assets account for 4% of the finds. Cell Phone Use (Searches Only) 1997-2014, page 50 This is a graph of the cell phone use from 1997 to 2014. The data for this graph uses only cell phone calls made by the subject themselves. If the caller is in the subject’s party but is not in distress, then they would not appear in the data. This means that rescue missions are rarely included because there is usually an uninjured party making the call on behalf of the subject. So, mostly searches are included on this chart. After years of increasing use, it appears that cell phone use has not varied by more than 3-4 people over the last 6 years. Subject Status by Age (SAR Only), page 51 This chart shows the actual number of subjects in distress for 2014. This does not include false missions, body recoveries, or disasters. Only searches and rescues are included. Subjects are broken down by age group and condition recovered. The column labeled Unknown is due to the subject’s condition left out of the report. The row labeled Unknown is used when the subject’s age was left out of the report. The charts titled Number of Subjects by Age Group (SAR Only) and Proportion of Subjects by Age Group (SAR Only) use this data. Although there was the same number of Operational Missions as last year, there was a noticeable decrease in the number of people involved in SAR. A reduction of 52 people equates to a 5% decrease in the number of people in distress. Specifically, there was a 10% decrease for female subjects involved in SAR and an 8% decrease in the number of males. The boxed area at the bottom of the page Subject Status by Age (SAR Only) is the combination of male and female populations. Compared to last year, there was a 3% decrease of people found alive and a 3% increase in the number found deceased. This is an unfortunate change from last year’s figures. The number of subjects still missing remained at 2%. Put into words, 2014 was not a good year, with more people recovered deceased or still missing and fewer found alive. The following table compares 2014 with the average number of SAR subjects. Keep in mind that these figures represent only subjects involved in searches and rescues. The three blocks separate data for males, females, and all subjects. The third row of each block shows the difference between 2014 and the average.
-13-
MALES Alive Deceased Missing Unknown
1997-2014 88% 9% 2% 0.3% 2014 87% 10% 3% 0.3%
Difference in 2014 Down 1% Up 1% Up 1% No change
FEMALES Alive Deceased Missing Unknown
1997-2014 94% 5% 1% 0.1% 2014 96% 3% 1% 0.0%
Difference in 2014 Up 2% Down 2% No change Down 0.1%
All Subjects Alive Deceased Missing Unknown
1997-2014 90% 8% 2% 0.3% 2014 90% 8% 1% 0.3%
Difference in 2014 No change No change Down 1% No change
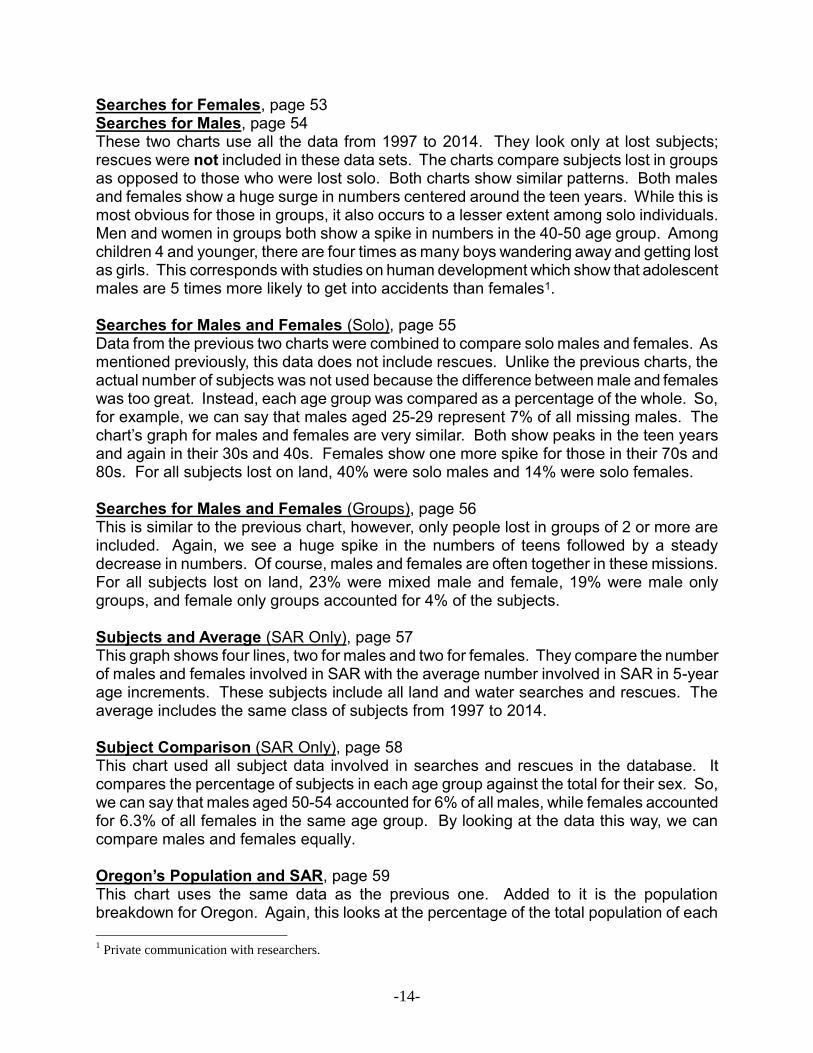
From this we can see that for all subjects, 2014 was very close to an average year. Due to rounding off, numbers may appear not to add up to 100%. The following information deals with search results for people who were lost in groups as opposed to those who were lost by themselves. Keep in mind that this data includes only people who were lost; rescues are not included. Groups include two or more people. Using all the data from 1997 to 2014, we get the following charts.
Lost Males Alive Deceased Missing Unknown
In groups 2,693 (97%) 62 (2%) 22 (0.8%) 8 (0.3%) Solo 2,528 (78%) 516 (16%) 184 (6%) 23 (0.7%)
Lost Females Alive Deceased Missing Unknown
In groups 1,301 (98%) 17 (1%) 6 (0.5%) 2 (0.2%) Solo 939 (84%) 124 (11%) 46 (4%) 3 (0.3%)
Looking at the numbers, we find that there were 8 times as many males found deceased when lost by themselves as opposed to being with a group. They were also 8 times as many still missing. Among females, there were almost 7 times the number of fatalities among solo females and 8 times the number still missing. The conclusion is obvious and cannot be overemphasized. Do not hike alone; one’s chances of surviving are significantly reduced if you are lost and by yourself. All SAR Subjects by Age 1997-2014, page 52 This chart shows the number of subjects involved in a search or a rescue by age. For example, we can see that there were 150 people aged 60 that were in distress. Keep in mind that many of the very young are actually with adults when those adults were in distress.
-14-
Searches for Females, page 53 Searches for Males, page 54 These two charts use all the data from 1997 to 2014. They look only at lost subjects; rescues were not included in these data sets. The charts compare subjects lost in groups as opposed to those who were lost solo. Both charts show similar patterns. Both males and females show a huge surge in numbers centered around the teen years. While this is most obvious for those in groups, it also occurs to a lesser extent among solo individuals. Men and women in groups both show a spike in numbers in the 40-50 age group. Among children 4 and younger, there are four times as many boys wandering away and getting lost as girls. This corresponds with studies on human development which show that adolescent males are 5 times more likely to get into accidents than females1. Searches for Males and Females (Solo), page 55 Data from the previous two charts were combined to compare solo males and females. As mentioned previously, this data does not include rescues. Unlike the previous charts, the actual number of subjects was not used because the difference between male and females was too great. Instead, each age group was compared as a percentage of the whole. So, for example, we can say that males aged 25-29 represent 7% of all missing males. The chart’s graph for males and females are very similar. Both show peaks in the teen years and again in their 30s and 40s. Females show one more spike for those in their 70s and 80s. For all subjects lost on land, 40% were solo males and 14% were solo females. Searches for Males and Females (Groups), page 56 This is similar to the previous chart, however, only people lost in groups of 2 or more are included. Again, we see a huge spike in the numbers of teens followed by a steady decrease in numbers. Of course, males and females are often together in these missions. For all subjects lost on land, 23% were mixed male and female, 19% were male only groups, and female only groups accounted for 4% of the subjects. Subjects and Average (SAR Only), page 57 This graph shows four lines, two for males and two for females. They compare the number of males and females involved in SAR with the average number involved in SAR in 5-year age increments. These subjects include all land and water searches and rescues. The average includes the same class of subjects from 1997 to 2014. Subject Comparison (SAR Only), page 58 This chart used all subject data involved in searches and rescues in the database. It compares the percentage of subjects in each age group against the total for their sex. So, we can say that males aged 50-54 accounted for 6% of all males, while females accounted for 6.3% of all females in the same age group. By looking at the data this way, we can compare males and females equally. Oregon’s Population and SAR, page 59 This chart uses the same data as the previous one. Added to it is the population breakdown for Oregon. Again, this looks at the percentage of the total population of each 1 Private communication with researchers.
-15-
group. For example, you can see from the chart that while females aged 20-24 make up 6.3% of Oregon’s population, they make up 10.7% of the female SAR subjects. Number of Subjects by Age Group (SAR Only), page 60 This bar chart graphically shows the information from Subject Status by Age (SAR Only). Keep in mind that people are counted individually, even though they may have been lost and found in groups. For example, most of the 0-9 year old children were with an adult, but the chart separates the subjects’ ages into groups. Proportion of Subjects by Age Group (SAR Only), page 61 In this instance, the data is the same as the previous chart, but combines males and females to form 100% by age group. This displays the division between the sexes by age group. The overall division remains about 30% female and 70% male. Home of Missing Subjects, page 62 This chart attempts to answer the question “Where do these people come from?” The data for this and the following chart comes from all the subjects in the database, not just from 2014. As indicated, 16% of the SAR records have no location specified. For missing subjects, the top five counties are shown. The combined out-of-state subjects account for 11% of missing people. Included are the two states with the highest figures. At the bottom of the chart is a breakdown of the subject’s origins. We can see that in-state citizens account for about 73% of the missing subjects. Home of Rescued Subjects, page 63 The top five counties are shown. The in-state and out-of-state components for all rescued subjects are very close to the numbers for missing people. No location was provided for 15% of the subjects. The inhabitants of Lane County continue to lead in the number of subjects in need of rescue. Multnomah County comes in second, 9% behind Lane County, although Lane County has less than half of Multnomah County’s population. Land Use for Rescues (Land and Water), page 64 All missions begin somewhere. This and the next chart only show the land ownership for the location where the mission started. This chart shows the land ownership for all land and water rescues in 2014. Land Use for Searches (Land and Water), page 65 This chart shows the land ownership for all missing people on land and in water for 2014. Work Hours (SAR Only), page 66 This chart plots the total work hours spent for all land and water SAR missions. On separate plots are the total work hours for paid and volunteer personnel. The chart uses the data for 9,582 missions ordered from maximum number of hours to minimum. Work hours were split into paid and volunteer hours. Missions totaling 0 hours were removed. This left 7,079 missions with volunteer hours and 8,512 missions that had paid hours. The five biggest missions were not plotted because the scale would prevent the remaining

-16-
mission data from being easily visible. From the combined missions’ information we can derive the following:
Percent of missions Work Hours 25% ≤ 7 work hrs 50% ≤ 21 work hrs 75% ≤ 63 work hrs
This means that 25% of the SAR missions accumulated 7 work hours or less total time. Fifty percent of the missions accumulated 21 work hours or less. Mission Hours (SAR Only) labeled, page 67 This chart plots the same information as the previous one. Both axis use logarithmic scales. On a logarithmic scale, all the major gridlines are multiples of ten. The average number of hours worked for all missions is marked at 88 hours. Seven of the most publicized missions are marked on the chart. The Horman mission is, to date, the biggest with 26,048 SAR hours reported, while the Boehlke mission with 3,812 SAR hours is the 14th largest. Hours to Find a Subject on Land, page 68 This graph has been plotted on logarithmic axes. Every mission has a notification time and, if the subject is found, a location time. The difference between the times generates the graph on this chart. The data looks only at missing persons on land. Missing people in water are not included due to a small sample and a very different environment. The graph includes both subjects found alive and those found deceased. The chart shows only missions that took less than 30,000 hours (3½ years) to locate the subject. This leaves 1 mission off the chart. The graph plots 4,377 missions taken from the entire database, as there is no value in looking at only one year. The y-axis values are the total number of hours it took to locate the subject. From the data we can derive:
Percent of missions Hours to find 25% ≤ 1.8 50% ≤ 3.6 75% ≤ 9.0
81.4% ≤ 12 93.1% ≤ 24
From the table above we can see that a quarter of all missing people are found in less than 2 hours and half are found in under 4 hours. Within the first operational period, 81% of all missions are completed, and within the first day, 93% of all missing persons were located. Hours to Find A Subject on Land (Alive), page 69 In this case, we look at the time it took to locate a lost person on land who was alive when found. The chart is a semi-log and all missions are included. From the chart, we can see that about 12% of the subjects are found within an hour. There are 4,090 missions included
-17-
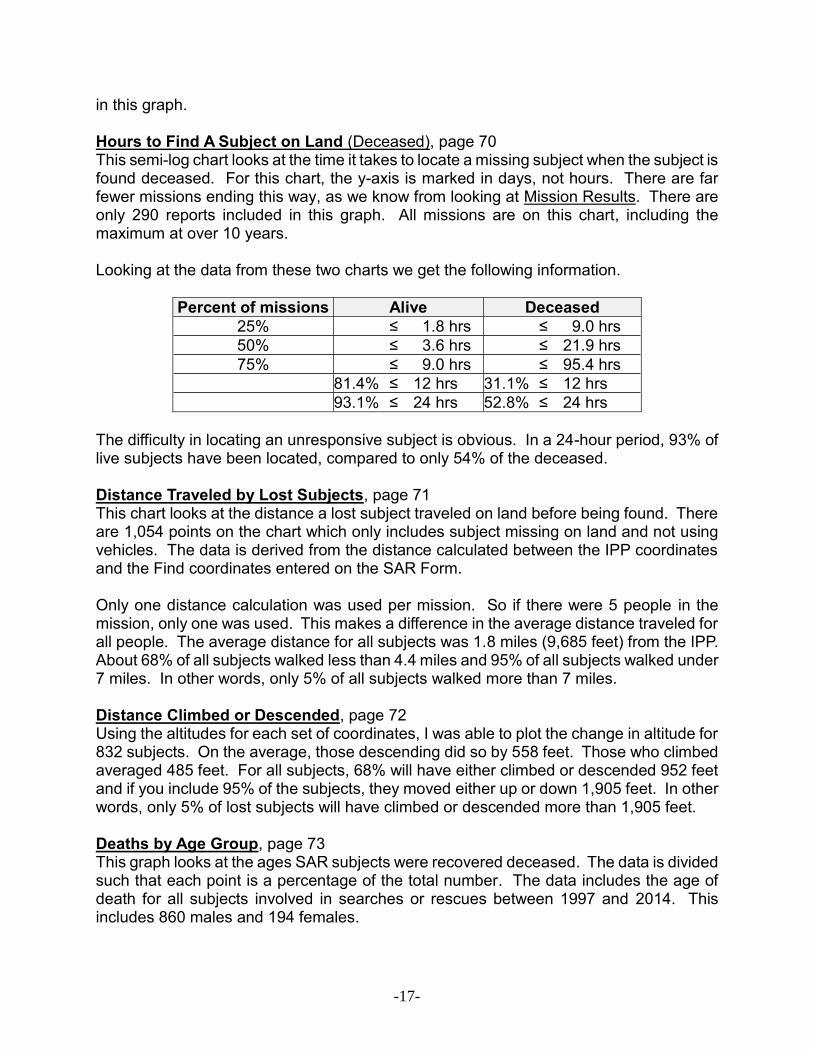
in this graph. Hours to Find A Subject on Land (Deceased), page 70 This semi-log chart looks at the time it takes to locate a missing subject when the subject is found deceased. For this chart, the y-axis is marked in days, not hours. There are far fewer missions ending this way, as we know from looking at Mission Results. There are only 290 reports included in this graph. All missions are on this chart, including the maximum at over 10 years. Looking at the data from these two charts we get the following information.
Percent of missions Alive Deceased 25% ≤ 1.8 hrs ≤ 9.0 hrs 50% ≤ 3.6 hrs ≤ 21.9 hrs 75% ≤ 9.0 hrs ≤ 95.4 hrs
81.4% ≤ 12 hrs 31.1% ≤ 12 hrs 93.1% ≤ 24 hrs 52.8% ≤ 24 hrs
The difficulty in locating an unresponsive subject is obvious. In a 24-hour period, 93% of live subjects have been located, compared to only 54% of the deceased. Distance Traveled by Lost Subjects, page 71 This chart looks at the distance a lost subject traveled on land before being found. There are 1,054 points on the chart which only includes subject missing on land and not using vehicles. The data is derived from the distance calculated between the IPP coordinates and the Find coordinates entered on the SAR Form. Only one distance calculation was used per mission. So if there were 5 people in the mission, only one was used. This makes a difference in the average distance traveled for all people. The average distance for all subjects was 1.8 miles (9,685 feet) from the IPP. About 68% of all subjects walked less than 4.4 miles and 95% of all subjects walked under 7 miles. In other words, only 5% of all subjects walked more than 7 miles. Distance Climbed or Descended, page 72 Using the altitudes for each set of coordinates, I was able to plot the change in altitude for 832 subjects. On the average, those descending did so by 558 feet. Those who climbed averaged 485 feet. For all subjects, 68% will have either climbed or descended 952 feet and if you include 95% of the subjects, they moved either up or down 1,905 feet. In other words, only 5% of lost subjects will have climbed or descended more than 1,905 feet. Deaths by Age Group, page 73 This graph looks at the ages SAR subjects were recovered deceased. The data is divided such that each point is a percentage of the total number. The data includes the age of death for all subjects involved in searches or rescues between 1997 and 2014. This includes 860 males and 194 females.
-18-
Deaths by Age 1997-2014, page 74 Instead of showing age groups, this chart show the number of subjects recovered deceased by age. For example, we can see that there were 19 subjects aged 50 when recovered. Suicide, page 75 Suicides are unusual in that it is one of the very few SAR missions in which the subject may not want to be found. There are four graphs on the chart, two for males and two for females. The bold lines show the percentage of deaths by suicide for SAR related incidents. The dotted lines are the percentages of suicides for the general population of Oregon. This data comes from publications of the Oregon Department of Human Services (ODHS), Center for Health Statistics. The SAR suicide data contains 286 males and 106 females. The suicide data from ODHS from 1997 to 2013 has 7,829 males and 2,159 females. Mission Results, page 76 This is a map all missions results broken down by those who survived and those who did not. Since County Sheriff’s Offices respond to out of state requests, some mission results lie outside Oregon’s borders. Aviation, page 77 This page summarizes all aircraft related missions for the state for 2014. The numbers are some of the lowest ever as there were so few missing aircraft. Aviation Mishaps and Injuries by Month, page 78 The data for this chart came from the National Transportation Safety Board (NTSB). These figures include only general aviation mishaps in Oregon. The 16 mishaps in 2014 involved 24 people, including 4 fatalities and 2 serious injuries. General Aviation Mishaps by Month, page 79 Data for this chart also comes from the NTSB. This chart is a graph of the mishap data in the previous chart Aviation Mishaps and Injuries by Month. Added to those statistics are the average number of mishaps for the last 10 years. Overall, 2014 had the fewest number of mishaps on record. In fact, it’s less than half the average number of mishaps for the last 10 years. Looking at the last 33 years, 2014 had the lowest number of fatalities and second lowest number of serious injuries. Number of Aviation Injuries 2005-2014, page 80 This bar chart gives a historical perspective of aviation injuries. The actual number of injuries in each of the four classifications are shown for the last 10 years along with their average. You can see from the chart that 2014 was the best year on record. Percentage of Aviation Injuries 2005-2014, page 81 This chart displays the same information as Number of Aviation Injuries. Instead of actual numbers for each type of injury, the chart displays all injuries as a percentage of the sum for the year. In this way, it is easy to see the proportion of injuries for any year. In 2014,
-19-
only 17% of the people involved in aviation mishaps were fatalities and another 8% resulted in a serious injury. From the chart, we can see that in the last 10 years, on the average, 61% of all aircraft accidents resulted in no injury, while 27% of all mishaps resulted in a death or serious injury. Annual Number of General Aviation Mishaps, page 82 This is a graph of the number of mishaps per year from 1973 to 2014. Since the mid-1980s, the overall trend has been relatively unchanged, although there appears to be a small drop in numbers in the last 5 years. Beacons, page 83 This and the next series of charts refer to missions responding to activated beacon signals. These include only emergency locator transmitters (ELT) and emergency position-indicating radio beacons (EPIRB). This page shows the sum of all efforts by all agencies involved on these missions. Annual Number of ELTs, page 84 This chart displays the total number of ELT reports each year since 1996. 2014 saw 29 beacons, only 1 more than last year. The average is now at 30 ELT signals per year, compared to an average of 125 per year before the deactivation of the NOAA satellites in 2009. ELTs by Month per County, page 85 This chart shows the number of ELTs occurring in each county by month. The county was determined by where the beacon was located or the location of the signal, if the device wasn’t found. Region refers to beacons that spanned multiple counties. Number of ELTs per Month, page 86 This chart graphs the information from the previous page. Superimposed, is the average number of ELTs from 1996 to 2008 and the average from 2009 to 2014. This shows the enormous change that took place in the number of ELT signals when NOAA deactivated the 121.5 MHz receivers on its satellites. Only April had a record low number of ELTs. ELTs From 1996-2014, page 87 The last couple of years had too few ELTs to make it worthwhile to show on a map. Instead this map shows all 1,567 ELT activations since 1996 marked by a bolt on a map of Oregon Counties. ELT Notification Times, page 88 This chart displays the notification time for all ELT incidents for the year. The y-axis shows the time of the day in 1-hour increments. The x-axis displays the months and weeks. February is not displayed because the computer divides the year into 30.4-day months. The 30th day of the year is in January and the 61st day is in March. Percentage of ELTs Occurring per Hour of the Day, page 89 By compiling the activation times for the last 18 years, it was possible to graph the
-20-
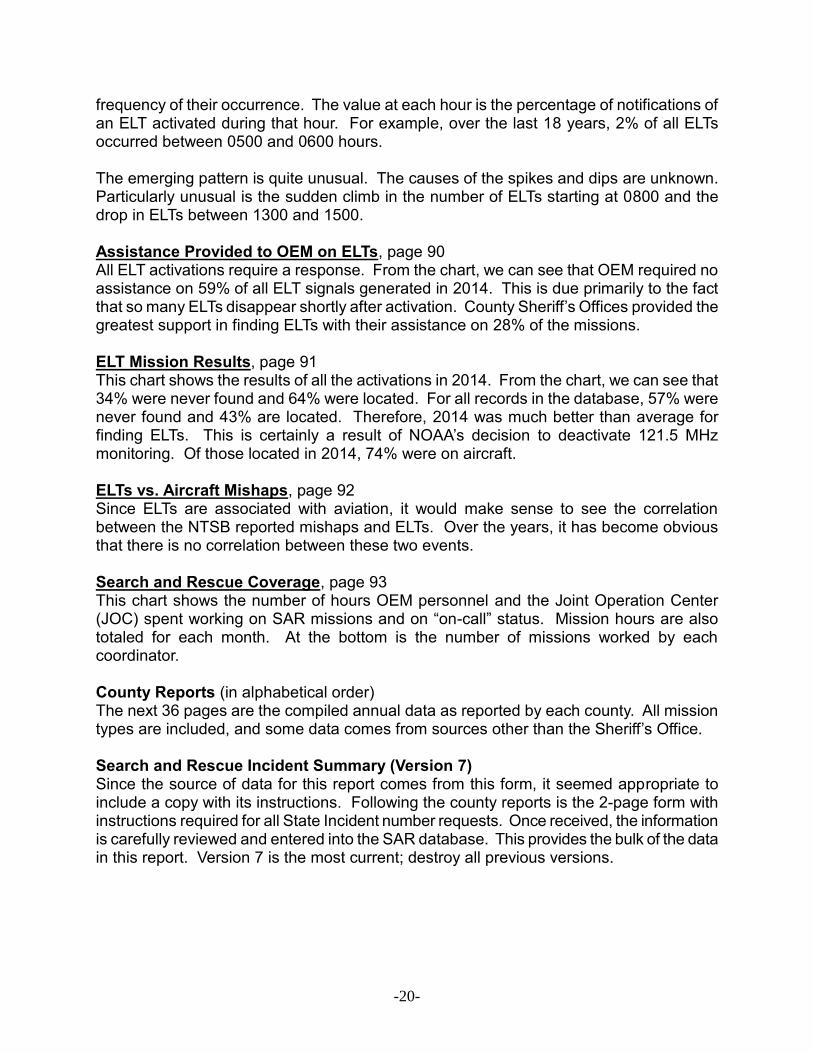
frequency of their occurrence. The value at each hour is the percentage of notifications of an ELT activated during that hour. For example, over the last 18 years, 2% of all ELTs occurred between 0500 and 0600 hours. The emerging pattern is quite unusual. The causes of the spikes and dips are unknown. Particularly unusual is the sudden climb in the number of ELTs starting at 0800 and the drop in ELTs between 1300 and 1500. Assistance Provided to OEM on ELTs, page 90 All ELT activations require a response. From the chart, we can see that OEM required no assistance on 59% of all ELT signals generated in 2014. This is due primarily to the fact that so many ELTs disappear shortly after activation. County Sheriff’s Offices provided the greatest support in finding ELTs with their assistance on 28% of the missions. ELT Mission Results, page 91 This chart shows the results of all the activations in 2014. From the chart, we can see that 34% were never found and 64% were located. For all records in the database, 57% were never found and 43% are located. Therefore, 2014 was much better than average for finding ELTs. This is certainly a result of NOAA’s decision to deactivate 121.5 MHz monitoring. Of those located in 2014, 74% were on aircraft. ELTs vs. Aircraft Mishaps, page 92 Since ELTs are associated with aviation, it would make sense to see the correlation between the NTSB reported mishaps and ELTs. Over the years, it has become obvious that there is no correlation between these two events. Search and Rescue Coverage, page 93 This chart shows the number of hours OEM personnel and the Joint Operation Center (JOC) spent working on SAR missions and on “on-call” status. Mission hours are also totaled for each month. At the bottom is the number of missions worked by each coordinator. County Reports (in alphabetical order) The next 36 pages are the compiled annual data as reported by each county. All mission types are included, and some data comes from sources other than the Sheriff’s Office. Search and Rescue Incident Summary (Version 7) Since the source of data for this report comes from this form, it seemed appropriate to include a copy with its instructions. Following the county reports is the 2-page form with instructions required for all State Incident number requests. Once received, the information is carefully reviewed and entered into the SAR database. This provides the bulk of the data in this report. Version 7 is the most current; destroy all previous versions.
Transportation and Work Hours for 2014
Paid Hours Volunteer Hours Transportation
CAP hrs
BLM 48 hrs
Explorers hrs
Jeep club 126 hrs
Fire service 1,104 hrs
Ski patrol 33 hrs
Horse Team 23 hrs
Dog team 11 hrs
Federal agency 271 hrs
Law enforcement 9,728 hrs
Mt Rescue 90 hrs
Forest Service 640 hrs
Divers 874 hrs
State agency 351 hrs
Other 290 hrs
571 hrs
hrs
8,271 hrs
2,231 hrs
548 hrs
1,483 hrs
6 hrs
13,141 hrs
106 hrs
194 hrs
4 hrs
6,934 hrs
2,917 hrs
1 hrs
3,993 hrs
10,854 hrs
Helicopter 67 hrs
Military helicopter 177 hrs
Plane 113 hrs
Military plane hrs
Snowmobile 150 hrs
Snow-cat 49 hrs
ATV 706 hrs
Motorcycle 6 hrs
4-Wheel drive 1,977 hrs
Specialized vehicles 552 hrs
2-wheel drive 559 hrs
Boat 367 hrs
Other 58 hrs
CAP
BLM
Explorers
Jeep club
Fire service
Ski patrol
Horse Team
Dog team
Federal agency
Law enforcement
Mt Rescue
Forest Service
Divers
State agency
Other
Amateur radio
25 miles
miles
40 miles
miles
559 miles
80 miles
320 miles
miles
189,208 miles
7,090 miles
33,954 miles
13 miles
102,712 miles
Unbudgeted costs
Food $9,701 Fuel $9,524 Lodging $367 Other $49,736
Total Paid
19,506
Total Volunteer
131,031
Total Transportation
4,778
Hours Miles
334,000
Number of Reports in Database for 2014: 1,029
SAR team 5,920 hrs SAR team 79,779 hrs
Total Number of Incidents for 2014: 1,044
Number of Missing Reports for 2014: 112
(including partial entries)
HoursHours
Total Number of Assists for 2014: 91
21
2014 Missions per County 2014
Jan Feb Mar Apr May Jun Jul Aug Sep Oct Nov Dec Total
Baker 1 3 1 1 2 4 3 3 4 1 2 1 26
Benton 1 3 3 1 3 11 8 9 3 2 1 3 48
Clackamas 3 3 6 5 6 8 15 11 1 10 6 3 77
Clatsop 2 1 1 2 4 1 1 2 1 2 2 1 20
Columbia 2 1 1 2 2 2 10
Coos 1 1 3 1 2 3 3 2 2 18
Crook 1 2 2 2 1 2 1 1 2 3 2 19
Curry 3 5 1 2 2 3 1 3 2 2 2 2 28
Deschutes 15 13 13 7 10 11 14 7 13 7 6 4 120
Douglas 7 3 6 3 3 2 4 12 9 13 3 3 68
Gilliam 1 1 2
Grant 2 1 2 1 2 1 9
Harney 0
Hood River 3 8 7 8 10 3 9 7 3 3 2 2 65
Jackson 9 4 6 7 8 7 11 12 7 15 7 4 97
Jefferson 3 1 1 1 1 1 1 9
Josephine 1 2 1 3 7
Klamath 1 1 1 2 5 3 1 2 1 17
Lake 4 5 3 1 2 2 1 1 19
Lane 6 3 8 5 5 15 15 10 9 9 7 6 98
Lincoln 1 2 1 2 1 7
Linn 2 1 2 1 3 1 2 1 1 14
Malheur 1 3 1 1 1 7
Marion 1 5 1 1 1 4 6 4 4 2 3 1 33
Morrow 2 2
Multnomah 5 9 7 3 10 5 11 4 1 6 4 5 70
Polk 1 1 1 1 4
REGION 1 1 1 1 1 1 6
Sherman 1 1
Tillamook 2 1 3 6 2 4 10 5 3 4 40
Umatilla 2 1 2 2 1 1 3 1 1 1 2 2 19
Union 2 2 2 2 3 1 3 3 1 3 3 1 26
Wallowa 2 2 2 1 3 2 1 2 1 2 18
Wasco 1 2 2 1 1 2 2 11
Washington 1 1 2 1 2 1 1 2 11
Wheeler 1 1 2 1 1 6
Yamhill 1 1 1 2 2 1 1 1 1 1 12
71 76 92 71 85 101 136 110 74 99 76 53 1,044
% of total 7% 7% 9% 7% 8% 10% 13% 11% 7% 9% 7% 5% 100%
-22-
2014 Missions per Month 2014
-23-
0
5
10
15
20
25
30
35
40
45
50
55
60
65
70
75
80
85
90
95
100
105
110
115
120
125
130
135
140
Jan Feb Mar Apr May Jun Jul Aug Sep Oct Nov Dec
Average Number of Missions
Missions for 2014
1997-2014 Missions per Year 1997-2014
-24-
856 875
816
859
960 991
922
847
988 993 1,006
1,127
1,085 1,065 1,069 1,085
1,044 1,044
767
714 751
807 834
794
715
806 831 832
949
906 875
858 893
856 849
0
100
200
300
400
500
600
700
800
900
1,000
1,100
1,200
1997 1998 1999 2000 2001 2002 2003 2004 2005 2006 2007 2008 2009 2010 2011 2012 2013 2014
Number of Missions
Operational Missions
Average
Transportation and Work Hours for 2014
Training OnlyPaid Hours Volunteer Hours Transportation
CAP hrs
BLM hrs
Explorers hrs
Jeep club hrs
Fire service hrs
Ski patrol hrs
Horse Team hrs
Dog team hrs
Federal agency hrs
Law enforcement 397 hrs
Mt Rescue 90 hrs
Forest Service 6 hrs
Divers 665 hrs
State agency hrs
Other hrs
154 hrs
hrs
6,132 hrs
987 hrs
3 hrs
1,231 hrs
hrs
9,128 hrs
hrs
9 hrs
hrs
4,615 hrs
2,659 hrs
hrs
2,346 hrs
8,605 hrs
Helicopter 1 hrs
Military helicopter hrs
Plane hrs
Military plane hrs
Snowmobile 23 hrs
Snow-cat hrs
ATV 321 hrs
Motorcycle hrs
4-Wheel drive 38 hrs
Specialized vehicles 61 hrs
2-wheel drive 8 hrs
Boat 20 hrs
Other 10 hrs
CAP
BLM
Explorers
Jeep club
Fire service
Ski patrol
Horse Team
Dog team
Federal agency
Law enforcement
Mt Rescue
Forest Service
Divers
State agency
Other
Amateur radio
miles
miles
miles
miles
miles
miles
2 miles
miles
44,415 miles
791 miles
23,060 miles
miles
61,307 miles
Reported expenses
Food $1,384 Fuel $795 Lodging $ Other $
Total Paid
2,469
Total Volunteer
86,418
Total Transportation
481
Hours Miles
129,574
SAR team 1,311 hrs SAR team 50,550 hrs
HoursHours
25

2014 Operational Missions by County 2014
Jan Feb Mar Apr May Jun Jul Aug Sep Oct Nov Dec Sum
Baker 2 1 3 1 1 2 1 11
Benton 2 2 2 10 7 8 2 1 2 36
Clackamas 2 2 5 4 6 8 14 9 1 9 5 2 67
Clatsop 1 2 2 1 1 7
Columbia 2 1 1 1 2 2 2 11
Coos 1 1 1 3 1 2 3 3 2 1 18
Crook 1 1 1 1 2 1 7
Curry 2 4 1 3 1 2 2 1 2 2 20
Deschutes 14 10 12 6 8 8 12 5 12 6 5 2 100
Douglas 5 2 5 2 2 4 11 8 12 2 2 55
Gilliam 1 2 1 4
Grant 2 1 2 1 1 7
Harney 0
Hood river 2 6 6 7 9 2 8 6 3 3 2 2 56
Jackson 7 2 4 5 6 5 8 10 5 13 5 3 73
Jefferson 3 1 1 1 1 1 1 9
Josephine 1 2 1 3 7
Klamath 1 1 1 2 5 3 1 2 1 17
Lake 4 5 3 1 2 2 1 18
Lane 5 2 7 4 4 14 14 9 8 8 6 5 86
Lincoln 1 2 2 1 6
Linn 2 1 2 1 3 1 2 1 1 14
Malheur 3 1 1 5
Marion 4 3 5 3 3 1 2 21
Morrow 2 2
Multnomah 5 8 7 2 9 5 11 4 1 5 3 5 65
Polk 1 1 1 1 4
Region 1 1 1 1 1 1 6
Sherman 1 1
Tillamook 1 2 5 1 3 9 5 3 3 32
Umatilla 2 1 2 2 1 1 3 1 1 1 2 1 18
Union 1 1 1 1 2 1 2 2 2 13
Wallowa 2 2 2 1 3 2 1 2 1 2 18
Wasco 1 2 2 1 1 2 2 11
Washington 1 1 1 1 2 1 1 2 10
Wheeler 1 1 2
Yamhill 1 1 1 2 2 1 1 1 1 1 12
Total 54 56 75 56 67 84 119 92 62 84 63 37 849
% of year 6% 7% 9% 7% 8% 10% 14% 11% 7% 10% 7% 4% 100%
-26-
Transportation and Work Hours for 2014
No Training or Civic MissionsPaid Hours Volunteer Hours Transportation
CAP hrs
BLM 48 hrs
Explorers hrs
Jeep club 126 hrs
Fire service 1,104 hrs
Ski patrol 33 hrs
Horse Team 23 hrs
Dog team 11 hrs
Federal agency 271 hrs
Law enforcement 9,230 hrs
Mt Rescue hrs
Forest Service 622 hrs
Divers 209 hrs
State agency 351 hrs
Other 290 hrs
417 hrs
hrs
1,633 hrs
1,194 hrs
545 hrs
252 hrs
6 hrs
3,663 hrs
106 hrs
168 hrs
4 hrs
2,117 hrs
218 hrs
1 hrs
1,558 hrs
2,249 hrs
Helicopter 66 hrs
Military helicopter 177 hrs
Plane 113 hrs
Military plane hrs
Snowmobile 113 hrs
Snow-cat 34 hrs
ATV 246 hrs
Motorcycle 6 hrs
4-Wheel drive 1,898 hrs
Specialized vehicles 141 hrs
2-wheel drive 551 hrs
Boat 347 hrs
Other 48 hrs
CAP
BLM
Explorers
Jeep club
Fire service
Ski patrol
Horse Team
Dog team
Federal agency
Law enforcement
Mt Rescue
Forest Service
Divers
State agency
Other
Amateur radio
25 miles
miles
40 miles
miles
559 miles
80 miles
233 miles
miles
136,224 miles
5,199 miles
9,390 miles
13 miles
28,186 miles
Unbudgeted costs
Food $9,701 Fuel $9,524 Lodging $367 Other $49,736
Total Paid
16,877
Total Volunteer
40,546
Total Transportation
3,738
Hours Miles
179,949
Number of Reports in Database for 2014: 845
SAR team 4,561 hrs SAR team 26,417 hrs
HoursHours
27
!P
!P
!P
!P
!P
!P!P
!P
!P
!P
!P
!P
!P
!P
!P
!P
!P!P!P!P!P
!P!P
#*
!P
!P
!P
!P !P
!P
!P
!P
!P!P!P!P!P!P
!P
!P
!P
!P
!P
!P
!P!P
!P
#*
#*
!P!P
!P
#*
#*!P
!P
!P
!P!P!P!P
!P
!P
!P
!P
!P!P
!P
!P
!P
!P
!P
!P#*
!P
!P
!P
!P!P
!P!P
!P!P
!P
!P
!P
!P
!P !P
#*
!P
!P
!P
!P
!P
#*
!P!P!P!P
!P
!P
!P
!P
!P
!P!P
!P
!P
!P!P
!P
!P
!P
!P!P
!P!P
#*
!P
!P
!P!P!P
!P!P
!P
!P
!P!P
!P
!P!P
!P
!P
#*
!P!P
#*
!P
!P
!P
!P
!P
#*
!P
!P
!P
!P
!P
!P
!P
!P
!P
!P
!P
!P!P!P!P
!P
!P
!P
!P
!P
!P
!P!P!P!P!P!P
!P
!P!P
!P
!P
!P
!P
!P
!P
!P!P
!P
!P
#*#*
!P
!P
!P
!P
!P
!P!P!P
#*
!P!P
!P
!P
!P
!P!P
!P
!P
!P!P!P!P
!P
!P
!P
!P
!P
!P
!P!P
!P!P
!P!P
!P
!P!P
!P!P
!P!P
#* !P
!P
!P
!P
!P
!P
#*
#*
!P
!P
!P!P
#*#*#*#*
!P!P
!P
!P!P
!P!P
!P!P
!P!P!P
!P!P
#*
!P
!P
!P
!P
!P
#*!P
!P!P
!P
!P
!P
!P!P!P
#*
!P
!P!P
!P
!P
!P
!P!P
!P
#*#*#*
!P
!P!P
!P!P
!P
!P
!P
!P
!P!P
!P!P !P
!P
!P
!P
!P
!P
!P
!P!P
!P!P
!P!P
!P
!P
!P
!P
!P
!P
!P
!P
!P
!P
!P!P
!P!P
!P
!P!P
!P
!P!P
!P
!P
!P!P
!P
!P
!P!P
!P
!P
!P
!P
!P
!P
!P
!P
!P
!P
!P
!P!P
!P!P
#*
!P
!P
!P
!P
!P!P
!P
!P!P
!P
!P!P!P
!P
!P
!P!P!P!P
!P!P
!P!P
!P
!P
!P
!P
!P!P
!P
!P!P
!P
!P
!P!P!P
!P
!P!P!P
!P
!P!P
!P!P!P!P
!P
!P
#*
!P!P
!P!P#*
!P!P
!P
!P
!P
!P
!P!P!P!P
!P
!P
!P
SEARCHES 2014
#* Water
!P Land
0 50 10025
Miles
Date: 2/19/2015Created by georges kleinbaum
-28-
-
GF
GF
GF
GFGFGFGFGFGF
GF
GFGFGFGF
GFGFGF
GFGF
GFGF
GF
GF
GF
GF
GFGFGFGF
GFGF
GF
GF
GF
GFGFGFGFGFGF
GFGF
GF
GF
GF
GF
GF
GF
GF
GFGFGF
GFGF
GF
GF
GFGF
GF
GF
GFGF
GFGFGFGF
GF
GFGFGF
GF
GF
GF
GFGF
GF
GF
GFGF
GF
GF
GF
GF
GFGF
GF
GF
GF
GFGFGF
GFGF
GF
GFGF
GF
GF
GF
GF
GF
GFGF
GF
GFGF
GF
GFGFGF
GF
GF
GF
GFGFGF
GF
GF
GF
GF
GFGFGF
GFGF
GFGF
GF
GF
GF
GFGFGF GFGFGF
GFGF
GFGFGFGFGFGFGFGFGFGFGF
GF
GF
GFGFGF
GFGFGFGF
GF
GF
GF
GF
GFGF
GF
GF
GF
GF
GFGFGFGFGFGFGFGFGFGFGFGFGFGF
GF
GFGF
GFGF
GFGFGF
GF
GF
GF
GFGF
GFGFGF GF
GF
GFGFGFGF
GFGFGF
GF
GF
GF
GF
GF
GFGFGF
GFGF
GFGF
GF
GFGF
GF
GFGFGF
GFGFGF
GFGF
GFGF
GFGFGFGF
GFGF
GF
GF
GF
GF
GF
GFGFGFGFGFGF
GFGFGFGFGFGFGFGFGF
GFGF
GFGFGFGFGFGF
GFGF
GF
GF GF
GF
GFGFGF GFGF
GFGF
GF
GF
GF
GFGF
GF
GFGF
GF
GFGFGF
GFGF
GFGFGF
GFGF
GF
GF
GF
GF
GFGF
GF
GF
GFGFGF
GFGFGFGFGFGFGFGF
GFGF
GF
GF
GFGF
GF
GFGF
GFGFGF
GFGFGFGF
GF
GFGFGFGFGFGF
GFGF
GFGFGF
GF
GFGF
GF
GF
GF
GFGF
GF
GFGF
GF
RESCUES 2014
GF Water
GF Land
0 50 10025
Miles
Date: 2/19/2015Created by georges kleinbaum
-29-
-
!(!(
!(
!(!(
!(!(!(
!(
!(!(
!(
!(!(
!(
!(
!(!(
!(!(
!(
!(
!(
!(!(
!(!(!(
!(
!(
!(!(
!(!(
!(
!(!(
!(
!(
!(!(
!(!(
!(
!(
!(!(
!(
!(
!(!(!(!(!(
!(!(
!(
!(
!(
!(
!(
!(
!(
!(
!(!(!(
!(!(
!(
!(!(
!(!(!(
!(
!(
!(
!(
!(
!(
!(
!( !(!(
!(
!(!(!(!(
!(
!(
!(!(!(!(!(!(!(
!(
!(
!(
!(
!(!(
!(
!(
!(
!(!(
!(
!(
!(
!(!(
!(
!(
!(
!(!(!(!(
!(
!(!(
!(
!(!(
!(
!(
!(!(!(!(
!(
!(
!(
!(
!(
!(
!(
!(
!(
!(
!(
!(
!(
!(!(
!(
!(
!(
!(
!(
!(
!(
!(
!(
!(
!(
!(
!(
!(
!(
!(
!(
!(
!(
!(
!(
!(!(
!( !(
!(
!(
G
GG
G
G
G
G
G
G
G
G
G
G
G
Mission ResultsDate: 2/19/2015Created by georges kleinbaum
Recovered!( Injured!( UninjuredG Deceased
(Mt Hood region 2010-2014)
0 3 6 9 12 15
Miles
-30-
-
XW XWXWXWXW
XW
XW
XWXW
XW
XW
XW
XWXW
XW
XWXW
XWXW
XWXWXW
XWXWXW
XW
XW
XW
XW
XWXWXWXW
XWXW
XWXWXWXWXWXWXWXWXWXWXWXWXW
XWXWXW
XWXW
XW
XWXWXW
XWXWXW
XWXW
XWXWXWXW
XWXWXWXW
XWXW
XW
XW
XWXWXWXW
XWXW
XW
XWXW
XWXWXW
XW
XWXWXWXW
XW
XWXWXWXWXWXWXW
XWXWXW
XW
XWXWXWXWXW
XWXW
XWXW
XWXWXWXW
XWXWXW
XWXWXWXWXW
XWXWXWXW
XWXW
XWXW
XW
XWXW
XW
XWXW
XWXW
XW XWXWXWXWXWXW
XW
XWXWXW
XWXW
XWXW
XWXW
XW
XW
XWXW
XWXWXWXWXWXWXW
XWXWXWXWXW
XWXWXW
XWXWXW
XWXWXW
XWXW
XWXWXWXWXW
XWXWXWXW
XWXWXWXW
XWXW
XWXWXW
XW
XW
XWXW
XWXWXW
XWXW
XW
XWXWXW
XWXWXWXWXWXWXWXWXW
XWXW
XW
XWXWXW
XWXWXWXWXWXW
XWXWXW
XWXW
XWXW
XWXW
XWXWXWXWXWXW
XWXW
XW
XW
XW
XW
XW
Water Missions
0 1 2 3 4 5 6 7 8 9 10 11 12 13 14 15
Miles
Date: 2/19/2015Created by georges kleinbaum
RecoveredXW Deceased
XW Alive
Eugene - Springfield-31-
-2010-2014
2014 Missions by Type and by County 2014
Mult Aviation Beacon M/P (L) M/P (W) Evid (L) Evid (W) Resc (L) Resc (W) Training Other (W) False Body (W) Body (L) E/M Civic Other TOTAL
Baker 6 5 12 3 26
Benton 10 2 3 1 14 11 1 1 2 45
Clackamas 1 1 26 5 24 5 8 5 1 76
Clatsop 2 1 3 1 2 1 1 1 12 1 25
Columbia 1 1 2 1 5
Coos 1 1
Crook 5 2 11 1 19
Curry 7 2 2 5 7 1 1 2 27
Deschutes 6 40 1 3 40 2 12 1 1 1 4 7 1 119
Douglas 1 28 2 5 1 6 5 11 6 1 3 1 1 71
Gilliam 1 1 2
Grant 1 4 5
Hood River 1 24 21 7 9 3 65
Jackson 1 5 44 2 2 8 1 12 1 5 1 3 11 7 103
Jefferson 8 1 9
Josephine 1 1
Klamath 2 6 2 1 3 1 1 1 2 19
Lake 5 5
Lane 1 2 26 1 9 1 13 29 12 1 2 1 98
Lincoln 4 2 1 7
Linn 6 1 5 1 1 14
Malheur 1 3 1 1 6
Marion 1 9 3 3 1 12 2 2 33
Morrow 1 1 2
Multnomah 1 2 28 7 2 6 10 6 1 3 2 1 69
Polk 4 4
Region 2 1 1 1 5
Tillamook 17 1 4 5 1 7 1 1 37
Umatilla 9 1 5 1 2 1 19
Union 1 4 5 12 1 1 1 25
Wallowa 7 1 1 9
Wasco 6 3 9
Washington 9 1 1 11
Wheeler 1 1 4 6
Yamhill 2 9 1 12
0
0
TOTAL 5 3 29 364 33 37 4 162 83 159 5 35 2 7 19 26 16 989
% of Total 0.5% 0.3% 3% 37% 3% 4% 0% 16% 8% 16% 0.5% 4% 0% 1% 1.9% 3% 2% 100%
-32-

1997-2014 Missions by Type and by County
(Without Training and Civic Missions) 1997-2014
Mult Aviation Beacon M/P (L) M/P (W) Evid (L) Evid (W) Resc (L) Resc (W) Other (W) False Body (W) Body (L) E/M Other TOTAL
Baker 1 5 18 84 6 4 1 40 7 2 12 2 1 1 184
Benton 2 2 44 103 6 25 6 27 16 1 5 30 267
Clackamas 3 18 98 555 52 33 2 319 151 6 116 7 9 8 1,377
Clatsop 2 3 40 95 14 13 22 54 5 15 9 3 3 5 23 306
Columbia 1 4 36 63 8 12 7 4 12 1 148
Coos 1 5 39 94 2 2 26 11 6 1 4 191
Crook 4 24 95 1 2 22 10 1 4 3 166
Curry 5 15 124 14 6 1 56 27 3 14 3 2 1 4 275
Deschutes 4 15 97 509 29 40 4 532 28 5 27 5 12 58 26 1,391
Douglas 6 12 52 299 31 44 14 126 55 9 45 3 8 4 18 726
Gilliam 2 13 4 1 20
Grant 3 15 60 15 7 1 101
Harney 6 33 49 1 1 10 1 101
Hood River 3 20 109 3 1 129 15 8 1 3 292
Jackson 6 9 76 551 20 79 10 127 37 29 56 5 13 43 86 1,147
Jefferson 2 1 21 103 8 5 1 66 6 9 2 1 5 3 233
Josephine 1 7 30 92 10 16 7 52 6 2 12 2 18 81 336
Klamath 7 15 43 223 24 19 14 52 35 11 21 3 4 5 3 479
Lake 1 4 26 97 1 5 12 5 4 16 171
Lane 16 9 103 450 61 64 23 140 394 55 36 20 11 2 8 1,392
Lincoln 2 2 45 70 12 16 2 14 4 2 4 1 2 2 178
Linn 3 9 35 148 11 2 76 13 12 1 1 2 1 314
Malheur 1 17 54 90 16 1 17 9 21 2 228
Marion 3 89 98 11 18 26 9 2 11 1 1 4 4 277
Morrow 2 14 40 8 21 10 3 5 103
Multnomah 5 1 157 266 87 64 20 128 132 16 32 37 9 1 10 965
Polk 2 1 45 46 5 4 6 1 2 1 113
Region 75 82 13 2 2 4 1 53 232
Sherman 11 1 2 2 2 18
Tillamook 4 2 22 378 31 11 1 112 41 2 65 1 1 5 676
Umatilla 1 7 44 62 3 9 0 37 2 6 1 2 1 175
Union 1 16 158 3 9 52 1 15 8 2 265
Wallowa 2 4 23 101 8 1 64 6 12 5 3 229
Warm Springs 1 0 0 5 2 8
Wasco 1 2 15 138 24 7 1 44 37 3 19 3 2 3 6 305
Washington 4 136 107 25 7 2 4 2 5 292
Wheeler 2 9 15 2 1 1 1 1 1 33
Yamhill 1 5 34 77 2 12 1 12 2 4 1 1 1 153
TOTAL 76 269 1,674 5,572 520 552 124 2,412 1,080 165 639 97 90 183 414 13,867
% of Total 0.5% 1.9% 12.1% 40.2% 3.7% 4.0% 0.9% 17.4% 7.8% 1.2% 4.6% 0.7% 0.6% 1.3% 3.0% 100%
-33-
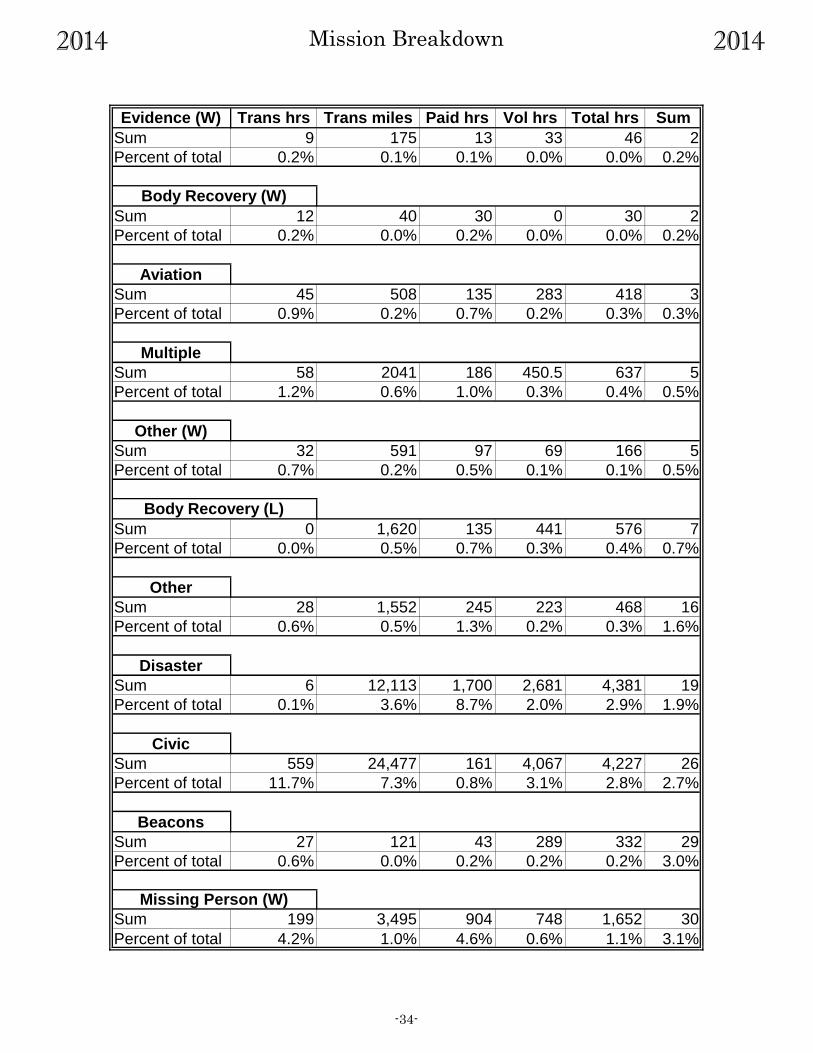
2014 Mission Breakdown 2014
Evidence (W) Trans hrs Trans miles Paid hrs Vol hrs Total hrs Sum
Sum 9 175 13 33 46 2
Percent of total 0.2% 0.1% 0.1% 0.0% 0.0% 0.2%
Sum 12 40 30 0 30 2
Percent of total 0.2% 0.0% 0.2% 0.0% 0.0% 0.2%
Aviation
Sum 45 508 135 283 418 3
Percent of total 0.9% 0.2% 0.7% 0.2% 0.3% 0.3%
Multiple
Sum 58 2041 186 450.5 637 5
Percent of total 1.2% 0.6% 1.0% 0.3% 0.4% 0.5%
Other (W)
Sum 32 591 97 69 166 5
Percent of total 0.7% 0.2% 0.5% 0.1% 0.1% 0.5%
Sum 0 1,620 135 441 576 7
Percent of total 0.0% 0.5% 0.7% 0.3% 0.4% 0.7%
Other
Sum 28 1,552 245 223 468 16
Percent of total 0.6% 0.5% 1.3% 0.2% 0.3% 1.6%
Disaster
Sum 6 12,113 1,700 2,681 4,381 19
Percent of total 0.1% 3.6% 8.7% 2.0% 2.9% 1.9%
Civic
Sum 559 24,477 161 4,067 4,227 26
Percent of total 11.7% 7.3% 0.8% 3.1% 2.8% 2.7%
Beacons
Sum 27 121 43 289 332 29
Percent of total 0.6% 0.0% 0.2% 0.2% 0.2% 3.0%
Sum 199 3,495 904 748 1,652 30
Percent of total 4.2% 1.0% 4.6% 0.6% 1.1% 3.1%
Body Recovery (W)
Missing Person (W)
Body Recovery (L)
-34-
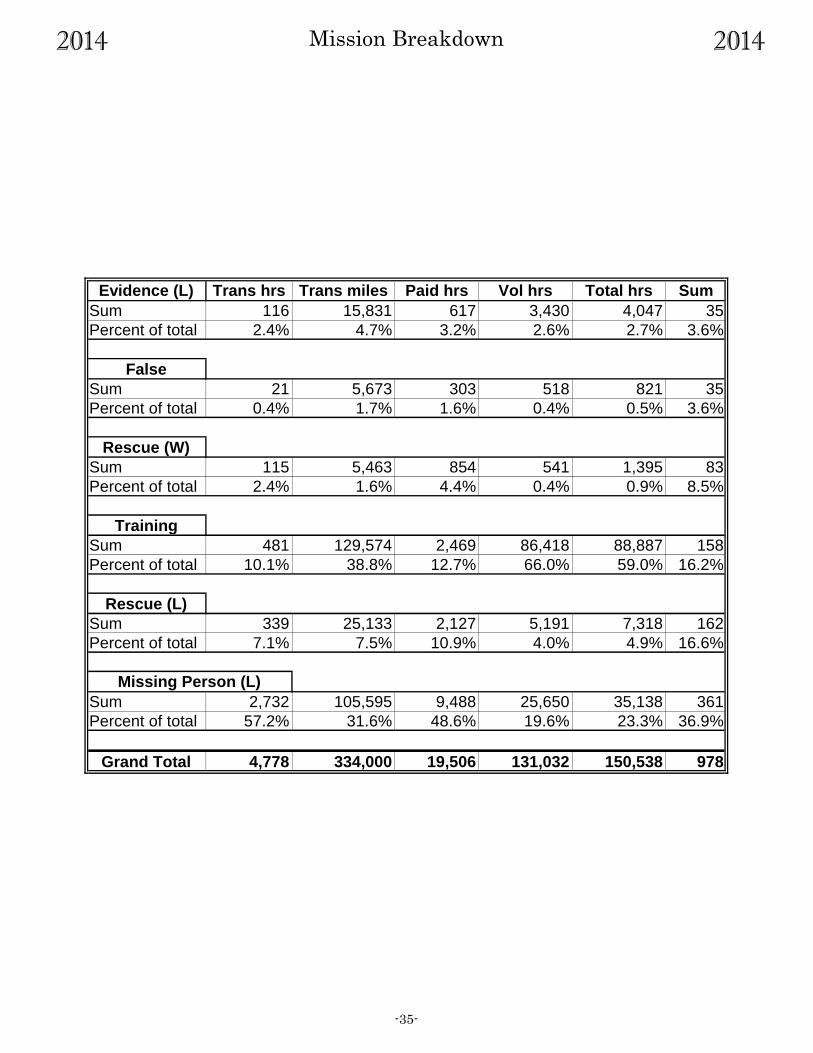
2014 Mission Breakdown 2014
Evidence (L) Trans hrs Trans miles Paid hrs Vol hrs Total hrs Sum
Sum 116 15,831 617 3,430 4,047 35
Percent of total 2.4% 4.7% 3.2% 2.6% 2.7% 3.6%
False
Sum 21 5,673 303 518 821 35
Percent of total 0.4% 1.7% 1.6% 0.4% 0.5% 3.6%
Rescue (W)
Sum 115 5,463 854 541 1,395 83
Percent of total 2.4% 1.6% 4.4% 0.4% 0.9% 8.5%
Training
Sum 481 129,574 2,469 86,418 88,887 158
Percent of total 10.1% 38.8% 12.7% 66.0% 59.0% 16.2%
Rescue (L)
Sum 339 25,133 2,127 5,191 7,318 162
Percent of total 7.1% 7.5% 10.9% 4.0% 4.9% 16.6%
Sum 2,732 105,595 9,488 25,650 35,138 361
Percent of total 57.2% 31.6% 48.6% 19.6% 23.3% 36.9%
Grand Total 4,778 334,000 19,506 131,032 150,538 978
Missing Person (L)
-35-

2014 Chart of Mission Breakdown 2014
-36-
0%
5%
10%
15%
20%
25%
30%
35%
40%
45%
50%
55%
60%
1 2 3 4 5 6 7 8 9 10 11 12 13 14 15 16 17
Percentage of all Missions
Percentage of Total Work Hours
6 - Evidence (W)
1 - Multiple
5 - Other (W)
10 - Missing Person (W)
4 - Disaster
7 - Body Recovery (W)
2 - Aviation
8 - Other
12 - Evidence (L)
3 - Body Recovery (L)
14 - Rescue (W)
9 - Beacons
11 - Civic
13 - False
16 - Rescue (L)
15 - Training
17 - Missing Person (L)
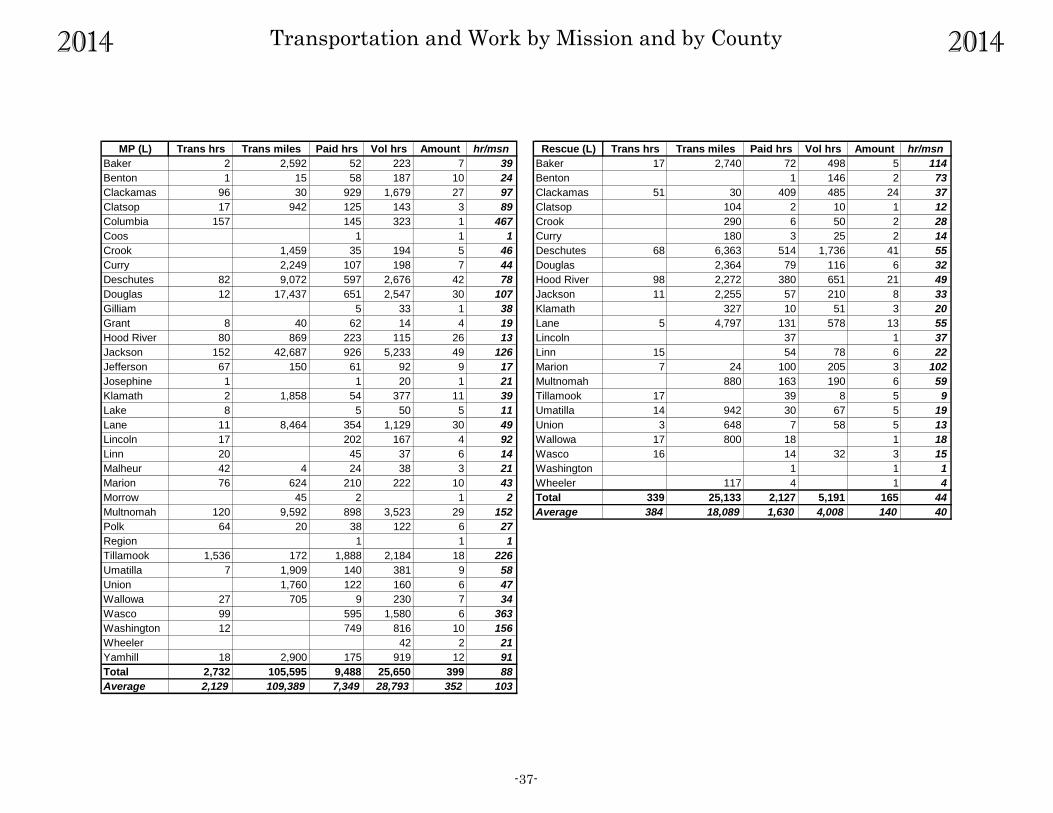
2014 Transportation and Work by Mission and by County 2014
MP (L) Trans hrs Trans miles Paid hrs Vol hrs Amount hr/msn Rescue (L) Trans hrs Trans miles Paid hrs Vol hrs Amount hr/msn
Baker 2 2,592 52 223 7 39 Baker 17 2,740 72 498 5 114
Benton 1 15 58 187 10 24 Benton 1 146 2 73
Clackamas 96 30 929 1,679 27 97 Clackamas 51 30 409 485 24 37
Clatsop 17 942 125 143 3 89 Clatsop 104 2 10 1 12
Columbia 157 145 323 1 467 Crook 290 6 50 2 28
Coos 1 1 1 Curry 180 3 25 2 14
Crook 1,459 35 194 5 46 Deschutes 68 6,363 514 1,736 41 55
Curry 2,249 107 198 7 44 Douglas 2,364 79 116 6 32
Deschutes 82 9,072 597 2,676 42 78 Hood River 98 2,272 380 651 21 49
Douglas 12 17,437 651 2,547 30 107 Jackson 11 2,255 57 210 8 33
Gilliam 5 33 1 38 Klamath 327 10 51 3 20
Grant 8 40 62 14 4 19 Lane 5 4,797 131 578 13 55
Hood River 80 869 223 115 26 13 Lincoln 37 1 37
Jackson 152 42,687 926 5,233 49 126 Linn 15 54 78 6 22
Jefferson 67 150 61 92 9 17 Marion 7 24 100 205 3 102
Josephine 1 1 20 1 21 Multnomah 880 163 190 6 59
Klamath 2 1,858 54 377 11 39 Tillamook 17 39 8 5 9
Lake 8 5 50 5 11 Umatilla 14 942 30 67 5 19
Lane 11 8,464 354 1,129 30 49 Union 3 648 7 58 5 13
Lincoln 17 202 167 4 92 Wallowa 17 800 18 1 18
Linn 20 45 37 6 14 Wasco 16 14 32 3 15
Malheur 42 4 24 38 3 21 Washington 1 1 1
Marion 76 624 210 222 10 43 Wheeler 117 4 1 4
Morrow 45 2 1 2 Total 339 25,133 2,127 5,191 165 44
Multnomah 120 9,592 898 3,523 29 152 Average 384 18,089 1,630 4,008 140 40
Polk 64 20 38 122 6 27
Region 1 1 1
Tillamook 1,536 172 1,888 2,184 18 226
Umatilla 7 1,909 140 381 9 58
Union 1,760 122 160 6 47
Wallowa 27 705 9 230 7 34
Wasco 99 595 1,580 6 363
Washington 12 749 816 10 156
Wheeler 42 2 21
Yamhill 18 2,900 175 919 12 91
Total 2,732 105,595 9,488 25,650 399 88
Average 2,129 109,389 7,349 28,793 352 103
-37-
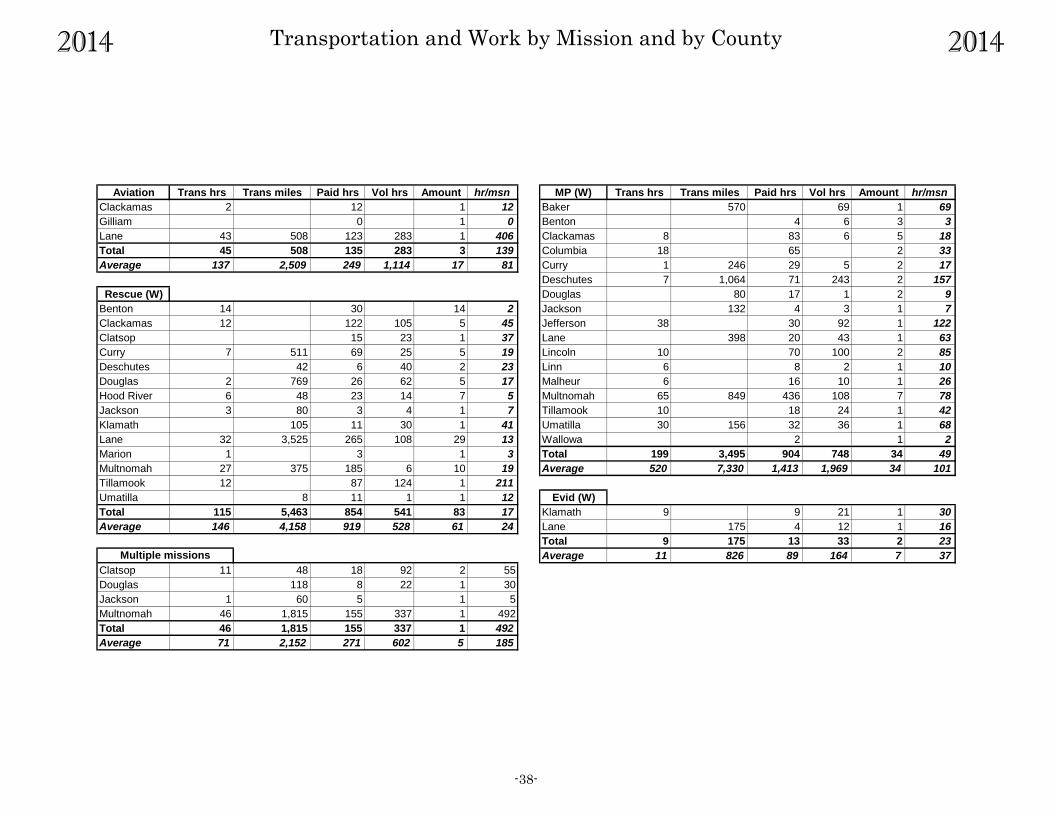
2014 Transportation and Work by Mission and by County 2014
Aviation Trans hrs Trans miles Paid hrs Vol hrs Amount hr/msn MP (W) Trans hrs Trans miles Paid hrs Vol hrs Amount hr/msn
Clackamas 2 12 1 12 Baker 570 69 1 69
Gilliam 0 1 0 Benton 4 6 3 3
Lane 43 508 123 283 1 406 Clackamas 8 83 6 5 18
Total 45 508 135 283 3 139 Columbia 18 65 2 33
Average 137 2,509 249 1,114 17 81 Curry 1 246 29 5 2 17
Deschutes 7 1,064 71 243 2 157
Rescue (W) Douglas 80 17 1 2 9
Benton 14 30 14 2 Jackson 132 4 3 1 7
Clackamas 12 122 105 5 45 Jefferson 38 30 92 1 122
Clatsop 15 23 1 37 Lane 398 20 43 1 63
Curry 7 511 69 25 5 19 Lincoln 10 70 100 2 85
Deschutes 42 6 40 2 23 Linn 6 8 2 1 10
Douglas 2 769 26 62 5 17 Malheur 6 16 10 1 26
Hood River 6 48 23 14 7 5 Multnomah 65 849 436 108 7 78
Jackson 3 80 3 4 1 7 Tillamook 10 18 24 1 42
Klamath 105 11 30 1 41 Umatilla 30 156 32 36 1 68
Lane 32 3,525 265 108 29 13 Wallowa 2 1 2
Marion 1 3 1 3 Total 199 3,495 904 748 34 49
Multnomah 27 375 185 6 10 19 Average 520 7,330 1,413 1,969 34 101
Tillamook 12 87 124 1 211
Umatilla 8 11 1 1 12 Evid (W)
Total 115 5,463 854 541 83 17 Klamath 9 9 21 1 30
Average 146 4,158 919 528 61 24 Lane 175 4 12 1 16
Total 9 175 13 33 2 23
Average 11 826 89 164 7 37
Clatsop 11 48 18 92 2 55
Douglas 118 8 22 1 30
Jackson 1 60 5 1 5
Multnomah 46 1,815 155 337 1 492
Total 46 1,815 155 337 1 492
Average 71 2,152 271 602 5 185
Multiple missions
-38-
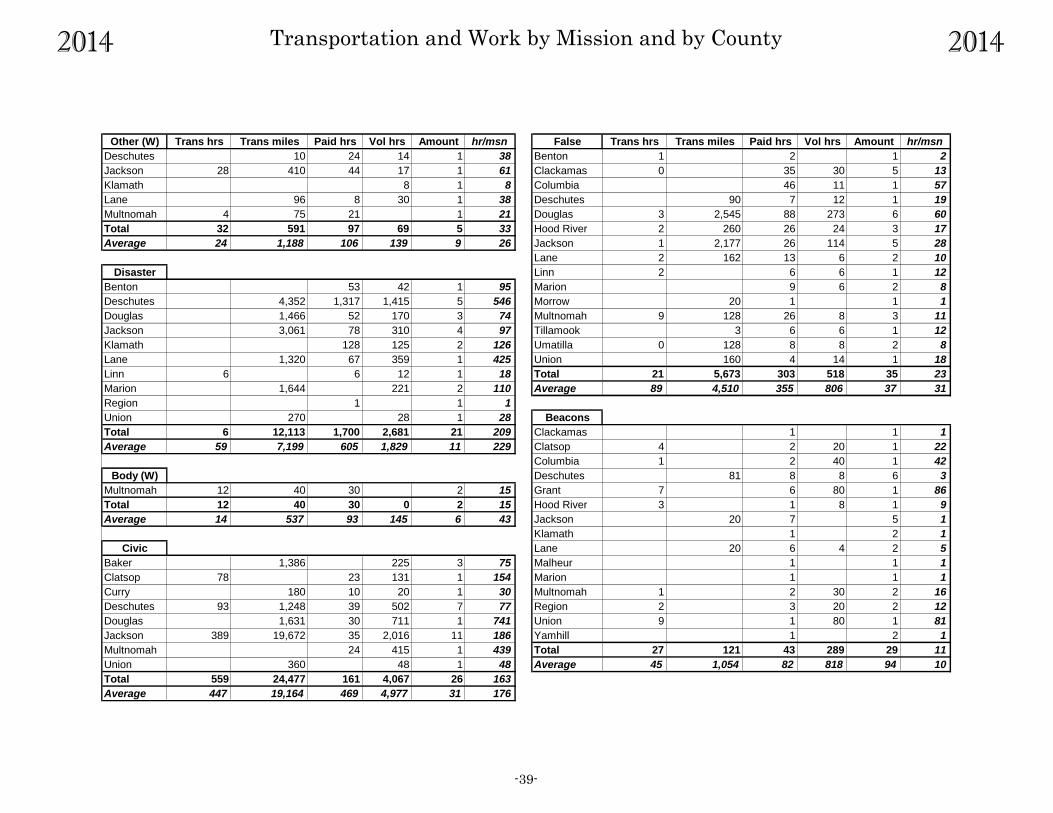
2014 Transportation and Work by Mission and by County 2014
Other (W) Trans hrs Trans miles Paid hrs Vol hrs Amount hr/msn False Trans hrs Trans miles Paid hrs Vol hrs Amount hr/msn
Deschutes 10 24 14 1 38 Benton 1 2 1 2
Jackson 28 410 44 17 1 61 Clackamas 0 35 30 5 13
Klamath 8 1 8 Columbia 46 11 1 57
Lane 96 8 30 1 38 Deschutes 90 7 12 1 19
Multnomah 4 75 21 1 21 Douglas 3 2,545 88 273 6 60
Total 32 591 97 69 5 33 Hood River 2 260 26 24 3 17
Average 24 1,188 106 139 9 26 Jackson 1 2,177 26 114 5 28
Lane 2 162 13 6 2 10
Disaster Linn 2 6 6 1 12
Benton 53 42 1 95 Marion 9 6 2 8
Deschutes 4,352 1,317 1,415 5 546 Morrow 20 1 1 1
Douglas 1,466 52 170 3 74 Multnomah 9 128 26 8 3 11
Jackson 3,061 78 310 4 97 Tillamook 3 6 6 1 12
Klamath 128 125 2 126 Umatilla 0 128 8 8 2 8
Lane 1,320 67 359 1 425 Union 160 4 14 1 18
Linn 6 6 12 1 18 Total 21 5,673 303 518 35 23
Marion 1,644 221 2 110 Average 89 4,510 355 806 37 31
Region 1 1 1
Union 270 28 1 28 Beacons
Total 6 12,113 1,700 2,681 21 209 Clackamas 1 1 1
Average 59 7,199 605 1,829 11 229 Clatsop 4 2 20 1 22
Columbia 1 2 40 1 42
Body (W) Deschutes 81 8 8 6 3
Multnomah 12 40 30 2 15 Grant 7 6 80 1 86
Total 12 40 30 0 2 15 Hood River 3 1 8 1 9
Average 14 537 93 145 6 43 Jackson 20 7 5 1
Klamath 1 2 1
Civic Lane 20 6 4 2 5
Baker 1,386 225 3 75 Malheur 1 1 1
Clatsop 78 23 131 1 154 Marion 1 1 1
Curry 180 10 20 1 30 Multnomah 1 2 30 2 16
Deschutes 93 1,248 39 502 7 77 Region 2 3 20 2 12
Douglas 1,631 30 711 1 741 Union 9 1 80 1 81
Jackson 389 19,672 35 2,016 11 186 Yamhill 1 2 1
Multnomah 24 415 1 439 Total 27 121 43 289 29 11
Union 360 48 1 48 Average 45 1,054 82 818 94 10
Total 559 24,477 161 4,067 26 163
Average 447 19,164 469 4,977 31 176
-39-
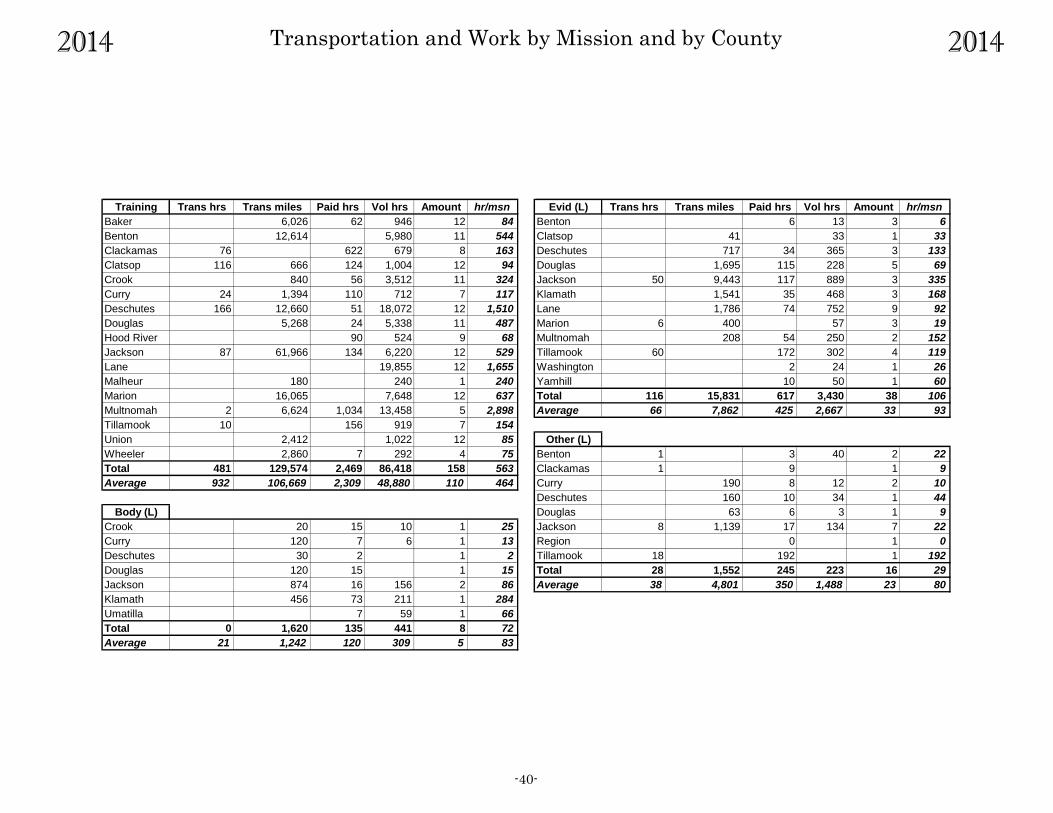
2014 Transportation and Work by Mission and by County 2014
Training Trans hrs Trans miles Paid hrs Vol hrs Amount hr/msn Evid (L) Trans hrs Trans miles Paid hrs Vol hrs Amount hr/msn
Baker 6,026 62 946 12 84 Benton 6 13 3 6
Benton 12,614 5,980 11 544 Clatsop 41 33 1 33
Clackamas 76 622 679 8 163 Deschutes 717 34 365 3 133
Clatsop 116 666 124 1,004 12 94 Douglas 1,695 115 228 5 69
Crook 840 56 3,512 11 324 Jackson 50 9,443 117 889 3 335
Curry 24 1,394 110 712 7 117 Klamath 1,541 35 468 3 168
Deschutes 166 12,660 51 18,072 12 1,510 Lane 1,786 74 752 9 92
Douglas 5,268 24 5,338 11 487 Marion 6 400 57 3 19
Hood River 90 524 9 68 Multnomah 208 54 250 2 152
Jackson 87 61,966 134 6,220 12 529 Tillamook 60 172 302 4 119
Lane 19,855 12 1,655 Washington 2 24 1 26
Malheur 180 240 1 240 Yamhill 10 50 1 60
Marion 16,065 7,648 12 637 Total 116 15,831 617 3,430 38 106
Multnomah 2 6,624 1,034 13,458 5 2,898 Average 66 7,862 425 2,667 33 93
Tillamook 10 156 919 7 154
Union 2,412 1,022 12 85 Other (L)
Wheeler 2,860 7 292 4 75 Benton 1 3 40 2 22
Total 481 129,574 2,469 86,418 158 563 Clackamas 1 9 1 9
Average 932 106,669 2,309 48,880 110 464 Curry 190 8 12 2 10
Deschutes 160 10 34 1 44
Body (L) Douglas 63 6 3 1 9
Crook 20 15 10 1 25 Jackson 8 1,139 17 134 7 22
Curry 120 7 6 1 13 Region 0 1 0
Deschutes 30 2 1 2 Tillamook 18 192 1 192
Douglas 120 15 1 15 Total 28 1,552 245 223 16 29
Jackson 874 16 156 2 86 Average 38 4,801 350 1,488 23 80
Klamath 456 73 211 1 284
Umatilla 7 59 1 66
Total 0 1,620 135 441 8 72
Average 21 1,242 120 309 5 83
-40-
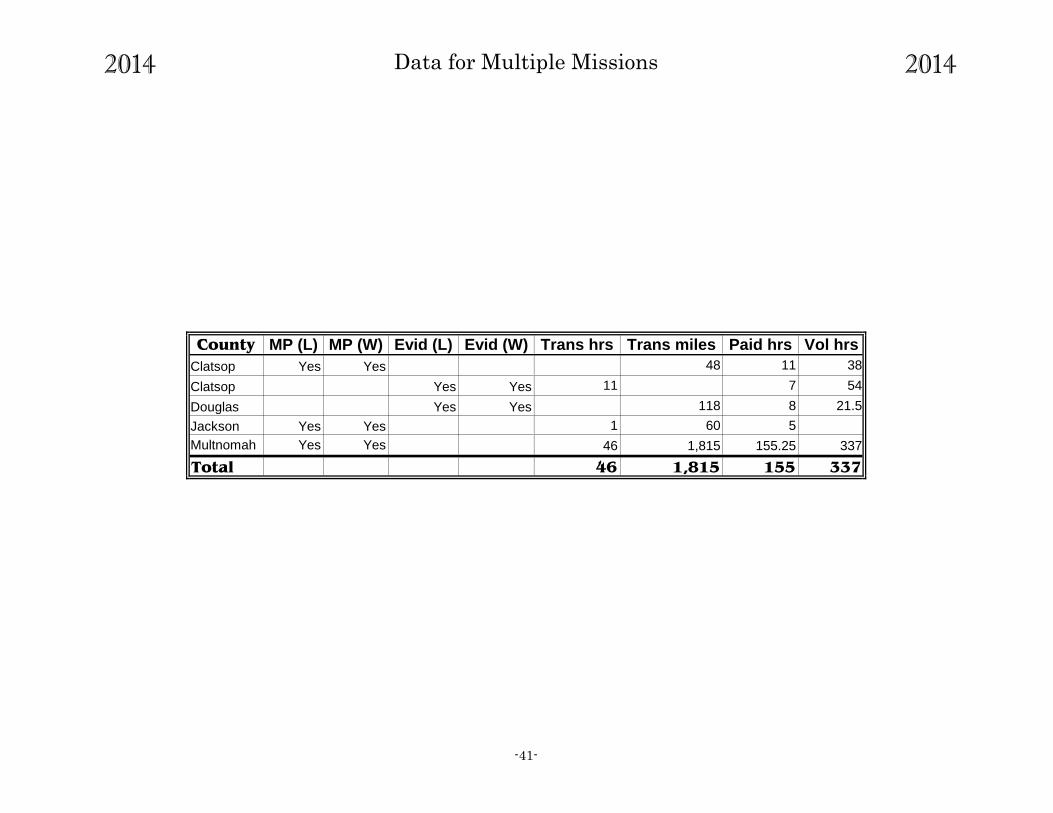
2014 Data for Multiple Missions 2014
County MP (L) MP (W) Evid (L) Evid (W) Trans hrs Trans miles Paid hrs Vol hrs
Clatsop Yes Yes 48 11 38
Clatsop Yes Yes 11 7 54
Douglas Yes Yes 118 8 21.5
Jackson Yes Yes 1 60 5
Multnomah Yes Yes 46 1,815 155.25 337
Total 46 1,815 155 337
-41-
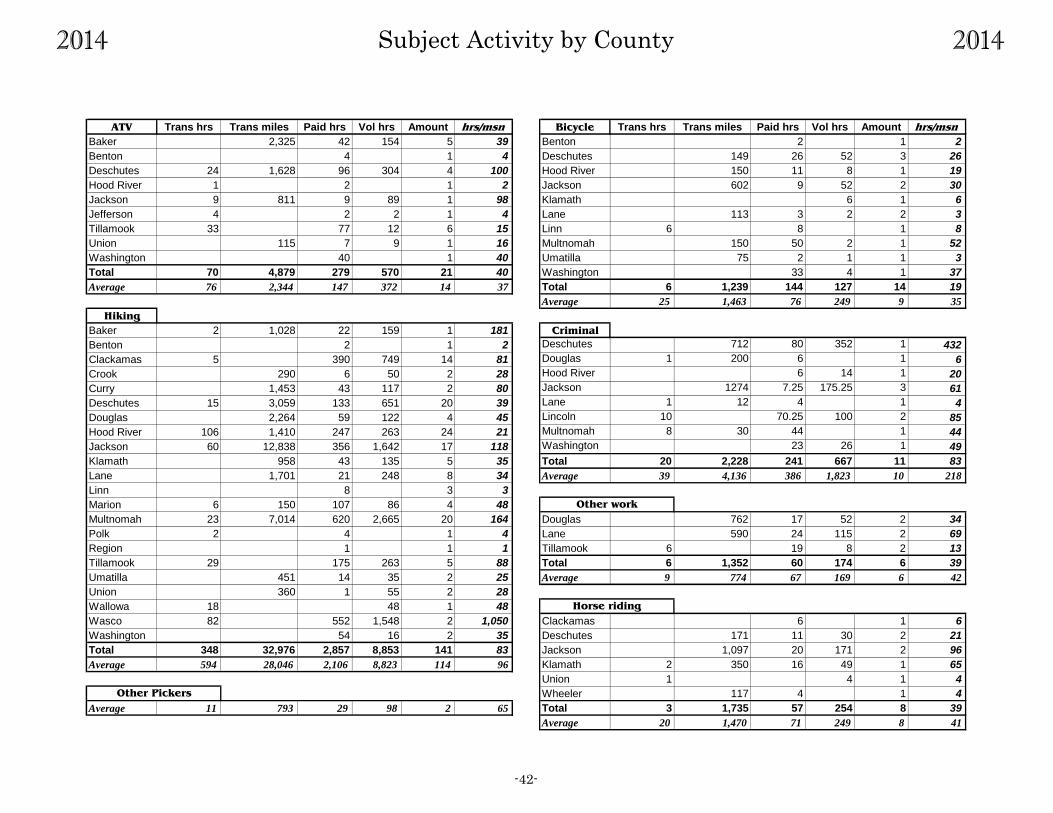
2014 Subject Activity by County 2014
ATV Trans hrs Trans miles Paid hrs Vol hrs Amount hrs/msn Bicycle Trans hrs Trans miles Paid hrs Vol hrs Amount hrs/msn
Baker 2,325 42 154 5 39 Benton 2 1 2
Benton 4 1 4 Deschutes 149 26 52 3 26
Deschutes 24 1,628 96 304 4 100 Hood River 150 11 8 1 19
Hood River 1 2 1 2 Jackson 602 9 52 2 30
Jackson 9 811 9 89 1 98 Klamath 6 1 6
Jefferson 4 2 2 1 4 Lane 113 3 2 2 3
Tillamook 33 77 12 6 15 Linn 6 8 1 8
Union 115 7 9 1 16 Multnomah 150 50 2 1 52
Washington 40 1 40 Umatilla 75 2 1 1 3
Total 70 4,879 279 570 21 40 Washington 33 4 1 37
Average 76 2,344 147 372 14 37 Total 6 1,239 144 127 14 19
Average 25 1,463 76 249 9 35
Hiking
Baker 2 1,028 22 159 1 181 Criminal
Benton 2 1 2 Deschutes 712 80 352 1 432
Clackamas 5 390 749 14 81 Douglas 1 200 6 1 6
Crook 290 6 50 2 28 Hood River 6 14 1 20
Curry 1,453 43 117 2 80 Jackson 1274 7.25 175.25 3 61
Deschutes 15 3,059 133 651 20 39 Lane 1 12 4 1 4
Douglas 2,264 59 122 4 45 Lincoln 10 70.25 100 2 85
Hood River 106 1,410 247 263 24 21 Multnomah 8 30 44 1 44
Jackson 60 12,838 356 1,642 17 118 Washington 23 26 1 49
Klamath 958 43 135 5 35 Total 20 2,228 241 667 11 83
Lane 1,701 21 248 8 34 Average 39 4,136 386 1,823 10 218
Linn 8 3 3
Marion 6 150 107 86 4 48
Multnomah 23 7,014 620 2,665 20 164 Douglas 762 17 52 2 34
Polk 2 4 1 4 Lane 590 24 115 2 69
Region 1 1 1 Tillamook 6 19 8 2 13
Tillamook 29 175 263 5 88 Total 6 1,352 60 174 6 39
Umatilla 451 14 35 2 25 Average 9 774 67 169 6 42
Union 360 1 55 2 28
Wallowa 18 48 1 48
Wasco 82 552 1,548 2 1,050 Clackamas 6 1 6
Washington 54 16 2 35 Deschutes 171 11 30 2 21
Total 348 32,976 2,857 8,853 141 83 Jackson 1,097 20 171 2 96
Average 594 28,046 2,106 8,823 114 96 Klamath 2 350 16 49 1 65
Union 1 4 1 4
Wheeler 117 4 1 4
Average 11 793 29 98 2 65 Total 3 1,735 57 254 8 39
Average 20 1,470 71 249 8 41
Other work
Horse riding
Other Pickers
-42-
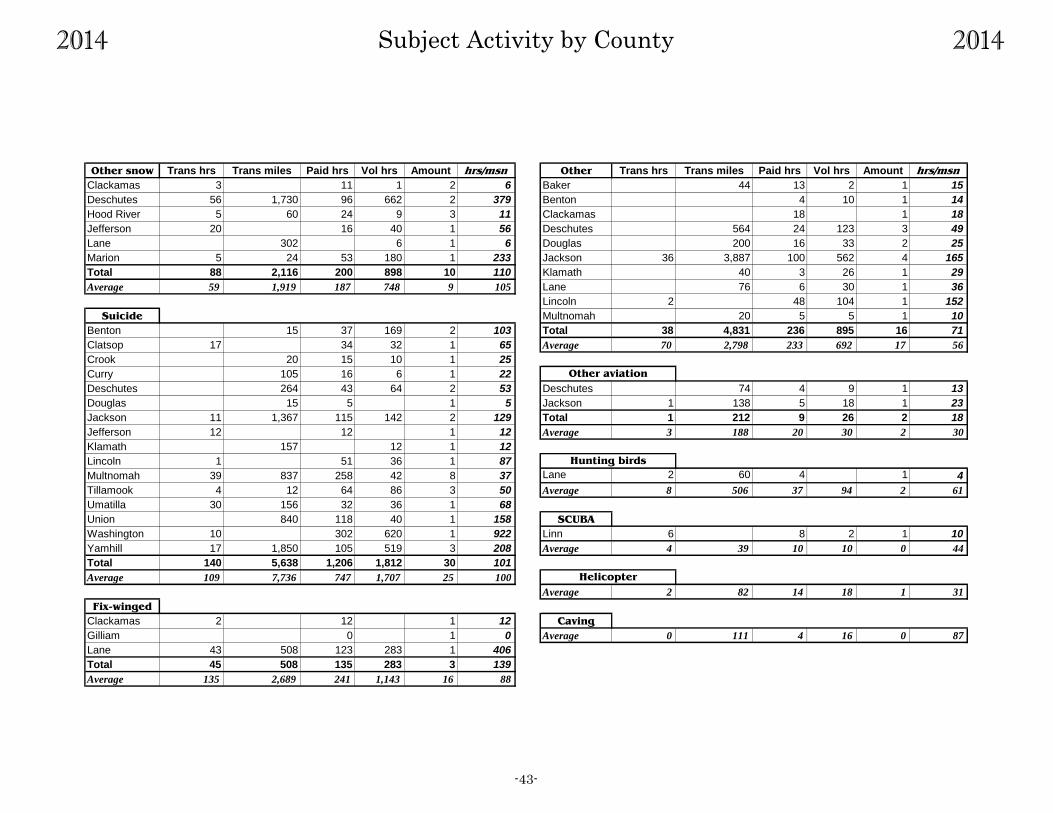
2014 Subject Activity by County 2014
Other snow Trans hrs Trans miles Paid hrs Vol hrs Amount hrs/msn Other Trans hrs Trans miles Paid hrs Vol hrs Amount hrs/msn
Clackamas 3 11 1 2 6 Baker 44 13 2 1 15
Deschutes 56 1,730 96 662 2 379 Benton 4 10 1 14
Hood River 5 60 24 9 3 11 Clackamas 18 1 18
Jefferson 20 16 40 1 56 Deschutes 564 24 123 3 49
Lane 302 6 1 6 Douglas 200 16 33 2 25
Marion 5 24 53 180 1 233 Jackson 36 3,887 100 562 4 165
Total 88 2,116 200 898 10 110 Klamath 40 3 26 1 29
Average 59 1,919 187 748 9 105 Lane 76 6 30 1 36
Lincoln 2 48 104 1 152
Suicide Multnomah 20 5 5 1 10
Benton 15 37 169 2 103 Total 38 4,831 236 895 16 71
Clatsop 17 34 32 1 65 Average 70 2,798 233 692 17 56
Crook 20 15 10 1 25
Curry 105 16 6 1 22
Deschutes 264 43 64 2 53 Deschutes 74 4 9 1 13
Douglas 15 5 1 5 Jackson 1 138 5 18 1 23
Jackson 11 1,367 115 142 2 129 Total 1 212 9 26 2 18
Jefferson 12 12 1 12 Average 3 188 20 30 2 30
Klamath 157 12 1 12
Lincoln 1 51 36 1 87
Multnomah 39 837 258 42 8 37 Lane 2 60 4 1 4
Tillamook 4 12 64 86 3 50 Average 8 506 37 94 2 61
Umatilla 30 156 32 36 1 68
Union 840 118 40 1 158 SCUBA
Washington 10 302 620 1 922 Linn 6 8 2 1 10
Yamhill 17 1,850 105 519 3 208 Average 4 39 10 10 0 44
Total 140 5,638 1,206 1,812 30 101
Average 109 7,736 747 1,707 25 100
Average 2 82 14 18 1 31
Fix-winged
Clackamas 2 12 1 12 Caving
Gilliam 0 1 0 Average 0 111 4 16 0 87
Lane 43 508 123 283 1 406
Total 45 508 135 283 3 139
Average 135 2,689 241 1,143 16 88
Hunting birds
Helicopter
Other aviation
-43-
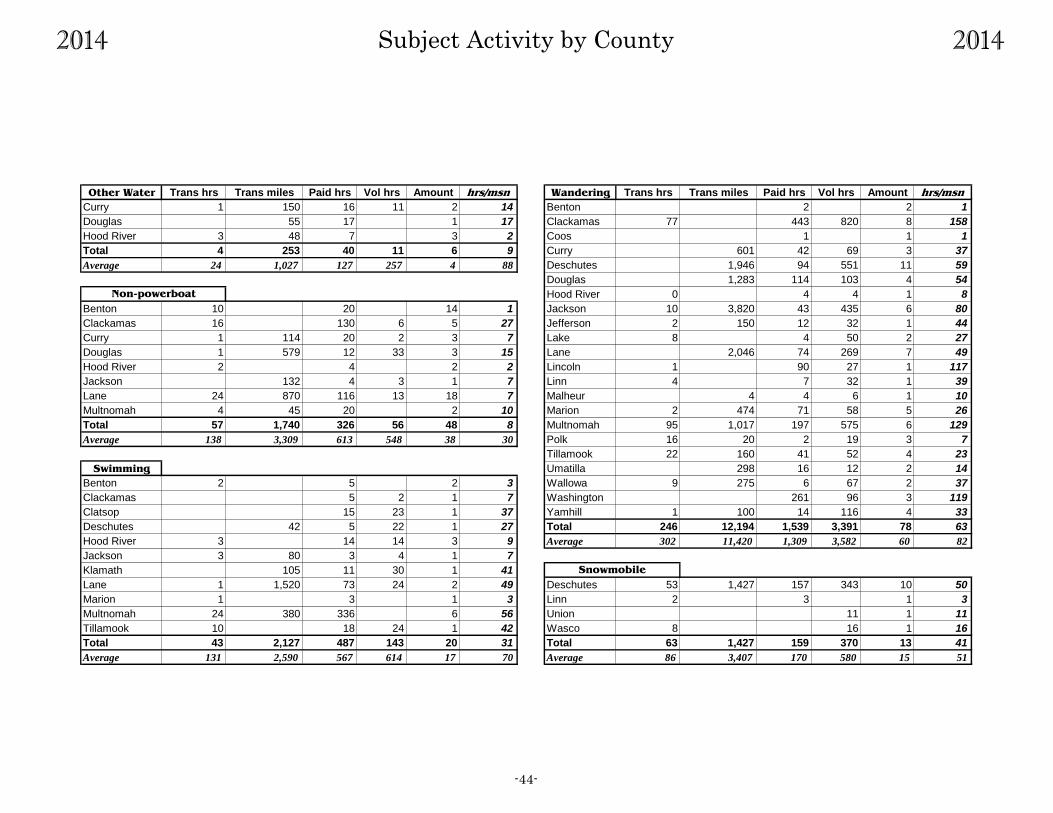
2014 Subject Activity by County 2014
Other Water Trans hrs Trans miles Paid hrs Vol hrs Amount hrs/msn Wandering Trans hrs Trans miles Paid hrs Vol hrs Amount hrs/msn
Curry 1 150 16 11 2 14 Benton 2 2 1
Douglas 55 17 1 17 Clackamas 77 443 820 8 158
Hood River 3 48 7 3 2 Coos 1 1 1
Total 4 253 40 11 6 9 Curry 601 42 69 3 37
Average 24 1,027 127 257 4 88 Deschutes 1,946 94 551 11 59
Douglas 1,283 114 103 4 54
Hood River 0 4 4 1 8
Benton 10 20 14 1 Jackson 10 3,820 43 435 6 80
Clackamas 16 130 6 5 27 Jefferson 2 150 12 32 1 44
Curry 1 114 20 2 3 7 Lake 8 4 50 2 27
Douglas 1 579 12 33 3 15 Lane 2,046 74 269 7 49
Hood River 2 4 2 2 Lincoln 1 90 27 1 117
Jackson 132 4 3 1 7 Linn 4 7 32 1 39
Lane 24 870 116 13 18 7 Malheur 4 4 6 1 10
Multnomah 4 45 20 2 10 Marion 2 474 71 58 5 26
Total 57 1,740 326 56 48 8 Multnomah 95 1,017 197 575 6 129
Average 138 3,309 613 548 38 30 Polk 16 20 2 19 3 7
Tillamook 22 160 41 52 4 23
Swimming Umatilla 298 16 12 2 14
Benton 2 5 2 3 Wallowa 9 275 6 67 2 37
Clackamas 5 2 1 7 Washington 261 96 3 119
Clatsop 15 23 1 37 Yamhill 1 100 14 116 4 33
Deschutes 42 5 22 1 27 Total 246 12,194 1,539 3,391 78 63
Hood River 3 14 14 3 9 Average 302 11,420 1,309 3,582 60 82
Jackson 3 80 3 4 1 7
Klamath 105 11 30 1 41
Lane 1 1,520 73 24 2 49 Deschutes 53 1,427 157 343 10 50
Marion 1 3 1 3 Linn 2 3 1 3
Multnomah 24 380 336 6 56 Union 11 1 11
Tillamook 10 18 24 1 42 Wasco 8 16 1 16
Total 43 2,127 487 143 20 31 Total 63 1,427 159 370 13 41
Average 131 2,590 567 614 17 70 Average 86 3,407 170 580 15 51
Snowmobile
Non-powerboat
-44-
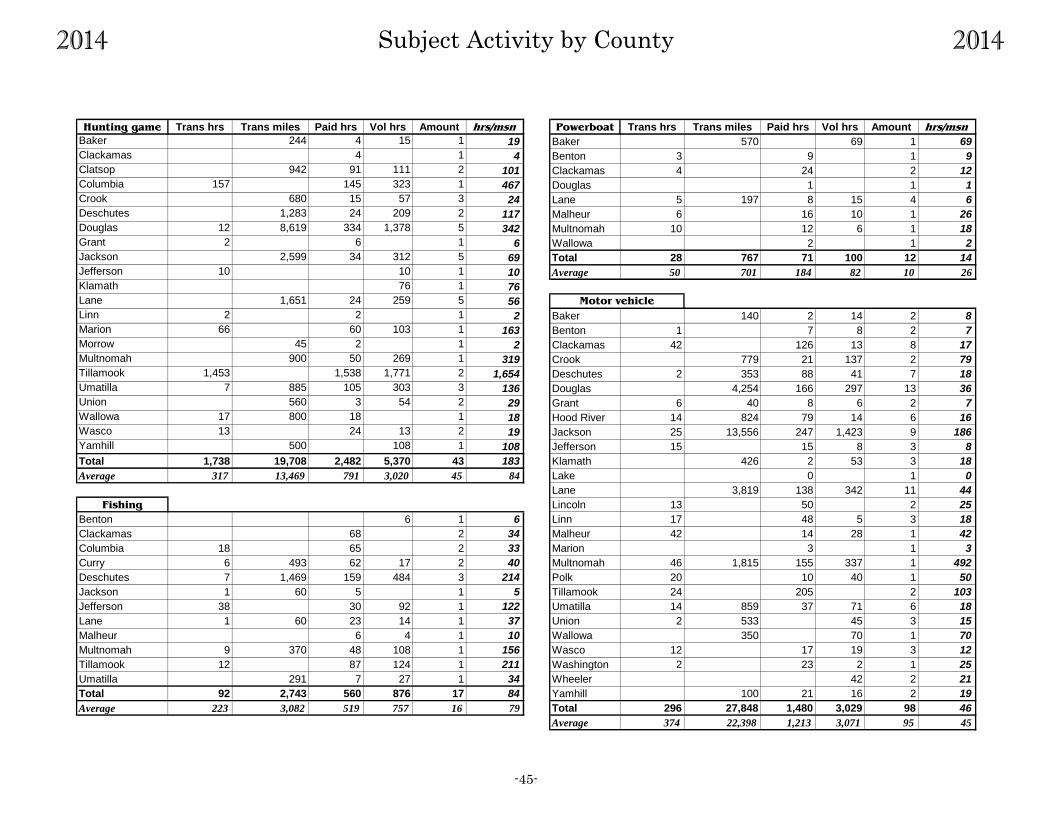
2014 Subject Activity by County 2014
Hunting game Trans hrs Trans miles Paid hrs Vol hrs Amount hrs/msn Powerboat Trans hrs Trans miles Paid hrs Vol hrs Amount hrs/msn
Baker 244 4 15 1 19 Baker 570 69 1 69
Clackamas 4 1 4 Benton 3 9 1 9
Clatsop 942 91 111 2 101 Clackamas 4 24 2 12
Columbia 157 145 323 1 467 Douglas 1 1 1
Crook 680 15 57 3 24 Lane 5 197 8 15 4 6
Deschutes 1,283 24 209 2 117 Malheur 6 16 10 1 26
Douglas 12 8,619 334 1,378 5 342 Multnomah 10 12 6 1 18
Grant 2 6 1 6 Wallowa 2 1 2
Jackson 2,599 34 312 5 69 Total 28 767 71 100 12 14
Jefferson 10 10 1 10 Average 50 701 184 82 10 26
Klamath 76 1 76
Lane 1,651 24 259 5 56
Linn 2 2 1 2 Baker 140 2 14 2 8
Marion 66 60 103 1 163 Benton 1 7 8 2 7
Morrow 45 2 1 2 Clackamas 42 126 13 8 17
Multnomah 900 50 269 1 319 Crook 779 21 137 2 79
Tillamook 1,453 1,538 1,771 2 1,654 Deschutes 2 353 88 41 7 18
Umatilla 7 885 105 303 3 136 Douglas 4,254 166 297 13 36
Union 560 3 54 2 29 Grant 6 40 8 6 2 7
Wallowa 17 800 18 1 18 Hood River 14 824 79 14 6 16
Wasco 13 24 13 2 19 Jackson 25 13,556 247 1,423 9 186
Yamhill 500 108 1 108 Jefferson 15 15 8 3 8
Total 1,738 19,708 2,482 5,370 43 183 Klamath 426 2 53 3 18
Average 317 13,469 791 3,020 45 84 Lake 0 1 0
Lane 3,819 138 342 11 44
Fishing Lincoln 13 50 2 25
Benton 6 1 6 Linn 17 48 5 3 18
Clackamas 68 2 34 Malheur 42 14 28 1 42
Columbia 18 65 2 33 Marion 3 1 3
Curry 6 493 62 17 2 40 Multnomah 46 1,815 155 337 1 492
Deschutes 7 1,469 159 484 3 214 Polk 20 10 40 1 50
Jackson 1 60 5 1 5 Tillamook 24 205 2 103
Jefferson 38 30 92 1 122 Umatilla 14 859 37 71 6 18
Lane 1 60 23 14 1 37 Union 2 533 45 3 15
Malheur 6 4 1 10 Wallowa 350 70 1 70
Multnomah 9 370 48 108 1 156 Wasco 12 17 19 3 12
Tillamook 12 87 124 1 211 Washington 2 23 2 1 25
Umatilla 291 7 27 1 34 Wheeler 42 2 21
Total 92 2,743 560 876 17 84 Yamhill 100 21 16 2 19
Average 223 3,082 519 757 16 79 Total 296 27,848 1,480 3,029 98 46
Average 374 22,398 1,213 3,071 95 45
Motor vehicle
-45-
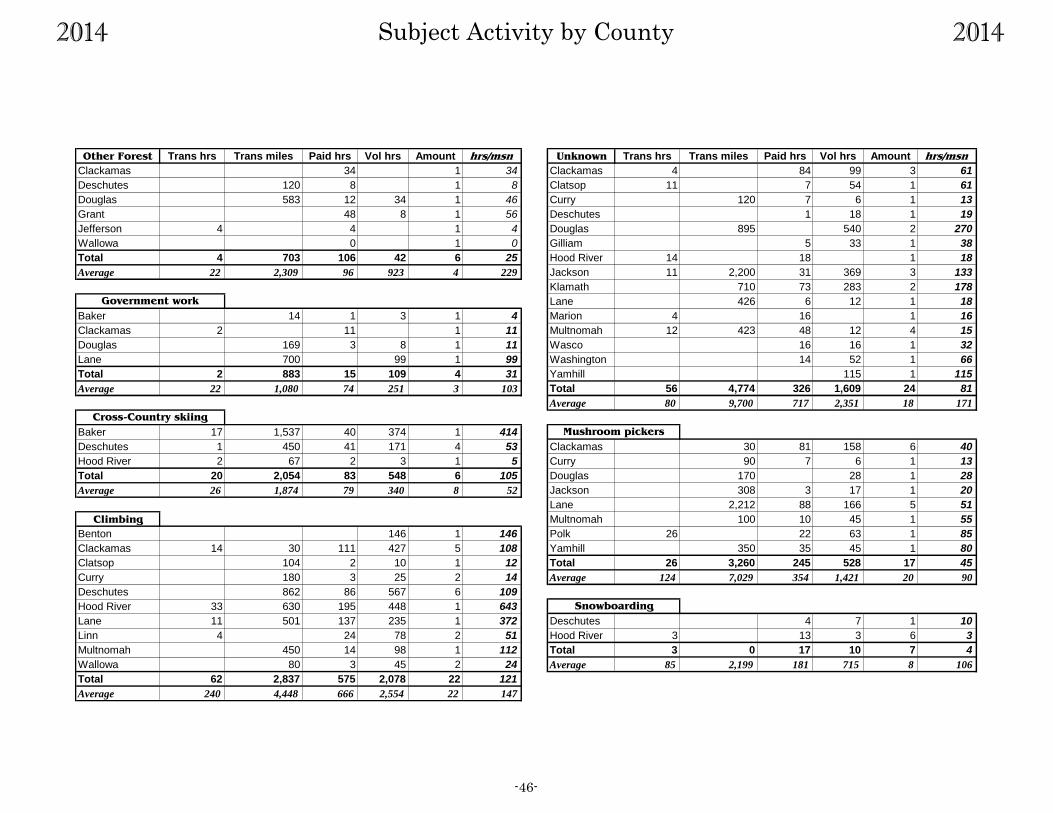
2014 Subject Activity by County 2014
Other Forest Trans hrs Trans miles Paid hrs Vol hrs Amount hrs/msn Unknown Trans hrs Trans miles Paid hrs Vol hrs Amount hrs/msn
Clackamas 34 1 34 Clackamas 4 84 99 3 61
Deschutes 120 8 1 8 Clatsop 11 7 54 1 61
Douglas 583 12 34 1 46 Curry 120 7 6 1 13
Grant 48 8 1 56 Deschutes 1 18 1 19
Jefferson 4 4 1 4 Douglas 895 540 2 270
Wallowa 0 1 0 Gilliam 5 33 1 38
Total 4 703 106 42 6 25 Hood River 14 18 1 18
Average 22 2,309 96 923 4 229 Jackson 11 2,200 31 369 3 133
Klamath 710 73 283 2 178
Lane 426 6 12 1 18
Baker 14 1 3 1 4 Marion 4 16 1 16
Clackamas 2 11 1 11 Multnomah 12 423 48 12 4 15
Douglas 169 3 8 1 11 Wasco 16 16 1 32
Lane 700 99 1 99 Washington 14 52 1 66
Total 2 883 15 109 4 31 Yamhill 115 1 115
Average 22 1,080 74 251 3 103 Total 56 4,774 326 1,609 24 81
Average 80 9,700 717 2,351 18 171
Baker 17 1,537 40 374 1 414
Deschutes 1 450 41 171 4 53 Clackamas 30 81 158 6 40
Hood River 2 67 2 3 1 5 Curry 90 7 6 1 13
Total 20 2,054 83 548 6 105 Douglas 170 28 1 28
Average 26 1,874 79 340 8 52 Jackson 308 3 17 1 20
Lane 2,212 88 166 5 51
Climbing Multnomah 100 10 45 1 55
Benton 146 1 146 Polk 26 22 63 1 85
Clackamas 14 30 111 427 5 108 Yamhill 350 35 45 1 80
Clatsop 104 2 10 1 12 Total 26 3,260 245 528 17 45
Curry 180 3 25 2 14 Average 124 7,029 354 1,421 20 90
Deschutes 862 86 567 6 109
Hood River 33 630 195 448 1 643
Lane 11 501 137 235 1 372 Deschutes 4 7 1 10
Linn 4 24 78 2 51 Hood River 3 13 3 6 3
Multnomah 450 14 98 1 112 Total 3 0 17 10 7 4
Wallowa 80 3 45 2 24 Average 85 2,199 181 715 8 106
Total 62 2,837 575 2,078 22 121
Average 240 4,448 666 2,554 22 147
Snowboarding
Government work
Mushroom pickers
Cross-Country skiing
-46-
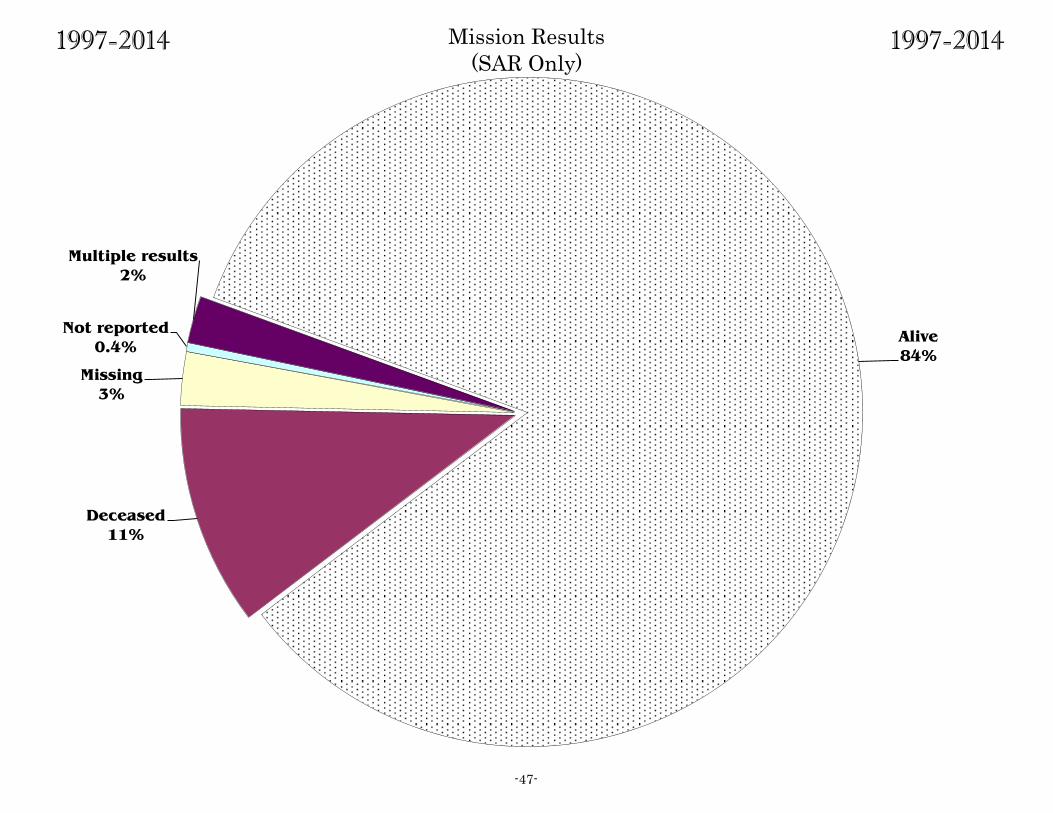
1997-2014 Mission Results
(SAR Only) 1997-2014
-47-
Alive
84%
Deceased
11%
Missing
3%
Not reported
0.4%
Multiple results
2%
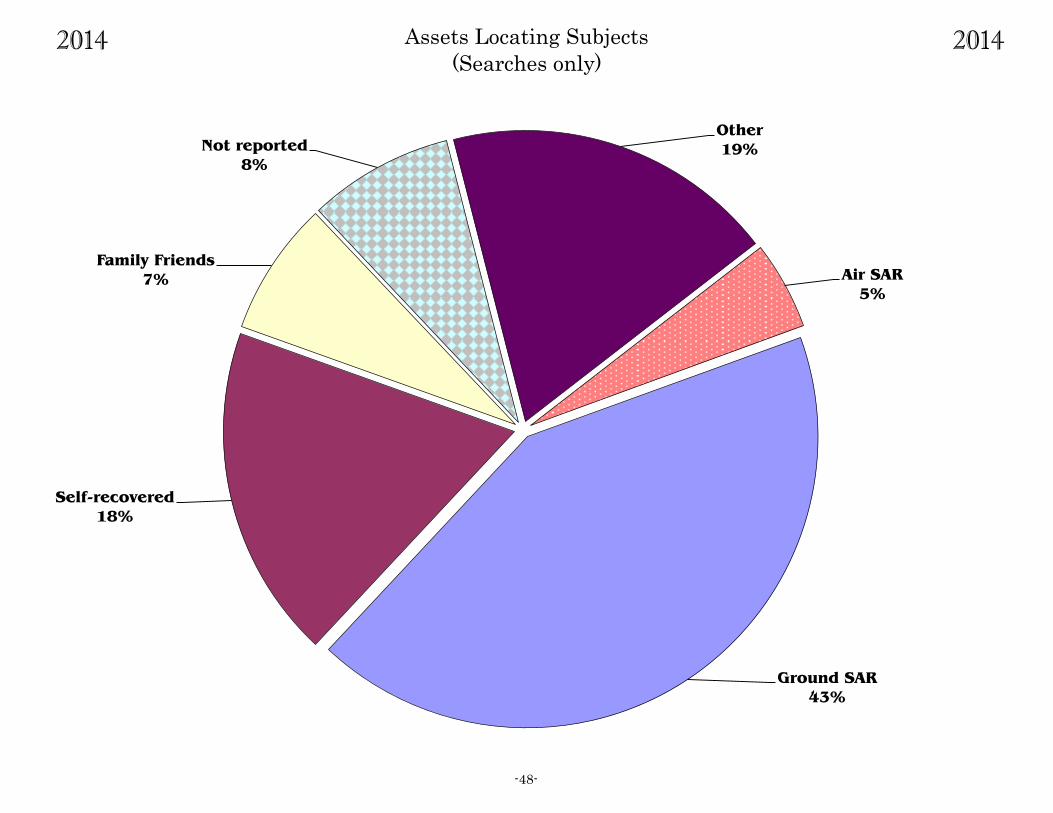
2014 Assets Locating Subjects
(Searches only) 2014
-48-
Ground SAR
43%
Self-recovered
18%
Family Friends
7%
Not reported
8%
Other
19%
Air SAR
5%
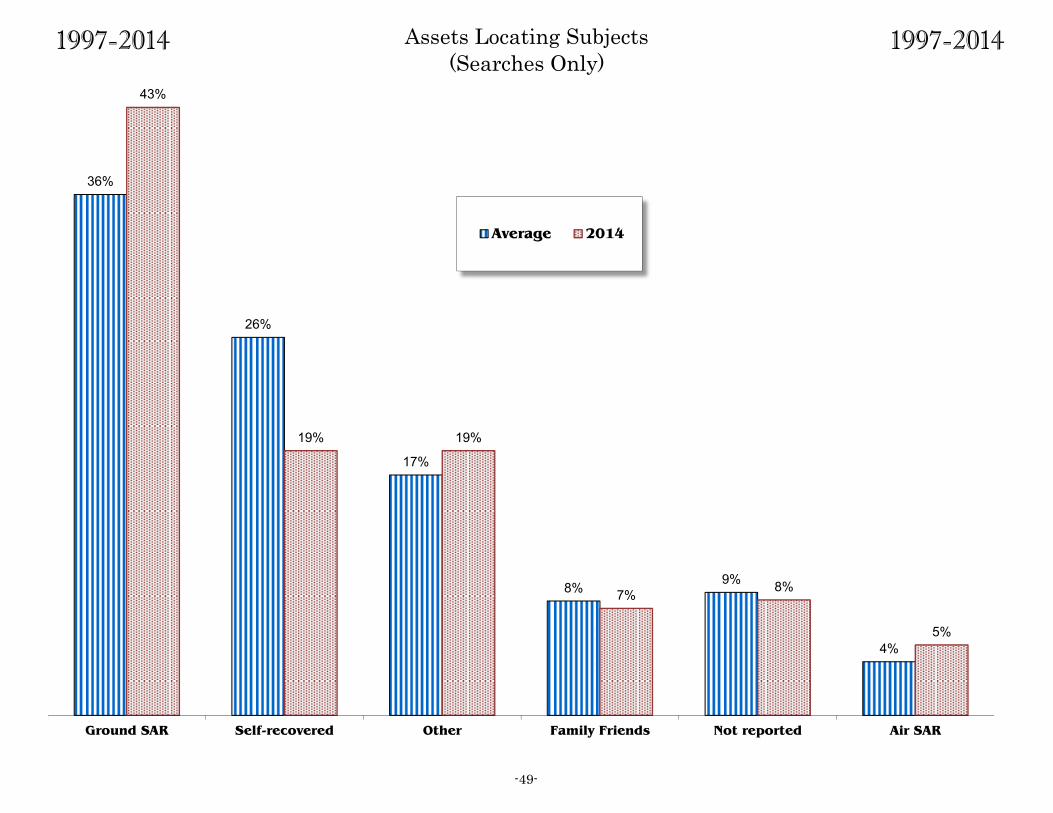
1997-2014 Assets Locating Subjects
(Searches Only) 1997-2014
-49-
36%
26%
17%
8% 9%
4%
43%
19% 19%
7% 8%
5%
Ground SAR Self-recovered Other Family Friends Not reported Air SAR
Average 2014
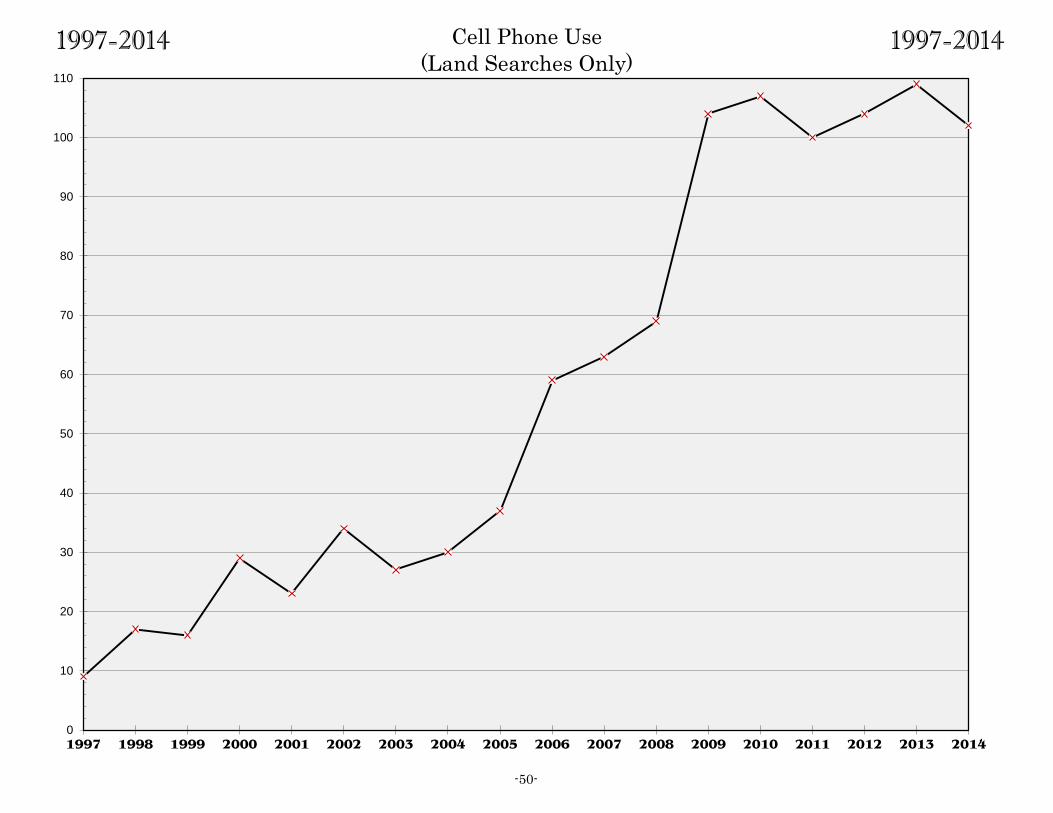
1997-2014 Cell Phone Use
(Land Searches Only) 1997-2014
-50-
0
10
20
30
40
50
60
70
80
90
100
110
1997 1998 1999 2000 2001 2002 2003 2004 2005 2006 2007 2008 2009 2010 2011 2012 2013 2014

2014 Subject Status by Age
(SAR Only) 2014
MALES Alive Deceased Missing Unknown Total
0-9 31 2 33
10-19 73 4 2 79
20-29 115 12 1 128
30-39 76 13 3 92
40-49 51 5 1 1 58
50-59 63 12 3 78
60-69 43 8 1 52
70-79 30 3 1 34
80-89 13 2 1 16
90-99 2 1 3
Unknown 15 3 18
Total 512 62 16 1 591
% of Total 87% 10% 3% 0.2% 100%
FEMALES Alive Deceased Missing Unknown Total
0-9 16 16
10-19 35 2 1 1 39
20-29 72 1 73
30-39 41 1 42
40-49 31 1 32
50-59 34 1 35
60-69 34 2 36
70-79 9 1 10
80-89 10 10
90-99 4 4
Unknown 13 13
Total 299 8 2 1 310
% of Total 96% 3% 1% 0.3% 100%
Alive Deceased Missing Unknown Total
% of Total
Population100%90% 8% 2% 0.2%
-51-
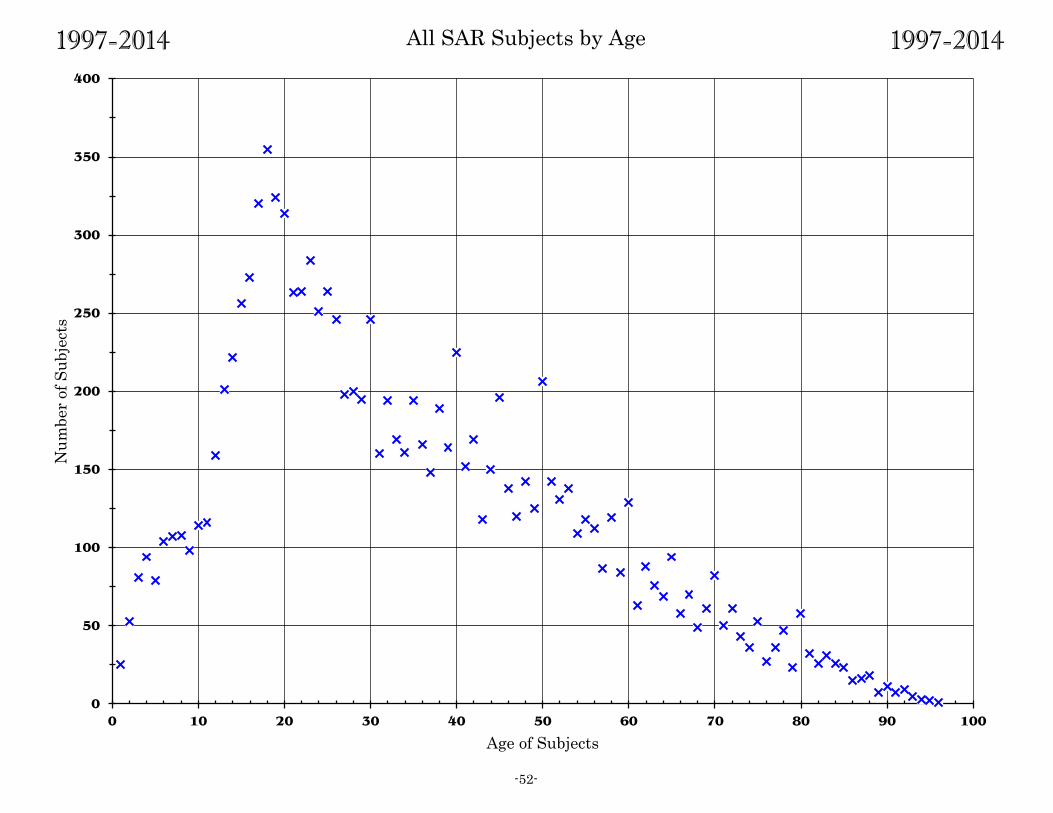
1997-2014 All SAR Subjects by Age 1997-2014
-52-
0
50
100
150
200
250
300
350
400
0 10 20 30 40 50 60 70 80 90 100
Nu
mb
er
of
Su
bje
cts
Age of Subjects

1997-2014 Searches for Females 1997-2014
-53-
0
10
20
30
40
50
60
70
80
90
100
110
120
130
140
150
160
170
180
190
200
0-4 5-9 10-14 15-19 20-24 25-29 30-34 35-39 40-44 45-49 50-54 55-59 60-64 65-69 70-74 75-79 80-84 85-89 90-94 95-99
Num
ber o
f Sub
ject
s
Females, Groups
Females, Solo
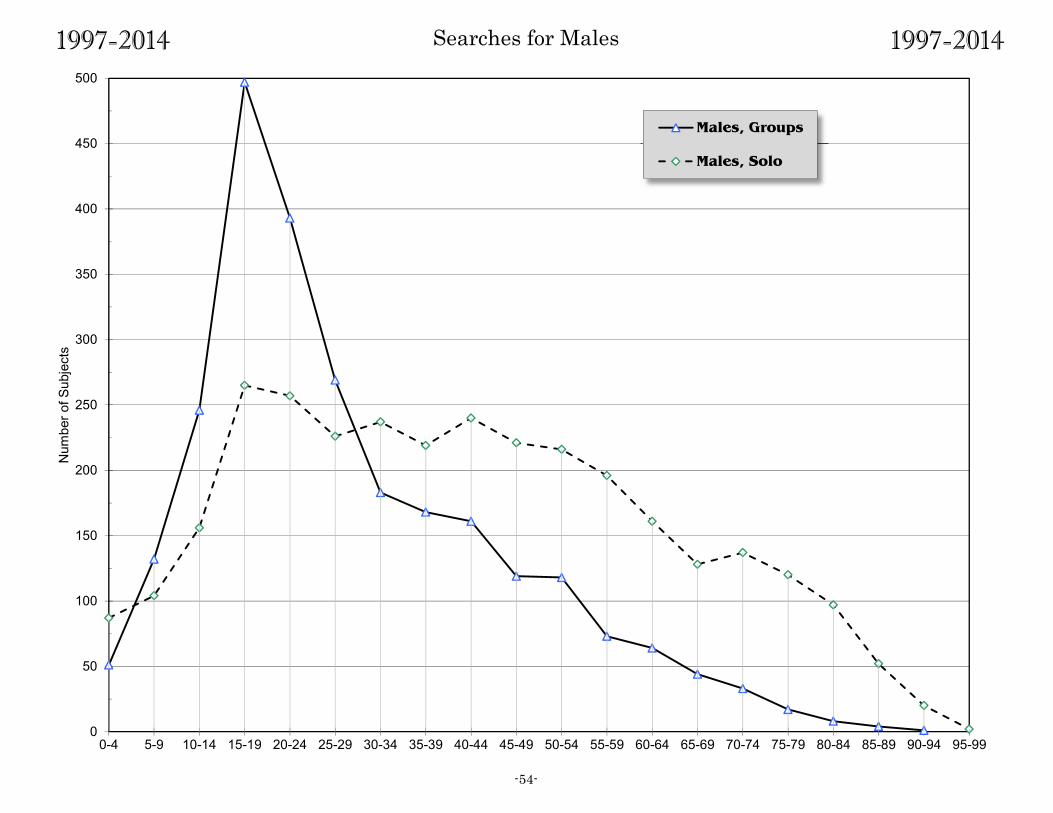
1997-2014 Searches for Males 1997-2014
-54-
0
50
100
150
200
250
300
350
400
450
500
0-4 5-9 10-14 15-19 20-24 25-29 30-34 35-39 40-44 45-49 50-54 55-59 60-64 65-69 70-74 75-79 80-84 85-89 90-94 95-99
Num
ber o
f Sub
ject
s
Males, Groups
Males, Solo
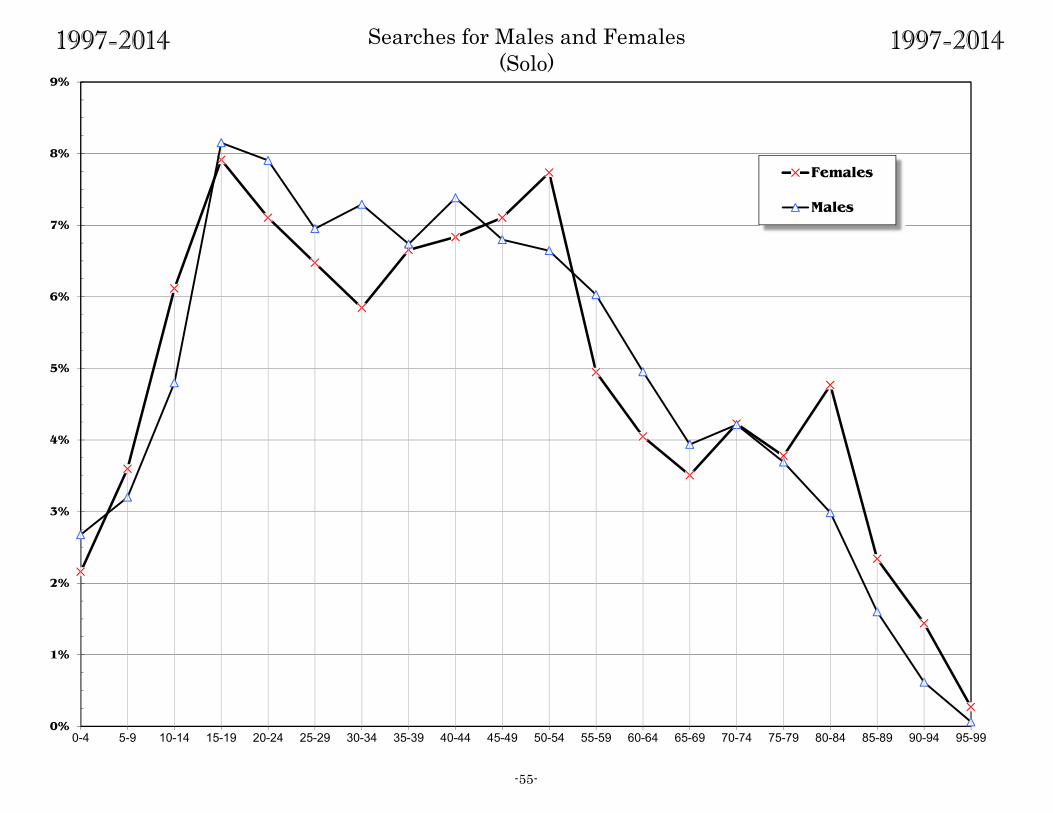
1997-2014 Searches for Males and Females
(Solo) 1997-2014
-55-
0%
1%
2%
3%
4%
5%
6%
7%
8%
9%
0-4 5-9 10-14 15-19 20-24 25-29 30-34 35-39 40-44 45-49 50-54 55-59 60-64 65-69 70-74 75-79 80-84 85-89 90-94 95-99
Females
Males
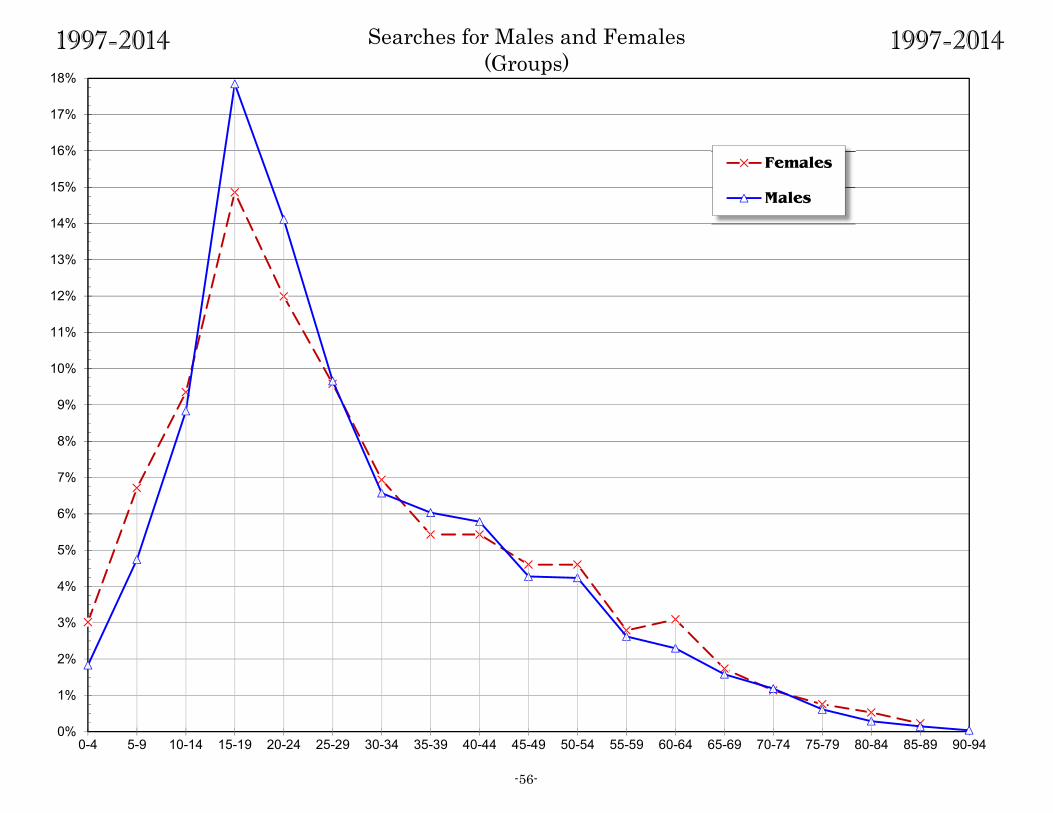
1997-2014 Searches for Males and Females
(Groups) 1997-2014
-56-
0%
1%
2%
3%
4%
5%
6%
7%
8%
9%
10%
11%
12%
13%
14%
15%
16%
17%
18%
0-4 5-9 10-14 15-19 20-24 25-29 30-34 35-39 40-44 45-49 50-54 55-59 60-64 65-69 70-74 75-79 80-84 85-89 90-94
Females
Males
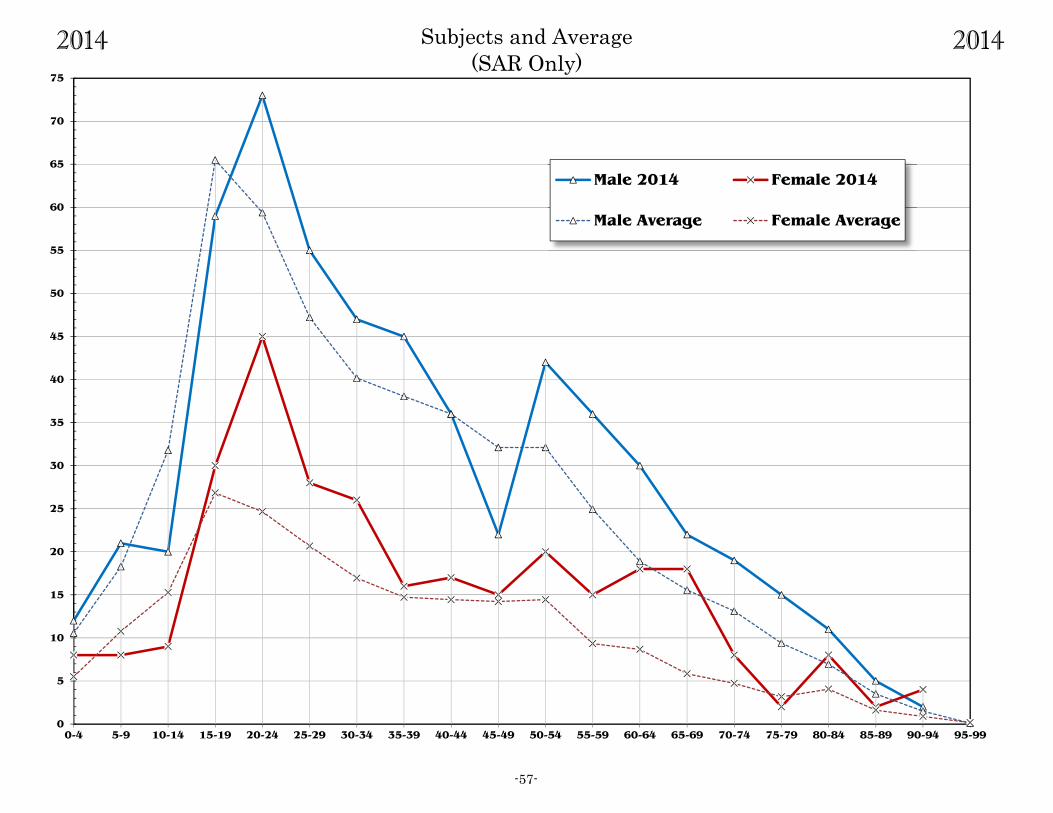
2014 Subjects and Average
(SAR Only) 2014
-57-
0
5
10
15
20
25
30
35
40
45
50
55
60
65
70
75
0-4 5-9 10-14 15-19 20-24 25-29 30-34 35-39 40-44 45-49 50-54 55-59 60-64 65-69 70-74 75-79 80-84 85-89 90-94 95-99
Male 2014 Female 2014
Male Average Female Average
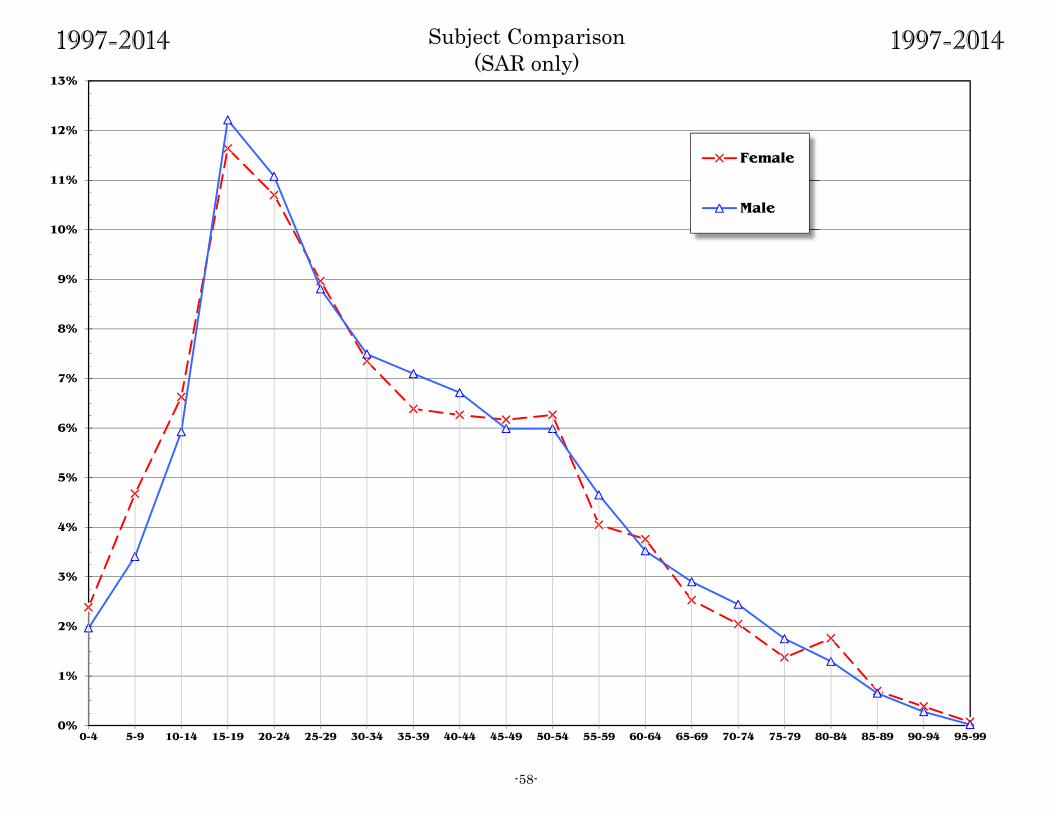
1997-2014 Subject Comparison
(SAR only) 1997-2014
-58-
0%
1%
2%
3%
4%
5%
6%
7%
8%
9%
10%
11%
12%
13%
0-4 5-9 10-14 15-19 20-24 25-29 30-34 35-39 40-44 45-49 50-54 55-59 60-64 65-69 70-74 75-79 80-84 85-89 90-94 95-99
Female
Male
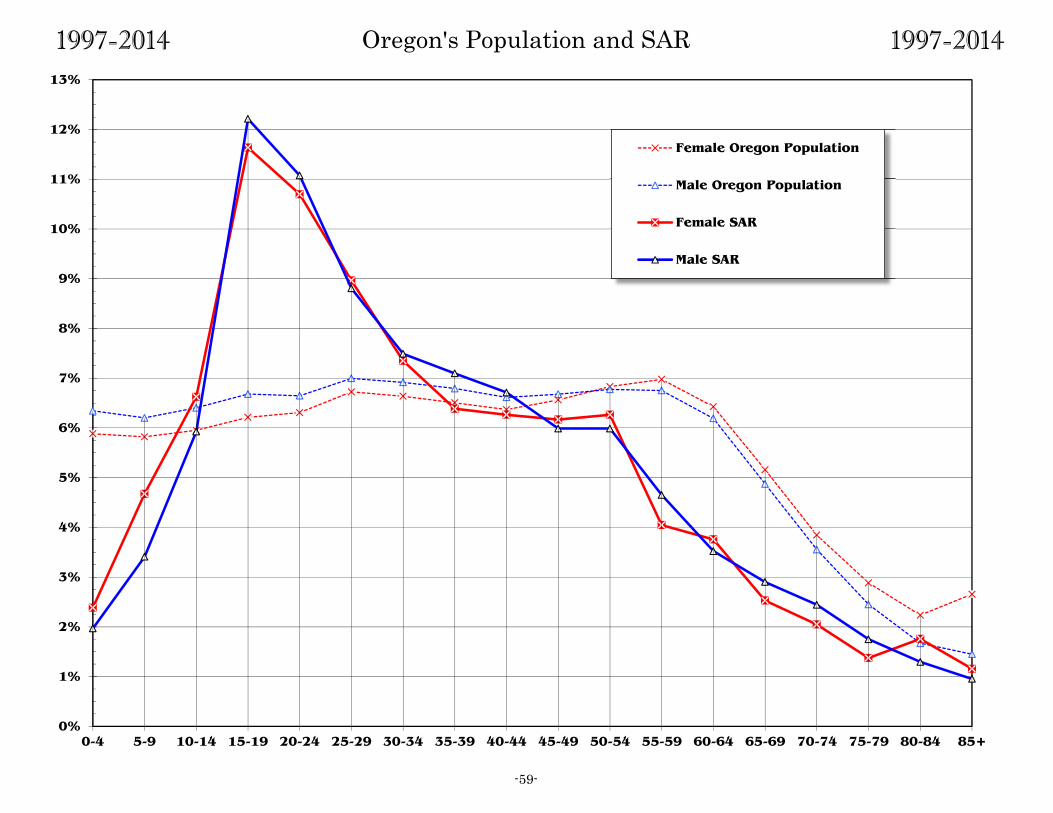
1997-2014 Oregon's Population and SAR 1997-2014
-59-
0%
1%
2%
3%
4%
5%
6%
7%
8%
9%
10%
11%
12%
13%
0-4 5-9 10-14 15-19 20-24 25-29 30-34 35-39 40-44 45-49 50-54 55-59 60-64 65-69 70-74 75-79 80-84 85+
Female Oregon Population
Male Oregon Population
Female SAR
Male SAR
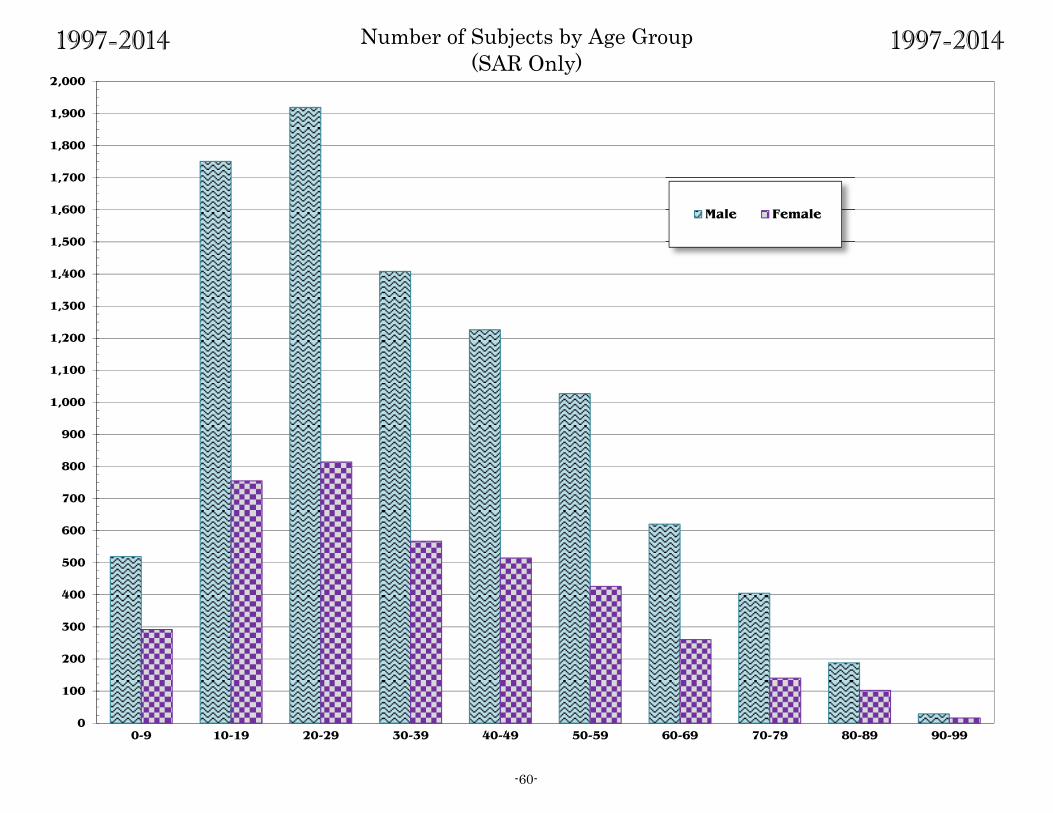
1997-2014 Number of Subjects by Age Group
(SAR Only) 1997-2014
-60-
0
100
200
300
400
500
600
700
800
900
1,000
1,100
1,200
1,300
1,400
1,500
1,600
1,700
1,800
1,900
2,000
0-9 10-19 20-29 30-39 40-49 50-59 60-69 70-79 80-89 90-99
Male Female

1997-2014 Proportion of Subjects by Age Group
(SAR Only) 1997-2014
-61-
0%
10%
20%
30%
40%
50%
60%
70%
80%
90%
100%
0-9 10-19 20-29 30-39 40-49 50-59 60-69 70-79 80-89 90-99
Females
Males
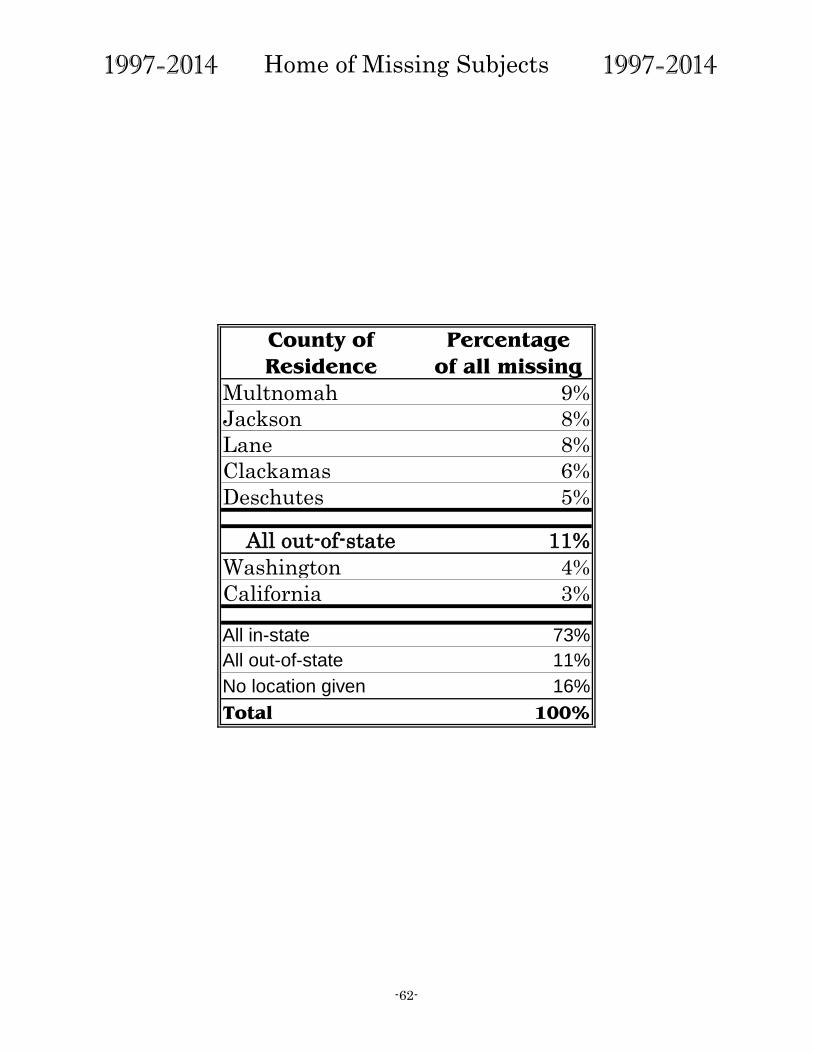
1997-2014 Home of Missing Subjects 1997-2014
County of Percentage
Residence of all missing
Multnomah 9%
Jackson 8%
Lane 8%
Clackamas 6%
Deschutes 5%
All out-of-state 11%
Washington 4%
California 3%
All in-state 73%
All out-of-state 11%
No location given 16%
Total 100%
-62-
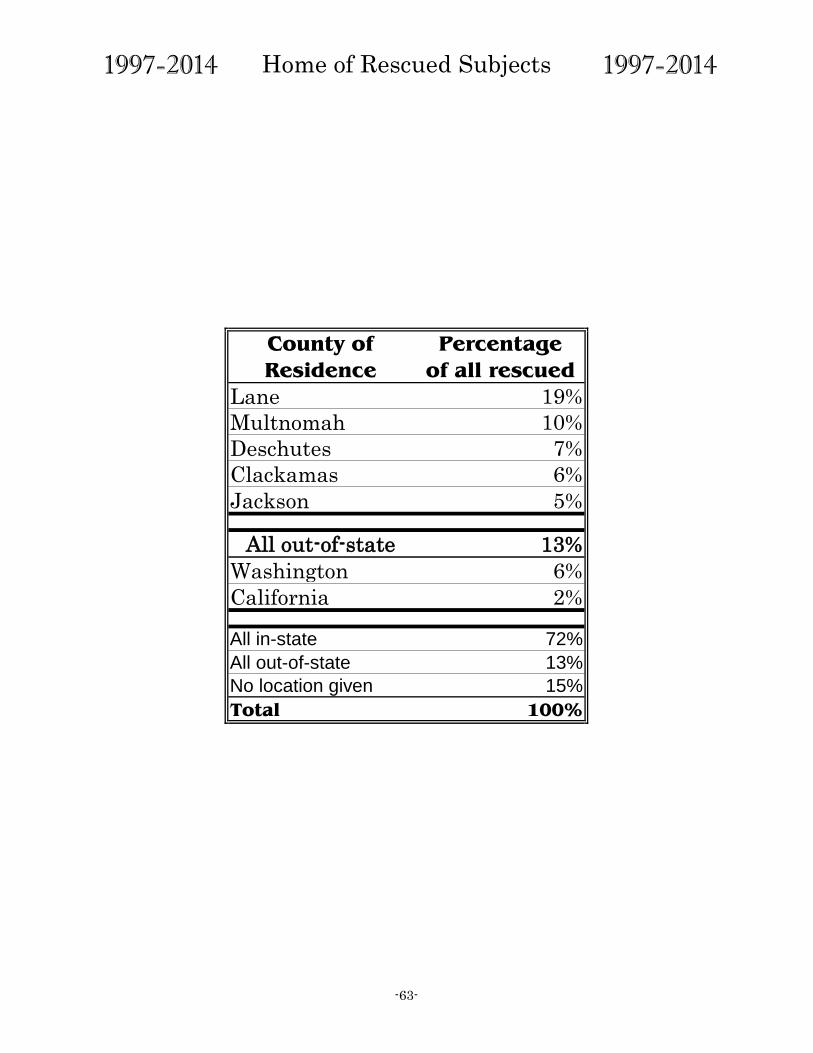
1997-2014 Home of Rescued Subjects 1997-2014
County of Percentage
Residence of all rescued
Lane 19%
Multnomah 10%
Deschutes 7%
Clackamas 6%
Jackson 5%
All out-of-state 13%
Washington 6%
California 2%
All in-state 72%
All out-of-state 13%
No location given 15%
Total 100%
-63-
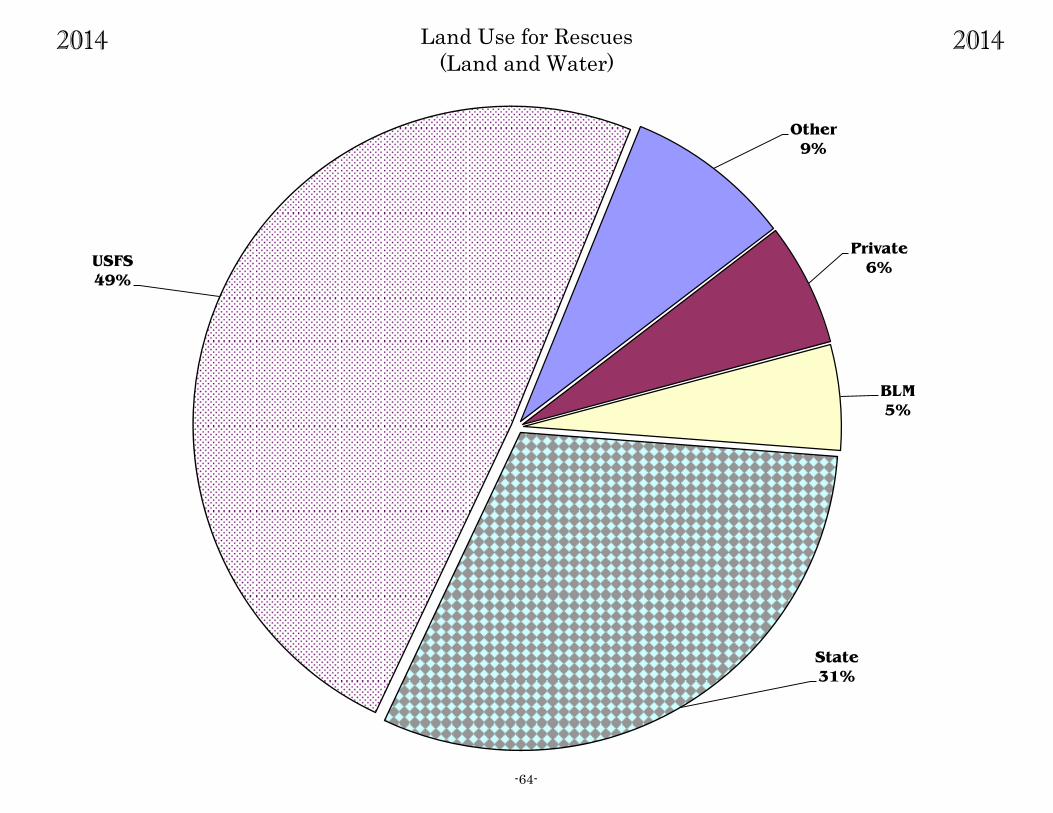
2014 Land Use for Rescues
(Land and Water) 2014
-64-
Other
9%
Private
6%
BLM
5%
State
31%
USFS
49%
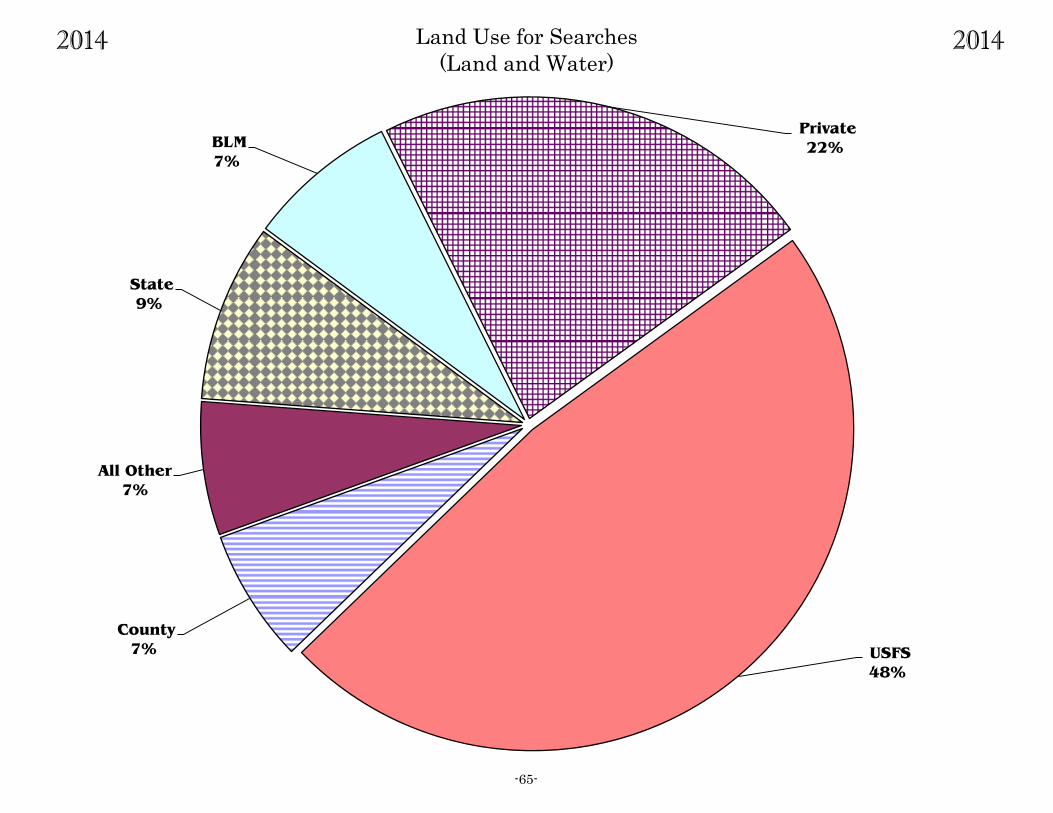
2014 Land Use for Searches
(Land and Water) 2014
-65-
County
7%
All Other
7%
State
9%
BLM
7%
Private
22%
USFS
48%
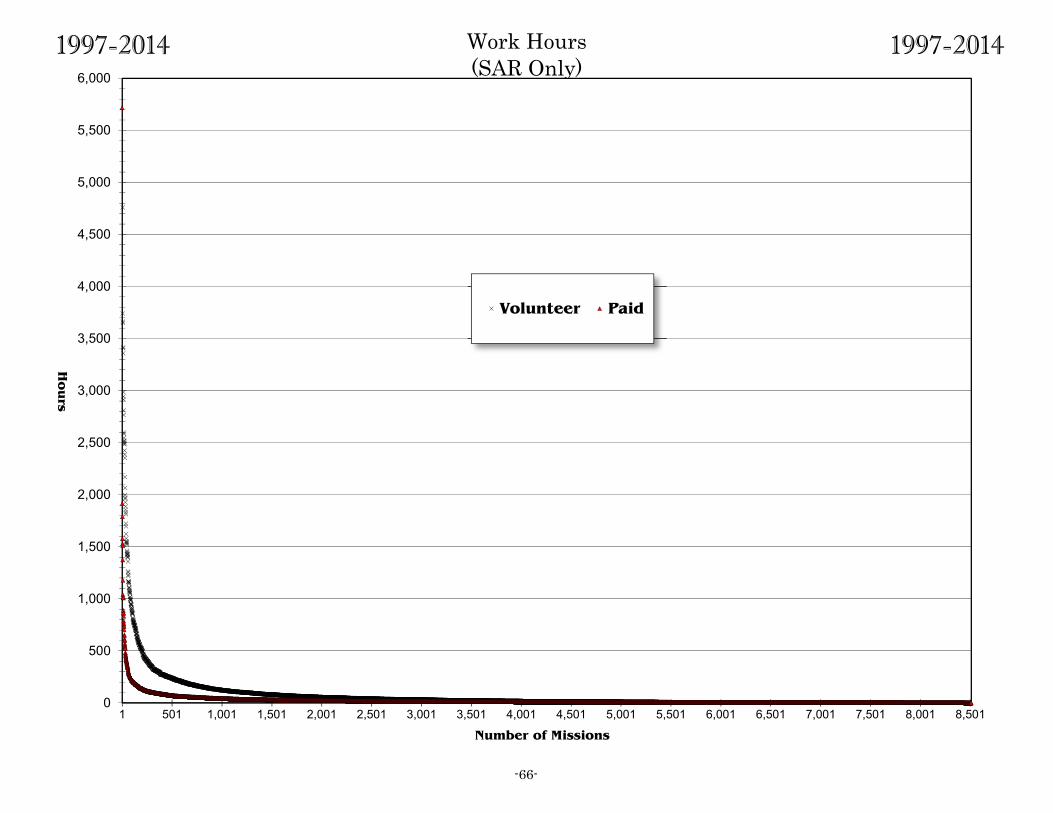
1997-2014 Work Hours
(SAR Only) 1997-2014
-66-
0
500
1,000
1,500
2,000
2,500
3,000
3,500
4,000
4,500
5,000
5,500
6,000
1 501 1,001 1,501 2,001 2,501 3,001 3,501 4,001 4,501 5,001 5,501 6,001 6,501 7,001 7,501 8,001 8,501
Hou
rs
Number of Missions
Volunteer Paid
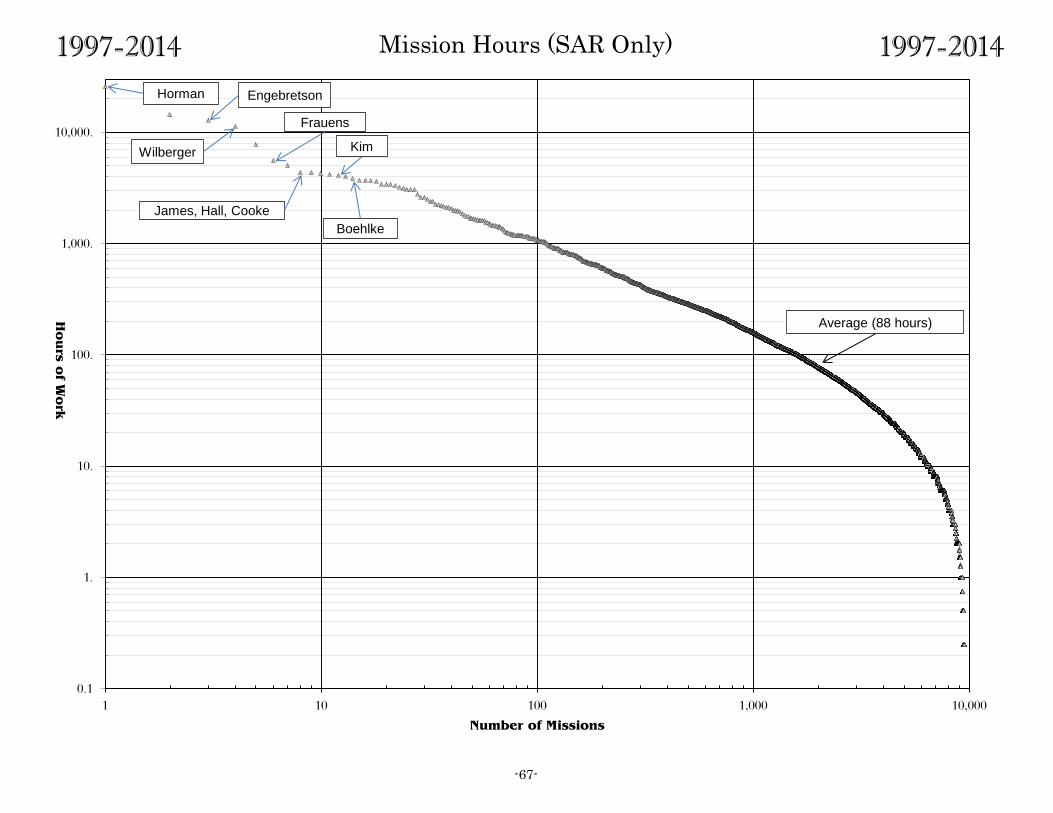
1997-2014 Mission Hours (SAR Only) 1997-2014
-67-
0.1
1.
10.
100.
1,000.
10,000.
1 10 100 1,000 10,000
Hou
rs of W
ork
Number of Missions
Horman
Wilberger
Engebretson
Frauens
James, Hall, Cooke
Kim
Boehlke
Average (88 hours)
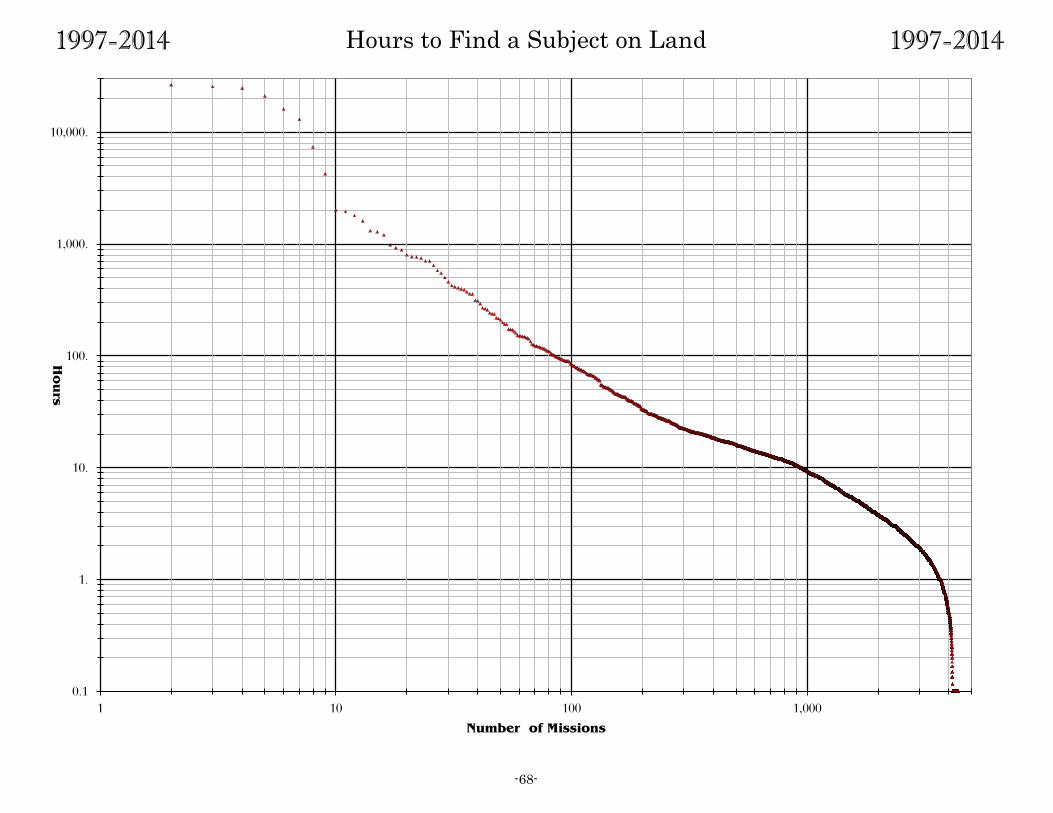
1997-2014 Hours to Find a Subject on Land 1997-2014
-68-
0.1
1.
10.
100.
1,000.
10,000.
1 10 100 1,000
Hou
rs
Number of Missions
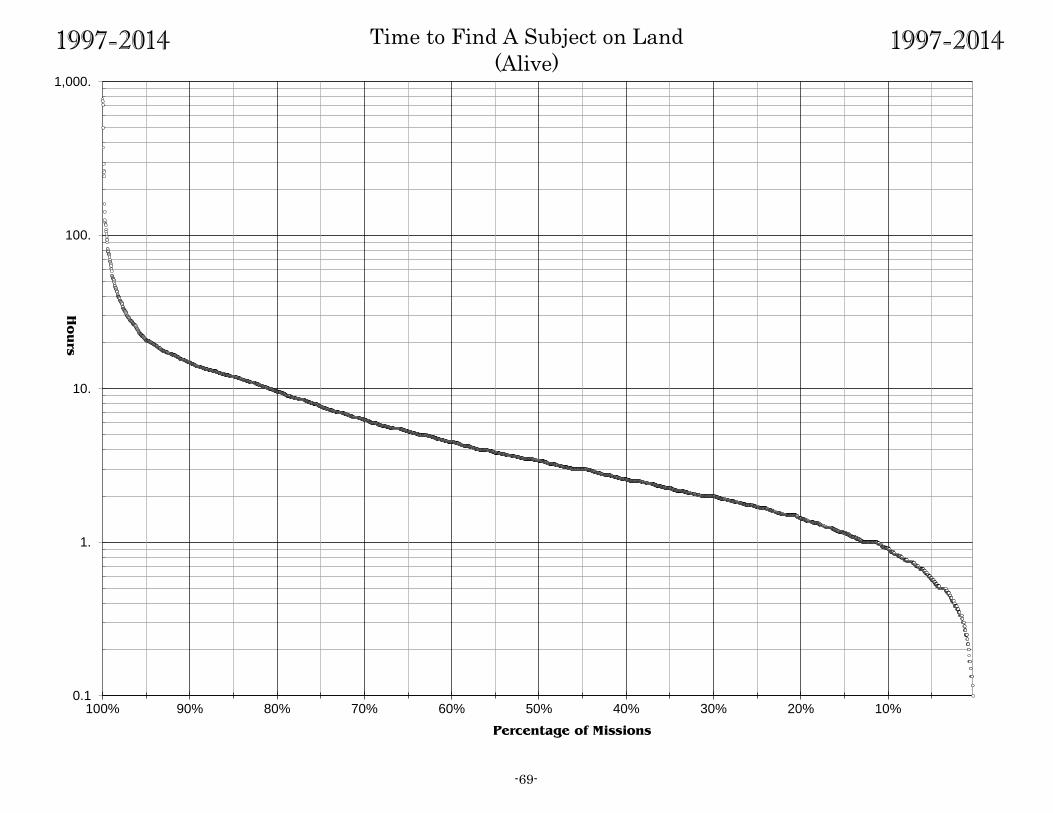
1997-2014 Time to Find A Subject on Land
(Alive) 1997-2014
-69-
0.1
1.
10.
100.
1,000.
100% 90% 80% 70% 60% 50% 40% 30% 20% 10%
Hou
rs
Percentage of Missions
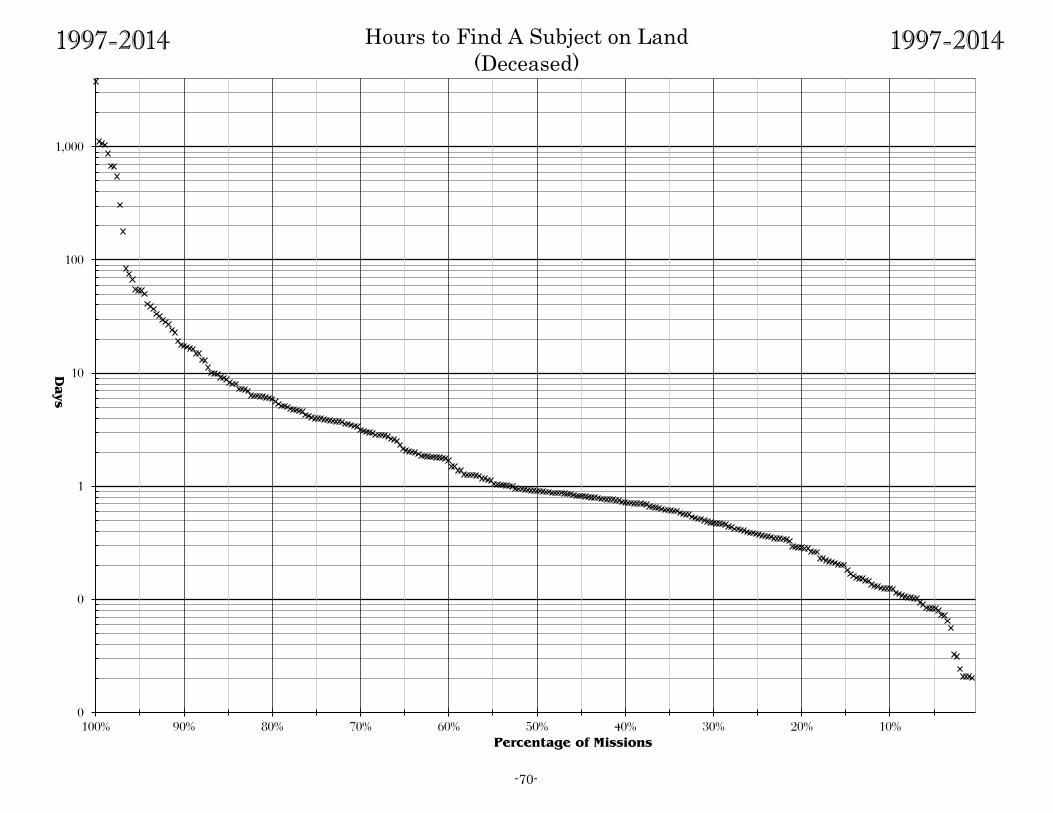
1997-2014 Hours to Find A Subject on Land
(Deceased) 1997-2014
-70-
0
0
1
10
100
1,000
100% 90% 80% 70% 60% 50% 40% 30% 20% 10%
Days
Percentage of Missions
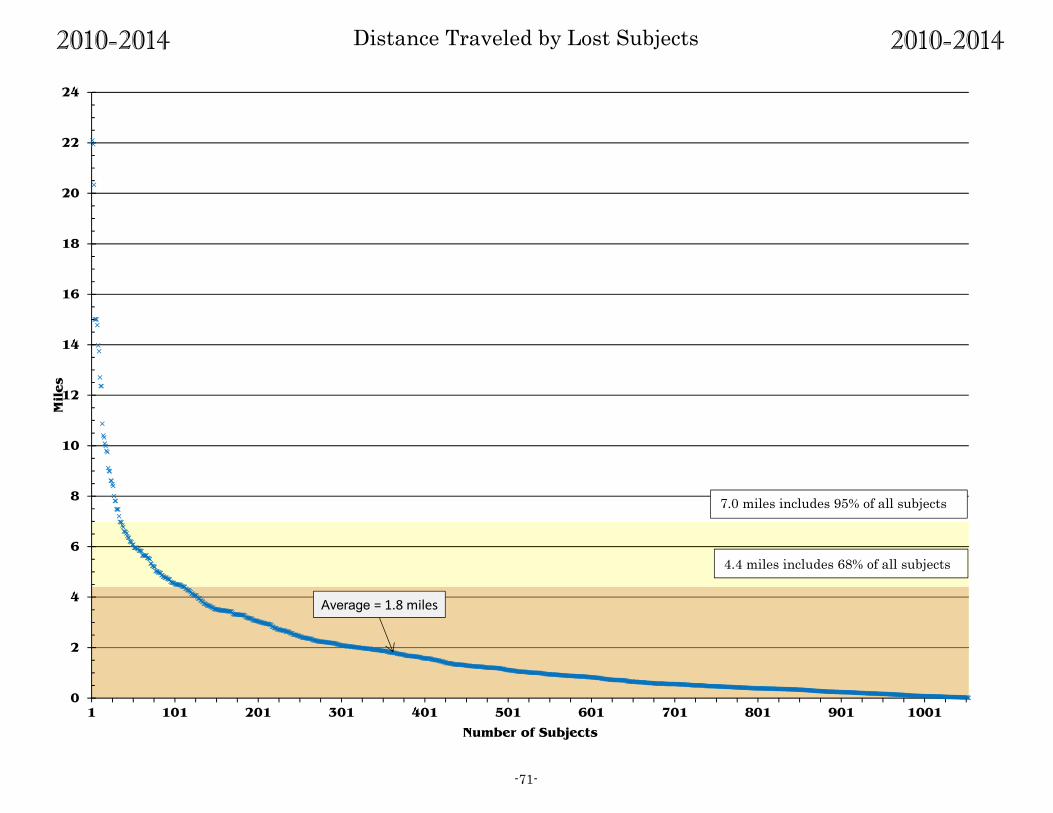
2010-2014 Distance Traveled by Lost Subjects 2010-2014
-71-
0
2
4
6
8
10
12
14
16
18
20
22
24
1 101 201 301 401 501 601 701 801 901 1001
Miles
Number of Subjects
4.4 miles includes 68% of all subjects
7.0 miles includes 95% of all subjects
Average = 1.8 miles
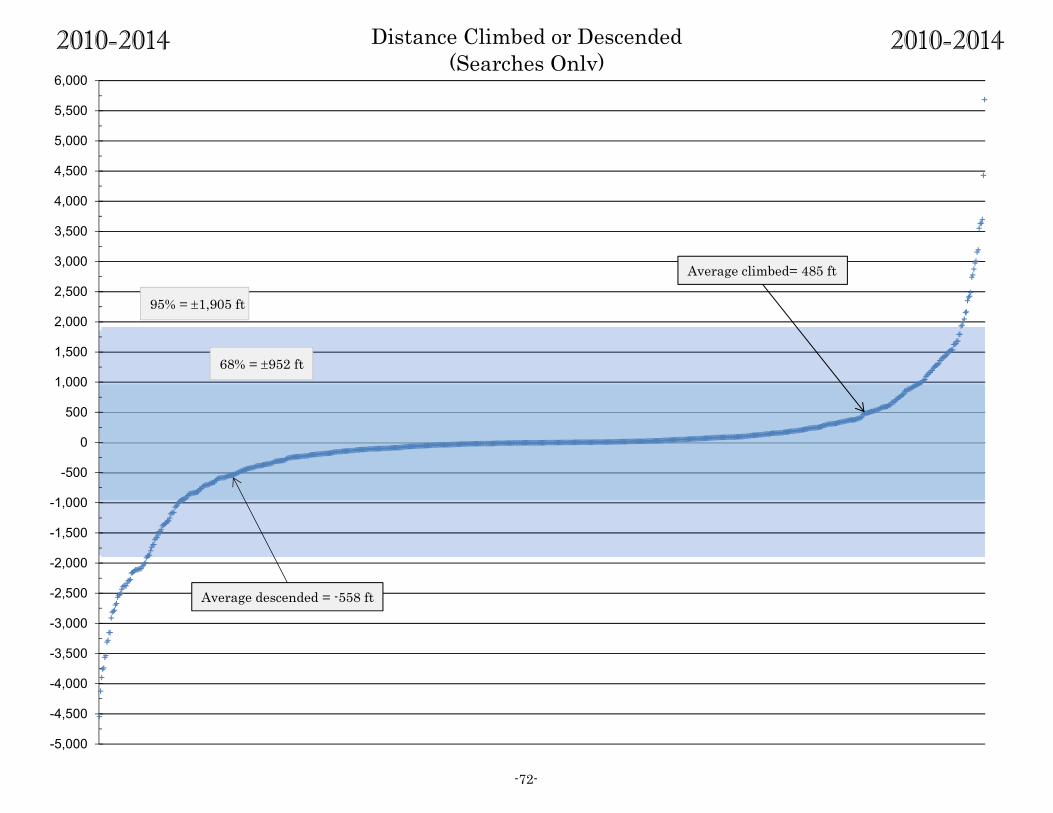
2010-2014 Distance Climbed or Descended
(Searches Only) 2010-2014
-72-
-5,000
-4,500
-4,000
-3,500
-3,000
-2,500
-2,000
-1,500
-1,000
-500
0
500
1,000
1,500
2,000
2,500
3,000
3,500
4,000
4,500
5,000
5,500
6,000
68% = 952 ft
95% = 1,905 ft
Average descended = -558 ft
Average climbed= 485 ft
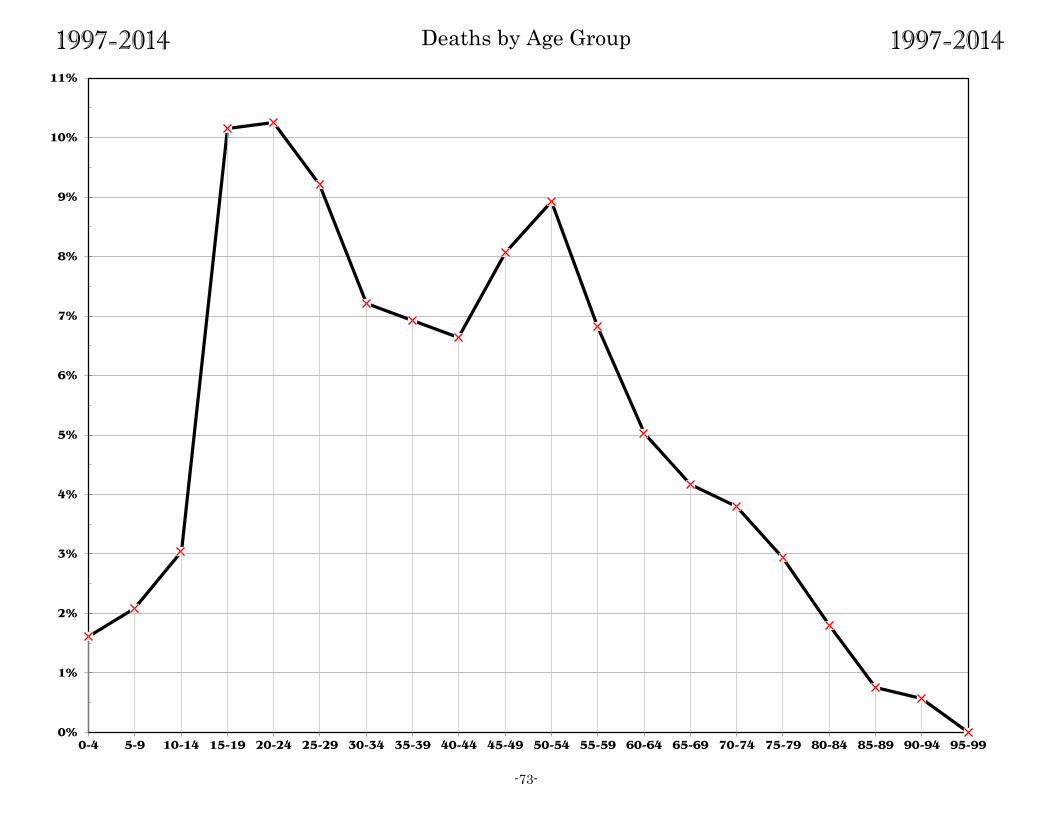
1997-2014 Deaths by Age Group 1997-2014
-73-
0%
1%
2%
3%
4%
5%
6%
7%
8%
9%
10%
11%
0-4 5-9 10-14 15-19 20-24 25-29 30-34 35-39 40-44 45-49 50-54 55-59 60-64 65-69 70-74 75-79 80-84 85-89 90-94 95-99
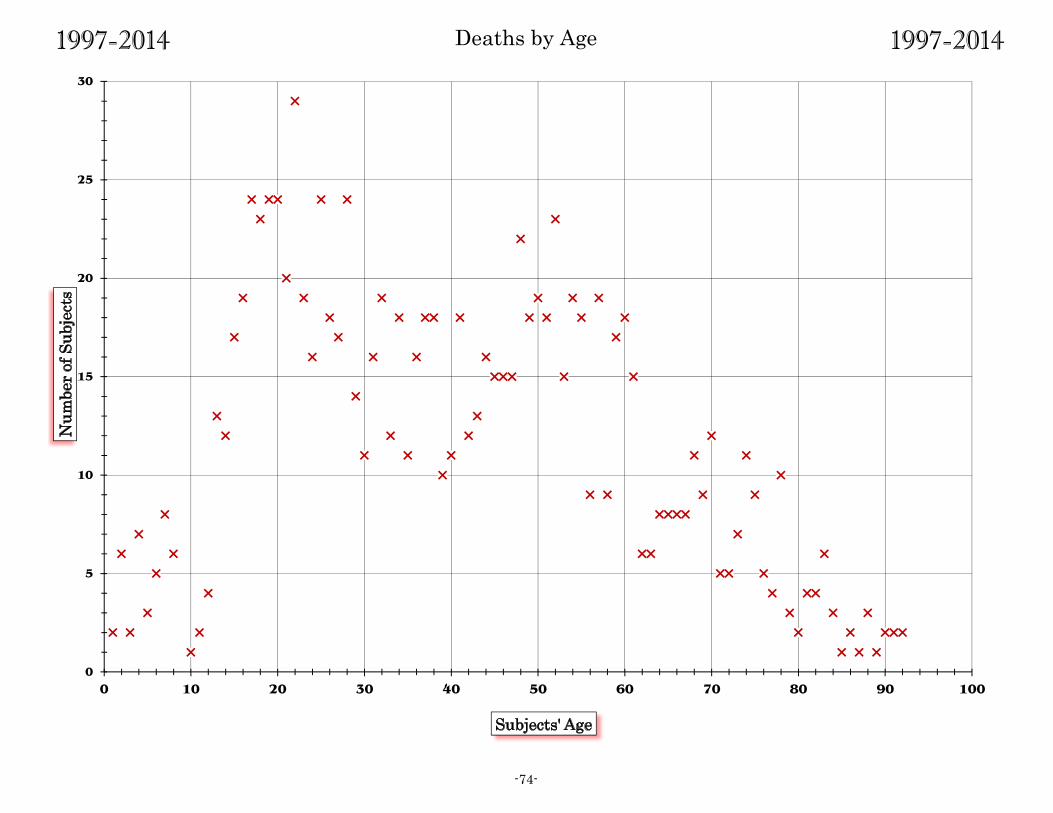
1997-2014 Deaths by Age 1997-2014
-74-
0
5
10
15
20
25
30
0 10 20 30 40 50 60 70 80 90 100
15
Nu
mb
er
of
Su
bje
cts
Subjects' Age
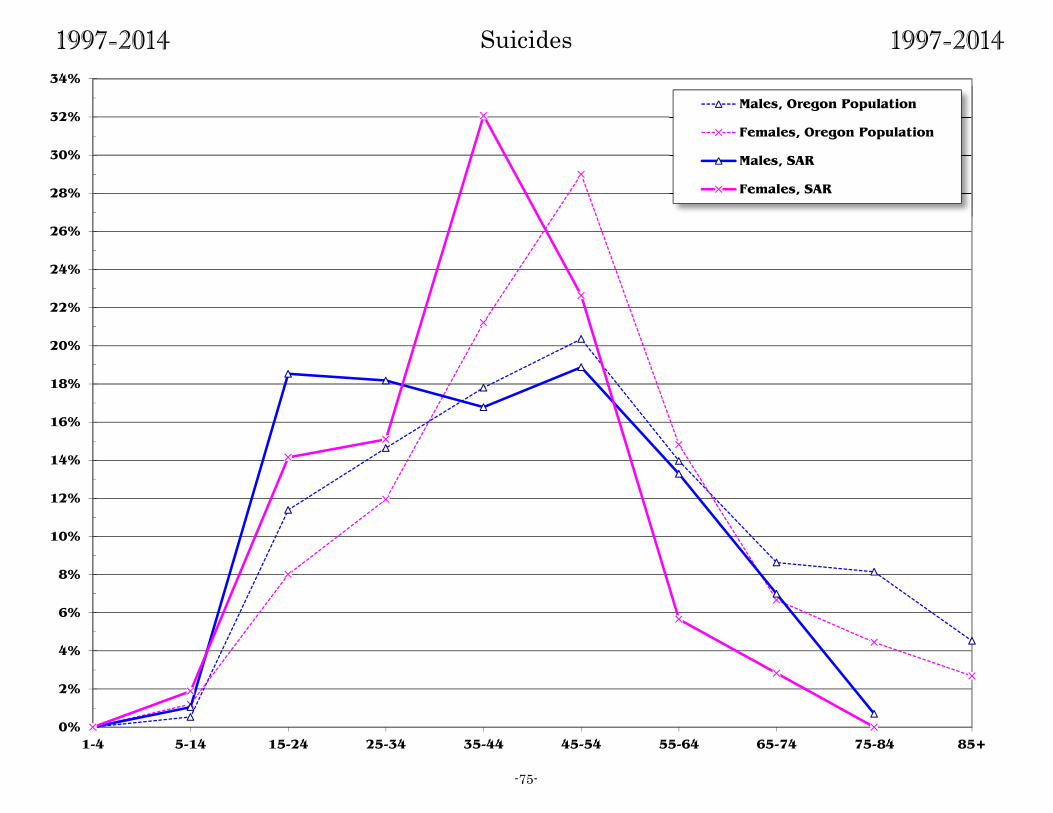
1997-2014 Suicides 1997-2014
-75-
0%
2%
4%
6%
8%
10%
12%
14%
16%
18%
20%
22%
24%
26%
28%
30%
32%
34%
1-4 5-14 15-24 25-34 35-44 45-54 55-64 65-74 75-84 85+
Males, Oregon Population
Females, Oregon Population
Males, SAR
Females, SAR
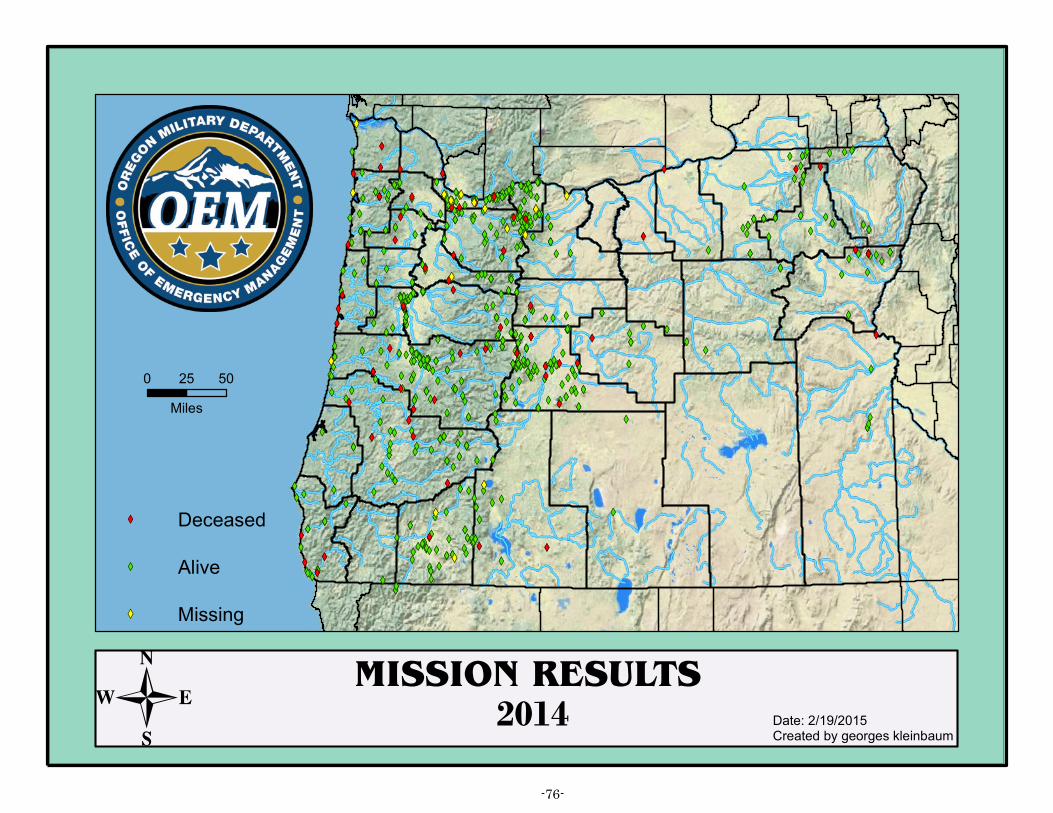
XWXW
XW
XW
XW
XWXWXWXWXWXW
XW
XW
XW
XW
XWXW
XW
XW
XWXWXWXW
XW
XWXWXWXW
XWXW XW
XW
XW
XW
XW
XWXW
XWXWXWXWXW
XWXW
XWXW
XW
XW
XW
XW
XW
XW
XW XW
XW
XW
XWXWXWXWXWXW
XW
XWXW
XWXW
XW
XW
XW
XW
XW
XW
XW
XWXW
XW
XW
XWXWXWXWXWXW
XWXW
XWXW
XW
XW
XW
XW
XW
XWXWXW
XW
XWXWXW
XW
XWXWXWXW
XW
XW
XW
XWXW
XW
XW
XW
XW
XW
XW
XW
XW
XWXW
XW
XW
XWXW
XWXWXWXW
XW
XW
XW
XWXWXW
XWXW
XWXW
XWXW
XW
XW
XW
XW
XW
XWXW
XW XW
XW
XW
XW
XW
XW
XW
XWXW
XW
XW
XWXWXWXW
XW
XW
XW
XW
XW
XW
XW
XW
XWXW
XWXW
XW
XW
XW
XWXW
XW
XW XW
XWXWXW
XWXW
XWXW
XWXW
XW
XW
XW
XW
XW
XW
XWXWXW
XWXW
XW
XW
XWXW
XWXW
XW
XWXW
XW
XW
XWXW
XWXW
XWXW
XW
XW
XW
XWXW
XW
XWXWXW
XW
XW
XW
XW
XW
XW
XW
XW
XW XW
XW
XW
XW
XW
XW
XW
XW
XW
XW
XWXWXW
XWXW
XW
XW
XWXWXWXWXW
XW
XW
XW
XW
XW
XWXW
XW
XWXWXWXWXW
XW
XW
XWXW
XWXWXW XWXWXW
XWXW
XWXWXWXWXWXWXWXWXWXWXWXW
XW
XW
XW
XW
XWXWXWXW
XWXW
XW
XW
XWXWXW
XW
XWXW
XW
XW
XW
XW
XWXWXW
XW
XWXW
XW
XW
XW
XW
XW
XW
XWXW
XW
XW
XWXW
XWXW
XW
XW
XWXW
XW
XWXWXW
XW
XW
XW
XW
XWXW
XWXWXWXWXWXWXWXWXWXWXW
XW
XWXW
XWXW
XWXW
XWXW
XWXWXW
XW
XW
XW
XWXW
XW
XWXW
XWXW
XWXW
XWXWXW XW
XW
XWXW
XW
XWXWXWXW
XWXWXW
XW
XW
XW
XW
XW
XW
XWXW
XWXW
XWXWXWXW
XW
XWXW
XWXW
XW
XW
XWXWXW
XWXW
XW
XWXW
XW
XWXWXW
XWXWXW
XWXWXW
XWXW
XWXW
XWXWXW
XW
XW
XW
XWXW
XW
XW
XW
XW
XWXW
XWXW
XW
XWXWXWXWXW
XW
XW
XW
XW
XWXWXW
XWXWXWXWXWXWXWXWXW
XWXW
XWXWXWXWXWXW
XW
XW
XW
XWXW
XW
XW XW
XW
XWXWXW XWXW
XWXW
XW
XW
XWXW
XW
XWXWXWXW
XW
XWXW
XW
XWXW
XW
XW
XW
XWXW
XWXWXW
XW
XW
XW
XW
XW
XW
XW
XWXWXW
XWXWXW
XWXWXW
XWXW
XW
XWXW
XWXWXW
XW
XW
XW
XW
XW
XWXW
XW
XW
XW
XW
XW
XW
XW
XWXW
XWXW
XW
XWXWXW
XWXWXW
XW
XW
XW
XWXW
XW
XWXWXWXW
XWXW
XWXW
XWXWXWXWXWXWXWXW
XW
XW
XW
XW
XW
XWXW
XW
XWXW
XWXW
XW
XW
XW
XWXW
XW
XWXW
XW
XW
XWXWXW
XW
XW
XWXW XWXWXWXW
XWXWXW
XWXW
XWXW
XWXWXWXW
XW
XW
XW
XW
XWXWXWXWXWXW
XWXWXW
XWXW
XWXW
XW
XW
XWXWXW
XW
XWXWXW
XW
XW
XW
XW
XWXWXWXWXW
XW XW
XWXW
XWXW
XW
XWXW
XWXW
XWXW
XWXW
XW
XW
XWXWXWXW
XW
XW
XW
XW
XW
XWXW
XW
XW
XW
XW
XWXWXW
XW
XW
XW
XW
XW XW
XW
XW
XW
XW
XW
XW
XW
XW
XW
XW
XW
XWXWXW
XW
XW
XW
XW
XW
XW XW
XW
XW
XW
XW
XW
XW
XW
XW
XW
XW
XWXW
XW
XW
XW
XW
XW
XW
XW
XW
XW
XW
XW
XW
XW
XW
XW
XW
XW
XWXW
XW
XWXWXW
XW
XW
XWXW XWXW
XW
XW
XW
XW
XW
XW
XW
XWXW
XW
XW
XW
XW
XW
XW
MISSION RESULTS
XW Deceased
XW Alive
XW Missing
0 5025
Miles
Date: 2/19/2015Created by georges kleinbaum
2014-76-
-

Total transportation use and work hours for aviation missions
AVIATION 20142014
Helicopter Helicopter
Military Helicopter 6 Military Helicopter
Plane Plane
Military Plane Military Plane
Snowmobile Snowmobile
Snowcat Snowcat
ATV 28 ATV
Motorcycle Motorcycle
Boat 9 Boat
4-Wheel drive 4-Wheel drive 500
Specialized vehicles Specialized vehicles 8
Other 2-wheel drive 2 Other 2-wheel drive
Other equipment Other equipment
HOURS MILES
TRANSPORTATION
HOURS OF PAID WORK
CAP Divers
BLM Forest Service Other Feds 84
Explorers Mt Rescue Dog team
Jeep club Ski patrol Horse team
Fire Service 8 Law Enforcement 41 State Agency
Other
HOURS OF VOLUNTEER WORK
Amateur radio
CAP Divers 38
BLM Forest Service Other Feds
Explorers Mt Rescue Dog team
Jeep club Horse team
Fire Service 126 Law Enforcement State Agency
Other
Ski patrol
UNBUDGETED COSTS FOR SEARCH AND RESCUE
Food $0.00 Fuel $0.00 Lodging $0.00 Other $0.00
Total Transportation Hours 45
Total Transportation Miles 508
Total Paid Hours 135
Total Volunteer Hours 283
Total Costs $0.00
Sheriff's SAR 2
Sheriff's SAR 119
-77-
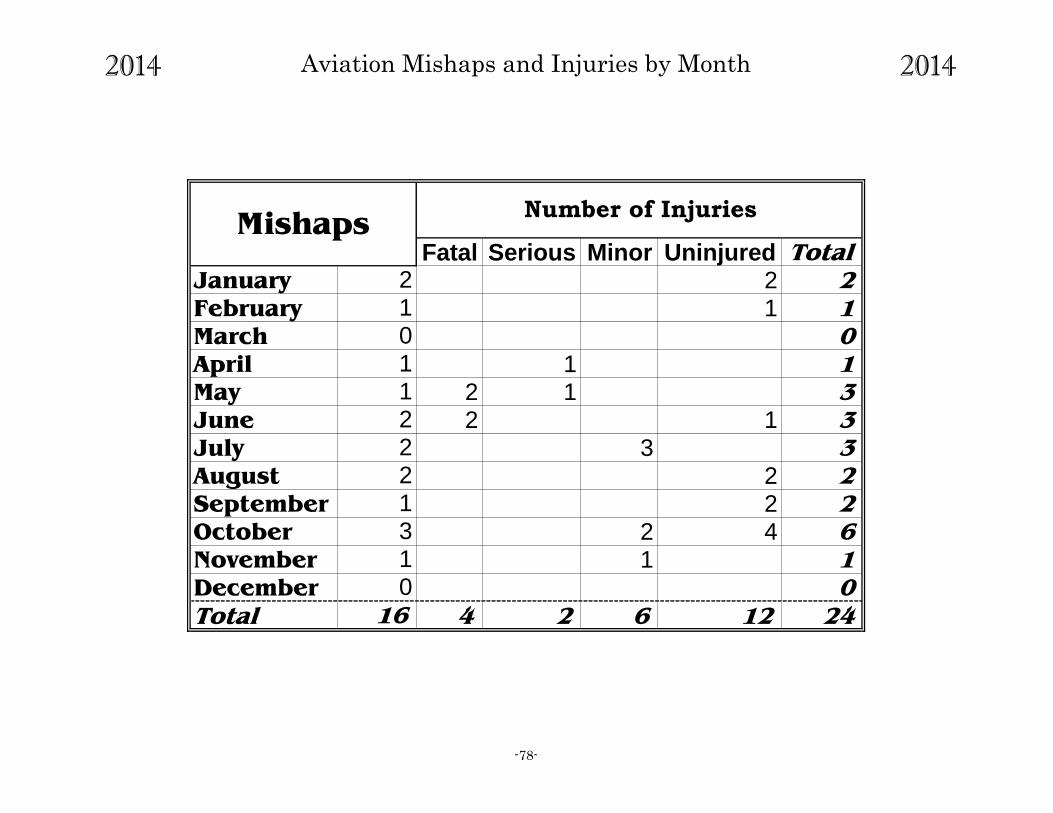
2014 Aviation Mishaps and Injuries by Month 2014
Fatal Serious Minor Uninjured Total
January 2 2
February 1 1
March 0
April 1 1
May 2 1 3
June 2 1 3
July 3 3
August 2 2
September 2 2
October 2 4 6
November 1 1
December 0
Total 4 2 6 12 2416
Mishaps
2213
0112
Number of Injuries
21
10
-78-
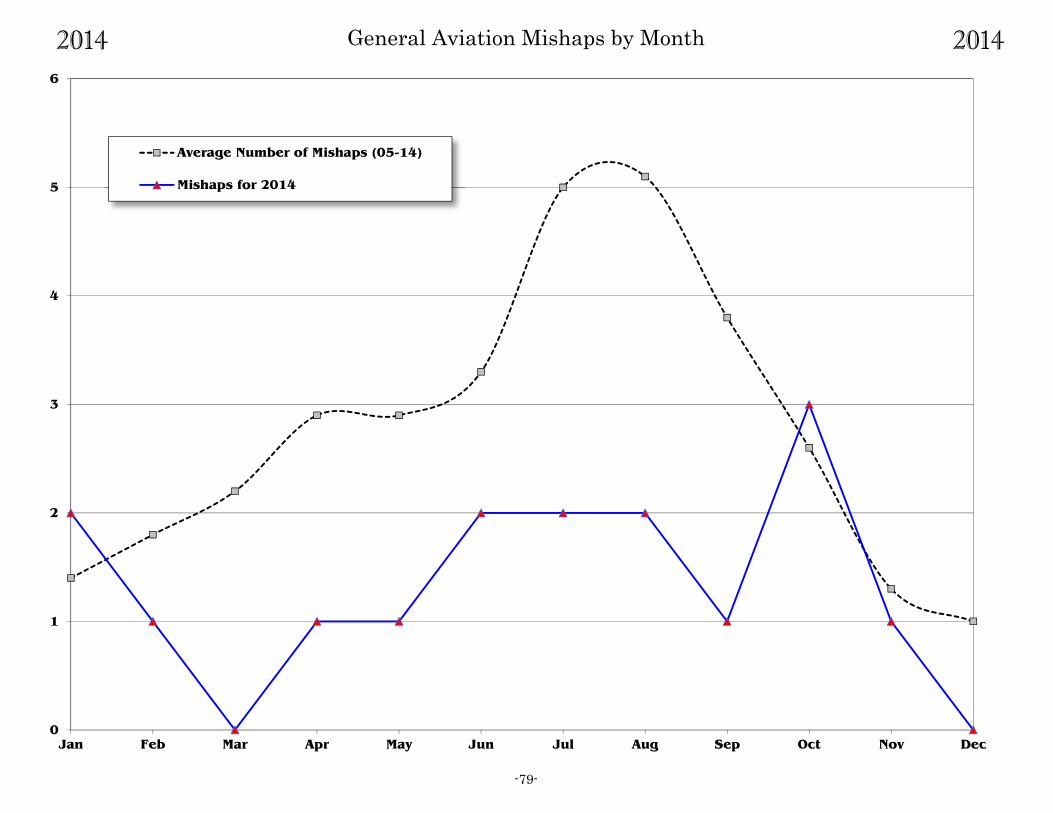
2014 General Aviation Mishaps by Month 2014
-79-
0
1
2
3
4
5
6
Jan Feb Mar Apr May Jun Jul Aug Sep Oct Nov Dec
Average Number of Mishaps (05-14)
Mishaps for 2014
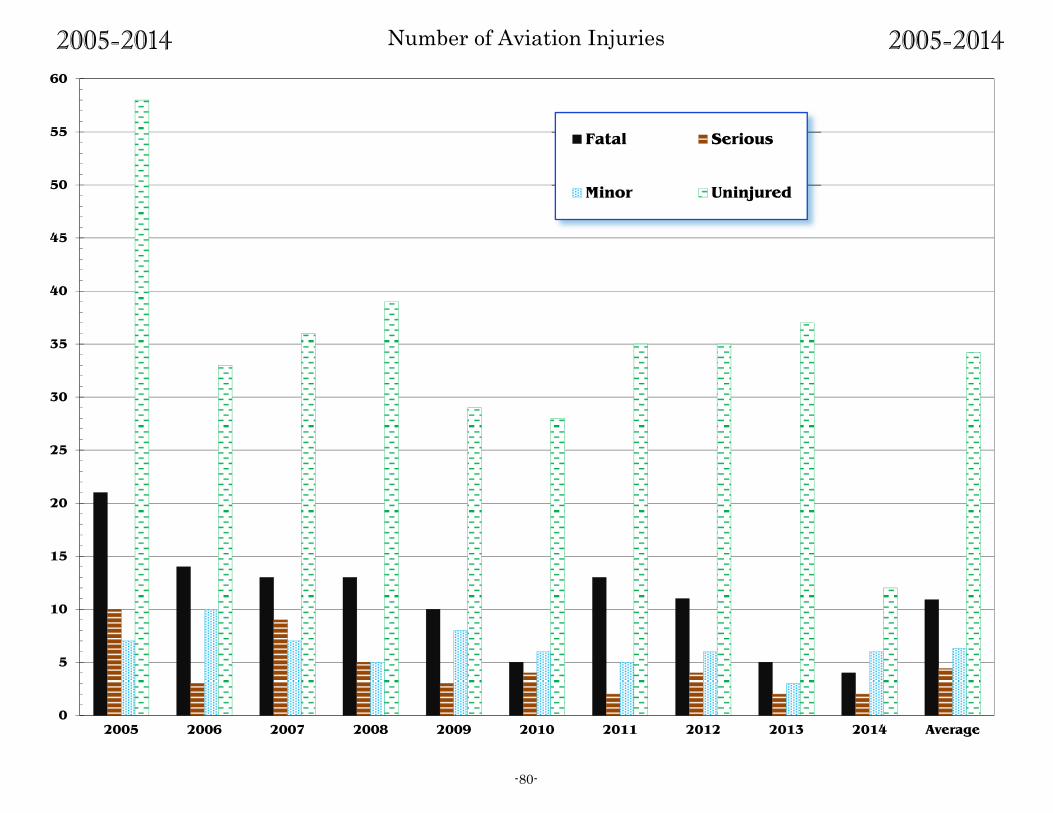
2005-2014 Number of Aviation Injuries 2005-2014
-80-
0
5
10
15
20
25
30
35
40
45
50
55
60
2005 2006 2007 2008 2009 2010 2011 2012 2013 2014 Average
Fatal Serious
Minor Uninjured
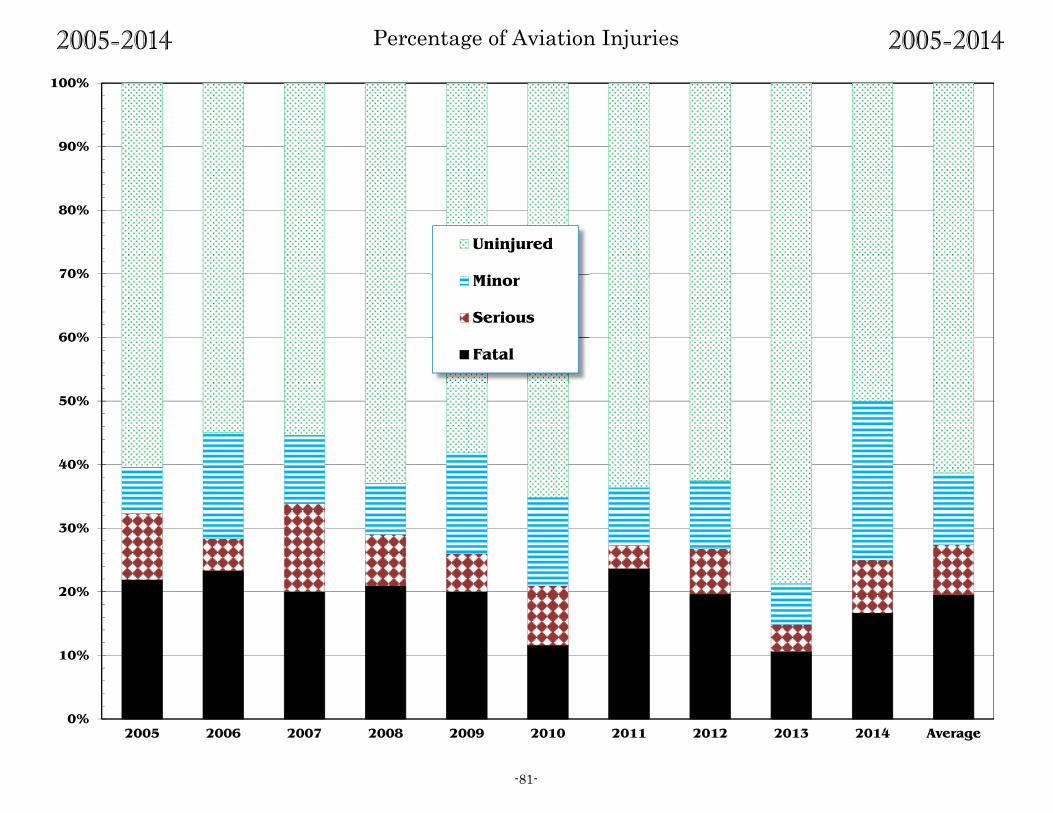
2005-2014 Percentage of Aviation Injuries 2005-2014
-81-
0%
10%
20%
30%
40%
50%
60%
70%
80%
90%
100%
2005 2006 2007 2008 2009 2010 2011 2012 2013 2014 Average
Uninjured
Minor
Serious
Fatal
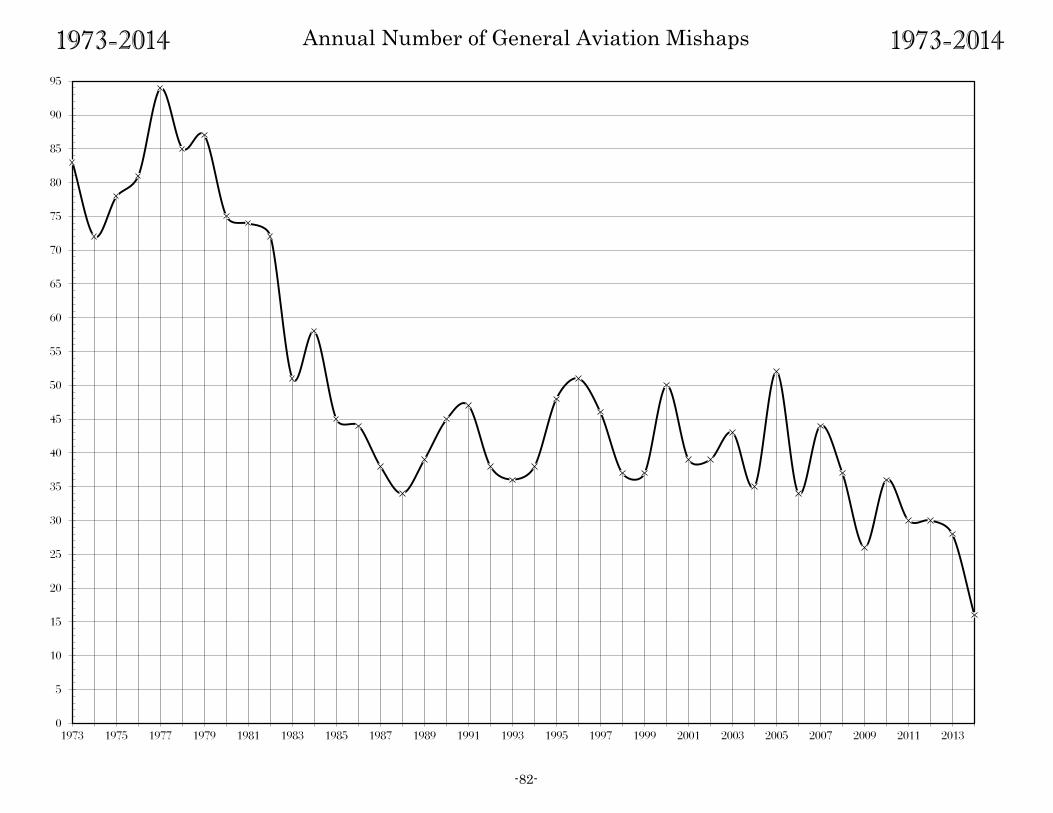
1973-2014 Annual Number of General Aviation Mishaps 1973-2014
-82-
0
5
10
15
20
25
30
35
40
45
50
55
60
65
70
75
80
85
90
95
1973 1975 1977 1979 1981 1983 1985 1987 1989 1991 1993 1995 1997 1999 2001 2003 2005 2007 2009 2011 2013
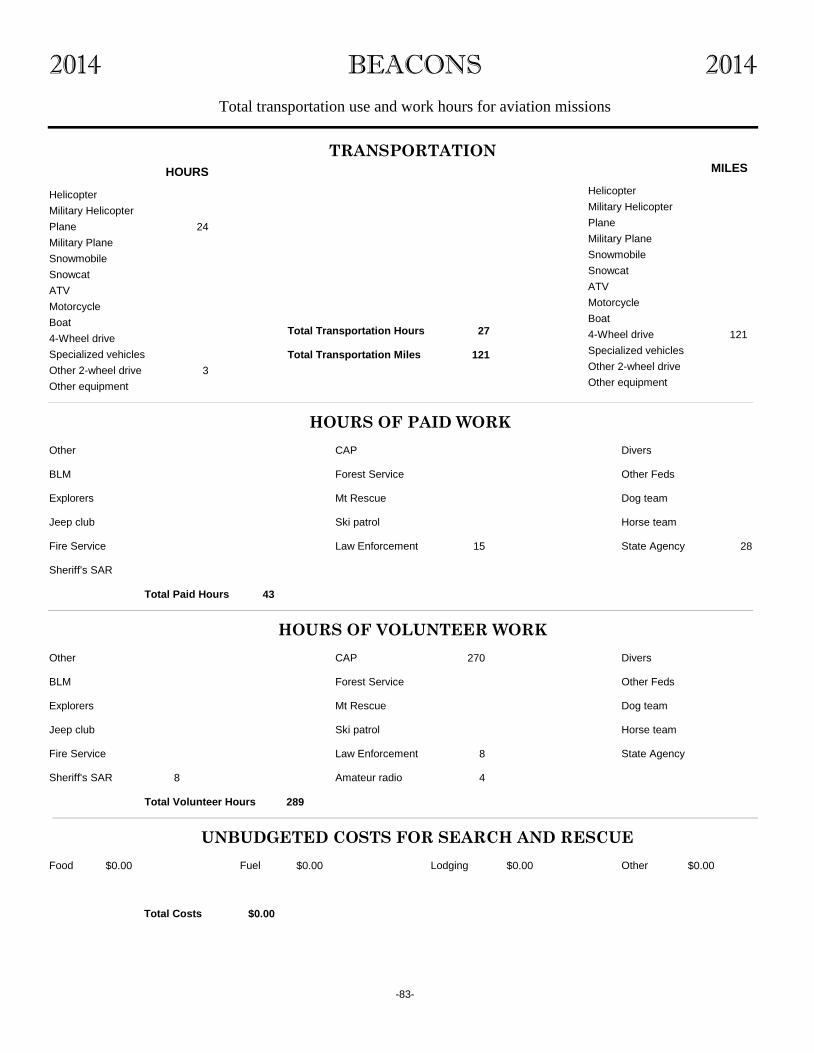
Total transportation use and work hours for aviation missions
BEACONS 20142014
Helicopter Helicopter
Military Helicopter Military Helicopter
Plane 24 Plane
Military Plane Military Plane
Snowmobile Snowmobile
Snowcat Snowcat
ATV ATV
Motorcycle Motorcycle
Boat Boat
4-Wheel drive 4-Wheel drive 121
Specialized vehicles Specialized vehicles
Other 2-wheel drive 3 Other 2-wheel drive
Other equipment Other equipment
HOURS MILES
TRANSPORTATION
HOURS OF PAID WORK
CAP Divers
BLM Forest Service Other Feds
Explorers Mt Rescue Dog team
Jeep club Ski patrol Horse team
Fire Service Law Enforcement 15 State Agency 28
Other
HOURS OF VOLUNTEER WORK
Amateur radio 4
CAP 270 Divers
BLM Forest Service Other Feds
Explorers Mt Rescue Dog team
Jeep club Horse team
Fire Service Law Enforcement 8 State Agency
Other
Ski patrol
UNBUDGETED COSTS FOR SEARCH AND RESCUE
Food $0.00 Fuel $0.00 Lodging $0.00 Other $0.00
Total Transportation Hours 27
Total Transportation Miles 121
Total Paid Hours 43
Total Volunteer Hours 289
Total Costs $0.00
Sheriff's SAR
Sheriff's SAR 8
-83-
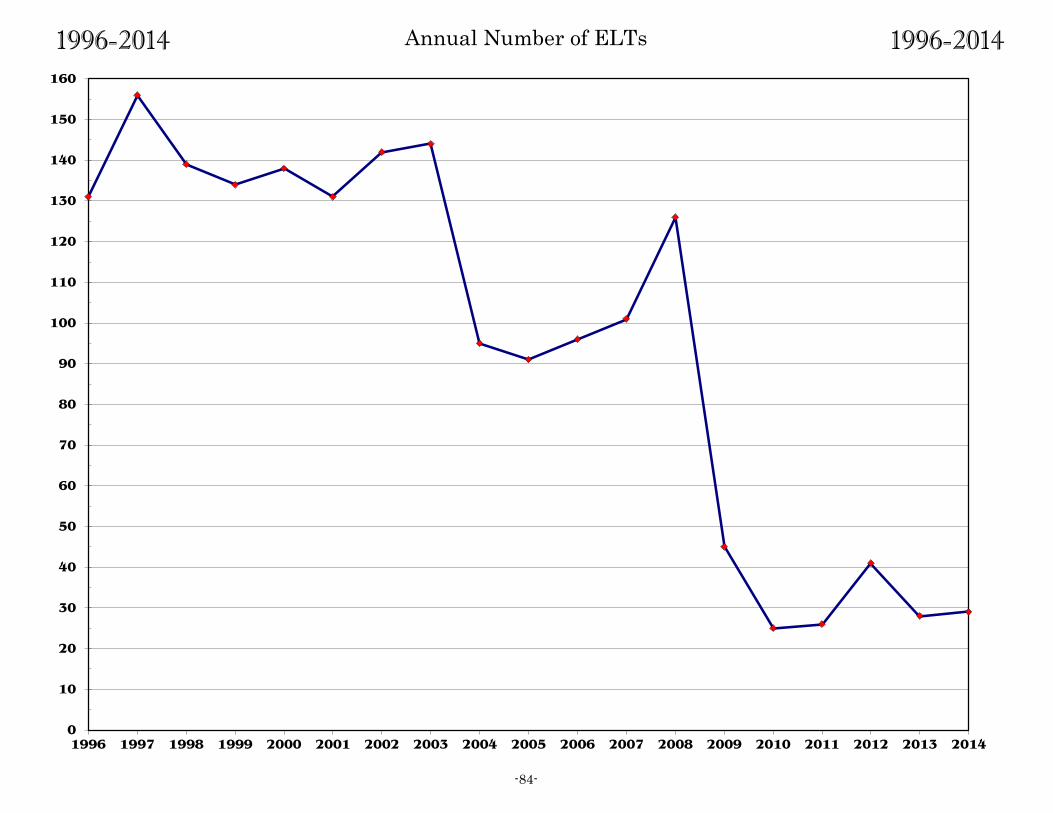
1996-2014 Annual Number of ELTs 1996-2014
-84-
0
10
20
30
40
50
60
70
80
90
100
110
120
130
140
150
160
1996 1997 1998 1999 2000 2001 2002 2003 2004 2005 2006 2007 2008 2009 2010 2011 2012 2013 2014

2014 ELTs per Month by County 2014
County Jan Feb Mar Apr May Jun Jul Aug Sep Oct Nov Dec Total
Clackamas 1 1
Clatsop 1 1
Columbia 1 1
Deschutes 1 2 1 1 1 6
Grant 1 1
Hood River 1 1
Jackson 2 1 1 1 5
Klamath 1 1 2
Lane 1 1 2
Malheur 1 1
Marion 1 1
Multnomah 1 1 2
Region 1 1 2
Union 1 1
Yamhill 1 1 2
Total 3 2 4 1 2 3 3 1 2 6 1 1 29
-85-
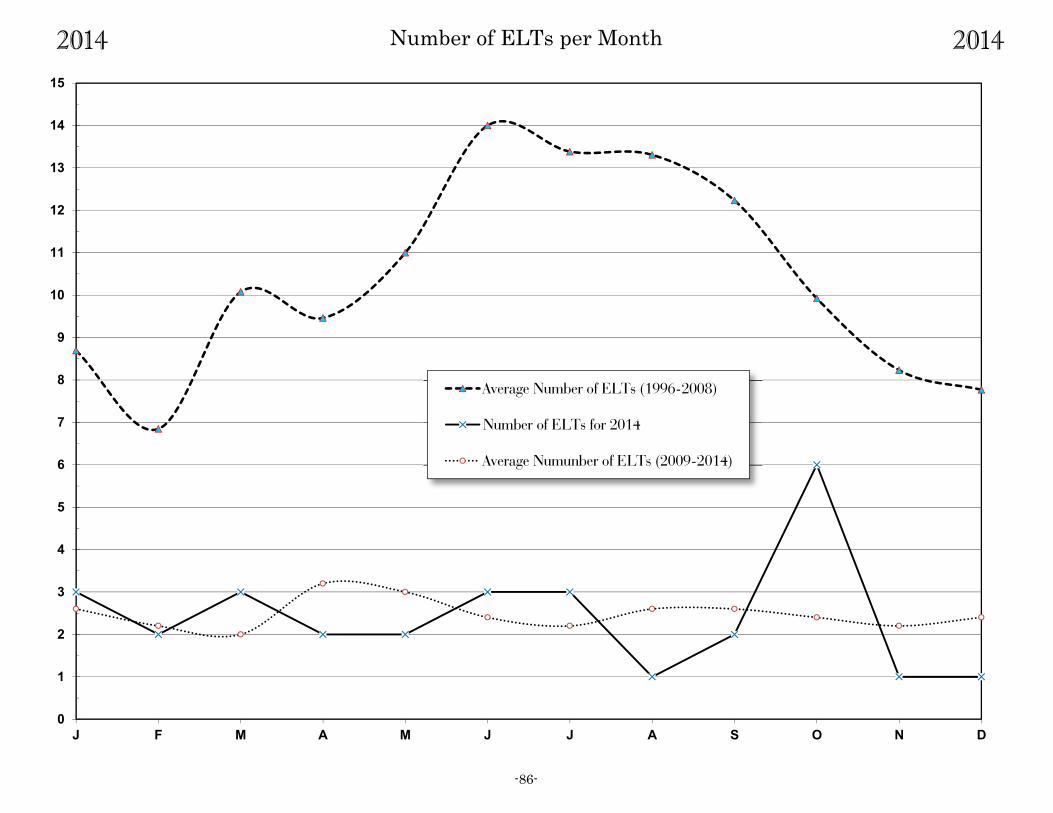
2014 Number of ELTs per Month 2014
-86-
0
1
2
3
4
5
6
7
8
9
10
11
12
13
14
15
J F M A M J J A S O N D
Average Number of ELTs (1996-2008)
Number of ELTs for 2014
Average Numunber of ELTs (2009-2014)

d
d
d
d
d
d
d
d
d
d
ddd d
d
d
d
d
d
d
dd
dd
d
d
d
d
d
d
d
d
dd
dd
d
d
d
d
d
d
d
d
d
d
d
dd
d
d
d
d
d
d
d
dd
d
d
d
d
d
d
d
d
d
d
d
dd
d
d
d
d
d
d
d
d
d
d
d
d
d
dd
d
d
d
d
d
d
d
d
d
d
d
d
d
d
d
d
d
d
d
d
d
d
d
d
d
dd
d
dd
d
d
d
d
d
d
d
d
d
d
d
d
d
d
d
d
d
d
d
d
ddd
d
d
d
d
d
d
d
d
d
d
dd
d
d
d
d d
d
d
d d
d
d
d
dd
d
d
d
d
d
d
d
d
d
d
d
d
d
d
d
d
d
d
d
ddd
d
d
d
d
d
d
d
d
d
d
d
d
dd
d
d
d
ddd
d
d
d
d
d
d
d
d
d
d
d
d
d
d
d
d
d
d
d
dddd
d
d
d d
d
d
d
d
d
d
dd
d
d
d
d
d
d
d
d
dd
d
d
d
d
dd
d
d
d
d
d
d
d
d
d
d
d
d d
d
d
d
d
d
dd
ddd
d
d
d
d
d
d
d
d
d
d
dd
d
d
d
d
d
d
d
d
d
d
d
d
d
d
d
d
d
d
d
d
d
d
d
dd
d
dd
d
d
d
d
d
d
d d
d
d
d
dd
d
d
d
d
d
d
d
d
d
d
d
d
d
d
d
d
d
d
d
d
d d
d
dd
d
dd
dddd
d
d
d
d
d
dd
d
d
d
d
d
d
d
dd
d
d
d
d
d
dd
d
d
d
d
d
dd
d
d
d
d
d
d
d
d
d
d
d
d
d
d
dd
d
d
d
d
d
d
d
d
d
d
d
d
d
d
d
d
dd
d
d
d
d
dd
dd
d
d
d
d
d
d
d
d
d
dd
d
d
d
d
d
d
d
d
d
d
d
d
d
dd
d
d
d
d
d
d d
d
dd
d
d
dd
d
d
d
d
d
d
d
d
d
dd
d
dd
d
d
d
d
d
d
d
d
d
d
d
dd d
d
d
d
d
dd
d
d
d
d
dd
d
d
dd
d d
d
d
d
d
d
d
d
d
d
d
dd dd
dd
d
d
d
dd
d
d
dd
d
d
d
d d
d
d
d
d
d
d
d
d
d
d
d
dd
d
d
d
d
d
d
d
d
d
dd
d d
d
d
d
dd
d
d
d
dd
d
d
dd
d
d
d
d
d
d
dd
d
d
d
d
d
d
d
d
d
d
d
d
d
d
d
d
dd
d
dd
d
d dd
d
d
d
d
dddd
d
d
d
d
dd
dd
d
d
d
d
d
d
d
d
d
d
d
d
d
d
d
d
d
d
d
d
d
d
d
d
d
d
d
d
d
dd
d
dd
d
d
d
dd
d
d
d
d
d
d
d
d
d
d
d
d
d
d
d
dd
dd
d
d
d
d
d
dd
d
d
d
d
d
d
d
d
d
d
d
d
d
d
d
d
d
d
d
d
d
d
d
d
d
dd
d
d
d
d
d
d
d
d
dd
d
d
dd
d
d
dd
d
d
d
d
d
d
d
d
d
d
d
d
d
d
d
d
d
d
d
d
d
d
d
dd
dd
d
d
d
d
d
d
d
dd
d
d
d
d
d
d
dd
d
d
d
d
d
d
d d
d
d
d
d
d
d
d
d
d
d
d
d
d
ddd
dd
d
d
d
d
d
d
dd
d
d
d
d
ddd
d
d
d
d
d
dd
d
d
d
dd
d d
d
d
d
d
d
d
d
d
d
d
d
d
d
d
d
d
d
d
d
d
dd
dd
d
d
d
d
d
d
d
d
d
d
d
d d
d
d
d
d
d
d
d
d
d
d
d
d
d
d
d
d
d
d
d
d
d
d
d
d
d
d
d
d
d
d
dd
d
d
d
d
d
d
d
dd
d
d
d
d
d
d
d
dd
dd
d
d
d
d
d
d
d
d
d
d
d
d
dd
d
d
dd
d
d
d
d
d
d
d
d
d
d
d
d
d
d d
d
d
d
d
d
dd
d
d
d
d
d
d
d
d
d
d
d
d
ddd
d
d
d
d
d
d
d
d
d
dd
dd
d
d
d
d
d
d
d
d
d
d
d
d
d
d
d
d
d
d
d
d
d
d
d
d
dd
d
d
d
d
d d
d
d
d
d
d
d
dd
d
d
d
d
d
d
d
d
d
d
d
d
d
d
d
d
d
d
d
dd
ddd
dd
d
d
d
d
d
d
d
d
d
d
d
d
d
d
d
d
d
dd
d
d
d
d
d
d
d
d
d
d
d
d
d
d
d
d
d
d
d
ddd
d
d
d
d d
d
d
d
dd
d d
d d d
d
d
d
ddd
d
d
d
d
d
d
d
d
dd
d
d
d
d
d
d
d
d
d d
d
d
d
d
d
d
d
d
d
dd
d
d
d
d
dd
d
d
d
d
d
d
d
dd
d
d
d
d
d
dd
d
d
d
d
d
d
d
d
d
d
dd
d
dd
d
d
d
d
d
dd
d
d
d
d
d
d
d
d
d
dd
d
d
d
d
dd
d
d
d
d d
d
d
d
d d
d
d
d
d
d
d
d
d
d
d
d
d
d
dd
dd
d
d
d
d
d
d
d
dd
d
d
d
d
d
d
d
dd
d
d
d
d
d
d
dd
d
d
d
d
d
d
d
d
dd
dd
d
d
d
d
d
d
d
d
d
dd
d
d
d
d
d
d
d
d
d
d
d
d
d
d
d
d
d
d
d
dd
d
d
d
d
d
d
d
d
d
d
d
d
d
d
d
dd
d
d
d
d
d
d
d
d
d
dd
d
d
d
d
d
dd
d
d
d
d
d
d
d
d
d
d
d
dd
d
d
d
d
d
d
d
d
d
d
d
d
dd
d
d
d
d
d
d
d
d
d
d
d
d
d
d
d
d
d
d
d
d d
dd
d
d
d
dd
d
d
d
d
d
d
ddd
d
d
d
dd
d
dd
d
d
d
d
d
dd
dd d
dd d
d
d
d
d
d
d
d
dd
dd
d
d
d
d
d
d
d
d
d
d
d
d
d
d
d
d
d
d
d
d
d
d
d
d
d
d
d
d
ddd
d
d
d
d
d
d
d
d
d
d
dd
d
dd
d
d
d
d
d
d
d
d
d
d
d
dd
d
d
d
dd
d
d
d
d
d
d
d
d
d
d
d
d
d
d
d
d
d
d
d
d
d
dd
d
d
d
d
d
d
dd
d
d
d
d
d
d
d
dd
d
d
d
d
d
d
ELT From 1997 - 20140 200100
Miles
Date: 2/6/2015Created by georges kleinbaum
-
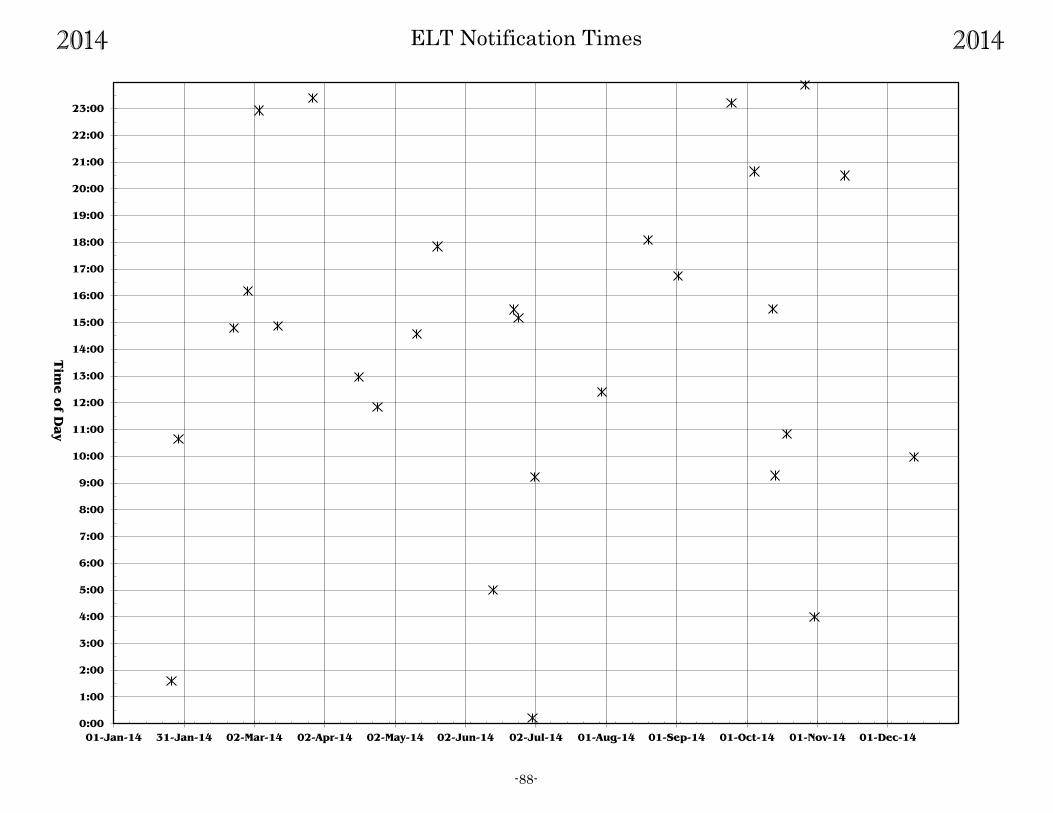
2014 ELT Notification Times 2014
-88-
0:00
1:00
2:00
3:00
4:00
5:00
6:00
7:00
8:00
9:00
10:00
11:00
12:00
13:00
14:00
15:00
16:00
17:00
18:00
19:00
20:00
21:00
22:00
23:00
01-Jan-14 31-Jan-14 02-Mar-14 02-Apr-14 02-May-14 02-Jun-14 02-Jul-14 01-Aug-14 01-Sep-14 01-Oct-14 01-Nov-14 01-Dec-14
Tim
e of D
ay
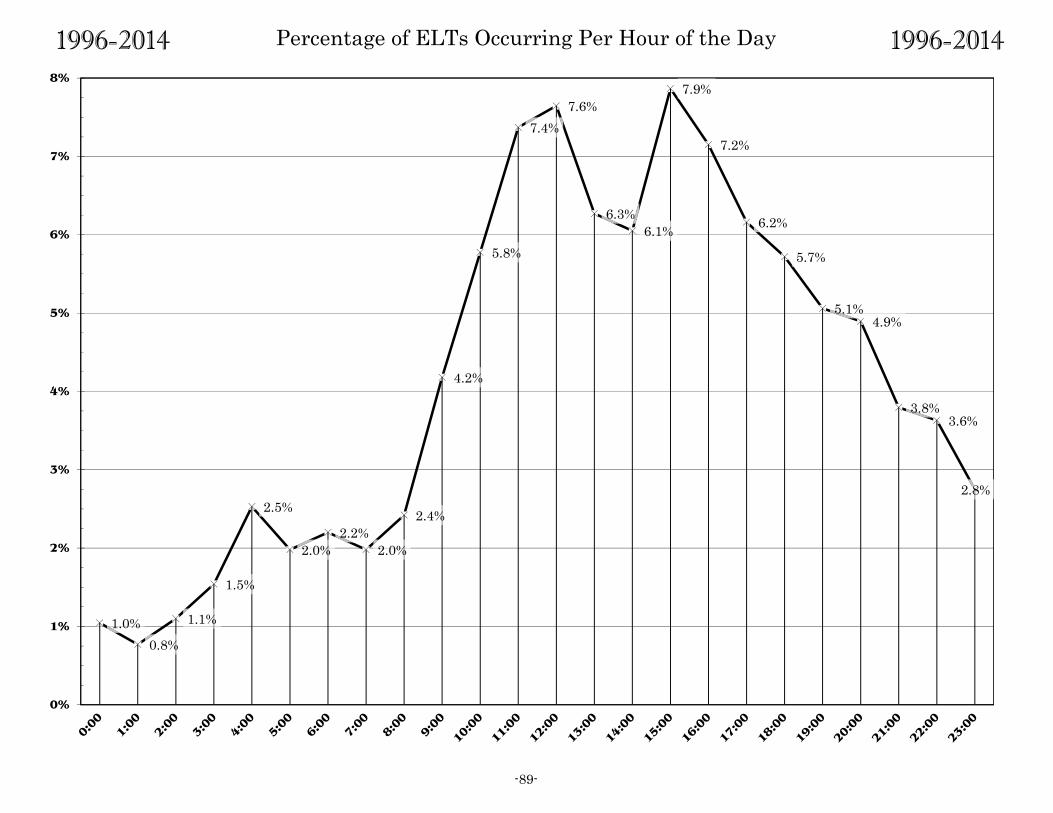
1996-2014 Percentage of ELTs Occurring Per Hour of the Day 1996-2014
-89-
1.0%
0.8%
1.1%
1.5%
2.5%
2.0%
2.2%
2.0%
2.4%
4.2%
5.8%
7.4%
7.6%
6.3%
6.1%
7.9%
7.2%
6.2%
5.7%
5.1% 4.9%
3.8% 3.6%
2.8%
0%
1%
2%
3%
4%
5%
6%
7%
8%
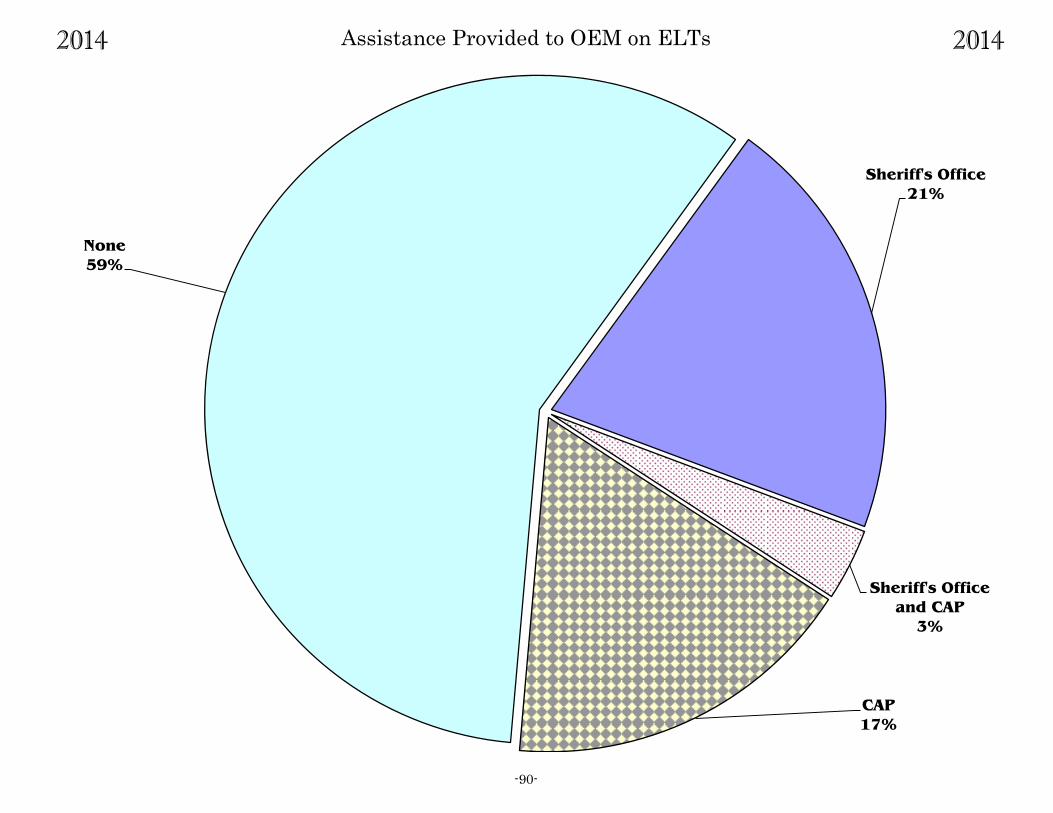
2014 Assistance Provided to OEM on ELTs 2014
-90-
Sheriff's Office
21%
Sheriff's Office
and CAP
3%
CAP
17%
None
59%
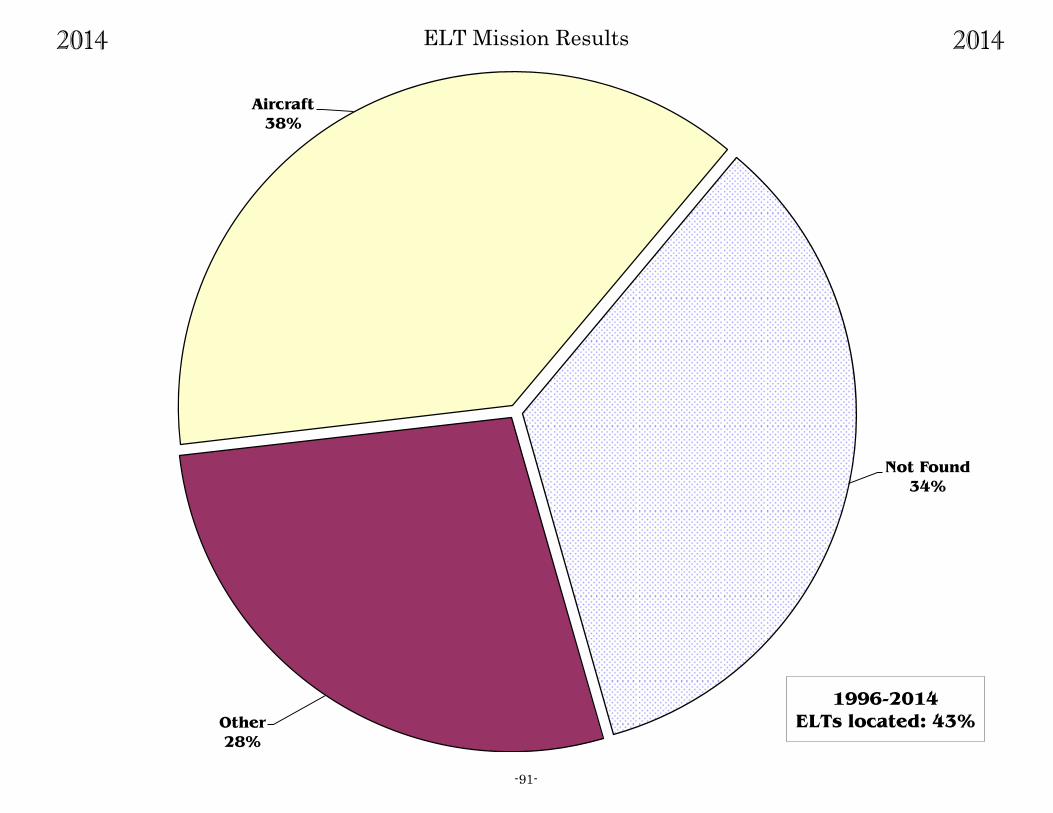
2014 ELT Mission Results 2014
-91-
Not Found
34%
Other
28%
Aircraft
38%
1996-2014
ELTs located: 43%
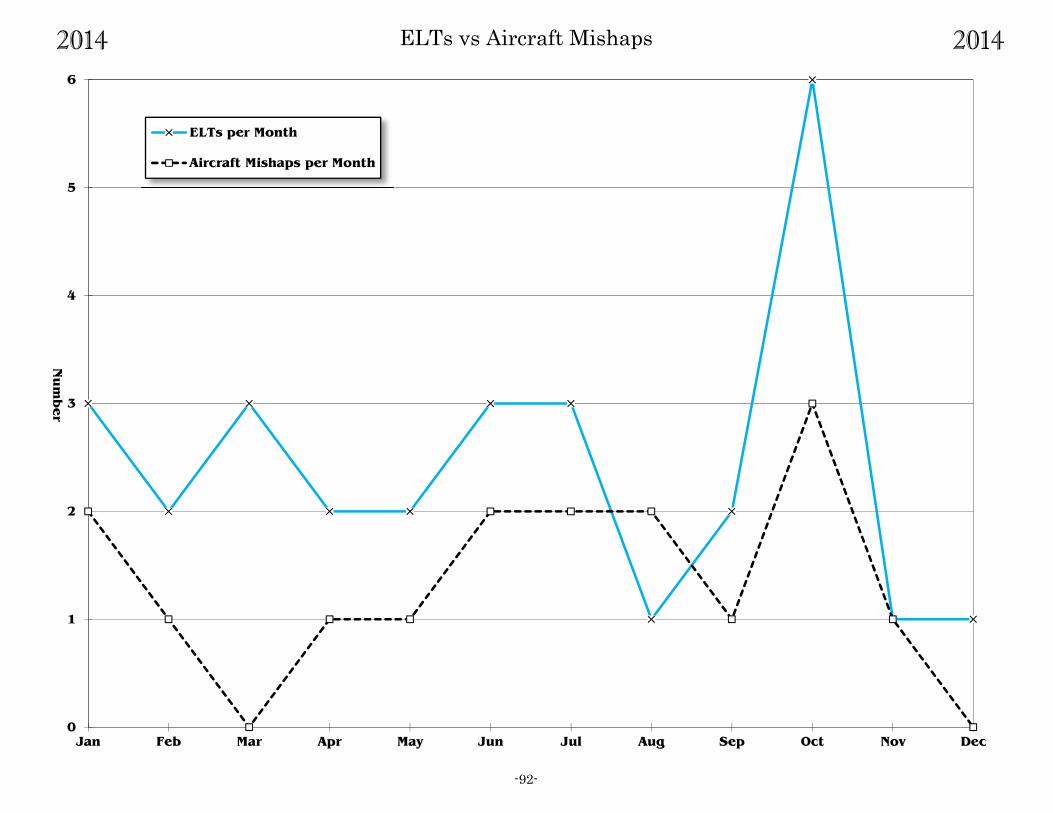
2014 ELTs vs Aircraft Mishaps 2014
-92-
0
1
2
3
4
5
6
Jan Feb Mar Apr May Jun Jul Aug Sep Oct Nov Dec
Nu
mb
er
ELTs per Month
Aircraft Mishaps per Month
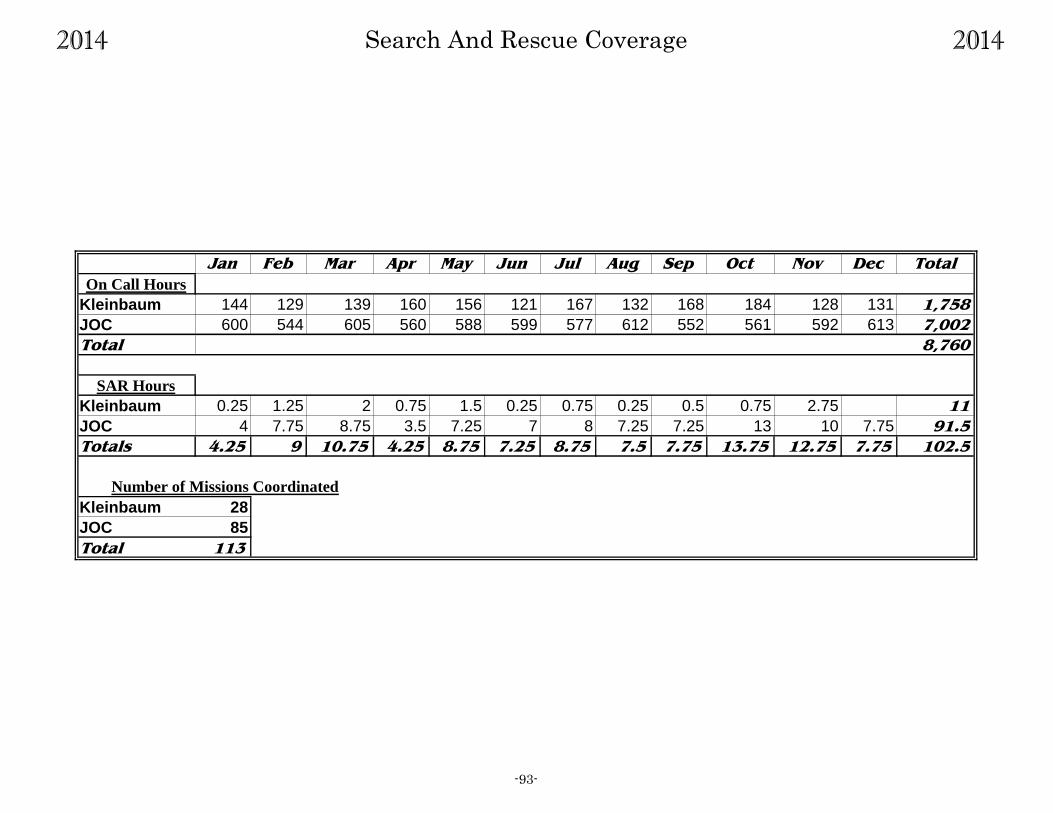
2014 Search And Rescue Coverage 2014
Jan Feb Mar Apr May Jun Jul Aug Sep Oct Nov Dec Total
On Call Hours
Kleinbaum 144 129 139 160 156 121 167 132 168 184 128 131 1,758
JOC 600 544 605 560 588 599 577 612 552 561 592 613 7,002
Total 8,760
SAR Hours
Kleinbaum 0.25 1.25 2 0.75 1.5 0.25 0.75 0.25 0.5 0.75 2.75 11
JOC 4 7.75 8.75 3.5 7.25 7 8 7.25 7.25 13 10 7.75 91.5
Totals 4.25 9 10.75 4.25 8.75 7.25 8.75 7.5 7.75 13.75 12.75 7.75 102.5
Kleinbaum 28
JOC 85
Total 113
Number of Missions Coordinated
-93-

BakerTotals for transportation use and work hours
20142014
Helicopter Helicopter
Military Helicopter 17 Military Helicopter
Plane 2 Plane
Military Plane Military Plane
Snowmobile Snowmobile 535
Snowcat Snowcat 80
ATV ATV 115
Motorcycle Motorcycle
Boat Boat
Four-Wheel drive Four-Wheel drive 4,391
Specialized vehicles Specialized vehicles
Two-Wheel drive Two-Wheel drive 8,193
Other equipment Other equipment
HOURS MILES
TRANSPORTATION
HOURS OF PAID WORK
CAP Divers 3 BLM
Forest Service 6 Other Feds Explorers
Mt Rescue Dog team Jeep club
Ski patrol Horse team Fire Service
Law Enforcement 114 State Agency 4
Other
HOURS OF VOLUNTEER WORK
Amateur radio
CAP Divers 38 BLM
Forest Service Other Feds Explorers
Mt Rescue Dog team Jeep club
Horse team 12 Fire Service 16
Law Enforcement State Agency
Other 134
Ski patrol
UNBUDGETED COSTS FOR SEARCH AND RESCUE
Food $0.00 Fuel $0.00 Lodging $0.00 Other $0.00
Total Transportation Hours 19
Total Transportation Miles 13,314
Total Paid Hours 186
Total Volunteer Hours 1,961
Total Cost $0.00
Sheriff's SAR 59
Sheriff's SAR 1,761
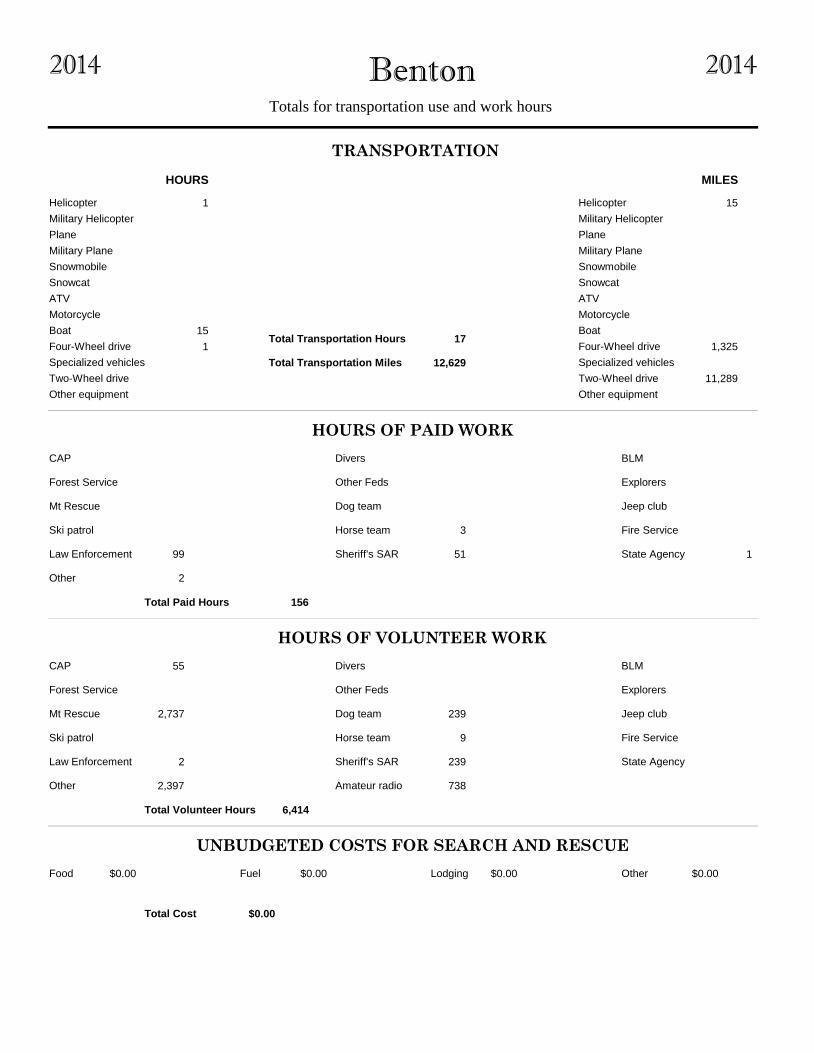
BentonTotals for transportation use and work hours
20142014
Helicopter 1 Helicopter 15
Military Helicopter Military Helicopter
Plane Plane
Military Plane Military Plane
Snowmobile Snowmobile
Snowcat Snowcat
ATV ATV
Motorcycle Motorcycle
Boat 15 Boat
Four-Wheel drive 1 Four-Wheel drive 1,325
Specialized vehicles Specialized vehicles
Two-Wheel drive Two-Wheel drive 11,289
Other equipment Other equipment
HOURS MILES
TRANSPORTATION
HOURS OF PAID WORK
CAP Divers BLM
Forest Service Other Feds Explorers
Mt Rescue Dog team Jeep club
Ski patrol Horse team 3 Fire Service
Law Enforcement 99 State Agency 1
Other 2
HOURS OF VOLUNTEER WORK
Amateur radio 738
CAP 55 Divers BLM
Forest Service Other Feds Explorers
Mt Rescue 2,737 Dog team 239 Jeep club
Horse team 9 Fire Service
Law Enforcement 2 State Agency
Other 2,397
Ski patrol
UNBUDGETED COSTS FOR SEARCH AND RESCUE
Food $0.00 Fuel $0.00 Lodging $0.00 Other $0.00
Total Transportation Hours 17
Total Transportation Miles 12,629
Total Paid Hours 156
Total Volunteer Hours 6,414
Total Cost $0.00
Sheriff's SAR 51
Sheriff's SAR 239
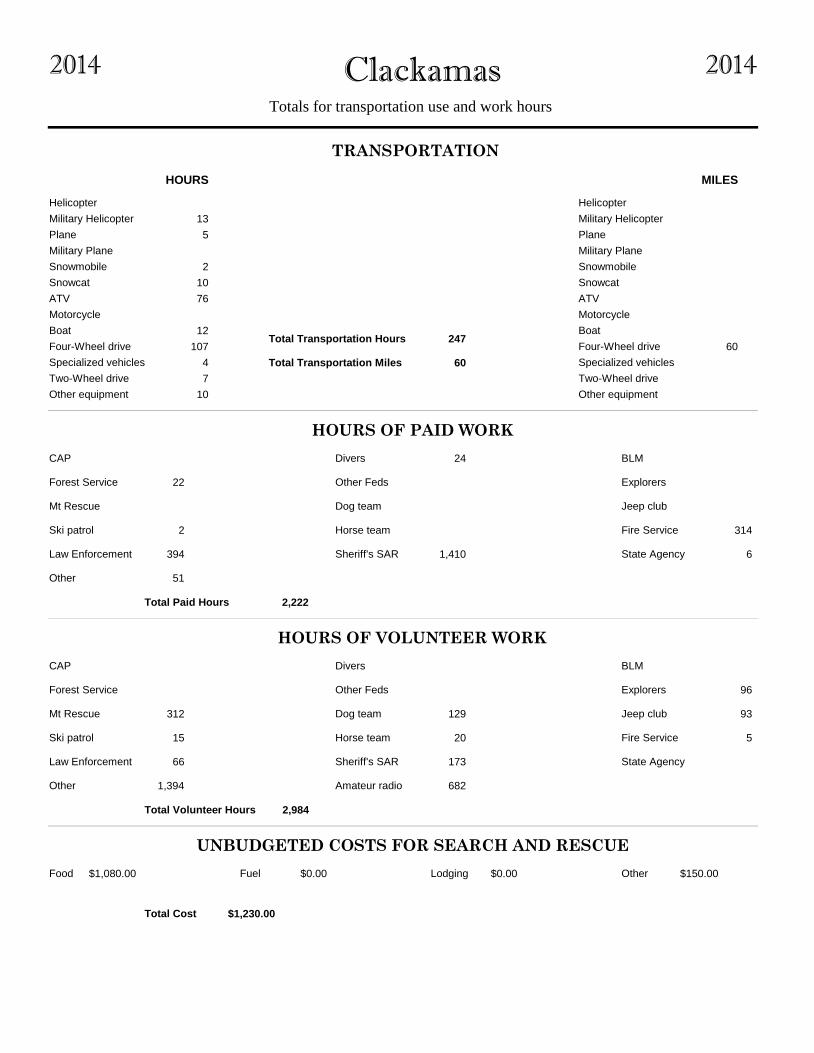
ClackamasTotals for transportation use and work hours
20142014
Helicopter Helicopter
Military Helicopter 13 Military Helicopter
Plane 5 Plane
Military Plane Military Plane
Snowmobile 2 Snowmobile
Snowcat 10 Snowcat
ATV 76 ATV
Motorcycle Motorcycle
Boat 12 Boat
Four-Wheel drive 107 Four-Wheel drive 60
Specialized vehicles 4 Specialized vehicles
Two-Wheel drive 7 Two-Wheel drive
Other equipment 10 Other equipment
HOURS MILES
TRANSPORTATION
HOURS OF PAID WORK
CAP Divers 24 BLM
Forest Service 22 Other Feds Explorers
Mt Rescue Dog team Jeep club
Ski patrol 2 Horse team Fire Service 314
Law Enforcement 394 State Agency 6
Other 51
HOURS OF VOLUNTEER WORK
Amateur radio 682
CAP Divers BLM
Forest Service Other Feds Explorers 96
Mt Rescue 312 Dog team 129 Jeep club 93
Horse team 20 Fire Service 5
Law Enforcement 66 State Agency
Other 1,394
Ski patrol 15
UNBUDGETED COSTS FOR SEARCH AND RESCUE
Food $1,080.00 Fuel $0.00 Lodging $0.00 Other $150.00
Total Transportation Hours 247
Total Transportation Miles 60
Total Paid Hours 2,222
Total Volunteer Hours 2,984
Total Cost $1,230.00
Sheriff's SAR 1,410
Sheriff's SAR 173

ClatsopTotals for transportation use and work hours
20142014
Helicopter Helicopter
Military Helicopter 2 Military Helicopter
Plane 4 Plane
Military Plane Military Plane
Snowmobile Snowmobile
Snowcat Snowcat
ATV 99 ATV
Motorcycle Motorcycle
Boat 1 Boat
Four-Wheel drive 93 Four-Wheel drive 1,371
Specialized vehicles 17 Specialized vehicles
Two-Wheel drive Two-Wheel drive 186
Other equipment 10 Other equipment 244
HOURS MILES
TRANSPORTATION
HOURS OF PAID WORK
CAP Divers BLM
Forest Service Other Feds Explorers
Mt Rescue Dog team Jeep club
Ski patrol Horse team Fire Service
Law Enforcement 243 State Agency 3
Other
HOURS OF VOLUNTEER WORK
Amateur radio
CAP 20 Divers 400 BLM
Forest Service Other Feds Explorers
Mt Rescue 130 Dog team Jeep club
Horse team Fire Service
Law Enforcement 7 State Agency
Other 72
Ski patrol
UNBUDGETED COSTS FOR SEARCH AND RESCUE
Food $0.00 Fuel $0.00 Lodging $0.00 Other $0.00
Total Transportation Hours 225
Total Transportation Miles 1,801
Total Paid Hours 308
Total Volunteer Hours 1,455
Total Cost $0.00
Sheriff's SAR 62
Sheriff's SAR 826
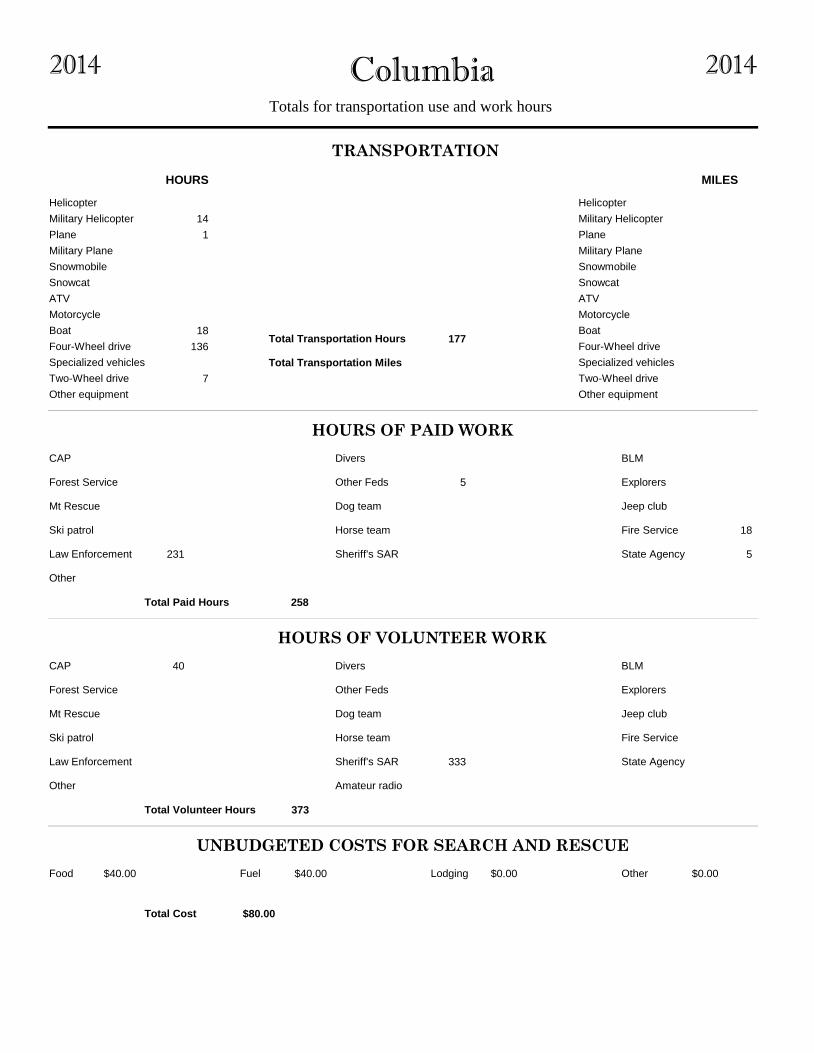
ColumbiaTotals for transportation use and work hours
20142014
Helicopter Helicopter
Military Helicopter 14 Military Helicopter
Plane 1 Plane
Military Plane Military Plane
Snowmobile Snowmobile
Snowcat Snowcat
ATV ATV
Motorcycle Motorcycle
Boat 18 Boat
Four-Wheel drive 136 Four-Wheel drive
Specialized vehicles Specialized vehicles
Two-Wheel drive 7 Two-Wheel drive
Other equipment Other equipment
HOURS MILES
TRANSPORTATION
HOURS OF PAID WORK
CAP Divers BLM
Forest Service Other Feds 5 Explorers
Mt Rescue Dog team Jeep club
Ski patrol Horse team Fire Service 18
Law Enforcement 231 State Agency 5
Other
HOURS OF VOLUNTEER WORK
Amateur radio
CAP 40 Divers BLM
Forest Service Other Feds Explorers
Mt Rescue Dog team Jeep club
Horse team Fire Service
Law Enforcement State Agency
Other
Ski patrol
UNBUDGETED COSTS FOR SEARCH AND RESCUE
Food $40.00 Fuel $40.00 Lodging $0.00 Other $0.00
Total Transportation Hours 177
Total Transportation Miles
Total Paid Hours 258
Total Volunteer Hours 373
Total Cost $80.00
Sheriff's SAR
Sheriff's SAR 333

CoosTotals for transportation use and work hours
20142014
Helicopter Helicopter
Military Helicopter Military Helicopter
Plane Plane
Military Plane Military Plane
Snowmobile Snowmobile
Snowcat Snowcat
ATV ATV
Motorcycle Motorcycle
Boat Boat
Four-Wheel drive Four-Wheel drive
Specialized vehicles Specialized vehicles
Two-Wheel drive Two-Wheel drive
Other equipment Other equipment
HOURS MILES
TRANSPORTATION
HOURS OF PAID WORK
CAP Divers BLM
Forest Service Other Feds Explorers
Mt Rescue Dog team Jeep club
Ski patrol Horse team Fire Service
Law Enforcement State Agency 1
Other
HOURS OF VOLUNTEER WORK
Amateur radio
CAP Divers BLM
Forest Service Other Feds Explorers
Mt Rescue Dog team Jeep club
Horse team Fire Service
Law Enforcement State Agency
Other
Ski patrol
UNBUDGETED COSTS FOR SEARCH AND RESCUE
Food $0.00 Fuel $0.00 Lodging $0.00 Other $0.00
Total Transportation Hours
Total Transportation Miles
Total Paid Hours 1
Total Volunteer Hours
Total Cost $0.00
Sheriff's SAR
Sheriff's SAR
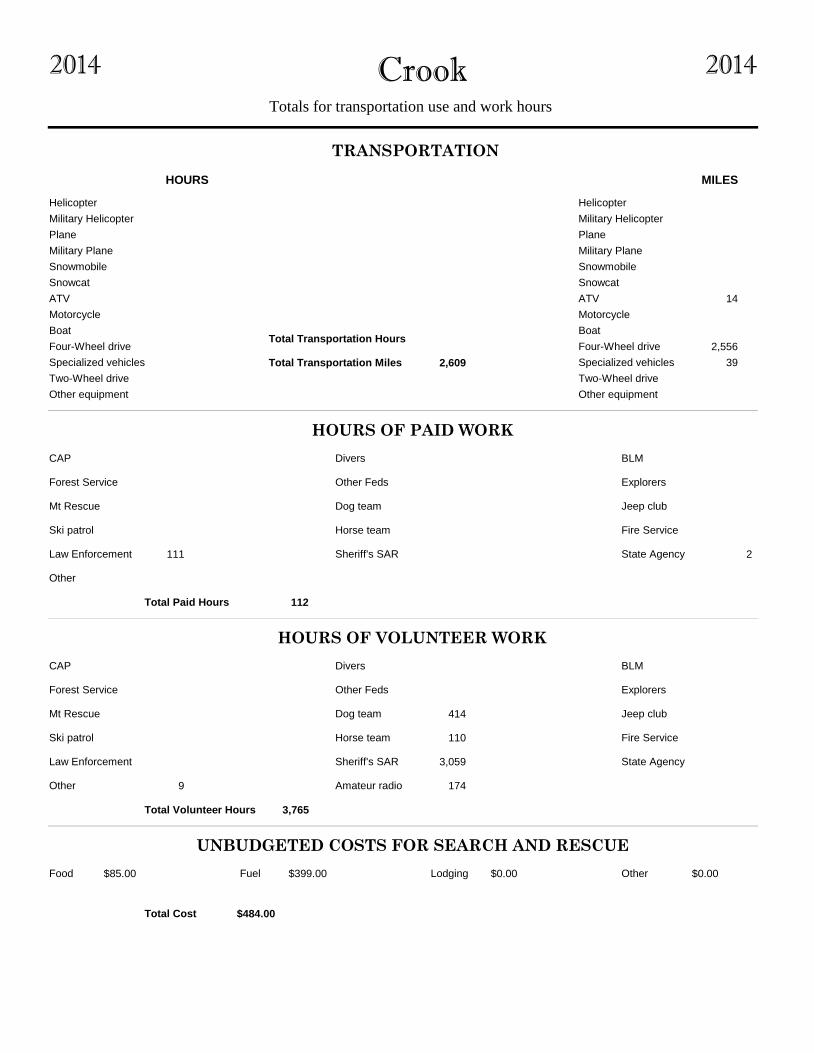
CrookTotals for transportation use and work hours
20142014
Helicopter Helicopter
Military Helicopter Military Helicopter
Plane Plane
Military Plane Military Plane
Snowmobile Snowmobile
Snowcat Snowcat
ATV ATV 14
Motorcycle Motorcycle
Boat Boat
Four-Wheel drive Four-Wheel drive 2,556
Specialized vehicles Specialized vehicles 39
Two-Wheel drive Two-Wheel drive
Other equipment Other equipment
HOURS MILES
TRANSPORTATION
HOURS OF PAID WORK
CAP Divers BLM
Forest Service Other Feds Explorers
Mt Rescue Dog team Jeep club
Ski patrol Horse team Fire Service
Law Enforcement 111 State Agency 2
Other
HOURS OF VOLUNTEER WORK
Amateur radio 174
CAP Divers BLM
Forest Service Other Feds Explorers
Mt Rescue Dog team 414 Jeep club
Horse team 110 Fire Service
Law Enforcement State Agency
Other 9
Ski patrol
UNBUDGETED COSTS FOR SEARCH AND RESCUE
Food $85.00 Fuel $399.00 Lodging $0.00 Other $0.00
Total Transportation Hours
Total Transportation Miles 2,609
Total Paid Hours 112
Total Volunteer Hours 3,765
Total Cost $484.00
Sheriff's SAR
Sheriff's SAR 3,059
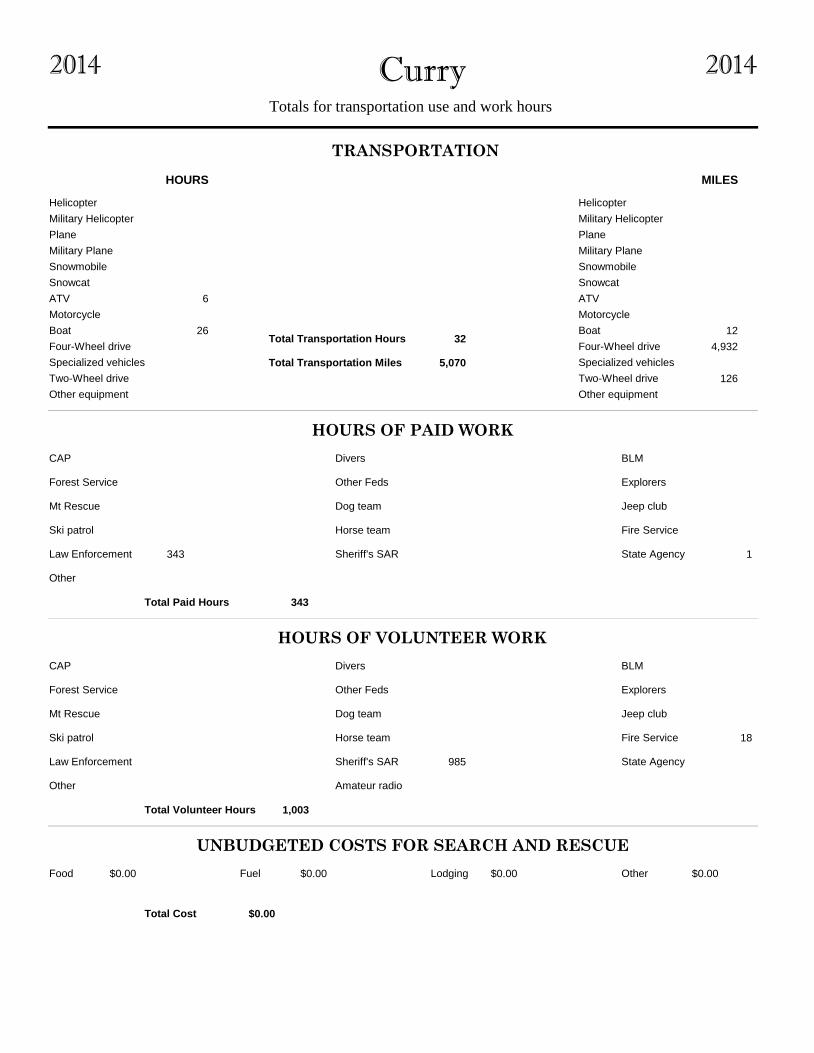
CurryTotals for transportation use and work hours
20142014
Helicopter Helicopter
Military Helicopter Military Helicopter
Plane Plane
Military Plane Military Plane
Snowmobile Snowmobile
Snowcat Snowcat
ATV 6 ATV
Motorcycle Motorcycle
Boat 26 Boat 12
Four-Wheel drive Four-Wheel drive 4,932
Specialized vehicles Specialized vehicles
Two-Wheel drive Two-Wheel drive 126
Other equipment Other equipment
HOURS MILES
TRANSPORTATION
HOURS OF PAID WORK
CAP Divers BLM
Forest Service Other Feds Explorers
Mt Rescue Dog team Jeep club
Ski patrol Horse team Fire Service
Law Enforcement 343 State Agency 1
Other
HOURS OF VOLUNTEER WORK
Amateur radio
CAP Divers BLM
Forest Service Other Feds Explorers
Mt Rescue Dog team Jeep club
Horse team Fire Service 18
Law Enforcement State Agency
Other
Ski patrol
UNBUDGETED COSTS FOR SEARCH AND RESCUE
Food $0.00 Fuel $0.00 Lodging $0.00 Other $0.00
Total Transportation Hours 32
Total Transportation Miles 5,070
Total Paid Hours 343
Total Volunteer Hours 1,003
Total Cost $0.00
Sheriff's SAR
Sheriff's SAR 985
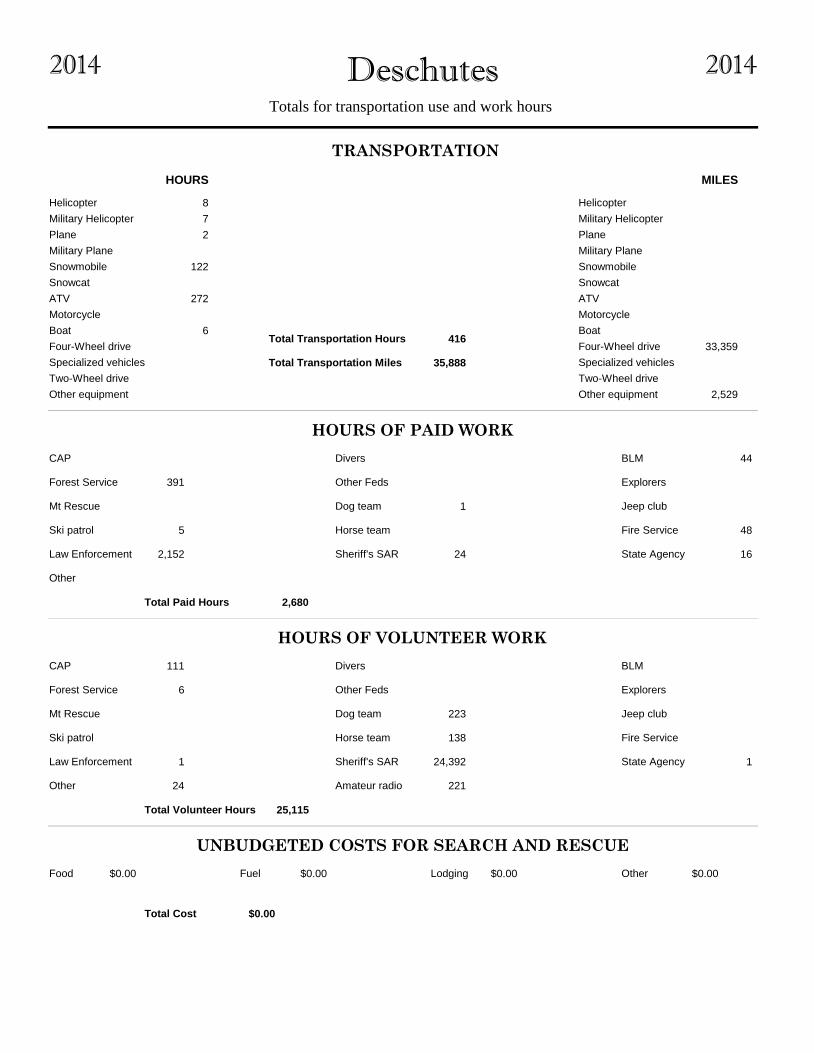
DeschutesTotals for transportation use and work hours
20142014
Helicopter 8 Helicopter
Military Helicopter 7 Military Helicopter
Plane 2 Plane
Military Plane Military Plane
Snowmobile 122 Snowmobile
Snowcat Snowcat
ATV 272 ATV
Motorcycle Motorcycle
Boat 6 Boat
Four-Wheel drive Four-Wheel drive 33,359
Specialized vehicles Specialized vehicles
Two-Wheel drive Two-Wheel drive
Other equipment Other equipment 2,529
HOURS MILES
TRANSPORTATION
HOURS OF PAID WORK
CAP Divers BLM 44
Forest Service 391 Other Feds Explorers
Mt Rescue Dog team 1 Jeep club
Ski patrol 5 Horse team Fire Service 48
Law Enforcement 2,152 State Agency 16
Other
HOURS OF VOLUNTEER WORK
Amateur radio 221
CAP 111 Divers BLM
Forest Service 6 Other Feds Explorers
Mt Rescue Dog team 223 Jeep club
Horse team 138 Fire Service
Law Enforcement 1 State Agency 1
Other 24
Ski patrol
UNBUDGETED COSTS FOR SEARCH AND RESCUE
Food $0.00 Fuel $0.00 Lodging $0.00 Other $0.00
Total Transportation Hours 416
Total Transportation Miles 35,888
Total Paid Hours 2,680
Total Volunteer Hours 25,115
Total Cost $0.00
Sheriff's SAR 24
Sheriff's SAR 24,392

DouglasTotals for transportation use and work hours
20142014
Helicopter 5 Helicopter 10
Military Helicopter 10 Military Helicopter
Plane Plane
Military Plane Military Plane
Snowmobile Snowmobile
Snowcat Snowcat
ATV ATV
Motorcycle Motorcycle
Boat 2 Boat
Four-Wheel drive Four-Wheel drive 26,378
Specialized vehicles Specialized vehicles
Two-Wheel drive Two-Wheel drive 1,971
Other equipment Other equipment 5,197
HOURS MILES
TRANSPORTATION
HOURS OF PAID WORK
CAP Divers BLM
Forest Service Other Feds Explorers
Mt Rescue Dog team Jeep club
Ski patrol Horse team Fire Service
Law Enforcement 1,096 State Agency 8
Other
HOURS OF VOLUNTEER WORK
Amateur radio
CAP Divers BLM
Forest Service Other Feds Explorers 2,939
Mt Rescue 4,821 Dog team 604 Jeep club 843
Horse team 87 Fire Service 69
Law Enforcement 1 State Agency
Other 16
Ski patrol 79
UNBUDGETED COSTS FOR SEARCH AND RESCUE
Food $1,233.34 Fuel $0.00 Lodging $0.00 Other $13,751.23
Total Transportation Hours 17
Total Transportation Miles 33,556
Total Paid Hours 1,110
Total Volunteer Hours 9,468
Total Cost $14,984.57
Sheriff's SAR 6
Sheriff's SAR 11

GilliamTotals for transportation use and work hours
20142014
Helicopter Helicopter
Military Helicopter Military Helicopter
Plane Plane
Military Plane Military Plane
Snowmobile Snowmobile
Snowcat Snowcat
ATV ATV
Motorcycle Motorcycle
Boat Boat
Four-Wheel drive Four-Wheel drive
Specialized vehicles Specialized vehicles
Two-Wheel drive Two-Wheel drive
Other equipment Other equipment
HOURS MILES
TRANSPORTATION
HOURS OF PAID WORK
CAP Divers BLM
Forest Service Other Feds Explorers
Mt Rescue Dog team Jeep club
Ski patrol Horse team Fire Service
Law Enforcement State Agency
Other 5
HOURS OF VOLUNTEER WORK
Amateur radio
CAP Divers BLM
Forest Service Other Feds Explorers
Mt Rescue Dog team Jeep club
Horse team 4 Fire Service 5
Law Enforcement State Agency
Other
Ski patrol
UNBUDGETED COSTS FOR SEARCH AND RESCUE
Food $0.00 Fuel $0.00 Lodging $0.00 Other $0.00
Total Transportation Hours
Total Transportation Miles
Total Paid Hours 5
Total Volunteer Hours 33
Total Cost $0.00
Sheriff's SAR
Sheriff's SAR 24
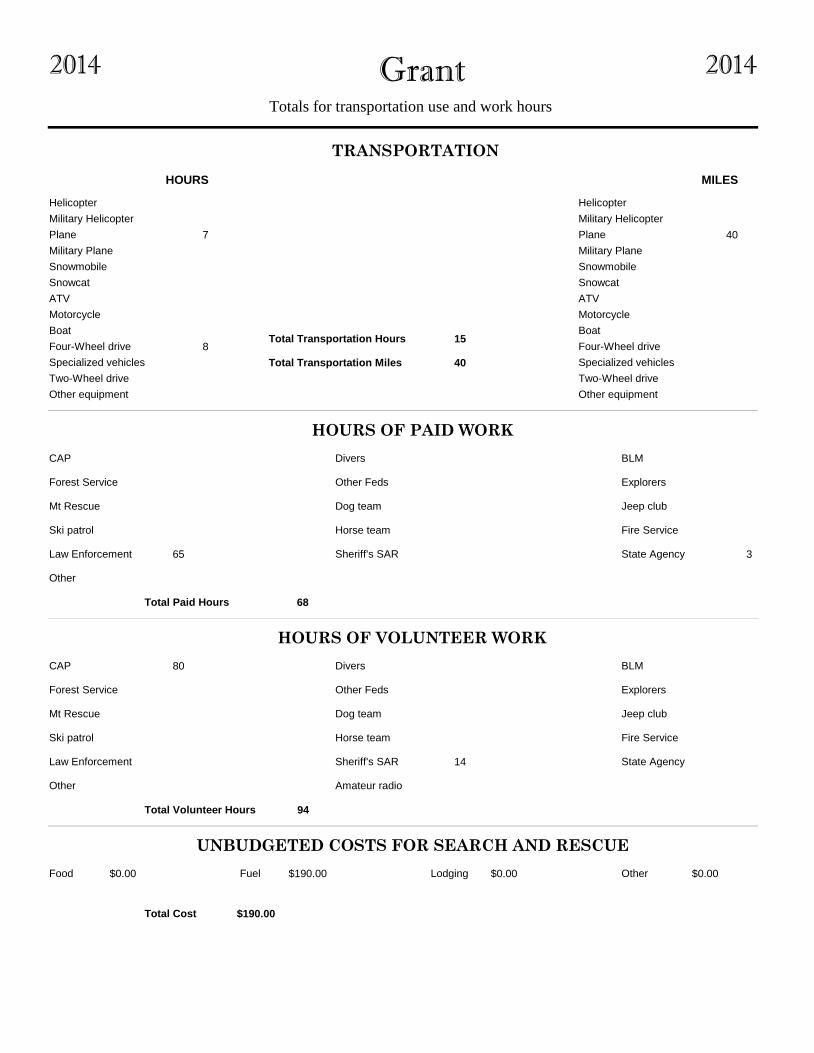
GrantTotals for transportation use and work hours
20142014
Helicopter Helicopter
Military Helicopter Military Helicopter
Plane 7 Plane 40
Military Plane Military Plane
Snowmobile Snowmobile
Snowcat Snowcat
ATV ATV
Motorcycle Motorcycle
Boat Boat
Four-Wheel drive 8 Four-Wheel drive
Specialized vehicles Specialized vehicles
Two-Wheel drive Two-Wheel drive
Other equipment Other equipment
HOURS MILES
TRANSPORTATION
HOURS OF PAID WORK
CAP Divers BLM
Forest Service Other Feds Explorers
Mt Rescue Dog team Jeep club
Ski patrol Horse team Fire Service
Law Enforcement 65 State Agency 3
Other
HOURS OF VOLUNTEER WORK
Amateur radio
CAP 80 Divers BLM
Forest Service Other Feds Explorers
Mt Rescue Dog team Jeep club
Horse team Fire Service
Law Enforcement State Agency
Other
Ski patrol
UNBUDGETED COSTS FOR SEARCH AND RESCUE
Food $0.00 Fuel $190.00 Lodging $0.00 Other $0.00
Total Transportation Hours 15
Total Transportation Miles 40
Total Paid Hours 68
Total Volunteer Hours 94
Total Cost $190.00
Sheriff's SAR
Sheriff's SAR 14
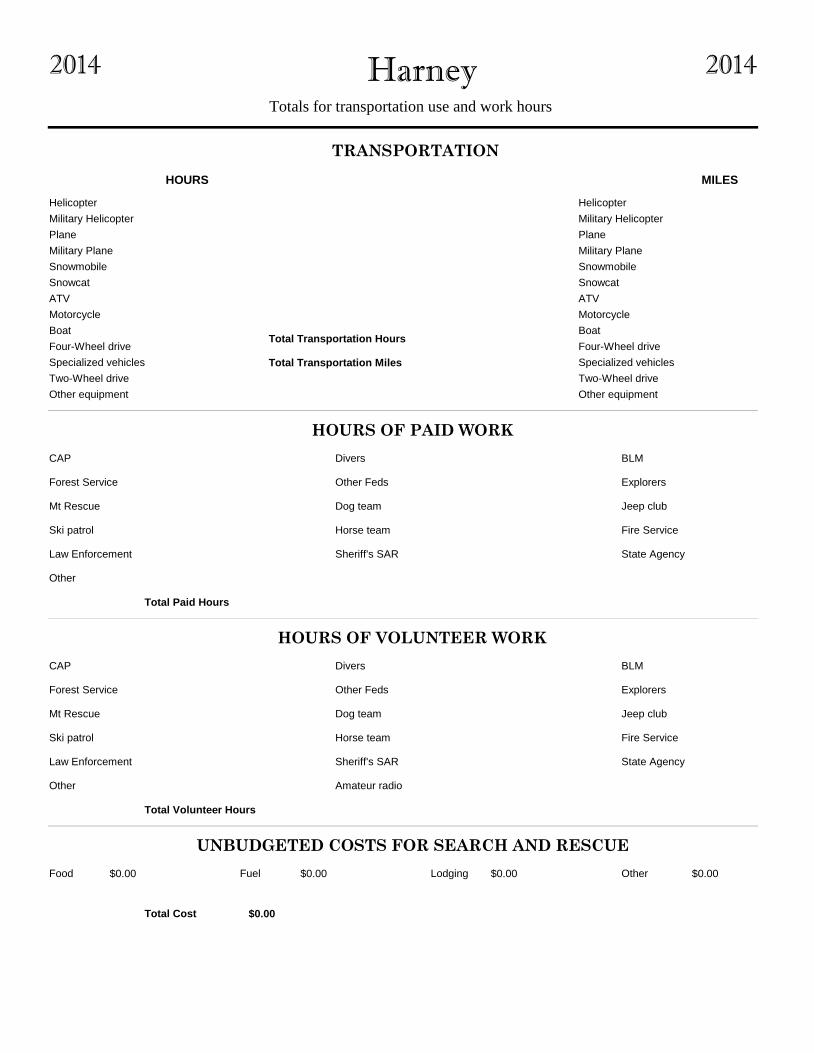
HarneyTotals for transportation use and work hours
20142014
Helicopter Helicopter
Military Helicopter Military Helicopter
Plane Plane
Military Plane Military Plane
Snowmobile Snowmobile
Snowcat Snowcat
ATV ATV
Motorcycle Motorcycle
Boat Boat
Four-Wheel drive Four-Wheel drive
Specialized vehicles Specialized vehicles
Two-Wheel drive Two-Wheel drive
Other equipment Other equipment
HOURS MILES
TRANSPORTATION
HOURS OF PAID WORK
CAP Divers BLM
Forest Service Other Feds Explorers
Mt Rescue Dog team Jeep club
Ski patrol Horse team Fire Service
Law Enforcement State Agency
Other
HOURS OF VOLUNTEER WORK
Amateur radio
CAP Divers BLM
Forest Service Other Feds Explorers
Mt Rescue Dog team Jeep club
Horse team Fire Service
Law Enforcement State Agency
Other
Ski patrol
UNBUDGETED COSTS FOR SEARCH AND RESCUE
Food $0.00 Fuel $0.00 Lodging $0.00 Other $0.00
Total Transportation Hours
Total Transportation Miles
Total Paid Hours
Total Volunteer Hours
Total Cost $0.00
Sheriff's SAR
Sheriff's SAR

Hood RiverTotals for transportation use and work hours
20142014
Helicopter 6 Helicopter
Military Helicopter 6 Military Helicopter
Plane 36 Plane
Military Plane Military Plane
Snowmobile 6 Snowmobile
Snowcat 24 Snowcat
ATV 5 ATV
Motorcycle Motorcycle
Boat 5 Boat
Four-Wheel drive 33 Four-Wheel drive 2,339
Specialized vehicles 62 Specialized vehicles 720
Two-Wheel drive 6 Two-Wheel drive 390
Other equipment 2 Other equipment
HOURS MILES
TRANSPORTATION
HOURS OF PAID WORK
CAP Divers BLM
Forest Service 21 Other Feds 35 Explorers
Mt Rescue 90 Dog team Jeep club
Ski patrol 27 Horse team Fire Service 34
Law Enforcement 509 State Agency 4
Other 6
HOURS OF VOLUNTEER WORK
Amateur radio
CAP Divers BLM
Forest Service Other Feds Explorers
Mt Rescue 1,183 Dog team Jeep club
Horse team Fire Service 71
Law Enforcement 28 State Agency
Other 6
Ski patrol 12
UNBUDGETED COSTS FOR SEARCH AND RESCUE
Food $0.00 Fuel $0.00 Lodging $0.00 Other $0.00
Total Transportation Hours 189
Total Transportation Miles 3,449
Total Paid Hours 742
Total Volunteer Hours 1,336
Total Cost $0.00
Sheriff's SAR 17
Sheriff's SAR 37

JacksonTotals for transportation use and work hours
20142014
Helicopter 28 Helicopter
Military Helicopter 32 Military Helicopter
Plane 18 Plane
Military Plane Military Plane
Snowmobile 14 Snowmobile
Snowcat 15 Snowcat
ATV 121 ATV
Motorcycle Motorcycle
Boat 35 Boat
Four-Wheel drive Four-Wheel drive 45,114
Specialized vehicles 468 Specialized vehicles 4,320
Two-Wheel drive Two-Wheel drive
Other equipment Other equipment 94,542
HOURS MILES
TRANSPORTATION
HOURS OF PAID WORK
CAP Divers 38 BLM
Forest Service 12 Other Feds Explorers
Mt Rescue Dog team Jeep club
Ski patrol Horse team Fire Service
Law Enforcement 161 State Agency 13
Other 183
HOURS OF VOLUNTEER WORK
Amateur radio
CAP 65 Divers 122 BLM
Forest Service Other Feds Explorers
Mt Rescue Dog team 2,588 Jeep club 136
Horse team 157 Fire Service
Law Enforcement 18 State Agency
Other 182
Ski patrol
UNBUDGETED COSTS FOR SEARCH AND RESCUE
Food $2,452.01 Fuel $2,172.61 Lodging $366.78 Other $34,889.42
Total Transportation Hours 730
Total Transportation Miles 143,976
Total Paid Hours 1,468
Total Volunteer Hours 15,304
Total Cost $39,880.82
Sheriff's SAR 1,061
Sheriff's SAR 12,037

JeffersonTotals for transportation use and work hours
20142014
Helicopter 2 Helicopter
Military Helicopter Military Helicopter
Plane Plane
Military Plane Military Plane
Snowmobile Snowmobile
Snowcat Snowcat
ATV 16 ATV
Motorcycle Motorcycle
Boat Boat
Four-Wheel drive 67 Four-Wheel drive 150
Specialized vehicles Specialized vehicles
Two-Wheel drive Two-Wheel drive
Other equipment 20 Other equipment
HOURS MILES
TRANSPORTATION
HOURS OF PAID WORK
CAP Divers BLM
Forest Service 3 Other Feds Explorers
Mt Rescue Dog team Jeep club
Ski patrol Horse team Fire Service
Law Enforcement 88 State Agency
Other
HOURS OF VOLUNTEER WORK
Amateur radio
CAP Divers BLM
Forest Service Other Feds Explorers
Mt Rescue Dog team Jeep club
Horse team Fire Service
Law Enforcement State Agency
Other 32
Ski patrol
UNBUDGETED COSTS FOR SEARCH AND RESCUE
Food $0.00 Fuel $502.00 Lodging $0.00 Other $0.00
Total Transportation Hours 105
Total Transportation Miles 150
Total Paid Hours 91
Total Volunteer Hours 184
Total Cost $502.00
Sheriff's SAR
Sheriff's SAR 152
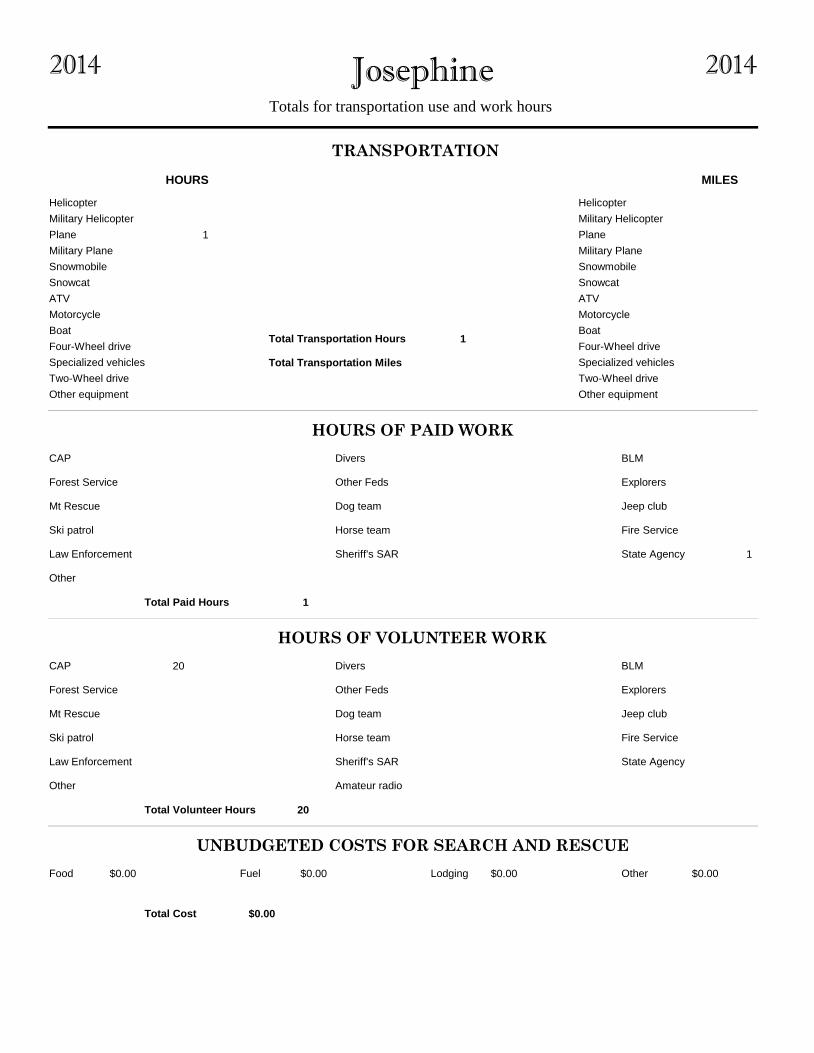
JosephineTotals for transportation use and work hours
20142014
Helicopter Helicopter
Military Helicopter Military Helicopter
Plane 1 Plane
Military Plane Military Plane
Snowmobile Snowmobile
Snowcat Snowcat
ATV ATV
Motorcycle Motorcycle
Boat Boat
Four-Wheel drive Four-Wheel drive
Specialized vehicles Specialized vehicles
Two-Wheel drive Two-Wheel drive
Other equipment Other equipment
HOURS MILES
TRANSPORTATION
HOURS OF PAID WORK
CAP Divers BLM
Forest Service Other Feds Explorers
Mt Rescue Dog team Jeep club
Ski patrol Horse team Fire Service
Law Enforcement State Agency 1
Other
HOURS OF VOLUNTEER WORK
Amateur radio
CAP 20 Divers BLM
Forest Service Other Feds Explorers
Mt Rescue Dog team Jeep club
Horse team Fire Service
Law Enforcement State Agency
Other
Ski patrol
UNBUDGETED COSTS FOR SEARCH AND RESCUE
Food $0.00 Fuel $0.00 Lodging $0.00 Other $0.00
Total Transportation Hours 1
Total Transportation Miles
Total Paid Hours 1
Total Volunteer Hours 20
Total Cost $0.00
Sheriff's SAR
Sheriff's SAR

KlamathTotals for transportation use and work hours
20142014
Helicopter 2 Helicopter
Military Helicopter Military Helicopter
Plane Plane
Military Plane Military Plane
Snowmobile Snowmobile 24
Snowcat Snowcat
ATV ATV
Motorcycle Motorcycle
Boat 3 Boat
Four-Wheel drive Four-Wheel drive 4,033
Specialized vehicles Specialized vehicles
Two-Wheel drive Two-Wheel drive 160
Other equipment 6 Other equipment 70
HOURS MILES
TRANSPORTATION
HOURS OF PAID WORK
CAP Divers BLM
Forest Service 6 Other Feds Explorers
Mt Rescue Dog team Jeep club
Ski patrol Horse team Fire Service
Law Enforcement 308 State Agency 4
Other
HOURS OF VOLUNTEER WORK
Amateur radio
CAP Divers 75 BLM
Forest Service Other Feds Explorers
Mt Rescue Dog team Jeep club
Horse team Fire Service
Law Enforcement 17 State Agency
Other
Ski patrol
UNBUDGETED COSTS FOR SEARCH AND RESCUE
Food $0.00 Fuel $0.00 Lodging $0.00 Other $0.00
Total Transportation Hours 11
Total Transportation Miles 4,287
Total Paid Hours 320
Total Volunteer Hours 1,290
Total Cost $0.00
Sheriff's SAR 3
Sheriff's SAR 1,198
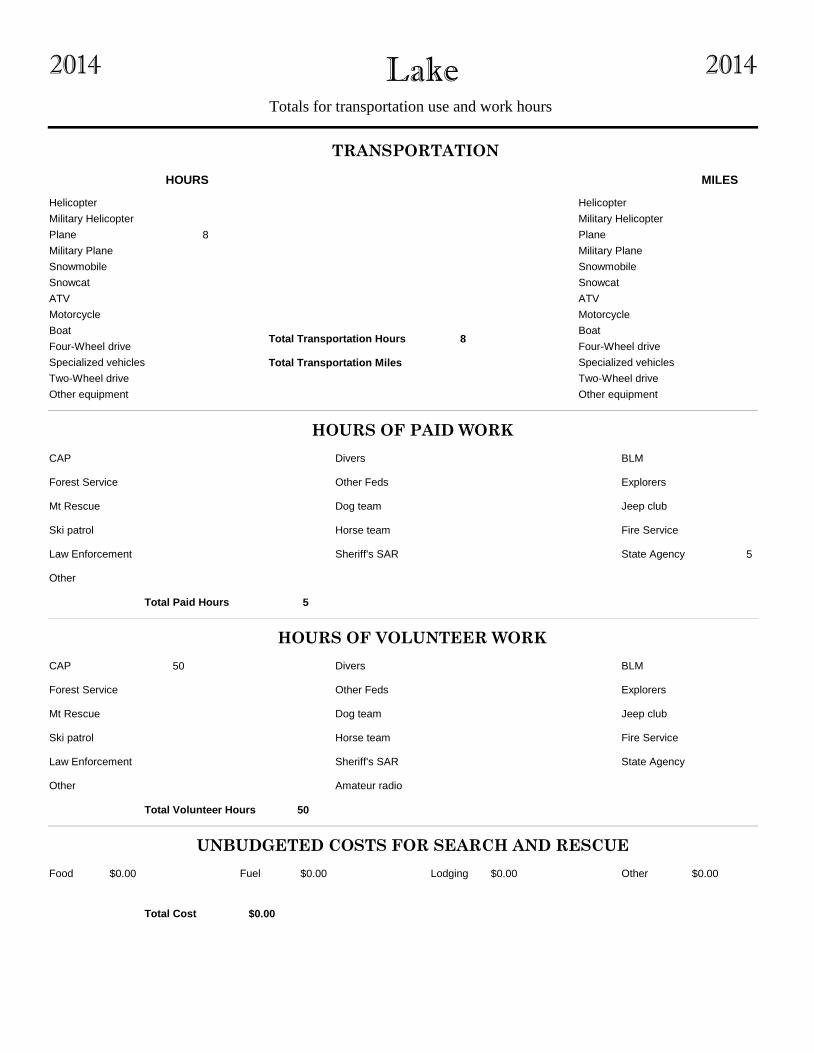
LakeTotals for transportation use and work hours
20142014
Helicopter Helicopter
Military Helicopter Military Helicopter
Plane 8 Plane
Military Plane Military Plane
Snowmobile Snowmobile
Snowcat Snowcat
ATV ATV
Motorcycle Motorcycle
Boat Boat
Four-Wheel drive Four-Wheel drive
Specialized vehicles Specialized vehicles
Two-Wheel drive Two-Wheel drive
Other equipment Other equipment
HOURS MILES
TRANSPORTATION
HOURS OF PAID WORK
CAP Divers BLM
Forest Service Other Feds Explorers
Mt Rescue Dog team Jeep club
Ski patrol Horse team Fire Service
Law Enforcement State Agency 5
Other
HOURS OF VOLUNTEER WORK
Amateur radio
CAP 50 Divers BLM
Forest Service Other Feds Explorers
Mt Rescue Dog team Jeep club
Horse team Fire Service
Law Enforcement State Agency
Other
Ski patrol
UNBUDGETED COSTS FOR SEARCH AND RESCUE
Food $0.00 Fuel $0.00 Lodging $0.00 Other $0.00
Total Transportation Hours 8
Total Transportation Miles
Total Paid Hours 5
Total Volunteer Hours 50
Total Cost $0.00
Sheriff's SAR
Sheriff's SAR
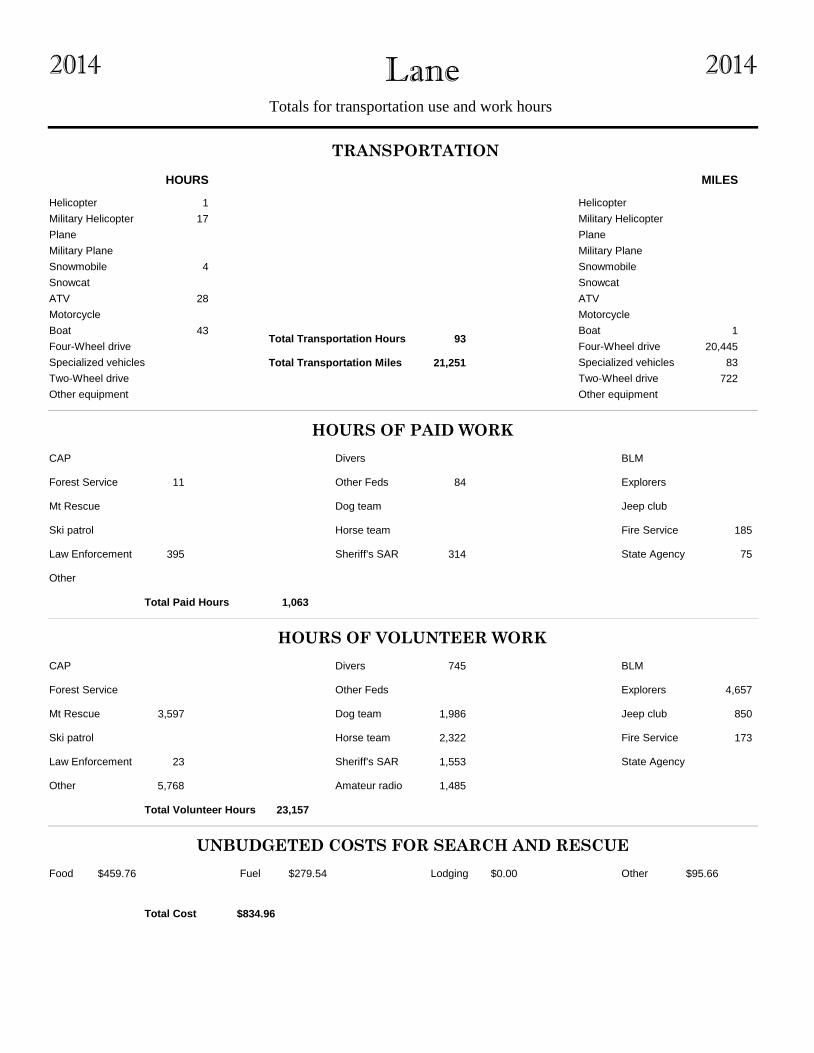
LaneTotals for transportation use and work hours
20142014
Helicopter 1 Helicopter
Military Helicopter 17 Military Helicopter
Plane Plane
Military Plane Military Plane
Snowmobile 4 Snowmobile
Snowcat Snowcat
ATV 28 ATV
Motorcycle Motorcycle
Boat 43 Boat 1
Four-Wheel drive Four-Wheel drive 20,445
Specialized vehicles Specialized vehicles 83
Two-Wheel drive Two-Wheel drive 722
Other equipment Other equipment
HOURS MILES
TRANSPORTATION
HOURS OF PAID WORK
CAP Divers BLM
Forest Service 11 Other Feds 84 Explorers
Mt Rescue Dog team Jeep club
Ski patrol Horse team Fire Service 185
Law Enforcement 395 State Agency 75
Other
HOURS OF VOLUNTEER WORK
Amateur radio 1,485
CAP Divers 745 BLM
Forest Service Other Feds Explorers 4,657
Mt Rescue 3,597 Dog team 1,986 Jeep club 850
Horse team 2,322 Fire Service 173
Law Enforcement 23 State Agency
Other 5,768
Ski patrol
UNBUDGETED COSTS FOR SEARCH AND RESCUE
Food $459.76 Fuel $279.54 Lodging $0.00 Other $95.66
Total Transportation Hours 93
Total Transportation Miles 21,251
Total Paid Hours 1,063
Total Volunteer Hours 23,157
Total Cost $834.96
Sheriff's SAR 314
Sheriff's SAR 1,553

LincolnTotals for transportation use and work hours
20142014
Helicopter 6 Helicopter
Military Helicopter 2 Military Helicopter
Plane Plane
Military Plane Military Plane
Snowmobile Snowmobile
Snowcat Snowcat
ATV ATV
Motorcycle Motorcycle
Boat 6 Boat
Four-Wheel drive 11 Four-Wheel drive
Specialized vehicles Specialized vehicles
Two-Wheel drive 2 Two-Wheel drive
Other equipment Other equipment
HOURS MILES
TRANSPORTATION
HOURS OF PAID WORK
CAP Divers BLM
Forest Service Other Feds Explorers
Mt Rescue Dog team Jeep club
Ski patrol Horse team Fire Service 46
Law Enforcement 261 State Agency 2
Other
HOURS OF VOLUNTEER WORK
Amateur radio
CAP Divers BLM
Forest Service Other Feds Explorers
Mt Rescue Dog team Jeep club
Horse team Fire Service 36
Law Enforcement State Agency
Other
Ski patrol
UNBUDGETED COSTS FOR SEARCH AND RESCUE
Food $0.00 Fuel $0.00 Lodging $0.00 Other $50.00
Total Transportation Hours 27
Total Transportation Miles
Total Paid Hours 309
Total Volunteer Hours 267
Total Cost $50.00
Sheriff's SAR
Sheriff's SAR 231

LinnTotals for transportation use and work hours
20142014
Helicopter Helicopter
Military Helicopter 1 Military Helicopter
Plane Plane
Military Plane Military Plane
Snowmobile 2 Snowmobile
Snowcat Snowcat
ATV ATV
Motorcycle Motorcycle
Boat Boat
Four-Wheel drive 46 Four-Wheel drive
Specialized vehicles Specialized vehicles
Two-Wheel drive Two-Wheel drive
Other equipment Other equipment
HOURS MILES
TRANSPORTATION
HOURS OF PAID WORK
CAP Divers BLM
Forest Service Other Feds Explorers
Mt Rescue Dog team Jeep club
Ski patrol Horse team Fire Service
Law Enforcement 103 State Agency 1
Other
HOURS OF VOLUNTEER WORK
Amateur radio
CAP Divers 2 BLM
Forest Service Other Feds Explorers
Mt Rescue Dog team Jeep club
Horse team 12 Fire Service
Law Enforcement State Agency
Other 5
Ski patrol
UNBUDGETED COSTS FOR SEARCH AND RESCUE
Food $0.00 Fuel $0.00 Lodging $0.00 Other $0.00
Total Transportation Hours 49
Total Transportation Miles
Total Paid Hours 119
Total Volunteer Hours 135
Total Cost $0.00
Sheriff's SAR 16
Sheriff's SAR 116

MalheurTotals for transportation use and work hours
20142014
Helicopter Helicopter
Military Helicopter Military Helicopter
Plane Plane
Military Plane Military Plane
Snowmobile Snowmobile
Snowcat Snowcat
ATV 14 ATV
Motorcycle Motorcycle
Boat 6 Boat
Four-Wheel drive 28 Four-Wheel drive 184
Specialized vehicles Specialized vehicles
Two-Wheel drive Two-Wheel drive
Other equipment Other equipment
HOURS MILES
TRANSPORTATION
HOURS OF PAID WORK
CAP Divers BLM
Forest Service Other Feds Explorers
Mt Rescue Dog team Jeep club
Ski patrol Horse team Fire Service 6
Law Enforcement 34 State Agency 1
Other
HOURS OF VOLUNTEER WORK
Amateur radio
CAP Divers BLM
Forest Service Other Feds Explorers
Mt Rescue Dog team Jeep club
Horse team Fire Service
Law Enforcement 10 State Agency
Other 4
Ski patrol
UNBUDGETED COSTS FOR SEARCH AND RESCUE
Food $0.00 Fuel $0.00 Lodging $0.00 Other $0.00
Total Transportation Hours 48
Total Transportation Miles 184
Total Paid Hours 41
Total Volunteer Hours 288
Total Cost $0.00
Sheriff's SAR
Sheriff's SAR 274
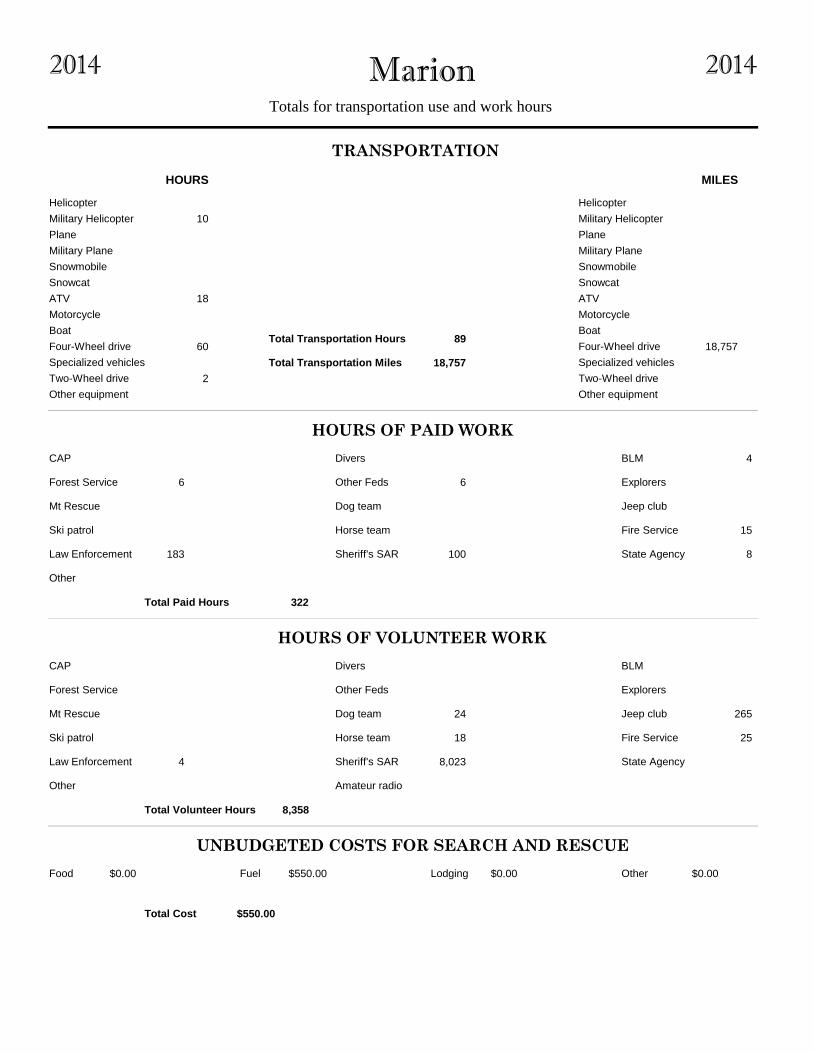
MarionTotals for transportation use and work hours
20142014
Helicopter Helicopter
Military Helicopter 10 Military Helicopter
Plane Plane
Military Plane Military Plane
Snowmobile Snowmobile
Snowcat Snowcat
ATV 18 ATV
Motorcycle Motorcycle
Boat Boat
Four-Wheel drive 60 Four-Wheel drive 18,757
Specialized vehicles Specialized vehicles
Two-Wheel drive 2 Two-Wheel drive
Other equipment Other equipment
HOURS MILES
TRANSPORTATION
HOURS OF PAID WORK
CAP Divers BLM 4
Forest Service 6 Other Feds 6 Explorers
Mt Rescue Dog team Jeep club
Ski patrol Horse team Fire Service 15
Law Enforcement 183 State Agency 8
Other
HOURS OF VOLUNTEER WORK
Amateur radio
CAP Divers BLM
Forest Service Other Feds Explorers
Mt Rescue Dog team 24 Jeep club 265
Horse team 18 Fire Service 25
Law Enforcement 4 State Agency
Other
Ski patrol
UNBUDGETED COSTS FOR SEARCH AND RESCUE
Food $0.00 Fuel $550.00 Lodging $0.00 Other $0.00
Total Transportation Hours 89
Total Transportation Miles 18,757
Total Paid Hours 322
Total Volunteer Hours 8,358
Total Cost $550.00
Sheriff's SAR 100
Sheriff's SAR 8,023

MorrowTotals for transportation use and work hours
20142014
Helicopter Helicopter
Military Helicopter Military Helicopter
Plane Plane
Military Plane Military Plane
Snowmobile Snowmobile
Snowcat Snowcat
ATV ATV
Motorcycle Motorcycle
Boat Boat
Four-Wheel drive Four-Wheel drive 45
Specialized vehicles Specialized vehicles
Two-Wheel drive Two-Wheel drive 20
Other equipment Other equipment
HOURS MILES
TRANSPORTATION
HOURS OF PAID WORK
CAP Divers BLM
Forest Service Other Feds Explorers
Mt Rescue Dog team Jeep club
Ski patrol Horse team Fire Service
Law Enforcement 3 State Agency
Other
HOURS OF VOLUNTEER WORK
Amateur radio
CAP Divers BLM
Forest Service Other Feds Explorers
Mt Rescue Dog team Jeep club
Horse team Fire Service
Law Enforcement State Agency
Other
Ski patrol
UNBUDGETED COSTS FOR SEARCH AND RESCUE
Food $0.00 Fuel $0.00 Lodging $0.00 Other $0.00
Total Transportation Hours
Total Transportation Miles 65
Total Paid Hours 3
Total Volunteer Hours
Total Cost $0.00
Sheriff's SAR
Sheriff's SAR

MultnomahTotals for transportation use and work hours
20142014
Helicopter 2 Helicopter
Military Helicopter 2 Military Helicopter
Plane 17 Plane
Military Plane Military Plane
Snowmobile Snowmobile
Snowcat Snowcat
ATV 6 ATV
Motorcycle 6 Motorcycle
Boat 149 Boat
Four-Wheel drive 5 Four-Wheel drive 10,549
Specialized vehicles 2 Specialized vehicles 1,618
Two-Wheel drive 96 Two-Wheel drive 8,289
Other equipment Other equipment 130
HOURS MILES
TRANSPORTATION
HOURS OF PAID WORK
CAP Divers 797 BLM
Forest Service 12 Other Feds 36 Explorers
Mt Rescue Dog team 6 Jeep club
Ski patrol Horse team 4 Fire Service 423
Law Enforcement 957 State Agency 9
Other 12
HOURS OF VOLUNTEER WORK
Amateur radio 403
CAP 30 Divers 90 BLM
Forest Service Other Feds 4 Explorers
Mt Rescue 362 Dog team 191 Jeep club
Horse team Fire Service 32
Law Enforcement 14 State Agency
Other 13
Ski patrol
UNBUDGETED COSTS FOR SEARCH AND RESCUE
Food $459.06 Fuel $0.00 Lodging $0.00 Other $0.00
Total Transportation Hours 285
Total Transportation Miles 20,586
Total Paid Hours 3,027
Total Volunteer Hours 18,324
Total Cost $459.06
Sheriff's SAR 771
Sheriff's SAR 17,186

PolkTotals for transportation use and work hours
20142014
Helicopter Helicopter
Military Helicopter Military Helicopter
Plane Plane
Military Plane Military Plane
Snowmobile Snowmobile
Snowcat Snowcat
ATV ATV
Motorcycle Motorcycle
Boat Boat
Four-Wheel drive 64 Four-Wheel drive 20
Specialized vehicles Specialized vehicles
Two-Wheel drive Two-Wheel drive
Other equipment Other equipment
HOURS MILES
TRANSPORTATION
HOURS OF PAID WORK
CAP Divers BLM
Forest Service Other Feds Explorers
Mt Rescue Dog team Jeep club
Ski patrol Horse team Fire Service
Law Enforcement 2 State Agency
Other
HOURS OF VOLUNTEER WORK
Amateur radio
CAP Divers BLM
Forest Service Other Feds Explorers
Mt Rescue Dog team Jeep club
Horse team Fire Service
Law Enforcement State Agency
Other
Ski patrol
UNBUDGETED COSTS FOR SEARCH AND RESCUE
Food $0.00 Fuel $160.00 Lodging $0.00 Other $0.00
Total Transportation Hours 64
Total Transportation Miles 20
Total Paid Hours 38
Total Volunteer Hours 122
Total Cost $160.00
Sheriff's SAR 36
Sheriff's SAR 122
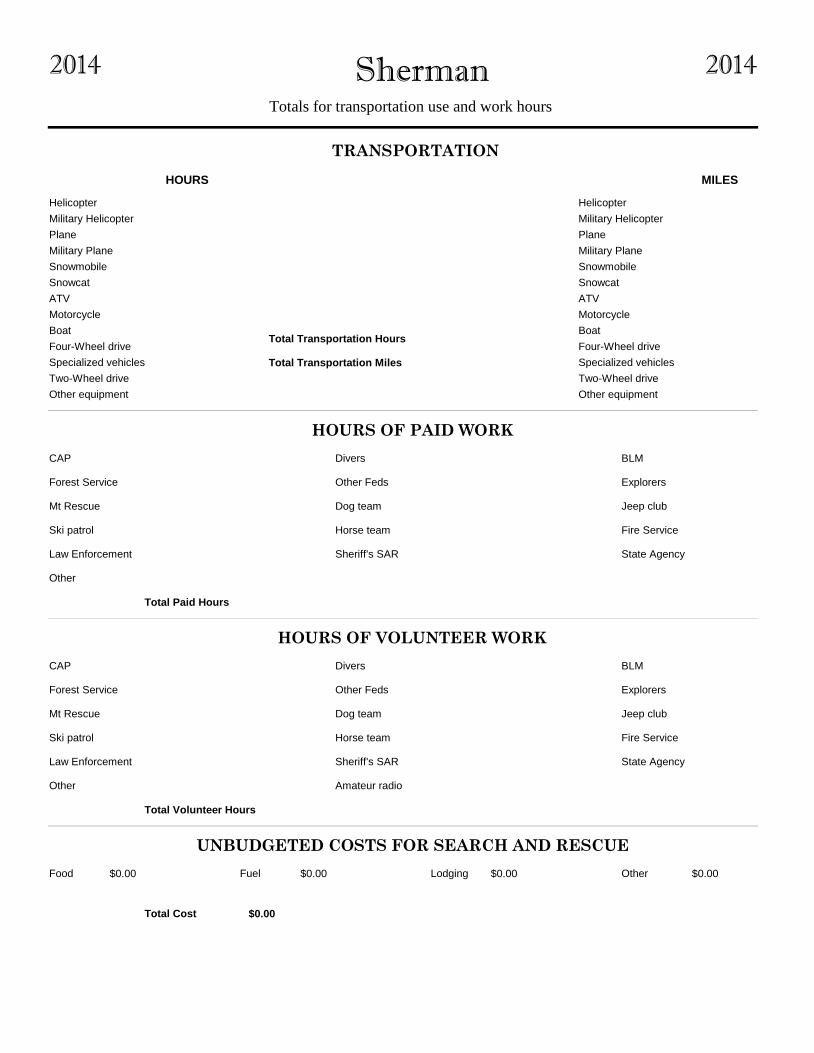
ShermanTotals for transportation use and work hours
20142014
Helicopter Helicopter
Military Helicopter Military Helicopter
Plane Plane
Military Plane Military Plane
Snowmobile Snowmobile
Snowcat Snowcat
ATV ATV
Motorcycle Motorcycle
Boat Boat
Four-Wheel drive Four-Wheel drive
Specialized vehicles Specialized vehicles
Two-Wheel drive Two-Wheel drive
Other equipment Other equipment
HOURS MILES
TRANSPORTATION
HOURS OF PAID WORK
CAP Divers BLM
Forest Service Other Feds Explorers
Mt Rescue Dog team Jeep club
Ski patrol Horse team Fire Service
Law Enforcement State Agency
Other
HOURS OF VOLUNTEER WORK
Amateur radio
CAP Divers BLM
Forest Service Other Feds Explorers
Mt Rescue Dog team Jeep club
Horse team Fire Service
Law Enforcement State Agency
Other
Ski patrol
UNBUDGETED COSTS FOR SEARCH AND RESCUE
Food $0.00 Fuel $0.00 Lodging $0.00 Other $0.00
Total Transportation Hours
Total Transportation Miles
Total Paid Hours
Total Volunteer Hours
Total Cost $0.00
Sheriff's SAR
Sheriff's SAR

TillamookTotals for transportation use and work hours
20142014
Helicopter 4 Helicopter
Military Helicopter 27 Military Helicopter
Plane Plane
Military Plane Military Plane
Snowmobile Snowmobile
Snowcat Snowcat
ATV ATV
Motorcycle Motorcycle
Boat 10 Boat
Four-Wheel drive 1,242 Four-Wheel drive
Specialized vehicles Specialized vehicles
Two-Wheel drive 380 Two-Wheel drive 175
Other equipment Other equipment
HOURS MILES
TRANSPORTATION
HOURS OF PAID WORK
CAP Divers 12 BLM
Forest Service Other Feds 10 Explorers
Mt Rescue Dog team Jeep club 126
Ski patrol Horse team Fire Service
Law Enforcement 694 State Agency 156
Other
HOURS OF VOLUNTEER WORK
Amateur radio
CAP Divers 12 BLM
Forest Service Other Feds Explorers
Mt Rescue Dog team Jeep club 40
Horse team Fire Service 99
Law Enforcement State Agency
Other
Ski patrol
UNBUDGETED COSTS FOR SEARCH AND RESCUE
Food $2,500.00 Fuel $4,500.00 Lodging $0.00 Other $800.00
Total Transportation Hours 1,663
Total Transportation Miles 175
Total Paid Hours 2,558
Total Volunteer Hours 3,567
Total Cost $7,800.00
Sheriff's SAR 1,560
Sheriff's SAR 3,416

UmatillaTotals for transportation use and work hours
20142014
Helicopter Helicopter
Military Helicopter 7 Military Helicopter
Plane Plane
Military Plane Military Plane
Snowmobile Snowmobile
Snowcat Snowcat
ATV ATV
Motorcycle Motorcycle
Boat 30 Boat
Four-Wheel drive 14 Four-Wheel drive 3,143
Specialized vehicles Specialized vehicles
Two-Wheel drive Two-Wheel drive
Other equipment Other equipment
HOURS MILES
TRANSPORTATION
HOURS OF PAID WORK
CAP Divers BLM
Forest Service 25 Other Feds 6 Explorers
Mt Rescue Dog team Jeep club
Ski patrol Horse team Fire Service
Law Enforcement 77 State Agency 3
Other 16
HOURS OF VOLUNTEER WORK
Amateur radio
CAP Divers BLM
Forest Service Other Feds Explorers
Mt Rescue Dog team Jeep club
Horse team Fire Service
Law Enforcement State Agency
Other 167
Ski patrol
UNBUDGETED COSTS FOR SEARCH AND RESCUE
Food $0.00 Fuel $546.00 Lodging $0.00 Other $0.00
Total Transportation Hours 51
Total Transportation Miles 3,143
Total Paid Hours 227
Total Volunteer Hours 551
Total Cost $546.00
Sheriff's SAR 101
Sheriff's SAR 384

UnionTotals for transportation use and work hours
20142014
Helicopter Helicopter
Military Helicopter Military Helicopter
Plane 9 Plane
Military Plane Military Plane
Snowmobile Snowmobile
Snowcat Snowcat
ATV ATV 191
Motorcycle Motorcycle
Boat Boat
Four-Wheel drive 3 Four-Wheel drive 2,986
Specialized vehicles Specialized vehicles
Two-Wheel drive Two-Wheel drive 2,433
Other equipment Other equipment
HOURS MILES
TRANSPORTATION
HOURS OF PAID WORK
CAP Divers BLM
Forest Service Other Feds Explorers
Mt Rescue Dog team Jeep club
Ski patrol Horse team Fire Service
Law Enforcement 126 State Agency 1
Other
HOURS OF VOLUNTEER WORK
Amateur radio
CAP 80 Divers BLM
Forest Service Other Feds Explorers
Mt Rescue Dog team Jeep club
Horse team Fire Service
Law Enforcement State Agency
Other
Ski patrol
UNBUDGETED COSTS FOR SEARCH AND RESCUE
Food $150.00 Fuel $160.00 Lodging $0.00 Other $0.00
Total Transportation Hours 12
Total Transportation Miles 5,610
Total Paid Hours 134
Total Volunteer Hours 1,410
Total Cost $310.00
Sheriff's SAR 7
Sheriff's SAR 1,330

WallowaTotals for transportation use and work hours
20142014
Helicopter Helicopter
Military Helicopter 5 Military Helicopter
Plane Plane
Military Plane Military Plane
Snowmobile Snowmobile
Snowcat Snowcat
ATV 6 ATV
Motorcycle Motorcycle
Boat Boat
Four-Wheel drive 23 Four-Wheel drive 1,345
Specialized vehicles Specialized vehicles 160
Two-Wheel drive Two-Wheel drive
Other equipment 10 Other equipment
HOURS MILES
TRANSPORTATION
HOURS OF PAID WORK
CAP Divers BLM
Forest Service Other Feds Explorers
Mt Rescue Dog team Jeep club
Ski patrol Horse team Fire Service
Law Enforcement 9 State Agency 3
Other 16
HOURS OF VOLUNTEER WORK
Amateur radio
CAP Divers BLM
Forest Service Other Feds Explorers
Mt Rescue Dog team 22 Jeep club
Horse team 10 Fire Service
Law Enforcement State Agency
Other 115
Ski patrol
UNBUDGETED COSTS FOR SEARCH AND RESCUE
Food $0.00 Fuel $0.00 Lodging $0.00 Other $0.00
Total Transportation Hours 44
Total Transportation Miles 1,505
Total Paid Hours 28
Total Volunteer Hours 230
Total Cost $0.00
Sheriff's SAR
Sheriff's SAR 83
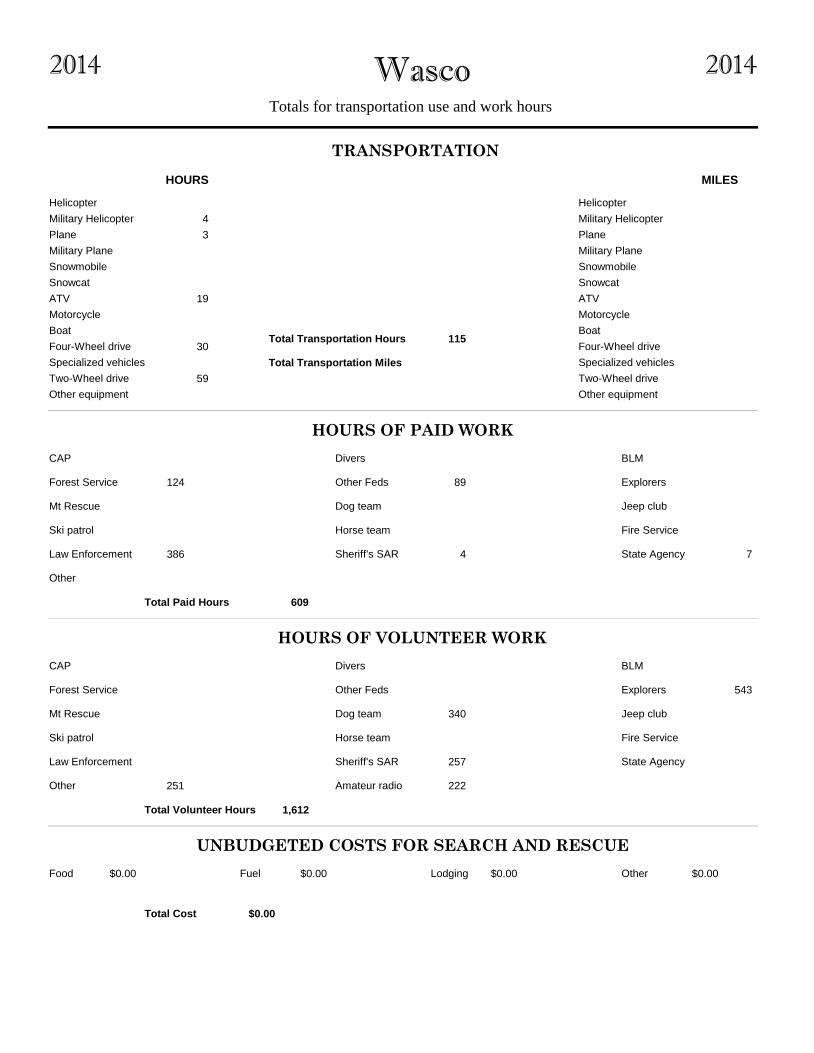
WascoTotals for transportation use and work hours
20142014
Helicopter Helicopter
Military Helicopter 4 Military Helicopter
Plane 3 Plane
Military Plane Military Plane
Snowmobile Snowmobile
Snowcat Snowcat
ATV 19 ATV
Motorcycle Motorcycle
Boat Boat
Four-Wheel drive 30 Four-Wheel drive
Specialized vehicles Specialized vehicles
Two-Wheel drive 59 Two-Wheel drive
Other equipment Other equipment
HOURS MILES
TRANSPORTATION
HOURS OF PAID WORK
CAP Divers BLM
Forest Service 124 Other Feds 89 Explorers
Mt Rescue Dog team Jeep club
Ski patrol Horse team Fire Service
Law Enforcement 386 State Agency 7
Other
HOURS OF VOLUNTEER WORK
Amateur radio 222
CAP Divers BLM
Forest Service Other Feds Explorers 543
Mt Rescue Dog team 340 Jeep club
Horse team Fire Service
Law Enforcement State Agency
Other 251
Ski patrol
UNBUDGETED COSTS FOR SEARCH AND RESCUE
Food $0.00 Fuel $0.00 Lodging $0.00 Other $0.00
Total Transportation Hours 115
Total Transportation Miles
Total Paid Hours 609
Total Volunteer Hours 1,612
Total Cost $0.00
Sheriff's SAR 4
Sheriff's SAR 257

WashingtonTotals for transportation use and work hours
20142014
Helicopter Helicopter
Military Helicopter Military Helicopter
Plane Plane
Military Plane Military Plane
Snowmobile Snowmobile
Snowcat Snowcat
ATV 5 ATV
Motorcycle Motorcycle
Boat Boat
Four-Wheel drive 7 Four-Wheel drive
Specialized vehicles Specialized vehicles
Two-Wheel drive Two-Wheel drive
Other equipment Other equipment
HOURS MILES
TRANSPORTATION
HOURS OF PAID WORK
CAP Divers BLM
Forest Service 2 Other Feds Explorers
Mt Rescue Dog team 4 Jeep club
Ski patrol Horse team 16 Fire Service
Law Enforcement 413 State Agency 1
Other
HOURS OF VOLUNTEER WORK
Amateur radio 63
CAP Divers BLM
Forest Service Other Feds Explorers 36
Mt Rescue Dog team 46 Jeep club 6
Horse team Fire Service
Law Enforcement State Agency
Other 267
Ski patrol
UNBUDGETED COSTS FOR SEARCH AND RESCUE
Food $1,022.74 Fuel $0.00 Lodging $0.00 Other $0.00
Total Transportation Hours 12
Total Transportation Miles
Total Paid Hours 751
Total Volunteer Hours 840
Total Cost $1,022.74
Sheriff's SAR 316
Sheriff's SAR 422

WheelerTotals for transportation use and work hours
20142014
Helicopter Helicopter
Military Helicopter Military Helicopter
Plane Plane
Military Plane Military Plane
Snowmobile Snowmobile
Snowcat Snowcat
ATV ATV
Motorcycle Motorcycle
Boat Boat
Four-Wheel drive Four-Wheel drive 2,977
Specialized vehicles Specialized vehicles
Two-Wheel drive Two-Wheel drive
Other equipment Other equipment
HOURS MILES
TRANSPORTATION
HOURS OF PAID WORK
CAP Divers BLM
Forest Service Other Feds Explorers
Mt Rescue Dog team Jeep club
Ski patrol Horse team Fire Service
Law Enforcement 7 State Agency
Other
HOURS OF VOLUNTEER WORK
Amateur radio
CAP Divers BLM
Forest Service Other Feds Explorers
Mt Rescue Dog team Jeep club
Horse team Fire Service
Law Enforcement State Agency
Other
Ski patrol
UNBUDGETED COSTS FOR SEARCH AND RESCUE
Food $0.00 Fuel $25.00 Lodging $0.00 Other $0.00
Total Transportation Hours
Total Transportation Miles 2,977
Total Paid Hours 11
Total Volunteer Hours 334
Total Cost $25.00
Sheriff's SAR 4
Sheriff's SAR 334
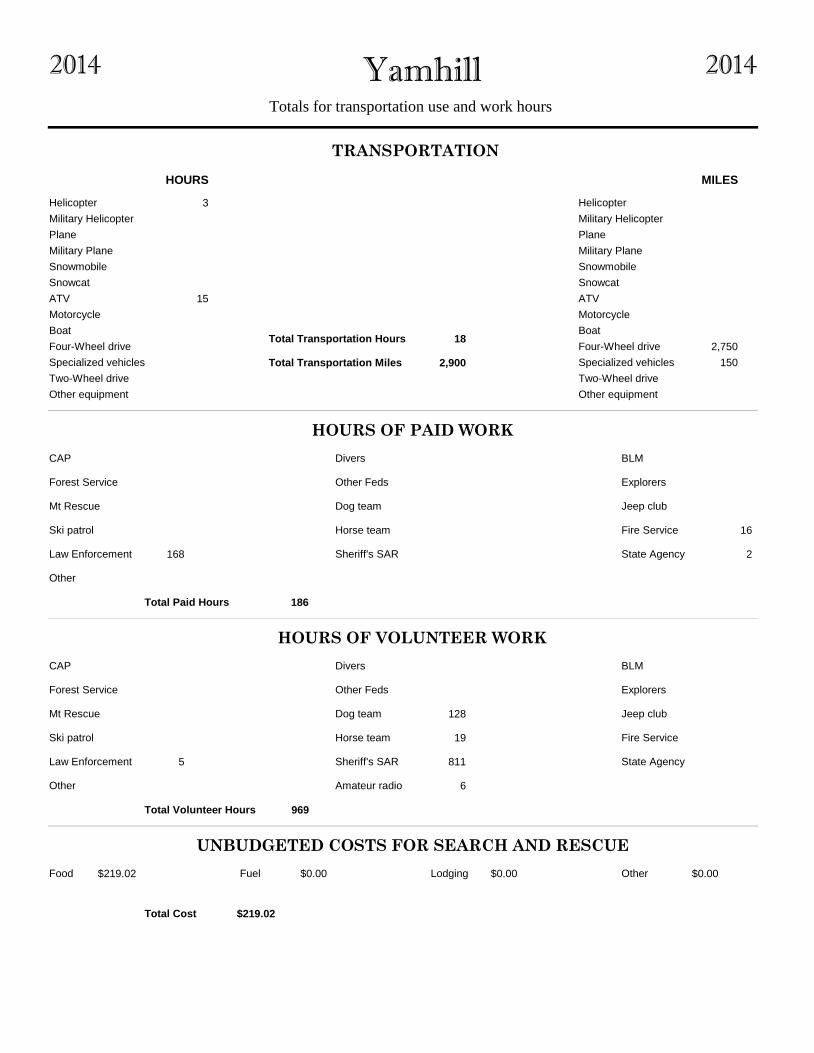
YamhillTotals for transportation use and work hours
20142014
Helicopter 3 Helicopter
Military Helicopter Military Helicopter
Plane Plane
Military Plane Military Plane
Snowmobile Snowmobile
Snowcat Snowcat
ATV 15 ATV
Motorcycle Motorcycle
Boat Boat
Four-Wheel drive Four-Wheel drive 2,750
Specialized vehicles Specialized vehicles 150
Two-Wheel drive Two-Wheel drive
Other equipment Other equipment
HOURS MILES
TRANSPORTATION
HOURS OF PAID WORK
CAP Divers BLM
Forest Service Other Feds Explorers
Mt Rescue Dog team Jeep club
Ski patrol Horse team Fire Service 16
Law Enforcement 168 State Agency 2
Other
HOURS OF VOLUNTEER WORK
Amateur radio 6
CAP Divers BLM
Forest Service Other Feds Explorers
Mt Rescue Dog team 128 Jeep club
Horse team 19 Fire Service
Law Enforcement 5 State Agency
Other
Ski patrol
UNBUDGETED COSTS FOR SEARCH AND RESCUE
Food $219.02 Fuel $0.00 Lodging $0.00 Other $0.00
Total Transportation Hours 18
Total Transportation Miles 2,900
Total Paid Hours 186
Total Volunteer Hours 969
Total Cost $219.02
Sheriff's SAR
Sheriff's SAR 811
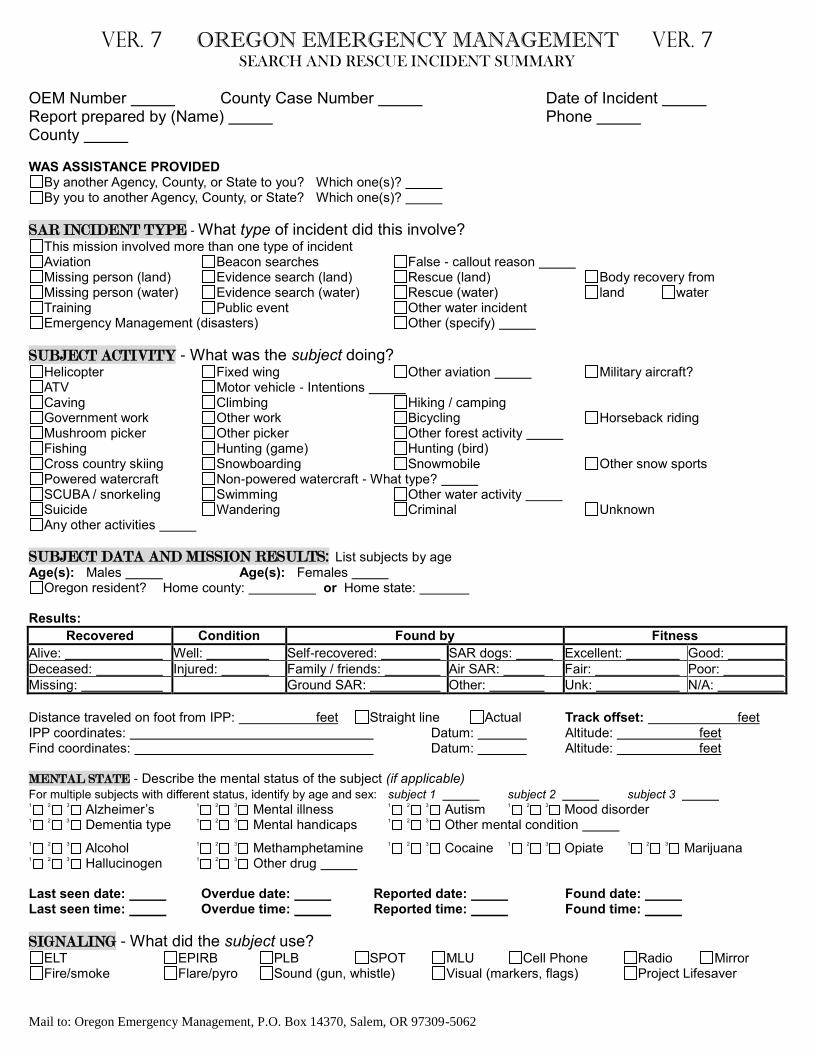
Mail to: Oregon Emergency Management, P.O. Box 14370, Salem, OR 97309-5062
Ver. 7 OREGON EMERGENCY MANAGEMENT Ver. 7 SEARCH AND RESCUE INCIDENT SUMMARY
OEM Number County Case Number Date of Incident Report prepared by (Name) Phone County WAS ASSISTANCE PROVIDED
By another Agency, County, or State to you? Which one(s)? By you to another Agency, County, or State? Which one(s)?
SAR INCIDENT TYPE - What type of incident did this involve?
This mission involved more than one type of incident Aviation Beacon searches False - callout reason Missing person (land) Evidence search (land) Rescue (land) Body recovery from Missing person (water) Evidence search (water) Rescue (water) land water Training Public event Other water incident Emergency Management (disasters) Other (specify)
SUBJECT ACTIVITY - What was the subject doing?
Helicopter Fixed wing Other aviation Military aircraft? ATV Motor vehicle - Intentions Caving Climbing Hiking / camping Government work Other work Bicycling Horseback riding Mushroom picker Other picker Other forest activity Fishing Hunting (game) Hunting (bird) Cross country skiing Snowboarding Snowmobile Other snow sports Powered watercraft Non-powered watercraft - What type? SCUBA / snorkeling Swimming Other water activity Suicide Wandering Criminal Unknown Any other activities
SUBJECT DATA AND MISSION RESULTS: List subjects by age Age(s): Males Age(s): Females
Oregon resident? Home county: or Home state: Results:
Recovered Condition Found by Fitness
Alive: Well: Self-recovered: SAR dogs: Excellent: Good:
Deceased: Injured: Family / friends: Air SAR: Fair: Poor:
Missing: Ground SAR: Other: Unk: N/A:
Distance traveled on foot from IPP: feet Straight line Actual Track offset: feet IPP coordinates: Datum: Altitude: feet Find coordinates: Datum: Altitude: feet MENTAL STATE - Describe the mental status of the subject (if applicable) For multiple subjects with different status, identify by age and sex: subject 1 subject 2 subject 3 1
2
3
Alzheimer’s 1
2
3
Mental illness 1
2
3
Autism 1
2
3
Mood disorder 1
2
3
Dementia type 1
2
3
Mental handicaps 1
2
3
Other mental condition
1
2
3
Alcohol 1
2
3
Methamphetamine 1
2
3
Cocaine 1
2
3
Opiate 1
2
3
Marijuana 1
2
3
Hallucinogen 1
2
3
Other drug Last seen date: Overdue date: Reported date: Found date: Last seen time: Overdue time: Reported time: Found time:
SIGNALING - What did the subject use?
ELT EPIRB PLB SPOT MLU Cell Phone Radio Mirror Fire/smoke Flare/pyro Sound (gun, whistle) Visual (markers, flags) Project Lifesaver
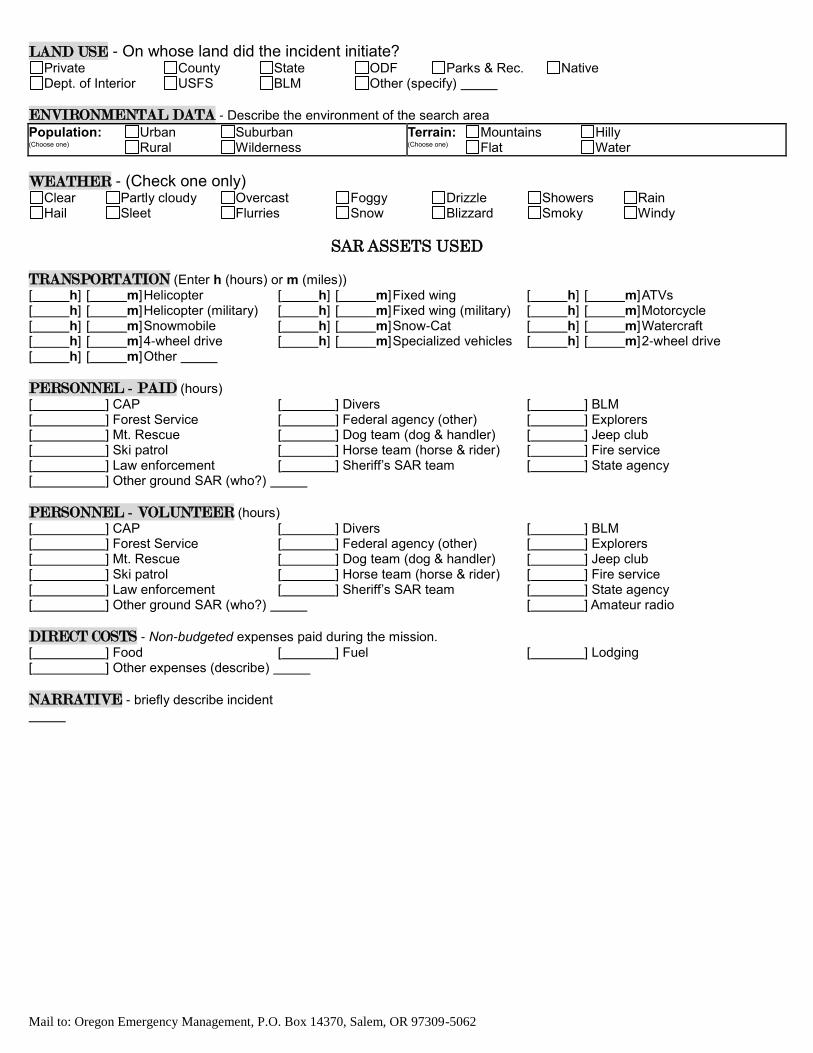
Mail to: Oregon Emergency Management, P.O. Box 14370, Salem, OR 97309-5062
LAND USE - On whose land did the incident initiate? Private County State ODF Parks & Rec. Native Dept. of Interior USFS BLM Other (specify)
ENVIRONMENTAL DATA - Describe the environment of the search area
Population: Urban Suburban (Choose one) Rural Wilderness
Terrain: Mountains Hilly (Choose one) Flat Water
WEATHER - (Check one only) Clear Partly cloudy Overcast Foggy Drizzle Showers Rain Hail Sleet Flurries Snow Blizzard Smoky Windy
SAR ASSETS USED
TRANSPORTATION (Enter h (hours) or m (miles)) [ h] [ m] Helicopter [ h] [ m] Fixed wing [ h] [ m] ATVs [ h] [ m] Helicopter (military) [ h] [ m] Fixed wing (military) [ h] [ m] Motorcycle [ h] [ m] Snowmobile [ h] [ m] Snow-Cat [ h] [ m] Watercraft [ h] [ m] 4-wheel drive [ h] [ m] Specialized vehicles [ h] [ m] 2-wheel drive [ h] [ m] Other
PERSONNEL - PAID (hours)
[ ] CAP [ ] Divers [ ] BLM [ ] Forest Service [ ] Federal agency (other) [ ] Explorers [ ] Mt. Rescue [ ] Dog team (dog & handler) [ ] Jeep club [ ] Ski patrol [ ] Horse team (horse & rider) [ ] Fire service [ ] Law enforcement [ ] Sheriff’s SAR team [ ] State agency [ ] Other ground SAR (who?)
PERSONNEL - VOLUNTEER (hours)
[ ] CAP [ ] Divers [ ] BLM [ ] Forest Service [ ] Federal agency (other) [ ] Explorers [ ] Mt. Rescue [ ] Dog team (dog & handler) [ ] Jeep club [ ] Ski patrol [ ] Horse team (horse & rider) [ ] Fire service [ ] Law enforcement [ ] Sheriff’s SAR team [ ] State agency [ ] Other ground SAR (who?) [ ] Amateur radio
DIRECT COSTS - Non-budgeted expenses paid during the mission.
[ ] Food [ ] Fuel [ ] Lodging [ ] Other expenses (describe)
NARRATIVE - briefly describe incident
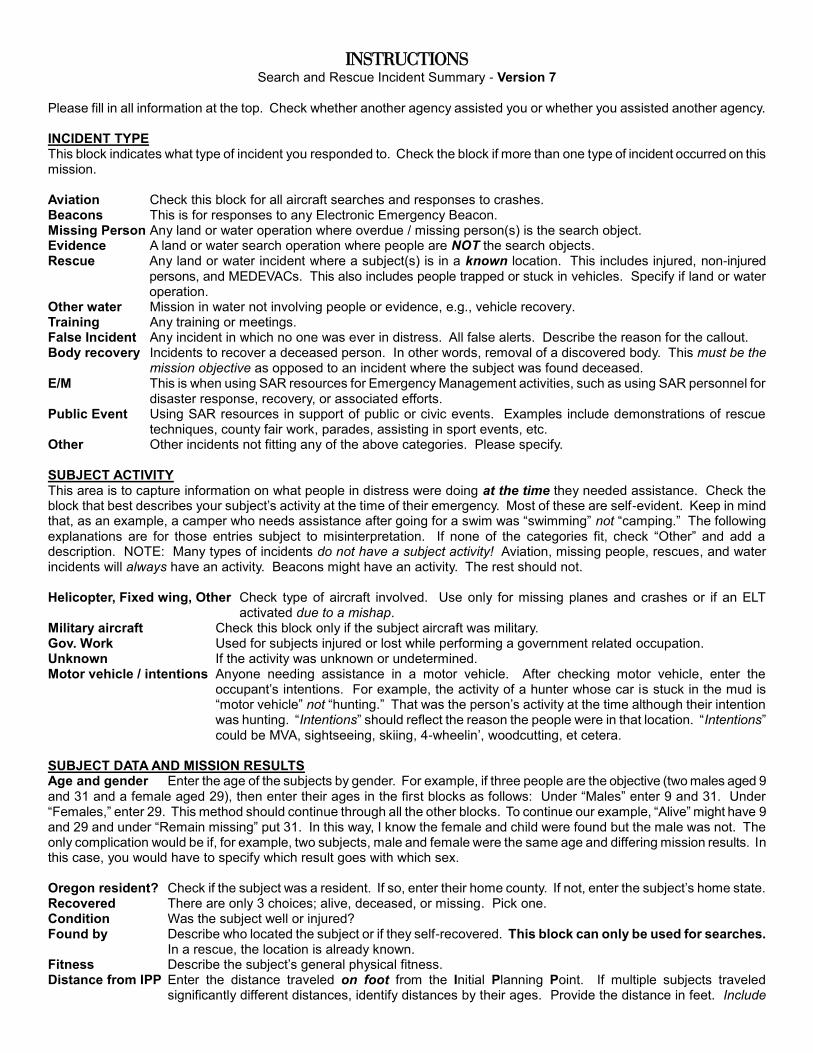
INSTRUCTIONS
Search and Rescue Incident Summary - Version 7 Please fill in all information at the top. Check whether another agency assisted you or whether you assisted another agency. INCIDENT TYPE This block indicates what type of incident you responded to. Check the block if more than one type of incident occurred on this mission. Aviation Check this block for all aircraft searches and responses to crashes. Beacons This is for responses to any Electronic Emergency Beacon. Missing Person Any land or water operation where overdue / missing person(s) is the search object. Evidence A land or water search operation where people are NOT the search objects. Rescue Any land or water incident where a subject(s) is in a known location. This includes injured, non-injured
persons, and MEDEVACs. This also includes people trapped or stuck in vehicles. Specify if land or water operation.
Other water Mission in water not involving people or evidence, e.g., vehicle recovery. Training Any training or meetings. False Incident Any incident in which no one was ever in distress. All false alerts. Describe the reason for the callout. Body recovery Incidents to recover a deceased person. In other words, removal of a discovered body. This must be the
mission objective as opposed to an incident where the subject was found deceased. E/M This is when using SAR resources for Emergency Management activities, such as using SAR personnel for
disaster response, recovery, or associated efforts. Public Event Using SAR resources in support of public or civic events. Examples include demonstrations of rescue
techniques, county fair work, parades, assisting in sport events, etc. Other Other incidents not fitting any of the above categories. Please specify. SUBJECT ACTIVITY This area is to capture information on what people in distress were doing at the time they needed assistance. Check the block that best describes your subject’s activity at the time of their emergency. Most of these are self-evident. Keep in mind that, as an example, a camper who needs assistance after going for a swim was “swimming” not “camping.” The following explanations are for those entries subject to misinterpretation. If none of the categories fit, check “Other” and add a description. NOTE: Many types of incidents do not have a subject activity! Aviation, missing people, rescues, and water incidents will always have an activity. Beacons might have an activity. The rest should not. Helicopter, Fixed wing, Other Check type of aircraft involved. Use only for missing planes and crashes or if an ELT
activated due to a mishap. Military aircraft Check this block only if the subject aircraft was military. Gov. Work Used for subjects injured or lost while performing a government related occupation. Unknown If the activity was unknown or undetermined. Motor vehicle / intentions Anyone needing assistance in a motor vehicle. After checking motor vehicle, enter the
occupant’s intentions. For example, the activity of a hunter whose car is stuck in the mud is “motor vehicle” not “hunting.” That was the person’s activity at the time although their intention was hunting. “Intentions” should reflect the reason the people were in that location. “Intentions” could be MVA, sightseeing, skiing, 4-wheelin’, woodcutting, et cetera.
SUBJECT DATA AND MISSION RESULTS Age and gender Enter the age of the subjects by gender. For example, if three people are the objective (two males aged 9 and 31 and a female aged 29), then enter their ages in the first blocks as follows: Under “Males” enter 9 and 31. Under “Females,” enter 29. This method should continue through all the other blocks. To continue our example, “Alive” might have 9 and 29 and under “Remain missing” put 31. In this way, I know the female and child were found but the male was not. The only complication would be if, for example, two subjects, male and female were the same age and differing mission results. In this case, you would have to specify which result goes with which sex. Oregon resident? Check if the subject was a resident. If so, enter their home county. If not, enter the subject’s home state. Recovered There are only 3 choices; alive, deceased, or missing. Pick one. Condition Was the subject well or injured? Found by Describe who located the subject or if they self-recovered. This block can only be used for searches.
In a rescue, the location is already known. Fitness Describe the subject’s general physical fitness. Distance from IPP Enter the distance traveled on foot from the Initial Planning Point. If multiple subjects traveled
significantly different distances, identify distances by their ages. Provide the distance in feet. Include
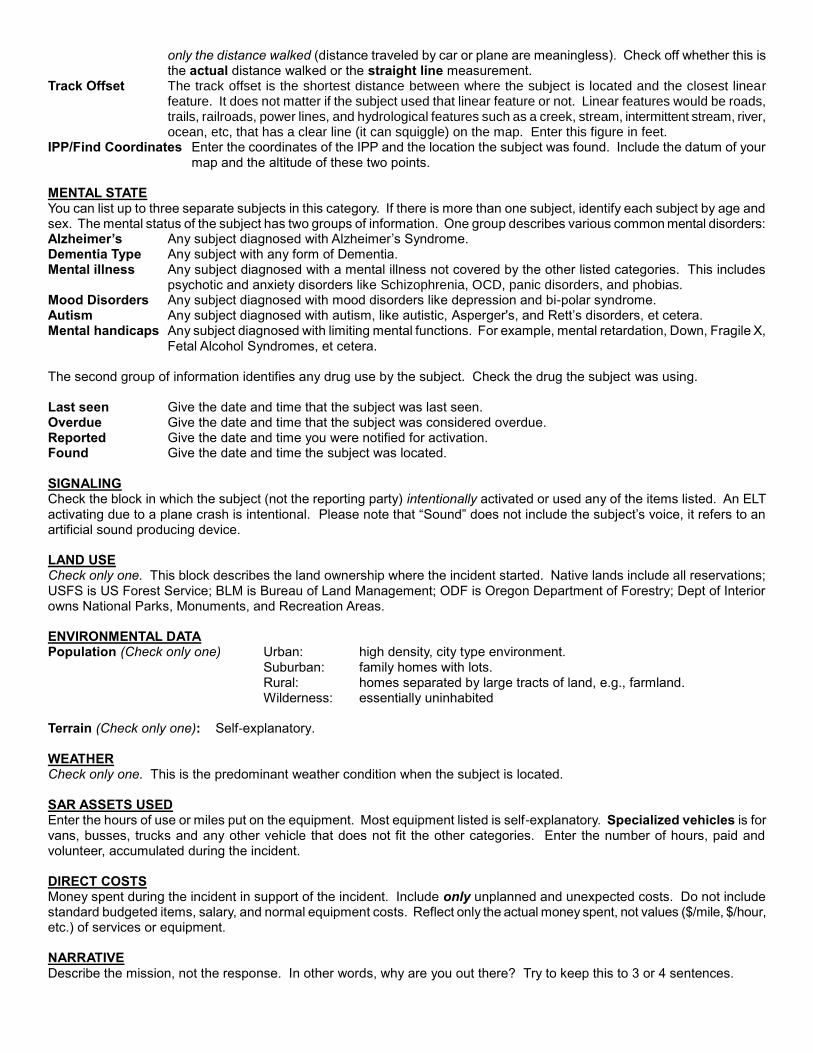
only the distance walked (distance traveled by car or plane are meaningless). Check off whether this is the actual distance walked or the straight line measurement.
Track Offset The track offset is the shortest distance between where the subject is located and the closest linear feature. It does not matter if the subject used that linear feature or not. Linear features would be roads, trails, railroads, power lines, and hydrological features such as a creek, stream, intermittent stream, river, ocean, etc, that has a clear line (it can squiggle) on the map. Enter this figure in feet.
IPP/Find Coordinates Enter the coordinates of the IPP and the location the subject was found. Include the datum of your map and the altitude of these two points.
MENTAL STATE You can list up to three separate subjects in this category. If there is more than one subject, identify each subject by age and sex. The mental status of the subject has two groups of information. One group describes various common mental disorders: Alzheimer’s Any subject diagnosed with Alzheimer’s Syndrome. Dementia Type Any subject with any form of Dementia. Mental illness Any subject diagnosed with a mental illness not covered by the other listed categories. This includes
psychotic and anxiety disorders like Schizophrenia, OCD, panic disorders, and phobias. Mood Disorders Any subject diagnosed with mood disorders like depression and bi-polar syndrome. Autism Any subject diagnosed with autism, like autistic, Asperger's, and Rett’s disorders, et cetera. Mental handicaps Any subject diagnosed with limiting mental functions. For example, mental retardation, Down, Fragile X,
Fetal Alcohol Syndromes, et cetera. The second group of information identifies any drug use by the subject. Check the drug the subject was using. Last seen Give the date and time that the subject was last seen. Overdue Give the date and time that the subject was considered overdue. Reported Give the date and time you were notified for activation. Found Give the date and time the subject was located. SIGNALING Check the block in which the subject (not the reporting party) intentionally activated or used any of the items listed. An ELT activating due to a plane crash is intentional. Please note that “Sound” does not include the subject’s voice, it refers to an artificial sound producing device. LAND USE Check only one. This block describes the land ownership where the incident started. Native lands include all reservations; USFS is US Forest Service; BLM is Bureau of Land Management; ODF is Oregon Department of Forestry; Dept of Interior owns National Parks, Monuments, and Recreation Areas. ENVIRONMENTAL DATA Population (Check only one) Urban: high density, city type environment.
Suburban: family homes with lots. Rural: homes separated by large tracts of land, e.g., farmland. Wilderness: essentially uninhabited
Terrain (Check only one): Self-explanatory. WEATHER Check only one. This is the predominant weather condition when the subject is located. SAR ASSETS USED Enter the hours of use or miles put on the equipment. Most equipment listed is self-explanatory. Specialized vehicles is for vans, busses, trucks and any other vehicle that does not fit the other categories. Enter the number of hours, paid and volunteer, accumulated during the incident. DIRECT COSTS Money spent during the incident in support of the incident. Include only unplanned and unexpected costs. Do not include standard budgeted items, salary, and normal equipment costs. Reflect only the actual money spent, not values ($/mile, $/hour, etc.) of services or equipment. NARRATIVE Describe the mission, not the response. In other words, why are you out there? Try to keep this to 3 or 4 sentences.
If you have any questions, comments, suggestions, critiques, or glorious praise of this report, please send them to: Search and Rescue Coordinator Oregon Emergency Management P.O. Box 14370 Salem, OR 97309-5062 You may also contact the State Search and Rescue Coordinator by e-mail at: