Embed Size (px)
Citation preview
Estuarine, Coastal and Shelf Science 65 (2005) 239e252
www.elsevier.com/locate/ECSS
Seasonality of coastal phytoplankton in the Baltic Sea:Influence of salinity and eutrophication
Z.R. Gasi�unait _e a,*, A.C. Cardoso b, A.-S. Heiskanen b, P. Henriksen c,P. Kauppila d, I. Olenina e, R. Pilkaityt _e a, I. Purina f, A. Razinkovas a,
S. Sagert g, H. Schubert g, N. Wasmund h
a Coastal Research and Planning Institute, Klaipeda University, H. Manto 84, LT 92294 Klaipeda, Lithuaniab EC e Joint Research Centre, Institute for Environment and Sustainability, TP 290, I-21020 Ispra, Italy
c Department of Marine Ecology, National Environmental Research Institute, Frederiksborgvej 399, DK-4000 Roskilde, Denmarkd Finnish Environment Institute, P.O. Box 140, FIN-00251 Finland
e Center of Marine Research, Taikos pr. 26, LT 91149 Klaipeda, Lithuaniaf Institute of Aquatic Ecology, University of Latvia, Daugavgrı�vas iela 8, LV-1048 Rı�ga, Latvia
g University of Rostock, Institute for Aquatic Ecology, Albert-Einstein-Str. 23, 18051 Rostock, Germanyh Baltic Sea Research Institute, Seestr. 15, D-18119 Warnemunde, Germany
Received 25 November 2004; accepted 30 May 2005
Available online 28 July 2005
Abstract
In this study long-term (1984e2001) phytoplankton and physico-chemical monitoring data representing different salinity regimesof the Baltic Sea were compiled from HELCOM, national and regional databases. The aim was to define seasonal succession
patterns of phytoplankton in seven different areas of the Baltic sea, characterised by different salinity, climate, and trophicconditions and to delineate a set of phytoplankton community indicators that are independent of season and salinity, but indicativeof trophic status of different coastal areas. The cluster analysis of the combined data set resulted in eight phytoplankton communitytypes, common for all locations, and characterised by different taxonomic composition representing different stages of seasonal
succession. A hierarchy of explanatory variables that best predicted the communities, dominated by either diatoms, cyanophytes,cryptophytes or dinoflagellates, was revealed through a redundancy analysis (RDA). Nutrients were not found to be significantfactors shaping the common phytoplankton community types for all locations. RDA analysis at the location level, covering all
seasonal succession stages, confirmed phytoplankton community composition to be sensitive to nutrient concentrations. Even withthe limitations of utilizing databases from different sources we identified community types that were indicative of climatic conditions(particularly temperature), salinity and eutrophication. The dominance of cyanobacteria as such, would not be an appropriate
indicator of trophic conditions in the Baltic Sea, in the areas where cyanobacteria blooms occur naturally. The structure of bothdiatom- and cyanophyte-dominated communities is governed by salinity, and thus the abundances of these groups cannot be directlyused as an indicator across the whole Baltic Sea.� 2005 Elsevier Ltd. All rights reserved.
Keywords: nutrients; geographic gradient; indicators
* Corresponding author.
E-mail address: [email protected] (Z.R. Gasi�unait_e).
0272-7714/$ - see front matter � 2005 Elsevier Ltd. All rights reserved.
doi:10.1016/j.ecss.2005.05.018
240 Z.R. Gasi�unait _e et al. / Estuarine, Coastal and Shelf Science 65 (2005) 239e252
1. Introduction
Eutrophication is a problem in many lakes (Vollen-weider and Kerekes, 1982) and marine coastal areas(Vollenweider, 1992; Nixon, 1995; Cloern, 2001), leadingto hypoxia and anoxia in bottom waters, nuisance algalblooms and changes in the species composition ofphytoplankton. Phytoplankton biomass, species compo-sition and community structure are commonly moni-tored in surface waters (e.g. HELCOM, 2002), however,these parameters, except for biomass, have seldom beenapplied as classification elements in assessing differenteutrophication levels.
Tools and methods for classification of the ecologicalquality of coastal waters are required for assessing thestatus of coastal waters as well as setting the environ-mental objectives for management purposes. The WaterFramework Directive (2000/60/EC; WFD), a recent EUlegislation, requires that, in addition to other biologicalelements, phytoplankton taxonomic composition, abun-dance, and biomass as well as the frequency ofphytoplankton blooms be used in the classification ofthe ecological status of lakes, rivers, and coastal andtransitional waters. The overall objective of the WFD isto maintain and improve the ecological quality ofsurface waters, and ultimately to achieve good ecolog-ical status of all surface waters. Furthermore, the resultsof the ecological quality classification systems should becomparable between countries sharing similar types ofsurface waters within the same ‘‘ecoregion’’ (Heiskanenet al., 2004). Assessment based measurable alterations inthe structure and functioning of ecosystem from highstatus to good and moderate sets new demands for thedeveloping of classification tools for the coastal andtransitional waters, such as the Baltic Sea.
In developing a classification system for phytoplank-ton, it is important to define regimes of environmentalvariables that affect species composition and communitystructure in different parts of an ecoregion. Salinity isone of the abiotic factors which may be highly variablein coastal and estuarine ecosystems (Remane, 1955,1958; Gasi�unait _e, 2000). In typical estuaries, changes insalinity within short time periods are usually consider-able due to tidal actions. In contrast, the tidal influenceis minor in the microtidal or non-tidal Baltic Sea(Stigebrandt, 2001), while the freshwater influenceresults in oligohaline (below 3) to euhaline (20e30)salinity variations. Thus, an important prerequisite forthe analysis of phytoplankton in relation to eutrophi-cation is the clustering of salinity regions.
Phytoplankton dynamics are also dependent onphysico-chemical and biological factors which have beenshown to exhibit pronounced seasonal variations due toclimatic factors (Rantajarvi et al., 1998; Schiewer, 1998).The short-lived phytoplankton reacts drastically to theannual climatic cycle. In the Baltic Sea, seasonality in
phytoplankton growth differs between the eastewest andnorthesouth gradient. Therefore in the assessment ofeutrophication level, it is important to identify appro-priate time periods in which the eutrophication indica-tors are the most sensitive and significant.
Characterization of phytoplankton communities ismultidimensional; interferences between nutrient andsalinity dependencies lead to combined changes inphytoplankton composition and abundance, requiringdifferent classification schemes for each. Moreover,development of a classification system is often hamperedby the limited number of data sets in which there aresimilar climatic and salinity conditions but differenteutrophication levels. As far as we know, there are noecoregion-wide efforts to study seasonality of phyto-plankton assemblages in different salinity regimes, asa first step towards the use of phytoplankton taxonomicindicators as quality elements for classification andecological quality status assessments of coastal waters.
In this study long-termdata set on both phytoplanktonand physico-chemical variables from coastal areas of theBaltic Sea was compiled. The aim was to definephytoplankton seasonal succession patterns along thesalinity gradient and to delineate a season and salinityindependent set of phytoplankton community structuralindicators in relation to eutrophication in the Baltic Sea.
2. Material and methods
2.1. Sampling locations
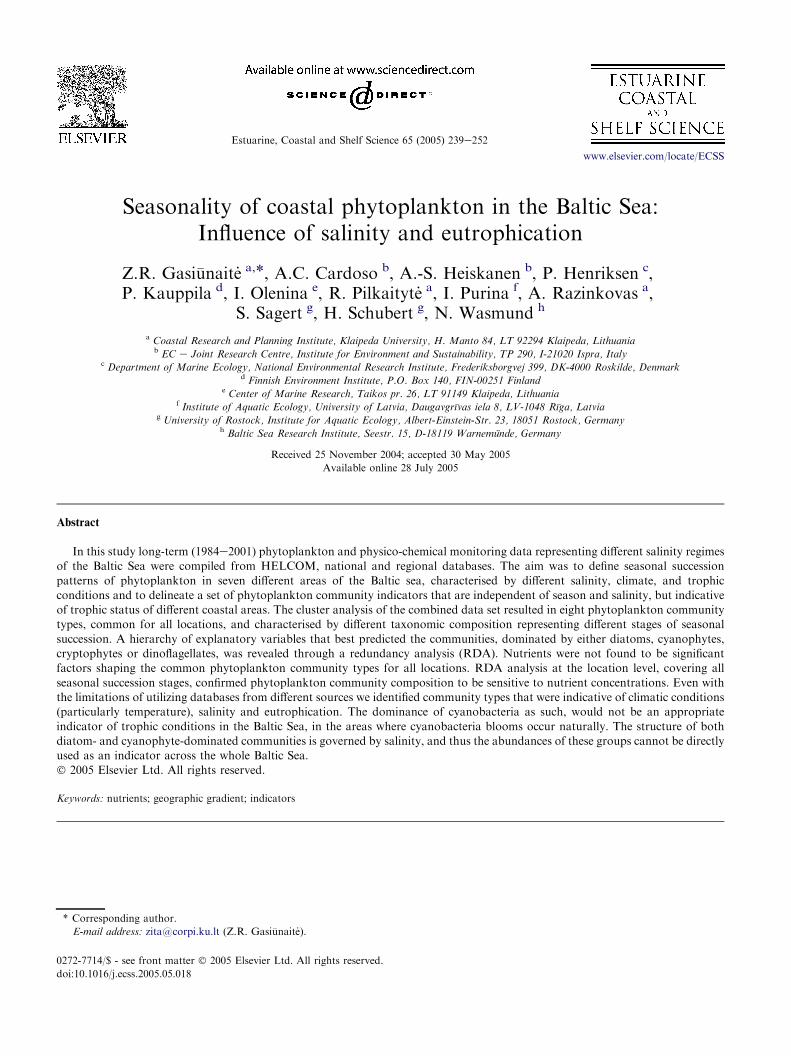
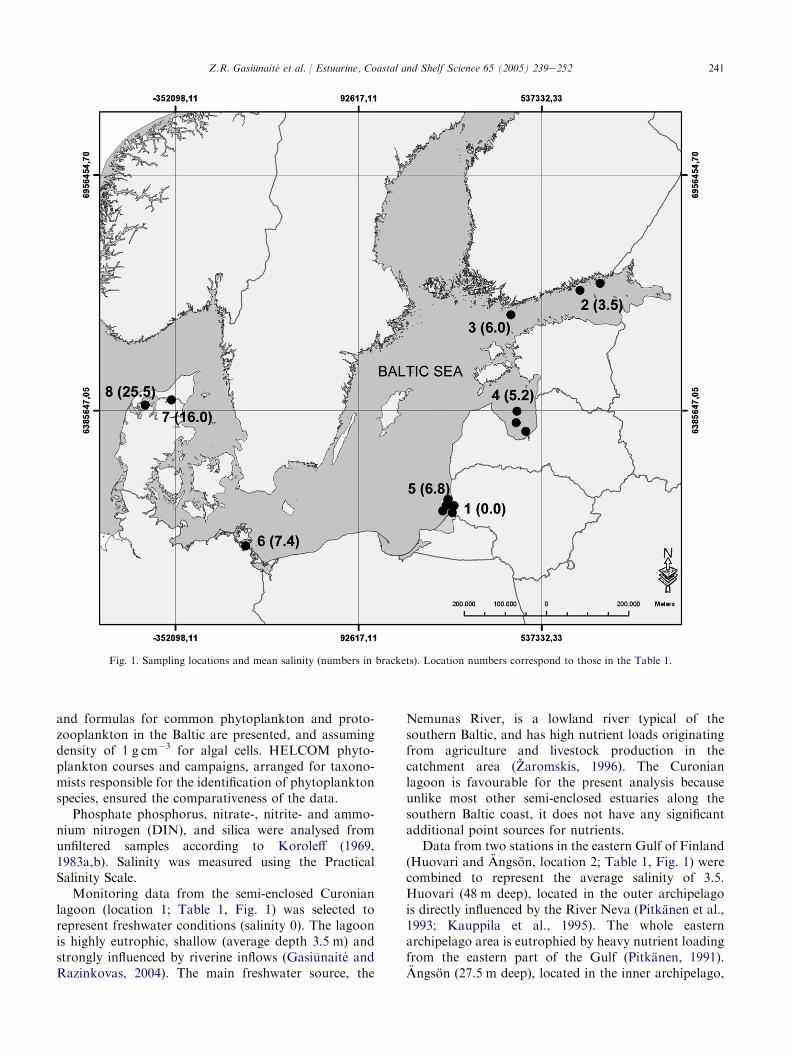
A data set was compiled from the monitoringprogrammes of the Baltic Sea (HELCOM) and fromthe national and regional monitoring programmes ofFinland, Latvia, Lithuania, Germany and Denmark.The data included phytoplankton biomasses for largenumber of nano- and microplanktonic species and themain physico-chemical variables from eight locations,each representing different salinity regimes, for theperiod of 1984e2001 (Fig. 1, Table 1). The locationswere selected for analysis according to data availabilityand average salinity. The variation of salinity at each ofthe locations was within G0.3e0.8 (standard deviation).Additionally, these locations represented the northesouth (approx. 1200 km) and westeeast (approx.2000 km) gradients in the Baltic Sea.
Phytoplankton analysis was carried out on biomassdetermined from enumeration and measurements usinginverted microscope according to Utermohl (1958) andHELCOM COMBINE recommendations (HELCOM,2001). Taxonomic identification was carried out mostlyto species level. Counts were converted to biomass(mgm�3) and presented as wet weight by calculating thealgal plasma volumes following the guidelines in Edler(1979) and HELCOM (2001), where stereometric shapes
241Z.R. Gasi�unait _e et al. / Estuarine, Coastal and Shelf Science 65 (2005) 239e252
Fig. 1. Sampling locations and mean salinity (numbers in brackets). Location numbers correspond to those in the Table 1.
and formulas for common phytoplankton and proto-zooplankton in the Baltic are presented, and assumingdensity of 1 g cm�3 for algal cells. HELCOM phyto-plankton courses and campaigns, arranged for taxono-mists responsible for the identification of phytoplanktonspecies, ensured the comparativeness of the data.
Phosphate phosphorus, nitrate-, nitrite- and ammo-nium nitrogen (DIN), and silica were analysed fromunfiltered samples according to Koroleff (1969,1983a,b). Salinity was measured using the PracticalSalinity Scale.
Monitoring data from the semi-enclosed Curonianlagoon (location 1; Table 1, Fig. 1) was selected torepresent freshwater conditions (salinity 0). The lagoonis highly eutrophic, shallow (average depth 3.5 m) andstrongly influenced by riverine inflows (Gasi�unait _e andRazinkovas, 2004). The main freshwater source, the
Nemunas River, is a lowland river typical of thesouthern Baltic, and has high nutrient loads originatingfrom agriculture and livestock production in thecatchment area (Zaromskis, 1996). The Curonianlagoon is favourable for the present analysis becauseunlike most other semi-enclosed estuaries along thesouthern Baltic coast, it does not have any significantadditional point sources for nutrients.
Data from two stations in the eastern Gulf of Finland(Huovari and Angson, location 2; Table 1, Fig. 1) werecombined to represent the average salinity of 3.5.Huovari (48 m deep), located in the outer archipelagois directly influenced by the River Neva (Pitkanen et al.,1993; Kauppila et al., 1995). The whole easternarchipelago area is eutrophied by heavy nutrient loadingfrom the eastern part of the Gulf (Pitkanen, 1991).Angson (27.5 m deep), located in the inner archipelago,
242 Z.R. Gasi�unait _e et al. / Estuarine, Coastal and Shelf Science 65 (2005) 239e252
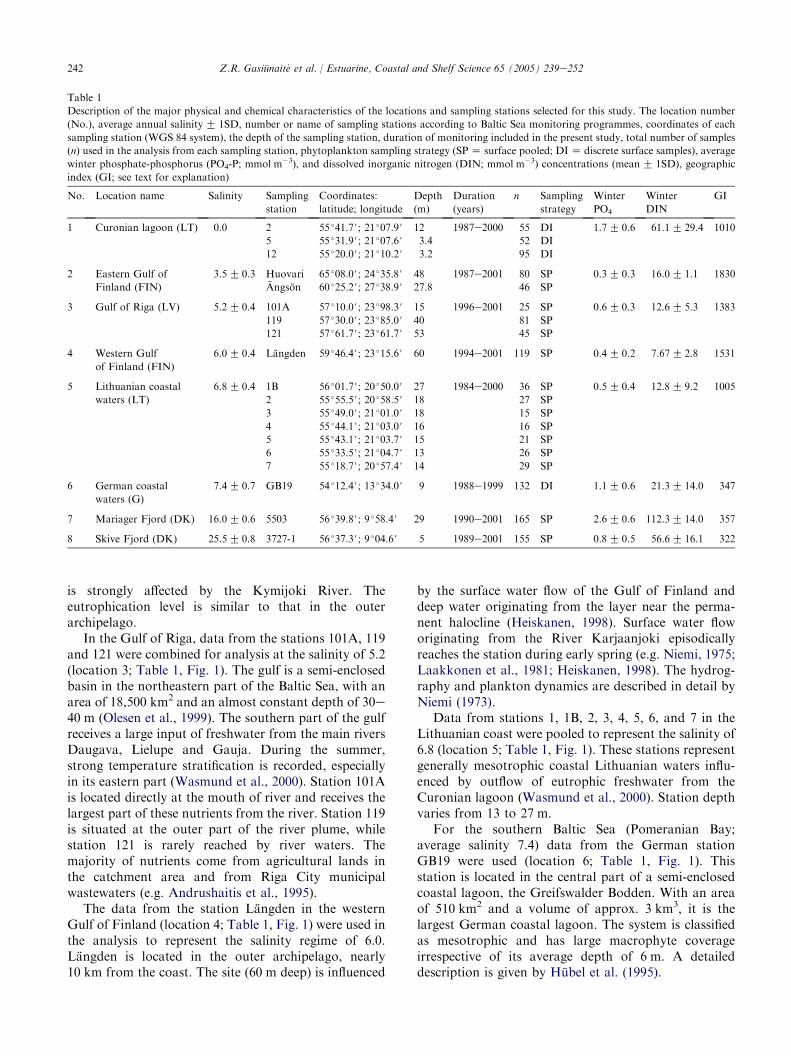
Table 1
Description of the major physical and chemical characteristics of the locations and sampling stations selected for this study. The location number
(No.), average annual salinityG 1SD, number or name of sampling stations according to Baltic Sea monitoring programmes, coordinates of each
sampling station (WGS 84 system), the depth of the sampling station, duration of monitoring included in the present study, total number of samples
(n) used in the analysis from each sampling station, phytoplankton sampling strategy (SPZ surface pooled; DIZ discrete surface samples), average
winter phosphate-phosphorus (PO4-P; mmol m�3), and dissolved inorganic nitrogen (DIN; mmol m�3) concentrations (meanG 1SD), geographic
index (GI; see text for explanation)
No. Location name Salinity Sampling
station
Coordinates:
latitude; longitude
Depth
(m)
Duration
(years)
n Sampling
strategy
Winter
PO4
Winter
DIN
GI
1 Curonian lagoon (LT) 0.0 2 55 �41.7#; 21 �07.9# 12 1987e2000 55 DI 1.7G 0.6 61.1G 29.4 1010
5 55 �31.9#; 21 �07.6# 3.4 52 DI
12 55 �20.0#; 21 �10.2# 3.2 95 DI
2 Eastern Gulf of
Finland (FIN)
3.5G 0.3 Huovari 65 �08.0#; 24 �35.8# 48 1987e2001 80 SP 0.3G 0.3 16.0G 1.1 1830
Angson 60 �25.2#; 27 �38.9# 27.8 46 SP
3 Gulf of Riga (LV) 5.2G 0.4 101A 57 �10.0#; 23 �98.3# 15 1996e2001 25 SP 0.6G 0.3 12.6G 5.3 1383
119 57 �30.0#; 23 �85.0# 40 81 SP
121 57 �61.7#; 23 �61.7# 53 45 SP
4 Western Gulf
of Finland (FIN)
6.0G 0.4 Langden 59 �46.4#; 23 �15.6# 60 1994e2001 119 SP 0.4G 0.2 7.67G 2.8 1531
5 Lithuanian coastal
waters (LT)
6.8G 0.4 1B 56 �01.7#; 20 �50.0# 27 1984e2000 36 SP 0.5G 0.4 12.8G 9.2 1005
2 55 �55.5#; 20 �58.5# 18 27 SP
3 55 �49.0#; 21 �01.0# 18 15 SP
4 55 �44.1#; 21 �03.0# 16 16 SP
5 55 �43.1#; 21 �03.7# 15 21 SP
6 55 �33.5#; 21 �04.7# 13 26 SP
7 55 �18.7#; 20 �57.4# 14 29 SP
6 German coastal
waters (G)
7.4G 0.7 GB19 54 �12.4#; 13 �34.0# 9 1988e1999 132 DI 1.1G 0.6 21.3G 14.0 347
7 Mariager Fjord (DK) 16.0G 0.6 5503 56 �39.8#; 9 �58.4# 29 1990e2001 165 SP 2.6G 0.6 112.3G 14.0 357
8 Skive Fjord (DK) 25.5G 0.8 3727-1 56 �37.3#; 9 �04.6# 5 1989e2001 155 SP 0.8G 0.5 56.6G 16.1 322
is strongly affected by the Kymijoki River. Theeutrophication level is similar to that in the outerarchipelago.
In the Gulf of Riga, data from the stations 101A, 119and 121 were combined for analysis at the salinity of 5.2(location 3; Table 1, Fig. 1). The gulf is a semi-enclosedbasin in the northeastern part of the Baltic Sea, with anarea of 18,500 km2 and an almost constant depth of 30e40 m (Olesen et al., 1999). The southern part of the gulfreceives a large input of freshwater from the main riversDaugava, Lielupe and Gauja. During the summer,strong temperature stratification is recorded, especiallyin its eastern part (Wasmund et al., 2000). Station 101Ais located directly at the mouth of river and receives thelargest part of these nutrients from the river. Station 119is situated at the outer part of the river plume, whilestation 121 is rarely reached by river waters. Themajority of nutrients come from agricultural lands inthe catchment area and from Riga City municipalwastewaters (e.g. Andrushaitis et al., 1995).
The data from the station Langden in the westernGulf of Finland (location 4; Table 1, Fig. 1) were used inthe analysis to represent the salinity regime of 6.0.Langden is located in the outer archipelago, nearly10 km from the coast. The site (60 m deep) is influenced
by the surface water flow of the Gulf of Finland anddeep water originating from the layer near the perma-nent halocline (Heiskanen, 1998). Surface water floworiginating from the River Karjaanjoki episodicallyreaches the station during early spring (e.g. Niemi, 1975;Laakkonen et al., 1981; Heiskanen, 1998). The hydrog-raphy and plankton dynamics are described in detail byNiemi (1973).
Data from stations 1, 1B, 2, 3, 4, 5, 6, and 7 in theLithuanian coast were pooled to represent the salinity of6.8 (location 5; Table 1, Fig. 1). These stations representgenerally mesotrophic coastal Lithuanian waters influ-enced by outflow of eutrophic freshwater from theCuronian lagoon (Wasmund et al., 2000). Station depthvaries from 13 to 27 m.
For the southern Baltic Sea (Pomeranian Bay;average salinity 7.4) data from the German stationGB19 were used (location 6; Table 1, Fig. 1). Thisstation is located in the central part of a semi-enclosedcoastal lagoon, the Greifswalder Bodden. With an areaof 510 km2 and a volume of approx. 3 km3, it is thelargest German coastal lagoon. The system is classifiedas mesotrophic and has large macrophyte coverageirrespective of its average depth of 6 m. A detaileddescription is given by Hubel et al. (1995).
243Z.R. Gasi�unait _e et al. / Estuarine, Coastal and Shelf Science 65 (2005) 239e252
Data from the Danish stations 5503 (Mariager Fjord,location 7; Table 1, Fig. 1) and 3727-1 (Skive Fjord,location 8) represented average salinities of 16.0 and25.5, respectively. Mariager Fjord is located on theeastern coast of Jutland, Denmark. The fjord consists ofan outer shallow part and an inner deeper part, wherethe sampling station 5503 is located. The outer part ofthe fjord acts as a sill for the inner part. The area andvolume of the inner part of Mariager Fjord are 19.4 km2
and 0.2 km3, respectively. This part of the fjord haspermanent salinity stratification. Skive Fjord (St. 3727-1)is located in Northern Jutland, Denmark, as a part ofthe Limfjorden. The area, volume and average depth ofSkive Fjord are 119 km2, 0.49 km3 and 4.2 m, respec-tively. The catchment area of both fjords is mainlyagricultural land.
2.2. Data analysis
The data consisted of 1220 phytoplankton sampleswith contemporaneous physico-chemical measurements.In total, approximately 120e200 pooled samples foreach location were analysed (see Table 1 for details ofthe number of samples, time interval, frequency, andsampling strategy at each station).
A cluster analysis (BrayeCurtis similarity coefficient,group average linking) was used to derive different typesof phytoplankton communities. Samples were classifiedaccording to the relative biomass (percentage of totalbiomass in the sample) of the main taxonomic groups ofphytoplankton: cyanophyceae, diatomophyceae, dino-phyceae, cryptophyceae, chlorophyceae, ciliophora(consisting mostly of Myrionecta rubra (ZMesodiniumrubrum)) and one cumulative group containing the restof the phytoplankton species. These groups wereintended to reflect seasonal successional stages (e.g.Sommer et al., 1986) as well as potentially indicateeutrophication level. This type of grouping was alsoused to minimise effects caused by possible differences intaxonomic analysis.
A ‘‘geographic index’’ (GI) was constructed to relatedifferent succession patterns to the geographic locationof sampling stations. This GI was based on theassumption that the sampling stations were distributedalong westeeast and northesouth gradients. To com-bine both gradients, the index for each location wascalculated as a sum of distance in kilometres from thelocation to the westernmost longitude and southernmostlatitude.
Winter nutrient concentrations are known to berelated to phytoplankton development, particularlyduring the spring (Peinert et al., 1982) as well asthroughout whole vegetation period (Vollenweider,1992), however, the relationship between these twoparameters could be modified by other factors (e.g.nutrient retention rate). Moreover, phytoplankton
blooms in the Baltic Sea features several biomass peaksduring the growth period. Thus it was decided to findthe biomass parameter, best reflecting the winterphosphate and DIN concentrations. The indicator oftrophic status for each location was detected throughanalysis of the correlation (Pearson r) between averagespring biomass, maximum spring biomass, averagesummer biomass and maximum summer biomass foreach location and each year and winter nutrientconcentrations.
Multivariate redundancy analysis (RDA) was appliedas a tool to evaluate the relationships between environ-mental and biological variables. This method is nor-mally used in ecology for ordination by direct gradientanalysis, where a matrix of species variables is analysedwith regard to a corresponding matrix of environmentalvariables (see Legendre and Anderson, 1999). Forestablishing the main cluster types, the relationshipsbetween nutrient concentrations, temperature, salinity,GI and maximum summer biomass (MSB) (designatedas explanatory variables), and biomass values of mainphytoplankton groups (designated as response varia-bles) were evaluated. The relationships between nutrientvalues and temperature as explanatory variables andbiomass values of main phytoplankton groups asresponse variables were estimated for each location.Non-normality of the data was treated by usinga log (xC 1) transformation (Clarke and Warwick,1997). An automatic forward selection procedure wasapplied in order to rank the explanatory variablesaccording to their importance. For means of interpre-tation, the first two axes were portrayed as biplots andthe eigenvalues of significant explanatory variables weretabulated.
PRIMER 5 (PRIMER-E Ltd.) and BRODGAR2.2.8 (Highland Statistics Ltd.) statistical packages wereused for data analysis.
3. Results
3.1. Phytoplankton community types
For each location 3e4 clusters of samples werederived at 50e60% similarity level. The mean relativebiomasses of the main taxonomic groups of phyto-plankton, as percentage of total phytoplankton biomassfor each of the clusters, are presented in Table 2. In eachof these clusters, one, or at the maximum two, of thetaxonomic groups listed exceeded a relative contributionof 30% per individual group. According to the prevail-ing taxonomic group, eight types of clusters werederived, dominated, respectively, by diatoms (I), cyano-phytes (II), dinophytes (III), cryptophytes (IV), cilio-phors (V), both diatoms and cyanophytes (VI), both
244 Z.R. Gasi�unait _e et al. / Estuarine, Coastal and Shelf Science 65 (2005) 239e252
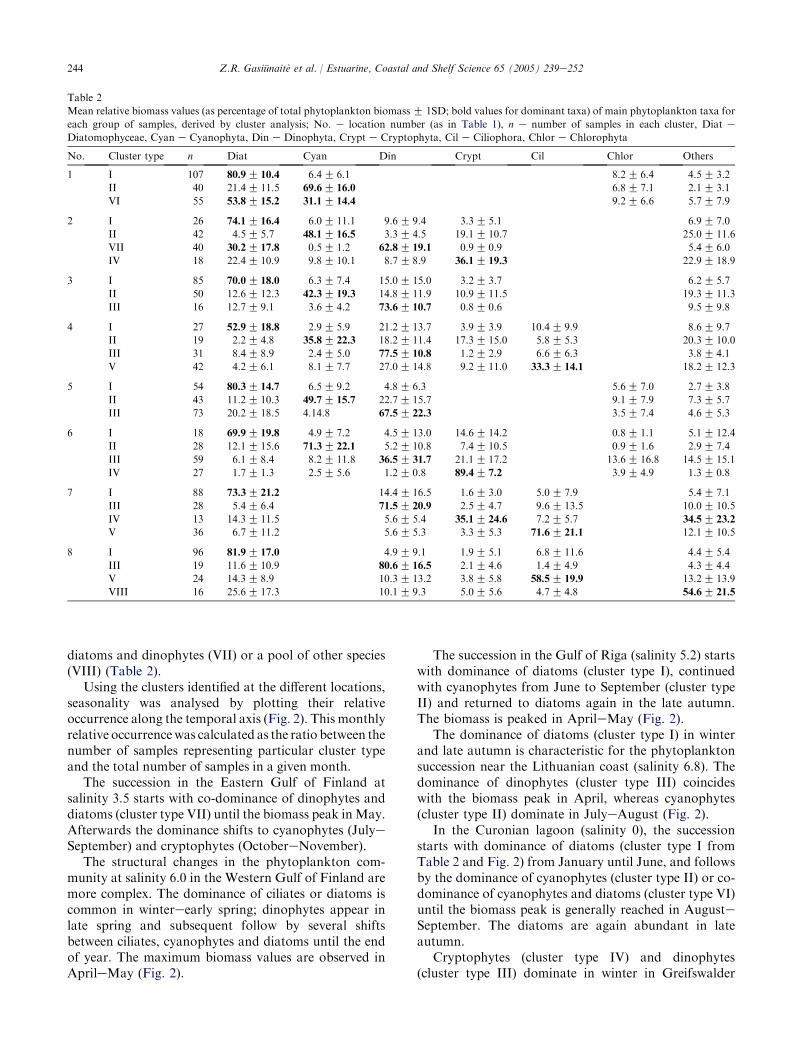
Table 2
Mean relative biomass values (as percentage of total phytoplankton biomassG 1SD; bold values for dominant taxa) of main phytoplankton taxa for
each group of samples, derived by cluster analysis; No. e location number (as in Table 1), n e number of samples in each cluster, Diat e
Diatomophyceae, Cyan e Cyanophyta, Din e Dinophyta, Crypt e Cryptophyta, Cil e Ciliophora, Chlor e Chlorophyta
No. Cluster type n Diat Cyan Din Crypt Cil Chlor Others
1 I 107 80.9G 10.4 6.4G 6.1 8.2G 6.4 4.5G 3.2
II 40 21.4G 11.5 69.6G 16.0 6.8G 7.1 2.1G 3.1
VI 55 53.8G 15.2 31.1G 14.4 9.2G 6.6 5.7G 7.9
2 I 26 74.1G 16.4 6.0G 11.1 9.6G 9.4 3.3G 5.1 6.9G 7.0
II 42 4.5G 5.7 48.1G 16.5 3.3G 4.5 19.1G 10.7 25.0G 11.6
VII 40 30.2G 17.8 0.5G 1.2 62.8G 19.1 0.9G 0.9 5.4G 6.0
IV 18 22.4G 10.9 9.8G 10.1 8.7G 8.9 36.1G 19.3 22.9G 18.9
3 I 85 70.0G 18.0 6.3G 7.4 15.0G 15.0 3.2G 3.7 6.2G 5.7
II 50 12.6G 12.3 42.3G 19.3 14.8G 11.9 10.9G 11.5 19.3G 11.3
III 16 12.7G 9.1 3.6G 4.2 73.6G 10.7 0.8G 0.6 9.5G 9.8
4 I 27 52.9G 18.8 2.9G 5.9 21.2G 13.7 3.9G 3.9 10.4G 9.9 8.6G 9.7
II 19 2.2G 4.8 35.8G 22.3 18.2G 11.4 17.3G 15.0 5.8G 5.3 20.3G 10.0
III 31 8.4G 8.9 2.4G 5.0 77.5G 10.8 1.2G 2.9 6.6G 6.3 3.8G 4.1
V 42 4.2G 6.1 8.1G 7.7 27.0G 14.8 9.2G 11.0 33.3G 14.1 18.2G 12.3
5 I 54 80.3G 14.7 6.5G 9.2 4.8G 6.3 5.6G 7.0 2.7G 3.8
II 43 11.2G 10.3 49.7G 15.7 22.7G 15.7 9.1G 7.9 7.3G 5.7
III 73 20.2G 18.5 4.14.8 67.5G 22.3 3.5G 7.4 4.6G 5.3
6 I 18 69.9G 19.8 4.9G 7.2 4.5G 13.0 14.6G 14.2 0.8G 1.1 5.1G 12.4
II 28 12.1G 15.6 71.3G 22.1 5.2G 10.8 7.4G 10.5 0.9G 1.6 2.9G 7.4
III 59 6.1G 8.4 8.2G 11.8 36.5G 31.7 21.1G 17.2 13.6G 16.8 14.5G 15.1
IV 27 1.7G 1.3 2.5G 5.6 1.2G 0.8 89.4G 7.2 3.9G 4.9 1.3G 0.8
7 I 88 73.3G 21.2 14.4G 16.5 1.6G 3.0 5.0G 7.9 5.4G 7.1
III 28 5.4G 6.4 71.5G 20.9 2.5G 4.7 9.6G 13.5 10.0G 10.5
IV 13 14.3G 11.5 5.6G 5.4 35.1G 24.6 7.2G 5.7 34.5G 23.2
V 36 6.7G 11.2 5.6G 5.3 3.3G 5.3 71.6G 21.1 12.1G 10.5
8 I 96 81.9G 17.0 4.9G 9.1 1.9G 5.1 6.8G 11.6 4.4G 5.4
III 19 11.6G 10.9 80.6G 16.5 2.1G 4.6 1.4G 4.9 4.3G 4.4
V 24 14.3G 8.9 10.3G 13.2 3.8G 5.8 58.5G 19.9 13.2G 13.9
VIII 16 25.6G 17.3 10.1G 9.3 5.0G 5.6 4.7G 4.8 54.6G 21.5
diatoms and dinophytes (VII) or a pool of other species(VIII) (Table 2).
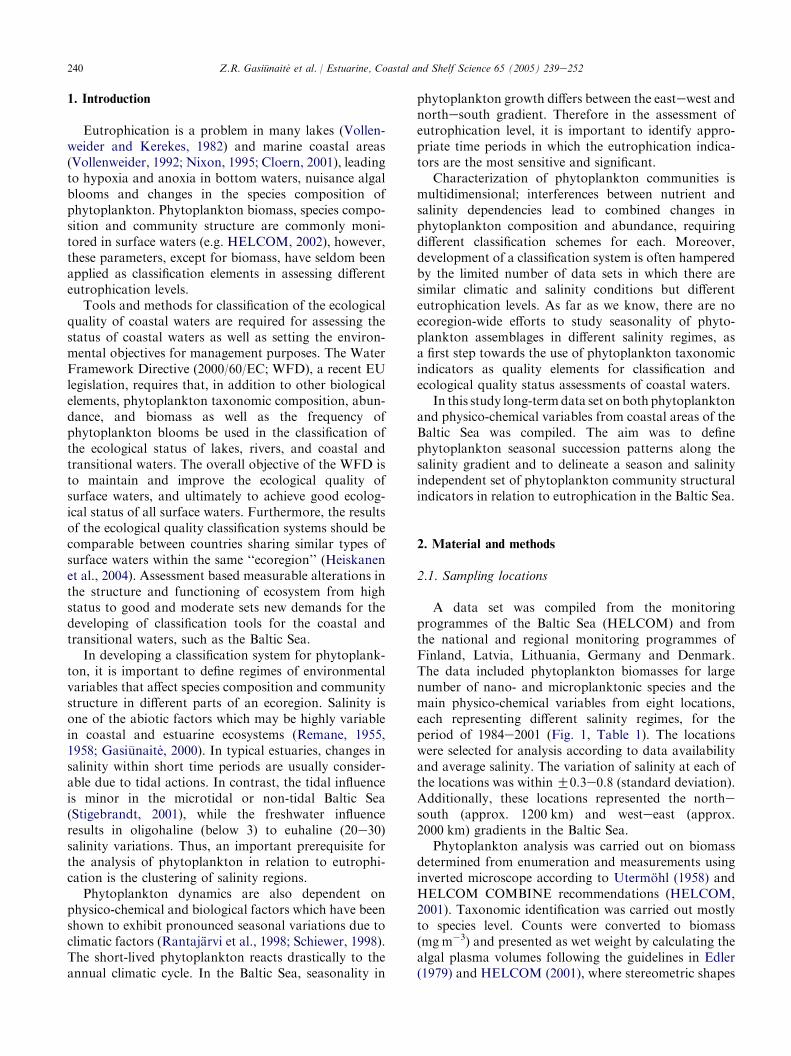
Using the clusters identified at the different locations,seasonality was analysed by plotting their relativeoccurrence along the temporal axis (Fig. 2). This monthlyrelative occurrencewas calculated as the ratio between thenumber of samples representing particular cluster typeand the total number of samples in a given month.
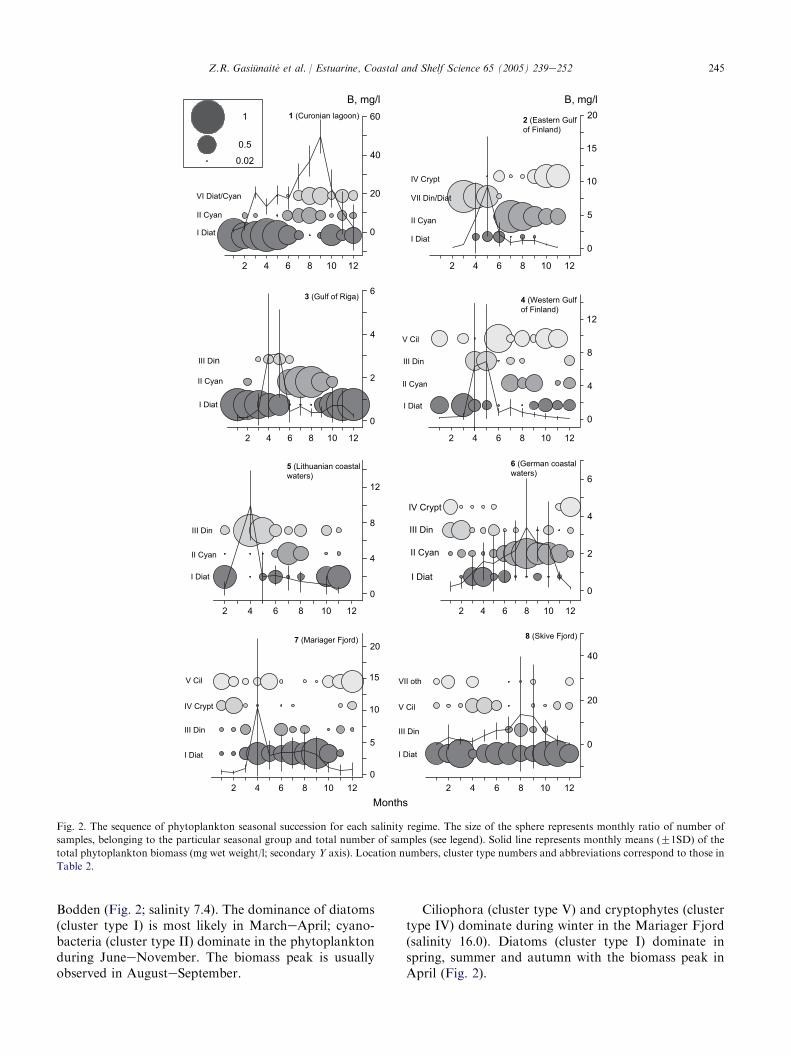
The succession in the Eastern Gulf of Finland atsalinity 3.5 starts with co-dominance of dinophytes anddiatoms (cluster type VII) until the biomass peak inMay.Afterwards the dominance shifts to cyanophytes (JulyeSeptember) and cryptophytes (OctobereNovember).
The structural changes in the phytoplankton com-munity at salinity 6.0 in the Western Gulf of Finland aremore complex. The dominance of ciliates or diatoms iscommon in wintereearly spring; dinophytes appear inlate spring and subsequent follow by several shiftsbetween ciliates, cyanophytes and diatoms until the endof year. The maximum biomass values are observed inAprileMay (Fig. 2).
The succession in the Gulf of Riga (salinity 5.2) startswith dominance of diatoms (cluster type I), continuedwith cyanophytes from June to September (cluster typeII) and returned to diatoms again in the late autumn.The biomass is peaked in AprileMay (Fig. 2).
The dominance of diatoms (cluster type I) in winterand late autumn is characteristic for the phytoplanktonsuccession near the Lithuanian coast (salinity 6.8). Thedominance of dinophytes (cluster type III) coincideswith the biomass peak in April, whereas cyanophytes(cluster type II) dominate in JulyeAugust (Fig. 2).
In the Curonian lagoon (salinity 0), the successionstarts with dominance of diatoms (cluster type I fromTable 2 and Fig. 2) from January until June, and followsby the dominance of cyanophytes (cluster type II) or co-dominance of cyanophytes and diatoms (cluster type VI)until the biomass peak is generally reached in AugusteSeptember. The diatoms are again abundant in lateautumn.
Cryptophytes (cluster type IV) and dinophytes(cluster type III) dominate in winter in Greifswalder
245Z.R. Gasi�unait _e et al. / Estuarine, Coastal and Shelf Science 65 (2005) 239e252
Months
0
5
10
15
20
2 4 6 8 10 12 2 4 6 8 10 12
2 4 6 8 10 12 2 4 6 8 10 12
2 4 6 8 10 12 2 4 6 8 10 12
0
2
4
6
0
4
8
12
0
4
8
12
0
5
10
15
20
0
20
40
2 4 6 8 10 12 2 4 6 8 10 12
0
20
40
601 (Curonian lagoon)2 (Eastern Gulfof Finland)
3 (Gulf of Riga)4 (Western Gulfof Finland)
5 (Lithuanian coastalwaters)
7 (Mariager Fjord) 8 (Skive Fjord)
I Diat
II Cyan
VI Diat/Cyan
IV Crypt
I Diat
I DiatI Diat
I Diat
I Diat I Diat
II Cyan
II CyanII Cyan
II Cyan
III DinIII Din
VII Din/Diat
III DinIII Din
III Din
V CilIV Crypt
V Cil
VII othV Cil
0
2
4
6
6 (German coastalwaters)
I Diat
II Cyan
III Din
IV Crypt
B, mg/l B, mg/l1
0.02
0.5
Fig. 2. The sequence of phytoplankton seasonal succession for each salinity regime. The size of the sphere represents monthly ratio of number of
samples, belonging to the particular seasonal group and total number of samples (see legend). Solid line represents monthly means (G1SD) of the
total phytoplankton biomass (mg wet weight/l; secondary Y axis). Location numbers, cluster type numbers and abbreviations correspond to those in
Table 2.
Bodden (Fig. 2; salinity 7.4). The dominance of diatoms(cluster type I) is most likely in MarcheApril; cyano-bacteria (cluster type II) dominate in the phytoplanktonduring JuneeNovember. The biomass peak is usuallyobserved in AugusteSeptember.
Ciliophora (cluster type V) and cryptophytes (clustertype IV) dominate during winter in the Mariager Fjord(salinity 16.0). Diatoms (cluster type I) dominate inspring, summer and autumn with the biomass peak inApril (Fig. 2).
246 Z.R. Gasi�unait _e et al. / Estuarine, Coastal and Shelf Science 65 (2005) 239e252
Diatoms (cluster type I) dominate year round in theSkive Fjord, at salinity 25.5; with a biomass peak inAugusteSeptember (Fig. 2).
3.2. Trophic status indication
The maximum summer biomass (MSB) showed thebest correlation to both winter DIN and winterphosphate concentration (rZ 0.71 and rZ 0.51, re-spectively, significant at p! 0.05). For other expectedindicators (maximum spring biomass, mean springbiomass, mean summer biomass), the correlations withboth winter DIN and winter phosphate were notsignificant at p! 0.05. Therefore the MSB were selectedas an indicator of the trophic status on each location.According to the MSB, all sampling sites could beranked from Gulf of Riga (lowest) to Western Gulf ofFinland, Eastern Gulf of Finland, Lithuanian coastalwaters, German coastal waters, Mariager Fjord, SkiveFjord and Curonian lagoon (highest).
3.3. Factor analysis at community level
Cluster types IeIV represented more than 82% of allanalysed samples, thus they were selected for furtherredundancy analysis (RDA).
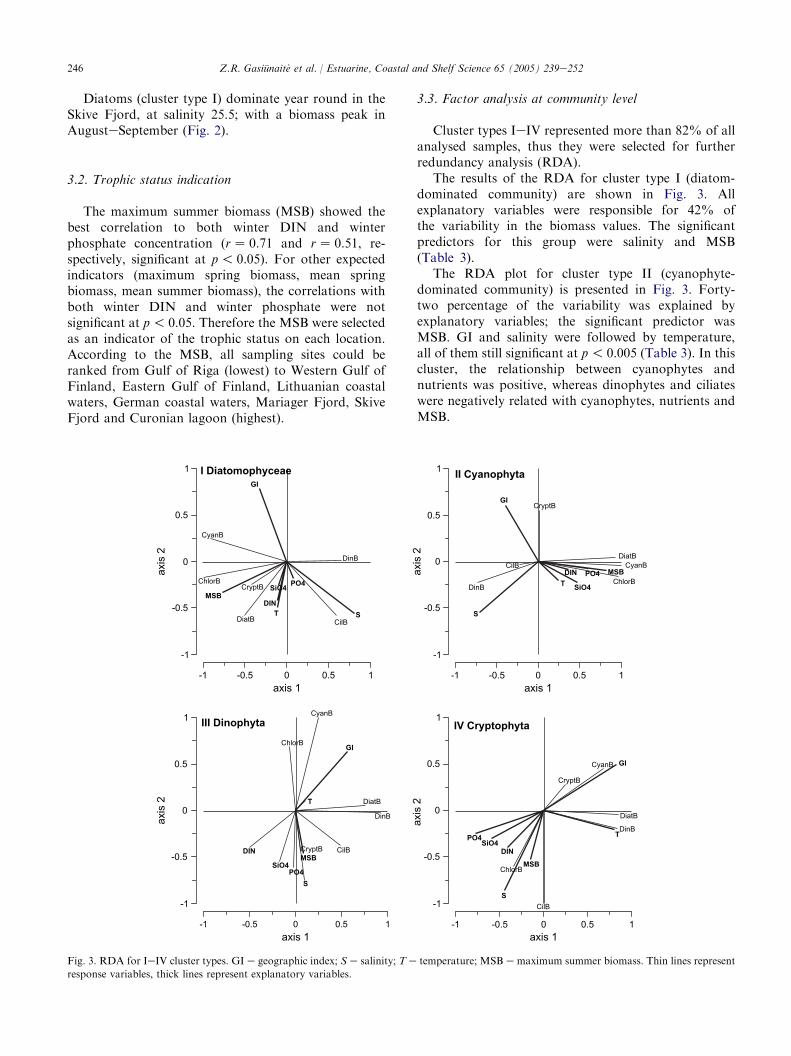
The results of the RDA for cluster type I (diatom-dominated community) are shown in Fig. 3. Allexplanatory variables were responsible for 42% ofthe variability in the biomass values. The significantpredictors for this group were salinity and MSB(Table 3).
The RDA plot for cluster type II (cyanophyte-dominated community) is presented in Fig. 3. Forty-two percentage of the variability was explained byexplanatory variables; the significant predictor wasMSB. GI and salinity were followed by temperature,all of them still significant at p! 0.005 (Table 3). In thiscluster, the relationship between cyanophytes andnutrients was positive, whereas dinophytes and ciliateswere negatively related with cyanophytes, nutrients andMSB.
CyanB
DiatB
CryptB
DinB
ChlorB
CilB
GI
MSB
T S
PO4
DIN
SiO4
axis 1-1 -0.5 0 0.5 1
axis
2
-1
-0.5
0
0.5
1 I Diatomophyceae
CyanBDiatB
CryptB
DinBChlorB
CilB
GI
MSB
T
S
PO4DIN
SiO4
axis 1-1 -0.5 0 0.5 1
axis
2
-1
-0.5
0
0.5
1II Cyanophyta
CyanB
DiatB
CryptB
DinB
ChlorB
CilB
GI
MSB
T
S
PO4
DIN
SiO4
axis 1-1 -0.5 0 0.5 1
axis
2
-1
-0.5
0
0.5
1III Dinophyta
CyanB
DiatB
CryptB
DinB
ChlorB
CilB
GI
MSB
T
S
PO4
DIN
SiO4
axis 1-1 -0.5 0 0.5 1
axis
2
-1
-0.5
0
0.5
1IV Cryptophyta
Fig. 3. RDA for IeIV cluster types. GI e geographic index; S e salinity; T e temperature; MSB e maximum summer biomass. Thin lines represent
response variables, thick lines represent explanatory variables.
247Z.R. Gasi�unait _e et al. / Estuarine, Coastal and Shelf Science 65 (2005) 239e252
The explanatory variables were responsible for 30%of the variability in the cluster type III (dinophyte-dominated community; Fig. 3). The significant predic-tors were GI and salinity. Biomass of dinophytes waspositively related with diatoms, however, there was noclear relationship between the dinophytes and abioticfactors.
The explanatory variables described 58% of thevariability in cluster type IV (cryptophyte-dominatedcommunity; Fig. 3), whereby GI salinity and tempera-ture were the significant predictors. This cluster includesmore than 50% of winter samples characterised byhigh cryptophyte biomasses and reflected the climaticgradient very well, in contrast to the other communitytypes (compare Table 3), however, strong positiverelation was observed between GI and cyanophytes.Almost all nutrient parameters were negatively relatedto the GI.
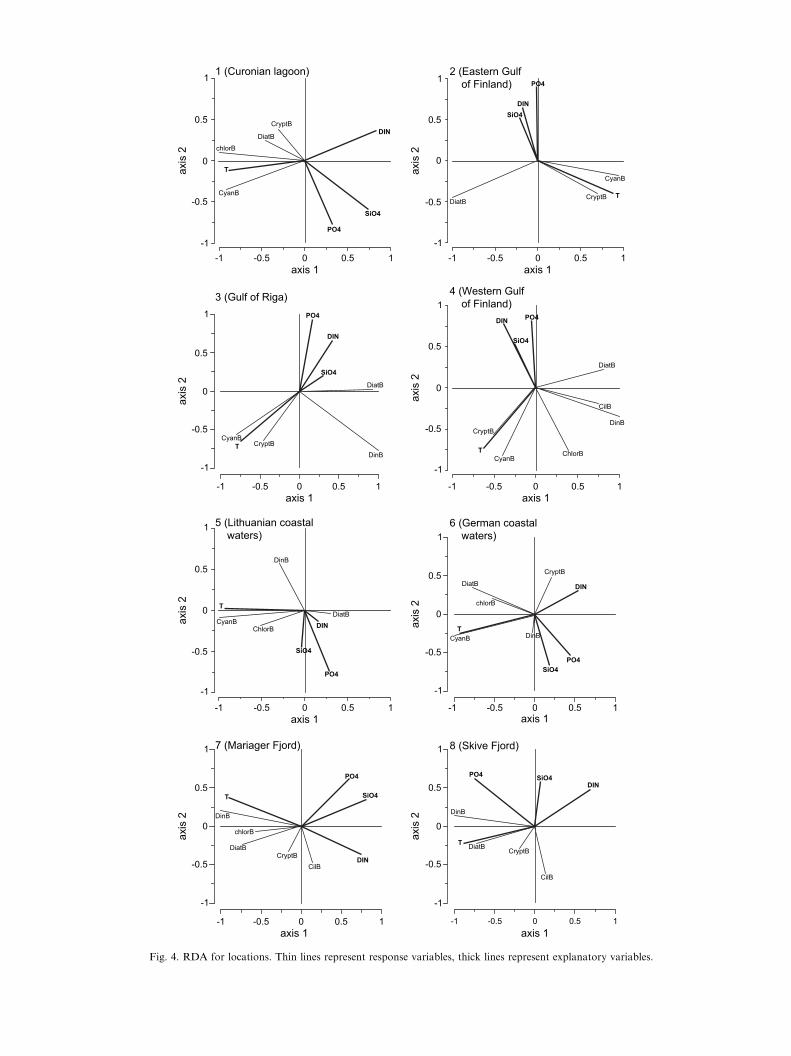
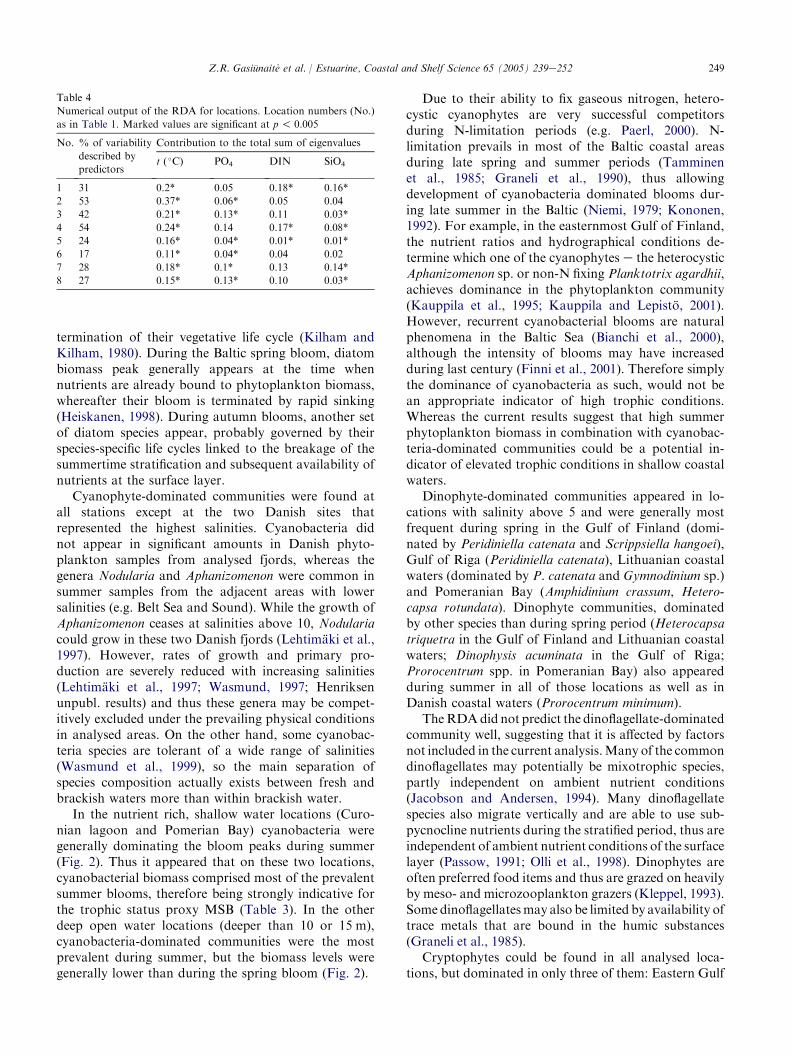
3.4. Factor analysis at location level
The results of RDA at the location level are presentedin Fig. 4 and Table 4. The percentage of variabilityexplained by selected predictors varied from 42 to 54%in Gulf of Finland and Gulf of Riga to only 17% in thePomeranian Bay (Table 4). Temperature appeared to bethe most significant factor shaping the phytoplanktoncommunity structure at all locations and was positivelyrelated with cyanophytes, chlorophytes and crypto-phytes and negatively with diatoms (except in theCuronian lagoon, Pomeranian Bay and Danish waters).Inorganic nutrient concentrations were significant fac-tors, but their importance varied in different locations.Silicate was a significant predictor in all locations exceptin the Eastern Gulf of Finland and the Pomeranian Bay.Phosphate concentration was significantly important inall locations except the Curonian lagoon and theWestern Gulf of Finland. Dissolved inorganic nitrogenwas only a significant predictor in the Curonian lagoon,Lithuanian coastal waters and the Western Gulf ofFinland (Table 4).
Table 3
Numerical output of the RDA for main cluster types. Cluster type
number as in Table 2; GI e geographic index; MSB e maximum
summer biomass. Marked values are significant at p! 0.005
Cluster
type
% of
variability
described by
predictors
Contribution to the total sum of eigenvalues
GI t ( �C) Salinity MSB Others
I 42 0.01 0.03 0.24* 0.12* 0.04
II 42 0.10* 0.02* 0.10* 0.23* 0.00
III 30 0.11* 0.05* 0.11* 0.02* 0.08
IV 58 0.32* 0.12* 0.20* 0.01 0.07
4. Discussion
The cluster analysis of the data set, which consistedof more than 1200 samples distributed throughout theBaltic Sea coastal area, resulted in eight phytoplanktoncommunity types. These phytoplankton communitytypes were characterised by different taxonomic com-position and considered as separate stages of seasonalsuccession. Further RDA revealed the hierarchy ofexplanatory variables that best predict the communitytypes dominated either by diatoms, cyanophytes,cryptophytes or dinoflagellates (Table 4).
In temperate and boreal coastal areas diatomsgenerally prevail during the first phase of the succession(spring bloom), they are generally adapted to moreturbulent environments characterised by high nutrientconcentrations (Margalef, 1978; Smayda, 1980). Dia-toms are one of the largest taxonomic groups ofphytoplankton of the Baltic Sea (Snoeijs and Balashova,1998; Snoeijs, 2001), and are the dominant springphytoplankton in all analysed locations. The commonspecies are Stephanodiscus spp. (Curonian lagoon,Lithuanian coastal waters), Thalassiosira spp. andAchnanthes taeniata (Gulf of Finland, Gulf of Riga,and Pomeranian Bay), Coscinodiscus granii (Lithuaniancoastal waters, Gulf of Riga) and Skeletonema costatum(Western Gulf of Finland, Pomeranian Bay, Danishfjords). Overall diatom biomass and the salinity are notrelated statistically, however, salinity appeared to be themost important factor shaping the structure of diatom-dominated communities (see Fig. 3). Development ofdiatom communities is also governed by other physicalfactors like stratification, mixing depth, and turbidity(resulting in light limitation), which were not consideredin this study. Diatom-dominated spring blooms withclear biomass peaks appeared in all locations, wheresampling sites were generally deeper than 10e15 m, andwhere either temperature or salinity stratification istemporarily established during the course of theseasonal development. While in very shallow stations(Curonian lagoon, Pomeranian Bay, and Skrive Fjord)establishment of spring bloom diatom biomass peakmay be limited by turbidity, either caused by highfreshwater flow or wind mixing and resuspension duringthe spring period.
Diatom biomass was well related to the MSB (Fig. 3),while the structure of the diatom-dominated communityappeared to be less important as an indicator of thetrophic status of the location (Table 3). Diatoms, likeother dominant phytoplankton groups, did not havea significant relationship with ambient nutrient con-ditions, which may have been due to the limitation ofother factors (such as light) as discussed above. Diatomshave high growth rate, they often emerge as pioneerspecies of the succession, and rapidly consume inorganicnutrients, and sink out from the water column after
CyanB
DiatB
CryptB
chlorB
T
PO4
DIN
SiO4
axis 1-1 -0.5 0 0.5 1
axis
2
-1
-0.5
0
0.5
1 1 (Curonian lagoon)
CyanB
DiatBCryptB T
PO4
DIN
SiO4
axis 1-1 -0.5 0 0.5 1
axis
2
-1
-0.5
0
0.5
12 (Eastern Gulf of Finland)
CyanB
DiatB
CryptBDinB
T
PO4
DIN
SiO4
axis 1-1 -0.5 0 0.5 1
axis
2
-1
-0.5
0
0.5
1
3 (Gulf of Riga)
CyanB
DiatB
CryptBDinB
ChlorB
CilB
T
PO4DIN
SiO4
axis 1-1 -0.5 0 0.5 1
axis
2
-1
-0.5
0
0.5
14 (Western Gulf of Finland)
CyanBDiatB
DinB
ChlorB
T
PO4
DIN
SiO4
axis 1-1 -0.5 0 0.5 1
axis
2
-1
-0.5
0
0.5
1 5 (Lithuanian coastal waters)
CyanB
DiatB
CryptB
DinB
chlorB
T
PO4
DIN
SiO4
axis 1-1 -0.5 0 0.5 1
axis
2
-1
-0.5
0
0.5
16 (German coastal waters)
DiatBCryptB
DinB
chlorB
CilB
T
PO4
DIN
SiO4
axis 1-1 -0.5 0 0.5 1
axis
2
-1
-0.5
0
0.5
1 7 (Mariager Fjord)
DiatB CryptB
DinB
CilB
T
PO4
DIN
SiO4
axis 1-1 -0.5 0 0.5 1
axis
2
-1
-0.5
0
0.5
1 8 (Skive Fjord)
Fig. 4. RDA for locations. Thin lines represent response variables, thick lines represent explanatory variables.
249Z.R. Gasi�unait _e et al. / Estuarine, Coastal and Shelf Science 65 (2005) 239e252
termination of their vegetative life cycle (Kilham andKilham, 1980). During the Baltic spring bloom, diatombiomass peak generally appears at the time whennutrients are already bound to phytoplankton biomass,whereafter their bloom is terminated by rapid sinking(Heiskanen, 1998). During autumn blooms, another setof diatom species appear, probably governed by theirspecies-specific life cycles linked to the breakage of thesummertime stratification and subsequent availability ofnutrients at the surface layer.
Cyanophyte-dominated communities were found atall stations except at the two Danish sites thatrepresented the highest salinities. Cyanobacteria didnot appear in significant amounts in Danish phyto-plankton samples from analysed fjords, whereas thegenera Nodularia and Aphanizomenon were common insummer samples from the adjacent areas with lowersalinities (e.g. Belt Sea and Sound). While the growth ofAphanizomenon ceases at salinities above 10, Nodulariacould grow in these two Danish fjords (Lehtimaki et al.,1997). However, rates of growth and primary pro-duction are severely reduced with increasing salinities(Lehtimaki et al., 1997; Wasmund, 1997; Henriksenunpubl. results) and thus these genera may be compet-itively excluded under the prevailing physical conditionsin analysed areas. On the other hand, some cyanobac-teria species are tolerant of a wide range of salinities(Wasmund et al., 1999), so the main separation ofspecies composition actually exists between fresh andbrackish waters more than within brackish water.
In the nutrient rich, shallow water locations (Curo-nian lagoon and Pomerian Bay) cyanobacteria weregenerally dominating the bloom peaks during summer(Fig. 2). Thus it appeared that on these two locations,cyanobacterial biomass comprised most of the prevalentsummer blooms, therefore being strongly indicative forthe trophic status proxy MSB (Table 3). In the otherdeep open water locations (deeper than 10 or 15 m),cyanobacteria-dominated communities were the mostprevalent during summer, but the biomass levels weregenerally lower than during the spring bloom (Fig. 2).
Table 4
Numerical output of the RDA for locations. Location numbers (No.)
as in Table 1. Marked values are significant at p! 0.005
No. % of variability
described by
predictors
Contribution to the total sum of eigenvalues
t ( �C) PO4 DIN SiO4
1 31 0.2* 0.05 0.18* 0.16*
2 53 0.37* 0.06* 0.05 0.04
3 42 0.21* 0.13* 0.11 0.03*
4 54 0.24* 0.14 0.17* 0.08*
5 24 0.16* 0.04* 0.01* 0.01*
6 17 0.11* 0.04* 0.04 0.02
7 28 0.18* 0.1* 0.13 0.14*
8 27 0.15* 0.13* 0.10 0.03*
Due to their ability to fix gaseous nitrogen, hetero-cystic cyanophytes are very successful competitorsduring N-limitation periods (e.g. Paerl, 2000). N-limitation prevails in most of the Baltic coastal areasduring late spring and summer periods (Tamminenet al., 1985; Graneli et al., 1990), thus allowingdevelopment of cyanobacteria dominated blooms dur-ing late summer in the Baltic (Niemi, 1979; Kononen,1992). For example, in the easternmost Gulf of Finland,the nutrient ratios and hydrographical conditions de-termine which one of the cyanophytes e the heterocysticAphanizomenon sp. or non-N fixing Planktotrix agardhii,achieves dominance in the phytoplankton community(Kauppila et al., 1995; Kauppila and Lepisto, 2001).However, recurrent cyanobacterial blooms are naturalphenomena in the Baltic Sea (Bianchi et al., 2000),although the intensity of blooms may have increasedduring last century (Finni et al., 2001). Therefore simplythe dominance of cyanobacteria as such, would not bean appropriate indicator of high trophic conditions.Whereas the current results suggest that high summerphytoplankton biomass in combination with cyanobac-teria-dominated communities could be a potential in-dicator of elevated trophic conditions in shallow coastalwaters.
Dinophyte-dominated communities appeared in lo-cations with salinity above 5 and were generally mostfrequent during spring in the Gulf of Finland (domi-nated by Peridiniella catenata and Scrippsiella hangoei),Gulf of Riga (Peridiniella catenata), Lithuanian coastalwaters (dominated by P. catenata and Gymnodinium sp.)and Pomeranian Bay (Amphidinium crassum, Hetero-capsa rotundata). Dinophyte communities, dominatedby other species than during spring period (Heterocapsatriquetra in the Gulf of Finland and Lithuanian coastalwaters; Dinophysis acuminata in the Gulf of Riga;Prorocentrum spp. in Pomeranian Bay) also appearedduring summer in all of those locations as well as inDanish coastal waters (Prorocentrum minimum).
TheRDAdid not predict the dinoflagellate-dominatedcommunity well, suggesting that it is affected by factorsnot included in the current analysis.Many of the commondinoflagellates may potentially be mixotrophic species,partly independent on ambient nutrient conditions(Jacobson and Andersen, 1994). Many dinoflagellatespecies also migrate vertically and are able to use sub-pycnocline nutrients during the stratified period, thus areindependent of ambient nutrient conditions of the surfacelayer (Passow, 1991; Olli et al., 1998). Dinophytes areoften preferred food items and thus are grazed on heavilyby meso- and microzooplankton grazers (Kleppel, 1993).Some dinoflagellatesmay also be limited by availability oftrace metals that are bound in the humic substances(Graneli et al., 1985).
Cryptophytes could be found in all analysed loca-tions, but dominated in only three of them: Eastern Gulf
250 Z.R. Gasi�unait _e et al. / Estuarine, Coastal and Shelf Science 65 (2005) 239e252
of Finland, Pomeranian Bay and Mariager Fjord. Incontrast to the other groups, this community appearedin late autumnewinter (NovembereFebruary) samplesin more than 50% of the cases. The sensitivity of thecryptophytes to the geographic index and the domi-nance of this group in only three different locationssuggest that other site-specific factors (e.g. hydrody-namics, ice cover) are more likely to predict thesecommunities than salinity or trophic status indicators.Cryptophytes have a relatively low affinity for light andoften dominate in the deeper part of the stratified watercolumn (Sommer, 1985; Stewart and Wetzel, 1986).Moreover, lack of winter sampling might influence thefinding that cryptophyte-dominated communities werenot detected in all locations. Therefore the factors thatresulted in appearance of cryptophyte-dominated com-munities in these three geographically separate andhydrodynamically different areas are not clear. Poten-tially species-specific analysis could shed some light onthe regulation. However, based on the current results theindicative value of cryptophytes for trophic conditionsseems to be limited.
The RDA at the location level reveals that temper-ature is the most important factor that shapes phyto-plankton community structure at all locations. Thisrelationship is the strongest in the northernmostlocations (Gulf of Finland) and much weaker in thesouthernmost location (Pomeranian Bay). The impor-tance of temperature reflects the strong seasonal differ-ences characteristic of boreal and temperate coastalwaters. Further, inorganic nitrogen and phosphorusconcentrations were also significantly linked to differentphytoplankton community structures at different loca-tions. Silica availability appeared to be a significantfactor shaping phytoplankton communities at alllocations except Eastern Gulf of Finland and Pomera-nian Bay.
It is important to note that nutrients were not amongthe most significant factors that shaped previouslydefined community types when data from all locationswere combined. This proves the feasibility of formalstatistical methods to derive seasonal community types.While the analysis of phytoplankton community struc-ture covering all seasonal succession stages confirmed itto be sensitive to nutrient concentrations at the locationlevel.
It could be concluded that irrespective of thelimitations in database compiled from different nationalsources, it was possible to identify phytoplanktoncommunity types, indicative of climatic conditions,salinity and trophic status of the locations. It is clear,that cyanophyte abundance alone cannot be used as aneutrophication indicator in the brackish Baltic Seawhere such blooms occur also naturally. Also, thestructure of both diatom- and cyanophyte-dominatedcommunities is governed by salinity, and thus the
abundances of these groups cannot be directly used asan indicator across the whole Baltic Sea.
Acknowledgements
This study was supported by EU FP 5 projectCHARM (Characterisation of the Baltic Sea Ecosystem:Dynamics and Function of Coastal Types) EVK3-CT-2001-00065. We also would like to thank Ibrahim Johaand Arjen Raateland for phytoplankton databasecompilation, Ulla Helminen for inspiring discussions,Lisa Rima Bacanskas for careful reading and languagerevision and two anonymous referees for their construc-tive comments.
References
Andrushaitis, A., Seisuma, Z., Legzdina, M., Lensh, E., 1995. River
load of eutrophying substances and heavy metals into the Gulf of
Riga. In: Ojaveer, E. (Ed.), Ecosystem of the Gulf of Riga between
1920 and 1990. Estonian Academic Publishers, Tallinn, pp. 32e40.Bianchi, T.S., Westman, P., Rolff, C., Engelhaupt, E., Andren, T.,
Elmgren, R., 2000. Cyanobacterial blooms in the Baltic Sea:
natural or human induced? Limnology and Oceanography 45,
716e726.Clarke, K.R., Warwick, R.M., 1997. Change in Marine Communities:
An Approach to Statistical Analysis and Interpretation. Plymouth
Marine Laboratory, Plymouth, 144 pp.
Cloern, J.E., 2001. Our evolving conceptual model of the coastal
eutrophication problem. Marine Ecology Progress Series 210,
223e253.
Edler, L., 1979. Recommendations on methods for marine biological
studies in the Baltic Sea. Phytoplankton and chlorophyll. The
Baltic Marine Biologists 5, 1e38.
Finni, T., Kononen, K., Olsonen, R., Wallstrom, K., 2001. The history
of cyanobacterial blooms in the Baltic Sea. Ambio 30, 172e178.Gasi�unait_e, Z.R., 2000. Coupling of the limnetic and brackishwater
plankton crustaceans in the Curonian lagoon (Baltic Sea).
International Review of Hydrobiology 85, 649e657.
Gasi�unait_e, Z.R., Razinkovas, A., 2004. Temporal and spatial patterns
of the crustacean zooplankton dynamics in transitional lagoon
ecosystem. Hydrobiologia 514, 139e149.
Graneli, E., Edler, L., Gedziorowska, D., Nyman, U., 1985. Influence
of humic and fulvic acids on Prorocentrum minimum. In:
Andersson, D.M., White, A.W., Baden, D.G. (Eds.), Toxic
Dinoflagellates. Elsevier, pp. 201e206.
Graneli, E., Wallstrom, K., Larsson, U., Graneli, W., Elmgren, R.,
1990. Nutrient limitation of primary production in the Baltic Sea
area. Ambio 19, 142e151.
Heiskanen, A.-S., 1998. Factors governing sedimentation and pelagic
nutrient cycles in the northern Baltic Sea. Monographs of the
Boreal Environment Research 8, 1e80.
Heiskanen, A.-S., van de Bund, W.J., Cardoso, A.C., N~oges, P., 2004.
Towards good ecological status of surface waters in Europe e
Interpretation and harmonisation of the concept. Water Science
and Technology 49, 169e177.
HELCOM, 2001. Manual for Marine Monitoring in the COMBINE
Programme ofHELCOM, Part C.HELCOM. Internet, updated 2001.
http://www.helcom.fi/Monas/CombineManual2/CombineHome.htm.
251Z.R. Gasi�unait _e et al. / Estuarine, Coastal and Shelf Science 65 (2005) 239e252
HELCOM, 2002. Environment of the Baltic Sea area, 1994e1998.Baltic Sea Environment Proceedings, vol. 82B. HELCOM, pp.
1e215.
Hubel, H.-J., Vietinghoff, U., Hubert, M.-L., Rambow-Bartels, S.,
Korth, B., Westphal, H., Lenk, B., 1995. Ergebnisse des
okologischen Monitorings Greifswalder Bodden September 1993
bis Marz 1995. Rostock, Meeresbiologie Beitr 3, 5e68.
Jacobson, D.M., Andersen, R.A., 1994. The discovery of mixotrophy
in photosynthetic species of Dinophysis (Dinophyceae): light and
electron microscopical observations of food vacuoles in Dinophysis
acuminata, D. norvegica and two heterotrophic dinophysoid
dinoflagellates. Phycologia 33, 97e100.Kauppila, P., Hallfors, G., Kangas, P., Kokkonen, P., Basova, S.,
1995. Late summer phytoplankton species composition and
biomasses in the eastern Gulf of Finland. Ophelia 42, 179e191.
Kauppila, P., Lepisto, L., 2001. Changes in phytoplankton. In:
Kauppila, P., Back, S. (Eds.), The State of Finnish Coastal Waters
in the 1990s. The Finnish Environment, vol. 427, pp. 61e70.
Kilham, P., Kilham, S.S., 1980. The evolutionary ecology of
phytoplankton. In: Morris, I. (Ed.), The Physiological Ecology
of Phytoplankton. University of California Press, Berkeley, pp.
571e597.
Kleppel, G.S., 1993. On the diets of calanoid copepods. Marine
Ecology Progress Series 99, 183e195.
Kononen, K., 1992. Dynamics of the toxic cyanobacterial blooms in
the Baltic Sea. Finnish Marine Research 261, 1e36.
Koroleff, F., 1969. Direct determination of ammonia in natural waters
as indophenol blue. CM ICES/C 9, 19e22.
Koroleff, F., 1983a. Determination of phosphorus. In: Grasshoff, K.,
Ehrhardt, M., Kremling, K. (Eds.), Methods of Sea Waters
Analysis, second ed. Verlag Chemie, Weinheim, pp. 125e139.
Koroleff, F., 1983b. Determination of silicon. In: Grasshoff, K.,
Ehrhardt, M., Kremling, K. (Eds.), Methods of Sea Waters
Analysis, second ed. Verlag Chemie, Weinheim, pp. 174e183.Laakkonen, A., Malkki, P., Niemi, A., 1981. Studies on the sinking,
degradation and sedimentation of organic matter off Hanko
peninsula, entrance to the Gulf of Finland. Meri 9, 1e42.
Legendre, P., Anderson, M.J., 1999. Distance-based redundancy
analysis: testing multispecies responses in multifactorial ecological
experiments. Ecological Monographs 69, 1e24.
Lehtimaki, J., Moisander, P., Sivonen, K., Kononen, K., 1997.
Growth, nitrogen fixation, and nodularin production by two Baltic
Sea cyanobacteria. Applied and Environmental Microbiology 63,
1647e1656.
Margalef, R., 1978. Life-forms of phytoplankton as survival alter-
natives in an unstable environment. Oceanologica Acta 1, 493e509.
Niemi, A., 1973. Ecology of phytoplankton in the Tvarminne area SW
coast of Finland. I. Dynamics of hydrography, nutrients,
chlorophyll a and phytoplankton. Acta Botanica Fennica 100,
1e68.
Niemi, A., 1975. Ecology of phytoplankton in the Tvarminne area SW
coast of Finland. II. Primary production and environmental
conditions in the archipelago zone and sea zone. Acta Botanica
Fennica 105, 1e73.
Niemi, A., 1979. Blue-green algal blooms and N:P ratio in the Baltic
Sea. Acta Botanica Fennica 110, 57e61.Nixon, S.W., 1995. Coastal marine eutrophication: a definition, social
causes, and future concerns. Ophelia 41, 199e219.
Olesen, M., Lundsgaard, C., Andrushaitis, A., 1999. Influence of
nutrients and mixing on the primary production and community
respiration in the Gulf of Riga. Journal of Marine Systems 23,
127e143.
Olli, K., Heiskanen, A.-S., Lohikari, K., 1998. Vertical migration of
autotrophic micro-organisms during a vernal bloom at the coastal
Baltic Sea e coexistence through nische separation. In:
Tamminen, T., Kuosa, H. (Eds.), Eutrophication in Planktonic
Ecosystems: Food Web Dynamics and Elemental Cycling. Hydro-
biologia, vol. 363, pp. 179e189.
Paerl, H.W., 2000. Marine plankton. In: Whitton, B.A., Potts, M.
(Eds.), The Ecology of Cyanobacteria. Kluver Academic publishers,
pp. 121e148.Passow, U., 1991. Vertical migration of Gonyaulax catenata and
Mesodinium rubrum. Marine Biology 110, 455e463.
Peinert, R., Saure, A., Stegmann, P., Stien, C., Haardt, H.,
Smetacek, V., 1982. Dynamics of primary production and
sedimentation in a coastal ecosystem. Netherlands Journal of Sea
Research 16, 276e289.
Pitkanen, H., 1991. Nutrient dynamics and trophic conditions in the
eastern Gulf of Finland: the regulatory role of the Neva estuary.
Aqua Fennica 21, 105e115.
Pitkanen, H., Tamminen, T., Kangas, P., Huttula, T., Kivi, K.,
Kuosa, H., Sarkkula, J.I., Eloheimo, K., Kauppila, P.,
Skakalsky, B., 1993. Late summer trophic conditions in the
north-east Gulf of Finland and the River Neva Estuary, Baltic
Sea. Estuarine, Coastal and Shelf Sciences 37, 453e474.
Rantajarvi, E., Gran, V., Hallfors, S., Olsonen, R., 1998. Effects of
environmental factors on the phytoplankton community in the
Gulf of Finland e unattended high frequency measurements and
multivariate analyses. Hydrobiologia 363, 127e139.Remane, A., 1955. Die Brackwasser e Submergenz und die
Unkomposition der Coenosen in Belt- und Ostsee. Kieler
Meeresforschung 11, 59e73.
Remane, A., 1958. Okologie des Brackwassers. In: Remane, A.,
Schlieper,C. (Eds.),DieBiologie desBrackwassers. Schweizerbartsche
Verlagsbuchhandlung, Stuttgart, p. 216.
Schiewer, U., 1998. 30 Years’ eutrophication in shallow brackish
waters e lessons to be learned. Hydrobiologia 363, 73e79.
Smayda, T.J., 1980. Phytoplankton species succession. In: Morris, I.
(Ed.), The Physiological Ecology of Phytoplankton. Studies in
Ecology, vol. 7. Blackwell, Oxford, pp. 493e570.Snoeijs, P., 2001. Diatoms and environmental change in brackish
waters. In: Stoermer, E.F., Smol, J.P. (Eds.), The Diatoms e
Application for the Environmental and Earth Sciences. Cambridge
University Press, pp. 298e333.Snoeijs, P., Balashova, J., 1998. In: Intercalibration and Distribution
of Diatom Species in the Baltic Sea, vol. 5 (including check-list).
Opulus Press, Uppsala, 141 pp.
Sommer, U., 1985. Differential migration of Cryptophyceae in lake
constance. In: Rankin, M.A. (Ed.), Migration: Mechanisms and
Adaptive Significance. Contributions in Marine Science, pp. 166e
175 (Austin).
Sommer, U., Gliwicz, Z.M., Lampert, W., Duncan, A., 1986. The PEG
e model of seasonal succession of planktonic events in fresh
waters. Archiv fur Hydrobiologie 106, 433e471.
Stewart, A.J., Wetzel, R.G., 1986. Cryptophytes and other micro-
flagellates as couplers in planktonic community dynamics. Archiv
fur Hydrobiologie 106, 1e19.
Stigebrandt, A., 2001. Physical oceanography of the Baltic sea. In:
Wulff, F., Rahm, L., Larsson, P. (Eds.), A System Analysis of the
Baltic Sea, pp. 20e74.
Tamminen, T., Kaitala, S., Kivi, K., Kuparinen, J., 1985. Response of
a planktonic brackish water community to single and combined
additions of ammonium and phosphate in a factorial mesocosm
experiment. In: Gray, J.S., Christiansen, M.E. (Eds.), Marine
Biology of Polar Regions and Effects of Stress on Marine
Organisms. Wiley, New York, pp. 363e378.Utermohl, H., 1958. Zur Vervollkommung der quantitativen phyto-
plankton-methodik. Mitteilungen Internationale Vereinigung fur
Limnologie 9, 1e38.
Vollenweider, R.A., 1992. Coastal marine eutrophication. In:
Vollenweider, R.A., Marchetti, R., Viviani, R. (Eds.), Marine
Coastal Eutrophication. Elsevier, London, pp. 1e20.
252 Z.R. Gasi�unait _e et al. / Estuarine, Coastal and Shelf Science 65 (2005) 239e252
Vollenweider, R.A., Kerekes, J., 1982. Eutrophication of Waters.
Monitoring, Assessment and Control. Organization for Economic
Co-Operation and Development (OECD), Paris, 156 pp.
Wasmund, N., 1997. Occurrence of cyanobacterial blooms in the Baltic
Sea in relation to environmental conditions. Internationale Revue
der gesamten Hydrobiologie 82, 169e184.
Wasmund, N., Zalewski, M., Busch, S., 1999. Phytoplankton in large
river plumes in the Baltic Sea. ICES Journal of Marine Science 56
(Suppl.), 23e32.
Wasmund, N., Nausch, G., Postel, L., Witek, Z., Zalewski, M.,
Gromisz, S., Lysiak-Pastuszak, E., Olenina, I., Kavolyte, R.,
Jasinskaite, A., Muller-Karulis, B., Ikauniece, A., Ojaveer, H.,
Kalliste, K., Jaanus, A., 2000. In: Trophic Status of Coastal and
Open Areas of the South-Eastern Baltic Sea Based on Nutrient and
Phytoplankton Data from 1993e1997, vol. 38. Meereswissen-
schaftliche Berichte, Warnemunde, 83 pp.
Zaromskis, R., 1996. Oceans, Seas, Estuaries. Vilnius, 293 pp. (in
Lithuanian).