Embed Size (px)
Citation preview
OrganizationDateSeattle City CouncilDec. 15, 2014
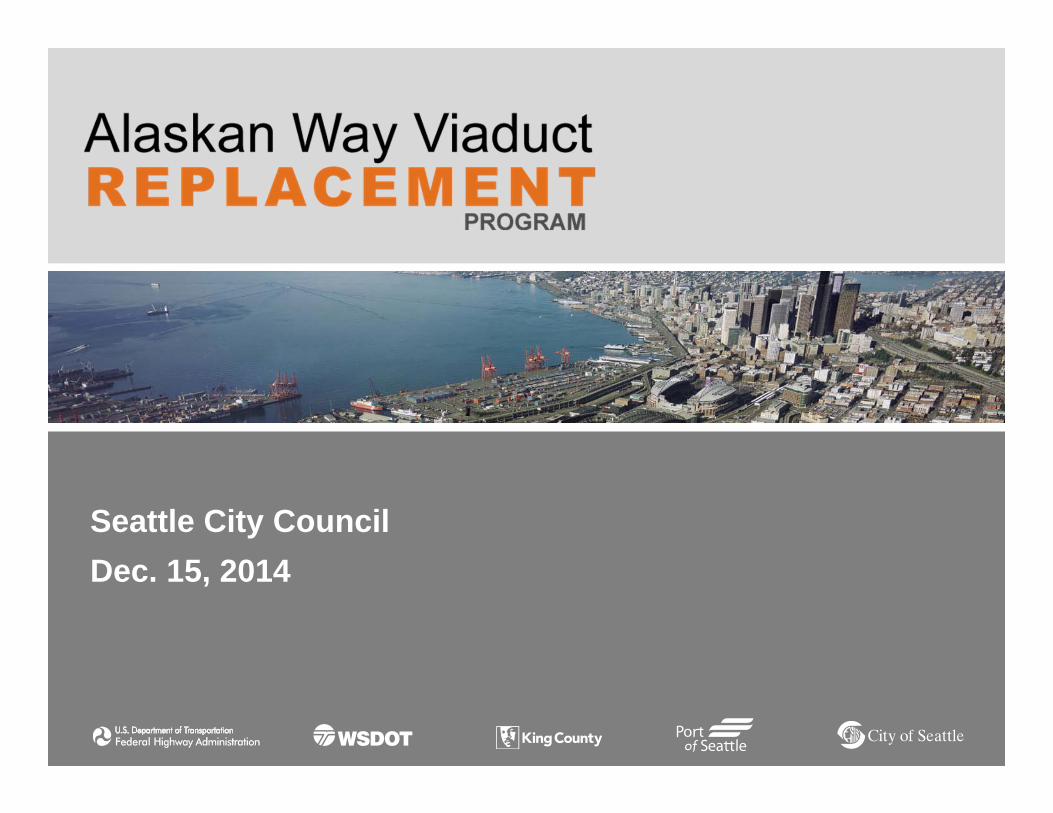
Surface, Building and Benchmark Settlement Since Nov. 24, 2014
0
Settl
emen
t (in
.)
-0.125-0.25
-0.375-0.05
-0.625-0.75
-0.875-1
-1.125-1.25
24 - Nov 29 - Nov 4 - Dec 9 - Dec 14 - Dec
Deep Benchmark 1Occidental Ave S and Railroad Way S
-0.636 -0.672
-0.696 -0.672
-0.636
Survey Accuracy
-0.756
Dec 12
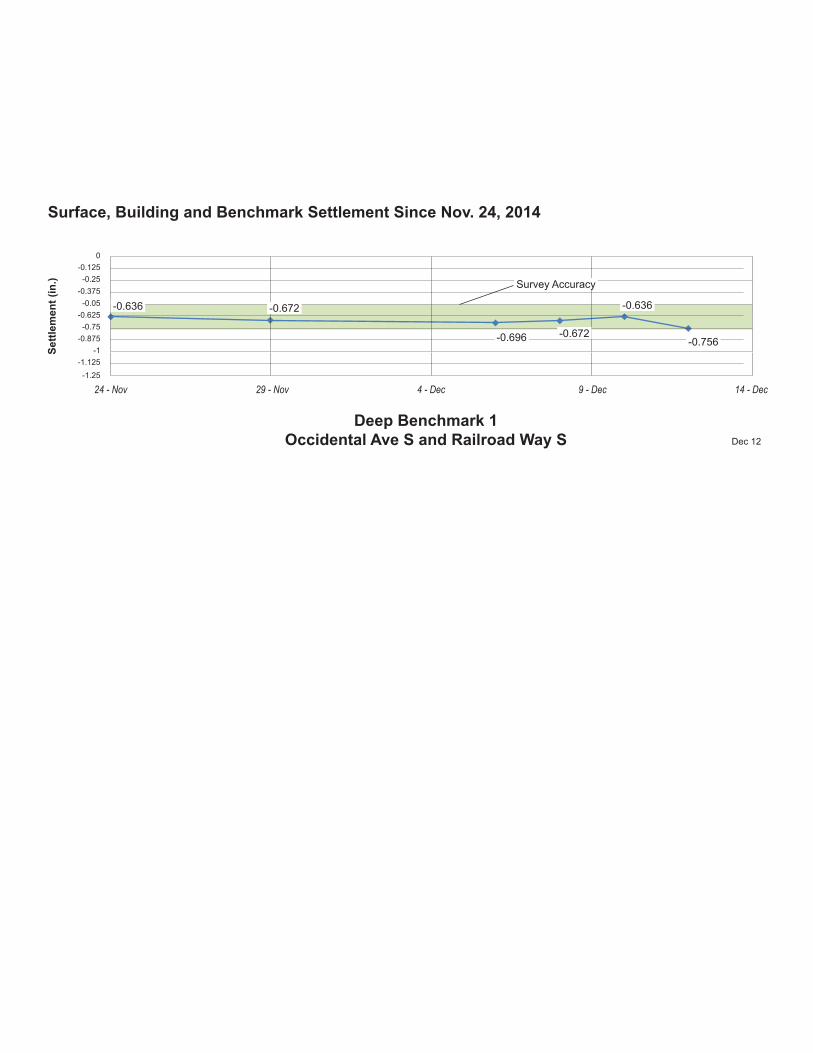
Surface, Building and Benchmark Settlement Since Nov. 24, 2014
0
Settl
emen
t (in
.)
-0.125-0.25
-0.375-0.05
-0.625-0.75
-0.875-1
-1.125-1.25
24 - Nov 29 - Nov 4 - Dec 9 - Dec 14 - Dec
Deep Benchmark 2Second Ave and Marion St
-0.24
-0.288
-0.24
-0.252
-0.24
-0.24
Survey Accuracy
Dec 12
Surface, Building and Benchmark Settlement Since Nov. 24, 2014
0
Settl
emen
t (in
.)
-0.125-0.25
-0.375-0.05
-0.625-0.75
-0.875-1
-1.125-1.25
24 - Nov 29 - Nov 4 - Dec 9 - Dec 14 - Dec
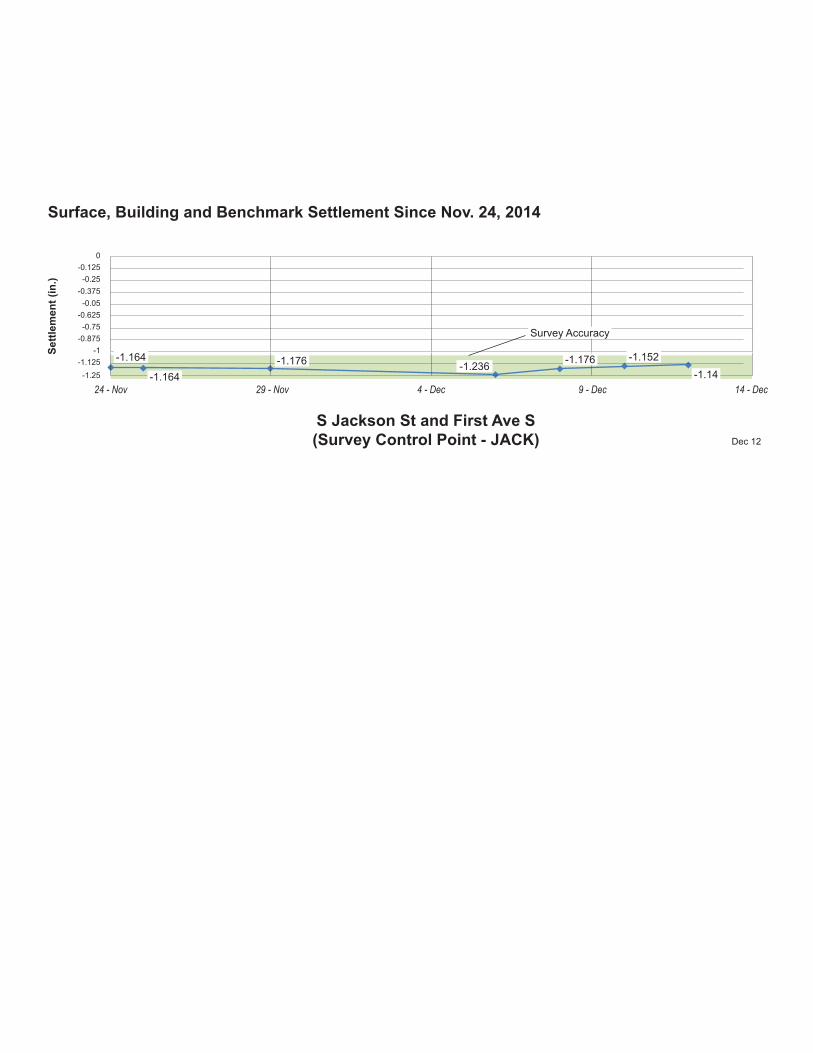
S Jackson St and First Ave S(Survey Control Point - JACK)
-1.164
-1.164-1.176 -1.236 -1.176 -1.152
-1.14
Survey Accuracy
Dec 12
Surface, Building and Benchmark Settlement Since Nov. 24, 2014
0
Settl
emen
t (in
.)
-0.125-0.25
-0.375-0.05
-0.625-0.75
-0.875-1
-1.125-1.25
24 - Nov 29 - Nov 4 - Dec 9 - Dec 14 - Dec
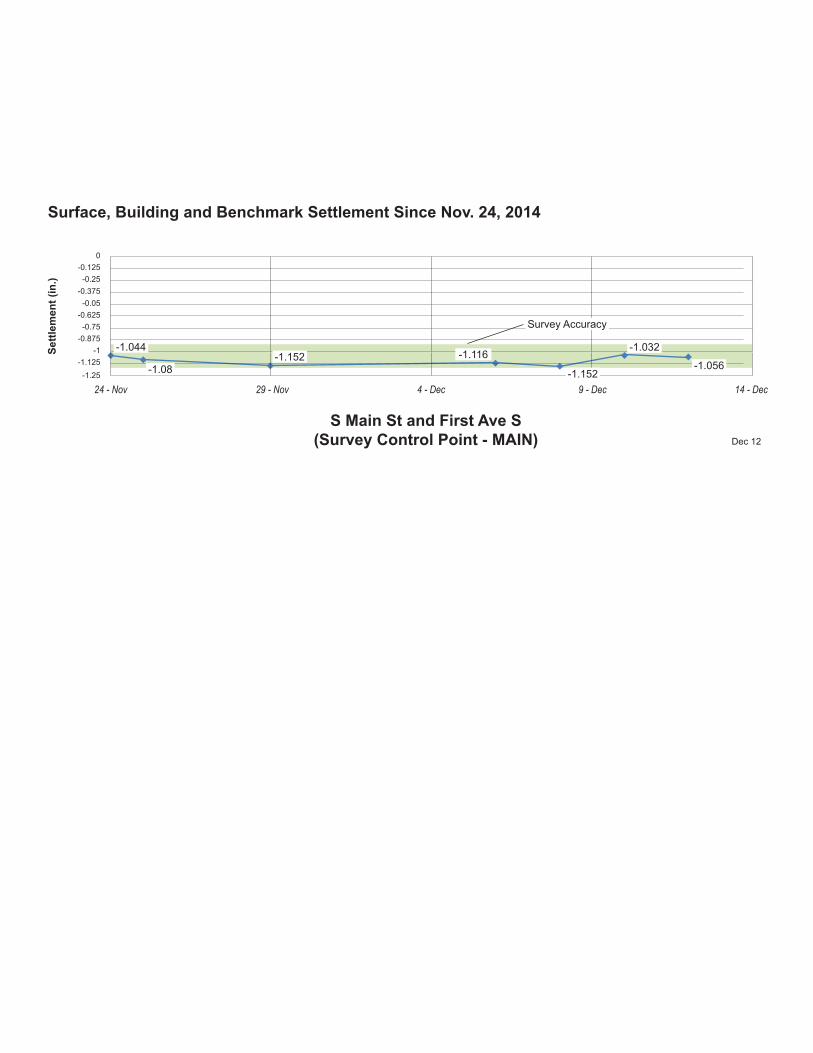
S Main St and First Ave S(Survey Control Point - MAIN)
-1.044
-1.08-1.152 -1.116
-1.152
-1.032
-1.056
Survey Accuracy
Dec 12
§̈¦5
Access Shaft
TunnelAlignment
Alaskan WayViaduct
DBM3
DBM2
DBM1
X34
X32
X52
X51
X50
X49
X47
X07
X06
Fire
King
Jack
Main
MYST
Pike
Event
MTC019
GP-276
GP-232
UnitedGP-319
Spring
Target
SMP 405
SMP 408
Tidal G
COS 5020
Bergman
SMP 409
-0.9
-0.7-0.8
-0.6-0.5
-1.0
-0.4
-0.3
-0.2
-1.1
-1.2
-0.1
-1.3
-1.4
-0.1
-0.9
-0.6
-0.6
-0.2
-1.4
-0.7
-0.5
-0.9
-0.7
-0.8
-0.8
-0.1
-0.7
-0.5
-0.2
-0.4
-0.3
-0.1
µ0 500
Feet
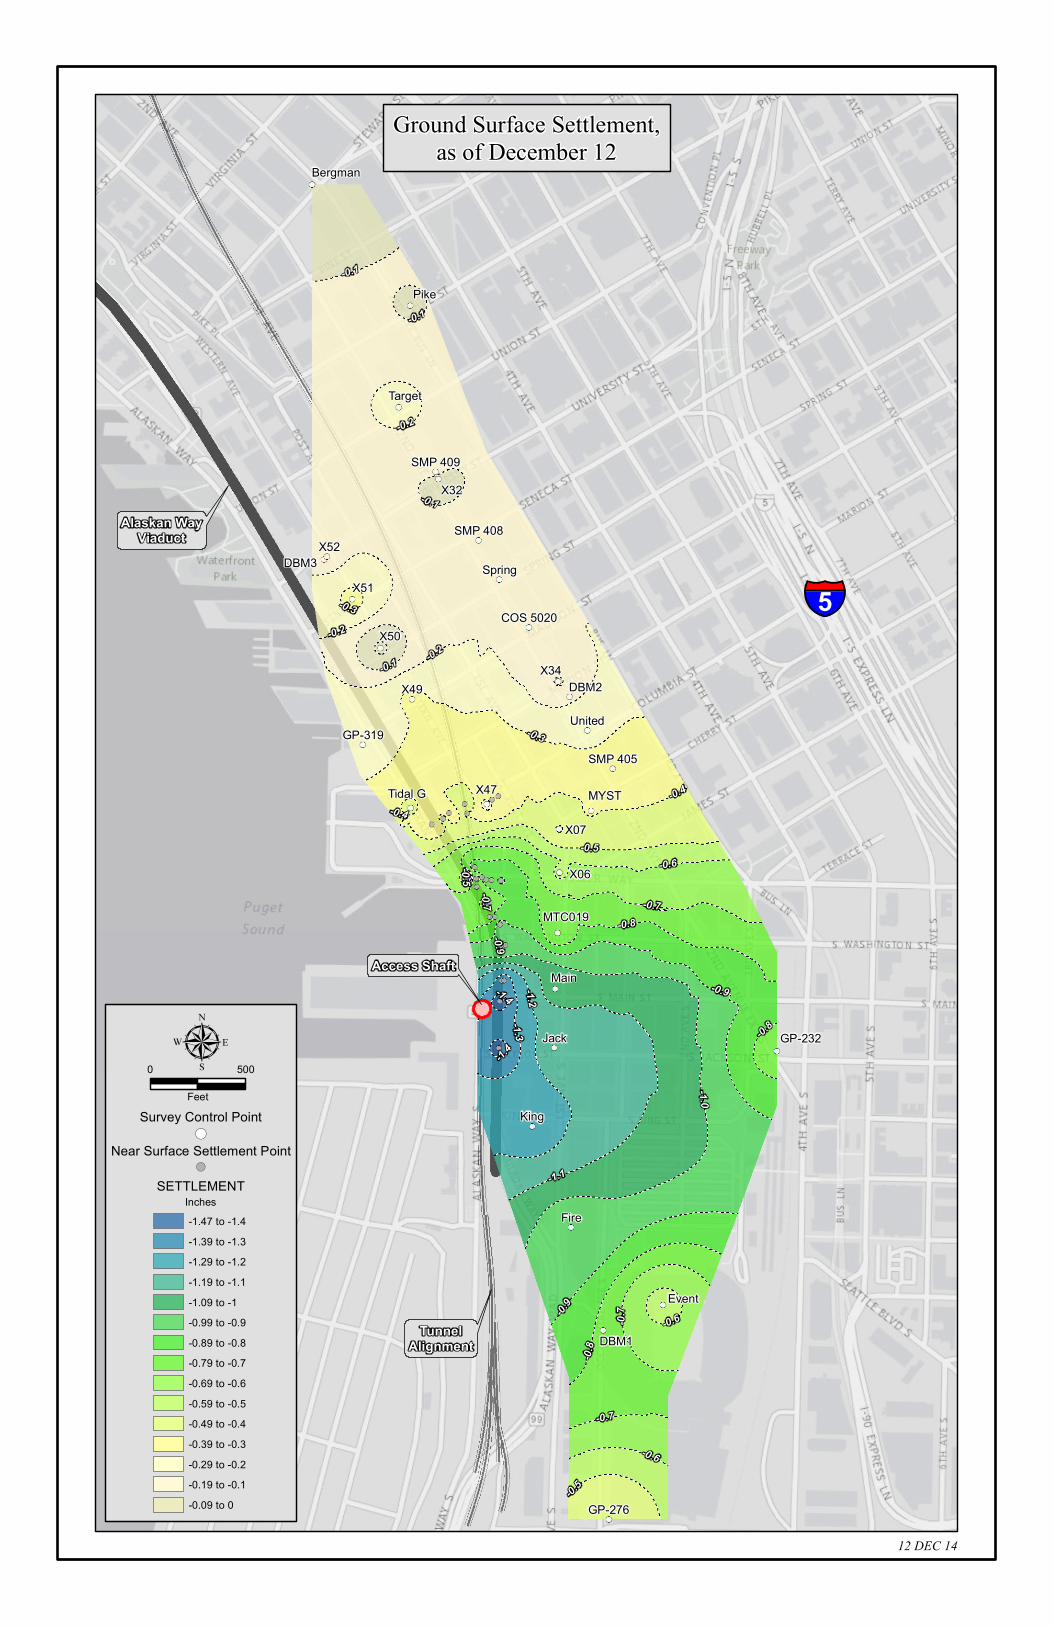
SETTLEMENTInches
!(
Survey Control Point
Near Surface Settlement Point!(
12 DEC 14
-1.47 to -1.4-1.39 to -1.3-1.29 to -1.2-1.19 to -1.1-1.09 to -1-0.99 to -0.9-0.89 to -0.8-0.79 to -0.7-0.69 to -0.6-0.59 to -0.5-0.49 to -0.4-0.39 to -0.3-0.29 to -0.2-0.19 to -0.1-0.09 to 0
Ground Surface Settlement,as of December 12
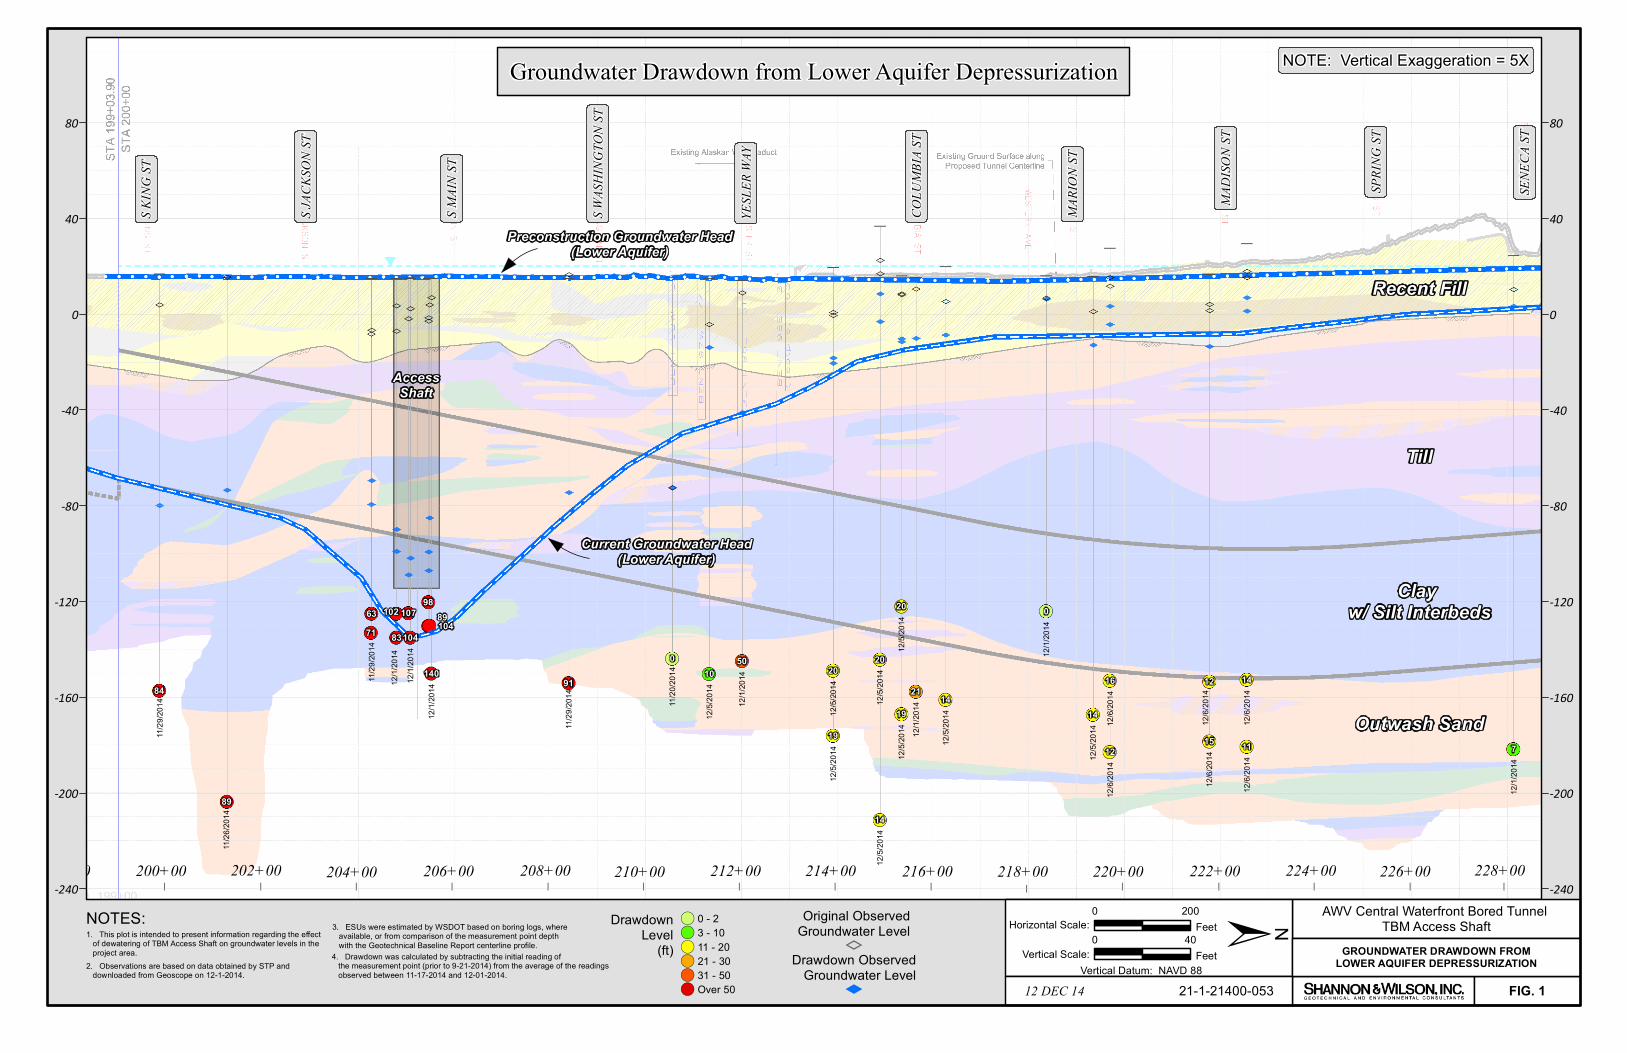
1. This plot is intended to present information regarding the effect of dewatering of TBM Access Shaft on groundwater levels in the project area.
3. ESUs were estimated by WSDOT based on boring logs, where available, or from comparison of the measurement point depth with the Geotechnical Baseline Report centerline profile.
NOTES:
FIG. 12. Observations are based on data obtained by STP and downloaded from Geoscope on 12-1-2014.
4. Drawdown was calculated by subtracting the initial reading of the measurement point (prior to 9-21-2014) from the average of the readings observed between 11-17-2014 and 12-01-2014.
I I I I I I I I I I I I I I I200+00 202+00 204+00 206+00 208+00 210+00 212+00 214+00 216+00 218+00 220+00 222+00 224+00 226+00 228+00198+00
Outwash Sand
Clay w/ Silt Interbeds
Till
Recent Fill
AccessShaft
Current Groundwater Head(Lower Aquifer)
Preconstruction Groundwater Head(Lower Aquifer)
0
91
19
20
14
15
1284
1050
21
0
14
11 7
7163 102
83
107
104
98
10489
140
89
20
14
20
19
1416
12
11/20
/2014
11/29
/2014
12/5/
2014
12/5/
2014
12/5/
2014
12/6/
2014
12/6/
2014
11/29
/2014
12/5/
2014
12/1/
2014
12/1/
2014
12/1/
2014
12/6/
2014
12/6/
2014
12/1/
2014
11/29
/2014
12/1/
2014
12/1/
2014
12/1/
2014
11/26
/2014
12/5/
2014
12/5/
2014
12/5/
2014
12/5/
2014
12/5/
2014 12/6/
2014
12/6/
2014
S KIN
G ST
S JAC
KSON
ST
S MAI
N ST
S WAS
HING
TON S
T
YESL
ER W
AY
COLU
MBIA
ST
MARI
ON ST
MADI
SON S
T
SPRI
NG ST
SENE
CA ST
-240 -240
-200 -200
-160 -160
-120 -120
-80 -80
-40 -40
0 0
40 40
80 80
AWV Central Waterfront Bored Tunnel TBM Access Shaft
0 200Feet
Feet0 40
Vertical Scale:
Horizontal Scale: ±
Vertical Datum: NAVD 88
DrawdownLevel
(ft)
Original ObservedGroundwater Level
Drawdown ObservedGroundwater Level
0 - 23 - 1011 - 2021 - 3031 - 50Over 50
!(!(!(!(!(!(
YX
NOTE: Vertical Exaggeration = 5X
12 DEC 14 21-1-21400-053
GROUNDWATER DRAWDOWN FROMLOWER AQUIFER DEPRESSURIZATION
Groundwater Drawdown from Lower Aquifer Depressurization

#*
#*
Lower Aquifer(Outwash Sand)
Aquitard(Clay w/ Silt Interbeds)
Unconfined Groudwater LevelScreened Observation Well
In Upper Aquifer
G r o u n d S u r f a c eG r o u n d S u r f a c e
Upper Aquifer(Recent Soil & Fill)
Confined Groundwater Level
Screened Observation WellIn Lower Aquifer
12 DEC 14
Generalized Aquifer Profile with Groundwater Wells
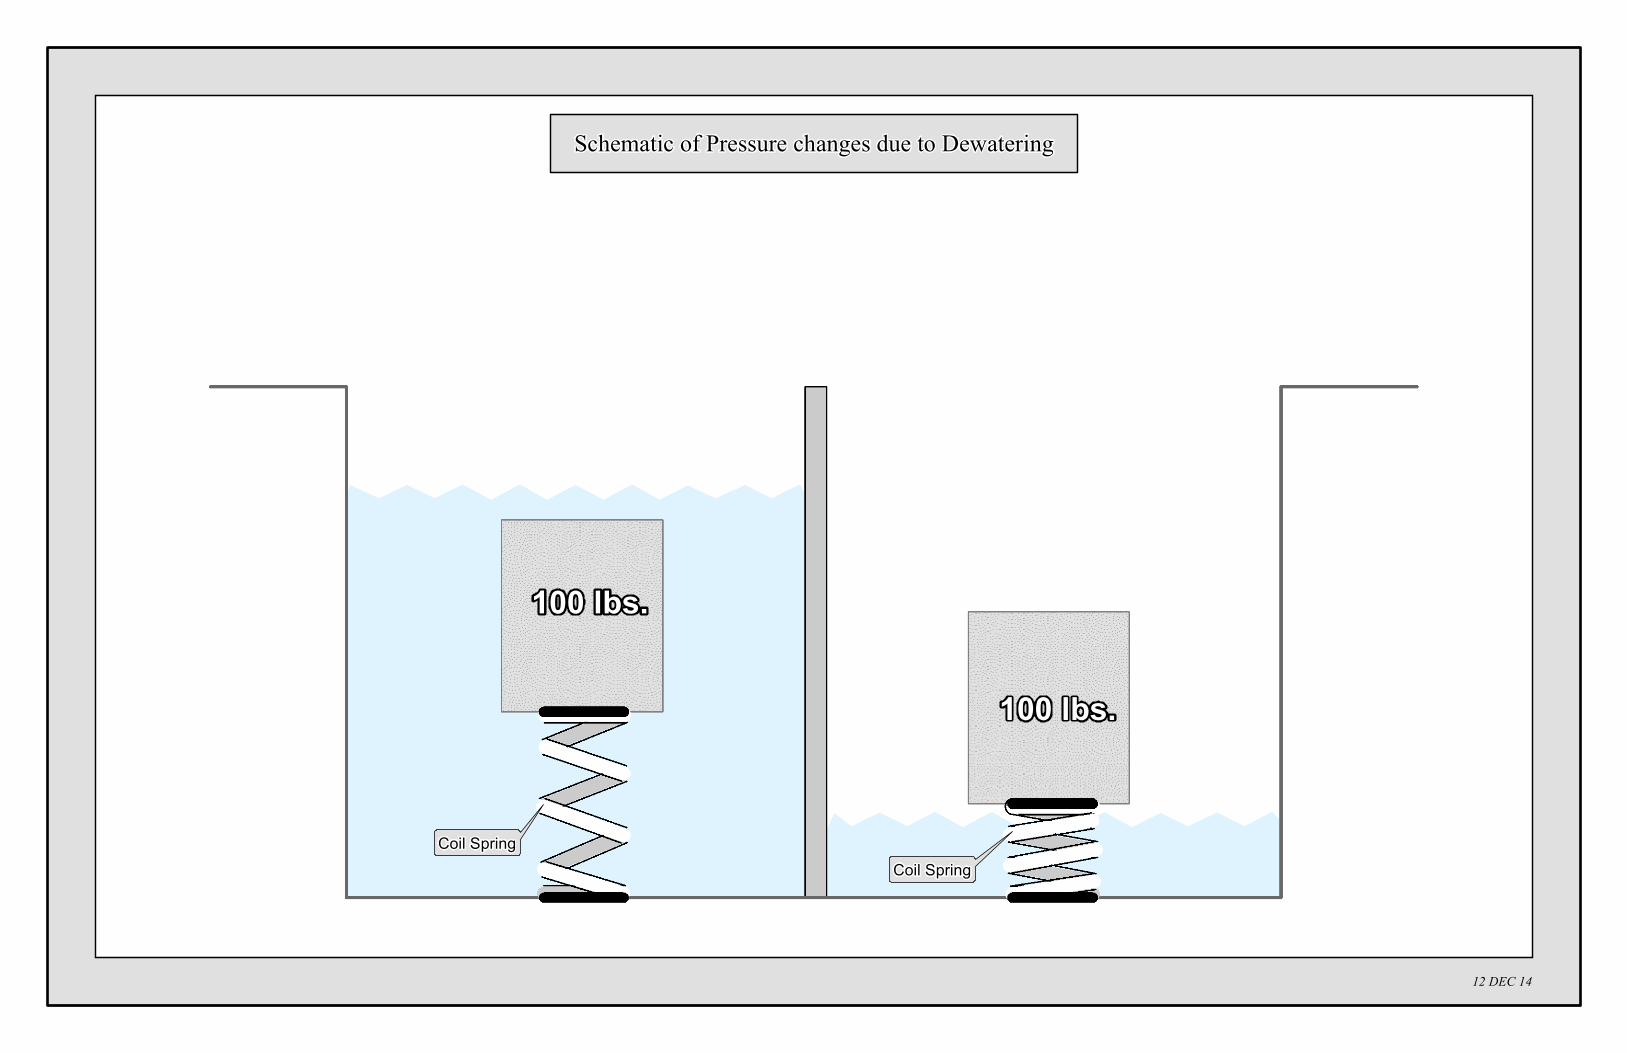
100 lbs.
100 lbs.
Coil SpringCoil Spring
12 DEC 14
Schematic of Pressure changes due to Dewatering
Alaskan Way Viaduct REPLACEMENT
PROGRAM
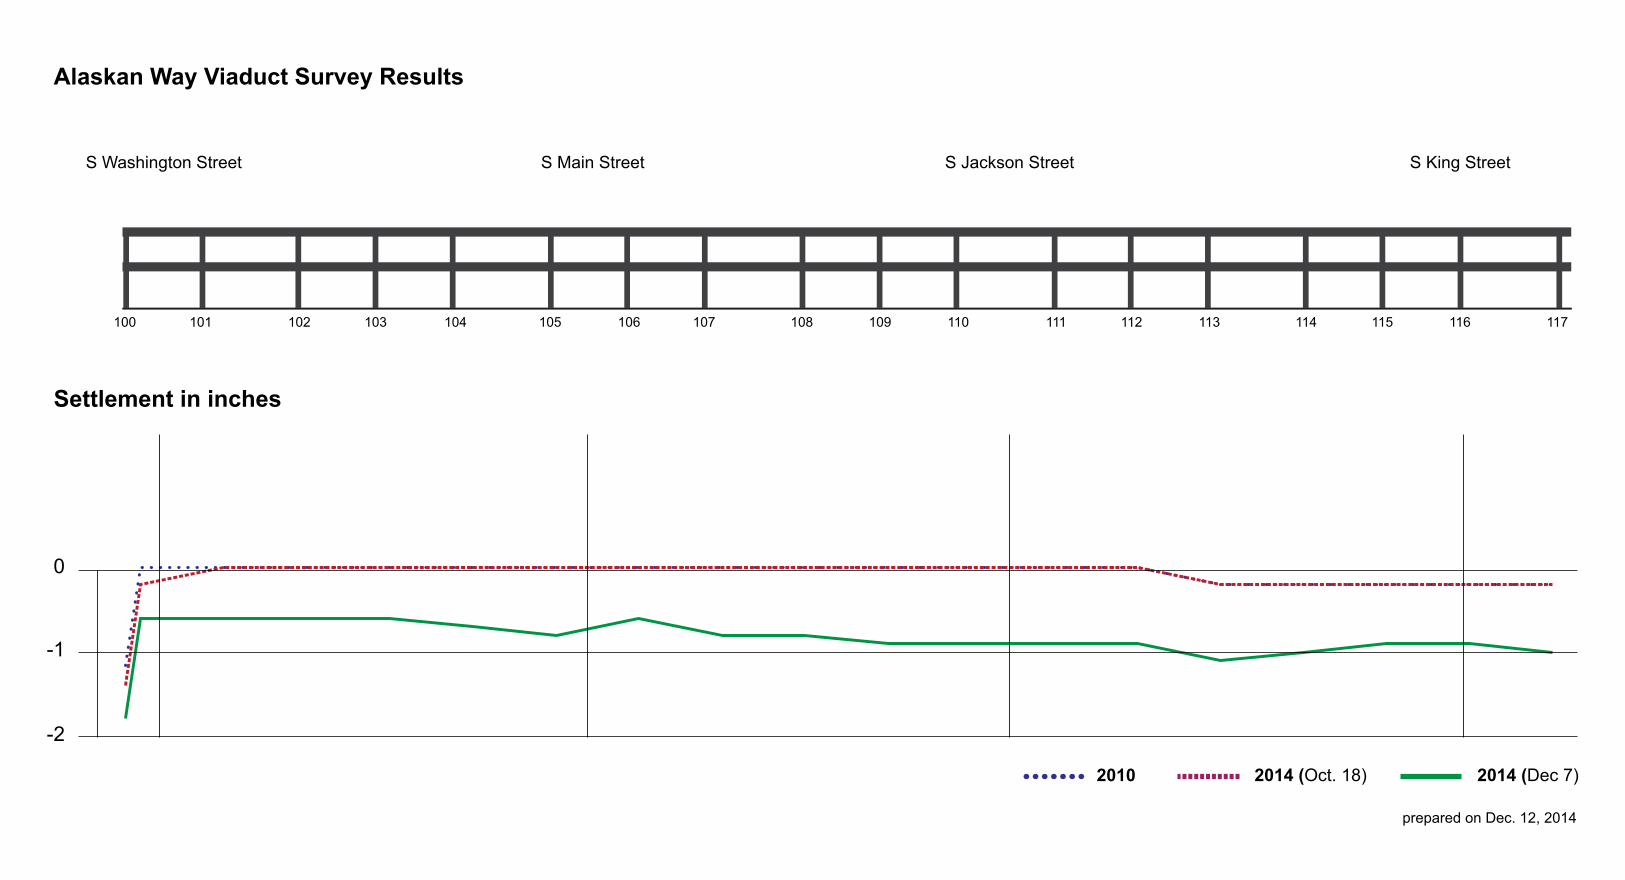
-2
-1
0
2014 (Dec 7)
Settlement in inches
Alaskan Way Viaduct Survey Results
2014 (Oct. 18)2010
100 101 102 103 104 105 106 107 108 109 110 111 112 113 114 115 116 117
S King StreetS Main StreetS Washington Street
prepared on Dec. 12, 2014
S Jackson Street