Embed Size (px)
Citation preview
Seaweed Aquaculture for Food Security, Income Generation and Environmental Health
Seaweed Aquaculture for Food Security, Income Generation and Environmental Health in
Tropical Developing CountriesTo meet carbon emissions targets, more than 30 countries have committed to boosting production of renewable resources from biological materials and convert them into products such as food, animal feed and bioenergy. In a post-fossil-fuel world, an increasing proportion of chemicals, plastics, textiles, fuels and electricity will have to come from biomass, which takes up land. To maintain current consumption trends the world will also need to produce 50–70% more food by 2050, increasingly under drought conditions and on poor soils. Depending on bioenergy policies, biomass use is expected to continue to rise to 2030 and imports to Europe are expected to triple by 2020. Europe is forecast to import 80 million tons of solid biomass per year by 2020 (Bosch et al. 2015).
Producing large volumes of seaweeds for human food, animal feed and biofuels could represent a transforma-tional change in the global food security equation and in the way we view and use the oceans. In 2012, global production of seaweeds was approximately 3 million tons dry weight, and growing by 9% per annum. Increasing the growth of seaweed farming up to 14% per year would generate 500 million tons dry weight by 2050, adding about 10% to the world’s present supply of food, generating revenues and improving environmental quality (Table 1). Assuming a conserva-tive average productivity from the best operating modern farms of about 1,000 dry metric tons per km2 (1 kg per m2), this entire harvest could be grown in a sea area of about 500,000 square kilometers, 0.03% of
the oceans’ surface area, equivalent to 4.4 percent of the US exclusive economic zone.
BenefitS of Seaweed PRodUCtion
The dry-matter composition of seaweeds ranges from 10–30% protein, with red and green seaweeds typically higher than browns (Kim 2012). Harvest season is an important determinant of composition. The lipid portion is typically 1–5% of dry matter (Kim 2012). Taking an average of 19% protein and 3% lipid (Table 2), 500 million dry tons of seaweed would produce about 150 million tons of algae protein and 15 million tons of algae oil. Based on the amino acid profile and some issues with anti-nutritional factors in both seaweed and soy, algae protein can be thought of as roughly similar in value to soy protein. Algae oils, however, can contain long chain omega-3 fatty acids, which make them more comparable to fish oils in nutritional value. Currently, about 1 million tons of fish oil and 250 million tons of soy meal are produced annually (Pike & Jackson 2010, USDA 2015). Accounting for the different protein levels in soy meal compared to algae protein concentrate, 500 million tons of seaweed would represent about 20% of current soy-protein production. Even more dramatic is the potential for lipid replacement; algae oils could represent a 750% increase over current fish oil production. Given the importance of oils containing long chain omega-3 fatty acids, this could be a significant boost to human health, while eliminating the need for fish oil in aquaculture
Seaweed Aquaculture for Food Security, Income Generation and Environmental Health in
1618458_Seaweed_Aquaculture.indd 1 6/29/16 2:53 PM
Pub
lic D
iscl
osur
e A
utho
rized
Pub
lic D
iscl
osur
e A
utho
rized
Pub
lic D
iscl
osur
e A
utho
rized
Pub
lic D
iscl
osur
e A
utho
rized
and animal feeds. Current price per ton for soy meal is about $550 meaning the protein fraction could be worth about $28 billion. Current price for fish oil is about $1500 per ton, making the seaweed oil component worth about $15 billion. Extrapolating an estimate of one job per 10 dry tons of seaweed results in a potential direct employment of 50 million jobs; a standard seafood industry secondary-employment multiplier of 2:1 suggests 100 million jobs could be created overall, roughly the number currently employed in marine capture fisheries.
Pollution Remediation
In 2014, 124 million tons of nitrogen were used globally as fertilizer, of which about half was not taken up by plants, 15%–30% of which ended up in coastal waters (FAO 2015, Lassaletta et al. 2014, Swaney et al. 2012). This has contributed to 245,000 square kilometers of dead zones globally (Diazi & Rosenberg 2008). Seaweed production could absorb many of these excess nutrients while producing at least 1,000 tons dry weight of marine plants per square kilometer or 245 million tons dry weight if all of the dead zones were farmed at this modest intensity (Zhang et al. 2014, Kim et al. 2014, 2015). Assuming nitrogen content of 3% for dry seaweed (Mišurcová, 2012), it would take up 20 tons of nitrogen per square
kilometer. Reaching a global level of 500 million tons of seaweed production would assimilate 10 million tons of nitrogen from seawater, equaling some 30% of the nitrogen estimated to enter the ocean
Phosphorous is not generally a limiting nutrient in the ocean so it does not cause dead zones or other environmental disruptions. However, it is becoming a more limiting nutrient for use on land over time, due to declines in phosphorous reserves as well as the high energy cost involved in creating phosphate fertilizers. Global production of phosphorous as fertilizer was 48 million tons in 2014 (FAO 2015). At an average of about 0.2% phosphorus in dry seaweed, marine agronomy would sequester 15 million tons of phosphorous or nearly a third of the phosphorous produced in fertilizers. If we could use by-products from seaweed culture for their phosphorous content, it could significantly add to fertilizer output or replace other forms of phosphorous production.
Carbon Sequestration
Increasing atmospheric carbon dioxide is causing ocean acidification with serious consequences for marine life (Ciais et al. 2013). In particular, lower pH alters the availability of shell-forming minerals needed by corals, mollusks and myriad microorganisms
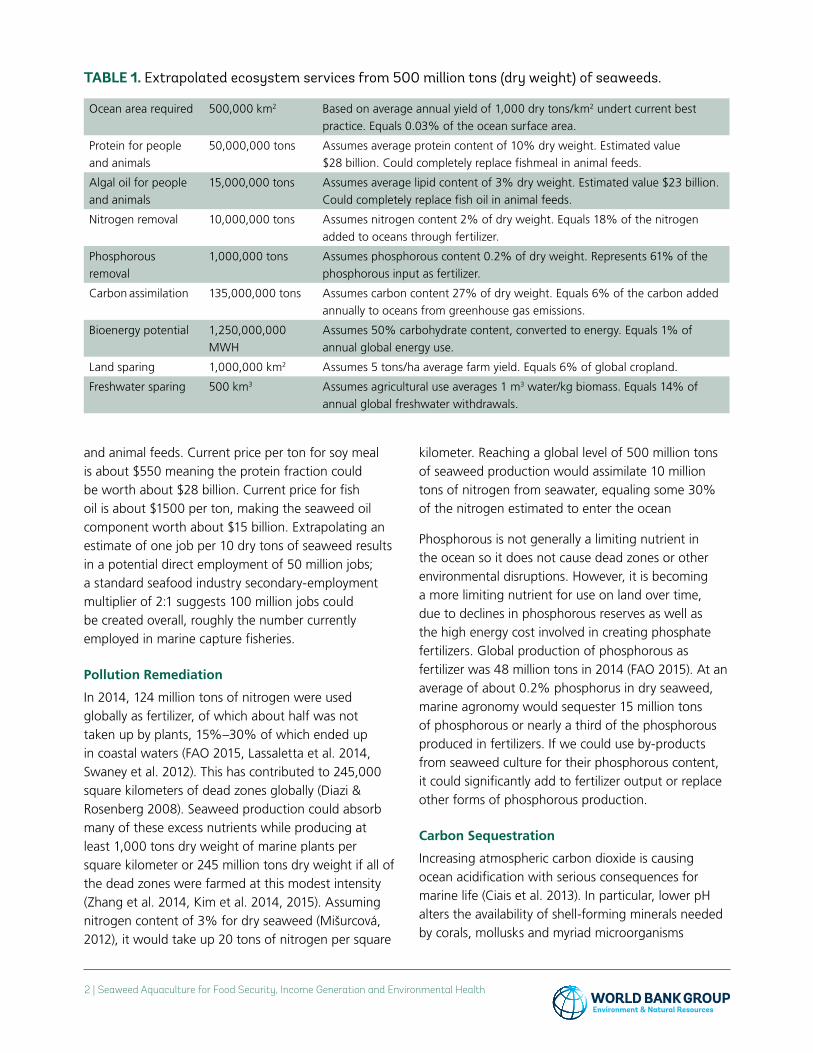
Table 1. Extrapolated ecosystem services from 500 million tons (dry weight) of seaweeds.
Ocean area required 500,000 km2 Based on average annual yield of 1,000 dry tons/km2 undert current best practice. Equals 0.03% of the ocean surface area.
Protein for people and animals
50,000,000 tons Assumes average protein content of 10% dry weight. Estimated value $28 billion. Could completely replace fishmeal in animal feeds.
Algal oil for people and animals
15,000,000 tons Assumes average lipid content of 3% dry weight. Estimated value $23 billion. Could completely replace fish oil in animal feeds.
Nitrogen removal 10,000,000 tons Assumes nitrogen content 2% of dry weight. Equals 18% of the nitrogen added to oceans through fertilizer.
Phosphorous removal
1,000,000 tons Assumes phosphorous content 0.2% of dry weight. Represents 61% of the phosphorous input as fertilizer.
Carbon assimilation 135,000,000 tons Assumes carbon content 27% of dry weight. Equals 6% of the carbon added annually to oceans from greenhouse gas emissions.
Bioenergy potential 1,250,000,000 MWH
Assumes 50% carbohydrate content, converted to energy. Equals 1% of annual global energy use.
Land sparing 1,000,000 km2 Assumes 5 tons/ha average farm yield. Equals 6% of global cropland.
Freshwater sparing 500 km3 Assumes agricultural use averages 1 m3 water/kg biomass. Equals 14% of annual global freshwater withdrawals.
2 | Seaweed Aquaculture for Food Security, Income Generation and Environmental Health
1618458_Seaweed_Aquaculture.indd 2 6/29/16 2:53 PM
Seaweed Aquaculture for Food Security, Income Generation and Environmental Health | 3
(Gatusso & Hansson 2011). Anthropogenic emissions of carbon in 2010 was about 8182 Tg (Boden et al. 2010). Production of 500 million tons of seaweed would absorb 135 million tons of carbon, about 3.2% of the carbon added annually to seawater from greenhouse gas emissions, offering the potential of using carbon credits to improve the profitability of seaweed businesses.
Biofuel
The carbohydrate content of seaweed, about 50% of dry mass, can be used in biofuel production (Garcia-Casal et al. 2007). Capturing the energy in seaweed can be as simple as microbial anaerobic digestion to produce methane or as complex as microbial breakdown of lignins and other complex carbohydrates into simple sugars for use in ethanol production (Wei et al. 2013). An annual harvest of 500 million dry tons of seaweeds with 50% carbohydrate content could produce about 1.25 billion megawatt-hours’ worth of methane or liquid fuel. The world used about 85 billion megawatt-hours of energy from fossil fuels in 2012, so energy production from these seaweed products would equate to roughly 1.5% of current energy use from fossil fuels (IEA 2014). Current biomass prices average about US$50 per dry ton, for a total value of some US$12.5 billion.
Since all of this can be done without using any land or freshwater, the potential for large-scale seaweed farming to supplement our future food supplies while easing the burden we now impose on the land seems clear. However, for this to happen, we must develop markets, processing systems, production systems, and businesses that will utilize the products from seaweed culture. While seaweed production technology is reasonably well established and important steps have been taken to expand the range of products that can be derived from seaweeds, research and development remain necessary throughout all steps in the seaweed value chain for the industry’s full potential to be realized.
ComPoSition and USe of SeaweedS
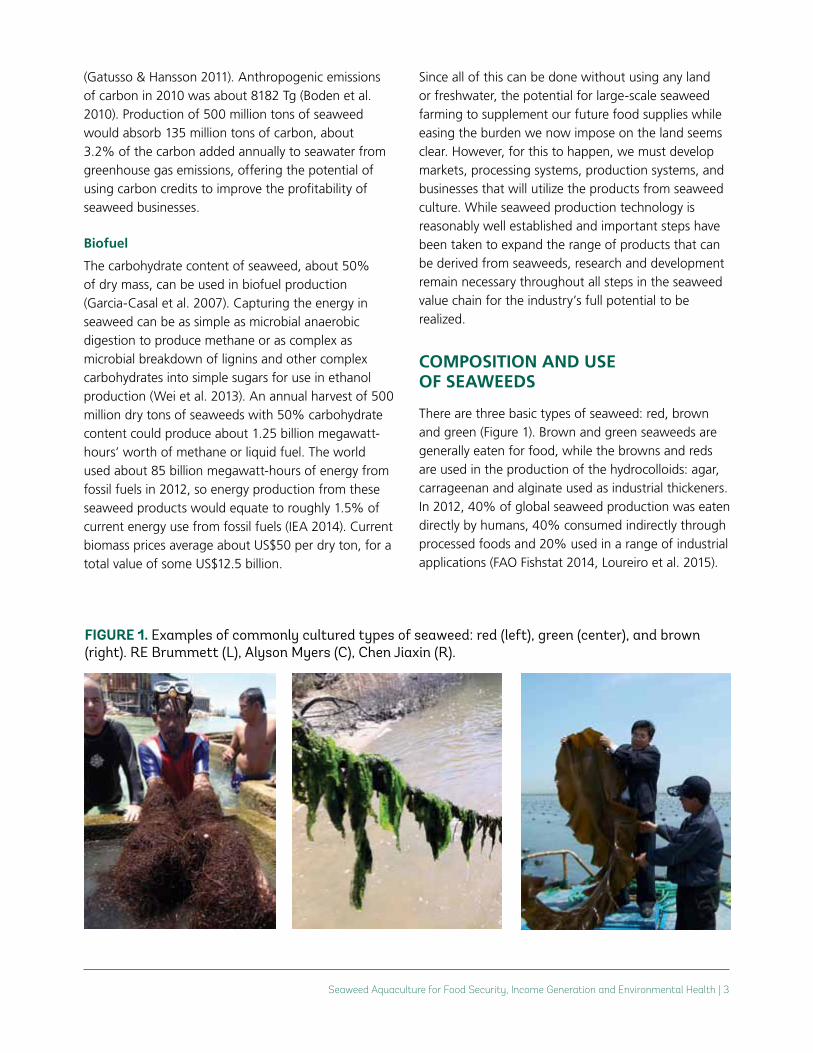
There are three basic types of seaweed: red, brown and green (Figure 1). Brown and green seaweeds are generally eaten for food, while the browns and reds are used in the production of the hydrocolloids: agar, carrageenan and alginate used as industrial thickeners. In 2012, 40% of global seaweed production was eaten directly by humans, 40% consumed indirectly through processed foods and 20% used in a range of industrial applications (FAO Fishstat 2014, Loureiro et al. 2015).
Figure 1. Examples of commonly cultured types of seaweed: red (left), green (center), and brown (right). RE Brummett (L), Alyson Myers (C), Chen Jiaxin (R).
1618458_Seaweed_Aquaculture.indd 3 6/29/16 2:53 PM
Nutritionally, seaweeds are generally low in fat and rich in carbohydrates, minerals, vitamins and essential micronutrients, particularly antioxidents (Radulovich et al. 2015). Nori is high in protein (Table 2).
For animals, seaweeds and seaweed extracts have been used to feed poultry, sheep, cattle, pigs, abalone and shrimp, stimulating food intake and growth, while decreasing the amount and cost of protein, especially fishmeal, in diets. In aquaculture, the major constraint to increased expansion and profitability is the high price and variability of fishmeal supply needed for feeds. An algal source of protein for fish and shrimp diets would create enormous opportunities to reduce pressure on both terrestrial and marine ecosystems.
The use of seaweed and their extracts as fertilizers has been tested in a number of species and has seen some significant growth in recent years. They are used as foliar fertilizers for cereals, vegetables and fruits to increase stress resistance to fungi and insects (Kim, 2012). They also serve as soil structural amendments, increasing water and nutrient retention (Chojnacka 2012, Vijayaraghavan & Joshi 2015)
Seaweeds are extensively used in traditional medicine with recognized antihelminth, antibacterial, antifungal and antiviral properties (El Gamal 2010). Fucoidan, anti-inflammatory extracted from brown seaweed, can prevent muscle necrosis caused by snake venom (Azofeifa et al. 2008). Several compounds isolated from seaweed have shown anti-cancer properties, while others possess antidiabetic, antihypertensive and hepatoprotective properties (Fukahori et al. 2008, Kim 2012).
Collectively known as hydrocolloids, agars, carrageenan and alginates are polysaccharide
carbohydrates that act as the skeleton of seaweeds and can be extracted and used as clear, flavorless thickeners. Carrageenan and agar are extracted from red seaweeds and are major industrial ingredients used for gelling, thickening and stabilizing food, pharmaceuticals, cosmetics, hand and body lotions, shampoo, soap, toothpaste, gel fresheners and many other consumer products (Samaraweera et al. 2011). Alginates, extracted from brown seaweeds, are used by the textile industry as thickeners for the paste containing dye (Babel et al. 2015). In the food and beverage industry, alginate is used in ice creams and sauces (Kim, 2012). It is also used as a separating agent in water-oil emulsions and as a softening agent in baking (Samaraweera et al. 2011). The chemical and pharmaceutical industries utilize alginate and cara-geenan as immobilizing agents for various biocatalysts in commercial synthesis and conversion reactions (Borglum & Marshall 1984, Tønnesen & Karlsen 2002). In the paper industry, alginate is used for surface sizing applications to give a continuous film surface (Bixler & Porse 2010). It also provides an oil-resistant layer that enhances grease repellency (Jost et al. 2014). Other applications of alginate include welding rod coatings (Yin & Lewis, 1981) and binders for fish feed (Duis et al. 1995).
the Seaweed aqUaCUltURe indUStRy
Although wild seaweed beds are harvested in North-ern Europe, Chile and Japan, the majority of seaweeds, 99.4% in 2013, are farmed in Asian coastal waters (Fishstat 2014). Main producing countries in 2011 were China (55%), Indonesia (25%), Philippines (9%), South
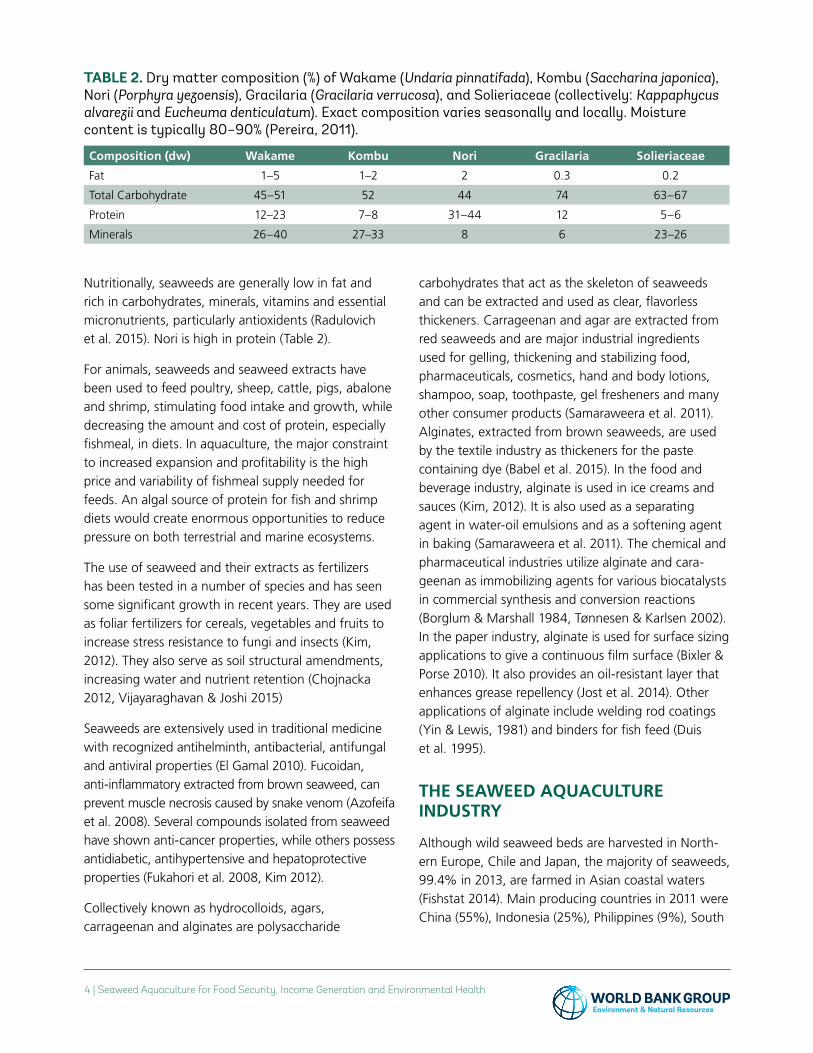
Table 2. Dry matter composition (%) of Wakame (Undaria pinnatifada), Kombu (Saccharina japonica), Nori (Porphyra yezoensis), Gracilaria (Gracilaria verrucosa), and Solieriaceae (collectively: Kappaphycus alvarezii and Eucheuma denticulatum). Exact composition varies seasonally and locally. Moisture content is typically 80–90% (Pereira, 2011).
Composition (dw) wakame Kombu nori Gracilaria Solieriaceae
Fat 1–5 1–2 2 0.3 0.2
Total Carbohydrate 45–51 52 44 74 63–67
Protein 12–23 7–8 31–44 12 5–6
Minerals 26–40 27–33 8 6 23–26
4 | Seaweed Aquaculture for Food Security, Income Generation and Environmental Health
1618458_Seaweed_Aquaculture.indd 4 6/29/16 2:53 PM
Seaweed Aquaculture for Food Security, Income Generation and Environmental Health | 5
Korea (5%), North Korea (2%) and Japan (2%) (FAO Fishstat 2014).
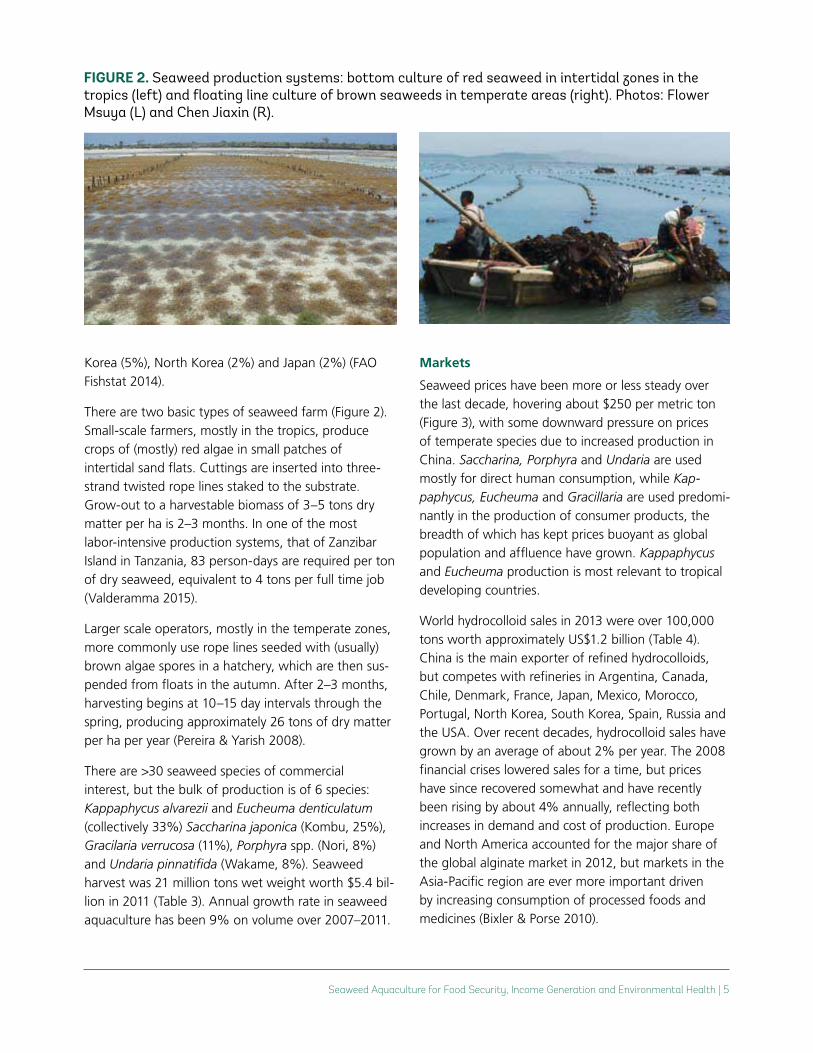
There are two basic types of seaweed farm (Figure 2). Small-scale farmers, mostly in the tropics, produce crops of (mostly) red algae in small patches of intertidal sand flats. Cuttings are inserted into three-strand twisted rope lines staked to the substrate. Grow-out to a harvestable biomass of 3–5 tons dry matter per ha is 2–3 months. In one of the most labor-intensive production systems, that of Zanzibar Island in Tanzania, 83 person-days are required per ton of dry seaweed, equivalent to 4 tons per full time job (Valderamma 2015).
Larger scale operators, mostly in the temperate zones, more commonly use rope lines seeded with (usually) brown algae spores in a hatchery, which are then sus-pended from floats in the autumn. After 2–3 months, harvesting begins at 10–15 day intervals through the spring, producing approximately 26 tons of dry matter per ha per year (Pereira & Yarish 2008).
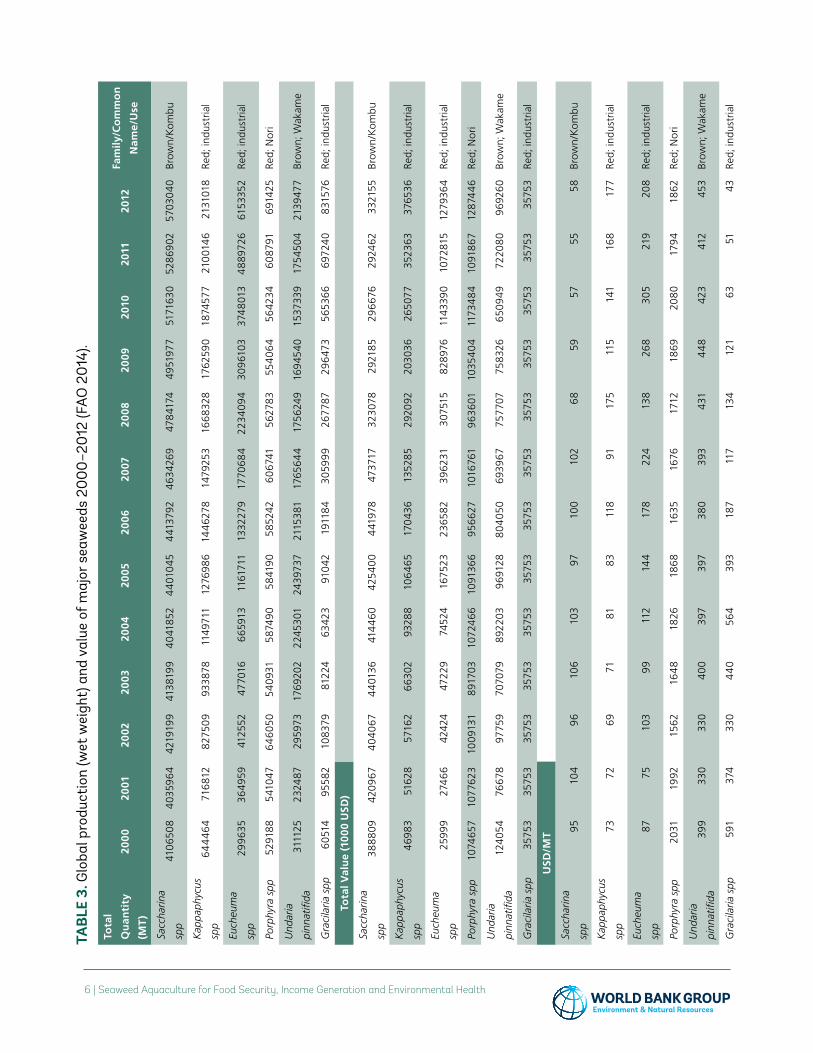
There are >30 seaweed species of commercial interest, but the bulk of production is of 6 species: Kappaphycus alvarezii and Eucheuma denticulatum (collectively 33%) Saccharina japonica (Kombu, 25%), Gracilaria verrucosa (11%), Porphyra spp. (Nori, 8%) and Undaria pinnatifida (Wakame, 8%). Seaweed harvest was 21 million tons wet weight worth $5.4 bil-lion in 2011 (Table 3). Annual growth rate in seaweed aquaculture has been 9% on volume over 2007–2011.
markets
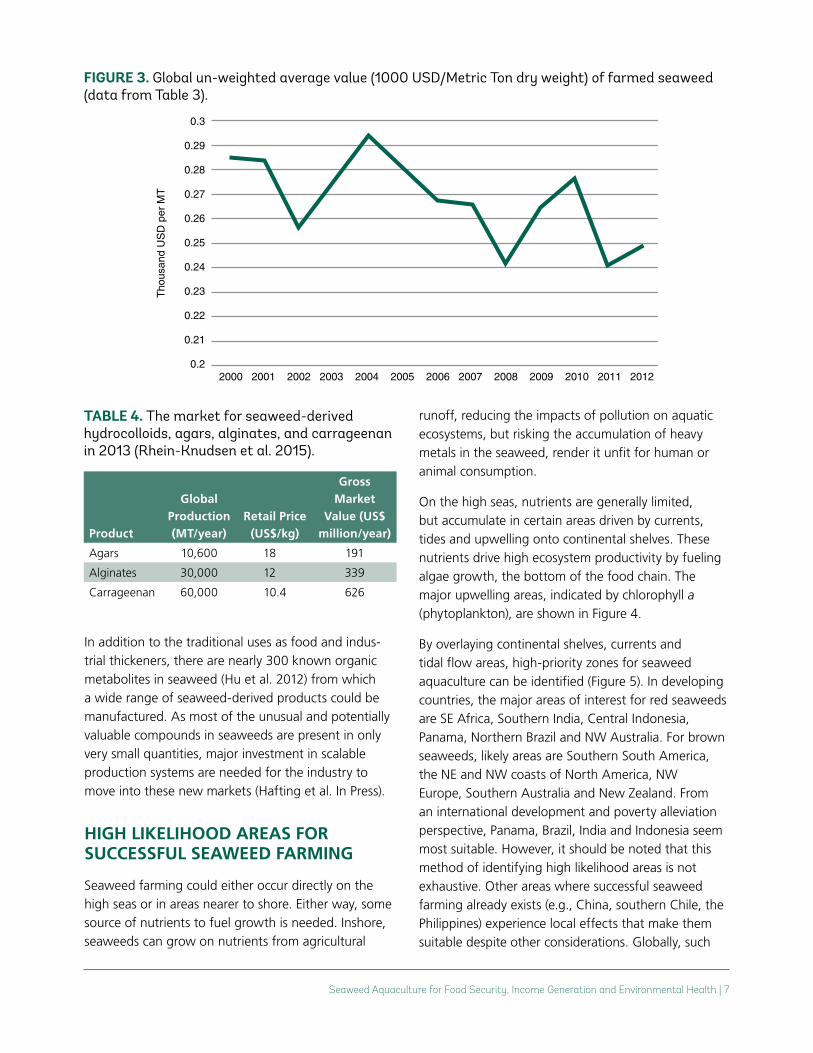
Seaweed prices have been more or less steady over the last decade, hovering about $250 per metric ton (Figure 3), with some downward pressure on prices of temperate species due to increased production in China. Saccharina, Porphyra and Undaria are used mostly for direct human consumption, while Kap-paphycus, Eucheuma and Gracillaria are used predomi-nantly in the production of consumer products, the breadth of which has kept prices buoyant as global population and affluence have grown. Kappaphycus and Eucheuma production is most relevant to tropical developing countries.
World hydrocolloid sales in 2013 were over 100,000 tons worth approximately US$1.2 billion (Table 4). China is the main exporter of refined hydrocolloids, but competes with refineries in Argentina, Canada, Chile, Denmark, France, Japan, Mexico, Morocco, Portugal, North Korea, South Korea, Spain, Russia and the USA. Over recent decades, hydrocolloid sales have grown by an average of about 2% per year. The 2008 financial crises lowered sales for a time, but prices have since recovered somewhat and have recently been rising by about 4% annually, reflecting both increases in demand and cost of production. Europe and North America accounted for the major share of the global alginate market in 2012, but markets in the Asia-Pacific region are ever more important driven by increasing consumption of processed foods and medicines (Bixler & Porse 2010).
Figure 2. Seaweed production systems: bottom culture of red seaweed in intertidal zones in the tropics (left) and floating line culture of brown seaweeds in temperate areas (right). Photos: Flower Msuya (L) and Chen Jiaxin (R).
1618458_Seaweed_Aquaculture.indd 5 6/29/16 2:53 PM
Tabl
e 3.
Glo
bal p
rodu
ctio
n (w
et w
eigh
t) a
nd v
alue
of m
ajor
sea
wee
ds 2
00
0–2
012
(FA
O 2
014
).
tota
l
qu
anti
ty
(mt
)
200
020
0120
0220
0320
0420
0520
0620
0720
0820
0920
1020
1120
12fa
mily
/Co
mm
on
nam
e/U
se
Sacc
harin
a
spp
410
650
84
0359
64
4219
199
4138
199
40
4185
24
401
045
441
3792
463
4269
478
4174
4951
977
5171
630
5286
902
5703
04
0Br
own
/Kom
bu
Kap
paph
ycus
spp
64
44
64
7168
1282
7509
9338
7811
4971
112
7698
614
462
7814
7925
316
6832
817
6259
018
7457
721
001
46
2131
018
Red;
indu
stria
l
Euch
eum
a
spp
2996
3536
4959
4125
5247
7016
6659
1311
6171
113
3227
917
7068
422
3409
430
9610
337
48
013
48
8972
661
5335
2Re
d; in
dust
rial
Porp
hyra
spp
5291
88
541
047
64
6050
54
0931
5874
90
5841
90
5852
4260
6741
5627
8355
40
64
5642
3460
8791
6914
25Re
d; N
ori
Und
aria
pinn
atifi
da31
1125
2324
8729
5973
1769
202
2245
301
2439
737
2115
381
1765
64
417
5624
916
945
40
1537
339
175
450
421
3947
7Br
own;
Wak
ame
Gra
cila
ria s
pp60
514
9558
210
8379
8122
463
423
910
4219
118
430
5999
2677
8729
647
356
5366
6972
40
8315
76Re
d; in
dust
rial
tota
l Val
ue
(10
00
USd
)
Sacc
harin
a
spp
388
809
4209
674
04
067
44
0136
414
460
425
40
04
4197
847
3717
3230
7829
2185
2966
7629
2462
3321
55Br
own
/Kom
bu
Kap
paph
ycus
spp
469
8351
628
5716
266
302
9328
810
64
6517
043
613
5285
2920
9220
3036
2650
7735
2363
3765
36Re
d; in
dust
rial
Euch
eum
a
spp
2599
927
466
4242
447
229
7452
416
7523
2365
8239
6231
3075
1582
8976
1143
390
1072
815
1279
364
Red;
indu
stria
l
Porp
hyra
spp
1074
657
1077
623
1009
131
8917
0310
724
6610
9136
695
6627
1016
761
9636
0110
354
04
1173
48
410
9186
712
874
46
Red;
Nor
i
Und
aria
pinn
atifi
da12
405
476
678
9775
970
7079
8922
0396
9128
80
405
069
3967
7577
0775
8326
6509
4972
208
096
9260
Brow
n; W
akam
e
Gra
cila
ria s
pp35
753
3575
335
753
3575
335
753
3575
335
753
3575
335
753
3575
335
753
3575
335
753
Red;
indu
stria
l
US d
/mt
Sacc
harin
a
spp
9510
496
106
103
9710
010
268
5957
5558
Brow
n/K
ombu
Kap
paph
ycus
spp
7372
6971
8183
118
9117
511
514
116
817
7Re
d; in
dust
rial
Euch
eum
a
spp
8775
103
9911
214
417
822
413
826
830
521
920
8Re
d; in
dust
rial
Porp
hyra
spp
2031
1992
1562
164
818
2618
6816
3516
7617
1218
6920
80
179
418
62Re
d; N
ori
Und
aria
pinn
atifi
da39
933
033
04
00
397
397
380
393
431
44
842
341
245
3Br
own;
Wak
ame
Gra
cila
ria s
pp59
137
433
04
40
564
393
187
117
134
121
6351
43Re
d; in
dust
rial
6 | Seaweed Aquaculture for Food Security, Income Generation and Environmental Health
1618458_Seaweed_Aquaculture.indd 6 6/29/16 2:53 PM
Seaweed Aquaculture for Food Security, Income Generation and Environmental Health | 7
In addition to the traditional uses as food and indus-trial thickeners, there are nearly 300 known organic metabolites in seaweed (Hu et al. 2012) from which a wide range of seaweed-derived products could be manufactured. As most of the unusual and potentially valuable compounds in seaweeds are present in only very small quantities, major investment in scalable production systems are needed for the industry to move into these new markets (Hafting et al. In Press).
hiGh liKelihood aReaS foR SUCCeSSfUl Seaweed faRminG
Seaweed farming could either occur directly on the high seas or in areas nearer to shore. Either way, some source of nutrients to fuel growth is needed. Inshore, seaweeds can grow on nutrients from agricultural
runoff, reducing the impacts of pollution on aquatic ecosystems, but risking the accumulation of heavy metals in the seaweed, render it unfit for human or animal consumption.
On the high seas, nutrients are generally limited, but accumulate in certain areas driven by currents, tides and upwelling onto continental shelves. These nutrients drive high ecosystem productivity by fueling algae growth, the bottom of the food chain. The major upwelling areas, indicated by chlorophyll a (phytoplankton), are shown in Figure 4.
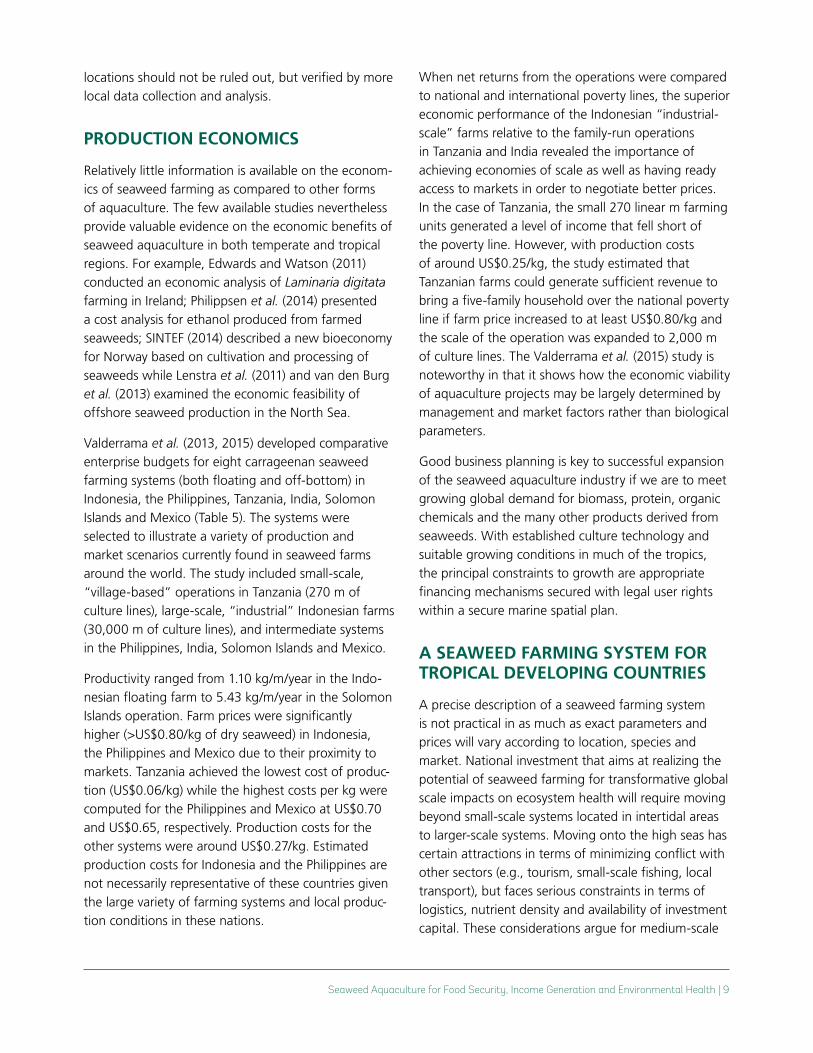
By overlaying continental shelves, currents and tidal flow areas, high-priority zones for seaweed aquaculture can be identified (Figure 5). In developing countries, the major areas of interest for red seaweeds are SE Africa, Southern India, Central Indonesia, Panama, Northern Brazil and NW Australia. For brown seaweeds, likely areas are Southern South America, the NE and NW coasts of North America, NW Europe, Southern Australia and New Zealand. From an international development and poverty alleviation perspective, Panama, Brazil, India and Indonesia seem most suitable. However, it should be noted that this method of identifying high likelihood areas is not exhaustive. Other areas where successful seaweed farming already exists (e.g., China, southern Chile, the Philippines) experience local effects that make them suitable despite other considerations. Globally, such
Table 4. The market for seaweed-derived hydrocolloids, agars, alginates, and carrageenan in 2013 (Rhein-Knudsen et al. 2015).
Product
Global Production (mt/year)
Retail Price (US$/kg)
Gross market
Value (US$ million/year)
Agars 10,600 18 191
Alginates 30,000 12 339
Carrageenan 60,000 10.4 626
Figure 3. Global un-weighted average value (1000 USD/Metric Ton dry weight) of farmed seaweed (data from Table 3).
0.3
0.29
0.28
0.27
0.26
0.25
0.24
0.23
0.22
0.21
0.22000 2001 2002 2003 2004 2005 2006 2007 2008 2009 2010 2011 2012
Tho
usan
d U
SD
per
MT
1618458_Seaweed_Aquaculture.indd 7 6/29/16 2:53 PM
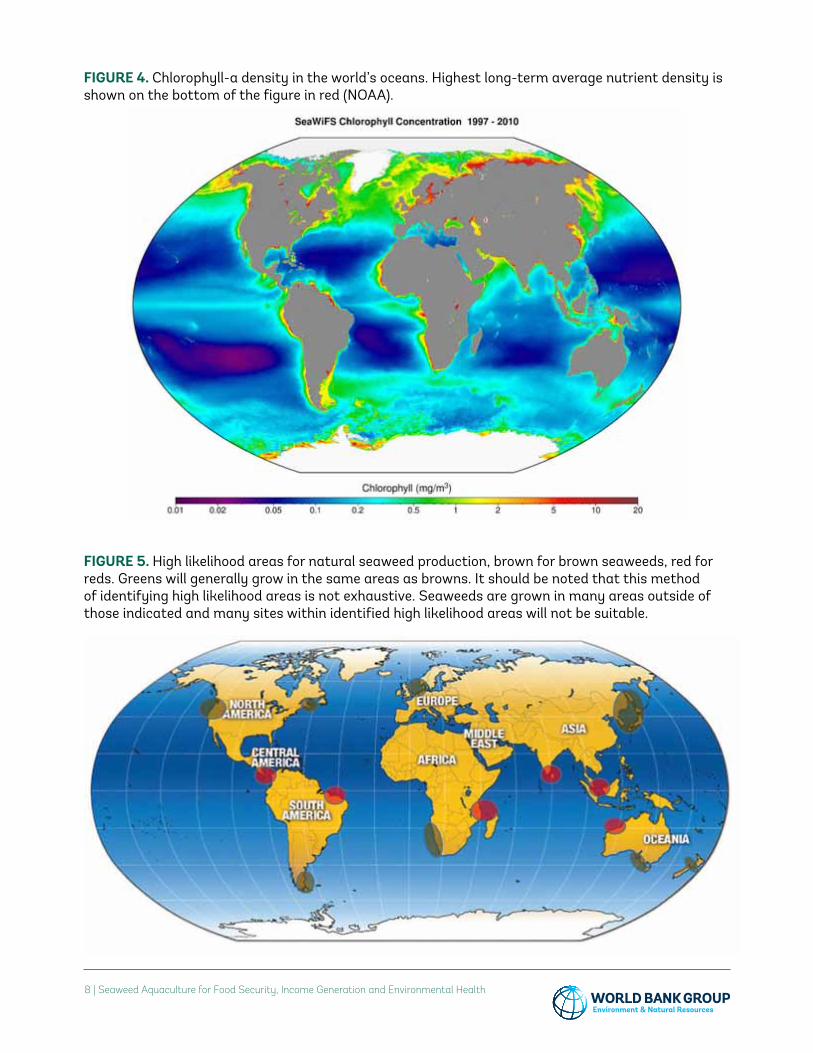
Figure 4. Chlorophyll-a density in the world’s oceans. Highest long-term average nutrient density is shown on the bottom of the figure in red (NOAA).
Figure 5. High likelihood areas for natural seaweed production, brown for brown seaweeds, red for reds. Greens will generally grow in the same areas as browns. It should be noted that this method of identifying high likelihood areas is not exhaustive. Seaweeds are grown in many areas outside of those indicated and many sites within identified high likelihood areas will not be suitable.
8 | Seaweed Aquaculture for Food Security, Income Generation and Environmental Health
1618458_Seaweed_Aquaculture.indd 8 6/29/16 2:53 PM
Seaweed Aquaculture for Food Security, Income Generation and Environmental Health | 9
locations should not be ruled out, but verified by more local data collection and analysis.
PRodUCtion eConomiCS
Relatively little information is available on the econom-ics of seaweed farming as compared to other forms of aquaculture. The few available studies nevertheless provide valuable evidence on the economic benefits of seaweed aquaculture in both temperate and tropical regions. For example, Edwards and Watson (2011) conducted an economic analysis of Laminaria digitata farming in Ireland; Philippsen et al. (2014) presented a cost analysis for ethanol produced from farmed seaweeds; SINTEF (2014) described a new bioeconomy for Norway based on cultivation and processing of seaweeds while Lenstra et al. (2011) and van den Burg et al. (2013) examined the economic feasibility of offshore seaweed production in the North Sea.
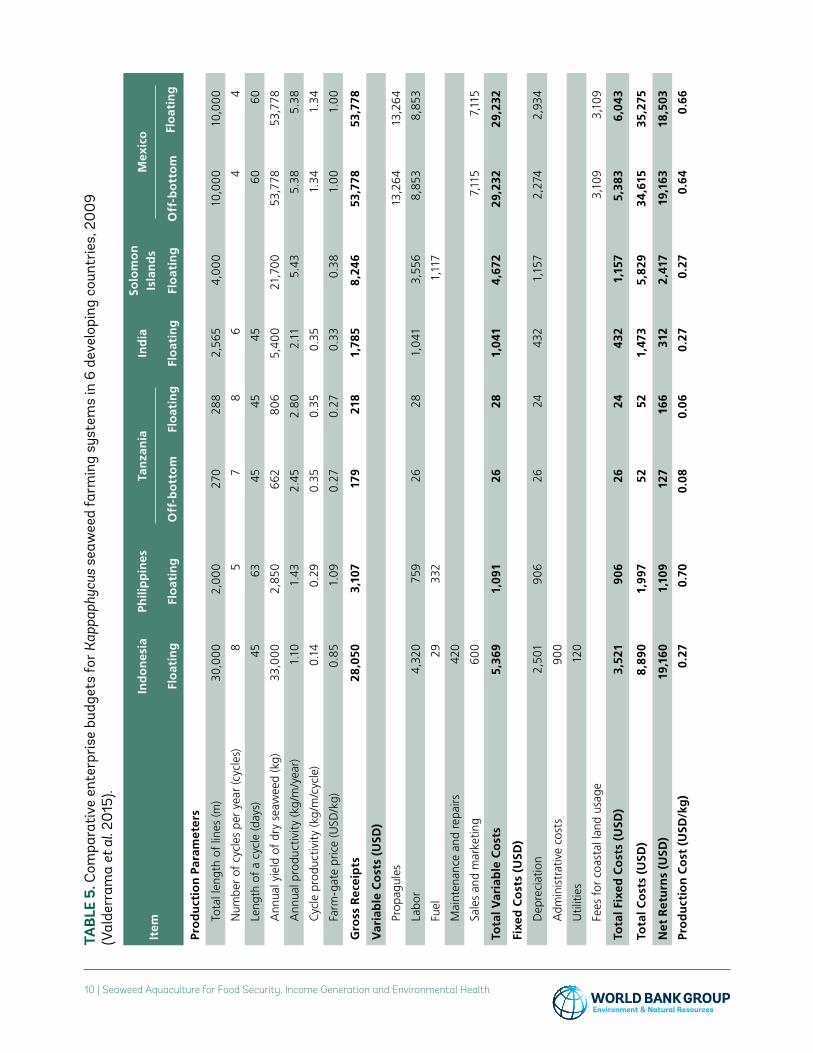
Valderrama et al. (2013, 2015) developed comparative enterprise budgets for eight carrageenan seaweed farming systems (both floating and off-bottom) in Indonesia, the Philippines, Tanzania, India, Solomon Islands and Mexico (Table 5). The systems were selected to illustrate a variety of production and market scenarios currently found in seaweed farms around the world. The study included small-scale, “village-based” operations in Tanzania (270 m of culture lines), large-scale, “industrial” Indonesian farms (30,000 m of culture lines), and intermediate systems in the Philippines, India, Solomon Islands and Mexico.
Productivity ranged from 1.10 kg/m/year in the Indo-nesian floating farm to 5.43 kg/m/year in the Solomon Islands operation. Farm prices were significantly higher (>US$0.80/kg of dry seaweed) in Indonesia, the Philippines and Mexico due to their proximity to markets. Tanzania achieved the lowest cost of produc-tion (US$0.06/kg) while the highest costs per kg were computed for the Philippines and Mexico at US$0.70 and US$0.65, respectively. Production costs for the other systems were around US$0.27/kg. Estimated production costs for Indonesia and the Philippines are not necessarily representative of these countries given the large variety of farming systems and local produc-tion conditions in these nations.
When net returns from the operations were compared to national and international poverty lines, the superior economic performance of the Indonesian “industrial-scale” farms relative to the family-run operations in Tanzania and India revealed the importance of achieving economies of scale as well as having ready access to markets in order to negotiate better prices. In the case of Tanzania, the small 270 linear m farming units generated a level of income that fell short of the poverty line. However, with production costs of around US$0.25/kg, the study estimated that Tanzanian farms could generate sufficient revenue to bring a five-family household over the national poverty line if farm price increased to at least US$0.80/kg and the scale of the operation was expanded to 2,000 m of culture lines. The Valderrama et al. (2015) study is noteworthy in that it shows how the economic viability of aquaculture projects may be largely determined by management and market factors rather than biological parameters.
Good business planning is key to successful expansion of the seaweed aquaculture industry if we are to meet growing global demand for biomass, protein, organic chemicals and the many other products derived from seaweeds. With established culture technology and suitable growing conditions in much of the tropics, the principal constraints to growth are appropriate financing mechanisms secured with legal user rights within a secure marine spatial plan.
a Seaweed faRminG SyStem foR tRoPiCal deVeloPinG CoUntRieS
A precise description of a seaweed farming system is not practical in as much as exact parameters and prices will vary according to location, species and market. National investment that aims at realizing the potential of seaweed farming for transformative global scale impacts on ecosystem health will require moving beyond small-scale systems located in intertidal areas to larger-scale systems. Moving onto the high seas has certain attractions in terms of minimizing conflict with other sectors (e.g., tourism, small-scale fishing, local transport), but faces serious constraints in terms of logistics, nutrient density and availability of investment capital. These considerations argue for medium-scale
1618458_Seaweed_Aquaculture.indd 9 6/29/16 2:53 PM
10 | Seaweed Aquaculture for Food Security, Income Generation and Environmental Health
Tabl
e 5.
Com
para
tive
ent
erpr
ise
budg
ets
for K
appa
phyc
us s
eaw
eed
farm
ing
syst
ems
in 6
dev
elop
ing
coun
trie
s, 2
00
9
(Val
derr
ama
et a
l. 20
15).
item
ind
on
esia
Phili
pp
ines
tan
zan
iain
dia
Solo
mo
n
isla
nd
sm
exic
o
flo
atin
gfl
oat
ing
off
-bo
tto
mfl
oat
ing
flo
atin
gfl
oat
ing
off
-bo
tto
mfl
oat
ing
Pro
du
ctio
n P
aram
eter
s
Tota
l len
gth
of li
nes
(m)
30,0
00
2,0
00
270
288
2,56
54,
00
010
,00
010
,00
0
Num
ber
of c
ycle
s pe
r ye
ar (c
ycle
s)8
57
86
44
Leng
th o
f a
cycl
e (d
ays)
4563
4545
4560
60
Ann
ual y
ield
of
dry
seaw
eed
(kg)
33,0
00
2,85
066
280
65,
400
21,7
00
53,7
7853
,778
Ann
ual p
rodu
ctiv
ity
(kg
/m/y
ear)
1.10
1.43
2.45
2.80
2.11
5.43
5.38
5.38
Cyc
le p
rodu
ctiv
ity
(kg
/m/c
ycle
)0.
140.
290.
350.
350.
351.
341.
34
Farm
-gat
e pr
ice
(USD
/kg)
0.85
1.09
0.27
0.27
0.33
0.38
1.0
01.
00
Gro
ss R
ecei
pts
28,0
503,
107
179
218
1,78
58,
246
53,7
7853
,778
Var
iab
le C
ost
s (U
Sd)
Prop
agul
es13
,26
413
,26
4
Labo
r4,
320
759
2628
1,0
413,
556
8,85
38,
853
Fuel
2933
21,
117
Mai
nten
ance
and
rep
airs
420
Sale
s an
d m
arke
ting
600
7,11
57,
115
tota
l Var
iab
le C
ost
s5,
369
1,09
126
281,
041
4,67
229
,232
29,2
32
fixe
d C
ost
s (U
Sd)
De p
reci
atio
n2,
501
90
626
2443
21,
157
2,27
42,
934
Adm
inis
trat
ive
cost
s9
00
Util
ities
120
Fees
for
coa
stal
land
usa
ge3,
109
3,10
9
tota
l fix
ed C
ost
s (U
Sd)
3,52
190
626
2443
21,
157
5,38
36,
043
tota
l Co
sts
(USd
)8,
890
1,99
752
521,
473
5,82
934
,615
35,2
75
net
Ret
urn
s (U
Sd)
19,1
601,
109
127
166
312
2,41
719
,163
18,5
03
Pro
du
ctio
n C
ost
(U
Sd/k
g)
0.27
0.70
0.08
0.06
0.27
0.27
0.64
0.66
1618458_Seaweed_Aquaculture.indd 10 6/29/16 2:53 PM
Seaweed Aquaculture for Food Security, Income Generation and Environmental Health | 11
floating rope line investments operating in high potential areas somewhat offshore, but likely still in the EEZ.
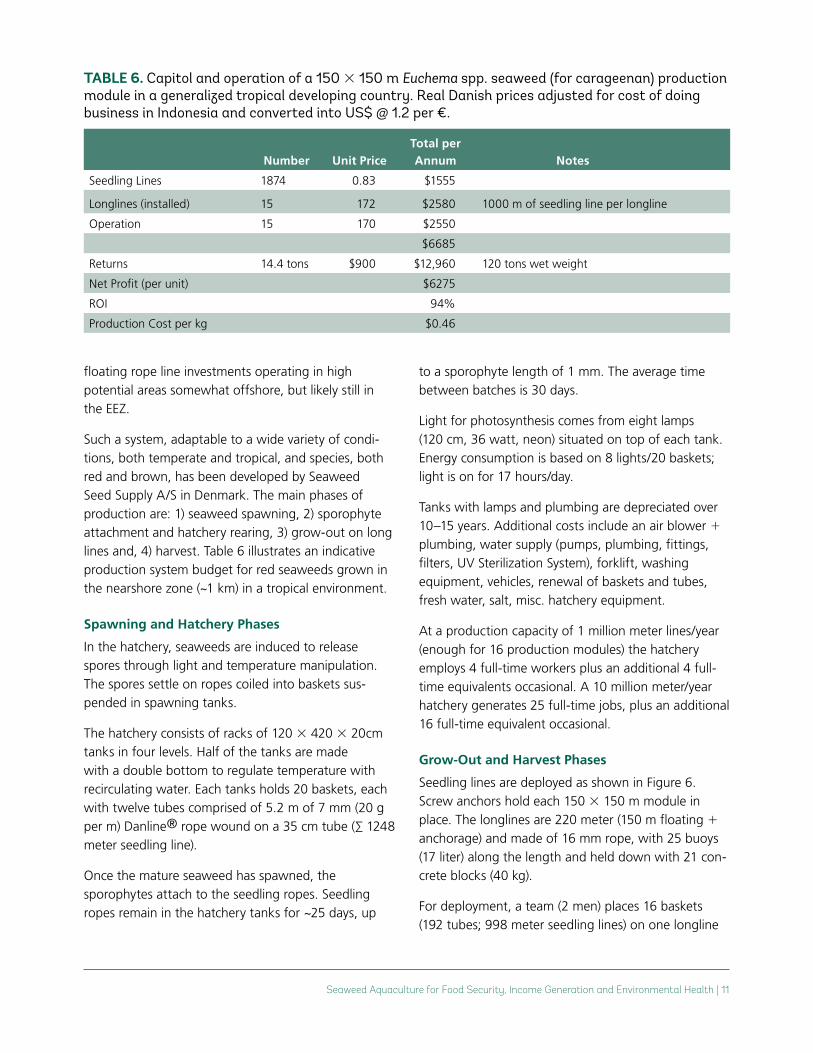
Such a system, adaptable to a wide variety of condi-tions, both temperate and tropical, and species, both red and brown, has been developed by Seaweed Seed Supply A/S in Denmark. The main phases of production are: 1) seaweed spawning, 2) sporophyte attachment and hatchery rearing, 3) grow-out on long lines and, 4) harvest. Table 6 illustrates an indicative production system budget for red seaweeds grown in the nearshore zone (~1 km) in a tropical environment.
Spawning and hatchery Phases
In the hatchery, seaweeds are induced to release spores through light and temperature manipulation. The spores settle on ropes coiled into baskets sus-pended in spawning tanks.
The hatchery consists of racks of 120 3 420 3 20cm tanks in four levels. Half of the tanks are made with a double bottom to regulate temperature with recirculating water. Each tanks holds 20 baskets, each with twelve tubes comprised of 5.2 m of 7 mm (20 g per m) Danline® rope wound on a 35 cm tube (∑ 1248 meter seedling line).
Once the mature seaweed has spawned, the sporophytes attach to the seedling ropes. Seedling ropes remain in the hatchery tanks for ~25 days, up
to a sporophyte length of 1 mm. The average time between batches is 30 days.
Light for photosynthesis comes from eight lamps (120 cm, 36 watt, neon) situated on top of each tank. Energy consumption is based on 8 lights/20 baskets; light is on for 17 hours/day.
Tanks with lamps and plumbing are depreciated over 10–15 years. Additional costs include an air blower 1 plumbing, water supply (pumps, plumbing, fittings, filters, UV Sterilization System), forklift, washing equipment, vehicles, renewal of baskets and tubes, fresh water, salt, misc. hatchery equipment.
At a production capacity of 1 million meter lines/year (enough for 16 production modules) the hatchery employs 4 full-time workers plus an additional 4 full-time equivalents occasional. A 10 million meter/year hatchery generates 25 full-time jobs, plus an additional 16 full-time equivalent occasional.
Grow-out and harvest Phases
Seedling lines are deployed as shown in Figure 6. Screw anchors hold each 150 3 150 m module in place. The longlines are 220 meter (150 m floating 1 anchorage) and made of 16 mm rope, with 25 buoys (17 liter) along the length and held down with 21 con-crete blocks (40 kg).
For deployment, a team (2 men) places 16 baskets (192 tubes; 998 meter seedling lines) on one longline
Table 6. Capitol and operation of a 150 3 150 m Euchema spp. seaweed (for carageenan) production module in a generalized tropical developing country. Real Danish prices adjusted for cost of doing business in Indonesia and converted into US$ @ 1.2 per €.
number Unit Price total per annum notes
Seedling Lines 1874 0.83 $1555
Longlines (installed) 15 172 $2580 1000 m of seedling line per longline
Operation 15 170 $2550
$6685
Returns 14.4 tons $900 $12,960 120 tons wet weight
Net Profit (per unit) $6275
ROI 94%
Production Cost per kg $0.46
1618458_Seaweed_Aquaculture.indd 11 6/29/16 2:53 PM
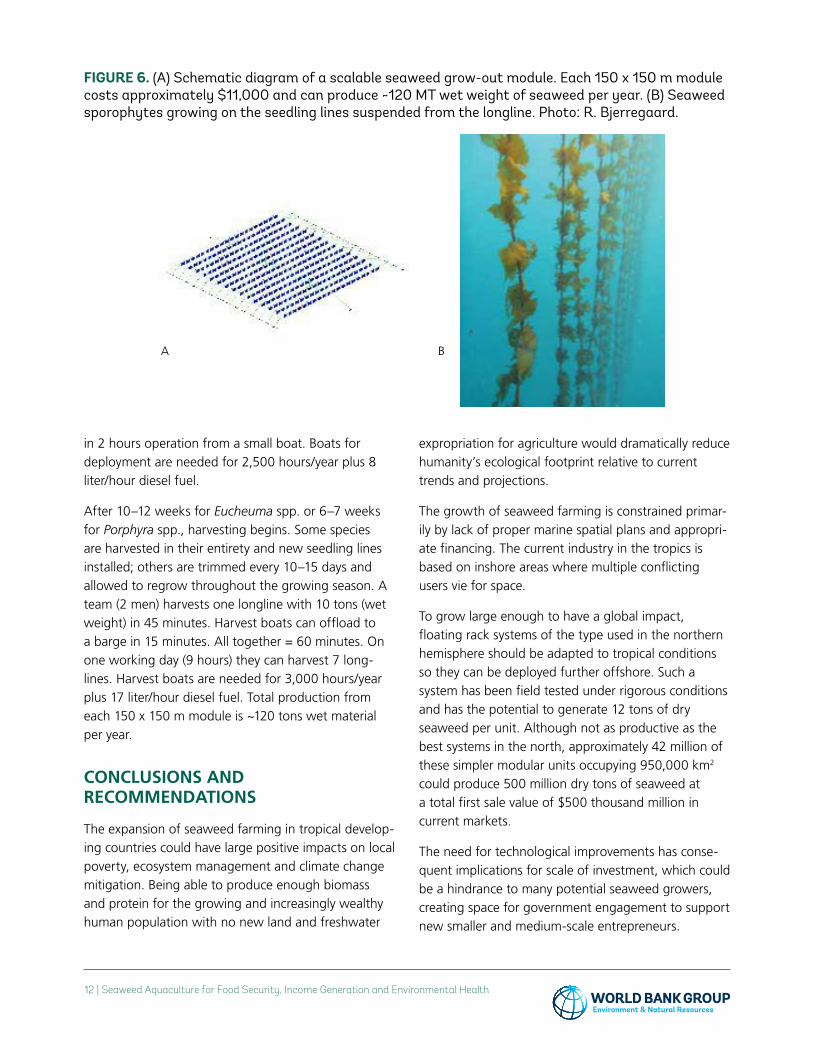
in 2 hours operation from a small boat. Boats for deployment are needed for 2,500 hours/year plus 8 liter/hour diesel fuel.
After 10–12 weeks for Eucheuma spp. or 6–7 weeks for Porphyra spp., harvesting begins. Some species are harvested in their entirety and new seedling lines installed; others are trimmed every 10–15 days and allowed to regrow throughout the growing season. A team (2 men) harvests one longline with 10 tons (wet weight) in 45 minutes. Harvest boats can offload to a barge in 15 minutes. All together = 60 minutes. On one working day (9 hours) they can harvest 7 long-lines. Harvest boats are needed for 3,000 hours/year plus 17 liter/hour diesel fuel. Total production from each 150 x 150 m module is ~120 tons wet material per year.
ConClUSionS and ReCommendationS
The expansion of seaweed farming in tropical develop-ing countries could have large positive impacts on local poverty, ecosystem management and climate change mitigation. Being able to produce enough biomass and protein for the growing and increasingly wealthy human population with no new land and freshwater
expropriation for agriculture would dramatically reduce humanity’s ecological footprint relative to current trends and projections.
The growth of seaweed farming is constrained primar-ily by lack of proper marine spatial plans and appropri-ate financing. The current industry in the tropics is based on inshore areas where multiple conflicting users vie for space.
To grow large enough to have a global impact, floating rack systems of the type used in the northern hemisphere should be adapted to tropical conditions so they can be deployed further offshore. Such a system has been field tested under rigorous conditions and has the potential to generate 12 tons of dry seaweed per unit. Although not as productive as the best systems in the north, approximately 42 million of these simpler modular units occupying 950,000 km2 could produce 500 million dry tons of seaweed at a total first sale value of $500 thousand million in current markets.
The need for technological improvements has conse-quent implications for scale of investment, which could be a hindrance to many potential seaweed growers, creating space for government engagement to support new smaller and medium-scale entrepreneurs.
Figure 6. (A) Schematic diagram of a scalable seaweed grow-out module. Each 150 x 150 m module costs approximately $11,000 and can produce ~120 MT wet weight of seaweed per year. (B) Seaweed sporophytes growing on the seedling lines suspended from the longline. Photo: R. Bjerregaard.
A B
12 | Seaweed Aquaculture for Food Security, Income Generation and Environmental Health
1618458_Seaweed_Aquaculture.indd 12 6/29/16 2:53 PM
Seaweed Aquaculture for Food Security, Income Generation and Environmental Health | 13
Other opportunities for engagement by governments and international agencies committed to sustainable development include investments in transport infra-structure, storage facilities, food preparation
and/or hydrocolloid extraction plants, applied research in solar drying and biogas technology inter alia, technical training and marine spatial planning.
ContRiBUtoRS
Rasmus Bjerregaard, Seaweed Seed Supply A/S (Denmark)
Diego Valderrama, University of Florida
Neil Sims, Kampachi Farms, Ltd. (USA)
Ricardo Radulovich, University of Costa Rica
James Diana, University of Michigan
Mark Capron, Ocean Forests, Inc. (USA)
John Forster, Forster Consulting, Inc. (USA)
Clifford Goudey, C.A. Goudey & Associates, Inc. (USA)
Charles Yarish, University of Connecticut
Kevin Hopkins, University of Hawaii
Michael Rust, NOAA Fisheries
Cedric McKinnie, World Bank
Thanks to Stefan Kraan, Ocean Harvest Technology; Prof Rene Wijffels, Wageningen University, the Netherlands and Jens Legarth, Fermentation Experts Inc. for valuable technical insights and to Richard P. Stumpf, NOAA National Centers for Coastal Ocean Science and Norman Kuring at NASA for help with chlorophyll a mapping.
more information:
Randall Brummett, World Bank, [email protected]
Steffen Hansen, Global Environment Facility, [email protected]
1618458_Seaweed_Aquaculture.indd 13 6/29/16 2:53 PM
RefeRenCeS
Azofeifa, K., Y. Angulo & B. Lomonte. 2008. Ability of fucoidan to prevent muscle necrosis induced by snake venom myotoxins: com-parison of high- and low-molecular weight fractions. Toxicon 51(3): 373–380.
Babel, S., S. Sharma & R. Rajvanshi. 2015. Block printing with reactive dye using sodium alginate. Man-Made Textiles in India 43(6): 220–222.
Bixler, H. J. & H. Porse. 2010. A decade of change in the seaweed hydrocolloids industry. Journal of Applied Phycology: DOI 10.1007/s10811-010-9529-3.
Boden, T. A., G. Marland, and R. J. Andres (2010). Global, Regional, and National Fossil-Fuel CO2 Emissions. Carbon Dioxide Information Analy-sis Center, Oak Ridge National Laboratory, U.S. Department of Energy, Oak Ridge, Tenn., U.S.A. doi 10.3334/CDIAC/00001_V2010.
Borglum, G. B., & Marshall, J. J. (1984). The potential of immobilized biocatalysts for production of industrial chemicals. Applied biochemistry and biotechnology, 9(1), 117–130.
Bosch, R., M. van d Pol & J. Philp. 2015. Define biomass sustainability. Nature 523:526–527.
Chojnacka, K. (2012). Using the biomass of seaweeds in the Production of Components of Feed and Fertilizers. In S-K Kim (ed) Hand-book of Marine Macroalgae: Biotechnology and Applied Phycology, pp 478–490.
Ciais, P., C. Sabine, G. Bala, L. Bopp, V. Brovkin, J. Canadell, A. Chhabra, R. DeFries, J. Gal-loway, M. Heimann, C. Jones, C. Le Quéré, R.B. Myneni, S. Piao and P. Thornton, 2013: Carbon and Other Biogeochemical Cycles. In Climate Change 2013: The Physical Science Basis. Contribution of Working Group I to the Fifth Assessment Report of the Intergov-ernmental Panel on Climate Change [Stocker, T. F., D. Qin, G.-K. Plattner, M. Tignor, S. K. Allen, J. Boschung, A. Nauels, Y. Xia, V. Bex and P. M. Midgley (eds.)]. Cambridge
University Press, Cambridge, United Kingdom and New York, NY, USA.
Diaz, R. J. & R. Rosenberg. 2008. Spreading dead zones and consequences for marine ecosys-tems. Science 321: 926–929.
Duis, K., Inglis, V., Beveridge, M. C. M., & Ham-mer, C. (1995). Leaching of four different antibacterials from oil‐ and alginate‐coated fish‐feed pellets. Aquaculture Research, 26(8), 549–556.
Edwards, M. and Watson, L., 2011. Cultivating Laminaria digitata. Irish Sea Fisheries Board, Ireland.
El Gamal, A. A. (2010). Biological importance of marine algae. Saudi Pharmaceutical Jour-nal, 18(1), 1–25.
FAO (2014). The State of World Fisheries and Aquaculture. Food and Agriculture Organiza-tion of the United Nations, Rome.
FAO (2015). World Fertilizer Trends and Outlook to 2018. Food and Agriculture Organization of the United Nations, Rome.
FAO FishStat. (2014). Electronic fisheries database. Food and Agriculture Organization of the United Nations, Rome.
FAOSTAT (2015). Food and Agriculture Organiza-tion of the United Nations Statistics Division. Rome.
Fukahori, S., Yano, H., Akiba, J., Ogasawara, S., Momosaki, S., Sanada, S., & Kojiro, M. (2008). Fucoidan, a major component of brown seaweed, prohibits the growth of human cancer cell lines in vitro. Molecular medicine reports, 1(4), 537–542.
García-Casal, M. N., Pereira, A. C., Leets, I., Ramírez, J., & Quiroga, M. F. (2007). High iron content and bioavailability in humans from four species of marine algae. The Journal of Nutrition, 137(12), 2691–2695.
Gattuso, J. P., & Hansson, L. (2011). Ocean acidification: background and history. Ocean acidification, 1–20.
14 | Seaweed Aquaculture for Food Security, Income Generation and Environmental Health
1618458_Seaweed_Aquaculture.indd 14 6/29/16 2:53 PM
Seaweed Aquaculture for Food Security, Income Generation and Environmental Health | 15
Hu, J., Yang, B., Lin, X., Zhou, X. F., Yang, X. W., & Liu, Y. (2012). Bioactive metabolites from seaweeds. Handbook of Marine Macroalgae: Biotechnology and Applied Phycology, 262–284.
IEA, 2014. Key World Energy Statistics 2014. International Energy Agency, Paris.
Jost, V., Kobsik, K., Schmid, M., & Noller, K. (2014). Influence of plasticiser on the barrier, mechanical and grease resistance properties of alginate cast films. Carbohydrate poly-mers, 110, 309–319.
Kim, Se-Kwon (Ed). (2012). Handbook of Marine Macroalgae: Biotechnology and Applied Phycology. Hoboken, NJ: John Wiley & Sons.
Kim, J. K., G. P. Kraemer and C. Yarish. 2014. Field scale evaluation of seaweed aquaculture as a nutrient bioextraction strategy in Long Island Sound and the Bronx River Estuary. Aquacul-ture 433:148–156.
Kim, J. K., S. Kottuparambilm S. H. Moh, T. K. Lee, Y. Kim, J. Rhee, E. Choi, B. H. Kim, Y. J. Yu, C. Yarish and T. Han. 2015. Potential applications of nuisance microalgae blooms. J. Appl. Phycol. 27:1223–1234.
Lassaletta, L., Billen, G., Grizzetti, B., Anglade, J., & Garnier, J. (2014). 50 year trends in nitrogen use efficiency of world cropping systems: the relationship between yield and nitrogen input to cropland. Environmental Research Letters, 9(10), 105011.
Lenstra, J., van Hal, J. and Reith, H., 2011. Economic aspects of open ocean seaweed production. Energy Research Centre of the Netherlands, Petten, the Netherlands.
Loureiro, R., CMM Gachon & C. Rebours. 2015. Seaweed cultivation: potential and challenges of crop domestication at an unprecedented pace. New Phytologist, www.newphytologist .com.
Mišurcová, L. 2012. Chemical composition of seaweeds, pp. 173–192, in: Se-Kwon Kim.
Handbook of Marine Macroalgae. Wiley-Blackwell, West Sussex, UK.
Pereira, L. (2011). A Review of the Nutrient Composition of Selected Edible Seaweeds. In Seaweed: Ecology, Nutrient Composition and Medicinal Uses. Pomin, V. H. (Ed.). Nova Science Publishers: Hauppauge, pp. 15–50.
Pereira, R. & C. Yarish. 2008. Mass production of Marine Macroalgae. In Sven Erik Jørgensen and Brian D. Fath (Editor-in-Chief), Ecological Engineering. Vol. [3] of Encyclopedia of Ecol-ogy, 5 vols. pp. 2236–2247. Oxford: Elsevier.
Philippsen, A., Wild, P. and Rowe, A., 2014. Energy input, carbon intensity and cost for ethanol produced from farmed seaweed. Renewable and Sustainable Energy Reviews 38, 609–623.
Pike, I. H. & A. Jackson. 2010. Fish oil: production and use now and in the future. Lipid Technol-ogy 22(3):59–61.
Radulovich, R., Neori, A., Valderrama, D., Reddy, C. R. K., Cronin, H. & Forster, J. (2015). Farming of Seaweeds. In B. Tiwari and D. Troy (Eds.) Seaweed Sustainability—Food and Non- Food Applications (pp. 27–60). Amsterdam: Elsevier.
Radulovich, R., Umanzor, S., Cabrera, R., & Mata, R. (2015). Tropical seaweeds for human food, their cultivation and its effect on biodi-versity enrichment. Aquaculture, 436, 40–46.
Rhein-Knudsen, N., Ale, M. T., & Meyer, A. S. (2015). Seaweed Hydrocolloid Production: An Update on Enzyme Assisted Extraction and Modification Technologies. Marine Drugs, 13(6), 3340–3359.
Samaraweera, A. M., Vidanarachchi, J. K., & Kurukulasuriya, M. S. (2011). Industrial applica-tions of macroalgae. Handbook of Marine Macroalgae: Biotechnology and Applied Phycology, 500–521.
SINTEF, 2014. A New Norwegian Bioeconomy Based on Cultivation and Processing of
1618458_Seaweed_Aquaculture.indd 15 6/29/16 2:53 PM
Seaweeds: Opportunities and Research and Development Needs. SINTEF Fisheries and Aquaculture, Norway.
Swaney, D. P., Hong, B., Ti, C., Howarth, R. W., & Humborg, C. (2012). Net anthropogenic nitrogen inputs to watersheds and riverine N export to coastal waters: a brief over-view. Current Opinion in Environmental Sustainability, 4(2), 203–211.
Tønnesen, H. H., & Karlsen, J. (2002). Alginate in drug delivery systems. Drug development and industrial pharmacy, 28(6), 621–630.
USDA. 2015. World agricultural supply and demand estimates. WASDE 546. http://www .usda.gov/oce/commodity/wasde/latest.pdf.
Valderrama, D., Cai, J., Hishamunda, N. and Ridler, N., 2013. Social and economic dimen-sions of carrageenan seaweed farming. Fisheries and Aquaculture Technical Paper 580. FAO, Rome.
Valderrama, D., Cai, J., Hishamunda, N., Reidler, N., Neish, I. C., Hurtado, A. Q., Msuya, F. E., Krishnan, M., Narayanakumar, R., Kronen, M., Robledo, D., Gasca-Leyva, E. and Fraga, J., 2015. The economics of Kap-paphycus seaweed cultivation in developing countries: a comparative analysis of farming
systems. Aquaculture Economics and Man-agement 19, 251–277.
Van den Burg, S., Bikker, P., van Krimpen M. and van Duijn, A.-P., 2013. Economic feasibility of offshore seaweed production in the North Sea. Presentation at the 2013 Aquaculture Europe Conference. Trondheim, Norway. Available at http://www.slideshare.net/svdburg/economic-feasibility-of-offshore-seaweed-production-in-the-north-sea.
Vijayaraghavan, K., & Joshi, U. M. (2015). Applica-tion of seaweed as substrate additive in green roofs: Enhancement of water retention and sorption capacity. Landscape and Urban Planning, 143, 25–32.
Wei, N., Quarterman, J., & Jin, Y. S. (2013). Marine macroalgae: an untapped resource for producing fuels and chemicals. Trends in biotechnology, 31(2), 70–77.
Yin, R. I., & Lewis, J. G. (1981). U.S. Patent No. 4,257,816. Washington, DC: U.S. Patent and Trademark Office.
Zhang, J., Y. Huo, H. Wu, K. Yu, J. K. Kim, C. Yar-ish, Y. Qin, C. Liu, R. Xu and P. He. 2014. The origin of the Ulva macroalgal blooms in the Yellow Sea in 2013. Marine Pollution Bulletin 89 (1–2): 276–283.
16 | Seaweed Aquaculture for Food Security, Income Generation and Environmental Health
1618458_Seaweed_Aquaculture.indd 16 6/29/16 2:53 PM