Embed Size (px)
Citation preview

Section 2:Income Sources

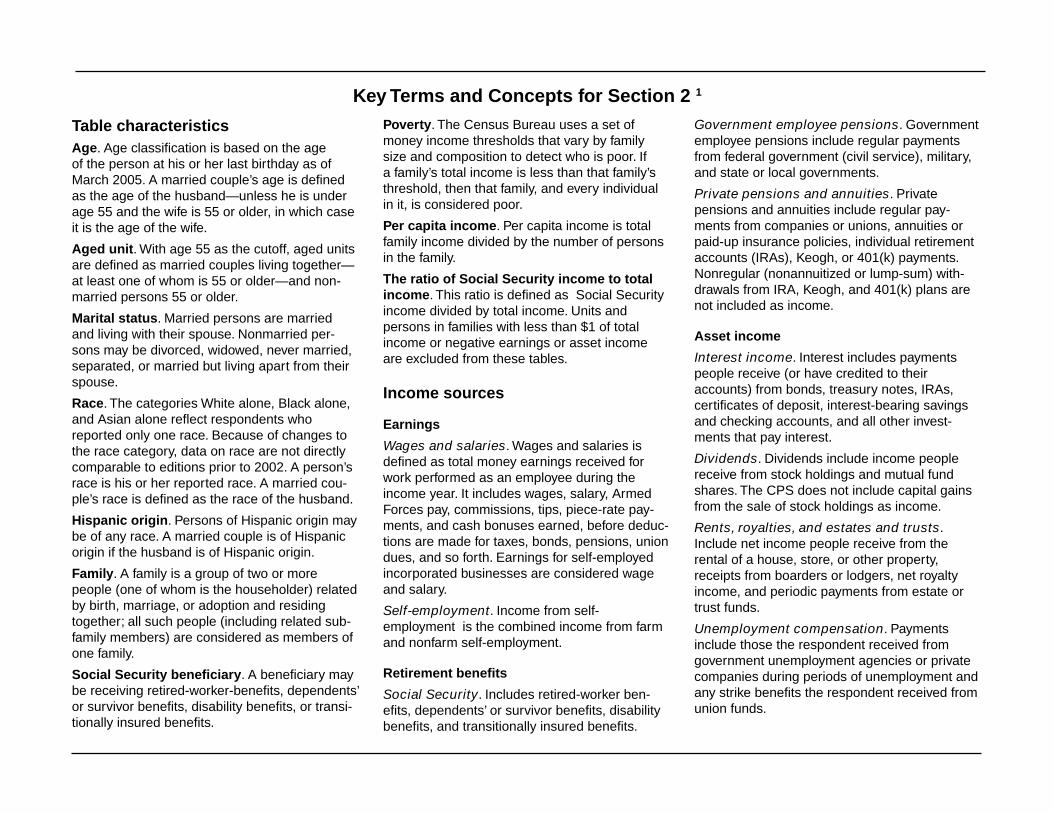
Key Terms and Concepts for Section 2 1
Table characteristicsAge. Age classification is based on the age of the person at his or her last birthday as of March 2005. A married couple’s age is defined as the age of the husband—unless he is under age 55 and the wife is 55 or older, in which case it is the age of the wife.
Aged unit. With age 55 as the cutoff, aged units are defined as married couples living together—at least one of whom is 55 or older—and non‑married persons 55 or older.
Marital status. Married persons are married and living with their spouse. Nonmarried per‑sons may be divorced, widowed, never married, separated, or married but living apart from their spouse.
Race. The categories White alone, Black alone, and Asian alone reflect respondents who reported only one race. Because of changes to the race category, data on race are not directly comparable to editions prior to 2002. A person’s race is his or her reported race. A married cou‑ple’s race is defined as the race of the husband.
Hispanic origin. Persons of Hispanic origin may be of any race. A married couple is of Hispanic origin if the husband is of Hispanic origin.
Family. A family is a group of two or more people (one of whom is the householder) related by birth, marriage, or adoption and residing together; all such people (including related sub‑family members) are considered as members of one family.
Social Security beneficiary. A beneficiary may be receiving retired‑worker‑benefits, dependents’ or survivor benefits, disability benefits, or transi‑tionally insured benefits.
Poverty. The Census Bureau uses a set of money income thresholds that vary by family size and composition to detect who is poor. If a family’s total income is less than that family’s threshold, then that family, and every individual in it, is considered poor.
Per capita income. Per capita income is total family income divided by the number of persons in the family.
The ratio of Social Security income to total income. This ratio is defined as Social Security income divided by total income. Units and persons in families with less than $1 of total income or negative earnings or asset income are excluded from these tables.
Income sources
Earnings
Wages and salaries. Wages and salaries is defined as total money earnings received for work performed as an employee during the income year. It includes wages, salary, Armed Forces pay, commissions, tips, piece‑rate pay‑ments, and cash bonuses earned, before deduc‑tions are made for taxes, bonds, pensions, union dues, and so forth. Earnings for self‑employed incorporated businesses are considered wage and salary.
Self-employment. Income from self‑ employment is the combined income from farm and nonfarm self‑employment.
Retirement benefits
Social Security. Includes retired‑worker ben‑efits, dependents’ or survivor benefits, disability benefits, and transitionally insured benefits.
Government employee pensions. Government employee pensions include regular payments from federal government (civil service), military, and state or local governments.
Private pensions and annuities. Private pensions and annuities include regular pay‑ments from companies or unions, annuities or paid‑up insurance policies, individual retirement accounts (IRAs), Keogh, or 401(k) payments. Nonregular (nonannuitized or lump‑sum) with‑drawals from IRA, Keogh, and 401(k) plans are not included as income.
Asset income
Interest income. Interest includes payments people receive (or have credited to their accounts) from bonds, treasury notes, IRAs, certificates of deposit, interest‑bearing savings and checking accounts, and all other invest‑ments that pay interest.
Dividends. Dividends include income people receive from stock holdings and mutual fund shares. The CPS does not include capital gains from the sale of stock holdings as income.
Rents, royalties, and estates and trusts. Include net income people receive from the rental of a house, store, or other property, receipts from boarders or lodgers, net royalty income, and periodic payments from estate or trust funds.
Unemployment compensation. Payments include those the respondent received from government unemployment agencies or private companies during periods of unemployment and any strike benefits the respondent received from union funds.
30 • Income of the Population 55 or Older, 2004 (Expanded Edition)
Workers’ compensation. Payment includes those received periodically from public or pri‑vate insurance companies for injuries received at work Veterans’ payments. Include payments disabled members of the Armed Forces or survivors of deceased veterans receive periodi‑cally from the Department of Veterans Affairs for education, on‑the‑job training, and means‑tested assistance.
Public Assistance—Cash benefits
Supplemental Security Income. Supplemen‑tal Security Income includes payments made by federal, State, and local welfare agencies to low‑income persons who are aged (65 or older), blind, or disabled, and who have limited income and financial resources.
Other Public Assistance. Public assistance or welfare payments include public assistance pay‑ments such as Aid to Families with Dependent Children (now Temporary Aid to Needy Families) and general assistance.
Public Assistance—Noncash Benefits
Noncash benefits. Include food stamps, energy assistance, and housing assistance. Receipt of noncash benefits is only reported in the section on the sources of income received. No dollar values are assigned to the noncash benefits in this publication, and they are not included in total money income. A person or aged unit is indicated as having received a noncash benefit if any person in the household received food, energy, or housing assistance.
Food. In this publication, food noncash benefits are comprised solely of food stamps.
Energy. The Low‑Income Home Energy Assis‑tance Program provides financial assistance to qualified households to help them pay heating costs.
Housing. There are some programs through which housing assistance is provided to low‑income families and individuals living in public or privately owned dwellings. Two of the more com‑mon types of programs in which federal, State, and local funds are used to subsidize private sector housing are rent supplement and interest reduction plans.
1 For more information, consult the Glossary at the front of this publication.
Income of the Population 55 or Older, 2004 (Expanded Edition) • 31
Total 65–69 70–74 75–79 80 or older
81.3 64.5 23.5 44.4 28.3 16.4 6.776.4 59.7 20.6 40.1 24.2 13.8 5.512.4 10.6 4.6 7.9 6.0 3.3 1.725.6 57.9 91.7 86.9 92.4 93.4 94.312.8 46.4 89.1 83.8 89.9 91.1 91.716.1 29.4 41.1 39.0 42.2 43.2 40.67.0 11.7 14.2 14.5 14.7 15.0 13.10.1 0.6 0.8 0.5 0.8 1.0 0.96.9 11.1 13.5 14.1 13.9 14.1 12.3
Military 1.3 2.1 1.7 2.3 1.7 1.4 1.3Federal 1.5 3.0 4.4 4.0 4.5 4.4 4.7State or local 4.3 6.4 8.2 8.4 8.5 8.9 7.3
9.8 19.3 29.2 26.7 30.4 30.5 29.658.0 58.7 55.1 56.7 56.9 53.7 53.354.8 55.3 51.6 53.3 53.4 50.2 49.629.6 31.1 25.3 26.7 27.6 24.8 22.725.2 25.9 20.1 21.6 22.0 19.6 17.89.2 10.7 8.7 9.1 9.6 8.2 8.00.3 0.2 0.4 0.3 0.4 0.2 0.53.7 2.4 4.2 3.3 4.2 4.1 5.04.9 3.4 0.8 2.0 0.6 0.4 0.21.6 1.3 0.4 0.7 0.6 0.2 0.19.4 10.0 11.8 11.9 12.4 10.9 11.94.8 4.9 4.4 5.1 4.8 3.6 4.04.4 4.6 4.2 5.0 4.3 3.5 3.90.7 0.4 0.2 0.1 0.5 0.1 0.26.9 7.8 9.8 9.5 10.2 9.3 10.04.5 4.8 4.3 4.8 5.0 3.9 3.61.7 2.3 2.9 2.7 2.8 2.8 3.12.8 3.2 4.8 4.3 5.0 4.9 5.22.1 1.3 0.9 1.2 0.8 0.6 0.9
15,772 4,990 26,865 7,078 5,999 5,827 7,960
Wages and salariesEarnings
Number (thousands)
Benefits other than Social SecuritySocial Security
Retirement benefitsSelf-employment
Private pensions or annuities
Government employee pensionsRailroad Retirement
Other public pensions
DividendsOther income from assetsInterest
Income from assets
Unemployment compensationVeterans' benefits
Estates or trustsRent or royalties
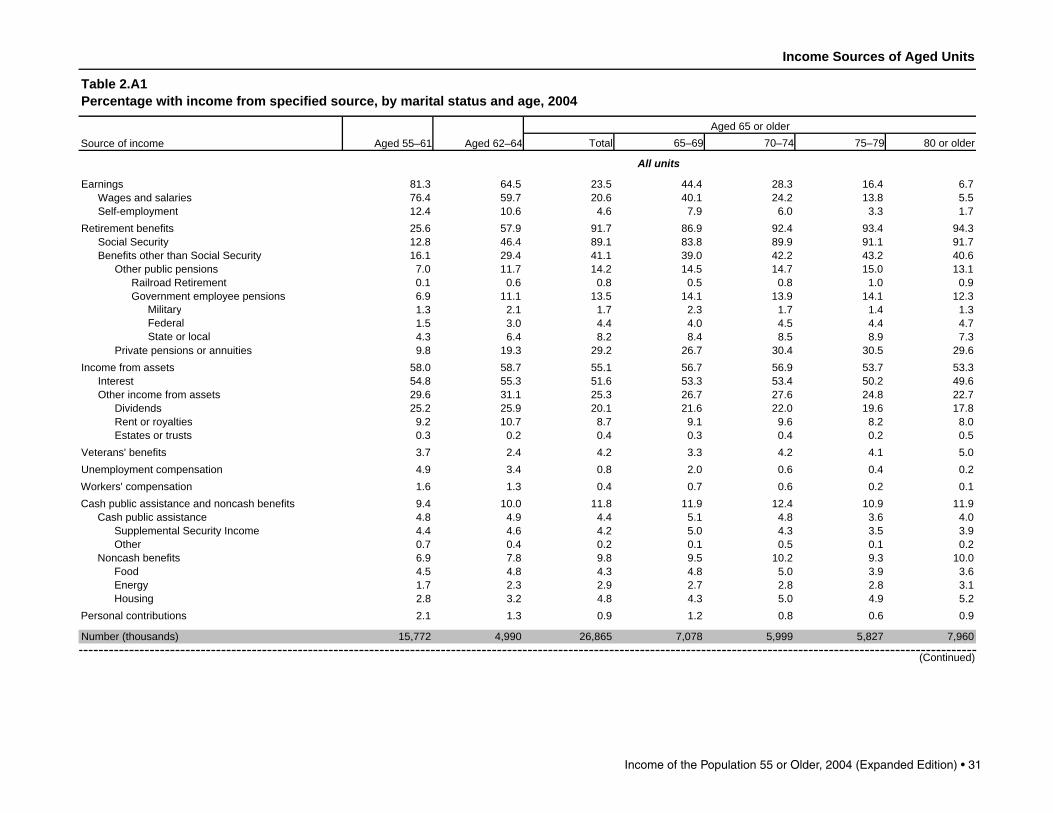
Income Sources of Aged Units
Table 2.A1Percentage with income from specified source, by marital status and age, 2004
Source of income
Personal contributionsHousingEnergyFood
Noncash benefitsOtherSupplemental Security Income
All units
Aged 55–61 Aged 62–64Aged 65 or older
(Continued)
Cash public assistanceCash public assistance and noncash benefitsWorkers' compensation
32 • Income of the Population 55 or Older, 2004 (Expanded Edition)
Total 65–69 70–74 75–79 80 or older
91.7 77.1 36.9 57.1 39.1 23.7 13.486.9 71.9 32.2 51.6 33.0 20.1 11.016.5 13.8 8.4 11.9 9.9 5.1 3.826.5 59.0 93.1 88.9 94.6 95.5 95.712.0 45.2 90.1 85.5 91.7 93.0 92.818.4 35.8 50.7 46.7 52.0 53.1 53.58.1 14.2 18.5 17.1 19.4 19.4 18.90.2 0.9 1.0 0.5 1.0 1.3 1.28.0 13.5 17.6 16.6 18.4 18.1 17.9
Military 1.8 3.0 2.3 2.7 2.3 1.7 2.2Federal 1.8 3.4 5.8 5.2 6.2 5.6 6.7State or local 4.7 7.7 10.7 9.6 11.0 11.8 11.3
11.0 23.9 36.5 33.2 37.3 38.0 39.369.0 68.0 67.4 67.7 68.3 64.8 68.565.5 64.4 63.7 64.2 64.1 61.5 64.537.7 38.7 34.8 35.4 36.2 32.4 34.732.4 33.3 28.7 29.5 29.7 26.2 28.911.8 12.7 12.0 12.1 13.2 10.4 12.00.2 0.3 0.2 0.2 0.1 0.1 0.24.3 2.7 5.4 4.1 4.7 5.1 8.95.6 4.2 1.4 2.8 1.1 0.6 0.21.8 1.3 0.6 0.8 0.9 0.2 0.14.6 4.3 4.9 4.9 5.5 4.1 5.02.9 2.6 2.4 2.8 2.9 1.8 1.72.7 2.6 2.2 2.7 2.3 1.6 1.70.3 0.1 0.2 0.1 0.7 0.2 02.6 2.4 3.5 3.0 4.2 3.1 4.01.8 1.5 1.8 1.8 1.9 1.9 1.80.6 0.9 1.2 1.0 1.3 1.1 1.40.8 0.4 1.2 0.8 1.6 1.1 1.60.9 0.5 0.5 0.6 0.4 0.3 0.7
8,681 2,745 10,930 3,710 2,731 2,342 2,146
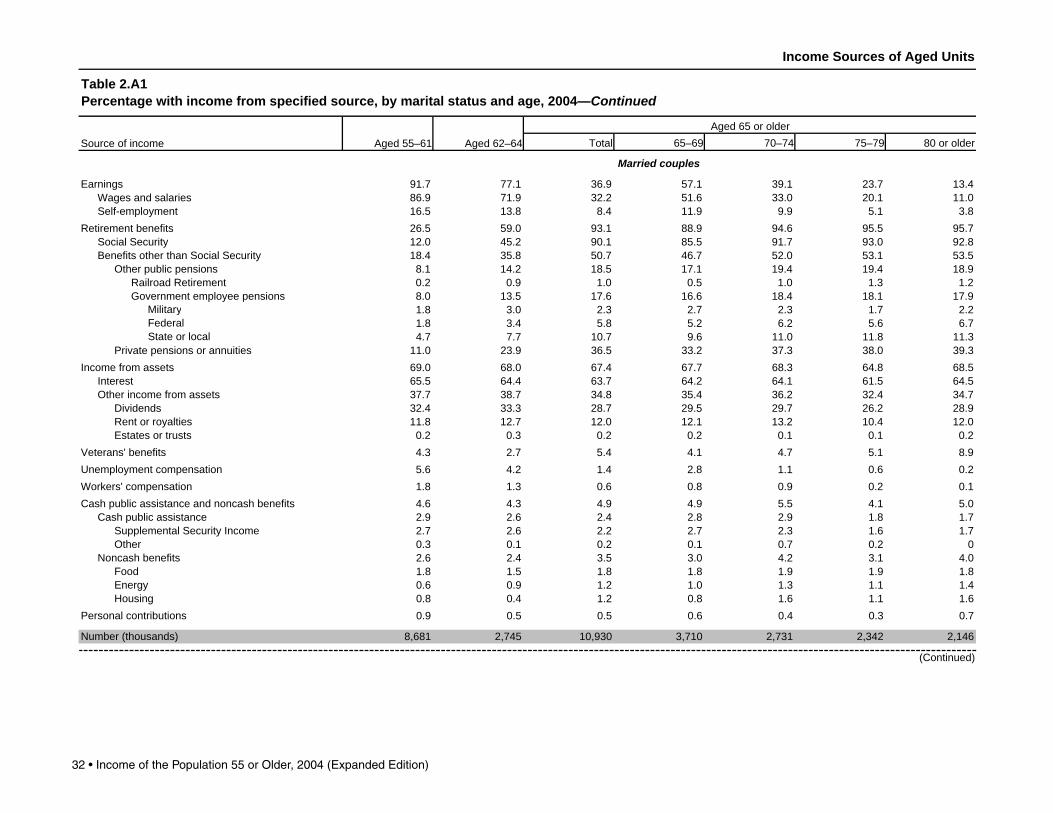
Income Sources of Aged Units
Table 2.A1Percentage with income from specified source, by marital status and age, 2004—Continued
Source of income Aged 55–61 Aged 62–64Aged 65 or older
(Continued)
Wages and salariesEarnings
Benefits other than Social SecuritySocial Security
Retirement benefitsSelf-employment
Private pensions or annuities
Government employee pensionsRailroad Retirement
Other public pensions
DividendsOther income from assetsInterest
Income from assets
Unemployment compensationVeterans' benefits
Estates or trustsRent or royalties
Supplemental Security IncomeCash public assistance
Cash public assistance and noncash benefitsWorkers' compensation
Number (thousands)
Personal contributionsHousingEnergyFood
Noncash benefitsOther
Married couples
Income of the Population 55 or Older, 2004 (Expanded Edition) • 33
Total 65–69 70–74 75–79 80 or older
68.6 49.2 14.4 30.4 19.2 11.4 4.263.5 44.8 12.6 27.5 16.9 9.6 3.57.3 6.8 2.1 3.5 2.8 2.1 0.9
24.5 56.6 90.8 84.7 90.5 92.0 93.713.8 47.9 88.4 82.0 88.3 89.9 91.313.4 21.7 34.5 30.4 34.0 36.6 35.85.6 8.5 11.3 11.7 10.7 12.1 11.00.1 0.3 0.7 0.5 0.5 0.8 0.85.5 8.3 10.7 11.3 10.2 11.4 10.3
Military 0.7 1.0 1.2 1.8 1.2 1.2 0.9Federal 1.1 2.5 3.4 2.8 3.0 3.6 3.9State or local 3.8 4.9 6.4 7.0 6.5 7.0 5.8
8.4 13.8 24.2 19.4 24.6 25.4 26.044.4 47.4 46.7 44.6 47.4 46.3 47.741.6 44.2 43.2 41.3 44.4 42.6 44.119.7 21.8 18.8 17.1 20.4 19.6 18.316.4 16.7 14.3 12.9 15.6 15.2 13.86.0 8.3 6.4 5.8 6.7 6.7 6.50.3 0 0.5 0.4 0.6 0.3 0.72.9 2.0 3.3 2.4 3.7 3.4 3.54.0 2.3 0.4 1.2 0.2 0.3 0.21.4 1.3 0.3 0.5 0.4 0.2 0.1
15.2 16.9 16.5 19.7 18.1 15.5 14.57.3 7.7 5.8 7.7 6.3 4.7 4.96.5 7.0 5.6 7.6 6.0 4.7 4.71.1 0.9 0.2 0.2 0.3 0 0.2
12.2 14.5 14.1 16.8 15.3 13.5 12.27.8 8.8 5.9 8.0 7.6 5.2 4.23.1 4.1 4.0 4.7 3.9 3.9 3.85.3 6.6 7.3 8.1 7.8 7.4 6.53.6 2.3 1.2 1.9 1.2 0.8 0.9
7,091 2,245 15,935 3,368 3,268 3,485 5,814
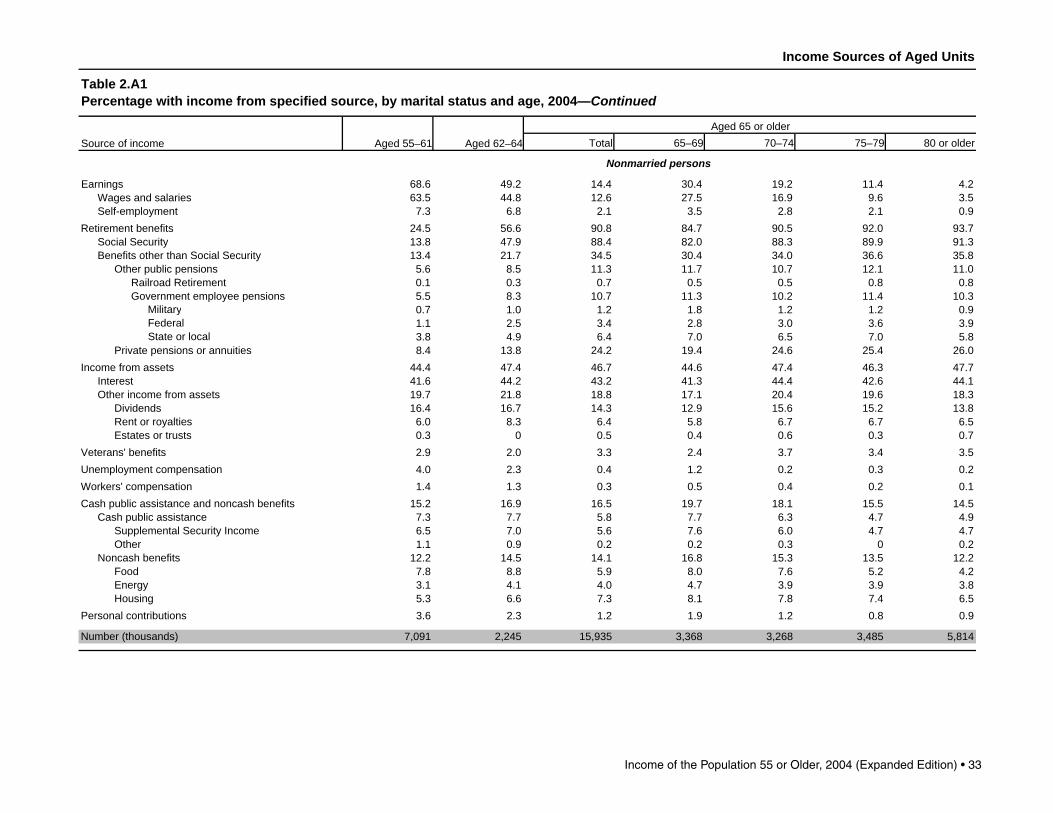
Source of income Aged 55–61 Aged 62–64Aged 65 or older
Earnings
Income Sources of Aged Units
Table 2.A1Percentage with income from specified source, by marital status and age, 2004—Continued
Social SecurityRetirement benefits
Self-employmentWages and salaries
Government employee pensionsRailroad Retirement
Other public pensionsBenefits other than Social Security
Other income from assetsInterest
Income from assetsPrivate pensions or annuities
Veterans' benefitsEstates or trustsRent or royaltiesDividends
Cash public assistanceCash public assistance and noncash benefitsWorkers' compensationUnemployment compensation
Number (thousands)
Personal contributionsHousingEnergyFood
Noncash benefitsOtherSupplemental Security Income
Nonmarried persons
34 • Income of the Population 55 or Older, 2004 (Expanded Edition)
55–61 62–64 65 or older 55–61 62–64 65 or older 55–61 62–64 65 or older
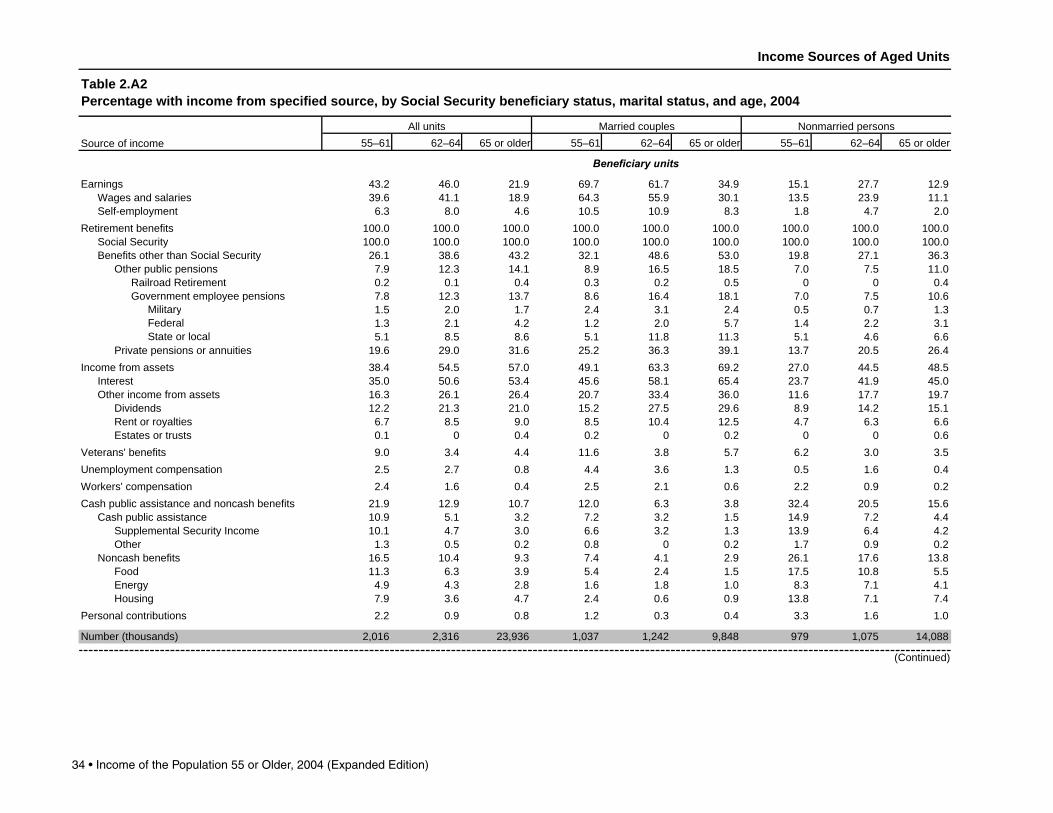
43.2 46.0 21.9 69.7 61.7 34.9 15.1 27.7 12.939.6 41.1 18.9 64.3 55.9 30.1 13.5 23.9 11.16.3 8.0 4.6 10.5 10.9 8.3 1.8 4.7 2.0
100.0 100.0 100.0 100.0 100.0 100.0 100.0 100.0 100.0100.0 100.0 100.0 100.0 100.0 100.0 100.0 100.0 100.026.1 38.6 43.2 32.1 48.6 53.0 19.8 27.1 36.37.9 12.3 14.1 8.9 16.5 18.5 7.0 7.5 11.00.2 0.1 0.4 0.3 0.2 0.5 0 0 0.47.8 12.3 13.7 8.6 16.4 18.1 7.0 7.5 10.6
Military 1.5 2.0 1.7 2.4 3.1 2.4 0.5 0.7 1.3Federal 1.3 2.1 4.2 1.2 2.0 5.7 1.4 2.2 3.1State or local 5.1 8.5 8.6 5.1 11.8 11.3 5.1 4.6 6.6
19.6 29.0 31.6 25.2 36.3 39.1 13.7 20.5 26.438.4 54.5 57.0 49.1 63.3 69.2 27.0 44.5 48.535.0 50.6 53.4 45.6 58.1 65.4 23.7 41.9 45.016.3 26.1 26.4 20.7 33.4 36.0 11.6 17.7 19.712.2 21.3 21.0 15.2 27.5 29.6 8.9 14.2 15.16.7 8.5 9.0 8.5 10.4 12.5 4.7 6.3 6.60.1 0 0.4 0.2 0 0.2 0 0 0.69.0 3.4 4.4 11.6 3.8 5.7 6.2 3.0 3.52.5 2.7 0.8 4.4 3.6 1.3 0.5 1.6 0.42.4 1.6 0.4 2.5 2.1 0.6 2.2 0.9 0.2
21.9 12.9 10.7 12.0 6.3 3.8 32.4 20.5 15.610.9 5.1 3.2 7.2 3.2 1.5 14.9 7.2 4.410.1 4.7 3.0 6.6 3.2 1.3 13.9 6.4 4.21.3 0.5 0.2 0.8 0 0.2 1.7 0.9 0.2
16.5 10.4 9.3 7.4 4.1 2.9 26.1 17.6 13.811.3 6.3 3.9 5.4 2.4 1.5 17.5 10.8 5.54.9 4.3 2.8 1.6 1.8 1.0 8.3 7.1 4.17.9 3.6 4.7 2.4 0.6 0.9 13.8 7.1 7.42.2 0.9 0.8 1.2 0.3 0.4 3.3 1.6 1.0
2,016 2,316 23,936 1,037 1,242 9,848 979 1,075 14,088
Beneficiary units
All units Married couples Nonmarried persons
Income Sources of Aged Units
Table 2.A2Percentage with income from specified source, by Social Security beneficiary status, marital status, and age, 2004
Source of income
Number (thousands)
Personal contributions
(Continued)
HousingEnergyFood
Noncash benefitsOtherSupplemental Security Income
Cash public assistanceCash public assistance and noncash benefitsWorkers' compensationUnemployment compensationVeterans' benefits
Estates or trustsRent or royaltiesDividends
Other income from assetsInterest
Income from assetsPrivate pensions or annuities
Government employee pensionsRailroad Retirement
Self-employmentWages and salaries
Earnings
Other public pensionsBenefits other than Social SecuritySocial Security
Retirement benefits
Income of the Population 55 or Older, 2004 (Expanded Edition) • 35
55–61 62–64 65 or older 55–61 62–64 65 or older 55–61 62–64 65 or older
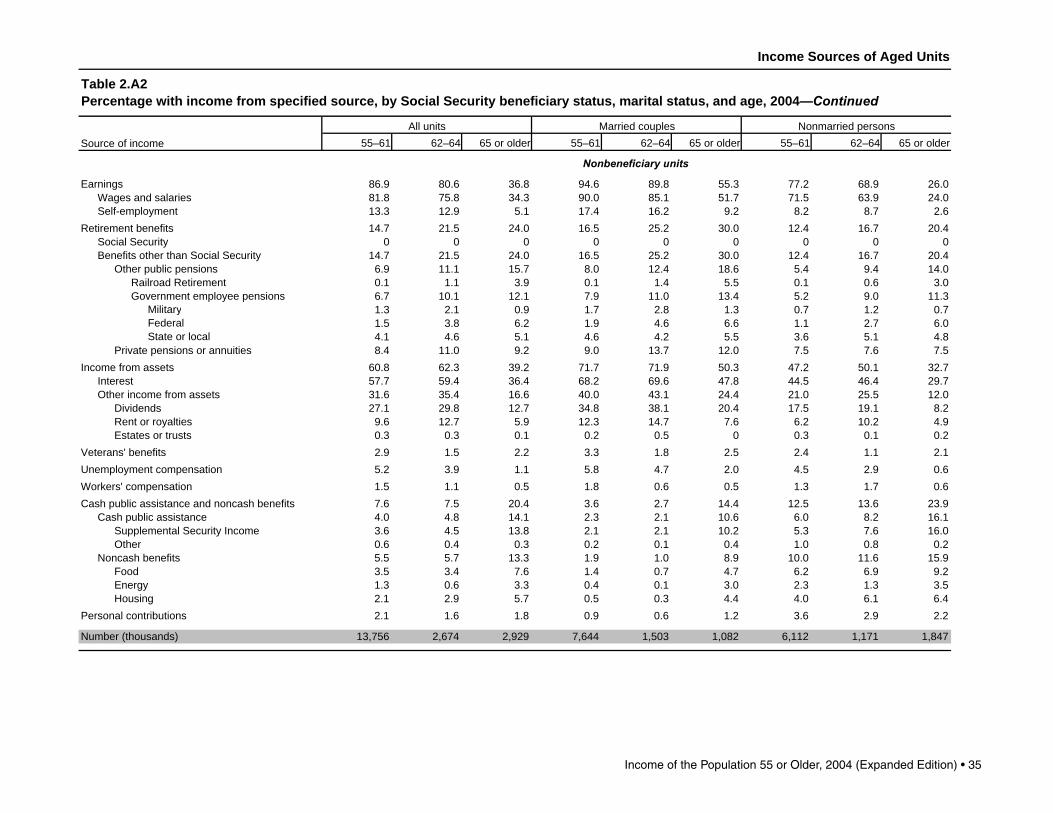
86.9 80.6 36.8 94.6 89.8 55.3 77.2 68.9 26.081.8 75.8 34.3 90.0 85.1 51.7 71.5 63.9 24.013.3 12.9 5.1 17.4 16.2 9.2 8.2 8.7 2.614.7 21.5 24.0 16.5 25.2 30.0 12.4 16.7 20.4
0 0 0 0 0 0 0 0 014.7 21.5 24.0 16.5 25.2 30.0 12.4 16.7 20.46.9 11.1 15.7 8.0 12.4 18.6 5.4 9.4 14.00.1 1.1 3.9 0.1 1.4 5.5 0.1 0.6 3.06.7 10.1 12.1 7.9 11.0 13.4 5.2 9.0 11.3
Military 1.3 2.1 0.9 1.7 2.8 1.3 0.7 1.2 0.7Federal 1.5 3.8 6.2 1.9 4.6 6.6 1.1 2.7 6.0State or local 4.1 4.6 5.1 4.6 4.2 5.5 3.6 5.1 4.8
8.4 11.0 9.2 9.0 13.7 12.0 7.5 7.6 7.560.8 62.3 39.2 71.7 71.9 50.3 47.2 50.1 32.757.7 59.4 36.4 68.2 69.6 47.8 44.5 46.4 29.731.6 35.4 16.6 40.0 43.1 24.4 21.0 25.5 12.027.1 29.8 12.7 34.8 38.1 20.4 17.5 19.1 8.29.6 12.7 5.9 12.3 14.7 7.6 6.2 10.2 4.90.3 0.3 0.1 0.2 0.5 0 0.3 0.1 0.22.9 1.5 2.2 3.3 1.8 2.5 2.4 1.1 2.15.2 3.9 1.1 5.8 4.7 2.0 4.5 2.9 0.61.5 1.1 0.5 1.8 0.6 0.5 1.3 1.7 0.67.6 7.5 20.4 3.6 2.7 14.4 12.5 13.6 23.94.0 4.8 14.1 2.3 2.1 10.6 6.0 8.2 16.13.6 4.5 13.8 2.1 2.1 10.2 5.3 7.6 16.00.6 0.4 0.3 0.2 0.1 0.4 1.0 0.8 0.25.5 5.7 13.3 1.9 1.0 8.9 10.0 11.6 15.93.5 3.4 7.6 1.4 0.7 4.7 6.2 6.9 9.21.3 0.6 3.3 0.4 0.1 3.0 2.3 1.3 3.52.1 2.9 5.7 0.5 0.3 4.4 4.0 6.1 6.42.1 1.6 1.8 0.9 0.6 1.2 3.6 2.9 2.2
13,756 2,674 2,929 7,644 1,503 1,082 6,112 1,171 1,847
Nonbeneficiary units
Income Sources of Aged Units
Table 2.A2Percentage with income from specified source, by Social Security beneficiary status, marital status, and age, 2004—Continued
Source of incomeAll units Married couples
Number (thousands)
Personal contributionsHousingEnergyFood
Noncash benefitsOtherSupplemental Security Income
Cash public assistanceCash public assistance and noncash benefitsWorkers' compensationUnemployment compensationVeterans' benefits
Estates or trustsRent or royaltiesDividends
Other income from assetsInterest
Income from assetsPrivate pensions or annuities
Government employee pensionsRailroad Retirement
Other public pensionsBenefits other than Social SecuritySocial Security
Retirement benefitsSelf-employmentWages and salaries
Earnings
Nonmarried persons
36 • Income of the Population 55 or Older, 2004 (Expanded Edition)
Income Sources of Aged Units
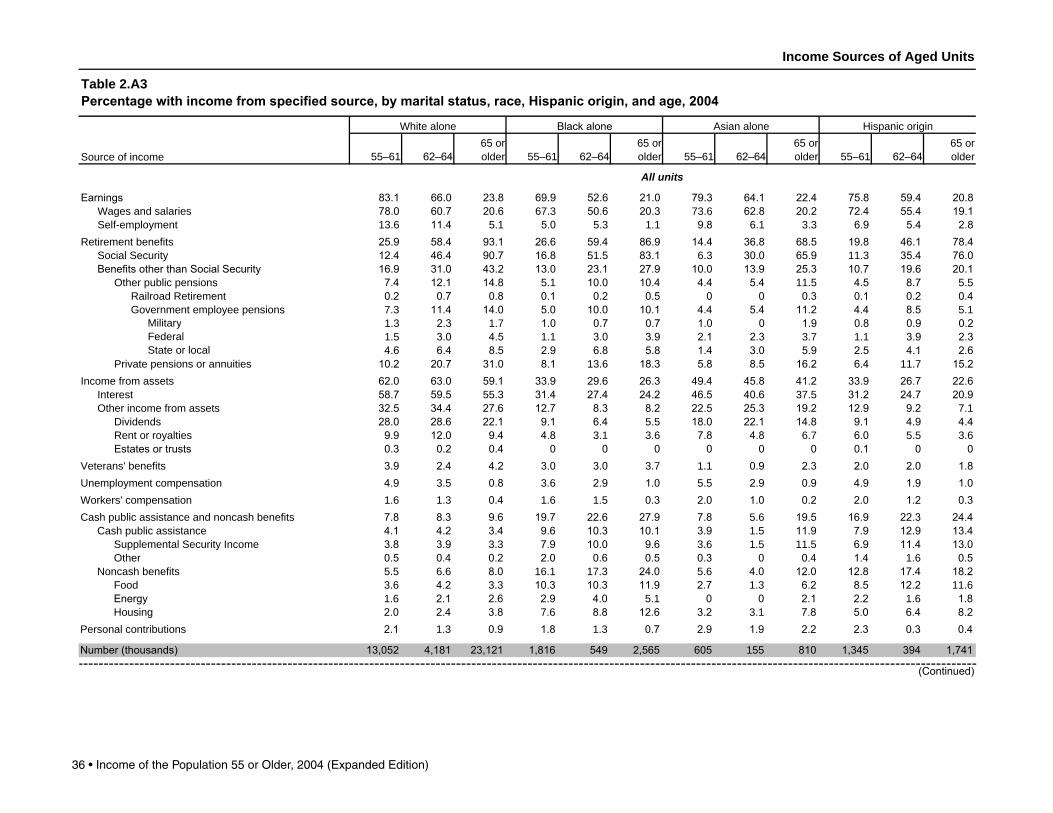
Table 2.A3Percentage with income from specified source, by marital status, race, Hispanic origin, and age, 2004
Source of income
White alone Blackalone Asian alone Hispanic origin
55–61 62–6465 orolder 55–61 62–64
65 orolder 55–61 62–64
65 orolder 55–61 62–64
65 orolder
All units
Earnings 83.1 66.0 23.8 69.9 52.6 21.0 79.3 64.1 22.4 75.8 59.4 20.8Wages and salaries 78.0 60.7 20.6 67 3 50.6 20.3 73 6 62.8 20.2 72.4 55.4 19.1Self-employment 13 6 11.4 5 1 5.0 5 3 1 1 9.8 6 1 3 3 6.9 5.4 2.8
Retirement benefits 25.9 58.4 93.1 26.6 59.4 86.9 14.4 36.8 68.5 19.8 46.1 78.4Social Security 12.4 46.4 90.7 16.8 51 5 83.1 6 3 30.0 65.9 11 3 35.4 76.0BenefitsotherthanSocialSecurity 16.9 31.0 43.2 13.0 23.1 27.9 10.0 13.9 25.3 10.7 19.6 20.1
Other public pensions 7.4 12.1 14.8 5 1 10.0 10.4 4.4 5.4 11 5 4.5 8.7 5 5Railroad Retirement 0.2 0.7 0.8 0.1 0.2 0.5 0 0 0.3 0.1 0.2 0.4Government employee pensions 7 3 11.4 14.0 5.0 10.0 10.1 4.4 5.4 11.2 4.4 8.5 5 1
Military 1 3 2.3 1 7 1.0 0.7 0.7 1.0 0 1.9 0.8 0.9 0.2Federal 1 5 3.0 4.5 1 1 3.0 3.9 2.1 2.3 3 7 1 1 3.9 2.3State or local 4.6 6.4 8.5 2.9 6.8 5.8 1.4 3.0 5.9 2.5 4.1 2.6
Private pensions or annuities 10.2 20.7 31.0 8.1 13 6 18.3 5.8 8.5 16.2 6.4 11 7 15.2Income from assets 62.0 63.0 59.1 33.9 29.6 26.3 49.4 45.8 41.2 33.9 26.7 22.6
Interest 58.7 59.5 55 3 31.4 27.4 24.2 46.5 40.6 37 5 31.2 24.7 20.9Other income from assets 32.5 34.4 27.6 12.7 8.3 8.2 22.5 25.3 19.2 12.9 9.2 7 1
Dividends 28.0 28.6 22.1 9.1 6.4 5 5 18.0 22.1 14.8 9.1 4.9 4.4Rent or royalties 9.9 12.0 9.4 4.8 3 1 3 6 7.8 4.8 6 7 6.0 5 5 3 6Estatesortrusts 0.3 0.2 0.4 0 0 0 0 0 0 0.1 0 0
Veterans' benefits 3.9 2.4 4.2 3.0 3.0 3 7 1 1 0.9 2.3 2.0 2.0 1.8Unemployment compensation 4.9 3 5 0.8 3 6 2.9 1.0 5 5 2.9 0.9 4.9 1.9 1.0Workers' compensation 1 6 1 3 0.4 1 6 1 5 0.3 2.0 1.0 0.2 2.0 1.2 0.3Cash public assistance and noncash benefits 7.8 8.3 9.6 19.7 22.6 27.9 7.8 5 6 19.5 16.9 22.3 24.4
Cash public assistance 4.1 4.2 3.4 9.6 10.3 10.1 3.9 1 5 11.9 7.9 12.9 13.4Supplemental Security Income 3.8 3.9 3 3 7.9 10.0 9.6 3 6 1 5 11 5 6.9 11.4 13.0Other 0.5 0.4 0.2 2.0 0.6 0.5 0.3 0 0.4 1.4 1 6 0.5
Noncash benefits 5 5 6 6 8.0 16 1 17 3 24.0 5 6 4.0 12.0 12.8 17.4 18.2Food 3 6 4.2 3 3 10.3 10.3 11.9 2.7 1 3 6.2 8.5 12.2 11 6Energy 1 6 2.1 2.6 2.9 4.0 5 1 0 0 2.1 2.2 1 6 1.8Housing 2.0 2.4 3.8 7 6 8.8 12.6 3.2 3 1 7.8 5.0 6.4 8.2
Personal contributions 2.1 1 3 0.9 1.8 1 3 0.7 2.9 1.9 2.2 2.3 0.3 0.4
Number(thousands) 13,052 4,181 23,121 1,816 549 2,565 605 155 810 1,345 394 1,741
(Continued)
Income of the Population 55 or Older, 2004 (Expanded Edition) • 37
Income Sources of Aged Units
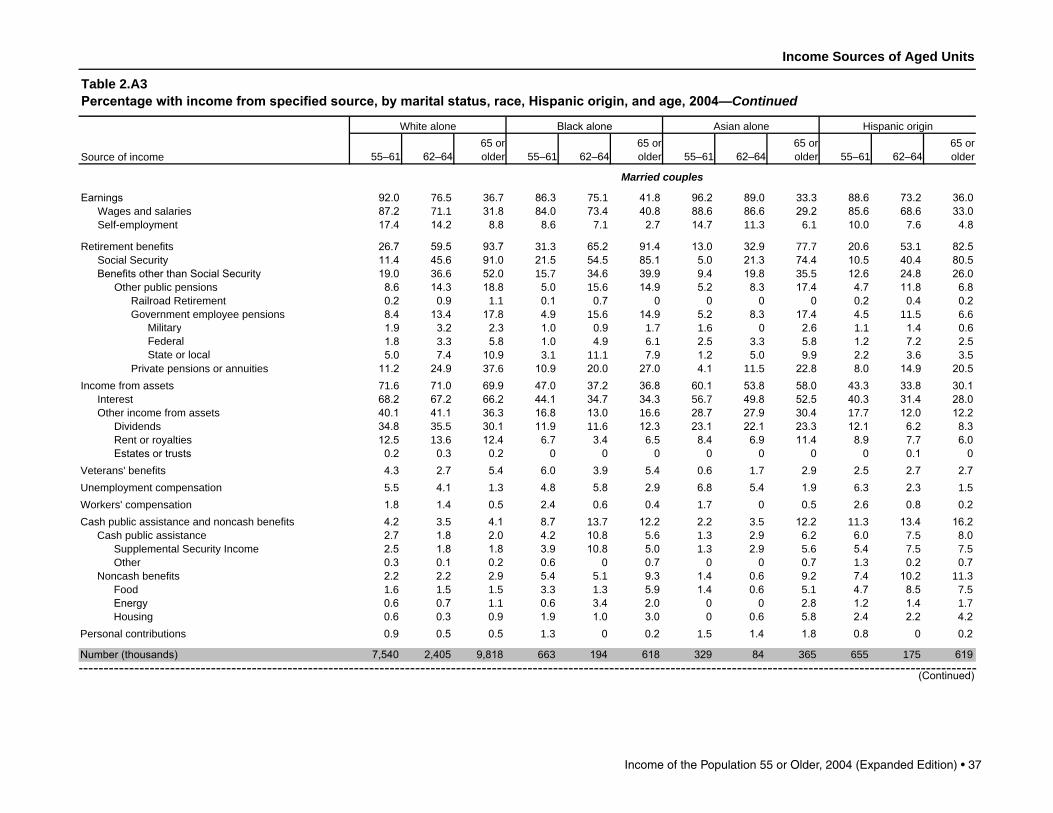
Table 2.A3Percentage with income from specified source, by marital status, race, Hispanic origin, and age, 2004—Continued
Source of income
White alone Blackalone Asian alone Hispanic origin
55–61 62–6465 orolder 55–61 62–64
65 orolder 55–61 62–64
65 orolder 55–61 62–64
65 orolder
Married couples
Earnings 92.0 76 5 36 7 86.3 75 1 41.8 96.2 89.0 33 3 88.6 73.2 36.0Wages and salaries 87.2 71 1 31.8 84.0 73.4 40.8 88.6 86.6 29.2 85.6 68.6 33.0Self-employment 17.4 14.2 8.8 8.6 7 1 2.7 14.7 11 3 6 1 10.0 7 6 4.8
Retirement benefits 26.7 59.5 93.7 31 3 65.2 91.4 13.0 32.9 77 7 20.6 53 1 82.5Social Security 11.4 45.6 91.0 21.5 54.5 85.1 5.0 21.3 74.4 10.5 40.4 80.5BenefitsotherthanSocialSecurity 19.0 36 6 52.0 15 7 34.6 39.9 9.4 19.8 35 5 12.6 24.8 26.0
Other public pensions 8.6 14.3 18.8 5.0 15 6 14.9 5.2 8.3 17.4 4.7 11.8 6.8Railroad Retirement 0.2 0.9 1 1 0.1 0.7 0 0 0 0 0.2 0.4 0.2Government employee pensions 8.4 13.4 17.8 4.9 15 6 14.9 5.2 8.3 17.4 4.5 11 5 6 6
Military 1.9 3.2 2.3 1.0 0.9 1 7 1 6 0 2.6 1 1 1.4 0.6Federal 1.8 3 3 5.8 1.0 4.9 6 1 2.5 3 3 5.8 1.2 7.2 2.5State or local 5.0 7.4 10.9 3 1 11 1 7.9 1.2 5.0 9.9 2.2 3 6 3 5
Private pensions or annuities 11.2 24.9 37 6 10.9 20.0 27.0 4.1 11 5 22.8 8.0 14.9 20.5Income from assets 71 6 71.0 69.9 47.0 37.2 36.8 60.1 53.8 58.0 43.3 33.8 30.1
Interest 68.2 67.2 66.2 44.1 34.7 34.3 56 7 49.8 52.5 40.3 31.4 28.0Other income from assets 40.1 41.1 36 3 16.8 13.0 16 6 28.7 27.9 30.4 17 7 12.0 12.2
Dividends 34.8 35 5 30.1 11.9 11 6 12.3 23.1 22.1 23.3 12.1 6.2 8.3Rent or royalties 12.5 13 6 12.4 6 7 3.4 6 5 8.4 6.9 11.4 8.9 7 7 6.0Estatesortrusts 0.2 0.3 0.2 0 0 0 0 0 0 0 0.1 0
Veterans' benefits 4.3 2.7 5.4 6.0 3.9 5.4 0.6 1 7 2.9 2.5 2.7 2.7Unemployment compensation 5 5 4.1 1 3 4.8 5.8 2.9 6.8 5.4 1.9 6 3 2.3 1 5Workers' compensation 1.8 1.4 0.5 2.4 0.6 0.4 1 7 0 0.5 2.6 0.8 0.2Cash public assistance and noncash benefits 4.2 3 5 4.1 8.7 13 7 12.2 2.2 3 5 12.2 11 3 13.4 16.2
Cash public assistance 2.7 1.8 2.0 4.2 10.8 5 6 1 3 2.9 6.2 6.0 7 5 8.0Supplemental Security Income 2.5 1.8 1.8 3.9 10.8 5.0 1 3 2.9 5 6 5.4 7 5 7 5Other 0.3 0.1 0.2 0.6 0 0.7 0 0 0.7 1 3 0.2 0.7
Noncash benefits 2.2 2.2 2.9 5.4 5 1 9.3 1.4 0.6 9.2 7.4 10.2 11 3Food 1 6 1 5 1 5 3 3 1 3 5.9 1.4 0.6 5 1 4.7 8.5 7 5Energy 0.6 0.7 1 1 0.6 3.4 2.0 0 0 2.8 1.2 1.4 1 7Housing 0.6 0.3 0.9 1.9 1.0 3.0 0 0.6 5.8 2.4 2.2 4.2
Personal contributions 0.9 0.5 0.5 1 3 0 0.2 1 5 1.4 1.8 0.8 0 0.2
Number(thousands) 7,540 2,405 9,818 663 194 618 329 84 365 655 175 619
(Continued)

38 • Income of the Population 55 or Older, 2004 (Expanded Edition)
Income Sources of Aged Units
Table 2.A3Percentage with income from specified source, by marital status, race, Hispanic origin, and age, 2004—Continued
Source of income
White alone Blackalone Asian alone Hispanic origin
55–61 62–6465 orolder 55–61 62–64
65 orolder 55–61 62–64
65 orolder 55–61 62–64
65 orolder
Nonmarried persons
Earnings 71.0 51.8 14.3 60.5 40.4 14.3 59.1 a 13.4 63 6 48.5 12.3Wages and salaries 65 3 46.8 12.4 57 7 38.1 13.8 55.8 a 12.8 60.0 44.8 11 3Self-employment 8.3 7 6 2.3 3.0 4.4 0.6 3.9 a 0.9 3.9 3 6 1 6
Retirement benefits 25.0 56.9 92.6 23.9 56.2 85.5 15.9 a 60.9 19.2 40.5 76 1Social Security 13.8 47.4 90.4 14.1 49.8 82.5 7.9 a 58.9 12.1 31.4 73.4BenefitsotherthanSocialSecurity 14.0 23.3 36.8 11.4 16.8 24.0 10.9 a 16.8 8.9 15.4 16.9
Other public pensions 5.8 9.0 11.8 5 1 7.0 8.9 3 5 a 6 7 4.3 6.2 4.8Railroad Retirement 0.1 0.4 0.7 0.1 0 0.6 0 a 0.6 0 0 0.5Government employee pensions 5 7 8.8 11.2 5 1 7.0 8.5 3 5 a 6 1 4.3 6.2 4.2
Military 0.6 1.0 1 3 1.0 0.6 0.5 0.3 a 1.4 0.5 0.5 0.1Federal 1.0 2.6 3 5 1.2 2.0 3.2 1 6 a 2.1 1.0 1.2 2.1State or local 4.1 5.2 6.8 2.8 4.5 5 1 1 5 a 2.6 2.8 4.5 2.1
Private pensions or annuities 8.8 14.9 26.1 6.4 10.1 15 5 7.8 a 10.7 4.9 9.2 12.3Income from assets 48.7 52.3 51 1 26.3 25.4 22.9 36 6 a 27.3 24.9 21.1 18.4
Interest 45.8 49.0 47.4 24.2 23.4 21.0 34.4 a 25.2 22.6 19.3 16.9Other income from assets 22.1 25.2 21.1 10.3 5.8 5 5 15.0 a 10.0 8.3 6.9 4.3
Dividends 18.6 19.3 16.2 7 5 3 5 3 3 12.0 a 7.8 6 1 3.9 2.2Rent or royalties 6 5 9.8 7 1 3 7 3.0 2.6 7.0 a 2.8 3.2 3 7 2.3Estatesortrusts 0.4 0 0.6 0 0 0.1 0 a 0 0.2 0 0
Veterans' benefits 3 3 2.0 3.4 1 3 2.4 3.2 1.8 a 1.8 1 5 1.4 1.2Unemployment compensation 4.1 2.6 0.4 2.9 1.4 0.4 3.9 a 0.2 3 5 1 5 0.7Workers' compensation 1 3 1.2 0.3 1.2 2.0 0.3 2.3 a 0 1 5 1 5 0.3Cash public assistance and noncash benefits 12.7 14.9 13 7 26.0 27.5 32.9 14.4 a 25.5 22.2 29.4 29.0
Cash public assistance 6.0 7.4 4.5 12.7 10.0 11 5 6.9 a 16 6 9.8 17.2 16.4Supplemental Security Income 5 6 6 7 4.3 10.3 9.5 11 1 6.4 a 16 5 8.4 14.5 16.0Other 0.7 0.9 0.2 2.9 1.0 0.4 0.7 a 0.2 1 6 2.8 0.4
Noncash benefits 9.9 12.6 11.8 22.2 23.9 28.7 10.6 a 14.3 17.9 23.1 22.1Food 6.4 7.8 4.7 14.2 15.2 13.8 4.3 a 7.2 12.2 15.2 13.9Energy 3.0 3.9 3.8 4.2 4.3 6.0 0.1 a 1 6 3 1 1.8 1.9Housing 3.9 5 3 5.9 10.8 13 1 15 7 7 1 a 9.5 7 5 9.8 10.5
Personal contributions 3.9 2.3 1.2 2.1 2.0 0.9 4.6 a 2.6 3 7 0.6 0.6
Number(thousands) 5,512 1,776 13,303 1,153 355 1,947 276 71 445 690 219 1,121
a Fewerthan75,000weightedcases.

Income of the Population 55 or Older, 2004 (Expanded Edition) • 39
Income Sources of Aged Units
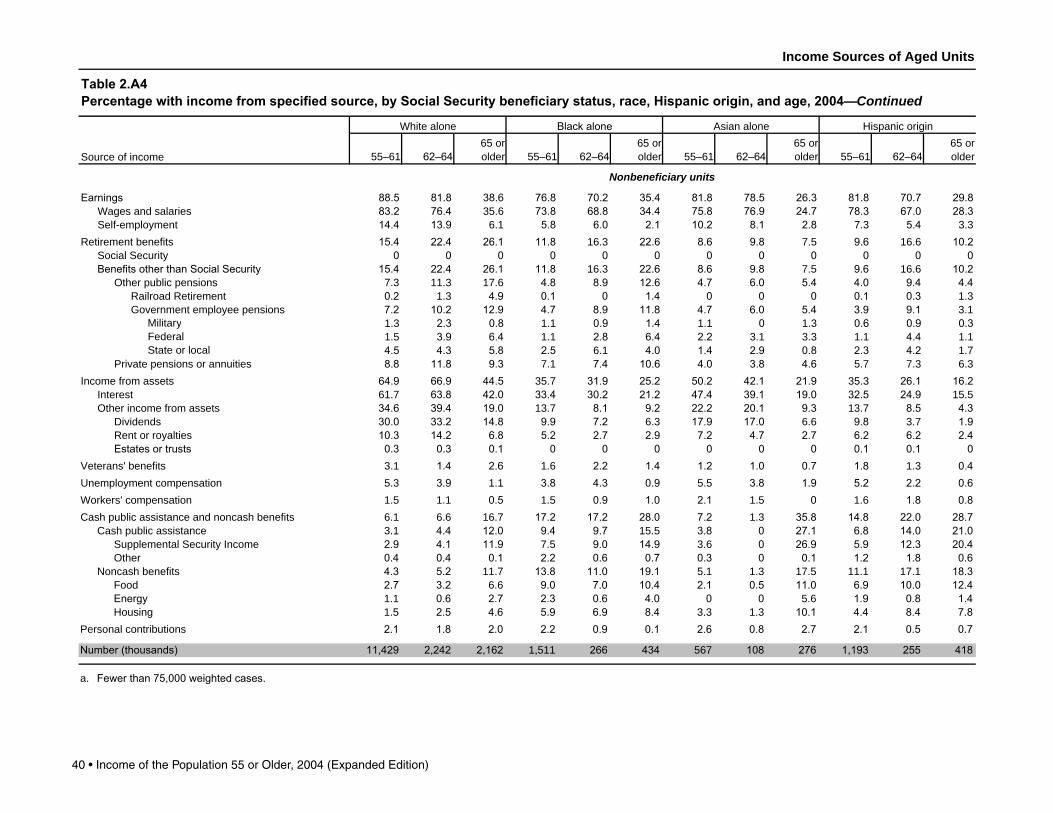
Table 2.A4Percentage with income from specified source, by Social Security beneficiary status, race, Hispanic origin, and age, 2004
Source of income
White alone Blackalone Asian alone Hispanic origin
55–61 62–6465 orolder 55–61 62–64
65 orolder 55–61 62–64
65 orolder 55–61 62–64
65 orolder
Beneficiary units
Earnings 45.1 47.8 22.3 35.8 36.0 18.0 a a 20.3 29.2 39.0 17.9Wages and salaries 40.9 42.6 19.1 34.9 33 5 17 5 a a 17.8 26.7 34.2 16 1Self-employment 7 5 8.5 5.0 1 1 4.7 0.9 a a 3 5 3.2 5.4 2.6
Retirement benefits 100.0 100.0 100.0 100.0 100.0 100.0 a a 100.0 100.0 100.0 100.0Social Security 100.0 100.0 100.0 100.0 100.0 100.0 a a 100.0 100.0 100.0 100.0BenefitsotherthanSocialSecurity 27.4 40.8 45.0 18.6 29.5 28.9 a a 34.4 19.1 24.9 23.3
Other public pensions 8.4 12.9 14.5 6 5 11 1 9.9 a a 14.7 8.2 7 5 5.8Railroad Retirement 0.2 0.1 0.4 0 0.5 0.3 a a 0.5 0 0 0.1Government employee pensions 8.2 12.9 14.1 6 5 11 1 9.7 a a 14.2 8.2 7 5 5 7
Military 1 6 2.3 1.8 0.9 0.5 0.6 a a 2.2 2.3 0.9 0.2Federal 1 3 2.0 4.3 1 1 3.2 3.4 a a 4.0 1 5 2.8 2.6State or local 5 3 9.0 8.8 4.9 7 5 6.2 a a 8.5 4.5 3.8 2.9
Private pensions or annuities 20.6 31.0 33.2 12.6 19.5 19.9 a a 22.1 11 3 20.0 18.0Income from assets 40.9 58.6 60.6 24.9 27.4 26.5 a a 51 1 22.6 28.0 24.6
Interest 37 7 54.6 56 7 21.7 24.8 24.8 a a 47.0 21.5 24.2 22.6Other income from assets 17.8 28.5 28.5 7 7 8.5 8.0 a a 24.3 6.9 10.4 8.0
Dividends 13.4 23.3 22.9 5 1 5 6 5 3 a a 19.0 3.2 7.2 5 1Rent or royalties 7 1 9.4 9.6 2.6 3 5 3 7 a a 8.8 4.1 4.1 4.0Estatesortrusts 0 0 0.5 0 0 0.1 a a 0 0 0 0
Veterans' benefits 9.1 3 5 4.4 10.0 3 7 4.2 a a 3 1 3 7 3.2 2.2Unemployment compensation 2.5 2.9 0.8 2.5 1 6 1.0 a a 0.5 2.3 1.4 1 1Workers' compensation 2.4 1 6 0.4 2.3 2.1 0.2 a a 0.3 5 6 0 0.1Cash public assistance and noncash benefits 19.5 10.3 8.9 32.0 27.8 27.9 a a 11 1 33 5 22.8 23.1
Cash public assistance 10.8 4.0 2.5 11.0 10.9 9.0 a a 4.1 16 3 10.8 11.0Supplemental Security Income 10.2 3 6 2.4 10.0 10.9 8.6 a a 3 6 15 1 9.8 10.6Other 1.2 0.4 0.2 1 1 0.6 0.5 a a 0.5 3.0 1.4 0.5
Noncash benefits 13.8 8.2 7 7 27.3 23.2 25.0 a a 9.1 26.0 18.0 18.2Food 9.7 5 3 3.0 16 6 13.4 12.2 a a 3.8 21.0 16 3 11 3Energy 4.8 3.8 2.6 5.8 7.2 5 3 a a 0.3 4.6 3.2 2.0Housing 6.0 2.4 3 7 15 5 10.6 13 5 a a 6 6 9.5 2.8 8.4
Personal contributions 2.4 0.7 0.7 0 1 7 0.8 a a 1.9 3 5 0 0.4
Number(thousands) 1,622 1,940 20,959 305 282 2,132 38 46 534 152 139 1,322
(Continued)
40 • Income of the Population 55 or Older, 2004 (Expanded Edition)
Income Sources of Aged Units
Table 2.A4Percentage with income from specified source, by Social Security beneficiary status, race, Hispanic origin, and age, 2004—Continued
Source of income
White alone Blackalone Asian alone Hispanic origin
55–61 62–6465 orolder 55–61 62–64
65 orolder 55–61 62–64
65 orolder 55–61 62–64
65 orolder
Nonbeneficiary units
Earnings 88.5 81.8 38.6 76.8 70.2 35.4 81.8 78.5 26.3 81.8 70.7 29.8Wages and salaries 83.2 76.4 35 6 73.8 68.8 34.4 75.8 76.9 24.7 78.3 67.0 28.3Self-employment 14.4 13.9 6 1 5.8 6.0 2.1 10.2 8.1 2.8 7 3 5.4 3 3
Retirement benefits 15.4 22.4 26.1 11.8 16 3 22.6 8.6 9.8 7 5 9.6 16 6 10.2Social Security 0 0 0 0 0 0 0 0 0 0 0 0BenefitsotherthanSocialSecurity 15.4 22.4 26.1 11.8 16 3 22.6 8.6 9.8 7 5 9.6 16 6 10.2
Other public pensions 7 3 11 3 17 6 4.8 8.9 12.6 4.7 6.0 5.4 4.0 9.4 4.4Railroad Retirement 0.2 1 3 4.9 0.1 0 1.4 0 0 0 0.1 0.3 1 3Government employee pensions 7.2 10.2 12.9 4.7 8.9 11.8 4.7 6.0 5.4 3.9 9.1 3 1
Military 1 3 2.3 0.8 1 1 0.9 1.4 1 1 0 1 3 0.6 0.9 0.3Federal 1 5 3.9 6.4 1 1 2.8 6.4 2.2 3 1 3 3 1 1 4.4 1 1State or local 4.5 4.3 5.8 2.5 6 1 4.0 1.4 2.9 0.8 2.3 4.2 1 7
Private pensions or annuities 8.8 11.8 9.3 7 1 7.4 10.6 4.0 3.8 4.6 5 7 7 3 6 3Income from assets 64.9 66.9 44.5 35 7 31.9 25.2 50.2 42.1 21.9 35 3 26.1 16.2
Interest 61 7 63.8 42.0 33.4 30.2 21.2 47.4 39.1 19.0 32.5 24.9 15 5Other income from assets 34.6 39.4 19.0 13 7 8.1 9.2 22.2 20.1 9.3 13 7 8.5 4.3
Dividends 30.0 33.2 14.8 9.9 7.2 6 3 17.9 17.0 6 6 9.8 3 7 1.9Rent or royalties 10.3 14.2 6.8 5.2 2.7 2.9 7.2 4.7 2.7 6.2 6.2 2.4Estatesortrusts 0.3 0.3 0.1 0 0 0 0 0 0 0.1 0.1 0
Veterans' benefits 3 1 1.4 2.6 1 6 2.2 1.4 1.2 1.0 0.7 1.8 1 3 0.4Unemployment compensation 5 3 3.9 1 1 3.8 4.3 0.9 5 5 3.8 1.9 5.2 2.2 0.6Workers' compensation 1 5 1 1 0.5 1 5 0.9 1.0 2.1 1 5 0 1 6 1.8 0.8Cash public assistance and noncash benefits 6 1 6 6 16 7 17.2 17.2 28.0 7.2 1 3 35.8 14.8 22.0 28.7
Cash public assistance 3 1 4.4 12.0 9.4 9.7 15 5 3.8 0 27.1 6.8 14.0 21.0Supplemental Security Income 2.9 4.1 11.9 7 5 9.0 14.9 3 6 0 26.9 5.9 12.3 20.4Other 0.4 0.4 0.1 2.2 0.6 0.7 0.3 0 0.1 1.2 1.8 0.6
Noncash benefits 4.3 5.2 11 7 13.8 11.0 19.1 5 1 1 3 17 5 11 1 17 1 18.3Food 2.7 3.2 6 6 9.0 7.0 10.4 2.1 0.5 11.0 6.9 10.0 12.4Energy 1 1 0.6 2.7 2.3 0.6 4.0 0 0 5 6 1.9 0.8 1.4Housing 1 5 2.5 4.6 5.9 6.9 8.4 3 3 1 3 10.1 4.4 8.4 7.8
Personal contributions 2.1 1.8 2.0 2.2 0.9 0.1 2.6 0.8 2.7 2.1 0.5 0.7
Number(thousands) 11,429 2,242 2,162 1,511 266 434 567 108 276 1,193 255 418
a Fewerthan75,000weightedcases.
Income of the Population 55 or Older, 2004 (Expanded Edition) • 41
Yes No Yes No Yes No Yes No Yes No Yes No
Total percent 100.0 100.0 100.0 100.0 100.0 100.0 100.0 100.0 100.0 100.0 100.0 100.0 100.0 100.0 100.0
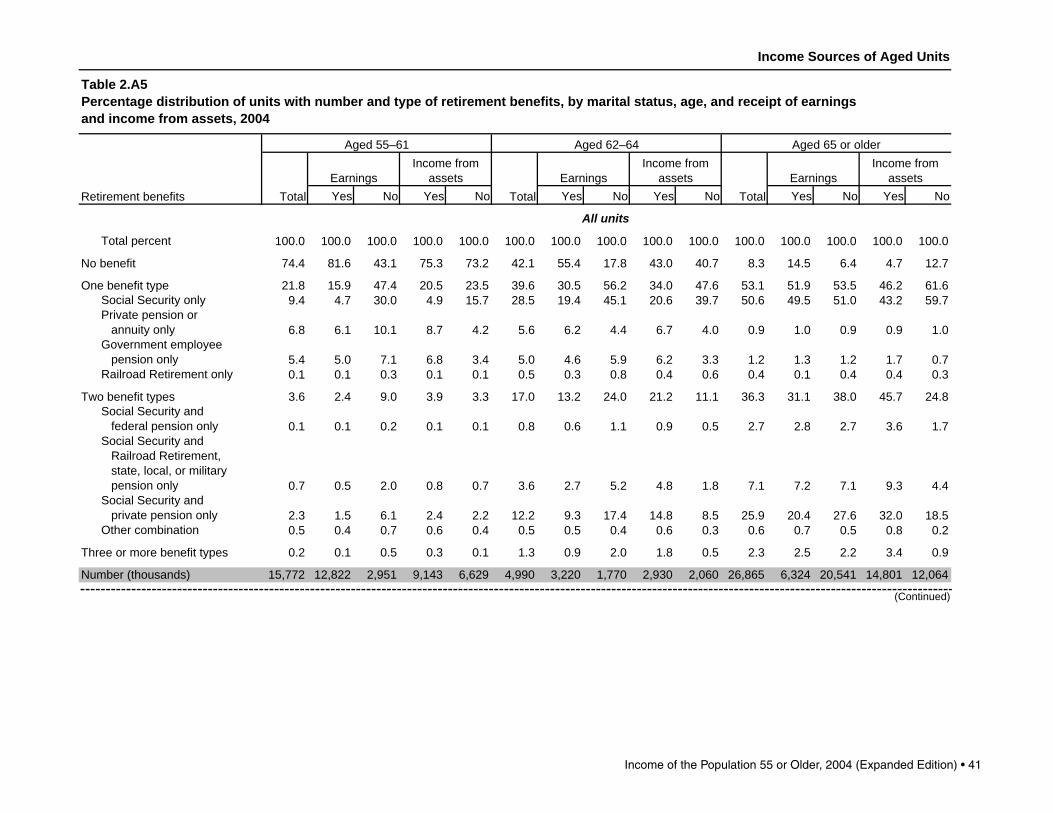
74.4 81.6 43.1 75.3 73.2 42.1 55.4 17.8 43.0 40.7 8.3 14.5 6.4 4.7 12.7
21.8 15.9 47.4 20.5 23.5 39.6 30.5 56.2 34.0 47.6 53.1 51.9 53.5 46.2 61.6Social Security only 9.4 4.7 30.0 4.9 15.7 28.5 19.4 45.1 20.6 39.7 50.6 49.5 51.0 43.2 59.7Private pension or annuity only 6.8 6.1 10.1 8.7 4.2 5.6 6.2 4.4 6.7 4.0 0.9 1.0 0.9 0.9 1.0Government employee pension only 5.4 5.0 7.1 6.8 3.4 5.0 4.6 5.9 6.2 3.3 1.2 1.3 1.2 1.7 0.7Railroad Retirement only 0.1 0.1 0.3 0.1 0.1 0.5 0.3 0.8 0.4 0.6 0.4 0.1 0.4 0.4 0.3
3.6 2.4 9.0 3.9 3.3 17.0 13.2 24.0 21.2 11.1 36.3 31.1 38.0 45.7 24.8Social Security and federal pension only 0.1 0.1 0.2 0.1 0.1 0.8 0.6 1.1 0.9 0.5 2.7 2.8 2.7 3.6 1.7Social Security and Railroad Retirement, state, local, or military pension only 0.7 0.5 2.0 0.8 0.7 3.6 2.7 5.2 4.8 1.8 7.1 7.2 7.1 9.3 4.4Social Security and private pension only 2.3 1.5 6.1 2.4 2.2 12.2 9.3 17.4 14.8 8.5 25.9 20.4 27.6 32.0 18.5Other combination 0.5 0.4 0.7 0.6 0.4 0.5 0.5 0.4 0.6 0.3 0.6 0.7 0.5 0.8 0.2
0.2 0.1 0.5 0.3 0.1 1.3 0.9 2.0 1.8 0.5 2.3 2.5 2.2 3.4 0.9
15,772 12,822 2,951 9,143 6,629 4,990 3,220 1,770 2,930 2,060 26,865 6,324 20,541 14,801 12,064
Retirement benefits
Aged 55–61 Aged 62–64
All units
Aged 65 or older
TotalEarnings
Income from assets
Income Sources of Aged Units
Table 2.A5Percentage distribution of units with number and type of retirement benefits, by marital status, age, and receipt of earningsand income from assets, 2004
No benefit
One benefit type
TotalEarnings
Income from assets
TotalEarnings
Income from assets
Two benefit types
Three or more benefit types
Number (thousands)
(Continued)
42 • Income of the Population 55 or Older, 2004 (Expanded Edition)
Yes No Yes No Yes No Yes No Yes No Yes No
Total percent 100.0 100.0 100.0 100.0 100.0 100.0 100.0 100.0 100.0 100.0 100.0 100.0 100.0 100.0 100.0
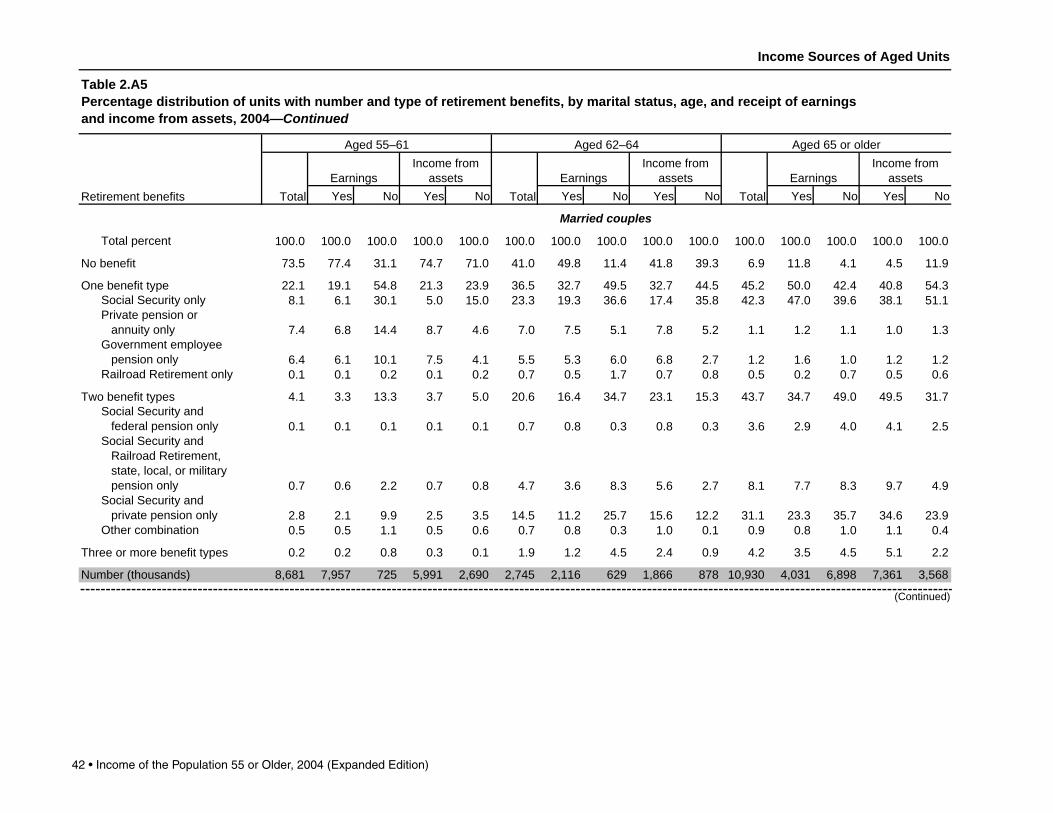
73.5 77.4 31.1 74.7 71.0 41.0 49.8 11.4 41.8 39.3 6.9 11.8 4.1 4.5 11.9
22.1 19.1 54.8 21.3 23.9 36.5 32.7 49.5 32.7 44.5 45.2 50.0 42.4 40.8 54.3Social Security only 8.1 6.1 30.1 5.0 15.0 23.3 19.3 36.6 17.4 35.8 42.3 47.0 39.6 38.1 51.1Private pension or annuity only 7.4 6.8 14.4 8.7 4.6 7.0 7.5 5.1 7.8 5.2 1.1 1.2 1.1 1.0 1.3Government employee pension only 6.4 6.1 10.1 7.5 4.1 5.5 5.3 6.0 6.8 2.7 1.2 1.6 1.0 1.2 1.2Railroad Retirement only 0.1 0.1 0.2 0.1 0.2 0.7 0.5 1.7 0.7 0.8 0.5 0.2 0.7 0.5 0.6
4.1 3.3 13.3 3.7 5.0 20.6 16.4 34.7 23.1 15.3 43.7 34.7 49.0 49.5 31.7Social Security and federal pension only 0.1 0.1 0.1 0.1 0.1 0.7 0.8 0.3 0.8 0.3 3.6 2.9 4.0 4.1 2.5Social Security and Railroad Retirement, state, local, or military pension only 0.7 0.6 2.2 0.7 0.8 4.7 3.6 8.3 5.6 2.7 8.1 7.7 8.3 9.7 4.9Social Security and private pension only 2.8 2.1 9.9 2.5 3.5 14.5 11.2 25.7 15.6 12.2 31.1 23.3 35.7 34.6 23.9Other combination 0.5 0.5 1.1 0.5 0.6 0.7 0.8 0.3 1.0 0.1 0.9 0.8 1.0 1.1 0.4
0.2 0.2 0.8 0.3 0.1 1.9 1.2 4.5 2.4 0.9 4.2 3.5 4.5 5.1 2.2
8,681 7,957 725 5,991 2,690 2,745 2,116 629 1,866 878 10,930 4,031 6,898 7,361 3,568
Married couples
No benefit
Income Sources of Aged Units
Table 2.A5Percentage distribution of units with number and type of retirement benefits, by marital status, age, and receipt of earningsand income from assets, 2004—Continued
Retirement benefits
Aged 55–61 Aged 62–64
One benefit type
Two benefit types
Three or more benefit types
Number (thousands)
Aged 65 or older
TotalEarnings
Income from assets
TotalEarnings
Income from assets
TotalEarnings
Income from assets
(Continued)

Income of the Population 55 or Older, 2004 (Expanded Edition) • 43
Yes No Yes No Yes No Yes No Yes No Yes No
Total percent 100.0 100.0 100.0 100.0 100.0 100.0 100.0 100.0 100.0 100.0 100.0 100.0 100.0 100.0 100.0
75.5 88.6 47.0 76.6 74.7 43.4 66.2 21.4 45.2 41.8 9.2 19.3 7.5 4.9 13.0
21.3 10.5 45.0 18.9 23.3 43.4 26.4 59.9 36.2 49.9 58.5 55.2 59.1 51.5 64.7Social Security only 11.1 2.5 29.9 4.7 16.2 34.9 19.6 49.8 26.3 42.7 56.3 53.8 56.7 48.4 63.3Private pension or annuity only 6.0 4.8 8.7 8.6 4.0 3.8 3.7 4.0 4.7 3.1 0.7 0.6 0.8 0.7 0.8Government employee pension only 4.1 3.2 6.1 5.4 3.0 4.5 3.1 5.8 5.2 3.8 1.2 0.8 1.3 2.1 0.5Railroad Retirement only 0.1 0 0.3 0.2 0.1 0.2 0 0.4 0 0.4 0.3 0 0.3 0.3 0.2
3.0 0.9 7.6 4.2 2.1 12.7 7.1 18.1 17.9 8.0 31.3 24.7 32.4 42.0 22.0Social Security and federal pension only 0.1 0 0.3 0.2 0 0.9 0.4 1.5 1.1 0.8 2.2 2.5 2.1 3.1 1.3Social Security and Railroad Retirement, state, local, or military pension only 0.7 0.2 1.9 1.0 0.5 2.2 0.9 3.4 3.4 1.1 6.4 6.4 6.4 9.0 4.2Social Security and private pension only 1.8 0.3 4.9 2.3 1.3 9.4 5.8 12.8 13.4 5.7 22.4 15.4 23.6 29.4 16.2Other combination 0.4 0.4 0.6 0.8 0.2 0.2 0 0.4 0 0.4 0.3 0.5 0.3 0.5 0.2
0.1 0 0.4 0.3 0 0.5 0.3 0.6 0.7 0.3 1.0 0.7 1.0 1.7 0.3
7,091 4,865 2,226 3,151 3,939 2,245 1,104 1,141 1,064 1,182 15,935 2,292 13,643 7,439 8,496
Nonmarried persons
Number (thousands)
No benefit
One benefit type
Two benefit types
Three or more benefit types
Income Sources of Aged Units
Table 2.A5Percentage distribution of units with number and type of retirement benefits, by marital status, age, and receipt of earningsand income from assets, 2004—Continued
Retirement benefits
Aged 55–61 Aged 62–64 Aged 65 or older
TotalEarnings
Income from assets Earnings
Income from assets
TotalEarnings
Income from assets
Total
44 • Income of the Population 55 or Older, 2004 (Expanded Edition)
First Second Third Fourth Fifth First Second Third Fourth Fifth First Second Third Fourth Fifth
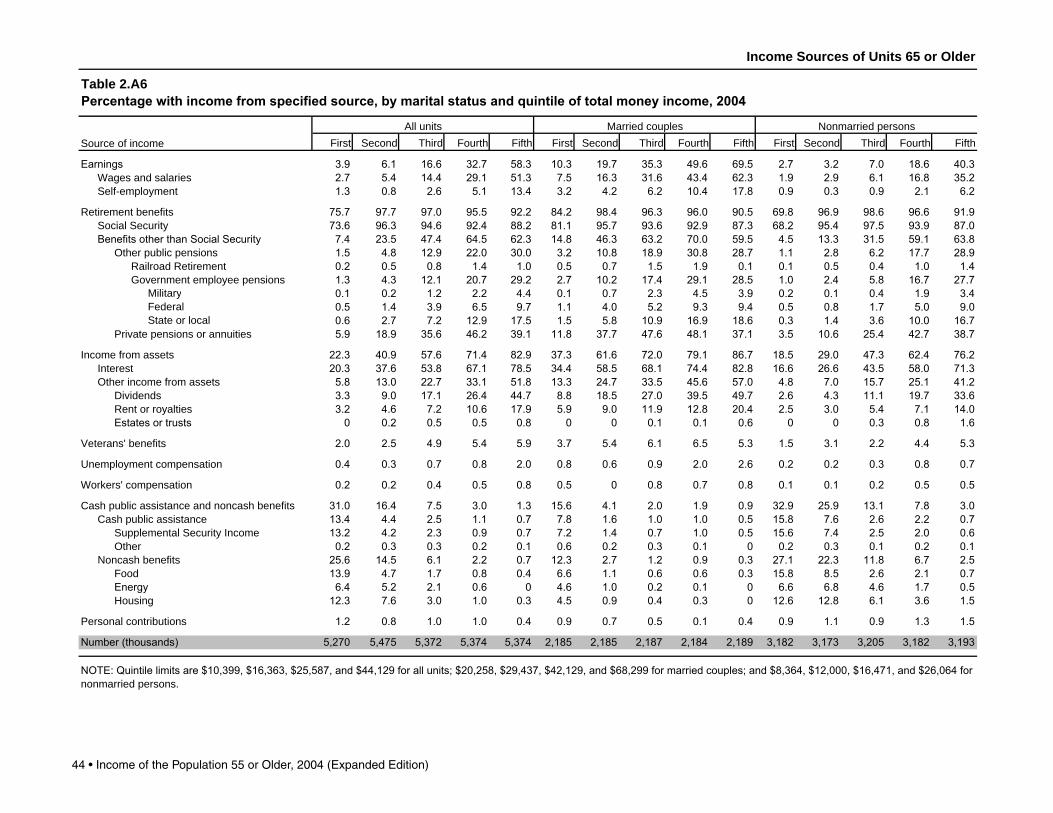
3.9 6.1 16.6 32.7 58.3 10.3 19.7 35.3 49.6 69.5 2.7 3.2 7.0 18.6 40.32.7 5.4 14.4 29.1 51.3 7.5 16.3 31.6 43.4 62.3 1.9 2.9 6.1 16.8 35.21.3 0.8 2.6 5.1 13.4 3.2 4.2 6.2 10.4 17.8 0.9 0.3 0.9 2.1 6.2
75.7 97.7 97.0 95.5 92.2 84.2 98.4 96.3 96.0 90.5 69.8 96.9 98.6 96.6 91.973.6 96.3 94.6 92.4 88.2 81.1 95.7 93.6 92.9 87.3 68.2 95.4 97.5 93.9 87.07.4 23.5 47.4 64.5 62.3 14.8 46.3 63.2 70.0 59.5 4.5 13.3 31.5 59.1 63.81.5 4.8 12.9 22.0 30.0 3.2 10.8 18.9 30.8 28.7 1.1 2.8 6.2 17.7 28.90.2 0.5 0.8 1.4 1.0 0.5 0.7 1.5 1.9 0.1 0.1 0.5 0.4 1.0 1.41.3 4.3 12.1 20.7 29.2 2.7 10.2 17.4 29.1 28.5 1.0 2.4 5.8 16.7 27.7
Military 0.1 0.2 1.2 2.2 4.4 0.1 0.7 2.3 4.5 3.9 0.2 0.1 0.4 1.9 3.4Federal 0.5 1.4 3.9 6.5 9.7 1.1 4.0 5.2 9.3 9.4 0.5 0.8 1.7 5.0 9.0State or local 0.6 2.7 7.2 12.9 17.5 1.5 5.8 10.9 16.9 18.6 0.3 1.4 3.6 10.0 16.7
5.9 18.9 35.6 46.2 39.1 11.8 37.7 47.6 48.1 37.1 3.5 10.6 25.4 42.7 38.7
22.3 40.9 57.6 71.4 82.9 37.3 61.6 72.0 79.1 86.7 18.5 29.0 47.3 62.4 76.220.3 37.6 53.8 67.1 78.5 34.4 58.5 68.1 74.4 82.8 16.6 26.6 43.5 58.0 71.35.8 13.0 22.7 33.1 51.8 13.3 24.7 33.5 45.6 57.0 4.8 7.0 15.7 25.1 41.23.3 9.0 17.1 26.4 44.7 8.8 18.5 27.0 39.5 49.7 2.6 4.3 11.1 19.7 33.63.2 4.6 7.2 10.6 17.9 5.9 9.0 11.9 12.8 20.4 2.5 3.0 5.4 7.1 14.00 0.2 0.5 0.5 0.8 0 0 0.1 0.1 0.6 0 0 0.3 0.8 1.6
2.0 2.5 4.9 5.4 5.9 3.7 5.4 6.1 6.5 5.3 1.5 3.1 2.2 4.4 5.3
0.4 0.3 0.7 0.8 2.0 0.8 0.6 0.9 2.0 2.6 0.2 0.2 0.3 0.8 0.7
0.2 0.2 0.4 0.5 0.8 0.5 0 0.8 0.7 0.8 0.1 0.1 0.2 0.5 0.5
31.0 16.4 7.5 3.0 1.3 15.6 4.1 2.0 1.9 0.9 32.9 25.9 13.1 7.8 3.013.4 4.4 2.5 1.1 0.7 7.8 1.6 1.0 1.0 0.5 15.8 7.6 2.6 2.2 0.713.2 4.2 2.3 0.9 0.7 7.2 1.4 0.7 1.0 0.5 15.6 7.4 2.5 2.0 0.60.2 0.3 0.3 0.2 0.1 0.6 0.2 0.3 0.1 0 0.2 0.3 0.1 0.2 0.125.6 14.5 6.1 2.2 0.7 12.3 2.7 1.2 0.9 0.3 27.1 22.3 11.8 6.7 2.513.9 4.7 1.7 0.8 0.4 6.6 1.1 0.6 0.6 0.3 15.8 8.5 2.6 2.1 0.76.4 5.2 2.1 0.6 0 4.6 1.0 0.2 0.1 0 6.6 6.8 4.6 1.7 0.512.3 7.6 3.0 1.0 0.3 4.5 0.9 0.4 0.3 0 12.6 12.8 6.1 3.6 1.5
1.2 0.8 1.0 1.0 0.4 0.9 0.7 0.5 0.1 0.4 0.9 1.1 0.9 1.3 1.5
5,270 5,475 5,372 5,374 5,374 2,185 2,185 2,187 2,184 2,189 3,182 3,173 3,205 3,182 3,193
All units Married couples Nonmarried persons
Income Sources of Units 65 or Older
Table 2.A6Percentage with income from specified source, by marital status and quintile of total money income, 2004
Source of income
Number(thousands)
Personal contributions
HousingEnergyFood
Noncash benefitsOtherSupplemental Security Income
Cash public assistanceCash public assistance and noncash benefits
Workers' compensation
Unemployment compensation
Veterans' benefits
EstatesortrustsRent or royaltiesDividends
Other income from assetsInterest
Income from assets
Private pensions or annuities
NOTE:Quintilelimitsare$10,399,$16,363,$25,587,and$44,129forallunits;$20,258,$29,437,$42,129,and$68,299formarriedcouples;and$8,364,$12,000,$16,471,and$26,064fornonmarried persons
Earnings
BenefitsotherthanSocialSecuritySocial Security
Retirement benefits
Self-employment
Government employee pensionsRailroad Retirement
Other public pensions
Wages and salaries
Income of the Population 55 or Older, 2004 (Expanded Edition) • 45
All unitsMarriedcouples
Nonmarriedpersons All units
Marriedcouples
Nonmarriedpersons All units
Marriedcouples
Nonmarriedpersons All units
Marriedcouples
Nonmarriedpersons
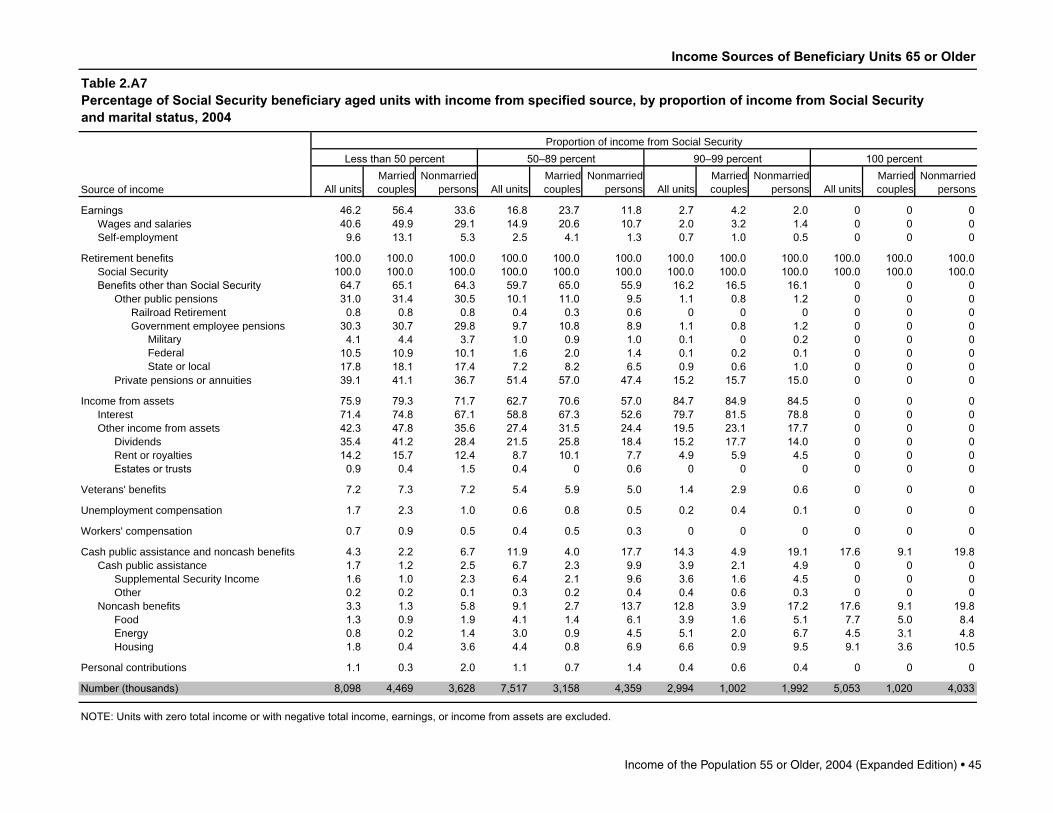
46.2 56.4 33.6 16.8 23.7 11.8 2.7 4.2 2.0 0 0 040.6 49.9 29.1 14.9 20.6 10.7 2.0 3.2 1.4 0 0 09.6 13.1 5.3 2.5 4.1 1.3 0.7 1.0 0.5 0 0 0
100.0 100.0 100.0 100.0 100.0 100.0 100.0 100.0 100.0 100.0 100.0 100.0100.0 100.0 100.0 100.0 100.0 100.0 100.0 100.0 100.0 100.0 100.0 100.064.7 65.1 64.3 59.7 65.0 55.9 16.2 16.5 16.1 0 0 031.0 31.4 30.5 10.1 11.0 9.5 1.1 0.8 1.2 0 0 00.8 0.8 0.8 0.4 0.3 0.6 0 0 0 0 0 030.3 30.7 29.8 9.7 10.8 8.9 1.1 0.8 1.2 0 0 0
Military 4.1 4.4 3.7 1.0 0.9 1.0 0.1 0 0.2 0 0 0Federal 10.5 10.9 10.1 1.6 2.0 1.4 0.1 0.2 0.1 0 0 0State or local 17.8 18.1 17.4 7.2 8.2 6.5 0.9 0.6 1.0 0 0 0
39.1 41.1 36.7 51.4 57.0 47.4 15.2 15.7 15.0 0 0 0
75.9 79.3 71.7 62.7 70.6 57.0 84.7 84.9 84.5 0 0 071.4 74.8 67.1 58.8 67.3 52.6 79.7 81.5 78.8 0 0 042.3 47.8 35.6 27.4 31.5 24.4 19.5 23.1 17.7 0 0 035.4 41.2 28.4 21.5 25.8 18.4 15.2 17.7 14.0 0 0 014.2 15.7 12.4 8.7 10.1 7.7 4.9 5.9 4.5 0 0 00.9 0.4 1.5 0.4 0 0.6 0 0 0 0 0 0
7.2 7.3 7.2 5.4 5.9 5.0 1.4 2.9 0.6 0 0 0
1.7 2.3 1.0 0.6 0.8 0.5 0.2 0.4 0.1 0 0 0
0.7 0.9 0.5 0.4 0.5 0.3 0 0 0 0 0 0
4.3 2.2 6.7 11.9 4.0 17.7 14.3 4.9 19.1 17.6 9.1 19.81.7 1.2 2.5 6.7 2.3 9.9 3.9 2.1 4.9 0 0 01.6 1.0 2.3 6.4 2.1 9.6 3.6 1.6 4.5 0 0 00.2 0.2 0.1 0.3 0.2 0.4 0.4 0.6 0.3 0 0 03.3 1.3 5.8 9.1 2.7 13.7 12.8 3.9 17.2 17.6 9.1 19.81.3 0.9 1.9 4.1 1.4 6.1 3.9 1.6 5.1 7.7 5.0 8.40.8 0.2 1.4 3.0 0.9 4.5 5.1 2.0 6.7 4.5 3.1 4.81.8 0.4 3.6 4.4 0.8 6.9 6.6 0.9 9.5 9.1 3.6 10.5
1.1 0.3 2.0 1.1 0.7 1.4 0.4 0.6 0.4 0 0 0
8,098 4,469 3,628 7,517 3,158 4,359 2,994 1,002 1,992 5,053 1,020 4,033
NOTE:Unitswithzerototalincomeorwithnegativetotalincome,earnings,orincomefromassetsareexcluded.
Wages and salariesEarnings
BenefitsotherthanSocialSecuritySocial Security
Retirement benefits
Self-employment
Private pensions or annuities
Government employee pensionsRailroad Retirement
Other public pensions
DividendsOther income from assetsInterest
Income from assets
Unemployment compensation
Veterans' benefits
EstatesortrustsRent or royalties
Supplemental Security IncomeCash public assistance
Cash public assistance and noncash benefits
Workers' compensation
Income Sources of Beneficiary Units 65 or Older
Table 2.A7Percentage of Social Security beneficiary aged units with income from specified source, by proportion of income from Social Securityand marital status, 2004
Source of income
Number(thousands)
Personal contributions
HousingEnergyFood
Noncash benefitsOther
Proportion of income from Social Security50–89percent 90–99percent 100percentLessthan50percent
46 • Income of the Population 55 or Older, 2004 (Expanded Edition)
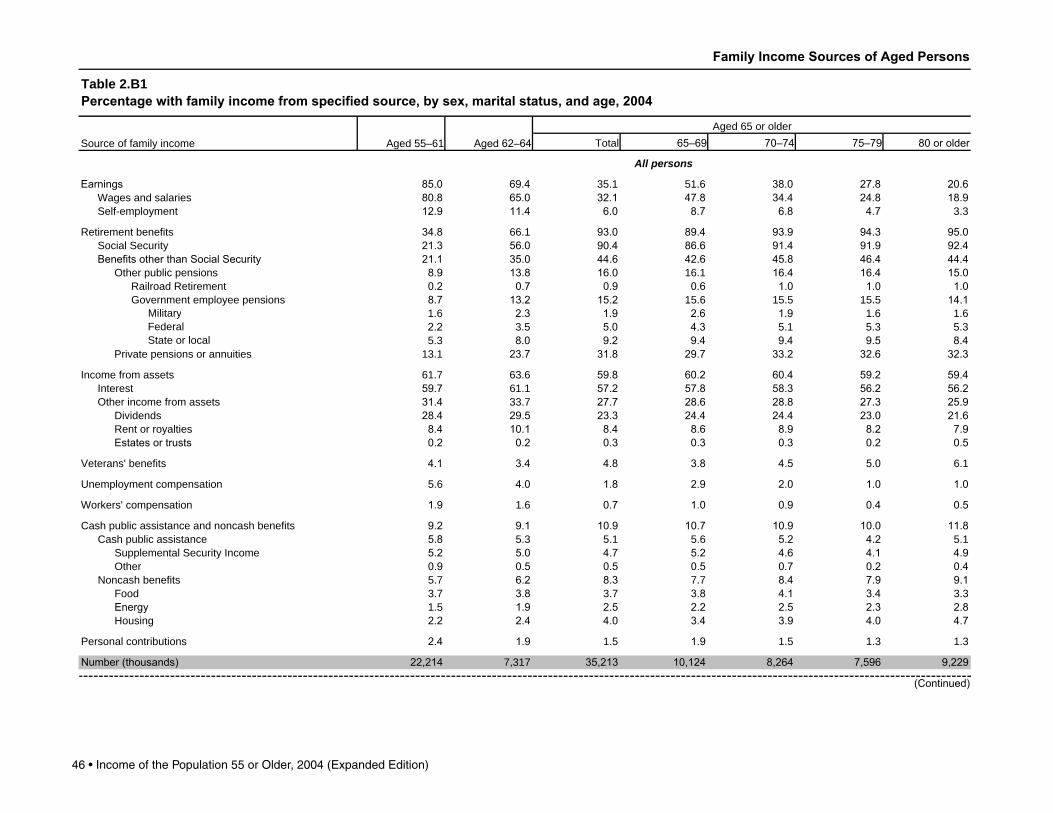
Family Income Sources of Aged Persons
Table 2.B1Percentage with family income from specified source, by sex, marital status, and age, 2004
Source of family income Aged 55–61 Aged62–64Aged 65 or older
Total 65–69 70–74 75–79 80orolder
All persons
Earnings 85.0 69.4 35 1 51 6 38.0 27.8 20.6Wages and salaries 80.8 65.0 32.1 47.8 34.4 24.8 18.9Self-employment 12.9 11.4 6.0 8.7 6.8 4.7 3 3
Retirement benefits 34.8 66 1 93.0 89.4 93.9 94.3 95.0Social Security 21.3 56.0 90.4 86.6 91.4 91.9 92.4BenefitsotherthanSocialSecurity 21.1 35.0 44.6 42.6 45.8 46.4 44.4
Other public pensions 8.9 13.8 16.0 16 1 16.4 16.4 15.0Railroad Retirement 0.2 0.7 0.9 0.6 1.0 1.0 1.0Government employee pensions 8.7 13.2 15.2 15 6 15 5 15 5 14.1
Military 1 6 2.3 1.9 2.6 1.9 1 6 1 6Federal 2.2 3 5 5.0 4.3 5 1 5 3 5 3State or local 5 3 8.0 9.2 9.4 9.4 9.5 8.4
Private pensions or annuities 13 1 23.7 31.8 29.7 33.2 32.6 32.3
Income from assets 61 7 63 6 59.8 60.2 60.4 59.2 59.4Interest 59.7 61 1 57.2 57.8 58.3 56.2 56.2Other income from assets 31.4 33 7 27.7 28.6 28.8 27.3 25.9
Dividends 28.4 29.5 23.3 24.4 24.4 23.0 21.6Rent or royalties 8.4 10.1 8.4 8.6 8.9 8.2 7.9Estatesortrusts 0.2 0.2 0.3 0.3 0.3 0.2 0.5
Veterans' benefits 4.1 3.4 4.8 3.8 4.5 5.0 6 1
Unemployment compensation 5 6 4.0 1.8 2.9 2.0 1.0 1.0
Workers' compensation 1.9 1 6 0.7 1.0 0.9 0.4 0.5
Cash public assistance and noncash benefits 9.2 9.1 10.9 10.7 10.9 10.0 11.8Cash public assistance 5.8 5 3 5 1 5 6 5.2 4.2 5 1
Supplemental Security Income 5.2 5.0 4.7 5.2 4.6 4.1 4.9Other 0.9 0.5 0.5 0.5 0.7 0.2 0.4
Noncash benefits 5 7 6.2 8.3 7 7 8.4 7.9 9.1Food 3 7 3.8 3 7 3.8 4.1 3.4 3 3Energy 1 5 1.9 2.5 2.2 2.5 2.3 2.8Housing 2.2 2.4 4.0 3.4 3.9 4.0 4.7
Personal contributions 2.4 1.9 1 5 1.9 1 5 1 3 1 3
Number(thousands) 22,214 7,317 35,213 10,124 8,264 7,596 9,229
(Continued)
Income of the Population 55 or Older, 2004 (Expanded Edition) • 47
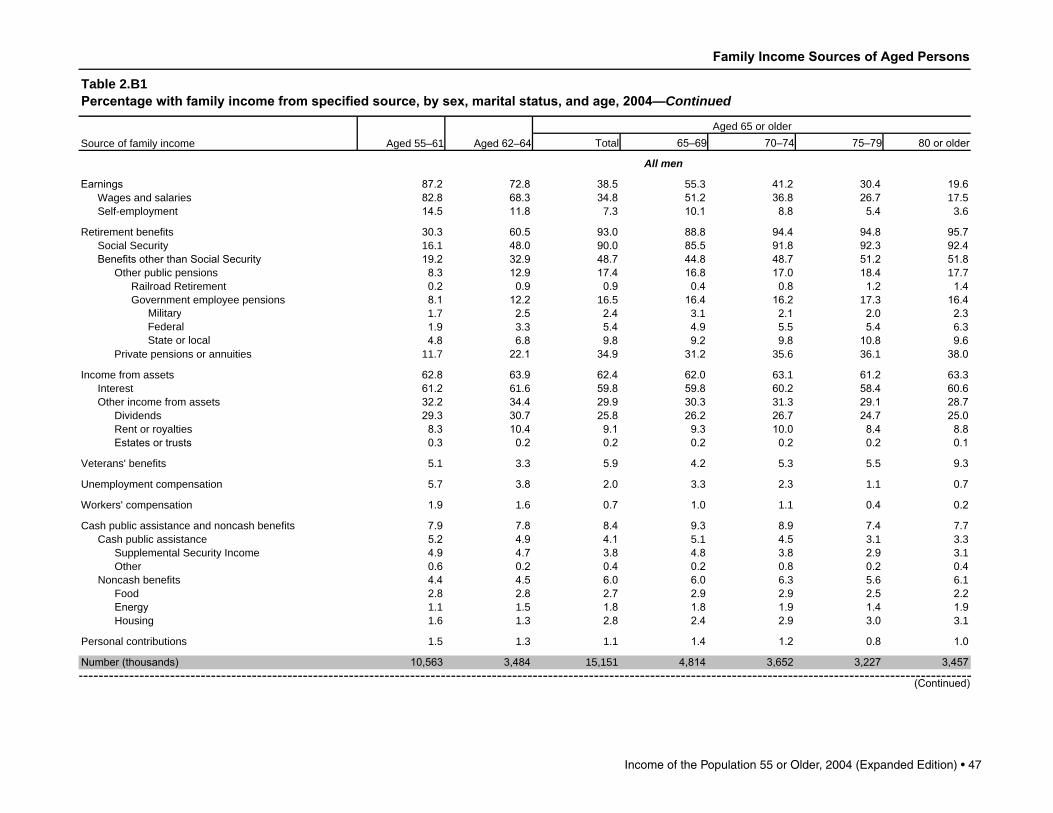
Family Income Sources of Aged Persons
Table 2.B1Percentage with family income from specified source, by sex, marital status, and age, 2004—Continued
Source of family income Aged 55–61 Aged62–64Aged 65 or older
Total 65–69 70–74 75–79 80orolder
All men
Earnings 87.2 72.8 38.5 55 3 41.2 30.4 19.6Wages and salaries 82.8 68.3 34.8 51.2 36.8 26.7 17 5Self-employment 14.5 11.8 7 3 10.1 8.8 5.4 3 6
Retirement benefits 30.3 60.5 93.0 88.8 94.4 94.8 95.7Social Security 16 1 48.0 90.0 85.5 91.8 92.3 92.4BenefitsotherthanSocialSecurity 19.2 32.9 48.7 44.8 48.7 51.2 51.8
Other public pensions 8.3 12.9 17.4 16.8 17.0 18.4 17 7Railroad Retirement 0.2 0.9 0.9 0.4 0.8 1.2 1.4Government employee pensions 8.1 12.2 16 5 16.4 16.2 17 3 16.4
Military 1 7 2.5 2.4 3 1 2.1 2.0 2.3Federal 1.9 3 3 5.4 4.9 5 5 5.4 6 3State or local 4.8 6.8 9.8 9.2 9.8 10.8 9.6
Private pensions or annuities 11 7 22.1 34.9 31.2 35 6 36 1 38.0
Income from assets 62.8 63.9 62.4 62.0 63 1 61.2 63 3Interest 61.2 61 6 59.8 59.8 60.2 58.4 60.6Other income from assets 32.2 34.4 29.9 30.3 31 3 29.1 28.7
Dividends 29.3 30.7 25.8 26.2 26.7 24.7 25.0Rent or royalties 8.3 10.4 9.1 9.3 10.0 8.4 8.8Estatesortrusts 0.3 0.2 0.2 0.2 0.2 0.2 0.1
Veterans' benefits 5 1 3 3 5.9 4.2 5 3 5 5 9.3
Unemployment compensation 5 7 3.8 2.0 3 3 2.3 1 1 0.7
Workers' compensation 1.9 1 6 0.7 1.0 1 1 0.4 0.2
Cash public assistance and noncash benefits 7.9 7.8 8.4 9.3 8.9 7.4 7 7Cash public assistance 5.2 4.9 4.1 5 1 4.5 3 1 3 3
Supplemental Security Income 4.9 4.7 3.8 4.8 3.8 2.9 3 1Other 0.6 0.2 0.4 0.2 0.8 0.2 0.4
Noncash benefits 4.4 4.5 6.0 6.0 6 3 5 6 6 1Food 2.8 2.8 2.7 2.9 2.9 2.5 2.2Energy 1 1 1 5 1.8 1.8 1.9 1.4 1.9Housing 1 6 1 3 2.8 2.4 2.9 3.0 3 1
Personal contributions 1 5 1 3 1 1 1.4 1.2 0.8 1.0
Number(thousands) 10,563 3,484 15,151 4,814 3,652 3,227 3,457
(Continued)
48 • Income of the Population 55 or Older, 2004 (Expanded Edition)
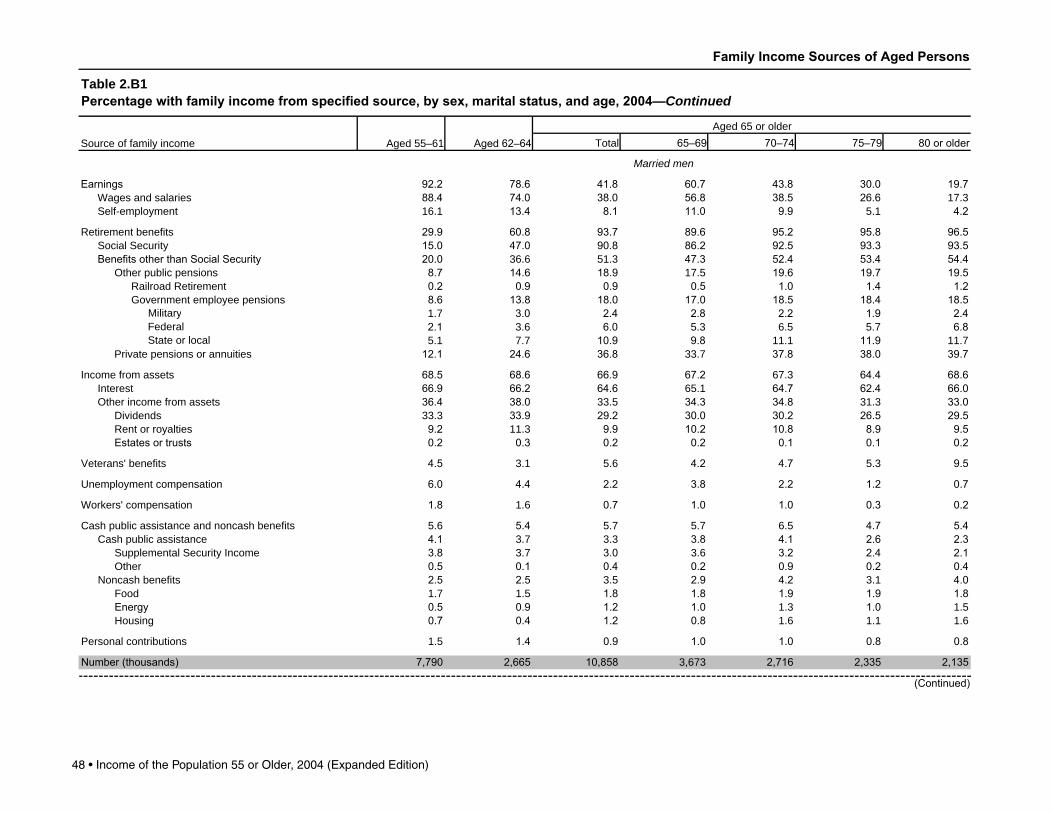
Family Income Sources of Aged Persons
Table 2.B1Percentage with family income from specified source, by sex, marital status, and age, 2004—Continued
Source of family income Aged 55–61 Aged62–64Aged 65 or older
Total 65–69 70–74 75–79 80orolder
Married men
Earnings 92.2 78.6 41.8 60.7 43.8 30.0 19.7Wages and salaries 88.4 74.0 38.0 56.8 38.5 26.6 17 3Self-employment 16 1 13.4 8.1 11.0 9.9 5 1 4.2
Retirement benefits 29.9 60.8 93.7 89.6 95.2 95.8 96.5Social Security 15.0 47.0 90.8 86.2 92.5 93.3 93.5BenefitsotherthanSocialSecurity 20.0 36 6 51 3 47.3 52.4 53.4 54.4
Other public pensions 8.7 14.6 18.9 17 5 19.6 19.7 19.5Railroad Retirement 0.2 0.9 0.9 0.5 1.0 1.4 1.2Government employee pensions 8.6 13.8 18.0 17.0 18.5 18.4 18.5
Military 1 7 3.0 2.4 2.8 2.2 1.9 2.4Federal 2.1 3 6 6.0 5 3 6 5 5 7 6.8State or local 5 1 7 7 10.9 9.8 11 1 11.9 11 7
Private pensions or annuities 12.1 24.6 36.8 33 7 37.8 38.0 39.7
Income from assets 68.5 68.6 66.9 67.2 67 3 64.4 68.6Interest 66.9 66.2 64.6 65 1 64.7 62.4 66.0Other income from assets 36.4 38.0 33 5 34.3 34.8 31 3 33.0
Dividends 33 3 33.9 29.2 30.0 30.2 26.5 29.5Rent or royalties 9.2 11 3 9.9 10.2 10.8 8.9 9.5Estatesortrusts 0.2 0.3 0.2 0.2 0.1 0.1 0.2
Veterans' benefits 4.5 3 1 5 6 4.2 4.7 5 3 9.5
Unemployment compensation 6.0 4.4 2.2 3.8 2.2 1.2 0.7
Workers' compensation 1.8 1 6 0.7 1.0 1.0 0.3 0.2
Cash public assistance and noncash benefits 5 6 5.4 5 7 5 7 6 5 4.7 5.4Cash public assistance 4.1 3 7 3 3 3.8 4.1 2.6 2.3
Supplemental Security Income 3.8 3 7 3.0 3 6 3.2 2.4 2.1Other 0.5 0.1 0.4 0.2 0.9 0.2 0.4
Noncash benefits 2.5 2.5 3 5 2.9 4.2 3 1 4.0Food 1 7 1 5 1.8 1.8 1.9 1.9 1.8Energy 0.5 0.9 1.2 1.0 1 3 1.0 1 5Housing 0.7 0.4 1.2 0.8 1 6 1 1 1 6
Personal contributions 1 5 1.4 0.9 1.0 1.0 0.8 0.8
Number(thousands) 7,790 2,665 10,858 3,673 2,716 2,335 2,135
(Continued)

Income of the Population 55 or Older, 2004 (Expanded Edition) • 49
Family Income Sources of Aged Persons
Table 2.B1Percentage with family income from specified source, by sex, marital status, and age, 2004—Continued
Source of family income Aged 55–61 Aged62–64Aged 65 or older
Total 65–69 70–74 75–79 80orolder
Nonmarried men
Earnings 73.2 53 6 30.0 38.1 34.0 31 3 19.4Wages and salaries 66.8 49.8 26.8 33 1 31 6 26.9 17.8Self-employment 9.8 6.9 5.2 7 1 5 7 6 1 2.5
Retirement benefits 31.4 59.5 91.2 85.9 92.0 92.2 94.4Social Security 19.3 51.2 88.2 83.1 89.7 89.6 90.5BenefitsotherthanSocialSecurity 16.8 21.1 42.2 36.9 38.0 45.3 47.7
Other public pensions 7 1 7 5 13 7 14.7 9.5 15.2 14.7Railroad Retirement 0.2 0.5 0.9 0.3 0.2 0.8 1.8Government employee pensions 6.9 6.9 12.9 14.4 9.4 14.4 13 1
Military 1 5 0.9 2.5 3.9 1 6 2.4 2.1Federal 1.4 2.4 4.1 3 5 2.5 4.6 5.4State or local 4.1 3 7 6.9 7 6 6.0 7.9 6.2
Private pensions or annuities 10.5 14.3 29.9 23.3 29.2 31 1 35.2
Income from assets 46.9 48.7 50.9 45.3 50.9 52.7 54.7Interest 45.0 46.6 47.6 42.7 47.2 48.0 52.0Other income from assets 20.6 22.5 20.8 17 6 21.1 23.2 21.7
Dividends 17.9 20.2 17 1 14.2 16.8 20.2 17 7Rent or royalties 6.0 7 5 7.2 6.4 7.4 7 1 7 6Estatesortrusts 0.6 0.1 0.2 0.1 0.3 0.4 0
Veterans' benefits 6 7 3 6 6 7 4.4 7 1 5.9 9.0
Unemployment compensation 4.8 2.0 1 5 1.8 2.6 1.0 0.8
Workers' compensation 2.2 1 6 0.8 0.9 1.2 0.8 0.3
Cash public assistance and noncash benefits 14.3 15.4 15.4 20.7 15 7 14.5 11.4Cash public assistance 8.5 8.7 6 1 9.1 5.8 4.4 4.9
Supplemental Security Income 7.9 8.2 5.9 8.8 5 5 4.3 4.7Other 0.9 0.6 0.3 0.3 0.3 0.3 0.4
Noncash benefits 9.8 11.2 12.3 15.8 12.2 12.2 9.4Food 5 7 6.8 4.7 6 6 5.9 4.0 2.8Energy 2.7 3 3 3 3 4.6 3 5 2.3 2.7Housing 4.1 4.3 6 7 7 5 6 6 7.9 5.4
Personal contributions 1 5 1.0 1 7 2.8 1 7 1.0 1.2
Number(thousands) 2,773 819 4,292 1,141 936 892 1,323
(Continued)
50 • Income of the Population 55 or Older, 2004 (Expanded Edition)
Family Income Sources of Aged Persons
Table 2.B1Percentage with family income from specified source, by sex, marital status, and age, 2004—Continued
Source of family income Aged 55–61 Aged62–64Aged 65 or older
Total 65–69 70–74 75–79 80orolder
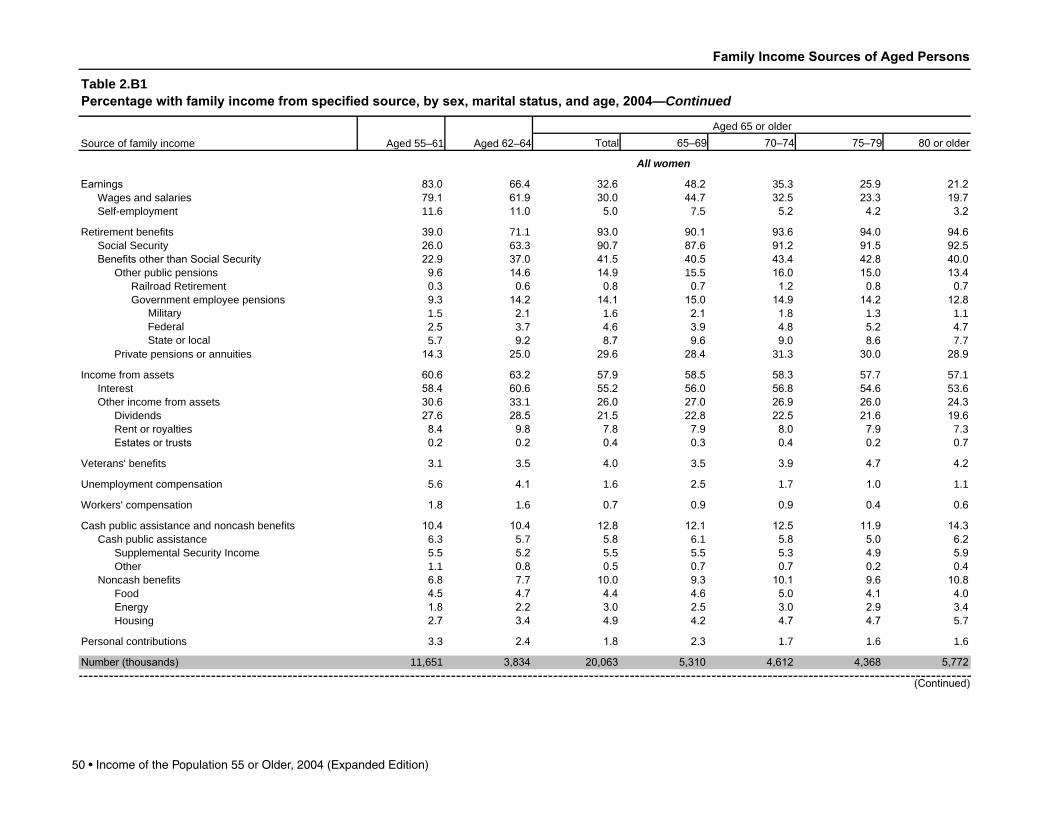
All women
Earnings 83.0 66.4 32.6 48.2 35 3 25.9 21.2Wages and salaries 79.1 61.9 30.0 44.7 32.5 23.3 19.7Self-employment 11 6 11.0 5.0 7 5 5.2 4.2 3.2
Retirement benefits 39.0 71 1 93.0 90.1 93.6 94.0 94.6Social Security 26.0 63 3 90.7 87.6 91.2 91.5 92.5BenefitsotherthanSocialSecurity 22.9 37.0 41.5 40.5 43.4 42.8 40.0
Other public pensions 9.6 14.6 14.9 15 5 16.0 15.0 13.4Railroad Retirement 0.3 0.6 0.8 0.7 1.2 0.8 0.7Government employee pensions 9.3 14.2 14.1 15.0 14.9 14.2 12.8
Military 1 5 2.1 1 6 2.1 1.8 1 3 1 1Federal 2.5 3 7 4.6 3.9 4.8 5.2 4.7State or local 5 7 9.2 8.7 9.6 9.0 8.6 7 7
Private pensions or annuities 14.3 25.0 29.6 28.4 31 3 30.0 28.9
Income from assets 60.6 63.2 57.9 58.5 58.3 57 7 57 1Interest 58.4 60.6 55.2 56.0 56.8 54.6 53 6Other income from assets 30.6 33 1 26.0 27.0 26.9 26.0 24.3
Dividends 27.6 28.5 21.5 22.8 22.5 21.6 19.6Rent or royalties 8.4 9.8 7.8 7.9 8.0 7.9 7 3Estatesortrusts 0.2 0.2 0.4 0.3 0.4 0.2 0.7
Veterans' benefits 3 1 3 5 4.0 3 5 3.9 4.7 4.2
Unemployment compensation 5 6 4.1 1 6 2.5 1 7 1.0 1 1
Workers' compensation 1.8 1 6 0.7 0.9 0.9 0.4 0.6
Cash public assistance and noncash benefits 10.4 10.4 12.8 12.1 12.5 11.9 14.3Cash public assistance 6 3 5 7 5.8 6 1 5.8 5.0 6.2
Supplemental Security Income 5 5 5.2 5 5 5 5 5 3 4.9 5.9Other 1 1 0.8 0.5 0.7 0.7 0.2 0.4
Noncash benefits 6.8 7 7 10.0 9.3 10.1 9.6 10.8Food 4.5 4.7 4.4 4.6 5.0 4.1 4.0Energy 1.8 2.2 3.0 2.5 3.0 2.9 3.4Housing 2.7 3.4 4.9 4.2 4.7 4.7 5 7
Personal contributions 3 3 2.4 1.8 2.3 1 7 1 6 1 6
Number(thousands) 11,651 3,834 20,063 5,310 4,612 4,368 5,772
(Continued)
Income of the Population 55 or Older, 2004 (Expanded Edition) • 51
Family Income Sources of Aged Persons
Table 2.B1Percentage with family income from specified source, by sex, marital status, and age, 2004—Continued
Source of family income Aged 55–61 Aged62–64Aged 65 or older
Total 65–69 70–74 75–79 80orolder
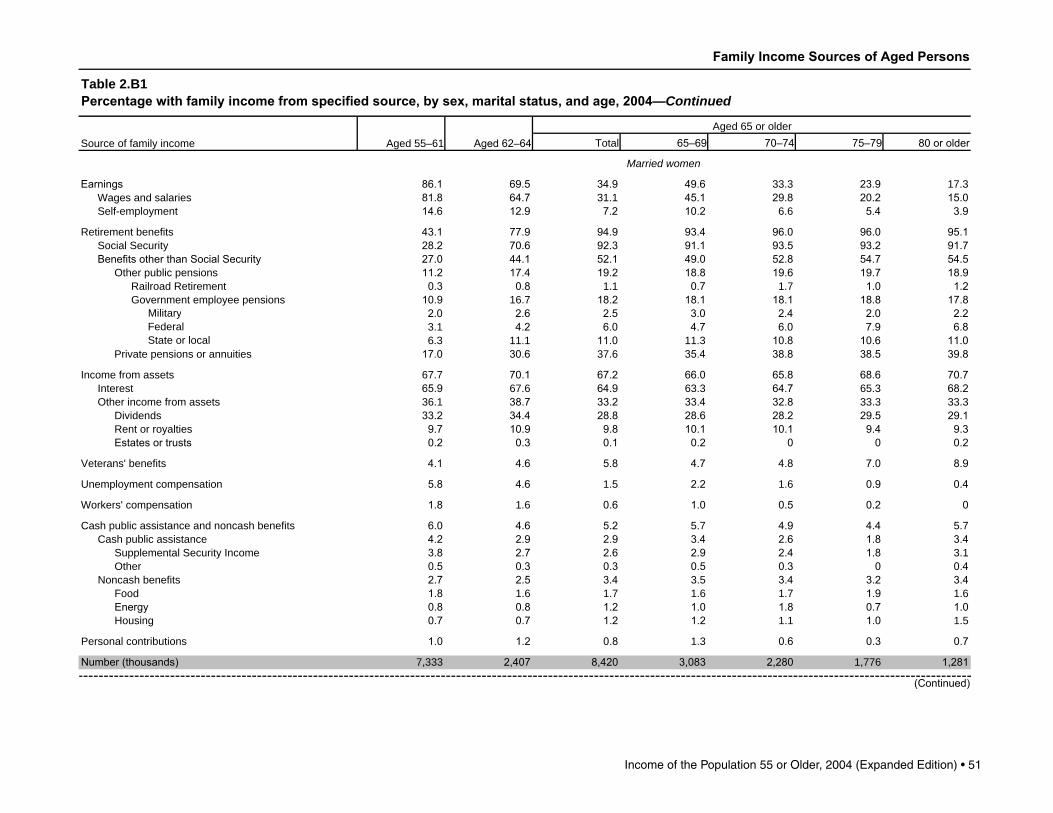
Married women
Earnings 86.1 69.5 34.9 49.6 33 3 23.9 17 3Wages and salaries 81.8 64.7 31 1 45.1 29.8 20.2 15.0Self-employment 14.6 12.9 7.2 10.2 6 6 5.4 3.9
Retirement benefits 43.1 77.9 94.9 93.4 96.0 96.0 95.1Social Security 28.2 70.6 92.3 91.1 93.5 93.2 91.7BenefitsotherthanSocialSecurity 27.0 44.1 52.1 49.0 52.8 54.7 54.5
Other public pensions 11.2 17.4 19.2 18.8 19.6 19.7 18.9Railroad Retirement 0.3 0.8 1 1 0.7 1 7 1.0 1.2Government employee pensions 10.9 16 7 18.2 18.1 18.1 18.8 17.8
Military 2.0 2.6 2.5 3.0 2.4 2.0 2.2Federal 3 1 4.2 6.0 4.7 6.0 7.9 6.8State or local 6 3 11 1 11.0 11 3 10.8 10.6 11.0
Private pensions or annuities 17.0 30.6 37 6 35.4 38.8 38.5 39.8
Income from assets 67 7 70.1 67.2 66.0 65.8 68.6 70.7Interest 65.9 67 6 64.9 63 3 64.7 65 3 68.2Other income from assets 36 1 38.7 33.2 33.4 32.8 33 3 33 3
Dividends 33.2 34.4 28.8 28.6 28.2 29.5 29.1Rent or royalties 9.7 10.9 9.8 10.1 10.1 9.4 9.3Estatesortrusts 0.2 0.3 0.1 0.2 0 0 0.2
Veterans' benefits 4.1 4.6 5.8 4.7 4.8 7.0 8.9
Unemployment compensation 5.8 4.6 1 5 2.2 1 6 0.9 0.4
Workers' compensation 1.8 1 6 0.6 1.0 0.5 0.2 0
Cash public assistance and noncash benefits 6.0 4.6 5.2 5 7 4.9 4.4 5 7Cash public assistance 4.2 2.9 2.9 3.4 2.6 1.8 3.4
Supplemental Security Income 3.8 2.7 2.6 2.9 2.4 1.8 3 1Other 0.5 0.3 0.3 0.5 0.3 0 0.4
Noncash benefits 2.7 2.5 3.4 3 5 3.4 3.2 3.4Food 1.8 1 6 1 7 1 6 1 7 1.9 1 6Energy 0.8 0.8 1.2 1.0 1.8 0.7 1.0Housing 0.7 0.7 1.2 1.2 1 1 1.0 1 5
Personal contributions 1.0 1.2 0.8 1 3 0.6 0.3 0.7
Number(thousands) 7,333 2,407 8,420 3,083 2,280 1,776 1,281
(Continued)

52 • Income of the Population 55 or Older, 2004 (Expanded Edition)
Family Income Sources of Aged Persons
Table 2.B1Percentage with family income from specified source, by sex, marital status, and age, 2004—Continued
Source of family income Aged 55–61 Aged62–64Aged 65 or older
Total 65–69 70–74 75–79 80orolder
Nonmarried women
Earnings 77 7 61.0 31.0 46.3 37 3 27.3 22.3Wages and salaries 74.5 57.2 29.3 44.2 35 1 25.5 21.0Self-employment 6 3 7 7 3.4 3.8 3.8 3.4 3.0
Retirement benefits 32.0 59.8 91.7 85.4 91.2 92.6 94.5Social Security 22.3 51.0 89.5 82.9 88.9 90.4 92.7BenefitsotherthanSocialSecurity 15.8 24.8 33.9 28.7 34.3 34.7 35.9
Other public pensions 6 7 9.9 11.8 11.0 12.4 11 7 11.9Railroad Retirement 0.2 0.2 0.6 0.6 0.7 0.7 0.6Government employee pensions 6 5 9.8 11.2 10.6 11 7 11.0 11.4
Military 0.5 1 1 0.9 0.8 1 1 0.9 0.8Federal 1.4 2.9 3 5 2.7 3 6 3 3 4.1State or local 4.7 5.9 7 1 7 3 7 3 7.2 6 7
Private pensions or annuities 9.8 15 6 23.7 18.6 23.9 24.3 25.8
Income from assets 48.5 51 5 51 1 48.2 50.9 50.2 53 3Interest 45.6 48.8 48.2 45.8 49.1 47.3 49.4Other income from assets 21.3 23.6 20.7 18.1 21.0 21.1 21.7
Dividends 18.1 18.5 16 3 14.6 16.9 16 3 16.8Rent or royalties 6 1 7.9 6 3 5.0 6.0 7.0 6.8Estatesortrusts 0.1 0 0.7 0.6 0.7 0.3 0.9
Veterans' benefits 1 6 1.4 2.7 1.8 2.9 3 1 2.9
Unemployment compensation 5 3 3 3 1 6 2.8 1 7 1.0 1 3
Workers' compensation 1.9 1 6 0.8 0.9 1.2 0.6 0.7
Cash public assistance and noncash benefits 18.0 20.2 18.3 20.9 20.0 17 1 16.8Cash public assistance 9.8 10.4 7.9 9.8 8.8 7 1 6.9
Supplemental Security Income 8.4 9.3 7 5 9.2 8.1 7.0 6 7Other 2.0 1 6 0.6 1.0 1.0 0.4 0.3
Noncash benefits 13.8 16.4 14.7 17 3 16 5 14.0 13.0Food 9.1 10.0 6.4 8.8 8.2 5 6 4.6Energy 3.4 4.5 4.3 4.7 4.1 4.5 4.1Housing 6 1 7.9 7 5 8.4 8.3 7.2 6.8
Personal contributions 7 3 4.5 2.6 3.9 2.9 2.5 1.8
Number(thousands) 4,317 1,427 11,643 2,227 2,332 2,592 4,492
Income of the Population 55 or Older, 2004 (Expanded Edition) • 53
55–61 62–64 65 or older 55–61 62–64 65 or older 55–61 62–64 65 or older
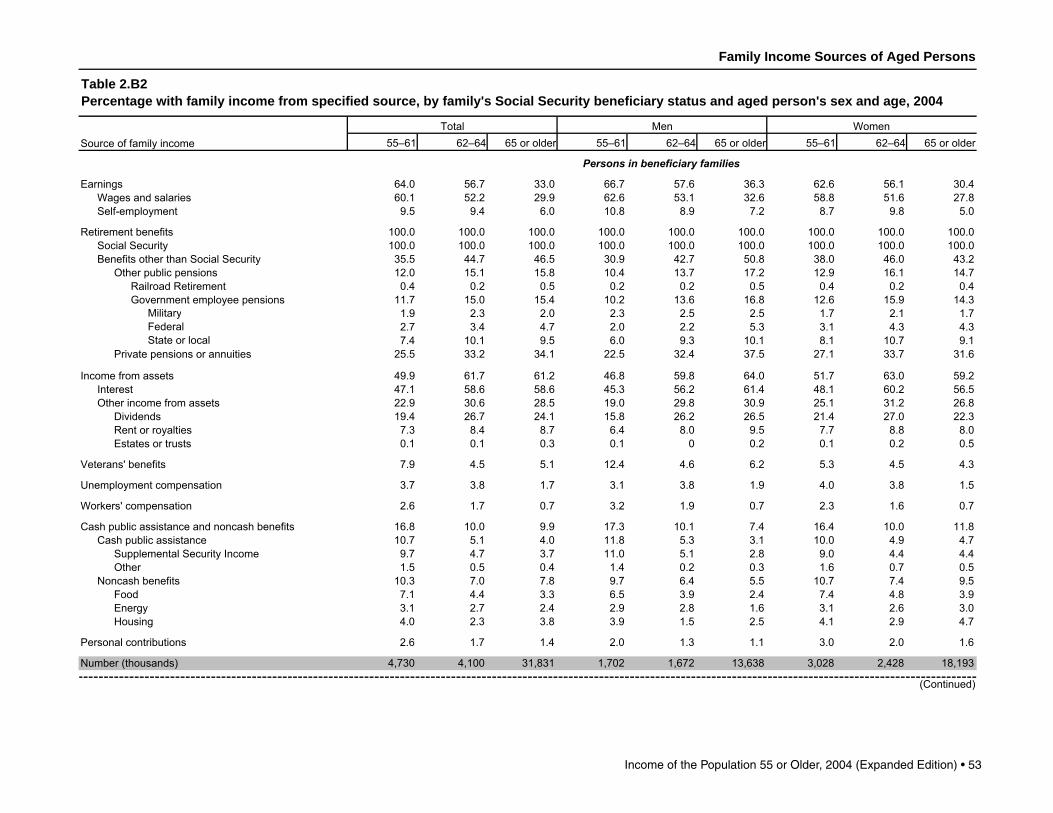
64.0 56.7 33.0 66.7 57.6 36.3 62.6 56.1 30.460.1 52.2 29.9 62.6 53.1 32.6 58.8 51.6 27.89.5 9.4 6.0 10.8 8.9 7.2 8.7 9.8 5.0
100.0 100.0 100.0 100.0 100.0 100.0 100.0 100.0 100.0100.0 100.0 100.0 100.0 100.0 100.0 100.0 100.0 100.035.5 44.7 46.5 30.9 42.7 50.8 38.0 46.0 43.212.0 15.1 15.8 10.4 13.7 17.2 12.9 16.1 14.70.4 0.2 0.5 0.2 0.2 0.5 0.4 0.2 0.4
11.7 15.0 15.4 10.2 13.6 16.8 12.6 15.9 14.3Military 1.9 2.3 2.0 2.3 2.5 2.5 1.7 2.1 1.7Federal 2.7 3.4 4.7 2.0 2.2 5.3 3.1 4.3 4.3State or local 7.4 10.1 9.5 6.0 9.3 10.1 8.1 10.7 9.1
25.5 33.2 34.1 22.5 32.4 37.5 27.1 33.7 31.6
49.9 61.7 61.2 46.8 59.8 64.0 51.7 63.0 59.247.1 58.6 58.6 45.3 56.2 61.4 48.1 60.2 56.522.9 30.6 28.5 19.0 29.8 30.9 25.1 31.2 26.819.4 26.7 24.1 15.8 26.2 26.5 21.4 27.0 22.37.3 8.4 8.7 6.4 8.0 9.5 7.7 8.8 8.00.1 0.1 0.3 0.1 0 0.2 0.1 0.2 0.5
7.9 4.5 5.1 12.4 4.6 6.2 5.3 4.5 4.3
3.7 3.8 1.7 3.1 3.8 1.9 4.0 3.8 1.5
2.6 1.7 0.7 3.2 1.9 0.7 2.3 1.6 0.7
16.8 10.0 9.9 17.3 10.1 7.4 16.4 10.0 11.810.7 5.1 4.0 11.8 5.3 3.1 10.0 4.9 4.79.7 4.7 3.7 11.0 5.1 2.8 9.0 4.4 4.41.5 0.5 0.4 1.4 0.2 0.3 1.6 0.7 0.5
10.3 7.0 7.8 9.7 6.4 5.5 10.7 7.4 9.57.1 4.4 3.3 6.5 3.9 2.4 7.4 4.8 3.93.1 2.7 2.4 2.9 2.8 1.6 3.1 2.6 3.04.0 2.3 3.8 3.9 1.5 2.5 4.1 2.9 4.7
2.6 1.7 1.4 2.0 1.3 1.1 3.0 2.0 1.6
4,730 4,100 31,831 1,702 1,672 13,638 3,028 2,428 18,193
(Continued)
Total Men Women
Wages and salariesSelf-employment
Persons in beneficiary families
Source of family income
Earnings
Social SecurityBenefits other than Social Security
Income from assets
Retirement benefits
Other public pensionsRailroad RetirementGovernment employee pensions
Private pensions or annuities
Unemployment compensation
Workers' compensation
InterestOther income from assets
DividendsRent or royaltiesEstates or trusts
Veterans' benefits
Number (thousands)
Personal contributions
HousingEnergyFood
Noncash benefitsOther
Cash public assistance and noncash benefitsCash public assistance
Supplemental Security Income
Family Income Sources of Aged Persons
Table 2.B2Percentage with family income from specified source, by family's Social Security beneficiary status and aged person's sex and age, 2004
54 • Income of the Population 55 or Older, 2004 (Expanded Edition)
55–61 62–64 65 or older 55–61 62–64 65 or older 55–61 62–64 65 or older
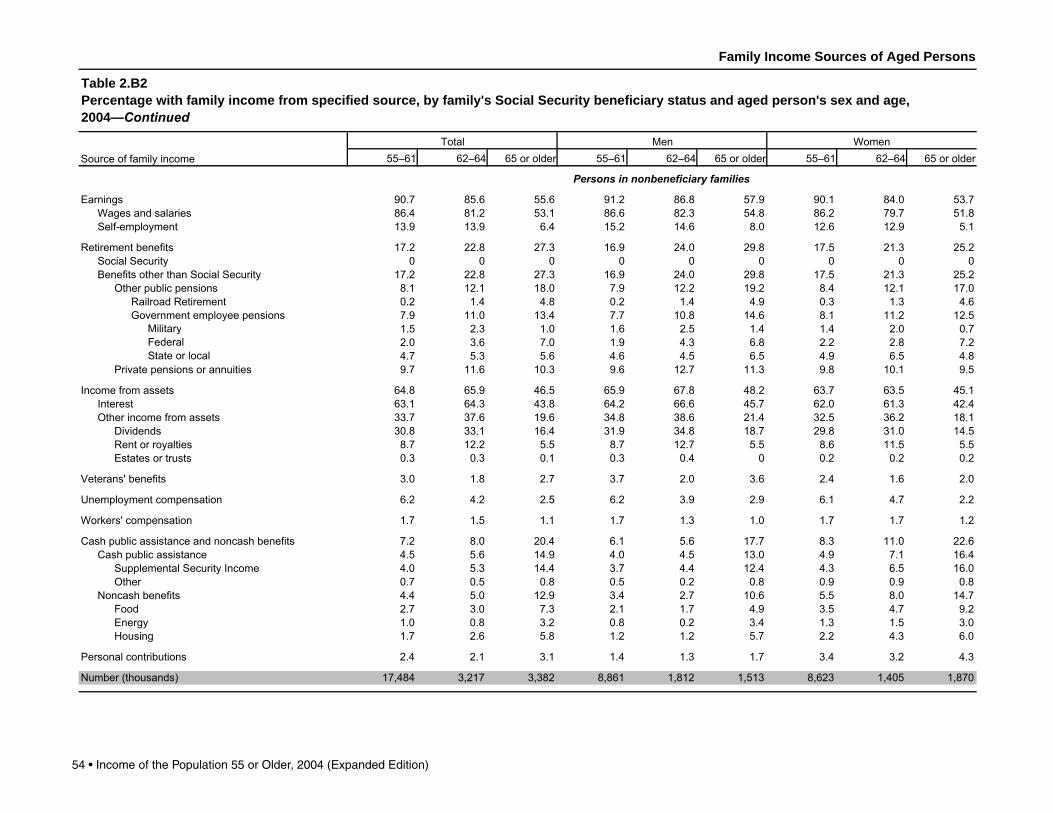
90.7 85.6 55.6 91.2 86.8 57.9 90.1 84.0 53.786.4 81.2 53.1 86.6 82.3 54.8 86.2 79.7 51.813.9 13.9 6.4 15.2 14.6 8.0 12.6 12.9 5.1
17.2 22.8 27.3 16.9 24.0 29.8 17.5 21.3 25.20 0 0 0 0 0 0 0 0
17.2 22.8 27.3 16.9 24.0 29.8 17.5 21.3 25.28.1 12.1 18.0 7.9 12.2 19.2 8.4 12.1 17.00.2 1.4 4.8 0.2 1.4 4.9 0.3 1.3 4.67.9 11.0 13.4 7.7 10.8 14.6 8.1 11.2 12.5
Military 1.5 2.3 1.0 1.6 2.5 1.4 1.4 2.0 0.7Federal 2.0 3.6 7.0 1.9 4.3 6.8 2.2 2.8 7.2State or local 4.7 5.3 5.6 4.6 4.5 6.5 4.9 6.5 4.8
9.7 11.6 10.3 9.6 12.7 11.3 9.8 10.1 9.5
64.8 65.9 46.5 65.9 67.8 48.2 63.7 63.5 45.163.1 64.3 43.8 64.2 66.6 45.7 62.0 61.3 42.433.7 37.6 19.6 34.8 38.6 21.4 32.5 36.2 18.130.8 33.1 16.4 31.9 34.8 18.7 29.8 31.0 14.58.7 12.2 5.5 8.7 12.7 5.5 8.6 11.5 5.50.3 0.3 0.1 0.3 0.4 0 0.2 0.2 0.2
3.0 1.8 2.7 3.7 2.0 3.6 2.4 1.6 2.0
6.2 4.2 2.5 6.2 3.9 2.9 6.1 4.7 2.2
1.7 1.5 1.1 1.7 1.3 1.0 1.7 1.7 1.2
7.2 8.0 20.4 6.1 5.6 17.7 8.3 11.0 22.64.5 5.6 14.9 4.0 4.5 13.0 4.9 7.1 16.44.0 5.3 14.4 3.7 4.4 12.4 4.3 6.5 16.00.7 0.5 0.8 0.5 0.2 0.8 0.9 0.9 0.84.4 5.0 12.9 3.4 2.7 10.6 5.5 8.0 14.72.7 3.0 7.3 2.1 1.7 4.9 3.5 4.7 9.21.0 0.8 3.2 0.8 0.2 3.4 1.3 1.5 3.01.7 2.6 5.8 1.2 1.2 5.7 2.2 4.3 6.0
2.4 2.1 3.1 1.4 1.3 1.7 3.4 3.2 4.3
17,484 3,217 3,382 8,861 1,812 1,513 8,623 1,405 1,870
Family Income Sources of Aged Persons
Table 2.B2Percentage with family income from specified source, by family's Social Security beneficiary status and aged person's sex and age, 2004—Continued
Source of family incomeTotal Men Women
Persons in nonbeneficiary families
EarningsWages and salariesSelf-employment
Retirement benefitsSocial SecurityBenefits other than Social Security
Other public pensionsRailroad RetirementGovernment employee pensions
Private pensions or annuities
Income from assetsInterestOther income from assets
DividendsRent or royalties
Supplemental Security IncomeOther
Estates or trusts
Veterans' benefits
Unemployment compensation
Workers' compensation
Personal contributions
Number (thousands)
Noncash benefitsFoodEnergyHousing
Cash public assistance and noncash benefitsCash public assistance
Income of the Population 55 or Older, 2004 (Expanded Edition) • 55
Family Income Sources of Aged Persons
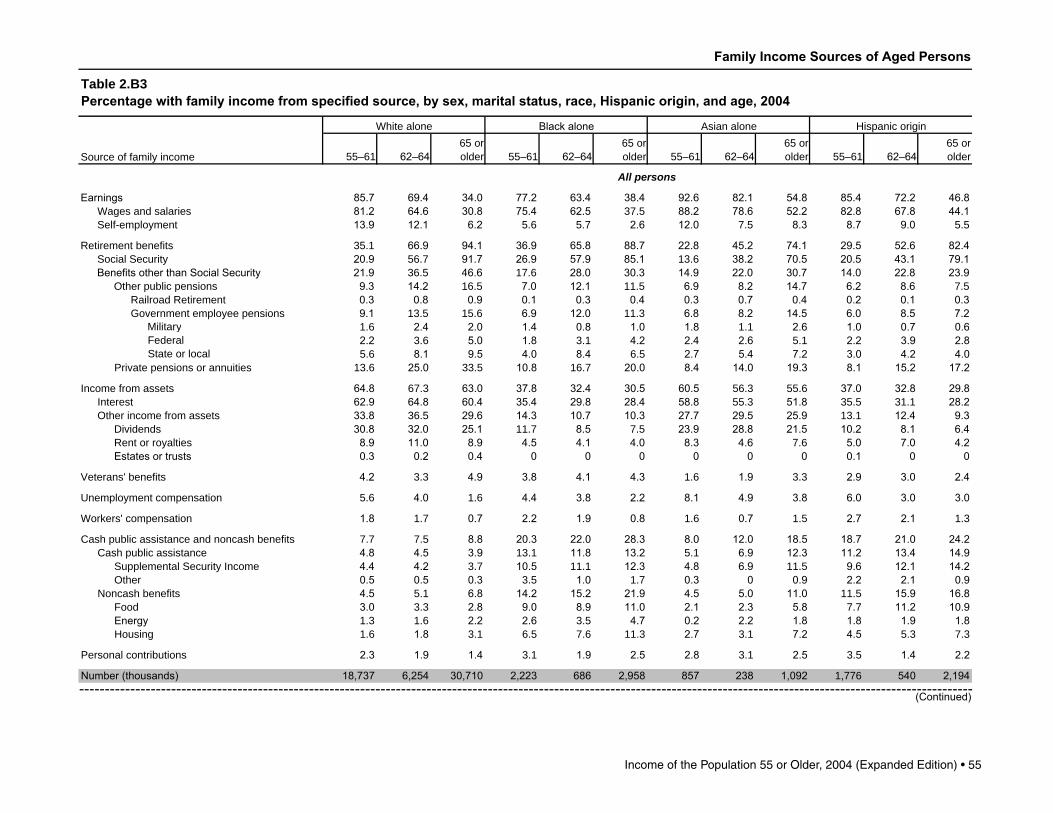
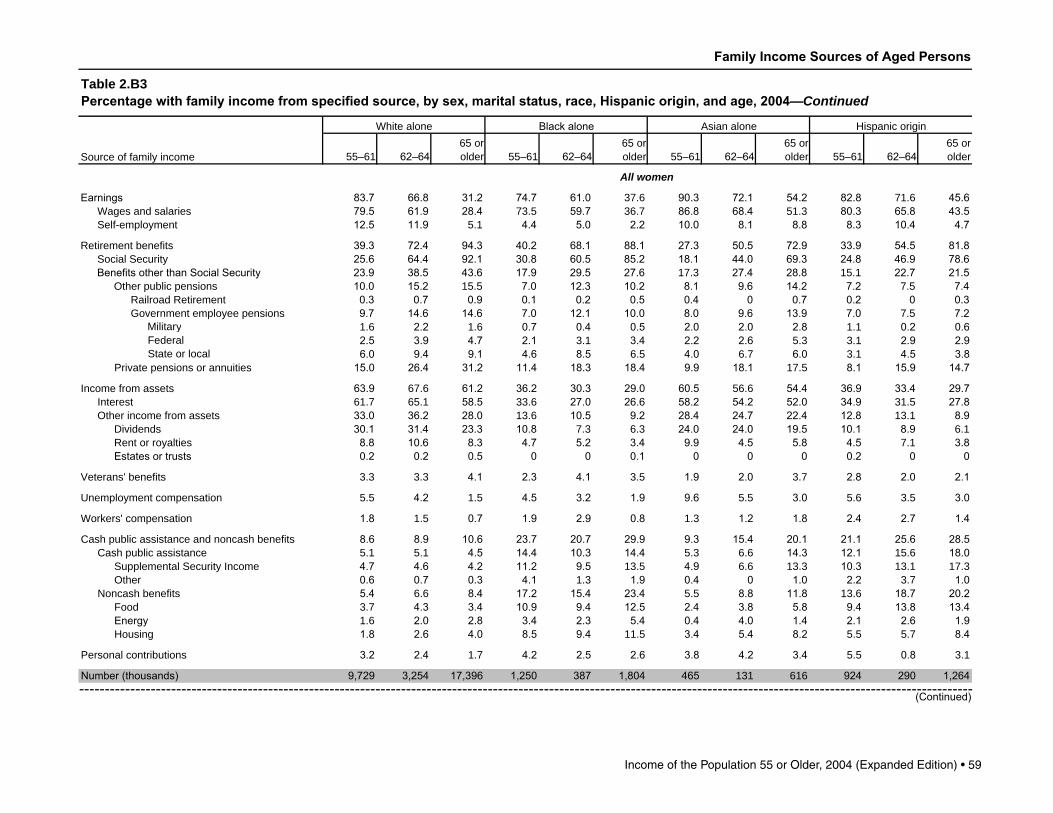
Table 2.B3Percentage with family income from specified source, by sex, marital status, race, Hispanic origin, and age, 2004
Source of family income
White alone Blackalone Asian alone Hispanic origin
55–61 62–6465 orolder 55–61 62–64
65 orolder 55–61 62–64
65 orolder 55–61 62–64
65 or older
All persons
Earnings 85.7 69.4 34.0 77.2 63.4 38.4 92.6 82.1 54.8 85.4 72.2 46.8Wages and salaries 81.2 64.6 30.8 75.4 62.5 37 5 88.2 78.6 52.2 82.8 67.8 44.1Self-employment 13.9 12.1 6.2 5 6 5 7 2.6 12.0 7 5 8.3 8.7 9.0 5 5
Retirement benefits 35 1 66.9 94.1 36.9 65.8 88.7 22.8 45.2 74.1 29.5 52.6 82.4Social Security 20.9 56 7 91.7 26.9 57.9 85.1 13 6 38.2 70.5 20.5 43.1 79.1BenefitsotherthanSocialSecurity 21.9 36 5 46.6 17 6 28.0 30.3 14.9 22.0 30.7 14.0 22.8 23.9
Other public pensions 9.3 14.2 16 5 7.0 12.1 11 5 6.9 8.2 14.7 6.2 8.6 7 5Railroad Retirement 0.3 0.8 0.9 0.1 0.3 0.4 0.3 0.7 0.4 0.2 0.1 0.3Government employee pensions 9.1 13 5 15 6 6.9 12.0 11 3 6.8 8.2 14.5 6.0 8.5 7.2
Military 1 6 2.4 2.0 1.4 0.8 1.0 1.8 1 1 2.6 1.0 0.7 0.6Federal 2.2 3 6 5.0 1.8 3 1 4.2 2.4 2.6 5 1 2.2 3.9 2.8State or local 5 6 8.1 9.5 4.0 8.4 6 5 2.7 5.4 7.2 3.0 4.2 4.0
Private pensions or annuities 13 6 25.0 33 5 10.8 16 7 20.0 8.4 14.0 19.3 8.1 15.2 17.2
Income from assets 64.8 67 3 63.0 37.8 32.4 30.5 60.5 56 3 55 6 37.0 32.8 29.8Interest 62.9 64.8 60.4 35.4 29.8 28.4 58.8 55 3 51.8 35 5 31 1 28.2Other income from assets 33.8 36 5 29.6 14.3 10.7 10.3 27.7 29.5 25.9 13 1 12.4 9.3
Dividends 30.8 32.0 25.1 11 7 8.5 7 5 23.9 28.8 21.5 10.2 8.1 6.4Rent or royalties 8.9 11.0 8.9 4.5 4.1 4.0 8.3 4.6 7 6 5.0 7.0 4.2Estatesortrusts 0.3 0.2 0.4 0 0 0 0 0 0 0.1 0 0
Veterans' benefits 4.2 3 3 4.9 3.8 4.1 4.3 1 6 1.9 3 3 2.9 3.0 2.4
Unemployment compensation 5 6 4.0 1 6 4.4 3.8 2.2 8.1 4.9 3.8 6.0 3.0 3.0
Workers' compensation 1.8 1 7 0.7 2.2 1.9 0.8 1 6 0.7 1 5 2.7 2.1 1 3
Cash public assistance and noncash benefits 7 7 7 5 8.8 20.3 22.0 28.3 8.0 12.0 18.5 18.7 21.0 24.2Cash public assistance 4.8 4.5 3.9 13 1 11.8 13.2 5 1 6.9 12.3 11.2 13.4 14.9
Supplemental Security Income 4.4 4.2 3 7 10.5 11 1 12.3 4.8 6.9 11 5 9.6 12.1 14.2Other 0.5 0.5 0.3 3 5 1.0 1 7 0.3 0 0.9 2.2 2.1 0.9
Noncash benefits 4.5 5 1 6.8 14.2 15.2 21.9 4.5 5.0 11.0 11 5 15.9 16.8Food 3.0 3 3 2.8 9.0 8.9 11.0 2.1 2.3 5.8 7 7 11.2 10.9Energy 1 3 1 6 2.2 2.6 3 5 4.7 0.2 2.2 1.8 1.8 1.9 1.8Housing 1 6 1.8 3 1 6 5 7 6 11 3 2.7 3 1 7.2 4.5 5 3 7 3
Personal contributions 2.3 1.9 1.4 3 1 1.9 2.5 2.8 3 1 2.5 3 5 1.4 2.2
Number(thousands) 18,737 6,254 30,710 2,223 686 2,958 857 238 1,092 1,776 540 2,194
(Continued)
56 • Income of the Population 55 or Older, 2004 (Expanded Edition)
Family Income Sources of Aged Persons
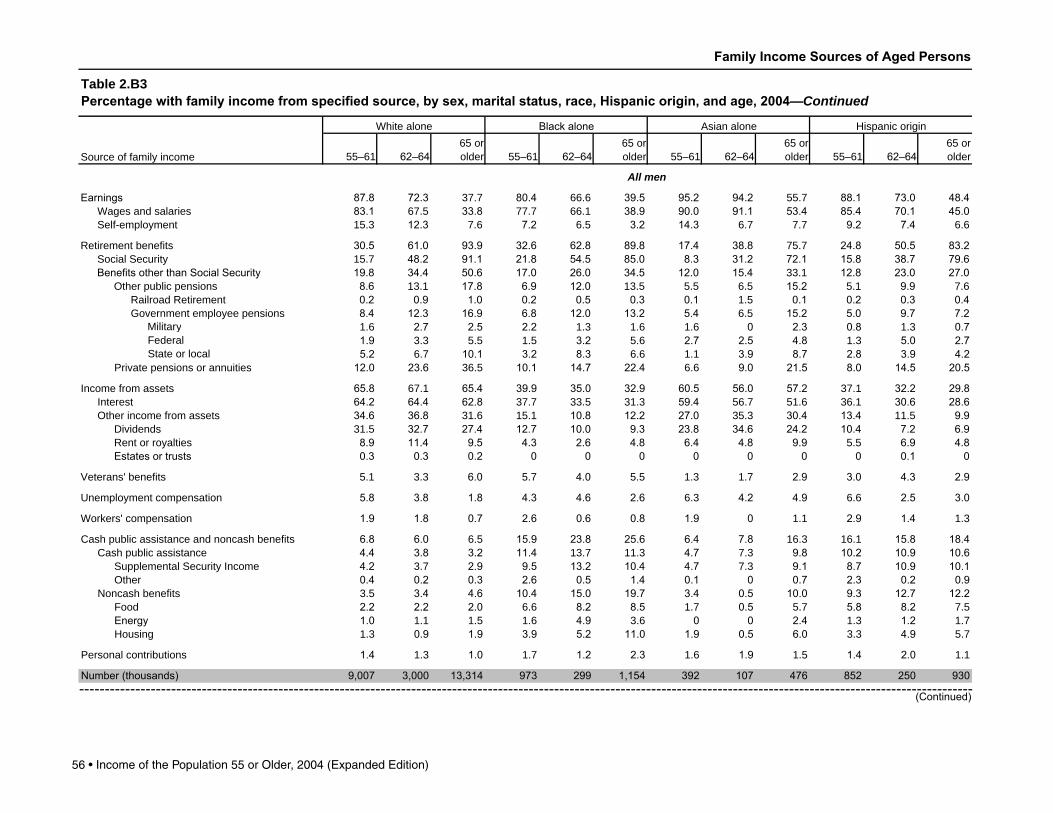
Table 2.B3Percentage with family income from specified source, by sex, marital status, race, Hispanic origin, and age, 2004—Continued
Source of family income
White alone Blackalone Asian alone Hispanic origin
55–61 62–6465 orolder 55–61 62–64
65 orolder 55–61 62–64
65 orolder 55–61 62–64
65 or older
All men
Earnings 87.8 72.3 37 7 80.4 66 6 39.5 95.2 94.2 55 7 88.1 73.0 48.4Wages and salaries 83.1 67 5 33.8 77 7 66 1 38.9 90.0 91.1 53.4 85.4 70.1 45.0Self-employment 15 3 12.3 7 6 7.2 6 5 3.2 14.3 6 7 7 7 9.2 7.4 6 6
Retirement benefits 30.5 61.0 93.9 32.6 62.8 89.8 17.4 38.8 75 7 24.8 50.5 83.2Social Security 15 7 48.2 91.1 21.8 54.5 85.0 8.3 31.2 72.1 15.8 38.7 79.6BenefitsotherthanSocialSecurity 19.8 34.4 50.6 17.0 26.0 34.5 12.0 15.4 33 1 12.8 23.0 27.0
Other public pensions 8.6 13 1 17.8 6.9 12.0 13 5 5 5 6 5 15.2 5 1 9.9 7 6Railroad Retirement 0.2 0.9 1.0 0.2 0.5 0.3 0.1 1 5 0.1 0.2 0.3 0.4Government employee pensions 8.4 12.3 16.9 6.8 12.0 13.2 5.4 6 5 15.2 5.0 9.7 7.2
Military 1 6 2.7 2.5 2.2 1 3 1 6 1 6 0 2.3 0.8 1 3 0.7Federal 1.9 3 3 5 5 1 5 3.2 5 6 2.7 2.5 4.8 1 3 5.0 2.7State or local 5.2 6 7 10.1 3.2 8.3 6 6 1 1 3.9 8.7 2.8 3.9 4.2
Private pensions or annuities 12.0 23.6 36 5 10.1 14.7 22.4 6 6 9.0 21.5 8.0 14.5 20.5
Income from assets 65.8 67 1 65.4 39.9 35.0 32.9 60.5 56.0 57.2 37 1 32.2 29.8Interest 64.2 64.4 62.8 37 7 33 5 31 3 59.4 56 7 51 6 36 1 30.6 28.6Other income from assets 34.6 36.8 31 6 15 1 10.8 12.2 27.0 35 3 30.4 13.4 11 5 9.9
Dividends 31 5 32.7 27.4 12.7 10.0 9.3 23.8 34.6 24.2 10.4 7.2 6.9Rent or royalties 8.9 11.4 9.5 4.3 2.6 4.8 6.4 4.8 9.9 5 5 6.9 4.8Estatesortrusts 0.3 0.3 0.2 0 0 0 0 0 0 0 0.1 0
Veterans' benefits 5 1 3 3 6.0 5 7 4.0 5 5 1 3 1 7 2.9 3.0 4.3 2.9
Unemployment compensation 5.8 3.8 1.8 4.3 4.6 2.6 6 3 4.2 4.9 6 6 2.5 3.0
Workers' compensation 1.9 1.8 0.7 2.6 0.6 0.8 1.9 0 1 1 2.9 1.4 1 3
Cash public assistance and noncash benefits 6.8 6.0 6 5 15.9 23.8 25.6 6.4 7.8 16 3 16 1 15.8 18.4Cash public assistance 4.4 3.8 3.2 11.4 13 7 11 3 4.7 7 3 9.8 10.2 10.9 10.6
Supplemental Security Income 4.2 3 7 2.9 9.5 13.2 10.4 4.7 7 3 9.1 8.7 10.9 10.1Other 0.4 0.2 0.3 2.6 0.5 1.4 0.1 0 0.7 2.3 0.2 0.9
Noncash benefits 3 5 3.4 4.6 10.4 15.0 19.7 3.4 0.5 10.0 9.3 12.7 12.2Food 2.2 2.2 2.0 6 6 8.2 8.5 1 7 0.5 5 7 5.8 8.2 7 5Energy 1.0 1 1 1 5 1 6 4.9 3 6 0 0 2.4 1 3 1.2 1 7Housing 1 3 0.9 1.9 3.9 5.2 11.0 1.9 0.5 6.0 3 3 4.9 5 7
Personal contributions 1.4 1 3 1.0 1 7 1.2 2.3 1 6 1.9 1 5 1.4 2.0 1 1
Number(thousands) 9,007 3,000 13,314 973 299 1,154 392 107 476 852 250 930
(Continued)
Income of the Population 55 or Older, 2004 (Expanded Edition) • 57
Family Income Sources of Aged Persons
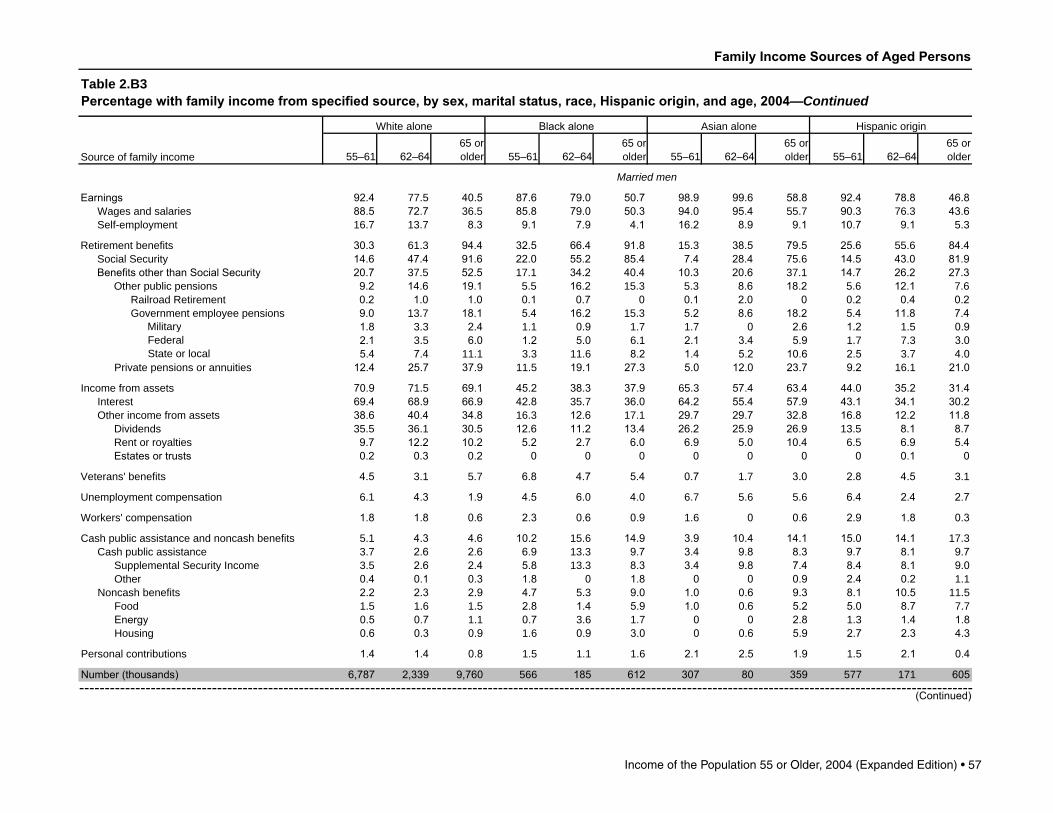
Table 2.B3Percentage with family income from specified source, by sex, marital status, race, Hispanic origin, and age, 2004—Continued
Source of family income
White alone Blackalone Asian alone Hispanic origin
55–61 62–6465 orolder 55–61 62–64
65 orolder 55–61 62–64
65 orolder 55–61 62–64
65 or older
Married men
Earnings 92.4 77 5 40.5 87.6 79.0 50.7 98.9 99.6 58.8 92.4 78.8 46.8Wages and salaries 88.5 72.7 36 5 85.8 79.0 50.3 94.0 95.4 55 7 90.3 76 3 43.6Self-employment 16 7 13 7 8.3 9.1 7.9 4.1 16.2 8.9 9.1 10.7 9.1 5 3
Retirement benefits 30.3 61 3 94.4 32.5 66.4 91.8 15 3 38.5 79.5 25.6 55 6 84.4Social Security 14.6 47.4 91.6 22.0 55.2 85.4 7.4 28.4 75 6 14.5 43.0 81.9BenefitsotherthanSocialSecurity 20.7 37 5 52.5 17 1 34.2 40.4 10.3 20.6 37 1 14.7 26.2 27.3
Other public pensions 9.2 14.6 19.1 5 5 16.2 15 3 5 3 8.6 18.2 5 6 12.1 7 6Railroad Retirement 0.2 1.0 1.0 0.1 0.7 0 0.1 2.0 0 0.2 0.4 0.2Government employee pensions 9.0 13 7 18.1 5.4 16.2 15 3 5.2 8.6 18.2 5.4 11.8 7.4
Military 1.8 3 3 2.4 1 1 0.9 1 7 1 7 0 2.6 1.2 1 5 0.9Federal 2.1 3 5 6.0 1.2 5.0 6 1 2.1 3.4 5.9 1 7 7 3 3.0State or local 5.4 7.4 11 1 3 3 11 6 8.2 1.4 5.2 10.6 2.5 3 7 4.0
Private pensions or annuities 12.4 25.7 37.9 11 5 19.1 27.3 5.0 12.0 23.7 9.2 16 1 21.0
Income from assets 70.9 71 5 69.1 45.2 38.3 37.9 65 3 57.4 63.4 44.0 35.2 31.4Interest 69.4 68.9 66.9 42.8 35 7 36.0 64.2 55.4 57.9 43.1 34.1 30.2Other income from assets 38.6 40.4 34.8 16 3 12.6 17 1 29.7 29.7 32.8 16.8 12.2 11.8
Dividends 35 5 36 1 30.5 12.6 11.2 13.4 26.2 25.9 26.9 13 5 8.1 8.7Rent or royalties 9.7 12.2 10.2 5.2 2.7 6.0 6.9 5.0 10.4 6 5 6.9 5.4Estatesortrusts 0.2 0.3 0.2 0 0 0 0 0 0 0 0.1 0
Veterans' benefits 4.5 3 1 5 7 6.8 4.7 5.4 0.7 1 7 3.0 2.8 4.5 3 1
Unemployment compensation 6 1 4.3 1.9 4.5 6.0 4.0 6 7 5 6 5 6 6.4 2.4 2.7
Workers' compensation 1.8 1.8 0.6 2.3 0.6 0.9 1 6 0 0.6 2.9 1.8 0.3
Cash public assistance and noncash benefits 5 1 4.3 4.6 10.2 15 6 14.9 3.9 10.4 14.1 15.0 14.1 17 3Cash public assistance 3 7 2.6 2.6 6.9 13 3 9.7 3.4 9.8 8.3 9.7 8.1 9.7
Supplemental Security Income 3 5 2.6 2.4 5.8 13 3 8.3 3.4 9.8 7.4 8.4 8.1 9.0Other 0.4 0.1 0.3 1.8 0 1.8 0 0 0.9 2.4 0.2 1 1
Noncash benefits 2.2 2.3 2.9 4.7 5 3 9.0 1.0 0.6 9.3 8.1 10.5 11 5Food 1 5 1 6 1 5 2.8 1.4 5.9 1.0 0.6 5.2 5.0 8.7 7 7Energy 0.5 0.7 1 1 0.7 3 6 1 7 0 0 2.8 1 3 1.4 1.8Housing 0.6 0.3 0.9 1 6 0.9 3.0 0 0.6 5.9 2.7 2.3 4.3
Personal contributions 1.4 1.4 0.8 1 5 1 1 1 6 2.1 2.5 1.9 1 5 2.1 0.4
Number(thousands) 6,787 2,339 9,760 566 185 612 307 80 359 577 171 605
(Continued)
58 • Income of the Population 55 or Older, 2004 (Expanded Edition)
Family Income Sources of Aged Persons
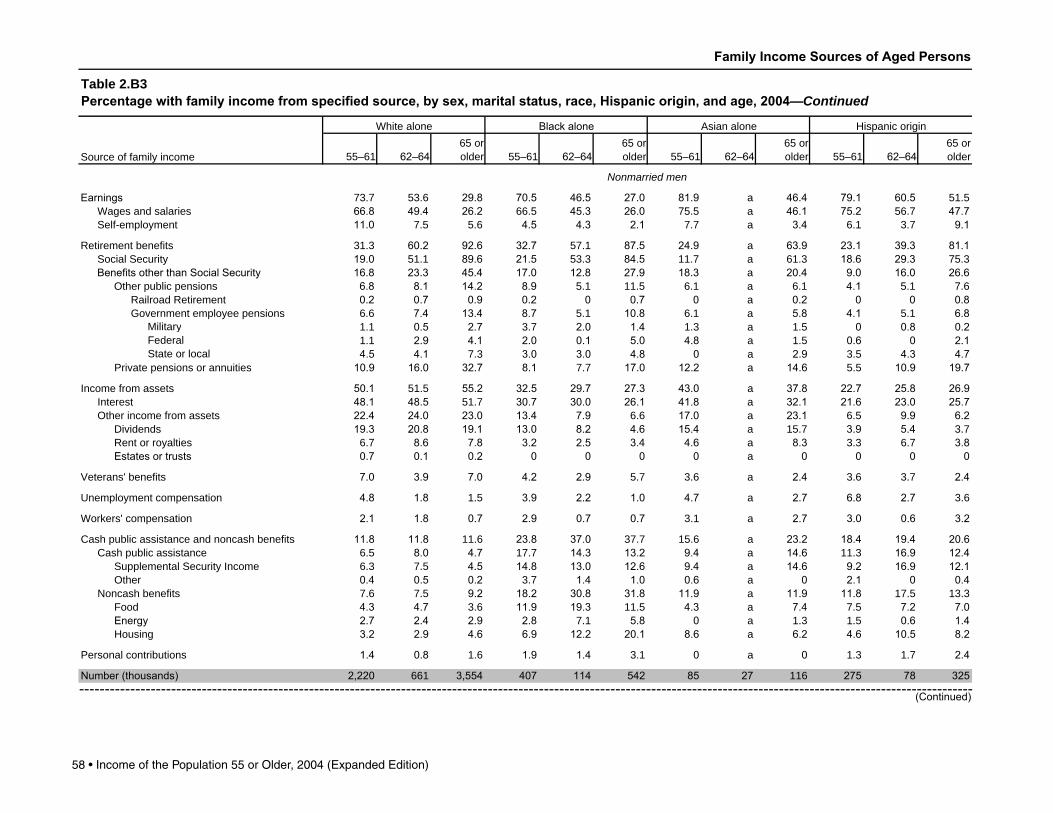
Table 2.B3Percentage with family income from specified source, by sex, marital status, race, Hispanic origin, and age, 2004—Continued
Source of family income
White alone Blackalone Asian alone Hispanic origin
55–61 62–6465 orolder 55–61 62–64
65 orolder 55–61 62–64
65 orolder 55–61 62–64
65 or older
Nonmarried men
Earnings 73 7 53 6 29.8 70.5 46.5 27.0 81.9 a 46.4 79.1 60.5 51 5Wages and salaries 66.8 49.4 26.2 66 5 45.3 26.0 75 5 a 46.1 75.2 56 7 47.7Self-employment 11.0 7 5 5 6 4.5 4.3 2.1 7 7 a 3.4 6 1 3 7 9.1
Retirement benefits 31 3 60.2 92.6 32.7 57 1 87.5 24.9 a 63.9 23.1 39.3 81.1Social Security 19.0 51 1 89.6 21.5 53 3 84.5 11 7 a 61 3 18.6 29.3 75 3BenefitsotherthanSocialSecurity 16.8 23.3 45.4 17.0 12.8 27.9 18.3 a 20.4 9.0 16.0 26.6
Other public pensions 6.8 8.1 14.2 8.9 5 1 11 5 6 1 a 6 1 4.1 5 1 7 6Railroad Retirement 0.2 0.7 0.9 0.2 0 0.7 0 a 0.2 0 0 0.8Government employee pensions 6 6 7.4 13.4 8.7 5 1 10.8 6 1 a 5.8 4.1 5 1 6.8
Military 1 1 0.5 2.7 3 7 2.0 1.4 1 3 a 1 5 0 0.8 0.2Federal 1 1 2.9 4.1 2.0 0.1 5.0 4.8 a 1 5 0.6 0 2.1State or local 4.5 4.1 7 3 3.0 3.0 4.8 0 a 2.9 3 5 4.3 4.7
Private pensions or annuities 10.9 16.0 32.7 8.1 7 7 17.0 12.2 a 14.6 5 5 10.9 19.7
Income from assets 50.1 51 5 55.2 32.5 29.7 27.3 43.0 a 37.8 22.7 25.8 26.9Interest 48.1 48.5 51 7 30.7 30.0 26.1 41.8 a 32.1 21.6 23.0 25.7Other income from assets 22.4 24.0 23.0 13.4 7.9 6 6 17.0 a 23.1 6 5 9.9 6.2
Dividends 19.3 20.8 19.1 13.0 8.2 4.6 15.4 a 15 7 3.9 5.4 3 7Rent or royalties 6 7 8.6 7.8 3.2 2.5 3.4 4.6 a 8.3 3 3 6 7 3.8Estatesortrusts 0.7 0.1 0.2 0 0 0 0 a 0 0 0 0
Veterans' benefits 7.0 3.9 7.0 4.2 2.9 5 7 3 6 a 2.4 3 6 3 7 2.4
Unemployment compensation 4.8 1.8 1 5 3.9 2.2 1.0 4.7 a 2.7 6.8 2.7 3 6
Workers' compensation 2.1 1.8 0.7 2.9 0.7 0.7 3 1 a 2.7 3.0 0.6 3.2
Cash public assistance and noncash benefits 11.8 11.8 11 6 23.8 37.0 37 7 15 6 a 23.2 18.4 19.4 20.6Cash public assistance 6 5 8.0 4.7 17 7 14.3 13.2 9.4 a 14.6 11 3 16.9 12.4
Supplemental Security Income 6 3 7 5 4.5 14.8 13.0 12.6 9.4 a 14.6 9.2 16.9 12.1Other 0.4 0.5 0.2 3 7 1.4 1.0 0.6 a 0 2.1 0 0.4
Noncash benefits 7 6 7 5 9.2 18.2 30.8 31.8 11.9 a 11.9 11.8 17 5 13 3Food 4.3 4.7 3 6 11.9 19.3 11 5 4.3 a 7.4 7 5 7.2 7.0Energy 2.7 2.4 2.9 2.8 7 1 5.8 0 a 1 3 1 5 0.6 1.4Housing 3.2 2.9 4.6 6.9 12.2 20.1 8.6 a 6.2 4.6 10.5 8.2
Personal contributions 1.4 0.8 1 6 1.9 1.4 3 1 0 a 0 1 3 1 7 2.4
Number(thousands) 2,220 661 3,554 407 114 542 85 27 116 275 78 325
(Continued)
Income of the Population 55 or Older, 2004 (Expanded Edition) • 59
Family Income Sources of Aged Persons
Table 2.B3Percentage with family income from specified source, by sex, marital status, race, Hispanic origin, and age, 2004—Continued
Source of family income
White alone Blackalone Asian alone Hispanic origin
55–61 62–6465 orolder 55–61 62–64
65 orolder 55–61 62–64
65 orolder 55–61 62–64
65 or older
All women
Earnings 83.7 66.8 31.2 74.7 61.0 37 6 90.3 72.1 54.2 82.8 71 6 45.6Wages and salaries 79.5 61.9 28.4 73 5 59.7 36 7 86.8 68.4 51 3 80.3 65.8 43.5Self-employment 12.5 11.9 5 1 4.4 5.0 2.2 10.0 8.1 8.8 8.3 10.4 4.7
Retirement benefits 39.3 72.4 94.3 40.2 68.1 88.1 27.3 50.5 72.9 33.9 54.5 81.8Social Security 25.6 64.4 92.1 30.8 60.5 85.2 18.1 44.0 69.3 24.8 46.9 78.6BenefitsotherthanSocialSecurity 23.9 38.5 43.6 17.9 29.5 27.6 17 3 27.4 28.8 15 1 22.7 21.5
Other public pensions 10.0 15.2 15 5 7.0 12.3 10.2 8.1 9.6 14.2 7.2 7 5 7.4Railroad Retirement 0.3 0.7 0.9 0.1 0.2 0.5 0.4 0 0.7 0.2 0 0.3Government employee pensions 9.7 14.6 14.6 7.0 12.1 10.0 8.0 9.6 13.9 7.0 7 5 7.2
Military 1 6 2.2 1 6 0.7 0.4 0.5 2.0 2.0 2.8 1 1 0.2 0.6Federal 2.5 3.9 4.7 2.1 3 1 3.4 2.2 2.6 5 3 3 1 2.9 2.9State or local 6.0 9.4 9.1 4.6 8.5 6 5 4.0 6 7 6.0 3 1 4.5 3.8
Private pensions or annuities 15.0 26.4 31.2 11.4 18.3 18.4 9.9 18.1 17 5 8.1 15.9 14.7
Income from assets 63.9 67 6 61.2 36.2 30.3 29.0 60.5 56 6 54.4 36.9 33.4 29.7Interest 61 7 65 1 58.5 33 6 27.0 26.6 58.2 54.2 52.0 34.9 31 5 27.8Other income from assets 33.0 36.2 28.0 13 6 10.5 9.2 28.4 24.7 22.4 12.8 13 1 8.9
Dividends 30.1 31.4 23.3 10.8 7 3 6 3 24.0 24.0 19.5 10.1 8.9 6 1Rent or royalties 8.8 10.6 8.3 4.7 5.2 3.4 9.9 4.5 5.8 4.5 7 1 3.8Estatesortrusts 0.2 0.2 0.5 0 0 0.1 0 0 0 0.2 0 0
Veterans' benefits 3 3 3 3 4.1 2.3 4.1 3 5 1.9 2.0 3 7 2.8 2.0 2.1
Unemployment compensation 5 5 4.2 1 5 4.5 3.2 1.9 9.6 5 5 3.0 5 6 3 5 3.0
Workers' compensation 1.8 1 5 0.7 1.9 2.9 0.8 1 3 1.2 1.8 2.4 2.7 1.4
Cash public assistance and noncash benefits 8.6 8.9 10.6 23.7 20.7 29.9 9.3 15.4 20.1 21.1 25.6 28.5Cash public assistance 5 1 5 1 4.5 14.4 10.3 14.4 5 3 6 6 14.3 12.1 15 6 18.0
Supplemental Security Income 4.7 4.6 4.2 11.2 9.5 13 5 4.9 6 6 13 3 10.3 13 1 17 3Other 0.6 0.7 0.3 4.1 1 3 1.9 0.4 0 1.0 2.2 3 7 1.0
Noncash benefits 5.4 6 6 8.4 17.2 15.4 23.4 5 5 8.8 11.8 13 6 18.7 20.2Food 3 7 4.3 3.4 10.9 9.4 12.5 2.4 3.8 5.8 9.4 13.8 13.4Energy 1 6 2.0 2.8 3.4 2.3 5.4 0.4 4.0 1.4 2.1 2.6 1.9Housing 1.8 2.6 4.0 8.5 9.4 11 5 3.4 5.4 8.2 5 5 5 7 8.4
Personal contributions 3.2 2.4 1 7 4.2 2.5 2.6 3.8 4.2 3.4 5 5 0.8 3 1
Number(thousands) 9,729 3,254 17,396 1,250 387 1,804 465 131 616 924 290 1,264
(Continued)
60 • Income of the Population 55 or Older, 2004 (Expanded Edition)
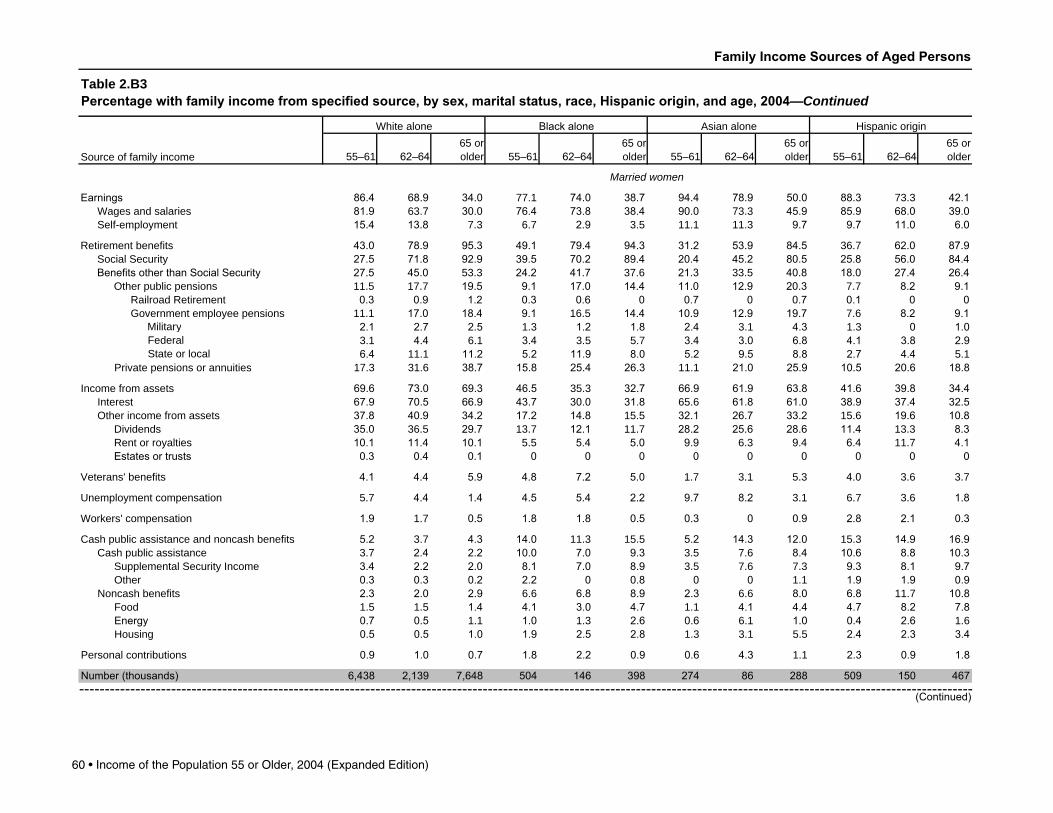
Family Income Sources of Aged Persons
Table 2.B3Percentage with family income from specified source, by sex, marital status, race, Hispanic origin, and age, 2004—Continued
Source of family income
White alone Blackalone Asian alone Hispanic origin
55–61 62–6465 orolder 55–61 62–64
65 orolder 55–61 62–64
65 orolder 55–61 62–64
65 or older
Married women
Earnings 86.4 68.9 34.0 77 1 74.0 38.7 94.4 78.9 50.0 88.3 73 3 42.1Wages and salaries 81.9 63 7 30.0 76.4 73.8 38.4 90.0 73 3 45.9 85.9 68.0 39.0Self-employment 15.4 13.8 7 3 6 7 2.9 3 5 11 1 11 3 9.7 9.7 11.0 6.0
Retirement benefits 43.0 78.9 95.3 49.1 79.4 94.3 31.2 53.9 84.5 36 7 62.0 87.9Social Security 27.5 71.8 92.9 39.5 70.2 89.4 20.4 45.2 80.5 25.8 56.0 84.4BenefitsotherthanSocialSecurity 27.5 45.0 53 3 24.2 41.7 37 6 21.3 33 5 40.8 18.0 27.4 26.4
Other public pensions 11 5 17 7 19.5 9.1 17.0 14.4 11.0 12.9 20.3 7 7 8.2 9.1Railroad Retirement 0.3 0.9 1.2 0.3 0.6 0 0.7 0 0.7 0.1 0 0Government employee pensions 11 1 17.0 18.4 9.1 16 5 14.4 10.9 12.9 19.7 7 6 8.2 9.1
Military 2.1 2.7 2.5 1 3 1.2 1.8 2.4 3 1 4.3 1 3 0 1.0Federal 3 1 4.4 6 1 3.4 3 5 5 7 3.4 3.0 6.8 4.1 3.8 2.9State or local 6.4 11 1 11.2 5.2 11.9 8.0 5.2 9.5 8.8 2.7 4.4 5 1
Private pensions or annuities 17 3 31 6 38.7 15.8 25.4 26.3 11 1 21.0 25.9 10.5 20.6 18.8
Income from assets 69.6 73.0 69.3 46.5 35 3 32.7 66.9 61.9 63.8 41.6 39.8 34.4Interest 67.9 70.5 66.9 43.7 30.0 31.8 65 6 61.8 61.0 38.9 37.4 32.5Other income from assets 37.8 40.9 34.2 17.2 14.8 15 5 32.1 26.7 33.2 15 6 19.6 10.8
Dividends 35.0 36 5 29.7 13 7 12.1 11 7 28.2 25.6 28.6 11.4 13 3 8.3Rent or royalties 10.1 11.4 10.1 5 5 5.4 5.0 9.9 6 3 9.4 6.4 11 7 4.1Estatesortrusts 0.3 0.4 0.1 0 0 0 0 0 0 0 0 0
Veterans' benefits 4.1 4.4 5.9 4.8 7.2 5.0 1 7 3 1 5 3 4.0 3 6 3 7
Unemployment compensation 5 7 4.4 1.4 4.5 5.4 2.2 9.7 8.2 3 1 6 7 3 6 1.8
Workers' compensation 1.9 1 7 0.5 1.8 1.8 0.5 0.3 0 0.9 2.8 2.1 0.3
Cash public assistance and noncash benefits 5.2 3 7 4.3 14.0 11 3 15 5 5.2 14.3 12.0 15 3 14.9 16.9Cash public assistance 3 7 2.4 2.2 10.0 7.0 9.3 3 5 7 6 8.4 10.6 8.8 10.3
Supplemental Security Income 3.4 2.2 2.0 8.1 7.0 8.9 3 5 7 6 7 3 9.3 8.1 9.7Other 0.3 0.3 0.2 2.2 0 0.8 0 0 1 1 1.9 1.9 0.9
Noncash benefits 2.3 2.0 2.9 6 6 6.8 8.9 2.3 6 6 8.0 6.8 11 7 10.8Food 1 5 1 5 1.4 4.1 3.0 4.7 1 1 4.1 4.4 4.7 8.2 7.8Energy 0.7 0.5 1 1 1.0 1 3 2.6 0.6 6 1 1.0 0.4 2.6 1 6Housing 0.5 0.5 1.0 1.9 2.5 2.8 1 3 3 1 5 5 2.4 2.3 3.4
Personal contributions 0.9 1.0 0.7 1.8 2.2 0.9 0.6 4.3 1 1 2.3 0.9 1.8
Number(thousands) 6,438 2,139 7,648 504 146 398 274 86 288 509 150 467
(Continued)
Income of the Population 55 or Older, 2004 (Expanded Edition) • 61
Family Income Sources of Aged Persons
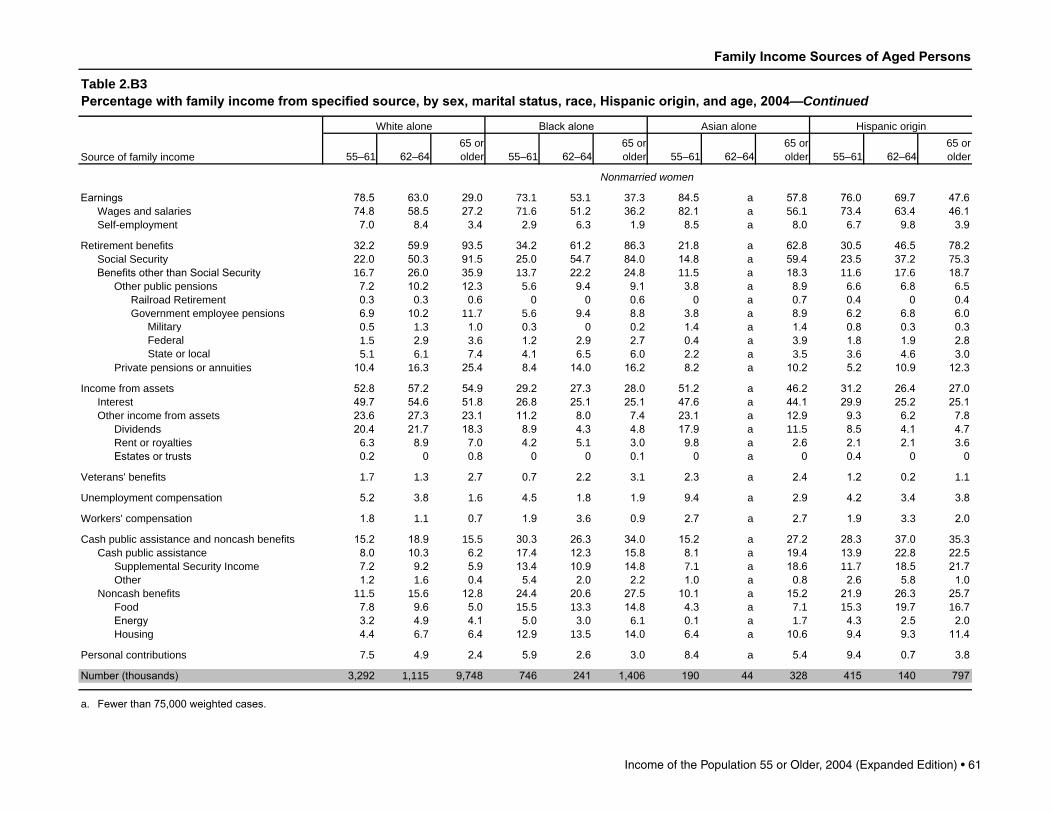
Table 2.B3Percentage with family income from specified source, by sex, marital status, race, Hispanic origin, and age, 2004—Continued
Source of family income
White alone Blackalone Asian alone Hispanic origin
55–61 62–6465 orolder 55–61 62–64
65 orolder 55–61 62–64
65 orolder 55–61 62–64
65 or older
Nonmarried women
Earnings 78.5 63.0 29.0 73 1 53 1 37 3 84.5 a 57.8 76.0 69.7 47.6Wages and salaries 74.8 58.5 27.2 71 6 51.2 36.2 82.1 a 56 1 73.4 63.4 46.1Self-employment 7.0 8.4 3.4 2.9 6 3 1.9 8.5 a 8.0 6 7 9.8 3.9
Retirement benefits 32.2 59.9 93.5 34.2 61.2 86.3 21.8 a 62.8 30.5 46.5 78.2Social Security 22.0 50.3 91.5 25.0 54.7 84.0 14.8 a 59.4 23.5 37.2 75 3BenefitsotherthanSocialSecurity 16 7 26.0 35.9 13 7 22.2 24.8 11 5 a 18.3 11 6 17 6 18.7
Other public pensions 7.2 10.2 12.3 5 6 9.4 9.1 3.8 a 8.9 6 6 6.8 6 5Railroad Retirement 0.3 0.3 0.6 0 0 0.6 0 a 0.7 0.4 0 0.4Government employee pensions 6.9 10.2 11 7 5 6 9.4 8.8 3.8 a 8.9 6.2 6.8 6.0
Military 0.5 1 3 1.0 0.3 0 0.2 1.4 a 1.4 0.8 0.3 0.3Federal 1 5 2.9 3 6 1.2 2.9 2.7 0.4 a 3.9 1.8 1.9 2.8State or local 5 1 6 1 7.4 4.1 6 5 6.0 2.2 a 3 5 3 6 4.6 3.0
Private pensions or annuities 10.4 16 3 25.4 8.4 14.0 16.2 8.2 a 10.2 5.2 10.9 12.3
Income from assets 52.8 57.2 54.9 29.2 27.3 28.0 51.2 a 46.2 31.2 26.4 27.0Interest 49.7 54.6 51.8 26.8 25.1 25.1 47.6 a 44.1 29.9 25.2 25.1Other income from assets 23.6 27.3 23.1 11.2 8.0 7.4 23.1 a 12.9 9.3 6.2 7.8
Dividends 20.4 21.7 18.3 8.9 4.3 4.8 17.9 a 11 5 8.5 4.1 4.7Rent or royalties 6 3 8.9 7.0 4.2 5 1 3.0 9.8 a 2.6 2.1 2.1 3 6Estatesortrusts 0.2 0 0.8 0 0 0.1 0 a 0 0.4 0 0
Veterans' benefits 1 7 1 3 2.7 0.7 2.2 3 1 2.3 a 2.4 1.2 0.2 1 1
Unemployment compensation 5.2 3.8 1 6 4.5 1.8 1.9 9.4 a 2.9 4.2 3.4 3.8
Workers' compensation 1.8 1 1 0.7 1.9 3 6 0.9 2.7 a 2.7 1.9 3 3 2.0
Cash public assistance and noncash benefits 15.2 18.9 15 5 30.3 26.3 34.0 15.2 a 27.2 28.3 37.0 35 3Cash public assistance 8.0 10.3 6.2 17.4 12.3 15.8 8.1 a 19.4 13.9 22.8 22.5
Supplemental Security Income 7.2 9.2 5.9 13.4 10.9 14.8 7 1 a 18.6 11 7 18.5 21.7Other 1.2 1 6 0.4 5.4 2.0 2.2 1.0 a 0.8 2.6 5.8 1.0
Noncash benefits 11 5 15 6 12.8 24.4 20.6 27.5 10.1 a 15.2 21.9 26.3 25.7Food 7.8 9.6 5.0 15 5 13 3 14.8 4.3 a 7 1 15 3 19.7 16 7Energy 3.2 4.9 4.1 5.0 3.0 6 1 0.1 a 1 7 4.3 2.5 2.0Housing 4.4 6 7 6.4 12.9 13 5 14.0 6.4 a 10.6 9.4 9.3 11.4
Personal contributions 7 5 4.9 2.4 5.9 2.6 3.0 8.4 a 5.4 9.4 0.7 3.8
Number(thousands) 3,292 1,115 9,748 746 241 1,406 190 44 328 415 140 797
a Fewerthan75,000weightedcases.
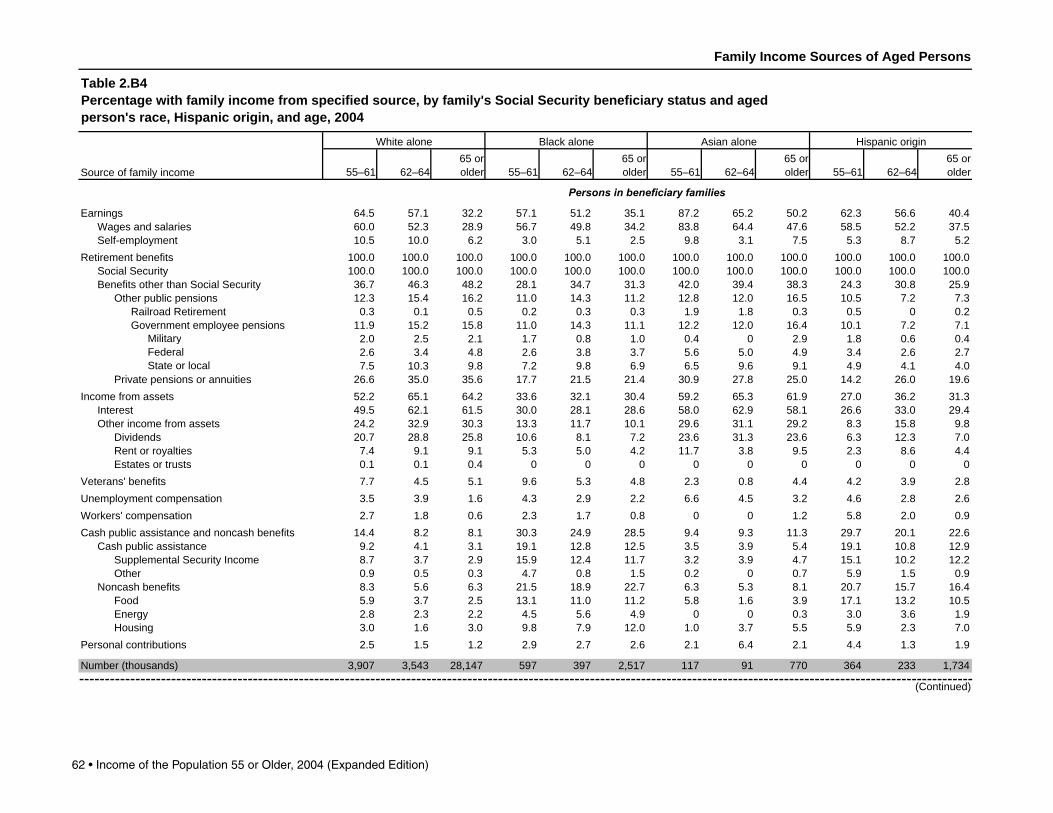
62 • Income of the Population 55 or Older, 2004 (Expanded Edition)
55–61 62–6465 or older 55–61 62–64
65 or older 55–61 62–64
65 or older 55–61 62–64
65 or older
64.5 57.1 32.2 57.1 51.2 35.1 87.2 65.2 50.2 62.3 56.6 40.460.0 52.3 28.9 56.7 49.8 34.2 83.8 64.4 47.6 58.5 52.2 37.510.5 10.0 6.2 3.0 5.1 2.5 9.8 3.1 7.5 5.3 8.7 5.2
100.0 100.0 100.0 100.0 100.0 100.0 100.0 100.0 100.0 100.0 100.0 100.0100.0 100.0 100.0 100.0 100.0 100.0 100.0 100.0 100.0 100.0 100.0 100.036.7 46.3 48.2 28.1 34.7 31.3 42.0 39.4 38.3 24.3 30.8 25.912.3 15.4 16.2 11.0 14.3 11.2 12.8 12.0 16.5 10.5 7.2 7.30.3 0.1 0.5 0.2 0.3 0.3 1.9 1.8 0.3 0.5 0 0.2
11.9 15.2 15.8 11.0 14.3 11.1 12.2 12.0 16.4 10.1 7.2 7.1Military 2.0 2.5 2.1 1.7 0.8 1.0 0.4 0 2.9 1.8 0.6 0.4Federal 2.6 3.4 4.8 2.6 3.8 3.7 5.6 5.0 4.9 3.4 2.6 2.7State or local 7.5 10.3 9.8 7.2 9.8 6.9 6.5 9.6 9.1 4.9 4.1 4.0
26.6 35.0 35.6 17.7 21.5 21.4 30.9 27.8 25.0 14.2 26.0 19.652.2 65.1 64.2 33.6 32.1 30.4 59.2 65.3 61.9 27.0 36.2 31.349.5 62.1 61.5 30.0 28.1 28.6 58.0 62.9 58.1 26.6 33.0 29.424.2 32.9 30.3 13.3 11.7 10.1 29.6 31.1 29.2 8.3 15.8 9.820.7 28.8 25.8 10.6 8.1 7.2 23.6 31.3 23.6 6.3 12.3 7.07.4 9.1 9.1 5.3 5.0 4.2 11.7 3.8 9.5 2.3 8.6 4.40.1 0.1 0.4 0 0 0 0 0 0 0 0 07.7 4.5 5.1 9.6 5.3 4.8 2.3 0.8 4.4 4.2 3.9 2.83.5 3.9 1.6 4.3 2.9 2.2 6.6 4.5 3.2 4.6 2.8 2.62.7 1.8 0.6 2.3 1.7 0.8 0 0 1.2 5.8 2.0 0.9
14.4 8.2 8.1 30.3 24.9 28.5 9.4 9.3 11.3 29.7 20.1 22.69.2 4.1 3.1 19.1 12.8 12.5 3.5 3.9 5.4 19.1 10.8 12.98.7 3.7 2.9 15.9 12.4 11.7 3.2 3.9 4.7 15.1 10.2 12.20.9 0.5 0.3 4.7 0.8 1.5 0.2 0 0.7 5.9 1.5 0.98.3 5.6 6.3 21.5 18.9 22.7 6.3 5.3 8.1 20.7 15.7 16.45.9 3.7 2.5 13.1 11.0 11.2 5.8 1.6 3.9 17.1 13.2 10.52.8 2.3 2.2 4.5 5.6 4.9 0 0 0.3 3.0 3.6 1.93.0 1.6 3.0 9.8 7.9 12.0 1.0 3.7 5.5 5.9 2.3 7.02.5 1.5 1.2 2.9 2.7 2.6 2.1 6.4 2.1 4.4 1.3 1.9
3,907 3,543 28,147 597 397 2,517 117 91 770 364 233 1,734
Wages and salariesSelf-employment
Retirement benefits
(Continued)
Energy
Social SecurityBenefits other than Social Security
Other public pensionsRailroad RetirementGovernment employee pensions
Family Income Sources of Aged Persons
Table 2.B4Percentage with family income from specified source, by family's Social Security beneficiary status and agedperson's race, Hispanic origin, and age, 2004
Source of family income
Earnings
Hispanic originWhite alone Black alone
Persons in beneficiary families
Asian alone
Private pensions or annuitiesIncome from assets
InterestOther income from assets
DividendsRent or royaltiesEstates or trusts
Veterans' benefitsUnemployment compensationWorkers' compensationCash public assistance and noncash benefits
Cash public assistanceSupplemental Security IncomeOther
Noncash benefitsFood
Personal contributionsHousing
Number (thousands)
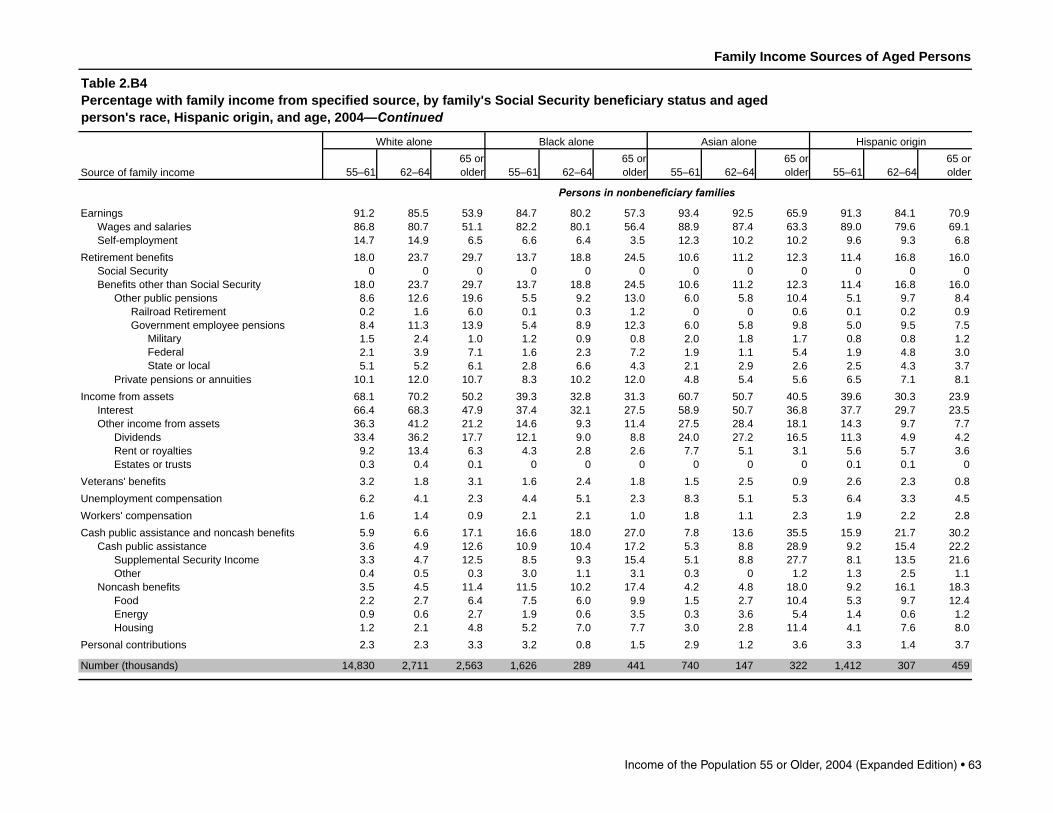
Income of the Population 55 or Older, 2004 (Expanded Edition) • 63
55–61 62–6465 or older 55–61 62–64
65 or older 55–61 62–64
65 or older 55–61 62–64
65 or older
91.2 85.5 53.9 84.7 80.2 57.3 93.4 92.5 65.9 91.3 84.1 70.986.8 80.7 51.1 82.2 80.1 56.4 88.9 87.4 63.3 89.0 79.6 69.114.7 14.9 6.5 6.6 6.4 3.5 12.3 10.2 10.2 9.6 9.3 6.818.0 23.7 29.7 13.7 18.8 24.5 10.6 11.2 12.3 11.4 16.8 16.0
0 0 0 0 0 0 0 0 0 0 0 018.0 23.7 29.7 13.7 18.8 24.5 10.6 11.2 12.3 11.4 16.8 16.08.6 12.6 19.6 5.5 9.2 13.0 6.0 5.8 10.4 5.1 9.7 8.40.2 1.6 6.0 0.1 0.3 1.2 0 0 0.6 0.1 0.2 0.98.4 11.3 13.9 5.4 8.9 12.3 6.0 5.8 9.8 5.0 9.5 7.5
Military 1.5 2.4 1.0 1.2 0.9 0.8 2.0 1.8 1.7 0.8 0.8 1.2Federal 2.1 3.9 7.1 1.6 2.3 7.2 1.9 1.1 5.4 1.9 4.8 3.0State or local 5.1 5.2 6.1 2.8 6.6 4.3 2.1 2.9 2.6 2.5 4.3 3.7
10.1 12.0 10.7 8.3 10.2 12.0 4.8 5.4 5.6 6.5 7.1 8.168.1 70.2 50.2 39.3 32.8 31.3 60.7 50.7 40.5 39.6 30.3 23.966.4 68.3 47.9 37.4 32.1 27.5 58.9 50.7 36.8 37.7 29.7 23.536.3 41.2 21.2 14.6 9.3 11.4 27.5 28.4 18.1 14.3 9.7 7.733.4 36.2 17.7 12.1 9.0 8.8 24.0 27.2 16.5 11.3 4.9 4.29.2 13.4 6.3 4.3 2.8 2.6 7.7 5.1 3.1 5.6 5.7 3.60.3 0.4 0.1 0 0 0 0 0 0 0.1 0.1 03.2 1.8 3.1 1.6 2.4 1.8 1.5 2.5 0.9 2.6 2.3 0.86.2 4.1 2.3 4.4 5.1 2.3 8.3 5.1 5.3 6.4 3.3 4.51.6 1.4 0.9 2.1 2.1 1.0 1.8 1.1 2.3 1.9 2.2 2.85.9 6.6 17.1 16.6 18.0 27.0 7.8 13.6 35.5 15.9 21.7 30.23.6 4.9 12.6 10.9 10.4 17.2 5.3 8.8 28.9 9.2 15.4 22.23.3 4.7 12.5 8.5 9.3 15.4 5.1 8.8 27.7 8.1 13.5 21.60.4 0.5 0.3 3.0 1.1 3.1 0.3 0 1.2 1.3 2.5 1.13.5 4.5 11.4 11.5 10.2 17.4 4.2 4.8 18.0 9.2 16.1 18.32.2 2.7 6.4 7.5 6.0 9.9 1.5 2.7 10.4 5.3 9.7 12.40.9 0.6 2.7 1.9 0.6 3.5 0.3 3.6 5.4 1.4 0.6 1.21.2 2.1 4.8 5.2 7.0 7.7 3.0 2.8 11.4 4.1 7.6 8.02.3 2.3 3.3 3.2 0.8 1.5 2.9 1.2 3.6 3.3 1.4 3.7
14,830 2,711 2,563 1,626 289 441 740 147 322 1,412 307 459
Persons in nonbeneficiary families
Self-employmentRetirement benefits
Family Income Sources of Aged Persons
Table 2.B4Percentage with family income from specified source, by family's Social Security beneficiary status and agedperson's race, Hispanic origin, and age, 2004—Continued
Source of family income
White alone Black alone Asian alone Hispanic origin
Benefits other than Social SecurityOther public pensions
EarningsWages and salaries
Social Security
Railroad RetirementGovernment employee pensions
Private pensions or annuitiesIncome from assets
InterestOther income from assets
DividendsRent or royaltiesEstates or trusts
Veterans' benefitsUnemployment compensationWorkers' compensationCash public assistance and noncash benefits
Cash public assistanceSupplemental Security IncomeOther
Noncash benefits
Number (thousands)
FoodEnergyHousing
Personal contributions
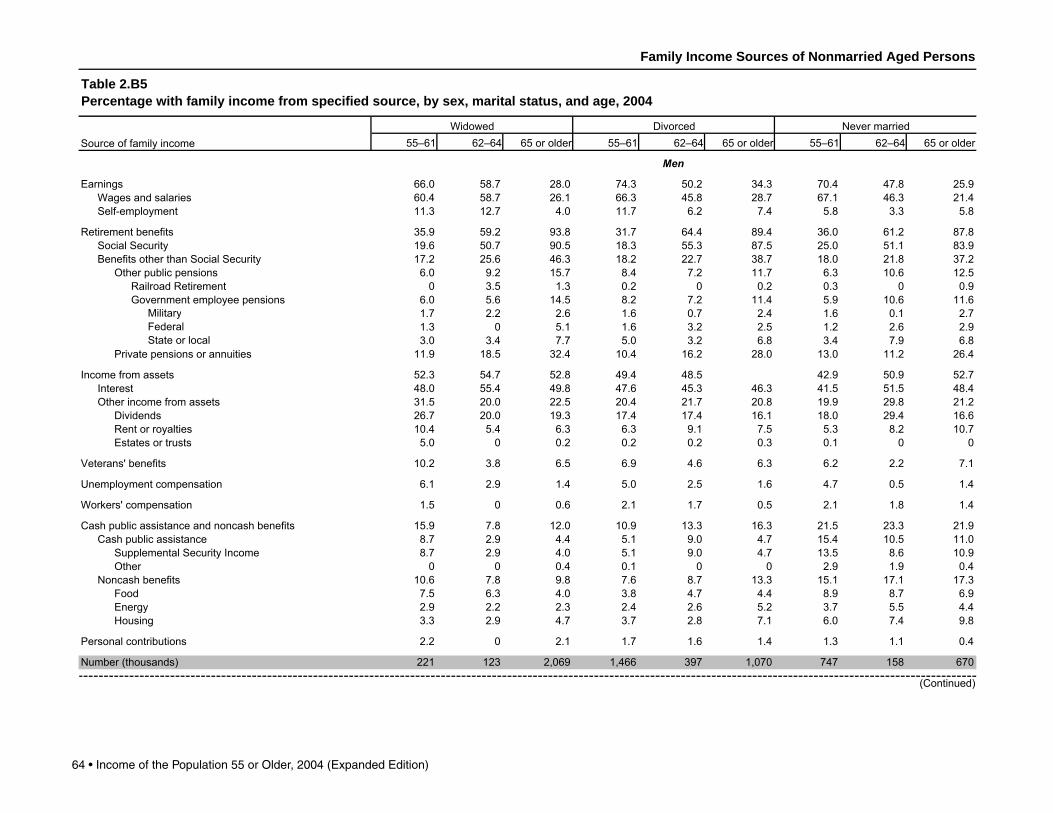
64 • Income of the Population 55 or Older, 2004 (Expanded Edition)
55–61 62–64 65 or older 55–61 62–64 65 or older 55–61 62–64 65 or older
66.0 58.7 28.0 74.3 50.2 34.3 70.4 47.8 25.960.4 58.7 26.1 66.3 45.8 28.7 67.1 46.3 21.411.3 12.7 4.0 11.7 6.2 7.4 5.8 3.3 5.8
35.9 59.2 93.8 31.7 64.4 89.4 36.0 61.2 87.819.6 50.7 90.5 18.3 55.3 87.5 25.0 51.1 83.917.2 25.6 46.3 18.2 22.7 38.7 18.0 21.8 37.26.0 9.2 15.7 8.4 7.2 11.7 6.3 10.6 12.5
0 3.5 1.3 0.2 0 0.2 0.3 0 0.96.0 5.6 14.5 8.2 7.2 11.4 5.9 10.6 11.6
Military 1.7 2.2 2.6 1.6 0.7 2.4 1.6 0.1 2.7Federal 1.3 0 5.1 1.6 3.2 2.5 1.2 2.6 2.9State or local 3.0 3.4 7.7 5.0 3.2 6.8 3.4 7.9 6.8
11.9 18.5 32.4 10.4 16.2 28.0 13.0 11.2 26.4
52.3 54.7 52.8 49.4 48.5 42.9 50.9 52.748.0 55.4 49.8 47.6 45.3 46.3 41.5 51.5 48.431.5 20.0 22.5 20.4 21.7 20.8 19.9 29.8 21.226.7 20.0 19.3 17.4 17.4 16.1 18.0 29.4 16.610.4 5.4 6.3 6.3 9.1 7.5 5.3 8.2 10.75.0 0 0.2 0.2 0.2 0.3 0.1 0 0
10.2 3.8 6.5 6.9 4.6 6.3 6.2 2.2 7.1
6.1 2.9 1.4 5.0 2.5 1.6 4.7 0.5 1.4
1.5 0 0.6 2.1 1.7 0.5 2.1 1.8 1.4
15.9 7.8 12.0 10.9 13.3 16.3 21.5 23.3 21.98.7 2.9 4.4 5.1 9.0 4.7 15.4 10.5 11.08.7 2.9 4.0 5.1 9.0 4.7 13.5 8.6 10.9
0 0 0.4 0.1 0 0 2.9 1.9 0.410.6 7.8 9.8 7.6 8.7 13.3 15.1 17.1 17.37.5 6.3 4.0 3.8 4.7 4.4 8.9 8.7 6.92.9 2.2 2.3 2.4 2.6 5.2 3.7 5.5 4.43.3 2.9 4.7 3.7 2.8 7.1 6.0 7.4 9.8
2.2 0 2.1 1.7 1.6 1.4 1.3 1.1 0.4
221 123 2,069 1,466 397 1,070 747 158 670
Family Income Sources of Nonmarried Aged Persons
Table 2.B5Percentage with family income from specified source, by sex, marital status, and age, 2004
Source of family income
Earnings
Widowed Divorced Never married
Men
Wages and salariesSelf-employment
Retirement benefitsSocial SecurityBenefits other than Social Security
Other public pensionsRailroad RetirementGovernment employee pensions
Private pensions or annuities
Income from assetsInterestOther income from assets
DividendsRent or royaltiesEstates or trusts
Veterans' benefits
Unemployment compensation
Workers' compensation
Cash public assistance and noncash benefitsCash public assistance
Supplemental Security IncomeOther
Noncash benefitsFood
(Continued)
EnergyHousing
Personal contributions
Number (thousands)
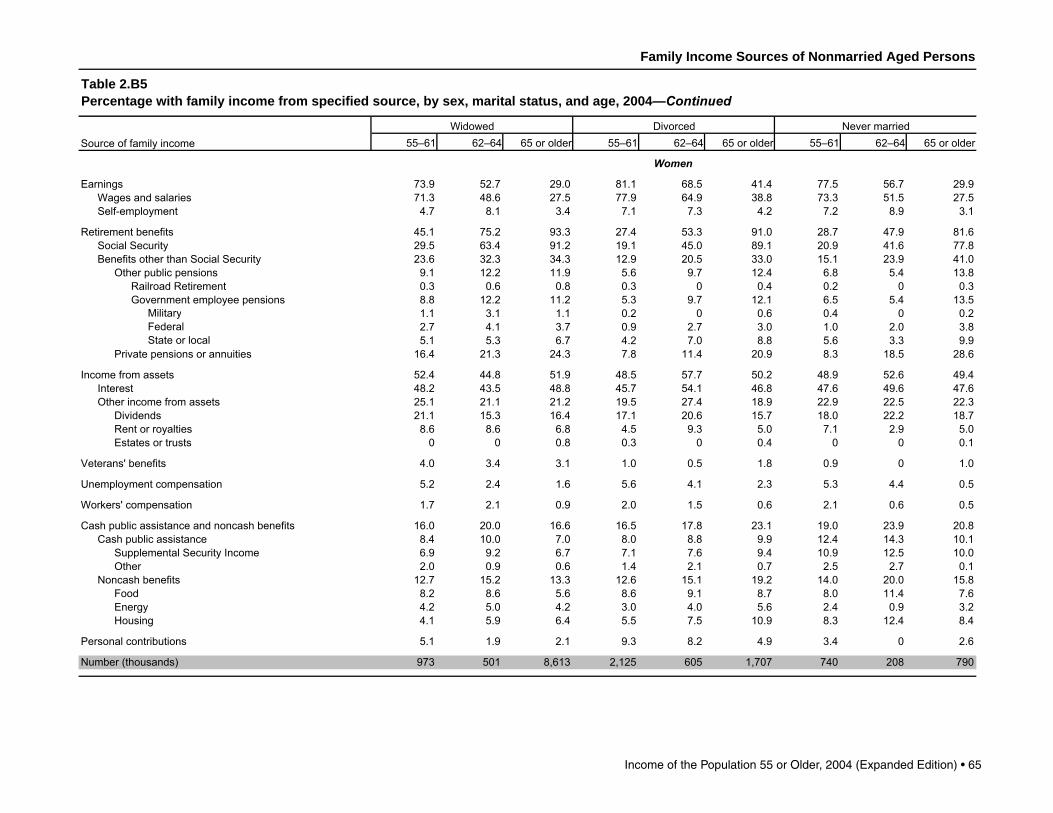
Income of the Population 55 or Older, 2004 (Expanded Edition) • 65
55–61 62–64 65 or older 55–61 62–64 65 or older 55–61 62–64 65 or older
73.9 52.7 29.0 81.1 68.5 41.4 77.5 56.7 29.971.3 48.6 27.5 77.9 64.9 38.8 73.3 51.5 27.54.7 8.1 3.4 7.1 7.3 4.2 7.2 8.9 3.1
45.1 75.2 93.3 27.4 53.3 91.0 28.7 47.9 81.629.5 63.4 91.2 19.1 45.0 89.1 20.9 41.6 77.823.6 32.3 34.3 12.9 20.5 33.0 15.1 23.9 41.09.1 12.2 11.9 5.6 9.7 12.4 6.8 5.4 13.80.3 0.6 0.8 0.3 0 0.4 0.2 0 0.38.8 12.2 11.2 5.3 9.7 12.1 6.5 5.4 13.5
Military 1.1 3.1 1.1 0.2 0 0.6 0.4 0 0.2Federal 2.7 4.1 3.7 0.9 2.7 3.0 1.0 2.0 3.8State or local 5.1 5.3 6.7 4.2 7.0 8.8 5.6 3.3 9.9
16.4 21.3 24.3 7.8 11.4 20.9 8.3 18.5 28.6
52.4 44.8 51.9 48.5 57.7 50.2 48.9 52.6 49.448.2 43.5 48.8 45.7 54.1 46.8 47.6 49.6 47.625.1 21.1 21.2 19.5 27.4 18.9 22.9 22.5 22.321.1 15.3 16.4 17.1 20.6 15.7 18.0 22.2 18.78.6 8.6 6.8 4.5 9.3 5.0 7.1 2.9 5.0
0 0 0.8 0.3 0 0.4 0 0 0.1
4.0 3.4 3.1 1.0 0.5 1.8 0.9 0 1.0
5.2 2.4 1.6 5.6 4.1 2.3 5.3 4.4 0.5
1.7 2.1 0.9 2.0 1.5 0.6 2.1 0.6 0.5
16.0 20.0 16.6 16.5 17.8 23.1 19.0 23.9 20.88.4 10.0 7.0 8.0 8.8 9.9 12.4 14.3 10.16.9 9.2 6.7 7.1 7.6 9.4 10.9 12.5 10.02.0 0.9 0.6 1.4 2.1 0.7 2.5 2.7 0.1
12.7 15.2 13.3 12.6 15.1 19.2 14.0 20.0 15.88.2 8.6 5.6 8.6 9.1 8.7 8.0 11.4 7.64.2 5.0 4.2 3.0 4.0 5.6 2.4 0.9 3.24.1 5.9 6.4 5.5 7.5 10.9 8.3 12.4 8.4
5.1 1.9 2.1 9.3 8.2 4.9 3.4 0 2.6
973 501 8,613 2,125 605 1,707 740 208 790
Family Income Sources of Nonmarried Aged Persons
Table 2.B5Percentage with family income from specified source, by sex, marital status, and age, 2004—Continued
Source of family incomeWidowed Divorced Never married
Personal contributions
Number (thousands)
Noncash benefitsFoodEnergyHousing
Cash public assistance and noncash benefitsCash public assistance
Supplemental Security IncomeOther
Estates or trusts
Veterans' benefits
Unemployment compensation
Workers' compensation
InterestOther income from assets
DividendsRent or royalties
Railroad RetirementGovernment employee pensions
Private pensions or annuities
Income from assets
Retirement benefitsSocial SecurityBenefits other than Social Security
Other public pensions
Women
EarningsWages and salariesSelf-employment
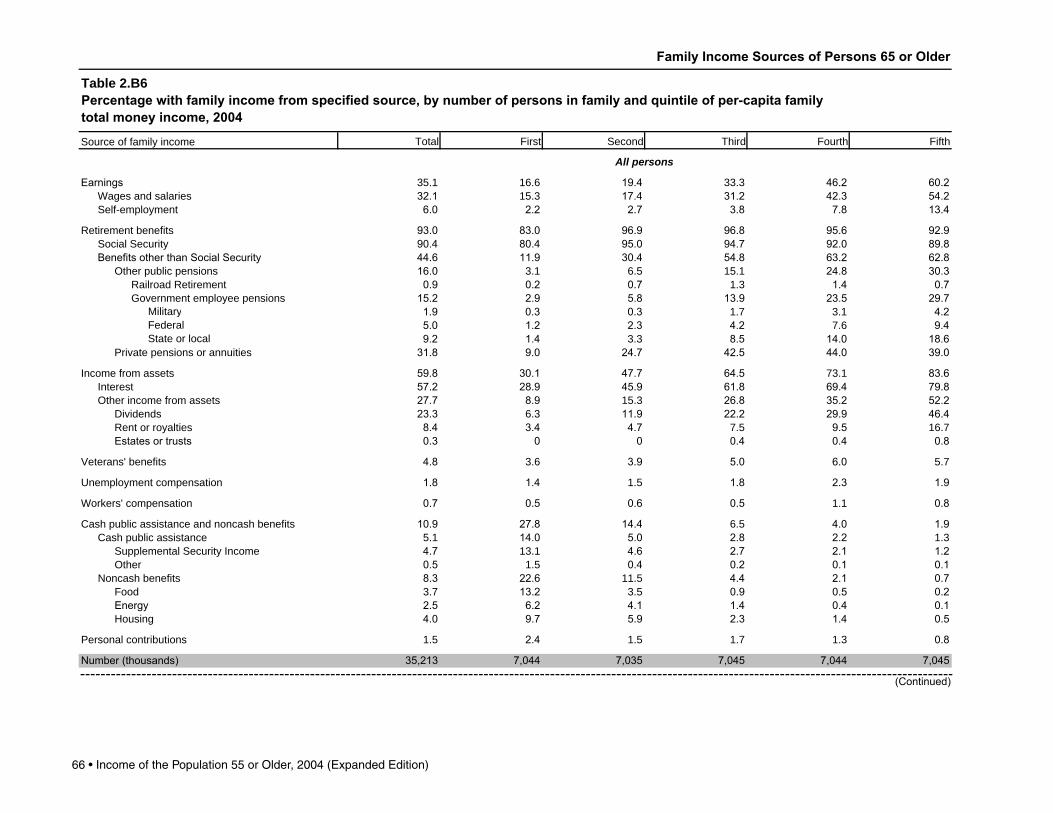
66 • Income of the Population 55 or Older, 2004 (Expanded Edition)
Family Income Sources of Persons 65 or Older
Table 2.B6Percentage with family income from specified source, by number of persons in family and quintile of per-capita familytotal money income, 2004
Source of family income Total First Second Third Fourth Fifth
All persons
Earnings 35 1 16 6 19.4 33 3 46.2 60.2Wages and salaries 32.1 15 3 17.4 31.2 42.3 54.2Self-employment 6.0 2.2 2.7 3.8 7.8 13.4
Retirement benefits 93.0 83.0 96.9 96.8 95.6 92.9Social Security 90.4 80.4 95.0 94.7 92.0 89.8BenefitsotherthanSocialSecurity 44.6 11.9 30.4 54.8 63.2 62.8
Other public pensions 16.0 3 1 6 5 15 1 24.8 30.3Railroad Retirement 0.9 0.2 0.7 1 3 1.4 0.7Government employee pensions 15.2 2.9 5.8 13.9 23.5 29.7
Military 1.9 0.3 0.3 1 7 3 1 4.2Federal 5.0 1.2 2.3 4.2 7 6 9.4State or local 9.2 1.4 3 3 8.5 14.0 18.6
Private pensions or annuities 31.8 9.0 24.7 42.5 44.0 39.0
Income from assets 59.8 30.1 47.7 64.5 73 1 83.6Interest 57.2 28.9 45.9 61.8 69.4 79.8Other income from assets 27.7 8.9 15 3 26.8 35.2 52.2
Dividends 23.3 6 3 11.9 22.2 29.9 46.4Rent or royalties 8.4 3.4 4.7 7 5 9.5 16 7Estatesortrusts 0.3 0 0 0.4 0.4 0.8
Veterans' benefits 4.8 3 6 3.9 5.0 6.0 5 7
Unemployment compensation 1.8 1.4 1 5 1.8 2.3 1.9
Workers' compensation 0.7 0.5 0.6 0.5 1 1 0.8
Cash public assistance and noncash benefits 10.9 27.8 14.4 6 5 4.0 1.9Cash public assistance 5 1 14.0 5.0 2.8 2.2 1 3
Supplemental Security Income 4.7 13 1 4.6 2.7 2.1 1.2Other 0.5 1 5 0.4 0.2 0.1 0.1
Noncash benefits 8.3 22.6 11 5 4.4 2.1 0.7Food 3 7 13.2 3 5 0.9 0.5 0.2Energy 2.5 6.2 4.1 1.4 0.4 0.1Housing 4.0 9.7 5.9 2.3 1.4 0.5
Personal contributions 1 5 2.4 1 5 1 7 1 3 0.8
Number(thousands) 35,213 7,044 7,035 7,045 7,044 7,045
(Continued)
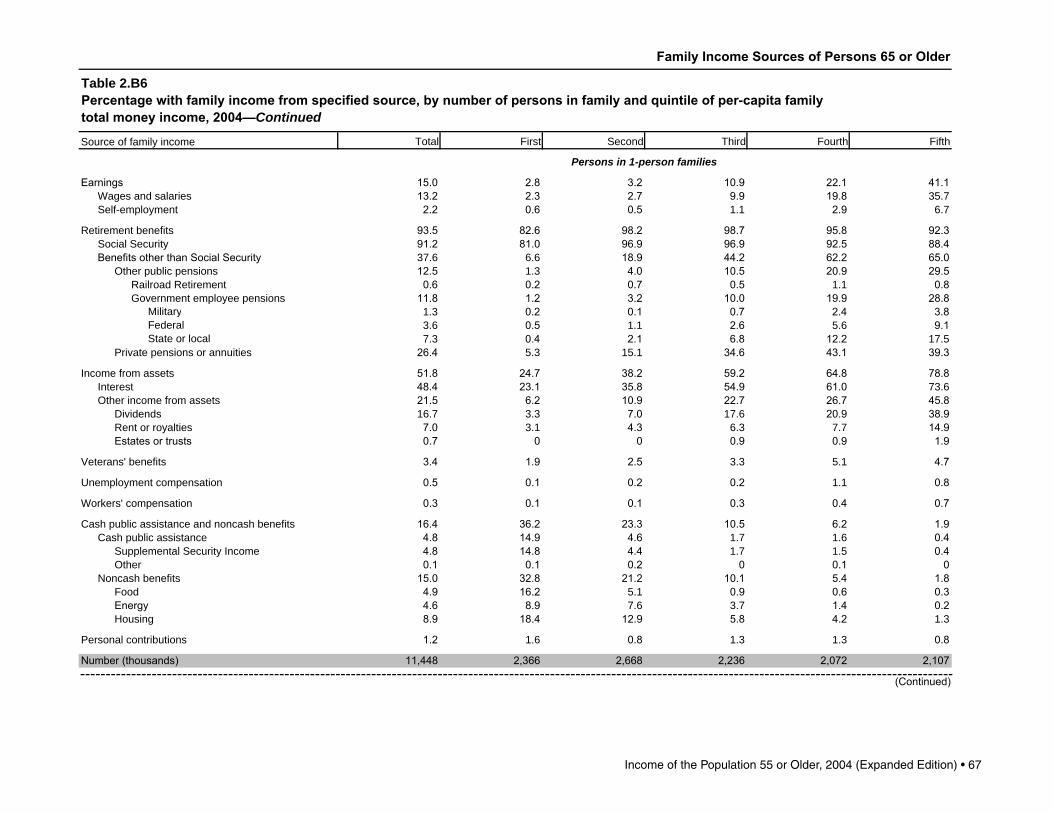
Income of the Population 55 or Older, 2004 (Expanded Edition) • 67
Family Income Sources of Persons 65 or Older
Table 2.B6Percentage with family income from specified source, by number of persons in family and quintile of per-capita familytotal money income, 2004—Continued
Source of family income Total First Second Third Fourth Fifth
Persons in 1-person families
Earnings 15.0 2.8 3.2 10.9 22.1 41.1Wages and salaries 13.2 2.3 2.7 9.9 19.8 35 7Self-employment 2.2 0.6 0.5 1 1 2.9 6 7
Retirement benefits 93.5 82.6 98.2 98.7 95.8 92.3Social Security 91.2 81.0 96.9 96.9 92.5 88.4BenefitsotherthanSocialSecurity 37 6 6 6 18.9 44.2 62.2 65.0
Other public pensions 12.5 1 3 4.0 10.5 20.9 29.5Railroad Retirement 0.6 0.2 0.7 0.5 1 1 0.8Government employee pensions 11.8 1.2 3.2 10.0 19.9 28.8
Military 1 3 0.2 0.1 0.7 2.4 3.8Federal 3 6 0.5 1 1 2.6 5 6 9.1State or local 7 3 0.4 2.1 6.8 12.2 17 5
Private pensions or annuities 26.4 5 3 15 1 34.6 43.1 39.3
Income from assets 51.8 24.7 38.2 59.2 64.8 78.8Interest 48.4 23.1 35.8 54.9 61.0 73 6Other income from assets 21.5 6.2 10.9 22.7 26.7 45.8
Dividends 16 7 3 3 7.0 17 6 20.9 38.9Rent or royalties 7.0 3 1 4.3 6 3 7 7 14.9Estatesortrusts 0.7 0 0 0.9 0.9 1.9
Veterans' benefits 3.4 1.9 2.5 3 3 5 1 4.7
Unemployment compensation 0.5 0.1 0.2 0.2 1 1 0.8
Workers' compensation 0.3 0.1 0.1 0.3 0.4 0.7
Cash public assistance and noncash benefits 16.4 36.2 23.3 10.5 6.2 1.9Cash public assistance 4.8 14.9 4.6 1 7 1 6 0.4
Supplemental Security Income 4.8 14.8 4.4 1 7 1 5 0.4Other 0.1 0.1 0.2 0 0.1 0
Noncash benefits 15.0 32.8 21.2 10.1 5.4 1.8Food 4.9 16.2 5 1 0.9 0.6 0.3Energy 4.6 8.9 7 6 3 7 1.4 0.2Housing 8.9 18.4 12.9 5.8 4.2 1 3
Personal contributions 1.2 1 6 0.8 1 3 1 3 0.8
Number(thousands) 11,448 2,366 2,668 2,236 2,072 2,107
(Continued)
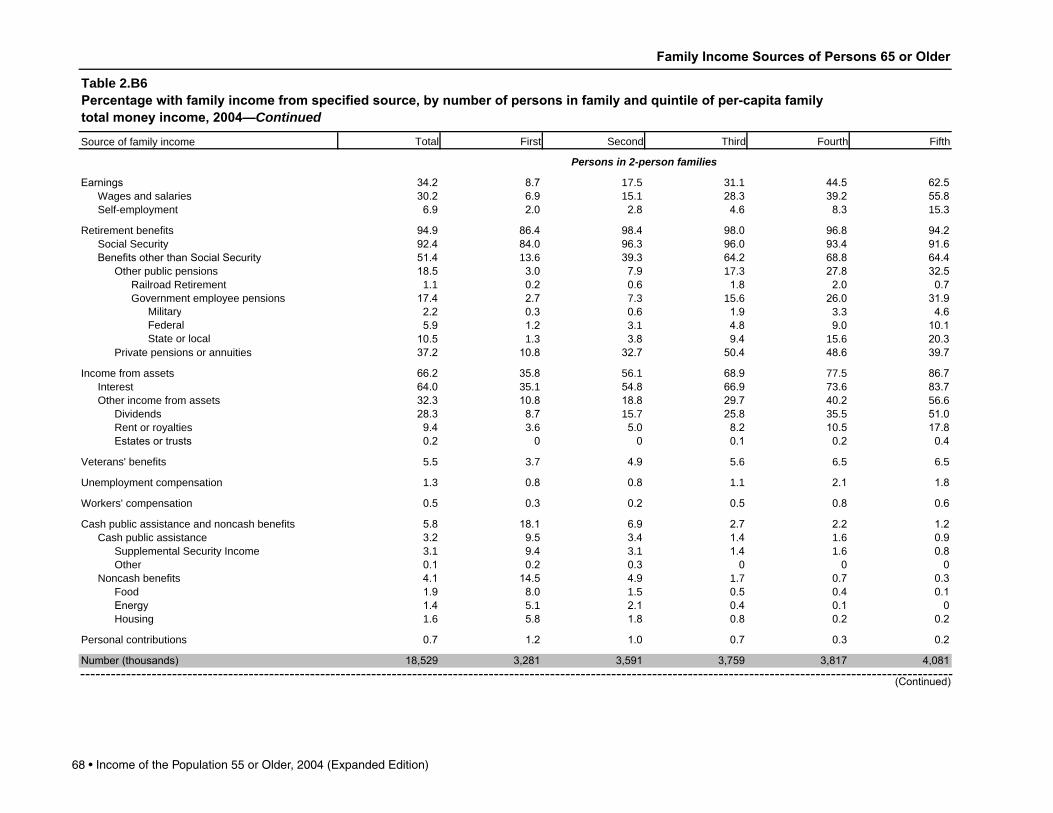
68 • Income of the Population 55 or Older, 2004 (Expanded Edition)
Family Income Sources of Persons 65 or Older
Table 2.B6Percentage with family income from specified source, by number of persons in family and quintile of per-capita familytotal money income, 2004—Continued
Source of family income Total First Second Third Fourth Fifth
Persons in 2-person families
Earnings 34.2 8.7 17 5 31 1 44.5 62.5Wages and salaries 30.2 6.9 15 1 28.3 39.2 55.8Self-employment 6.9 2.0 2.8 4.6 8.3 15 3
Retirement benefits 94.9 86.4 98.4 98.0 96.8 94.2Social Security 92.4 84.0 96.3 96.0 93.4 91.6BenefitsotherthanSocialSecurity 51.4 13 6 39.3 64.2 68.8 64.4
Other public pensions 18.5 3.0 7.9 17 3 27.8 32.5Railroad Retirement 1 1 0.2 0.6 1.8 2.0 0.7Government employee pensions 17.4 2.7 7 3 15 6 26.0 31.9
Military 2.2 0.3 0.6 1.9 3 3 4.6Federal 5.9 1.2 3 1 4.8 9.0 10.1State or local 10.5 1 3 3.8 9.4 15 6 20.3
Private pensions or annuities 37.2 10.8 32.7 50.4 48.6 39.7
Income from assets 66.2 35.8 56 1 68.9 77 5 86.7Interest 64.0 35 1 54.8 66.9 73 6 83.7Other income from assets 32.3 10.8 18.8 29.7 40.2 56 6
Dividends 28.3 8.7 15 7 25.8 35 5 51.0Rent or royalties 9.4 3 6 5.0 8.2 10.5 17.8Estatesortrusts 0.2 0 0 0.1 0.2 0.4
Veterans' benefits 5 5 3 7 4.9 5 6 6 5 6 5
Unemployment compensation 1 3 0.8 0.8 1 1 2.1 1.8
Workers' compensation 0.5 0.3 0.2 0.5 0.8 0.6
Cash public assistance and noncash benefits 5.8 18.1 6.9 2.7 2.2 1.2Cash public assistance 3.2 9.5 3.4 1.4 1 6 0.9
Supplemental Security Income 3 1 9.4 3 1 1.4 1 6 0.8Other 0.1 0.2 0.3 0 0 0
Noncash benefits 4.1 14.5 4.9 1 7 0.7 0.3Food 1.9 8.0 1 5 0.5 0.4 0.1Energy 1.4 5 1 2.1 0.4 0.1 0Housing 1 6 5.8 1.8 0.8 0.2 0.2
Personal contributions 0.7 1.2 1.0 0.7 0.3 0.2
Number(thousands) 18,529 3,281 3,591 3,759 3,817 4,081
(Continued)

Income of the Population 55 or Older, 2004 (Expanded Edition) • 69
Family Income Sources of Persons 65 or Older
Table 2.B6Percentage with family income from specified source, by number of persons in family and quintile of per-capita familytotal money income, 2004—Continued
Source of family income Total First Second Third Fourth Fifth
Persons in families of 3 or more
Earnings 82.5 58.5 83.6 88.6 95.2 96.0Wages and salaries 80.0 56.9 78.4 87.2 93.0 92.5Self-employment 11 1 5 5 10.0 7.0 15 1 20.7
Retirement benefits 85.0 75 5 85.5 88.3 91.1 88.0Social Security 81.3 71 1 82.3 85.5 86.5 85.0BenefitsotherthanSocialSecurity 36.0 17.0 28.3 43.8 46.7 49.6
Other public pensions 14.9 6 5 8.6 17.2 22.0 21.9Railroad Retirement 0.6 0.3 0.8 0.9 0.2 1.0Government employee pensions 14.4 6.2 7.8 16 3 21.9 21.5
Military 2.2 0.8 0.2 2.8 4.0 2.9Federal 4.8 2.6 2.9 5 6 6.4 7.2State or local 8.3 3.4 4.8 9.1 11.8 13 7
Private pensions or annuities 24.6 11.0 20.7 30.8 30.5 34.8
Income from assets 54.7 26.0 41.6 60.3 73 7 80.6Interest 52.0 23.9 39.2 58.1 70.7 76 5Other income from assets 24.6 8.7 14.5 24.7 33.8 47.3
Dividends 20.3 5.9 11 5 19.0 28.0 42.8Rent or royalties 7.8 3.4 4.5 7.9 9.5 15 7Estatesortrusts 0.1 0 0 0.1 0 0.2
Veterans' benefits 5 6 6 1 3.8 6 5 6 1 4.4
Unemployment compensation 6 1 4.7 8.6 7.9 5.2 5 1
Workers' compensation 2.4 1 7 4.4 1 3 3.0 2.1
Cash public assistance and noncash benefits 16.9 36 1 18.3 11.4 5.9 5 7Cash public assistance 12.2 23.1 13.2 10.0 5.4 5 7
Supplemental Security Income 10.6 18.7 11.9 9.3 5.2 5.2Other 2.4 7.0 1 7 1.0 0.2 0.4
Noncash benefits 8.4 24.3 8.9 2.2 0.7 0.2Food 7 1 20.5 7.0 2.0 0.5 0.2Energy 1 5 4.4 1 7 0.2 0 0Housing 1.4 4.3 1 3 0.2 0.1 0
Personal contributions 5.4 6 6 6 5 6.0 4.4 3 3
Number(thousands) 5,236 1,397 777 1,050 1,156 856
NOTE:Per-capitafamilytotalmoneyincomequintilelimitsare$9,508,$13,599,$19,120,and$30,199.
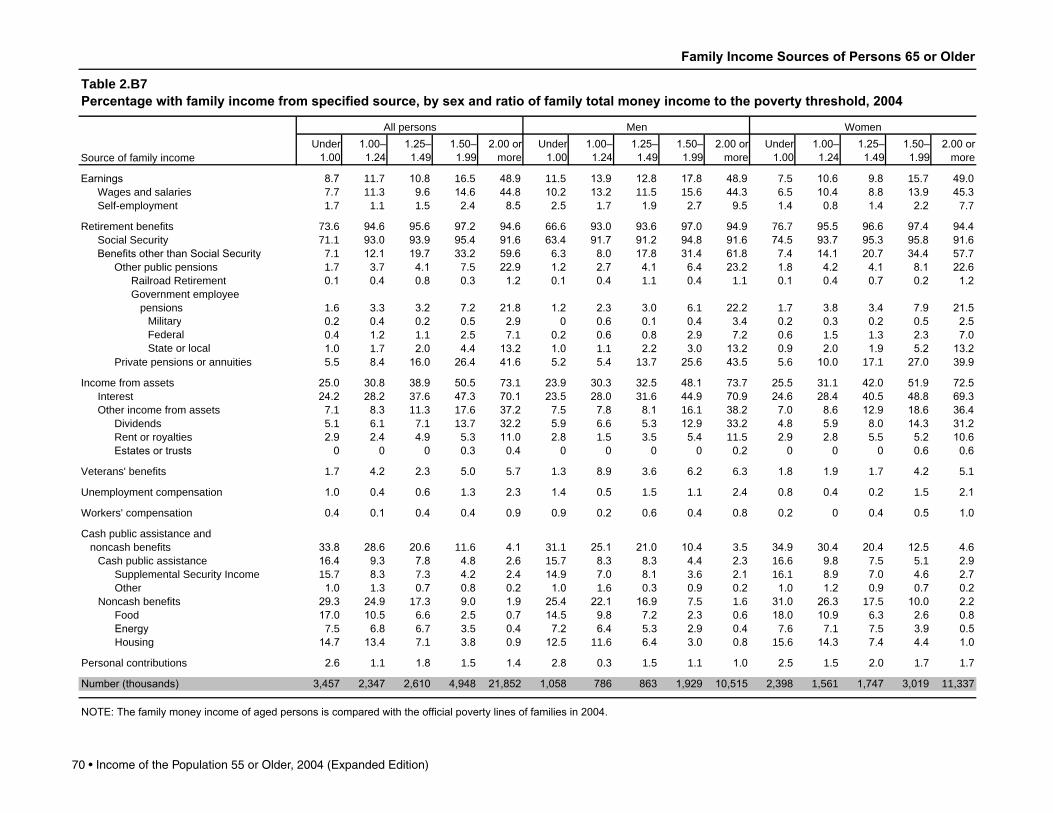
70 • Income of the Population 55 or Older, 2004 (Expanded Edition)
Family Income Sources of Persons 65 or Older
Table 2.B7Percentage with family income from specified source, by sex and ratio of family total money income to the poverty threshold, 2004
Source of family income
All persons Men WomenUnder1.00
1.00–1.24
1.25–1.49
1.50–1.99
2.00ormore
Under1.00
1.00–1.24
1.25–1.49
1.50–1.99
2.00ormore
Under1.00
1.00–1.24
1.25–1.49
1.50–1.99
2.00ormore
Earnings 8.7 11 7 10.8 16 5 48.9 11 5 13.9 12.8 17.8 48.9 7 5 10.6 9.8 15 7 49.0Wages and salaries 7 7 11 3 9.6 14.6 44.8 10.2 13.2 11 5 15 6 44.3 6 5 10.4 8.8 13.9 45.3Self-employment 1 7 1 1 1 5 2.4 8.5 2.5 1 7 1.9 2.7 9.5 1.4 0.8 1.4 2.2 7 7
Retirement benefits 73 6 94.6 95.6 97.2 94.6 66 6 93.0 93.6 97.0 94.9 76 7 95.5 96.6 97.4 94.4Social Security 71 1 93.0 93.9 95.4 91.6 63.4 91.7 91.2 94.8 91.6 74.5 93.7 95.3 95.8 91.6BenefitsotherthanSocialSecurity 7 1 12.1 19.7 33.2 59.6 6 3 8.0 17.8 31.4 61.8 7.4 14.1 20.7 34.4 57 7
Other public pensions 1 7 3 7 4.1 7 5 22.9 1.2 2.7 4.1 6.4 23.2 1.8 4.2 4.1 8.1 22.6Railroad Retirement 0.1 0.4 0.8 0.3 1.2 0.1 0.4 1 1 0.4 1 1 0.1 0.4 0.7 0.2 1.2Government employee pensions 1 6 3 3 3.2 7.2 21.8 1.2 2.3 3.0 6 1 22.2 1 7 3.8 3.4 7.9 21.5
Military 0.2 0.4 0.2 0.5 2.9 0 0.6 0.1 0.4 3.4 0.2 0.3 0.2 0.5 2.5Federal 0.4 1.2 1 1 2.5 7 1 0.2 0.6 0.8 2.9 7.2 0.6 1 5 1 3 2.3 7.0State or local 1.0 1 7 2.0 4.4 13.2 1.0 1 1 2.2 3.0 13.2 0.9 2.0 1.9 5.2 13.2
Private pensions or annuities 5 5 8.4 16.0 26.4 41.6 5.2 5.4 13 7 25.6 43.5 5 6 10.0 17 1 27.0 39.9
Income from assets 25.0 30.8 38.9 50.5 73 1 23.9 30.3 32.5 48.1 73 7 25.5 31 1 42.0 51.9 72.5Interest 24.2 28.2 37 6 47.3 70.1 23.5 28.0 31 6 44.9 70.9 24.6 28.4 40.5 48.8 69.3Other income from assets 7 1 8.3 11 3 17 6 37.2 7 5 7.8 8.1 16 1 38.2 7.0 8.6 12.9 18.6 36.4
Dividends 5 1 6 1 7 1 13 7 32.2 5.9 6 6 5 3 12.9 33.2 4.8 5.9 8.0 14.3 31.2Rent or royalties 2.9 2.4 4.9 5 3 11.0 2.8 1 5 3 5 5.4 11 5 2.9 2.8 5 5 5.2 10.6Estatesortrusts 0 0 0 0.3 0.4 0 0 0 0 0.2 0 0 0 0.6 0.6
Veterans' benefits 1 7 4.2 2.3 5.0 5 7 1 3 8.9 3 6 6.2 6 3 1.8 1.9 1 7 4.2 5 1
Unemployment compensation 1.0 0.4 0.6 1 3 2.3 1.4 0.5 1 5 1 1 2.4 0.8 0.4 0.2 1 5 2.1
Workers' compensation 0.4 0.1 0.4 0.4 0.9 0.9 0.2 0.6 0.4 0.8 0.2 0 0.4 0.5 1.0
Cash public assistance and noncash benefits 33.8 28.6 20.6 11 6 4.1 31 1 25.1 21.0 10.4 3 5 34.9 30.4 20.4 12.5 4.6
Cash public assistance 16.4 9.3 7.8 4.8 2.6 15 7 8.3 8.3 4.4 2.3 16 6 9.8 7 5 5 1 2.9Supplemental Security Income 15 7 8.3 7 3 4.2 2.4 14.9 7.0 8.1 3 6 2.1 16 1 8.9 7.0 4.6 2.7Other 1.0 1 3 0.7 0.8 0.2 1.0 1 6 0.3 0.9 0.2 1.0 1.2 0.9 0.7 0.2
Noncash benefits 29.3 24.9 17 3 9.0 1.9 25.4 22.1 16.9 7 5 1 6 31.0 26.3 17 5 10.0 2.2Food 17.0 10.5 6 6 2.5 0.7 14.5 9.8 7.2 2.3 0.6 18.0 10.9 6 3 2.6 0.8Energy 7 5 6.8 6 7 3 5 0.4 7.2 6.4 5 3 2.9 0.4 7 6 7 1 7 5 3.9 0.5Housing 14.7 13.4 7 1 3.8 0.9 12.5 11 6 6.4 3.0 0.8 15 6 14.3 7.4 4.4 1.0
Personal contributions 2.6 1 1 1.8 1 5 1.4 2.8 0.3 1 5 1 1 1.0 2.5 1 5 2.0 1 7 1 7
Number(thousands) 3,457 2,347 2,610 4,948 21,852 1,058 786 863 1,929 10,515 2,398 1,561 1,747 3,019 11,337
NOTE:Thefamilymoneyincomeofagedpersonsiscomparedwiththeofficialpovertylinesoffamiliesin2004.
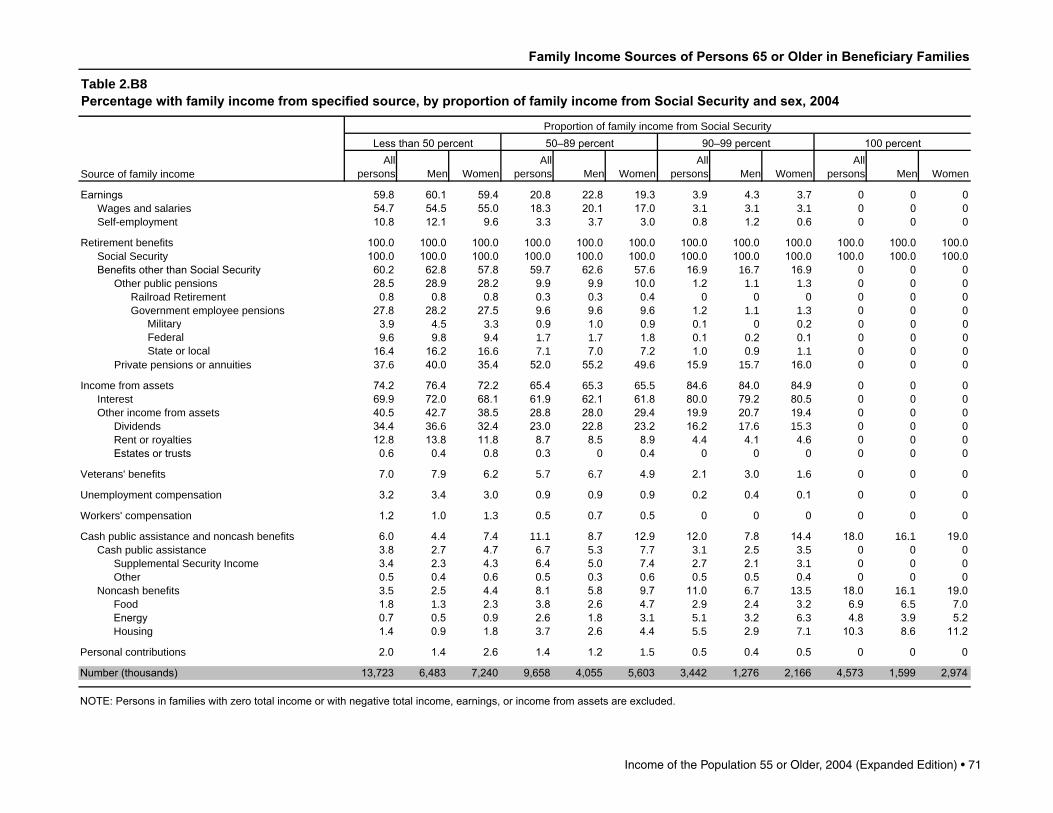
Income of the Population 55 or Older, 2004 (Expanded Edition) • 71
Family Income Sources of Persons 65 or Older in Beneficiary Families
Table 2.B8Percentage with family income from specified source, by proportion of family income from Social Security and sex, 2004
Source of family income
Proportion of family income from Social SecurityLessthan50percent 50–89percent 90–99percent 100percent
Allpersons Men Women
Allpersons Men Women
Allpersons Men Women
Allpersons Men Women
Earnings 59.8 60.1 59.4 20.8 22.8 19.3 3.9 4.3 3 7 0 0 0Wages and salaries 54.7 54.5 55.0 18.3 20.1 17.0 3 1 3 1 3 1 0 0 0Self-employment 10.8 12.1 9.6 3 3 3 7 3.0 0.8 1.2 0.6 0 0 0
Retirement benefits 100.0 100.0 100.0 100.0 100.0 100.0 100.0 100.0 100.0 100.0 100.0 100.0Social Security 100.0 100.0 100.0 100.0 100.0 100.0 100.0 100.0 100.0 100.0 100.0 100.0BenefitsotherthanSocialSecurity 60.2 62.8 57.8 59.7 62.6 57 6 16.9 16 7 16.9 0 0 0
Other public pensions 28.5 28.9 28.2 9.9 9.9 10.0 1.2 1 1 1 3 0 0 0Railroad Retirement 0.8 0.8 0.8 0.3 0.3 0.4 0 0 0 0 0 0Government employee pensions 27.8 28.2 27.5 9.6 9.6 9.6 1.2 1 1 1 3 0 0 0
Military 3.9 4.5 3 3 0.9 1.0 0.9 0.1 0 0.2 0 0 0Federal 9.6 9.8 9.4 1 7 1 7 1.8 0.1 0.2 0.1 0 0 0State or local 16.4 16.2 16 6 7 1 7.0 7.2 1.0 0.9 1 1 0 0 0
Private pensions or annuities 37 6 40.0 35.4 52.0 55.2 49.6 15.9 15 7 16.0 0 0 0
Income from assets 74.2 76.4 72.2 65.4 65 3 65 5 84.6 84.0 84.9 0 0 0Interest 69.9 72.0 68.1 61.9 62.1 61.8 80.0 79.2 80.5 0 0 0Other income from assets 40.5 42.7 38.5 28.8 28.0 29.4 19.9 20.7 19.4 0 0 0
Dividends 34.4 36 6 32.4 23.0 22.8 23.2 16.2 17 6 15 3 0 0 0Rent or royalties 12.8 13.8 11.8 8.7 8.5 8.9 4.4 4.1 4.6 0 0 0Estatesortrusts 0.6 0.4 0.8 0.3 0 0.4 0 0 0 0 0 0
Veterans' benefits 7.0 7.9 6.2 5 7 6 7 4.9 2.1 3.0 1 6 0 0 0
Unemployment compensation 3.2 3.4 3.0 0.9 0.9 0.9 0.2 0.4 0.1 0 0 0
Workers' compensation 1.2 1.0 1 3 0.5 0.7 0.5 0 0 0 0 0 0
Cash public assistance and noncash benefits 6.0 4.4 7.4 11 1 8.7 12.9 12.0 7.8 14.4 18.0 16 1 19.0Cash public assistance 3.8 2.7 4.7 6 7 5 3 7 7 3 1 2.5 3 5 0 0 0
Supplemental Security Income 3.4 2.3 4.3 6.4 5.0 7.4 2.7 2.1 3 1 0 0 0Other 0.5 0.4 0.6 0.5 0.3 0.6 0.5 0.5 0.4 0 0 0
Noncash benefits 3 5 2.5 4.4 8.1 5.8 9.7 11.0 6 7 13 5 18.0 16 1 19.0Food 1.8 1 3 2.3 3.8 2.6 4.7 2.9 2.4 3.2 6.9 6 5 7.0Energy 0.7 0.5 0.9 2.6 1.8 3 1 5 1 3.2 6 3 4.8 3.9 5.2Housing 1.4 0.9 1.8 3 7 2.6 4.4 5 5 2.9 7 1 10.3 8.6 11.2
Personal contributions 2.0 1.4 2.6 1.4 1.2 1 5 0.5 0.4 0.5 0 0 0
Number(thousands) 13,723 6,483 7,240 9,658 4,055 5,603 3,442 1,276 2,166 4,573 1,599 2,974
NOTE:Personsinfamilieswithzerototalincomeorwithnegativetotalincome,earnings,orincomefromassetsareexcluded.


![Low Income Household Water Assistance Program [Autosaved]](https://img.pdfslide.net/doc/110x75/625182b5fb60637d923def3c/low-income-household-water-assistance-program-autosaved.jpg)