Embed Size (px)
Citation preview
ource CharacterizationResouourand Monitoring
Ground Water Ground Water Ground Water Ground Water Ground Water Ground Water Ground Water Ground Water Ground Water Ground Water Ground Water Ground Water Ground Water Ground Water Ground Water Ground Water Ground Water Ground Water Ground Water Ground Water Ground Water Ground Water Ground Water Ground Water Ground Water Ground Water Ground Water Ground Water Ground Water Ground Water Ground Water Ground Water Ground Water Ground Water Ground Water Ground Water Ground Water Ground Water
As a nation, efforts to monitor and characterize ground water resources with
regard to quantity and quality have been sporadic and, while successful in some
local jurisdictions and watersheds, largely inadequate. We need to collect more
reliable, consistent, and comprehensive data that will sufficiently characterize
ground water quality and quantity in order to support critical water resource
use, protection, and management decisions. This should be done through a
coordinated (federal, state, and local) national data collection and monitoring
program that gives decision makers the ability to identify such critical
information as:
• Baseline ambient ground water quality.
• Where and how ground water quality is being degraded.
• Location of ground water recharge areas.
• Patterns of ground water withdrawal and recharge within identified
watersheds (to sustainably allocate resources and maintain healthy
ecosystems).
• Ground water contribution to stream baseflows and areas of ground
water/surface water interaction.
• Relationship and significance of ground water quantity and quality
to the maintenance of healthy rivers, lakes, streams, wildlife
habitats, and fisheries within given hydrogeologic settings.
Key Message
Section 3
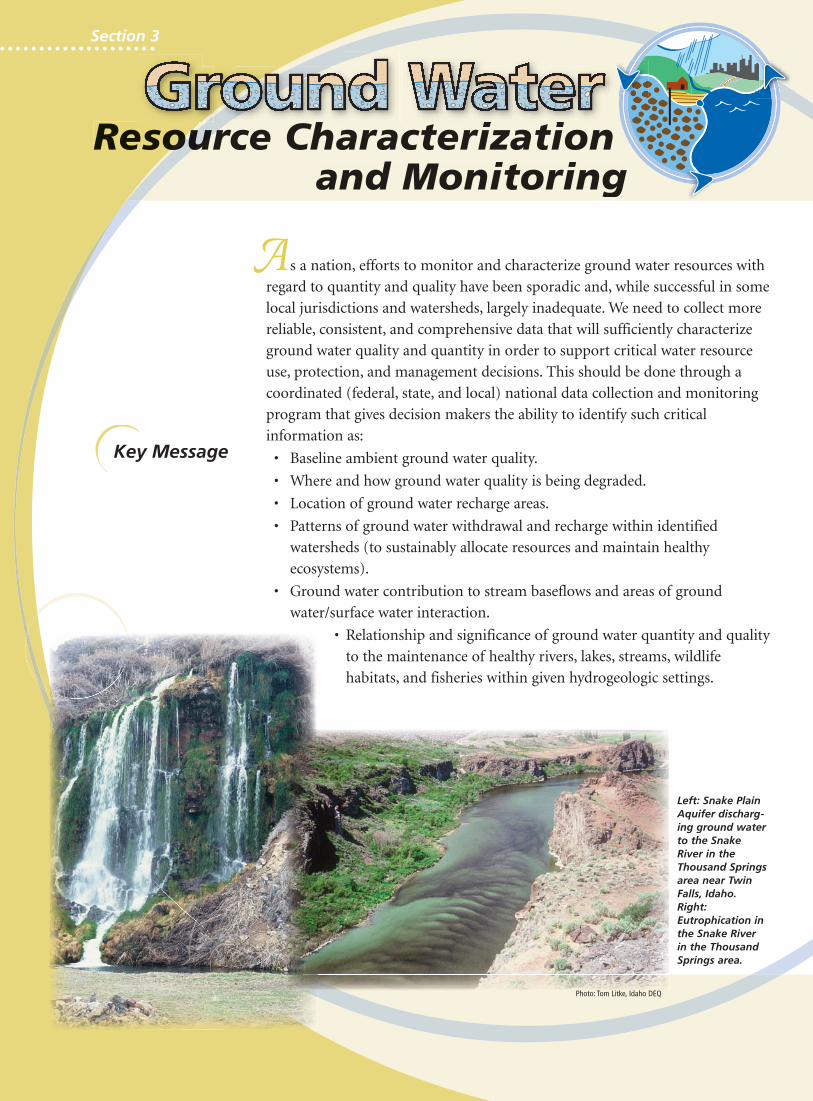
Photo: Tom Litke, Idaho DEQ
Left: Snake PlainAquifer discharg-ing ground waterto the SnakeRiver in theThousand Springsarea near TwinFalls, Idaho.Right:Eutrophication inthe Snake Riverin the ThousandSprings area.
Ground Water Report to the Nation…A Call to Action
3 • 2
whyground water ResourceCharacterization
and Monitoring matter…
While we have made strides in understanding how ground water/surface water systems work,
our ability to characterize how our human activities affect the many natural processes and inter-
actions inherent to specific systems has been constrained. This is primarily due to the lack of
long-term sustained support and funding for ground water quality and quantity data collection,
analysis, research and development trends, and information dissemination.
“The primary challenge related to hydrologic forecasting is in forecasting coming
variations in water availability (and water quality), not just amounts of water
expected based on ‘average conditions.’ To make advances in forecasting, more
comprehensive assessments of the amounts of water stored in the atmosphere,
surface, and subsurface, as well as the exchange between these, are needed.”Science and Technology to Support Fresh Water Availability in the United States | Report of the National Science and Technology
Council Committee on Environment and Natural Resources | November 2004
At a time when water scarcity is a concern in so manyareas of the country, when water allocation and with-drawal practices are creating conflict and upsettingnatural systems, and when contamination threats toground water from human activities are pervasive, wecannot afford to come up short in our ability toensure an adequate water supply for our nation’sfuture. Without the benefit of reliable and compre-hensive data on the quantity and availability ofground water resources, it is difficult to support piv-otal and increasingly contentious decisions regardingthe allocation of ground water resources amongstates, regions, communities, and a variety of com-peting uses.
According to a July 2003 report by the United StatesGeneral Accounting Office (GAO)—“National wateravailability and use has not been comprehensivelyassessed in 25 years, but current trends indicate thatdemands on the nation’s supplies are growing.” TheNational Ground Water Association (NGWA) hasstated: “We lack fundamental data necessary tounderstand adequately the nation’s ground waterresources and make informed decisions regarding itsuse and management.” (NGWA, 2004) And accordingto a June 2004 GAO report, ground water level dataare not being collected by any federal agencies on anational scale; although the U.S. Geological Survey(USGS) and National Park Service are collecting dataon a regional basis.
Do We Have Enough Water? Do We Have Enough Water?
The need to expand research and monitoring effortsand develop a comprehensive, consistent, and reliabledatabase from which to better understand and char-acterize existing conditions, identify existing andpotential problems, establish priorities, and developviable water policies and strategies is at the very leastcompelling. Current programs of acquiring and man-aging water-monitoring data are inadequate to meetour water quantity and quality challenges.
The potential for severe economic consequences hasnot been exaggerated. Policy makers at all levels ofgovernment will be faced with crucial decisionsregarding growth and development alternatives andtradeoffs. These decisions must be based on high-quality data. Because our water resources are inte-grated, decisions in one area can have negative reper-cussions in other areas. With adequate and reliablemonitoring programs and data, such negative conse-quences can be managed and minimized.
In this report, the Ground Water Protection Councilis adding its voice to a growing chorus of distin-guished entities (e.g., NGWA, GAO, the NationalScience and Technology Council’s Committee onEnvironment and Natural Resources) that have care-fully assessed our ability to secure sustainable fresh-water resources and have decried the overall lack offundamental ground water data and a system formanaging such data.
CHARACTERIZING AND MONITORING THE GROUND WATER SYSTEM
As stated by the NGWA (2004), “Obtaining accuratedata on water use and the sustainable yield ofaquifers, knowing past and current land-use andpumping rates as well as identifying human andecosystem water needs are integral to managing andprotecting the nation’s ground water resources.” Inthis regard, we have a lot of catching up to do inunderstanding the status and relationships of ourground water and ground water/surface water sys-tems. For example, one of the most fundamental real-ities concerning surface water and ground water isthat they are, in many cases, hydraulically connect-ed—what happens to one affects the other. Yet thiscrucial fact has been all too often ignored in watermanagement considerations and policies.
3 • 3
Section 3 • Ground Water Resource Characterization and Monitoring
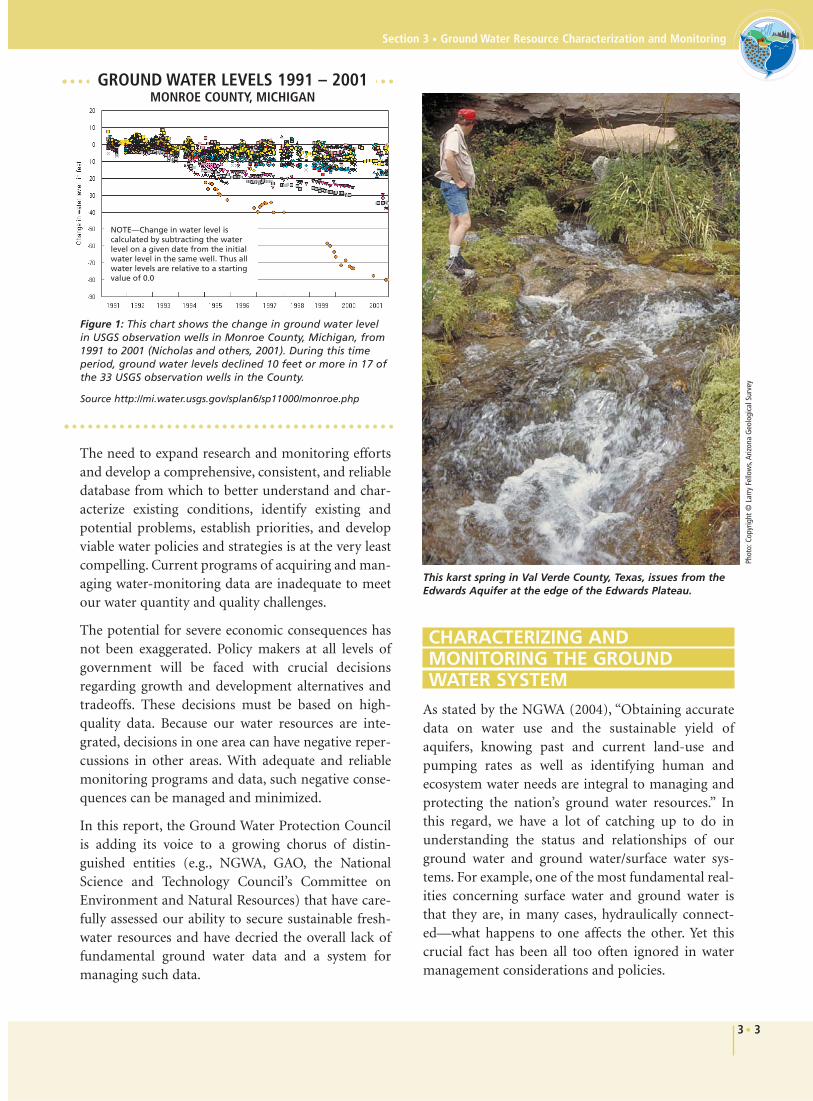
NOTE—Change in water level iscalculated by subtracting the waterlevel on a given date from the initialwater level in the same well. Thus allwater levels are relative to a startingvalue of 0.0
Figure 1: This chart shows the change in ground water levelin USGS observation wells in Monroe County, Michigan, from1991 to 2001 (Nicholas and others, 2001). During this timeperiod, ground water levels declined 10 feet or more in 17 ofthe 33 USGS observation wells in the County.
Source http://mi.water.usgs.gov/splan6/sp11000/monroe.php
GROUND WATER LEVELS 1991 – 2001MONROE COUNTY, MICHIGAN
This karst spring in Val Verde County, Texas, issues from theEdwards Aquifer at the edge of the Edwards Plateau.
Phot
o:Co
pyrig
ht ©
Lar
ry F
ello
ws,
Ariz
ona
Geo
logi
cal S
urve
y
Ground Water Report to the Nation…A Call to Action
Since ground water is out of sight and less accessiblethan surface water, it is more difficult and expensiveto monitor with respect to quality, quantity, andmovement in specific aquifers. It is relatively simpleto take a water sample from a stream in order to mon-itor surface water, but it takes drilling and well sam-pling to monitor ground water. In layered aquifers,sampling is even more expensive and complicatedbecause it is necessary to determine which layer(s)should be monitored, which may entail coring theformation ahead of time. (Winter et al. 1998)
Ground water management should be aquifer-basedand an integral part of watershed management.Aquifers are the natural units of management forground water within the watershed context. Forexample, we can only get a complete picture of theimpacts, or potential impacts, of contaminationsources by monitoring the whole watershed, includ-ing ground water. When determining the TotalMaximum Daily Load (TMDL) for a stream segment,it is critical to monitor the ground water contributingto the stream. It is incorrect to think that groundwater/surface water resource protection and develop-ment decisions can be made in the absence of a com-prehensive resource assessment.
OUR INCOMPLETE RESOURCE ASSESSMENT
Currently, our understanding of ground water avail-ability and quality is like a jigsaw puzzle with a sub-stantial assortment of missing pieces—the insuffi-cient data. This shortage of critical ground waterinformation was recognized by the Subcommittee onWater Availability and Quality, part of the NationalScience and Technology Council’s (NSTC’s)Committee on the Environment and NaturalResources, in its November 2004 report Science andTechnology to Support Fresh Water Availability in theUnited States.
The NSTC is a cabinet-level council, and it is theprincipal means for the President to coordinate sci-ence and technology policies across the federal gov-ernment. An important objective of the NSTC is theestablishment of clear national goals for federal sci-ence and technology investments. The 2004 reportfocuses on science issues and policy related to needed
improvements in technology and research that willadvance the goal of ensuring a safe and sustainablesupply of water in the United States for human andecological needs.
The report does a good job of defining the problem,providing recommendations for action, and identify-ing the types of information that needs to be collect-ed from monitoring efforts in order to answer impor-tant questions. It also does a good job of acknowledg-ing the importance of ground water and specificallystates the need for “renewed synthesis and collectionof ground water resources data on the regional andnational scale through process-based regional assess-ments of the nation’s ground water resources.” This isperhaps the strongest statement of need and urgencyfor monitoring that has come from the federal level inquite some time.
USEPA and State Monitoring ProgramsSection 106(e)(1) of the Clean Water Act (CWA)requires USEPA to determine that a state is monitor-ing the quality of navigable waters, compiling andanalyzing data on water quality, and including thisinformation in the state’s Section 305(b) report priorto the award of Section 106 grant funds. However,states are not required to report on ground waterquality and conditions.
In March 2003, USEPA took the step of publishingthe guidance Elements of a State Water Monitoring andAssessment Program, which states were expected to
3 • 4
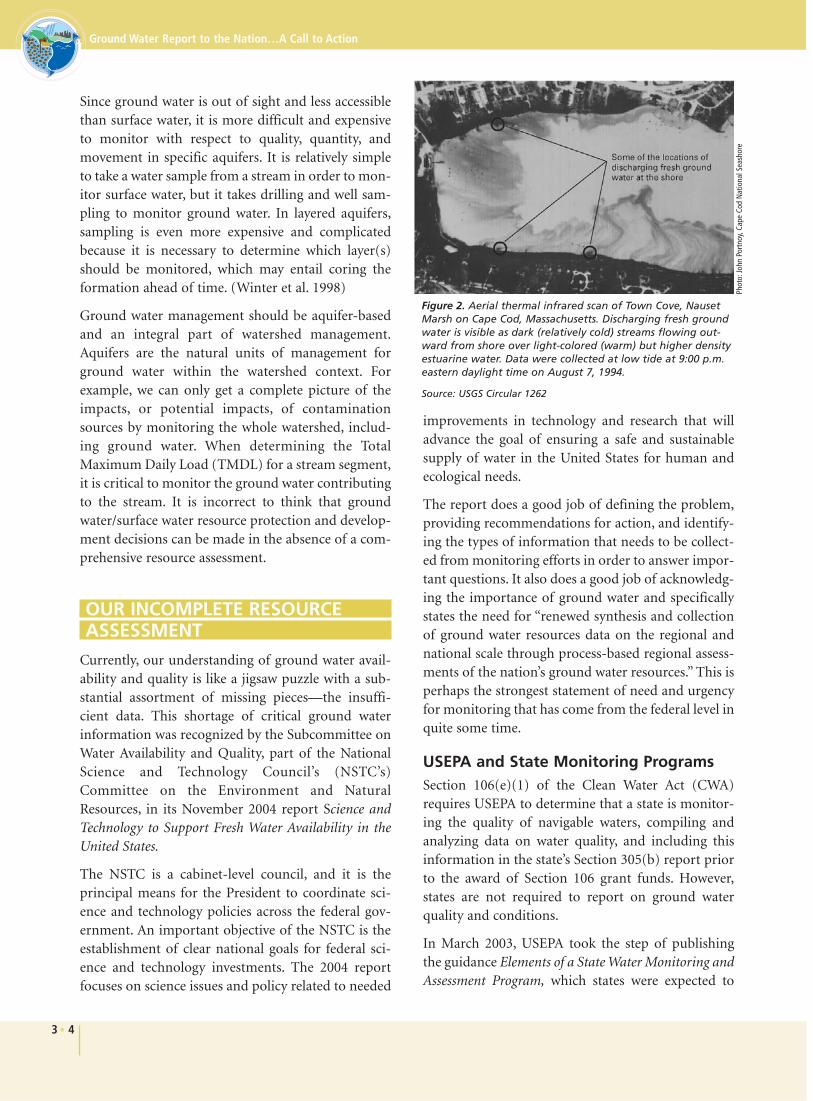
Figure 2. Aerial thermal infrared scan of Town Cove, NausetMarsh on Cape Cod, Massachusetts. Discharging fresh groundwater is visible as dark (relatively cold) streams flowing out-ward from shore over light-colored (warm) but higher densityestuarine water. Data were collected at low tide at 9:00 p.m.eastern daylight time on August 7, 1994.
Source: USGS Circular 1262
Phot
o:Jo
hn P
ortn
oy,C
ape
Cod
Nat
iona
l Sea
shor
e
follow in developing strategies and plans to monitortheir water resources. The guidance “...recommendsthe basic elements of a state water-monitoring pro-gram and serves as a tool to help EPA and the statedetermine whether a monitoring program meets theprerequisites of CWA Section 106(e)(1)” (from covermemo).
The first of ten required “elements” of the guidancesays that state monitoring strategies are to address allstate waters, including ground water. According to theresults of a GWPC-NGWA 2006 Survey of StateGround water Programs, 30 states have includedsome ground water monitoring component in theirmonitoring program strategies, but the amount ofUSEPA support or emphasis placed on the groundwater components of the strategies varies amongregions.
There are several reasons why ground water monitor-ing is often either left out or minimized in many statestrategies:
• Those at USEPA responsible for coordinatingwith states to develop strategies are largely in theagency’s surface water monitoring programs(i.e., National Pollutant Discharge EliminationSystem [NPDES] and Total Maximum DailyLoads [TMDLs], so coordination with statesfocuses primarily on state surface water pro-grams, and not state ground water programs.Clearly, the lack of a viable ground water pro-gram within USEPA creates a void for commu-nicating the ground water portion of the strate-gy guidance to state ground water monitoringprograms.
• Federal funding to support state surface water andground water programs comes from the same“pool” of grant monies—CWA Section 106.Without clear instruction from USEPA that thestate monitoring strategy must address groundwater as well as surface water, it is not in the bestinterest of state surface water (monitoring) pro-grams to include a ground water monitoringcomponent that would effectively divert resourcesaway from and diminish their own efforts. And,only the monitoring described in these strategiesis eligible for CWA Section 106 funding.
If a state monitoring strategy does not include aground water monitoring goal, there is little basis for
USEPA to press states to meet that goal or to assistthem in meeting that goal by providing supplementalfunding. Without such funding, many states do nothave the resources to develop and implement astatewide, ambient ground water monitoring pro-gram. Given that the monitoring described in thestrategy is to be completed within 10 years, manystates have yet to begin any systematic ground watermonitoring whatsoever. That being said, some statesdo have long-standing, strong ground water monitor-ing strategies and programs. Others have recentlymade progress.
3 • 5
Section 3 • Ground Water Resource Characterization and Monitoring
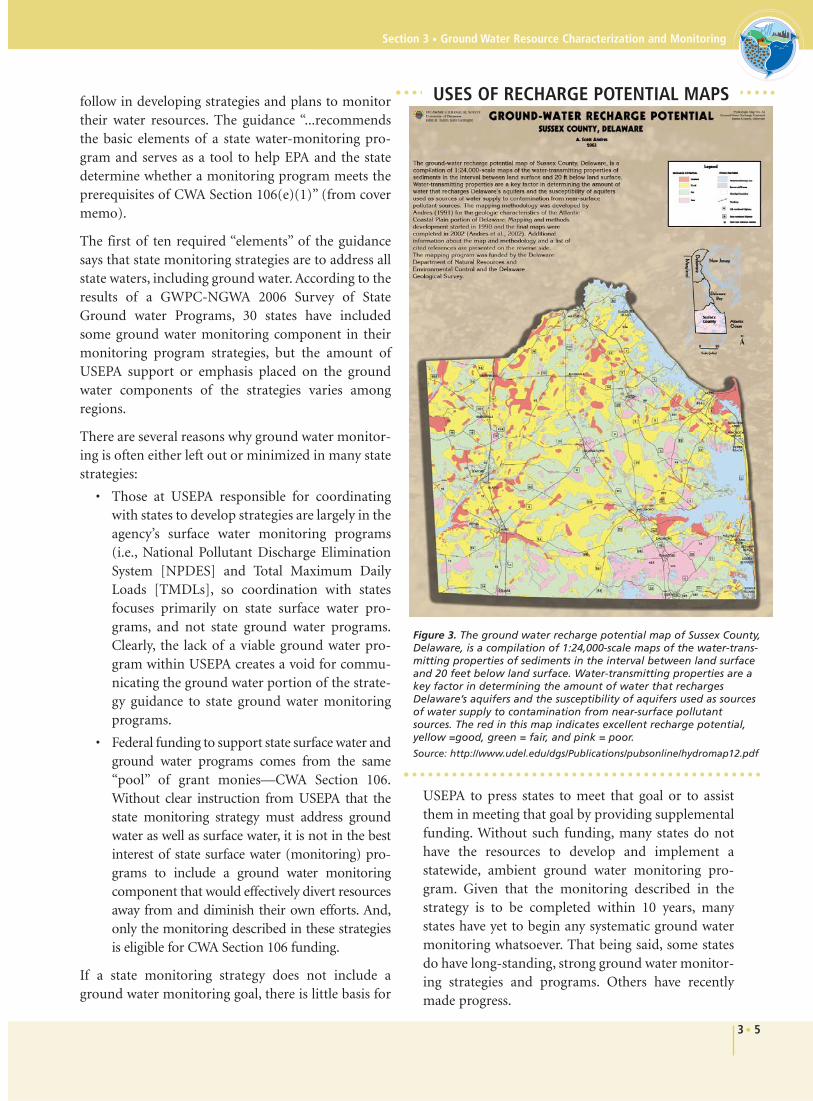
Figure 3. The ground water recharge potential map of Sussex County,Delaware, is a compilation of 1:24,000-scale maps of the water-trans-mitting properties of sediments in the interval between land surfaceand 20 feet below land surface. Water-transmitting properties are akey factor in determining the amount of water that rechargesDelaware’s aquifers and the susceptibility of aquifers used as sourcesof water supply to contamination from near-surface pollutantsources. The red in this map indicates excellent recharge potential,yellow =good, green = fair, and pink = poor.
Source: http://www.udel.edu/dgs/Publications/pubsonline/hydromap12.pdf
USES OF RECHARGE POTENTIAL MAPS
Ground Water Report to the Nation…A Call to Action
For example, in Vermont, lawmakers recently (2006)gave a crucial jumpstart to a long-ignored law whenthey appropriated more than $300,000 to get a map-ping program started. Although the Agency ofNatural Resources has had the statutory authority tomap the state’s ground water since 1985, this is thefirst time money has been earmarked specifically forthe purpose of mapping, which is an essential firststep. As demand for ground water continues to grow(two-thirds of the state’s population relies onground water for its drinking water), the state’s law-makers are recognizing the importance of groundwater and taking needed action toward passingcomprehensive ground water protection legislation.As a start, the House passed a requirement that mostlarge users of ground water report how much waterthey are using.
Recently, USEPA, along with the USGS and theGround Water Protection Council (GWPC), hastaken a very positive step to encourage ground watermonitoring on a national scale. In January 2007, anational Subcommittee on Ground Water wasformed by the Advisory Committee on WaterInformation (ACWI). Members include representa-
3 • 6
Moses Lake has historically exhibited eutrophic orhypereutrophic conditions, and is listed as a federalClean Water Act 303(d) “impaired waterbody.”Phosphorus has been identified as the limitingnutrient for the lake. Based on characteristic uses ofthe lake, an in-lake total phosphorus concentrationtarget of 0.050 mg/L has been proposed to managewater quality concerns. In order to develop an allo-cation strategy for phosphorus loading to the lake,a TMDL study was conducted by the WashingtonState Department of Ecology.
To better characterize the concentration and poten-tial source of nutrients in ground water directly dis-charging to the lake, 12 lake-bed monitoring sta-tions were installed. The majority of stations (75%)exhibited ground water organophosphorus (OP)concentrations above the 0.050 mg/L surface watertarget criteria. Concentrations of OP in ground
water generally increased from north to south, par-alleling increases in concentrations of parametersthat indicate anthropogenic (human-caused)impact to water quality.
A statistically significant relationship was estab-lished between OP concentration and the relativepercentage of urban development upgradient ofeach station. These findings suggest that urbanreleases of wastewater to the aquifer are the pri-mary source of phosphorus entering the lake viaground water discharge. Loading calculations pre-dict an annual OP mass flux to the lake fromapproximately 400 to 40,000 kgop per year viaground water discharge, with a value from 10,000to 20,000 kgop per year considered the best esti-mate of field conditions.
Source: http://www.ecy.wa.gov/pubs/0303005.pd
TMDL STUDY IDENTIFIES GROUND WATER’S CONTRIBUTION TOPHOSPHORUS LOADING IN WASHINGTON STATE’S MOSES LAKE
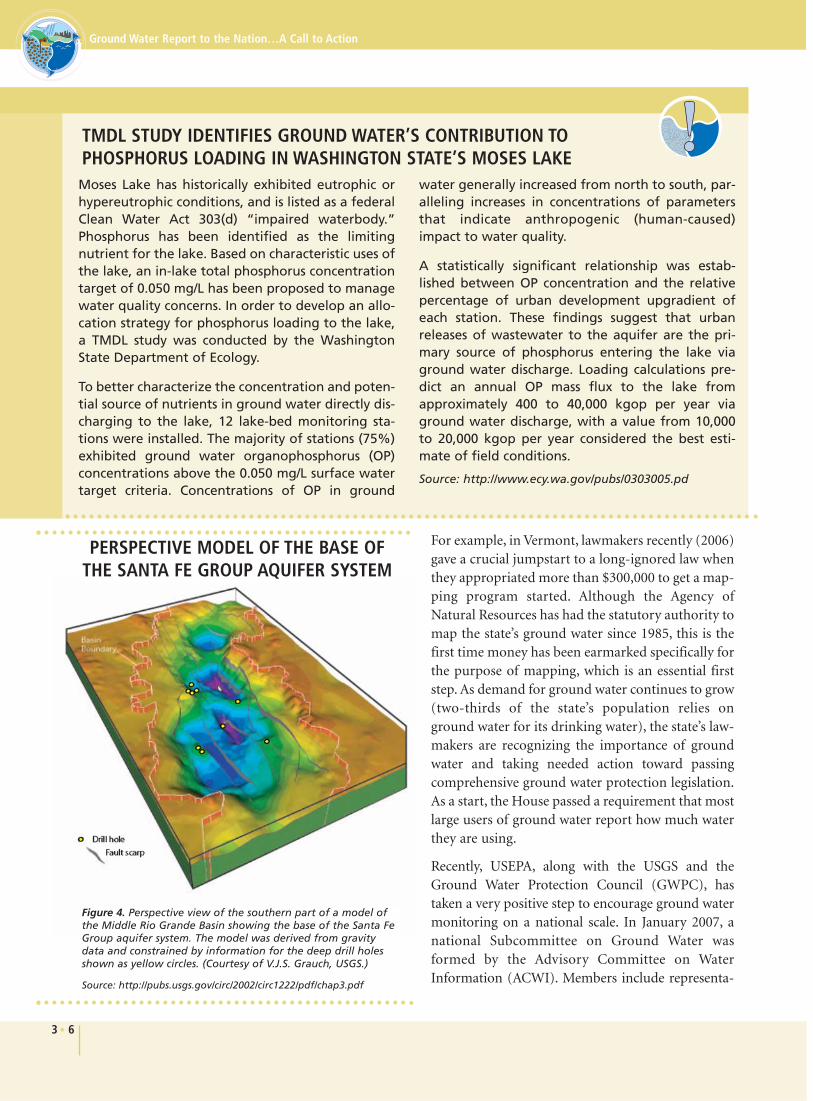
Figure 4. Perspective view of the southern part of a model ofthe Middle Rio Grande Basin showing the base of the Santa FeGroup aquifer system. The model was derived from gravitydata and constrained by information for the deep drill holesshown as yellow circles. (Courtesy of V.J.S. Grauch, USGS.)
Source: http://pubs.usgs.gov/circ/2002/circ1222/pdf/chap3.pdf
PERSPECTIVE MODEL OF THE BASE OFTHE SANTA FE GROUP AQUIFER SYSTEM
tion from USGS, American Society of Civil Engineers,NGWA, GWPC, Water Environment Federation,USEPA, Association of State Geologists, InterstateConference on Water Policy, and the National WaterQuality Monitoring Council.
The goal of the new subcommittee is to develop anational framework and network design for groundwater monitoring, with particular emphasis onchanges in the availability of potable water. Integratedmonitoring design and consistent data reporting willimprove information needed to make timely and eco-nomically efficient and effective ground water man-agement decisions.
In 2006, the NGWA and the GWPC developed adetailed set of questions regarding ground waterquality and quantity protection programs from acomprehensive list of ground water agencies. Theresults of this survey will help assess existing groundwater quality and quantity data availability issues.
In late 2006 the American Water Works AssociationResearch Foundation announced that it will surveyutilities and user groups in an attempt to assess theirinterest in having accessible ground water quality andquantity data. The results of this study could be a cat-alyst for increased national interest and funding for acentralized ground water data center.
And What About TMDLs? Short-changing attention to ground water monitoringhas an impact on Total Maximum Daily Load (TMDL)development. Section 303(d) of the Clean Water Actrequires states to identify waters that are impaired bypollution and to establish a TMDL of selected pollu-tants to ensure that water quality standards can beattained. TMDLs are intended to quantify all pollutionsources, including point discharges from municipali-ties and industry and nonpoint sources.
A TMDL is a calculation of the maximum amount ofa pollutant that a body of water can receive and stillmeet its designated use as determined by water qual-ity standards. On that basis, a specified amount ofpollutant becomes acceptable for discharge into thewater body. In other words, a TMDL is the sum of theallowable loads of a single pollutant from all con-tributing point and nonpoint sources. If pollutantloads coming from ground water into surface waterare not included in this calculation, then those pollu-
tants are not being factored into the protection of agiven water body.
Ground water can be a major contributor to streamsand rivers, and contaminated aquifers that dischargeto streams can thereby serve as nonpoint sources ofcontaminants to surface water. Quantifying the con-tribution is, therefore, a critical step in developingwater quality standards and criteria, issuing permits,and meeting Clean Water Act goals for swimmable,fishable, and drinkable waters. Yet ground waterinputs are typically not included in estimates of con-taminant loads in streams. The TMDL process shouldinclude ground water so that all pollution sources willbe considered and the process will be effective in pro-tecting and restoring streams.
Likewise, surface water can be a major contributor toground water, serving as a major nonpoint source ofcontamination to aquifers, particularly where high-capacity public water supply wells are located nearstreams and rivers. While ground water is generallythought to be safe for consumption without watertreatment, ground water from wells located nearstreams can share the same contaminants as the surfacewater recharging the well. Water managers should con-sider such connections when developing source waterand wellhead-protection strategies. (NAWQA, 2007)
WHAT DO WE NEED TO KNOW ABOUT GROUND WATER?
Hydrogeologic mapping and ground water monitoringnetworks (including ambient, impacted-area, and
3 • 7
Section 3 • Ground Water Resource Characterization and Monitoring
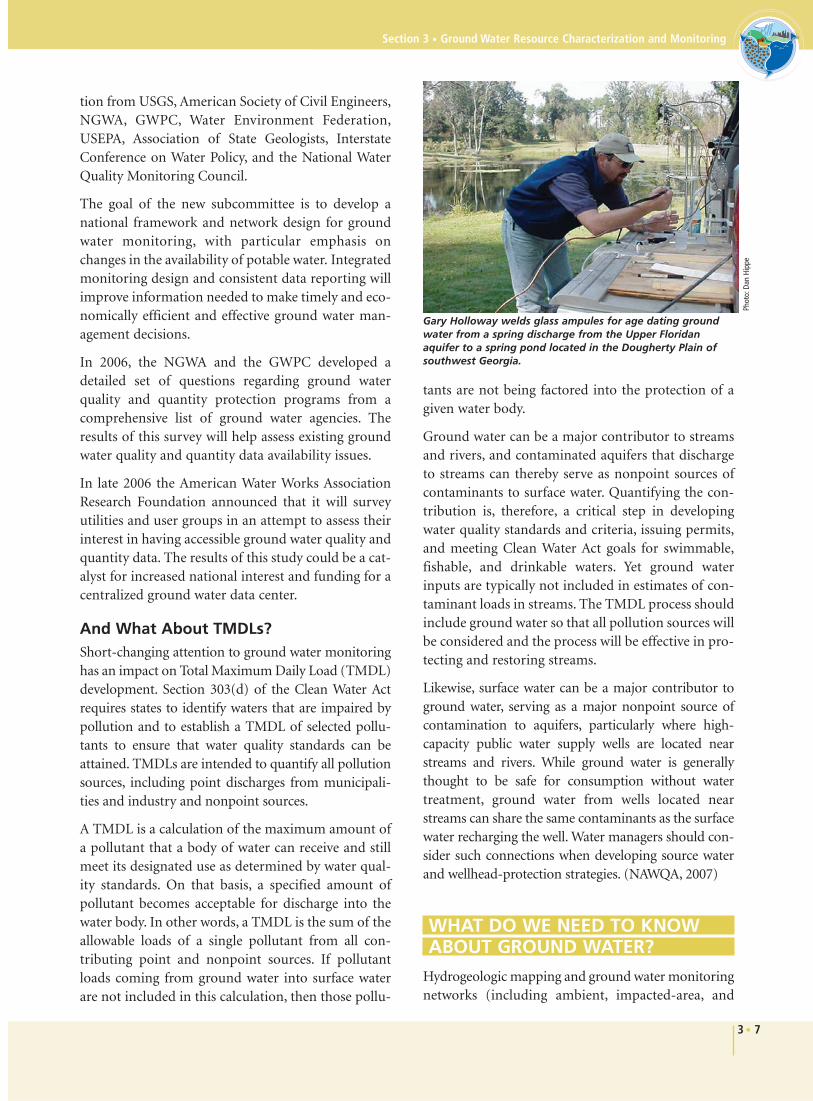
Gary Holloway welds glass ampules for age dating groundwater from a spring discharge from the Upper Floridanaquifer to a spring pond located in the Dougherty Plain ofsouthwest Georgia.
Phot
o:Da
n Hi
ppe
targeted monitoring) are needed to ensure the avail-ability of quality data at the appropriate scale to makesound ground water planning, management, anddevelopment decisions. Information is necessary todetermine:
• Where ground water resources are located (bothcurrent and future sources of drinking water aswell as ground water that may be more suitablefor other uses).
• Where ground water/surface water interactionis occurring.
• How much ground water is sustainably availablefor human uses (i.e., the ability of the groundwater resource to support current and addition-al population growth and development).
• How much ground water is needed to sustainhealthy ecosystems.
• Location of ground water recharge areas.
• Background quality of ground water (i.e., ambi-ent ground water monitoring).
• Appropriate uses of ground water of varyingquality.
• Design and effectiveness of ground water man-agement and protection programs.
• Short- and long-term changes in ground waterrecharge, storage, flow direction, and quality, as
impacted by land use, land-use changes, climat-ic variability, and water use.
• Potential opportunities to artificially rechargethe ground water supply in order to renew theresource and provide cost-effective water stor-age water for future use.
What Constitutes SufficientCharacterization and Monitoring?Sufficient characterization and monitoring refers tothe development of a comprehensive, consistent, anddefensible database from which to better understandand characterize existing conditions, identify existingand potential problems, establish priorities, anddevelop viable water policies and strategies. Itincludes identifying the appropriate period of moni-toring, the number of wells or stations per watershed,and the group of parameters monitored in order torepresent adequate indicators of pollution.
An October 1993 USEPA document, Ground WaterResource Assessment, written during a time whenground water received a good deal more attentionwithin the agency than it does today, contains valuableinformation that is as valid today as it was when thedocument was published. The document lists tencomponents that are necessary to characterize thephysical and chemical properties of the ground waterresource:
Ground Water Report to the Nation…A Call to Action
3 • 8
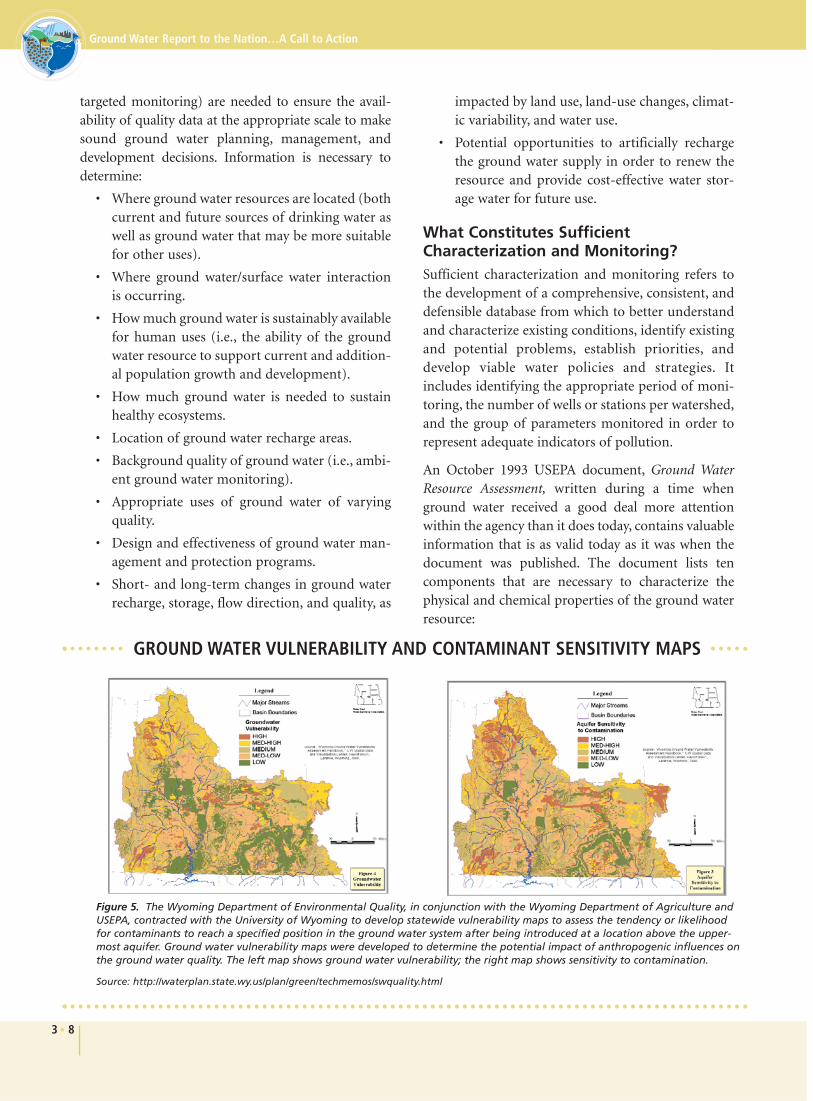
GROUND WATER VULNERABILITY AND CONTAMINANT SENSITIVITY MAPS
Figure 5. The Wyoming Department of Environmental Quality, in conjunction with the Wyoming Department of Agriculture andUSEPA, contracted with the University of Wyoming to develop statewide vulnerability maps to assess the tendency or likelihoodfor contaminants to reach a specified position in the ground water system after being introduced at a location above the upper-most aquifer. Ground water vulnerability maps were developed to determine the potential impact of anthropogenic influences onthe ground water quality. The left map shows ground water vulnerability; the right map shows sensitivity to contamination.
Source: http://waterplan.state.wy.us/plan/green/techmemos/swquality.html
3 • 9
Section 3 • Ground Water Resource Characterization and Monitoring
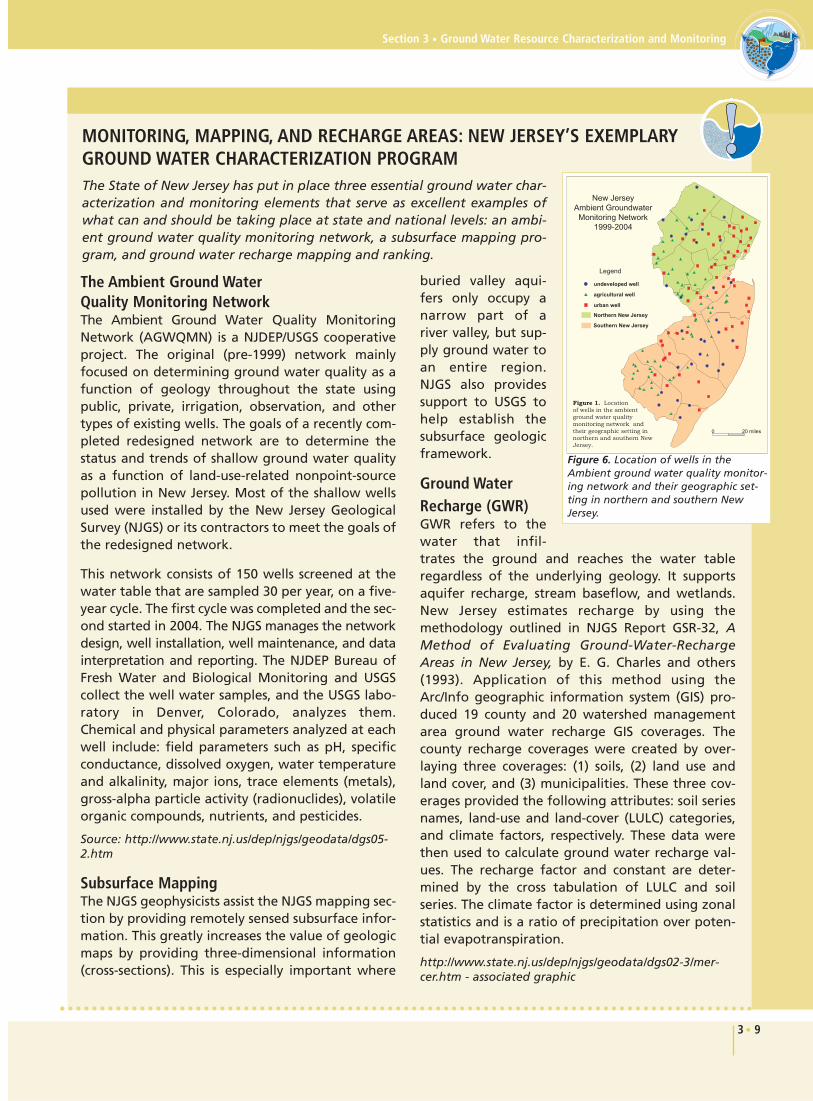
The Ambient Ground Water Quality Monitoring Network The Ambient Ground Water Quality MonitoringNetwork (AGWQMN) is a NJDEP/USGS cooperativeproject. The original (pre-1999) network mainlyfocused on determining ground water quality as afunction of geology throughout the state usingpublic, private, irrigation, observation, and othertypes of existing wells. The goals of a recently com-pleted redesigned network are to determine thestatus and trends of shallow ground water qualityas a function of land-use-related nonpoint-sourcepollution in New Jersey. Most of the shallow wellsused were installed by the New Jersey GeologicalSurvey (NJGS) or its contractors to meet the goals ofthe redesigned network.
This network consists of 150 wells screened at thewater table that are sampled 30 per year, on a five-year cycle. The first cycle was completed and the sec-ond started in 2004. The NJGS manages the networkdesign, well installation, well maintenance, and datainterpretation and reporting. The NJDEP Bureau ofFresh Water and Biological Monitoring and USGScollect the well water samples, and the USGS labo-ratory in Denver, Colorado, analyzes them.Chemical and physical parameters analyzed at eachwell include: field parameters such as pH, specificconductance, dissolved oxygen, water temperatureand alkalinity, major ions, trace elements (metals),gross-alpha particle activity (radionuclides), volatileorganic compounds, nutrients, and pesticides.
Source: http://www.state.nj.us/dep/njgs/geodata/dgs05-2.htm
Subsurface Mapping The NJGS geophysicists assist the NJGS mapping sec-tion by providing remotely sensed subsurface infor-mation. This greatly increases the value of geologicmaps by providing three-dimensional information(cross-sections). This is especially important where
buried valley aqui-fers only occupy anarrow part of ariver valley, but sup-ply ground water toan entire region.NJGS also providessupport to USGS tohelp establish thesubsurface geologicframework.
Ground WaterRecharge (GWR) GWR refers to thewater that infil-trates the ground and reaches the water tableregardless of the underlying geology. It supportsaquifer recharge, stream baseflow, and wetlands.New Jersey estimates recharge by using themethodology outlined in NJGS Report GSR-32, AMethod of Evaluating Ground-Water-RechargeAreas in New Jersey, by E. G. Charles and others(1993). Application of this method using theArc/Info geographic information system (GIS) pro-duced 19 county and 20 watershed managementarea ground water recharge GIS coverages. Thecounty recharge coverages were created by over-laying three coverages: (1) soils, (2) land use andland cover, and (3) municipalities. These three cov-erages provided the following attributes: soil seriesnames, land-use and land-cover (LULC) categories,and climate factors, respectively. These data werethen used to calculate ground water recharge val-ues. The recharge factor and constant are deter-mined by the cross tabulation of LULC and soilseries. The climate factor is determined using zonalstatistics and is a ratio of precipitation over poten-tial evapotranspiration.
http://www.state.nj.us/dep/njgs/geodata/dgs02-3/mer-cer.htm - associated graphic
MONITORING, MAPPING, AND RECHARGE AREAS: NEW JERSEY’S EXEMPLARYGROUND WATER CHARACTERIZATION PROGRAMThe State of New Jersey has put in place three essential ground water char-acterization and monitoring elements that serve as excellent examples ofwhat can and should be taking place at state and national levels: an ambi-ent ground water quality monitoring network, a subsurface mapping pro-gram, and ground water recharge mapping and ranking.
Figure 6. Location of wells in theAmbient ground water quality monitor-ing network and their geographic set-ting in northern and southern NewJersey.
Ground Water Report to the Nation…A Call to Action
• Regional hydrologic setting: Factors that con-trol the regional occurrence, movement, andavailability of ground water.
• Aquifer and aquifer-system occurrence: Realdistribution and three-dimensional position ofaquifers in the geologic setting.
• Water table levels: The upper surface of the sat-urated portion of an aquifer.
• Hydraulic properties: Soil, rock, sediment, andother geologic materials that govern the move-ment of water into, through, and out of anaquifer.
• Confinement and interaction among aquifers:Ease with which leakage among aquifers occurs—greater confinement, less interaction.
• Ground water recharge and discharge charac-terization: Where and at what rate groundwater is recharged by precipitation and dis-charged to a water body or land surface.
• Ground water and surface water interaction:Where and at what rate water moves betweenground water and surface water, includingstream baseflow. Baseflow is a critical parameterthat is typically not adequately established. It isimportant in relation to quantifying groundwater contribution to surface waters, especiallyin relation to modeling TMDL.
• Ground water budget: An accounting of all nat-ural and anthropomorphic removals from andadditions to the ground water system.
• Chemical and physical characteristics ofground water and overlying and underlyingmaterials: Characteristics that impact waterquality and affect the fate and transport of con-taminants.
• Ambient ground water quality: The quality ofground water at a baseline time selected by thedecision-making agency (ambient quality refersto the natural quality of ground water or may bethe quality as affected by widespread historicalcontamination).
The last point is especially prescient. Ambient moni-toring has been and still is being ignored by most statesand federal agencies, which focus instead on regulato-ry compliance and enforcement of standards that havebeen developed largely on the basis of impacts of con-taminants on humans. This information has little valuefor evaluating the benefits of environmental regulationto the health of ecosystems. For the latter we mustdesign ambient monitoring networks that combinechemical, microbiological, hydrogeological, and bio-logical parameters. These networks must be designedto be free from the direct influence of point-sourcepollution in order to reflect how the entire system isreacting to all the regulatory measures and BMPs onwhich millions of dollars are being spent.
THE NAWQA MODEL FOR GROUND WATER MONITORING
The USGS implemented the National Water QualityAssessment (NAWQA) Program in 1991 todevelop long-term consistent and comparableinformation on streams, rivers, ground water,and aquatic systems in support of national,regional, state, and local information needsand decisions related to water quality manage-ment and policy. The program is directed atanswering the following questions:
• What is the condition of our nation’sstreams, rivers, and ground water?
• How are these conditions changing overtime?
3 • 10
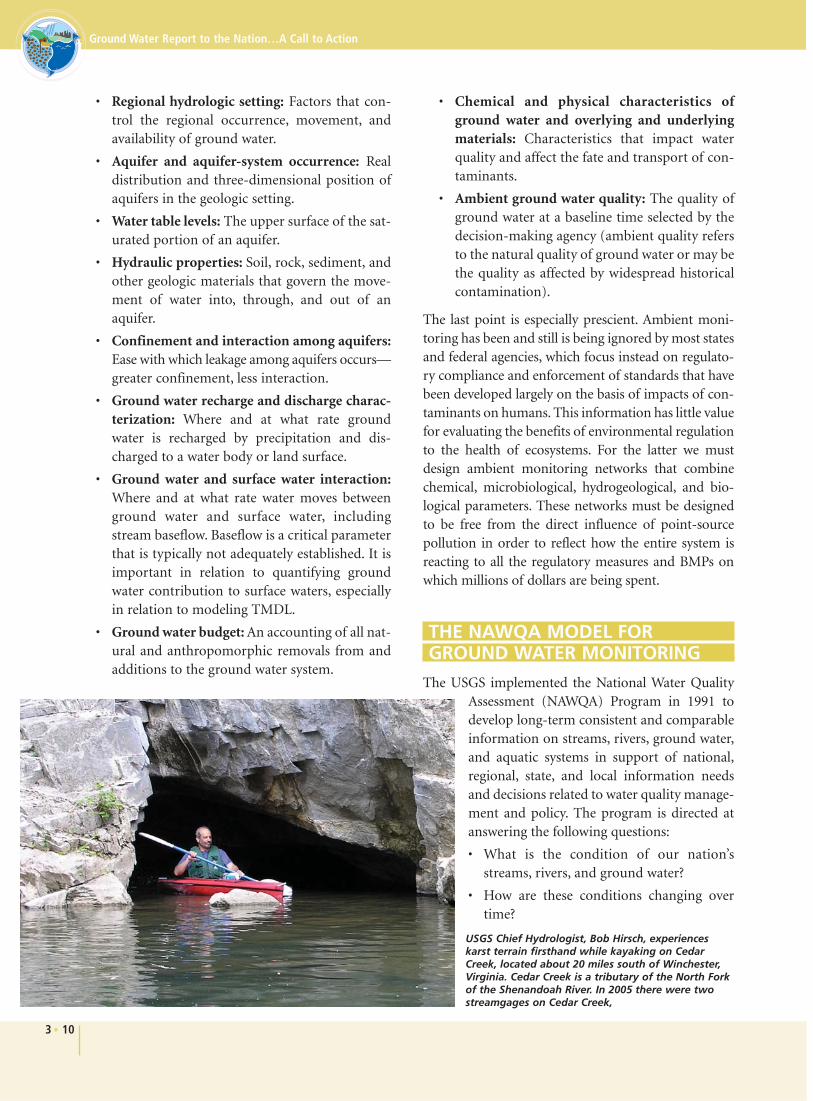
USGS Chief Hydrologist, Bob Hirsch, experienceskarst terrain firsthand while kayaking on CedarCreek, located about 20 miles south of Winchester,Virginia. Cedar Creek is a tributary of the North Forkof the Shenandoah River. In 2005 there were twostreamgages on Cedar Creek,
• How do natural features and human activitiesaffect these conditions, and where are thoseeffects most pronounced?
Through NAWQA, USGS scientists collect and inter-pret data about surface and ground water chemistry,hydrology, land use, stream habitat, and aquatic life inparts or all of nearly all 50 states using a nationallyconsistent study design and uniform methods ofsampling analysis. Their work is a major and positivestep in the direction of what should be happeningnationwide at a far more expansive level of aquifercoverage.
From 1991–2001, NAWQA conducted interdiscipli-nary assessments and established a baseline under-standing of water quality conditions in 51 of thenation’s river basins and aquifers, referred to as “studyunits.” Descriptions of water quality conditions instreams and ground water were developed in morethan a thousand reports. Nontechnical “summaryreports,” written primarily for those interested orinvolved in resource management, conservation, reg-ulation, and policy making, were completed for eachof the 51 study units. Nontechnical national summa-ry reports on pesticides, nutrients, and volatile organ-ic compounds (VOCs) were also completed, compar-ing water quality conditions to national standardsand guidelines related to drinking water, protection of
aquatic life, and nutrient enrichment. (http://water.usgs.gov/nawqa/)
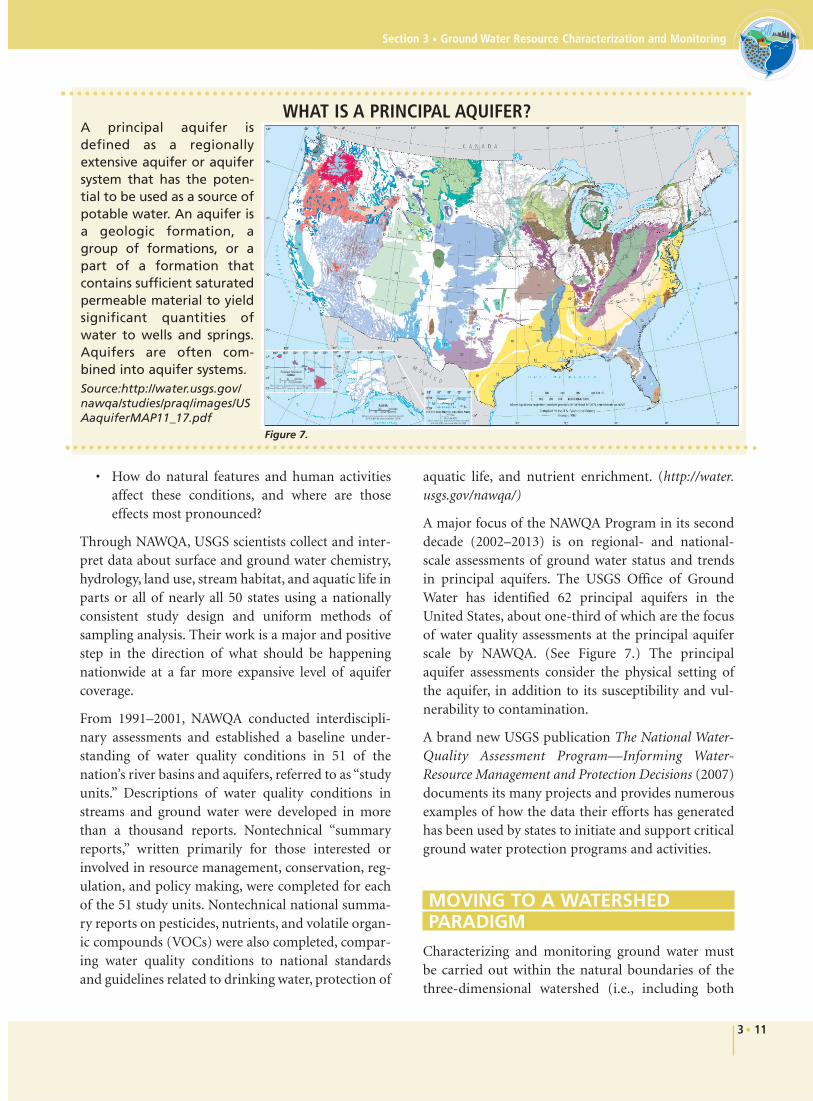
A major focus of the NAWQA Program in its seconddecade (2002–2013) is on regional- and national-scale assessments of ground water status and trendsin principal aquifers. The USGS Office of GroundWater has identified 62 principal aquifers in theUnited States, about one-third of which are the focusof water quality assessments at the principal aquiferscale by NAWQA. (See Figure 7.) The principalaquifer assessments consider the physical setting ofthe aquifer, in addition to its susceptibility and vul-nerability to contamination.
A brand new USGS publication The National Water-Quality Assessment Program—Informing Water-Resource Management and Protection Decisions (2007)documents its many projects and provides numerousexamples of how the data their efforts has generatedhas been used by states to initiate and support criticalground water protection programs and activities.
MOVING TO A WATERSHED PARADIGM
Characterizing and monitoring ground water mustbe carried out within the natural boundaries of thethree-dimensional watershed (i.e., including both
3 • 11
Section 3 • Ground Water Resource Characterization and Monitoring
WHAT IS A PRINCIPAL AQUIFER?A principal aquifer isdefined as a regionallyextensive aquifer or aquifersystem that has the poten-tial to be used as a source ofpotable water. An aquifer isa geologic formation, agroup of formations, or apart of a formation thatcontains sufficient saturatedpermeable material to yieldsignificant quantities ofwater to wells and springs.Aquifers are often com-bined into aquifer systems. Source:http://water.usgs.gov/nawqa/studies/praq/images/USAaquiferMAP11_17.pdf
Figure 7.
Ground Water Report to the Nation…A Call to Action
surface water and ground water). The notion ofwatershed monitoring has been much discussed;however, little attention has been given to scoping outdetails of what is needed. It is difficult for somegroups to agree on how to define a watershed; andwhen they do agree, they may still not know how todelineate the actual boundaries. To this end, USGShas developed a series of hydrologic unit codes(HUCs) to aid in ground water assessments.
Much more research is needed, however, in order tobetter understand how we can move to a true water-shed paradigm that includes both surface water andground water dimensions. The following are exam-ples of the type of work that is needed:
• Develop a scientifically acceptable definition ofa watershed.
• Develop methods of delineating watershedboundaries.
• Develop remote-sensing techniques to locateareas of ground water/surface water interactionwithin identified boundaries.
• Develop methods for quantifying ground watercontribution as baseflow to surface waters.
• Develop methods for calculating a water budgetfor a given watershed.
• Develop geophysical methods for locating anddescribing the morphology of conduits andchannels through which interaction betweensurface and ground water is likely.
• Apply water-aging and tracing (e.g., dye, iso-tope, bacteriophage) techniques to help inquantifying ground water or surface watersources within a watershed.
• Conduct basic research to develop numericalmodels to use in multiporosity aquifers that areinteracting with surface waters.
GETTING ORGANIZED
A plan for organizing available ground water resourceinformation, determining data gaps, and assigningresponsibilities for moving forward with a coordinat-ed program sounds logical, but it is not happening. Asthe GAO points out in its June 2004 report WatershedManagement: Better Coordination of Data CollectionEfforts Needed to Support Key Decisions: “The coordi-
nation of water quality data is falling short of itspotential.” The problem is even more acute withregard to the status of ground water data collectionand coordination.
The GAO report identifies the following four key fac-tors that impede effective water quality—and wewould add to these water quantity, data collection,and coordination:
• Significantly different purposes for whichgroups collect data.
• Inconsistencies in data-collection protocols.
• Lack of awareness on the part of data collectorsas to which entities collect what types of data.
• Low priority given to data coordination.
It is incumbent upon us to complement and reinforcethe NGWA position (2004) pertaining to action thefederal government should take to organize long-term ground water quality and quantity monitoringefforts, including:
• Synthesizing, in coordination with state andlocal governments, existing data and identifyingdata gaps.
• Developing guidelines that set out a consistentmethodology for data collection to enable datasharing.
• Developing guidance for establishing groundwater monitoring networks in differing hydro-geological settings.
• Establishing milestones to measure progress inreaching data-collection goals and committingto provide adequate funding to reach thosemilestones.
• Promoting the use of more robust data sets tobetter inform and reduce the uncertainty ofincorporating federal requirements into stateand local ground water decision making, such asdecisions regarding the application of theEndangered Species Act.
• Developing statistical analysis guidelines foridentifying long-term trends for each basin,aquifer, or watershed (choosing which dependson how extensive and well planned the moni-toring network is).
• Establishing a national clearinghouse to store orlink collected data.
3 • 12
3 • 13
Section 3 • Ground Water Resource Characterization and Monitoring
In addition to the recommended actions listed here, the Ground Water Protection Council supports the recommendations (and was part of the working group thatdeveloped the recommendations) contained in the National Ground Water Association’s(NGWA) “Ground Water Level and Quality Monitoring Position Paper” (April 2006).
Recommended Actions
To Congress:
Support the efforts by, and provide the necessary funding to, federal andstate geologic surveys and water resource agencies to further hydrogeo-logic mapping and ground water monitoring networks (e.g., ambient,impacted-area, targeted) needed to understand, manage, and protect thenation’s ground water resources.
To USEPA:
Ensure that ground water is clearly identified as an integral part of EPA’sstrategic plan, national monitoring strategy, and other federal agencyresource management plans. Specific changes should include:
• Giving states flexibility in their use of the Clean Water Act §106 and §319funding for ground water protection.
• Guidance to states to include ground water as part of state monitoringstrategies and monitoring reports, such as Clean Water Act §305(b) reports.
To USGS:
Ensure the availability of quality data at scales amenable to watershed-based decision making associated with water planning and allocation, man-agement, and development, especially in watersheds that may cross stateboundaries and jurisdictions.
Continue to actively support, including financially, the Advisory Committeeon Water Information’s Subcommittee on Ground Water.
To Governors and State Legislatures:
Provide funds to establish, operate, and maintain ground water quality and quantity monitoring networks that include ambient, targeted, andimpacted areas.
Policy makers at all levels of government will be faced with crucial decisions
regarding growth and development alternatives and tradeoffs. These decisions
must be based on high-quality data.
Photo: JECO Photo
Ground Water Report to the Nation…A Call to Action
3 • 14
Section 3 References: Ground Water Resource Characterization and MonitoringBarlow, P. M. 2003. Ground Water in Fresh Water-Salt Water Environments of the Atlantic Coast. USGS Circular 1262.
Available at: http://pubs.usgs.gov/circ/2003/circ1262/
General Accounting Office. 2003. Freshwater Supply: States View of How Federal Agencies Could Help Them Meet theChallenges of Expected Shortages. GAO-03-514. 2003.
General Accounting Office. 2004. Watershed Management: Better Coordination of Data Collection Efforts Needed toSupport Key Decisions ) GAO-04-382, June 2004. Available at: http://www.gao.gov/new.items/d04382.pdf.
National Ground Water Association (NGWA). 2004. Ground Water Sustainability: A Call to Action. Available at at:http://www.ngwa.org/PROGRAMS/government/issues/possustain.aspx (accessed July 2007).
National Science and Technology Council Committee on Environment and Natural Resources. November 2004.Report: Science and Technology to Support Fresh Water Availability in the United States. Available at:http://climate.gsfc.nasa.gov/viewStory.php?id=47
Nicholas, J. R., S. P. Blumer, and R. M. McGowan. 2001. Comparison of Hydrologic Data from Monroe County,Michigan, 1991 – 2001. U.S. Geological Survey Open-File Report 01-498. Available at:http://mi.water.usgs.gov/pubs/OF/OF01-498/pdf/OF01-498.pdf
U.S. Geological Survey. 2007. The National Water-Quality Assessment Program — Informing Water-ResourceManagement and Protection Decisions; written communication, Pixie A. Hamilton, May 2007;http://water.usgs.gov/nawqa/xrel.pdf
U.S. Geological Survey. August 1997. Conceptual Frameworks for GW Quality Monitoring, Ground Water Focus Group,ITFM, USGS/EPA. http://water.usgs.gov/wicp/gwfocus.pdf.
Winter, Thomas C., J. W. Harvey, O. L. Franke, W. M. Alley. 1998. Natural Processes of Ground-Water and Surface-WaterInteraction. USGS Circular 1139, http://pubs.usgs.gov/circ/circ1139/
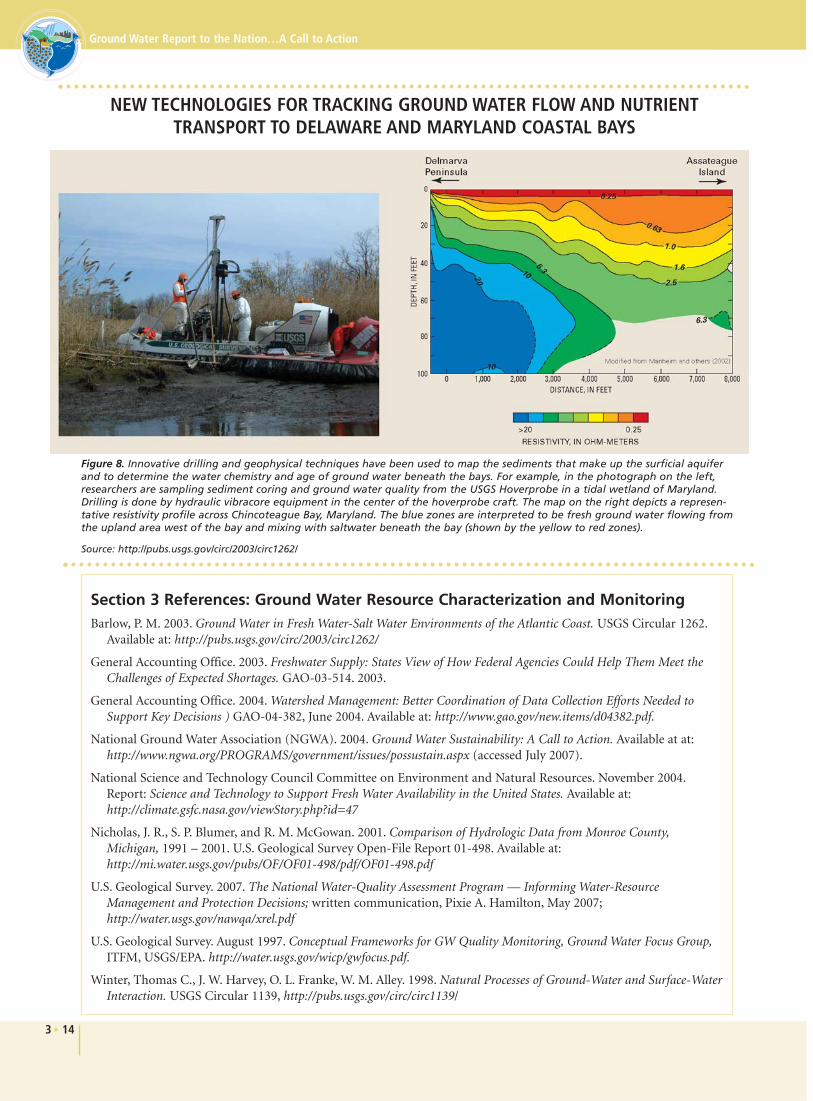
NEW TECHNOLOGIES FOR TRACKING GROUND WATER FLOW AND NUTRIENTTRANSPORT TO DELAWARE AND MARYLAND COASTAL BAYS
Figure 8. Innovative drilling and geophysical techniques have been used to map the sediments that make up the surficial aquiferand to determine the water chemistry and age of ground water beneath the bays. For example, in the photograph on the left,researchers are sampling sediment coring and ground water quality from the USGS Hoverprobe in a tidal wetland of Maryland.Drilling is done by hydraulic vibracore equipment in the center of the hoverprobe craft. The map on the right depicts a represen-tative resistivity profile across Chincoteague Bay, Maryland. The blue zones are interpreted to be fresh ground water flowing fromthe upland area west of the bay and mixing with saltwater beneath the bay (shown by the yellow to red zones).
Source: http://pubs.usgs.gov/circ/2003/circ1262/