Embed Size (px)
Citation preview
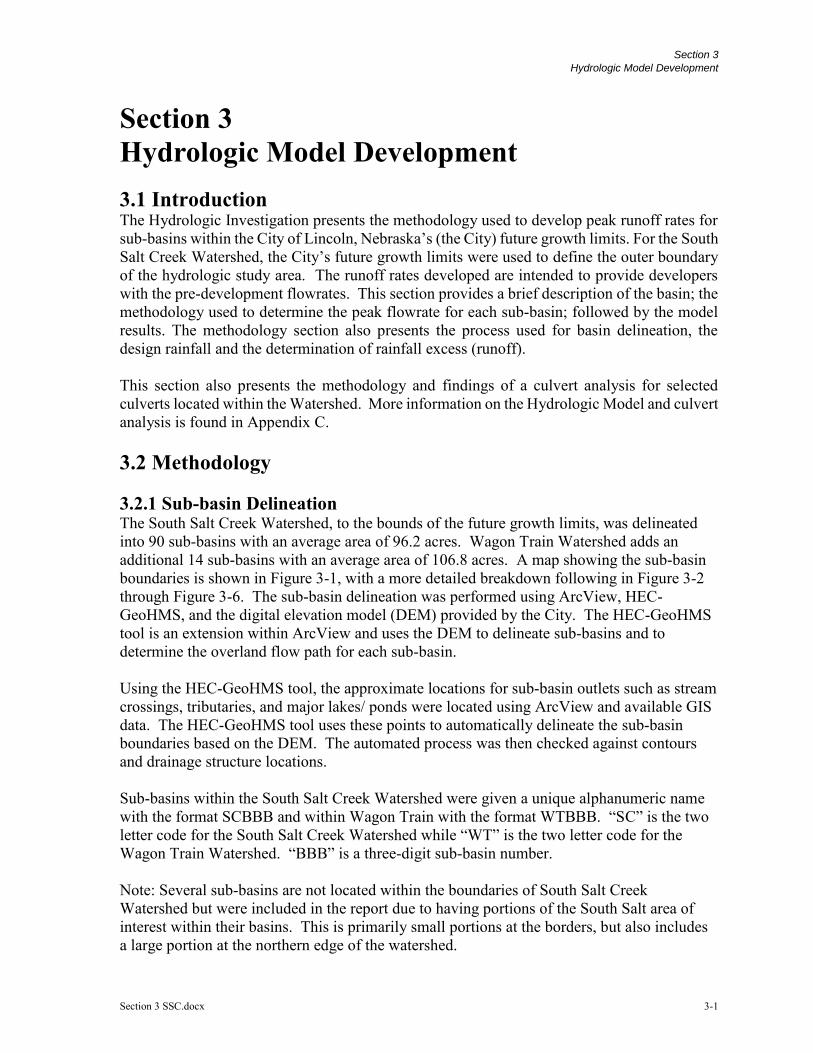
Section 3
Hydrologic Model Development
Section 3 SSC.docx 3-1
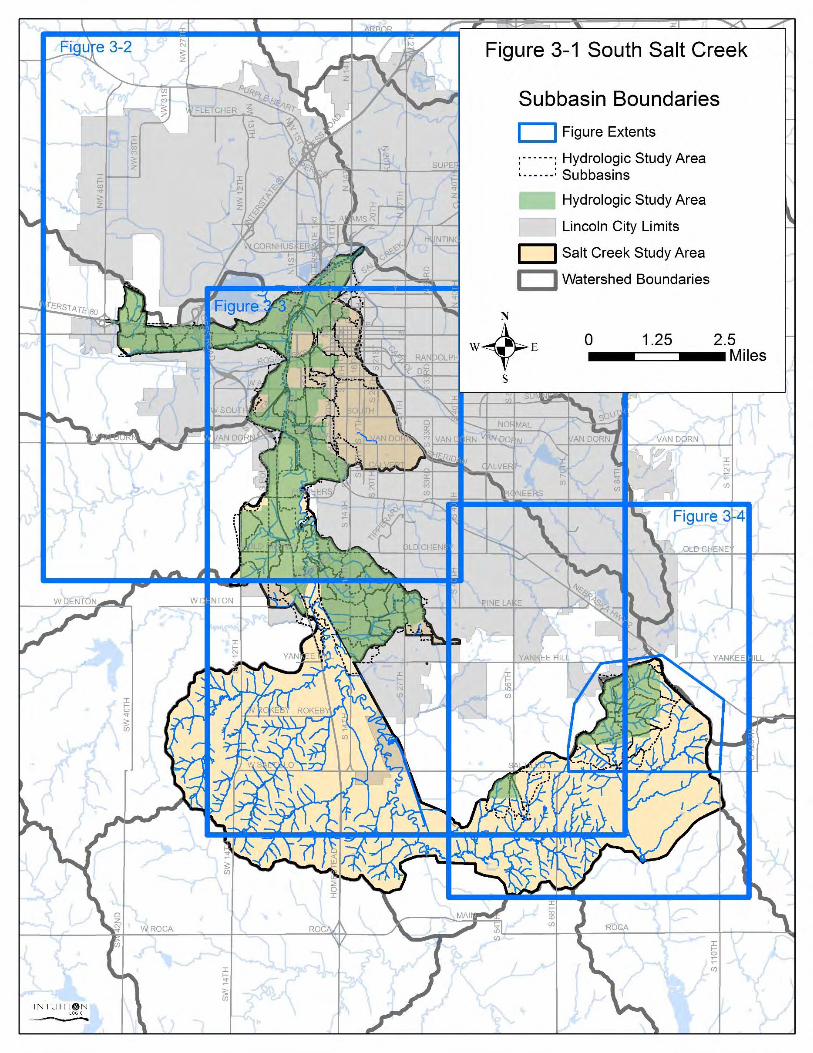
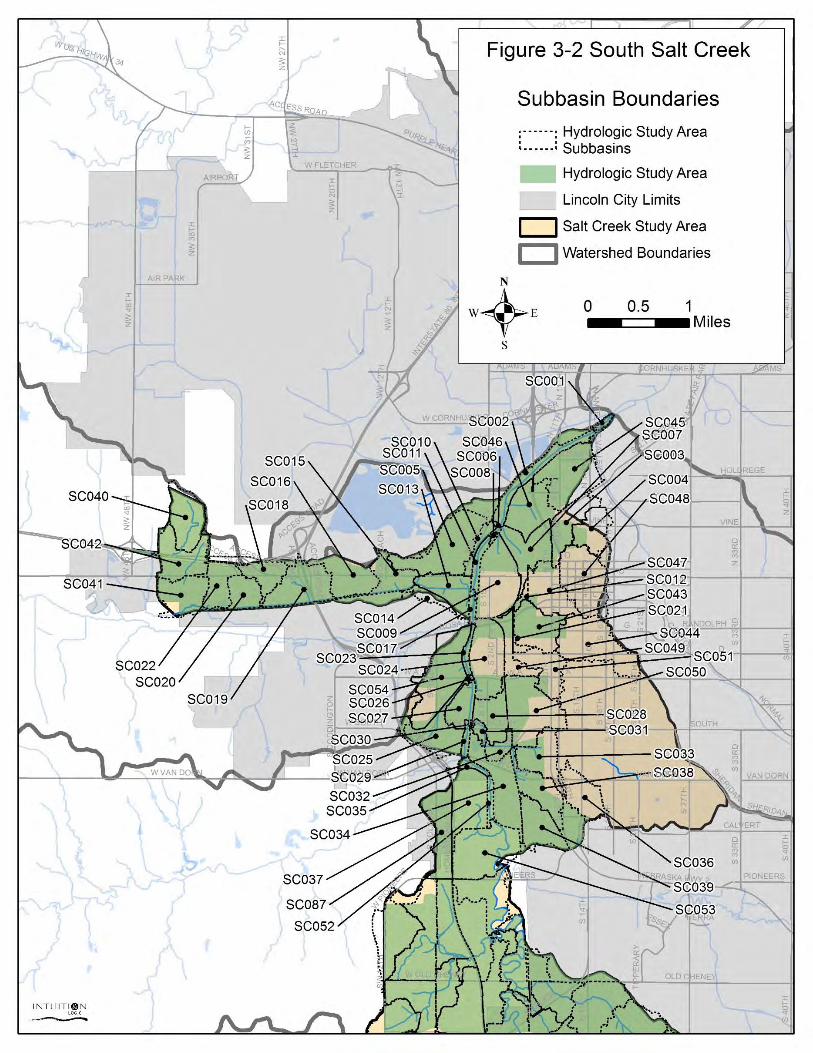
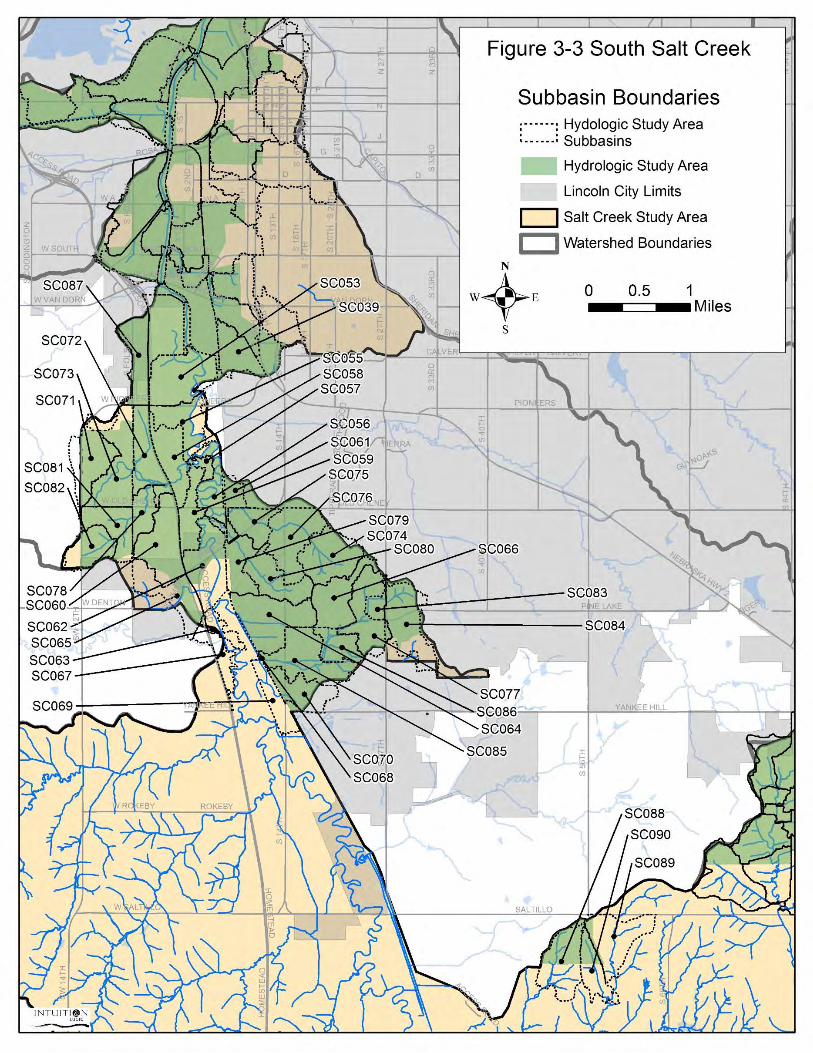
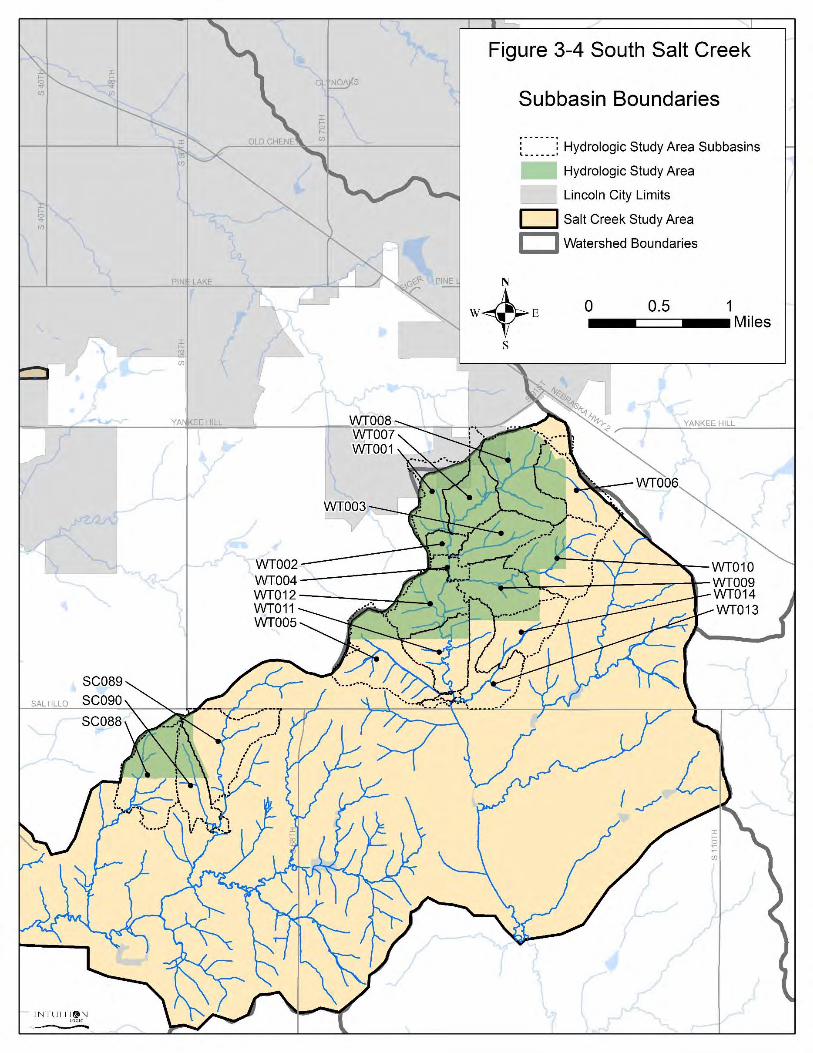
Section 3 Hydrologic Model Development 3.1 Introduction The Hydrologic Investigation presents the methodology used to develop peak runoff rates for sub-basins within the City of Lincoln, Nebraska’s (the City) future growth limits. For the South Salt Creek Watershed, the City’s future growth limits were used to define the outer boundary of the hydrologic study area. The runoff rates developed are intended to provide developers with the pre-development flowrates. This section provides a brief description of the basin; the methodology used to determine the peak flowrate for each sub-basin; followed by the model results. The methodology section also presents the process used for basin delineation, the design rainfall and the determination of rainfall excess (runoff). This section also presents the methodology and findings of a culvert analysis for selected culverts located within the Watershed. More information on the Hydrologic Model and culvert analysis is found in Appendix C. 3.2 Methodology 3.2.1 Sub-basin Delineation The South Salt Creek Watershed, to the bounds of the future growth limits, was delineated into 90 sub-basins with an average area of 96.2 acres. Wagon Train Watershed adds an additional 14 sub-basins with an average area of 106.8 acres. A map showing the sub-basin boundaries is shown in Figure 3-1, with a more detailed breakdown following in Figure 3-2 through Figure 3-6. The sub-basin delineation was performed using ArcView, HEC-GeoHMS, and the digital elevation model (DEM) provided by the City. The HEC-GeoHMS tool is an extension within ArcView and uses the DEM to delineate sub-basins and to determine the overland flow path for each sub-basin. Using the HEC-GeoHMS tool, the approximate locations for sub-basin outlets such as stream crossings, tributaries, and major lakes/ ponds were located using ArcView and available GIS data. The HEC-GeoHMS tool uses these points to automatically delineate the sub-basin boundaries based on the DEM. The automated process was then checked against contours and drainage structure locations. Sub-basins within the South Salt Creek Watershed were given a unique alphanumeric name with the format SCBBB and within Wagon Train with the format WTBBB. “SC” is the two letter code for the South Salt Creek Watershed while “WT” is the two letter code for the Wagon Train Watershed. “BBB” is a three-digit sub-basin number. Note: Several sub-basins are not located within the boundaries of South Salt Creek Watershed but were included in the report due to having portions of the South Salt area of interest within their basins. This is primarily small portions at the borders, but also includes a large portion at the northern edge of the watershed.
Section 3
Hydrologic Model Development
Section 3 SSC.docx 3-2
Figure 3-1
Section 3
Hydrologic Model Development
Section 3 SSC.docx 3-3
Figure 3-2
Section 3
Hydrologic Model Development
Section 3 SSC.docx 3-4
Figure 3-3
Section 3
Hydrologic Model Development
Section 3 SSC.docx 3-5
Figure 3-4
Section 3
Hydrologic Model Development
Section 3 SSC.docx 3-6
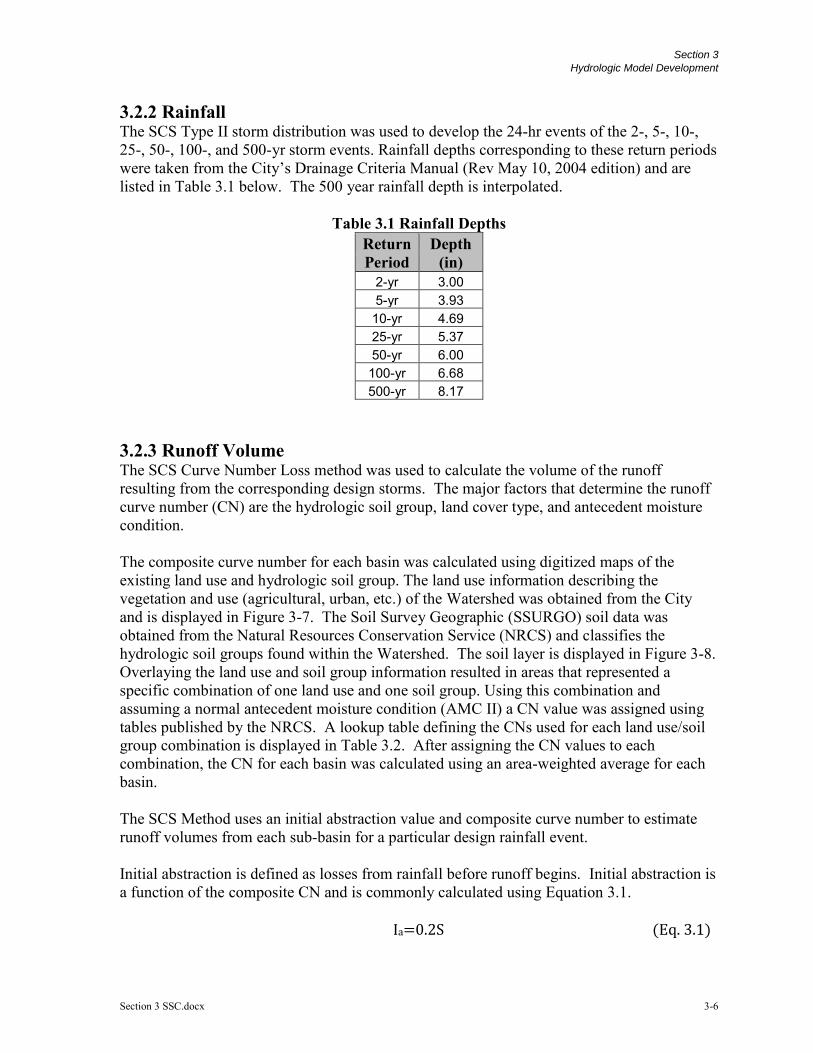
3.2.2 Rainfall The SCS Type II storm distribution was used to develop the 24-hr events of the 2-, 5-, 10-, 25-, 50-, 100-, and 500-yr storm events. Rainfall depths corresponding to these return periods were taken from the City’s Drainage Criteria Manual (Rev May 10, 2004 edition) and are listed in Table 3.1 below. The 500 year rainfall depth is interpolated.
Table 3.1 Rainfall Depths
Return Period
Depth (in)
2-yr 3.00 5-yr 3.93 10-yr 4.69 25-yr 5.37 50-yr 6.00 100-yr 6.68 500-yr 8.17
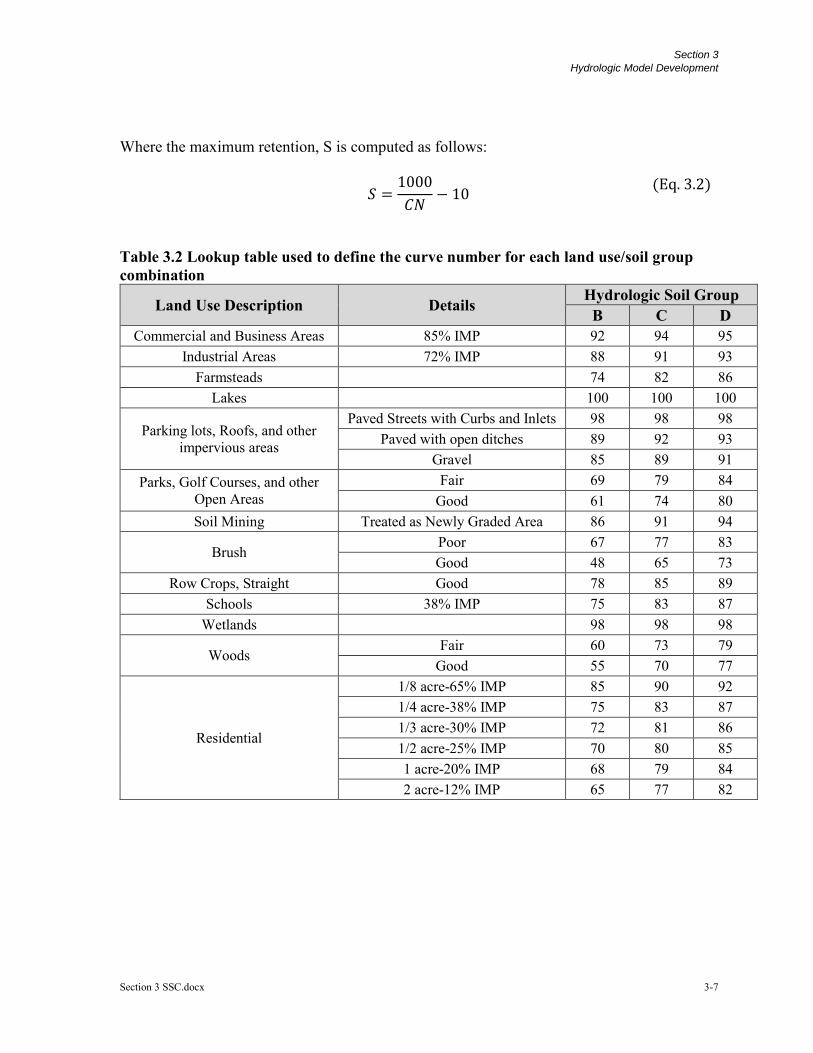
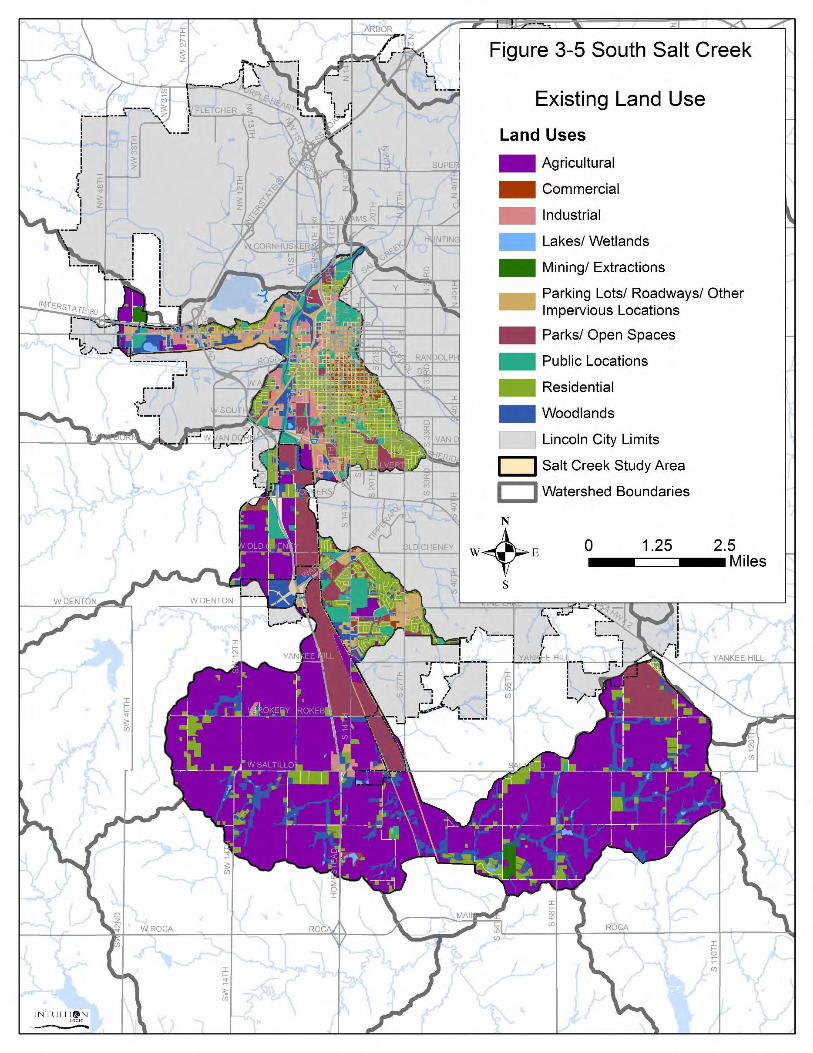
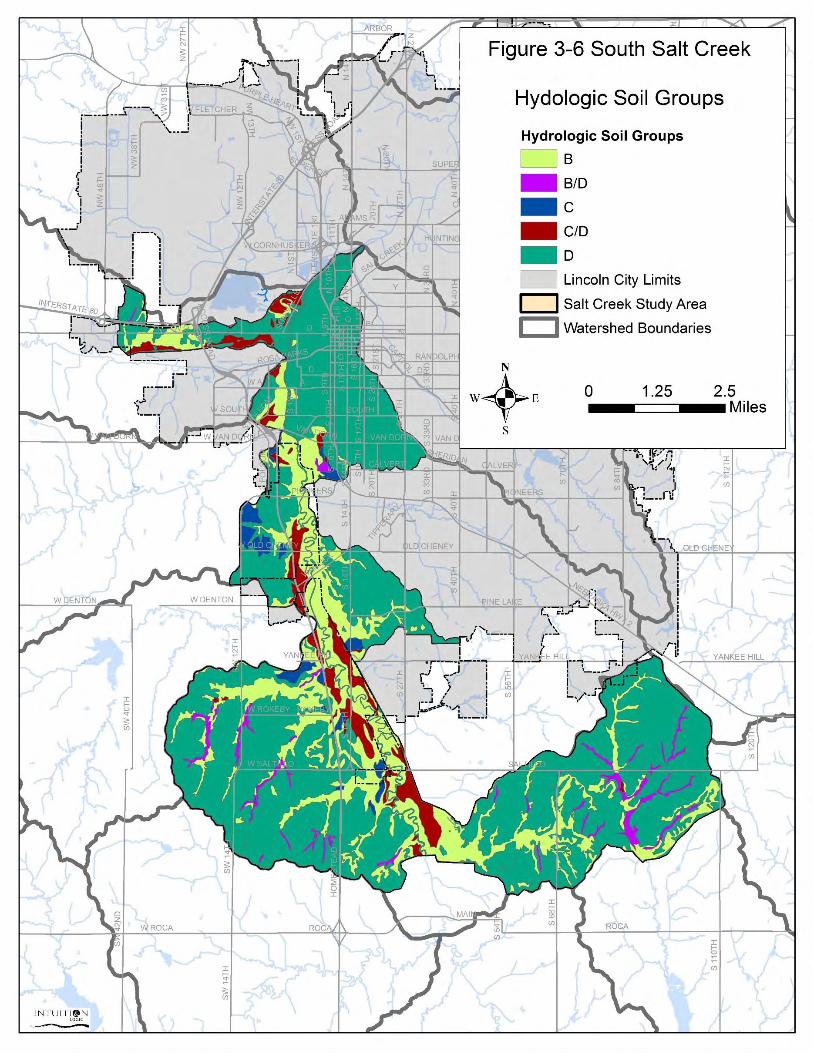
3.2.3 Runoff Volume The SCS Curve Number Loss method was used to calculate the volume of the runoff resulting from the corresponding design storms. The major factors that determine the runoff curve number (CN) are the hydrologic soil group, land cover type, and antecedent moisture condition. The composite curve number for each basin was calculated using digitized maps of the existing land use and hydrologic soil group. The land use information describing the vegetation and use (agricultural, urban, etc.) of the Watershed was obtained from the City and is displayed in Figure 3-7. The Soil Survey Geographic (SSURGO) soil data was obtained from the Natural Resources Conservation Service (NRCS) and classifies the hydrologic soil groups found within the Watershed. The soil layer is displayed in Figure 3-8. Overlaying the land use and soil group information resulted in areas that represented a specific combination of one land use and one soil group. Using this combination and assuming a normal antecedent moisture condition (AMC II) a CN value was assigned using tables published by the NRCS. A lookup table defining the CNs used for each land use/soil group combination is displayed in Table 3.2. After assigning the CN values to each combination, the CN for each basin was calculated using an area-weighted average for each basin. The SCS Method uses an initial abstraction value and composite curve number to estimate runoff volumes from each sub-basin for a particular design rainfall event. Initial abstraction is defined as losses from rainfall before runoff begins. Initial abstraction is a function of the composite CN and is commonly calculated using Equation 3.1.
Ia=0.2S
(Eq. 3.1)
Section 3
Hydrologic Model Development
Section 3 SSC.docx 3-7
Where the maximum retention, S is computed as follows:
𝑆 =
1000
𝐶𝑁− 10
(Eq. 3.2)
Table 3.2 Lookup table used to define the curve number for each land use/soil group combination
Land Use Description Details Hydrologic Soil Group B C D
Commercial and Business Areas 85% IMP 92 94 95 Industrial Areas 72% IMP 88 91 93
Farmsteads 74 82 86 Lakes 100 100 100
Parking lots, Roofs, and other impervious areas
Paved Streets with Curbs and Inlets 98 98 98 Paved with open ditches 89 92 93
Gravel 85 89 91 Parks, Golf Courses, and other
Open Areas Fair 69 79 84
Good 61 74 80 Soil Mining Treated as Newly Graded Area 86 91 94
Brush Poor 67 77 83 Good 48 65 73
Row Crops, Straight Good 78 85 89 Schools 38% IMP 75 83 87
Wetlands 98 98 98
Woods Fair 60 73 79
Good 55 70 77
Residential
1/8 acre-65% IMP 85 90 92 1/4 acre-38% IMP 75 83 87 1/3 acre-30% IMP 72 81 86 1/2 acre-25% IMP 70 80 85 1 acre-20% IMP 68 79 84 2 acre-12% IMP 65 77 82
Section 3
Hydrologic Model Development
Section 3 SSC.docx 3-8
Section 3
Hydrologic Model Development
Section 3 SSC.docx 3-9
Section 3
Hydrologic Model Development
Section 3 SSC.docx 3-10
3.2.4 Runoff Hydrographs The SCS Dimensionless Unit Hydrograph method was employed within HMS in order to distribute the runoff volume for each basin. This method requires the SCS lag time to be calculated. The lag time for each basin was calculated using the Curve Number Lag Method described in “National Engineering Handbook, Section 4” (Natural resources Conservation Service, 2001). This calculation was performed using an automated process available within HEC-GeoHMS. To calculate the lag time, HEC-GeoHMS employs a DEM to estimate the hydraulic length and average land slope of each basin. The lag time for each catchment was calculated using the following equation:
𝑳 =𝒍𝟎.𝟖(𝑺 + 𝟏)𝟎.𝟕
𝟏𝟗𝟎𝟎𝒀𝟎.𝟓
(Eq. 3.3)
in which L equals the lag time in hours; l is defined as the hydraulic length of the catchment in feet; Y represents the average Watershed slope in percent; and S represents maximum retention and can be determined using Equation 3.2, defined previously. HMS then uses the lag time parameter to internally calculate the time of concentration (tc) for each basin using the equation:
𝑡𝑐 =
5
3𝐿
(Eq. 3.4)
The time of concentration represents the time it takes for a drop of water to travel from the hydraulically most remote point of the catchment to the outlet. 3.3 Modeling Results Peak runoff rates were developed for each sub-basin within the South Salt Creek hydrologic study area. Table 3.3 presents the results for each sub-basin. Additional Hydrologic information can be found in Appendix C.
Section 3
Hydrologic Model Development
Section 3 SSC.docx 3-11
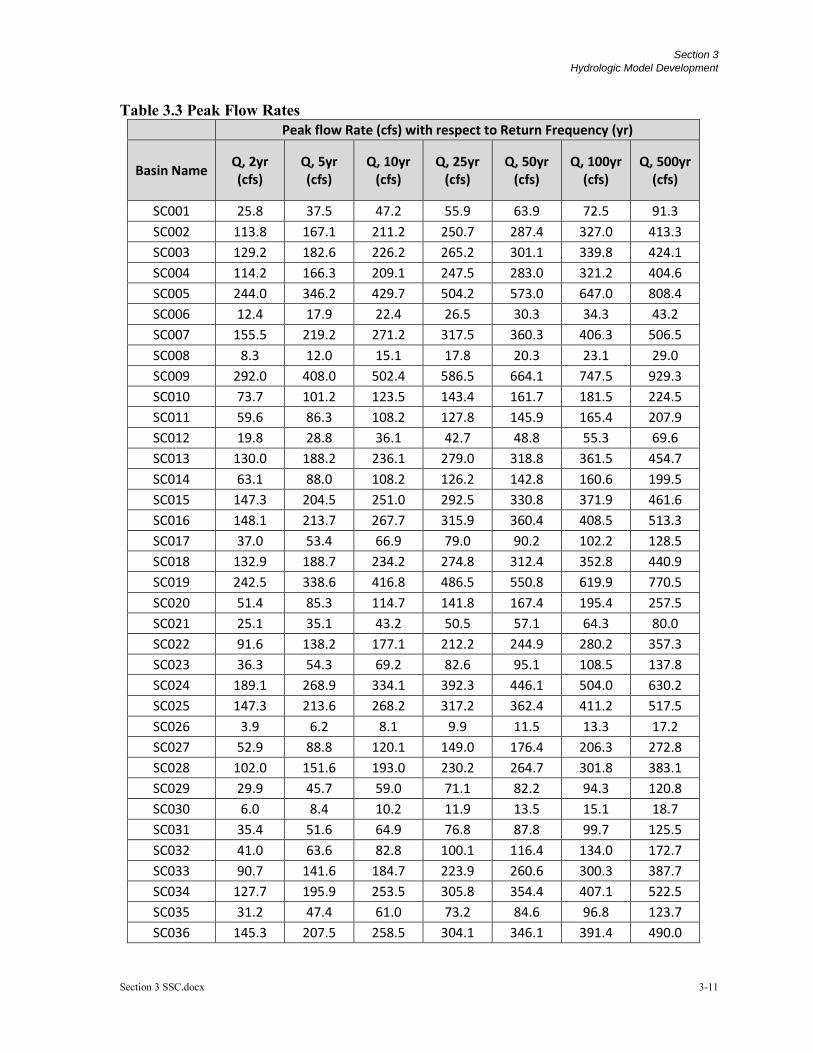
Table 3.3 Peak Flow Rates Peak flow Rate (cfs) with respect to Return Frequency (yr)
Basin Name Q, 2yr (cfs)
Q, 5yr (cfs)
Q, 10yr (cfs)
Q, 25yr (cfs)
Q, 50yr (cfs)
Q, 100yr (cfs)
Q, 500yr (cfs)
SC001 25.8 37.5 47.2 55.9 63.9 72.5 91.3
SC002 113.8 167.1 211.2 250.7 287.4 327.0 413.3
SC003 129.2 182.6 226.2 265.2 301.1 339.8 424.1
SC004 114.2 166.3 209.1 247.5 283.0 321.2 404.6
SC005 244.0 346.2 429.7 504.2 573.0 647.0 808.4
SC006 12.4 17.9 22.4 26.5 30.3 34.3 43.2
SC007 155.5 219.2 271.2 317.5 360.3 406.3 506.5
SC008 8.3 12.0 15.1 17.8 20.3 23.1 29.0
SC009 292.0 408.0 502.4 586.5 664.1 747.5 929.3
SC010 73.7 101.2 123.5 143.4 161.7 181.5 224.5
SC011 59.6 86.3 108.2 127.8 145.9 165.4 207.9
SC012 19.8 28.8 36.1 42.7 48.8 55.3 69.6
SC013 130.0 188.2 236.1 279.0 318.8 361.5 454.7
SC014 63.1 88.0 108.2 126.2 142.8 160.6 199.5
SC015 147.3 204.5 251.0 292.5 330.8 371.9 461.6
SC016 148.1 213.7 267.7 315.9 360.4 408.5 513.3
SC017 37.0 53.4 66.9 79.0 90.2 102.2 128.5
SC018 132.9 188.7 234.2 274.8 312.4 352.8 440.9
SC019 242.5 338.6 416.8 486.5 550.8 619.9 770.5
SC020 51.4 85.3 114.7 141.8 167.4 195.4 257.5
SC021 25.1 35.1 43.2 50.5 57.1 64.3 80.0
SC022 91.6 138.2 177.1 212.2 244.9 280.2 357.3
SC023 36.3 54.3 69.2 82.6 95.1 108.5 137.8
SC024 189.1 268.9 334.1 392.3 446.1 504.0 630.2
SC025 147.3 213.6 268.2 317.2 362.4 411.2 517.5
SC026 3.9 6.2 8.1 9.9 11.5 13.3 17.2
SC027 52.9 88.8 120.1 149.0 176.4 206.3 272.8
SC028 102.0 151.6 193.0 230.2 264.7 301.8 383.1
SC029 29.9 45.7 59.0 71.1 82.2 94.3 120.8
SC030 6.0 8.4 10.2 11.9 13.5 15.1 18.7
SC031 35.4 51.6 64.9 76.8 87.8 99.7 125.5
SC032 41.0 63.6 82.8 100.1 116.4 134.0 172.7
SC033 90.7 141.6 184.7 223.9 260.6 300.3 387.7
SC034 127.7 195.9 253.5 305.8 354.4 407.1 522.5
SC035 31.2 47.4 61.0 73.2 84.6 96.8 123.7
SC036 145.3 207.5 258.5 304.1 346.1 391.4 490.0
Section 3
Hydrologic Model Development
Section 3 SSC.docx 3-12
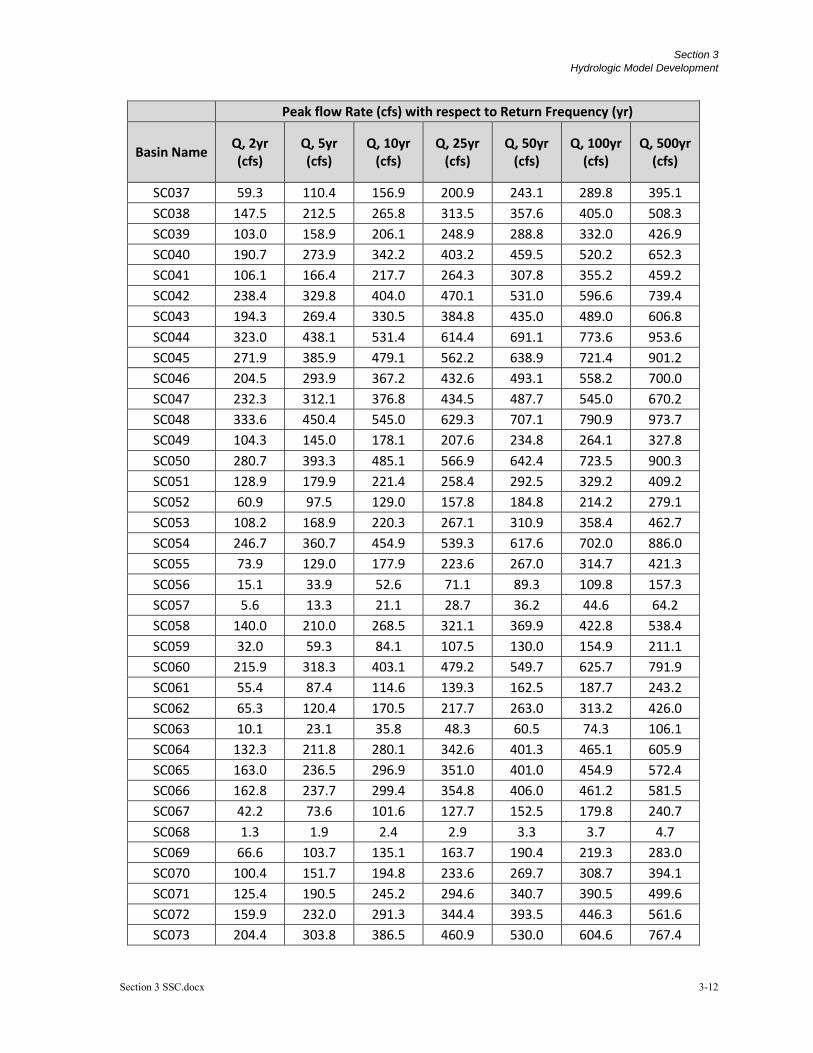
Peak flow Rate (cfs) with respect to Return Frequency (yr)
Basin Name Q, 2yr (cfs)
Q, 5yr (cfs)
Q, 10yr (cfs)
Q, 25yr (cfs)
Q, 50yr (cfs)
Q, 100yr (cfs)
Q, 500yr (cfs)
SC037 59.3 110.4 156.9 200.9 243.1 289.8 395.1
SC038 147.5 212.5 265.8 313.5 357.6 405.0 508.3
SC039 103.0 158.9 206.1 248.9 288.8 332.0 426.9
SC040 190.7 273.9 342.2 403.2 459.5 520.2 652.3
SC041 106.1 166.4 217.7 264.3 307.8 355.2 459.2
SC042 238.4 329.8 404.0 470.1 531.0 596.6 739.4
SC043 194.3 269.4 330.5 384.8 435.0 489.0 606.8
SC044 323.0 438.1 531.4 614.4 691.1 773.6 953.6
SC045 271.9 385.9 479.1 562.2 638.9 721.4 901.2
SC046 204.5 293.9 367.2 432.6 493.1 558.2 700.0
SC047 232.3 312.1 376.8 434.5 487.7 545.0 670.2
SC048 333.6 450.4 545.0 629.3 707.1 790.9 973.7
SC049 104.3 145.0 178.1 207.6 234.8 264.1 327.8
SC050 280.7 393.3 485.1 566.9 642.4 723.5 900.3
SC051 128.9 179.9 221.4 258.4 292.5 329.2 409.2
SC052 60.9 97.5 129.0 157.8 184.8 214.2 279.1
SC053 108.2 168.9 220.3 267.1 310.9 358.4 462.7
SC054 246.7 360.7 454.9 539.3 617.6 702.0 886.0
SC055 73.9 129.0 177.9 223.6 267.0 314.7 421.3
SC056 15.1 33.9 52.6 71.1 89.3 109.8 157.3
SC057 5.6 13.3 21.1 28.7 36.2 44.6 64.2
SC058 140.0 210.0 268.5 321.1 369.9 422.8 538.4
SC059 32.0 59.3 84.1 107.5 130.0 154.9 211.1
SC060 215.9 318.3 403.1 479.2 549.7 625.7 791.9
SC061 55.4 87.4 114.6 139.3 162.5 187.7 243.2
SC062 65.3 120.4 170.5 217.7 263.0 313.2 426.0
SC063 10.1 23.1 35.8 48.3 60.5 74.3 106.1
SC064 132.3 211.8 280.1 342.6 401.3 465.1 605.9
SC065 163.0 236.5 296.9 351.0 401.0 454.9 572.4
SC066 162.8 237.7 299.4 354.8 406.0 461.2 581.5
SC067 42.2 73.6 101.6 127.7 152.5 179.8 240.7
SC068 1.3 1.9 2.4 2.9 3.3 3.7 4.7
SC069 66.6 103.7 135.1 163.7 190.4 219.3 283.0
SC070 100.4 151.7 194.8 233.6 269.7 308.7 394.1
SC071 125.4 190.5 245.2 294.6 340.7 390.5 499.6
SC072 159.9 232.0 291.3 344.4 393.5 446.3 561.6
SC073 204.4 303.8 386.5 460.9 530.0 604.6 767.4
Section 3
Hydrologic Model Development
Section 3 SSC.docx 3-13
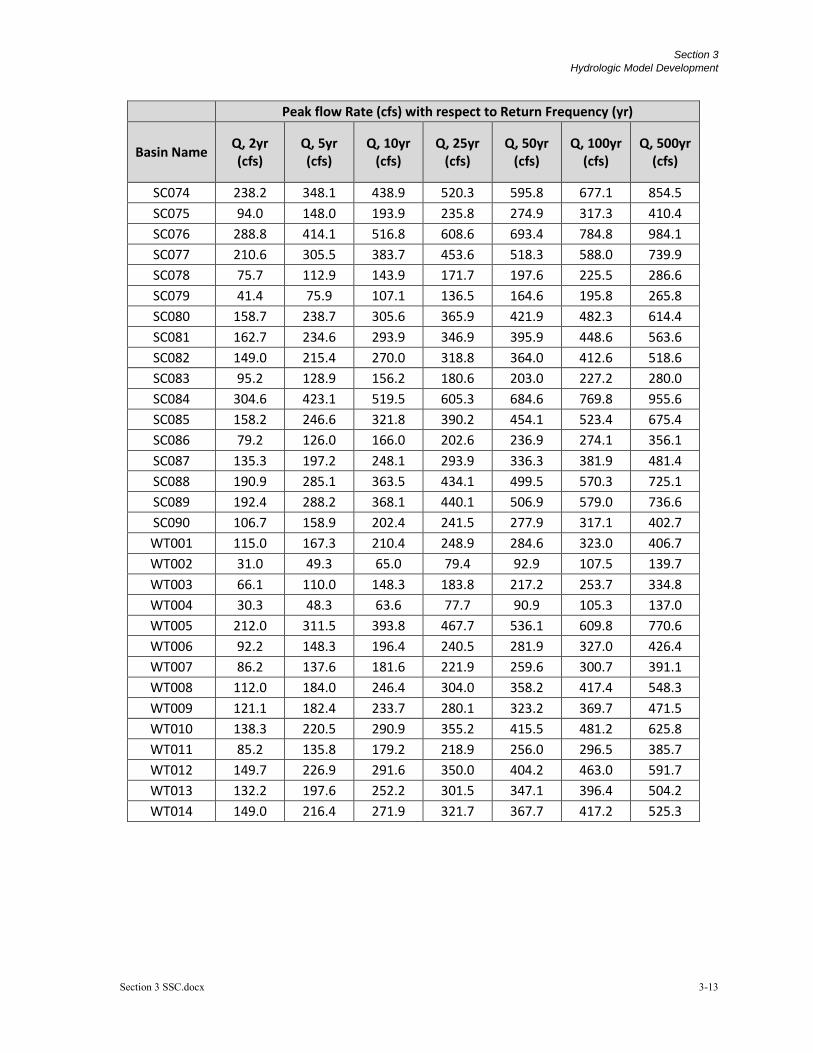
Peak flow Rate (cfs) with respect to Return Frequency (yr)
Basin Name Q, 2yr (cfs)
Q, 5yr (cfs)
Q, 10yr (cfs)
Q, 25yr (cfs)
Q, 50yr (cfs)
Q, 100yr (cfs)
Q, 500yr (cfs)
SC074 238.2 348.1 438.9 520.3 595.8 677.1 854.5
SC075 94.0 148.0 193.9 235.8 274.9 317.3 410.4
SC076 288.8 414.1 516.8 608.6 693.4 784.8 984.1
SC077 210.6 305.5 383.7 453.6 518.3 588.0 739.9
SC078 75.7 112.9 143.9 171.7 197.6 225.5 286.6
SC079 41.4 75.9 107.1 136.5 164.6 195.8 265.8
SC080 158.7 238.7 305.6 365.9 421.9 482.3 614.4
SC081 162.7 234.6 293.9 346.9 395.9 448.6 563.6
SC082 149.0 215.4 270.0 318.8 364.0 412.6 518.6
SC083 95.2 128.9 156.2 180.6 203.0 227.2 280.0
SC084 304.6 423.1 519.5 605.3 684.6 769.8 955.6
SC085 158.2 246.6 321.8 390.2 454.1 523.4 675.4
SC086 79.2 126.0 166.0 202.6 236.9 274.1 356.1
SC087 135.3 197.2 248.1 293.9 336.3 381.9 481.4
SC088 190.9 285.1 363.5 434.1 499.5 570.3 725.1
SC089 192.4 288.2 368.1 440.1 506.9 579.0 736.6
SC090 106.7 158.9 202.4 241.5 277.9 317.1 402.7
WT001 115.0 167.3 210.4 248.9 284.6 323.0 406.7
WT002 31.0 49.3 65.0 79.4 92.9 107.5 139.7
WT003 66.1 110.0 148.3 183.8 217.2 253.7 334.8
WT004 30.3 48.3 63.6 77.7 90.9 105.3 137.0
WT005 212.0 311.5 393.8 467.7 536.1 609.8 770.6
WT006 92.2 148.3 196.4 240.5 281.9 327.0 426.4
WT007 86.2 137.6 181.6 221.9 259.6 300.7 391.1
WT008 112.0 184.0 246.4 304.0 358.2 417.4 548.3
WT009 121.1 182.4 233.7 280.1 323.2 369.7 471.5
WT010 138.3 220.5 290.9 355.2 415.5 481.2 625.8
WT011 85.2 135.8 179.2 218.9 256.0 296.5 385.7
WT012 149.7 226.9 291.6 350.0 404.2 463.0 591.7
WT013 132.2 197.6 252.2 301.5 347.1 396.4 504.2
WT014 149.0 216.4 271.9 321.7 367.7 417.2 525.3
Section 3
Hydrologic Model Development
Section 3 SSC.docx 3-14
3.4 Culvert Analysis The Nebraska Department of Natural Resources has prepared hydrologic and hydraulic data for the Haines Branch Study Area. This information was used to delineate the Zone A Special Flood Areas. The Zone A areas illustrate a floodplain boundary based on normal flow depths, but do not provide corresponding water surface elevations and do not consider the effect of culverts. Many older culverts in the Watershed were designed to convey a 10 to 25 year storm event and possibly overtop the roadway during larger storm events. The Culvert Analysis is intended to evaluate culverts where sufficient flow rates and culvert as-built information is available to determine if the roadway is overtopped during a 100 year, 24 hour storm event. 3.4.1 Flowrates The analysis is based on available discharge and depth data from the Nebraska Department of Natural Resources. NDNR developed flowrate and depth estimates for delineating the FEMA Zone A special flood hazard areas in the tributaries. The available data was provided in a GIS shape file for use in the Culvert Analysis. The data consists of the 1% annual occurrence discharge; the flood depth; the flood elevation; and the cross section location where each flood depth and elevation were determined. 3.4.2 Culvert Identification The culvert identification process consisted of identifying all stream crossing locations; intersecting with the limits of DNR data; estimating the roadway elevation from GIS contours; and estimating the local flood elevation from the DNR depth data. A total of 91 stream crossing locations were identified in the South Salt Creek Watershed. Of those, there were 27 crossing locations that had sufficient hydrologic data for the analysis. The evaluation list of culverts was further refined by identifying where the existing flood depth was below the roadway elevation, i.e. under normal channel flow conditions the roadway is not overtopped. Locations where the normal channel depth is greater than the roadway would require more extensive road and culvert modifications to eliminate roadway overtopping. The refinement led to 12 culvert crossing locations that were sent to the County to obtain As-Built records for further analysis (no survey data was obtained for this analysis). Of the 12 culvert crossings, 7 crossings had As-Built records. For more information on culvert crossing locations, refer to Appendix C. 3.4.3 HY-8 Analysis The County provided As-Builts for culvert ID number S206, O048, O153, O192, O206, P038, and S086. The As-Builts contained sufficient data for detailed analysis of the 7 crossings. The culverts were modeled in HY-8 to determine if the current culvert configuration causes the roadway to overtop for the 1% annual occurrence discharge.
Section 3
Hydrologic Model Development
Section 3 SSC.docx 3-15
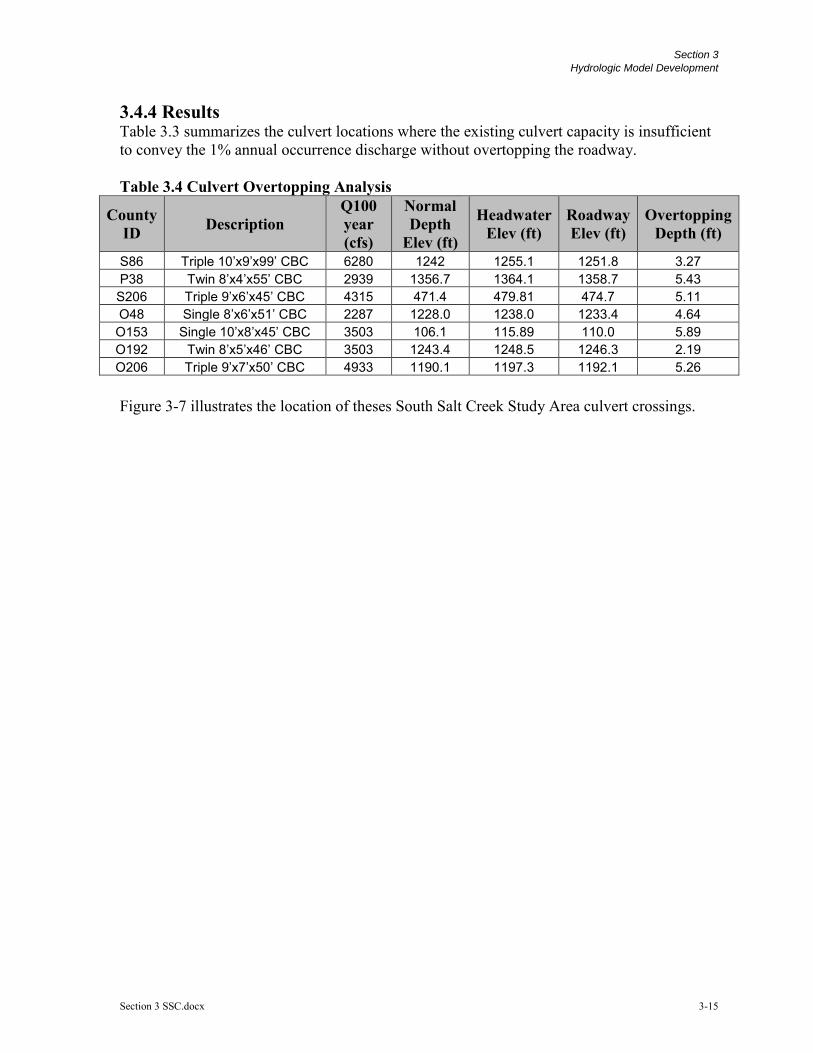
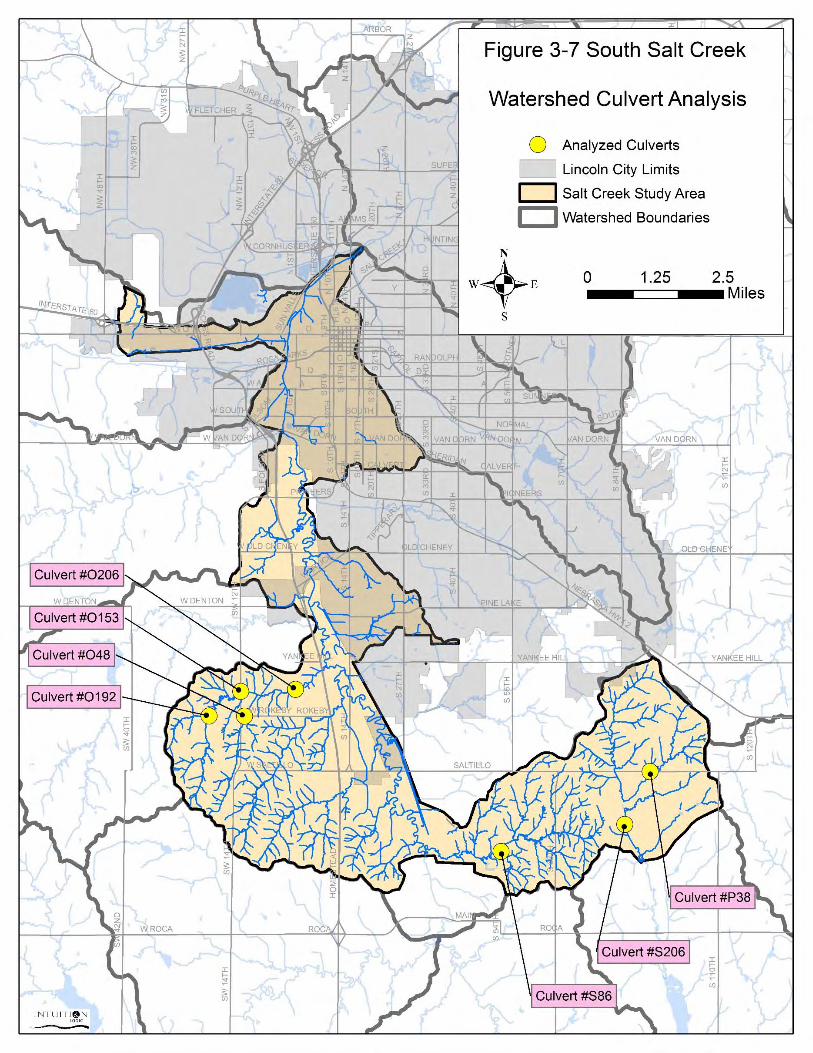
3.4.4 Results Table 3.3 summarizes the culvert locations where the existing culvert capacity is insufficient to convey the 1% annual occurrence discharge without overtopping the roadway. Table 3.4 Culvert Overtopping Analysis
County ID Description
Q100 year (cfs)
Normal Depth
Elev (ft)
Headwater Elev (ft)
Roadway Elev (ft)
Overtopping Depth (ft)
S86 Triple 10’x9’x99’ CBC 6280 1242 1255.1 1251.8 3.27 P38 Twin 8’x4’x55’ CBC 2939 1356.7 1364.1 1358.7 5.43 S206 Triple 9’x6’x45’ CBC 4315 471.4 479.81 474.7 5.11 O48 Single 8’x6’x51’ CBC 2287 1228.0 1238.0 1233.4 4.64 O153 Single 10’x8’x45’ CBC 3503 106.1 115.89 110.0 5.89 O192 Twin 8’x5’x46’ CBC 3503 1243.4 1248.5 1246.3 2.19 O206 Triple 9’x7’x50’ CBC 4933 1190.1 1197.3 1192.1 5.26 Figure 3-7 illustrates the location of theses South Salt Creek Study Area culvert crossings.
Section 3
Hydrologic Model Development
Section 3 SSC.docx 3-16