Embed Size (px)
Citation preview
Section 3: The North East Link
Chapters 6 to 10
January 2018
Section 3: The North East Link ii
Contents Section 3: Summary ....................................................................................................................................... v
6 The solution ................................................................................................................................... 6—1
6.1 Concept Design overview .............................................................................................. 6—1
6.2 Principal route (M80 to Eastern Freeway) ..................................................................... 6—3
6.2.1 Key segments ............................................................................................................................. 6—3
6.2.2 Principal roadway configuration ................................................................................................ 6—4
6.3 Strategic connections .................................................................................................... 6—5
6.3.1 Greensborough Bypass .............................................................................................................. 6—6
6.3.2 Grimshaw Street ........................................................................................................................ 6—7
6.3.3 Lower Plenty Road ..................................................................................................................... 6—8
6.3.4 Manningham Road and Bulleen Road........................................................................................ 6—9
6.3.5 Eastern Freeway ...................................................................................................................... 6—10
6.4 Eastern Freeway modernisation .................................................................................. 6—11
6.4.1 Doncaster Busway ................................................................................................................... 6—11
6.5 Bulleen Road upgrade .................................................................................................. 6—13
6.6 Local access .................................................................................................................. 6—13
6.7 Value creation and complementary projects .............................................................. 6—14
6.7.1 Project-specific VCC Plan ......................................................................................................... 6—14
6.7.2 Complementary projects ......................................................................................................... 6—14
6.8 Tolling ........................................................................................................................... 6—19
6.9 Design and operating parameters ............................................................................... 6—20
6.9.1 Vehicle speeds ......................................................................................................................... 6—20
6.9.2 Capacity and performance ....................................................................................................... 6—20
6.9.3 Safety ....................................................................................................................................... 6—20
6.9.4 Managed Motorway system .................................................................................................... 6—20
6.10 Other key project components .................................................................................... 6—22
6.10.1 Utilities ..................................................................................................................................... 6—22
6.10.2 Noise management .................................................................................................................. 6—22
6.10.3 Drainage and flood protection ................................................................................................. 6—22
6.10.4 Urban design ............................................................................................................................ 6—22
6.10.5 Sustainability............................................................................................................................ 6—23
6.11 Other complementary projects ................................................................................... 6—23
6.11.1 Road network improvement opportunities ............................................................................. 6—24
6.11.2 Other shared use path opportunities ...................................................................................... 6—25
6.11.3 Public transport improvements ............................................................................................... 6—25
6.11.4 Other opportunities ................................................................................................................. 6—26
7 Transport outcomes ...................................................................................................................... 7—1
7.1 Completing Melbourne’s orbital freeway network ....................................................... 7—1
7.2 Faster travel times and better accessibility ................................................................... 7—3
Section 3 - The North East Link iii
7.3 Reduced congestion and faster, more reliable commutes............................................ 7—5
7.3.1 Melbourne-wide statistics ......................................................................................................... 7—5
7.3.2 Key arterial roads in the north east ........................................................................................... 7—5
7.3.3 Eastern Freeway ........................................................................................................................ 7—1
7.3.4 Local network ............................................................................................................................ 7—2
7.4 Improved freight efficiency, accessibility and productivity ........................................... 7—4
7.4.1 Completion of the orbital freight network ................................................................................ 7—4
7.4.2 Greater freight efficiency and accessibility ................................................................................ 7—5
7.5 Improved road safety .................................................................................................... 7—6
7.6 A more resilient and better managed freeway network ............................................... 7—6
7.6.1 Greater network resilience and route choice ............................................................................ 7—6
7.6.2 Better managed freeways ......................................................................................................... 7—7
7.7 Faster, more reliable public transport ........................................................................... 7—7
7.8 High quality active transport connections ..................................................................... 7—9
8 Project benefits and impacts ...................................................................................................... 8—10
8.1 Meeting the Project Objectives ................................................................................... 8—10
8.1.1 Productive businesses ............................................................................................................. 8—12
8.1.2 Competitive supply chains ....................................................................................................... 8—20
8.1.3 Economic growth ..................................................................................................................... 8—25
8.1.4 Prosperous households ........................................................................................................... 8—27
8.1.5 Liveable neighbourhoods ........................................................................................................ 8—35
8.2 How the project solution minimises project impacts .................................................. 8—37
8.2.1 Potential heritage impacts ...................................................................................................... 8—37
8.2.2 Potential environmental impacts ............................................................................................ 8—38
8.2.3 Potential business impacts ...................................................................................................... 8—42
8.2.4 Potential social impacts ........................................................................................................... 8—43
8.2.5 Environmental management framework ................................................................................ 8—46
9 Financial analysis ........................................................................................................................... 9—1
9.1 Reference Project for financial analysis......................................................................... 9—1
9.2 Risk adjusted cost estimate ........................................................................................... 9—2
9.3 Financial analysis ........................................................................................................... 9—4
9.3.1 Financial analysis methodology ................................................................................................. 9—4
9.3.2 Key assumptions ........................................................................................................................ 9—4
9.4 Costs .............................................................................................................................. 9—5
9.4.1 State Project Development and Management cost estimate (risk adjusted) ............................ 9—5
9.4.2 Capital expenditure estimate (risk adjusted)............................................................................. 9—7
9.4.3 Operation & Maintenance expenditure estimate (risk adjusted) .............................................. 9—9
9.5 Risk adjustment ........................................................................................................... 9—10
9.6 Toll revenue ................................................................................................................. 9—11
9.6.1 Toll revenue - key assumptions and methodology .................................................................. 9—11
9.6.2 Toll revenue ............................................................................................................................. 9—13
9.6.3 Toll revenue sensitivity testing ................................................................................................ 9—13
Section 3: The North East Link iv
9.7 Notional funding split .................................................................................................. 9—14
9.7.1 Approach to determining the notional funding split ............................................................... 9—15
9.8 Project funding and budget and accounting ............................................................... 9—16
9.9 Independent cost review ............................................................................................. 9—16
10 Economic analysis ....................................................................................................................... 10—1
10.1 Approach to economic analysis ................................................................................... 10—1
10.1.1 General approach .................................................................................................................... 10—1
10.1.2 CBA framework ........................................................................................................................ 10—2
10.2 Cost benefit analysis .................................................................................................... 10—8
10.2.1 Economic costs ........................................................................................................................ 10—8
10.2.2 Benefits .................................................................................................................................... 10—9
10.2.3 Base CBA results summary .................................................................................................... 10—13
10.2.4 Risk and uncertainty analysis ................................................................................................. 10—14
10.2.5 Risk adjusted results summary .............................................................................................. 10—17
10.2.6 Sensitivity testing ................................................................................................................... 10—20
10.3 Real options ............................................................................................................... 10—23
10.3.1 Background ............................................................................................................................ 10—23
10.3.2 Possible real options and extent in the current delivery approach ....................................... 10—26
10.3.3 Next steps .............................................................................................................................. 10—27
Section 3 - The North East Link v
Section 3: Summary North East Link will complete the missing link in Melbourne’s orbital freeway network and establish a continuous freeway-standard orbital road around Melbourne, between Altona in the west and Frankston in the south. This section of the business case provides details of the proposed design of the new link and its anticipated transport outcomes, benefits and impacts. It also presents the results of the financial and economic analyses of the project conducted for the business case.
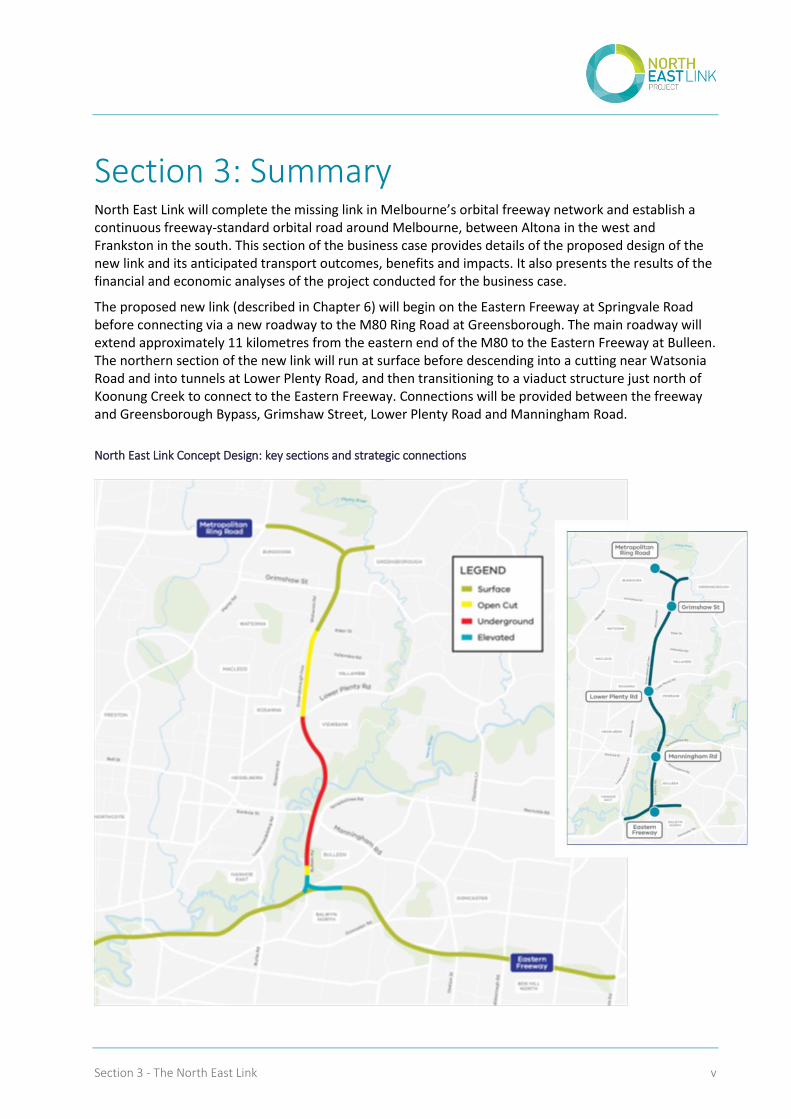
The proposed new link (described in Chapter 6) will begin on the Eastern Freeway at Springvale Road before connecting via a new roadway to the M80 Ring Road at Greensborough. The main roadway will extend approximately 11 kilometres from the eastern end of the M80 to the Eastern Freeway at Bulleen. The northern section of the new link will run at surface before descending into a cutting near Watsonia Road and into tunnels at Lower Plenty Road, and then transitioning to a viaduct structure just north of Koonung Creek to connect to the Eastern Freeway. Connections will be provided between the freeway and Greensborough Bypass, Grimshaw Street, Lower Plenty Road and Manningham Road.
North East Link Concept Design: key sections and strategic connections
Section 3: The North East Link vi
The project includes modernisation of the Eastern Freeway between Chandler Highway and Springvale Road to integrate effectively with North East Link, keep pace with increasing traffic volumes and changing travel demands, and provide greater capacity to accommodate cross-city orbital movements between North East Link and EastLink. The modernisation includes a reconfiguration of the freeway, new Doncaster Busway infrastructure and installation of the latest Managed Motorway technology.
The project also includes upgrades to Bulleen Road, new walking and cycling infrastructure and a series of land bridges to preserve local access and improve urban amenity in the area.
North East Link will be tolled to optimise asset use and traffic flows across the city’s road network and to assist in funding the project through a user pays mechanism.
When completed, North East Link will connect Melbourne’s other existing freeways, allowing for freeway-standard orbital movements around Melbourne, starting from Altona and ending in Frankston, via the M80, the North East Link, the modernised Eastern Freeway and EastLink. For the first time, Melbourne will have a fully connected orbital freeway network that provides continuous traffic flow conditions and efficient long distance travel across and through Melbourne, with strategic connections to the arterial road network.
Complementary projects have been identified to capitalise on opportunities created by North East Link. These projects include arterial road upgrades, additional walking and cycling initiatives and public transport improvements. The complementary projects included in the Concept Design have been fully considered in the project risks, costs, benefits, impacts and economic appraisal. Other complementary projects not included in the project scope are recommended for separate funding requests.
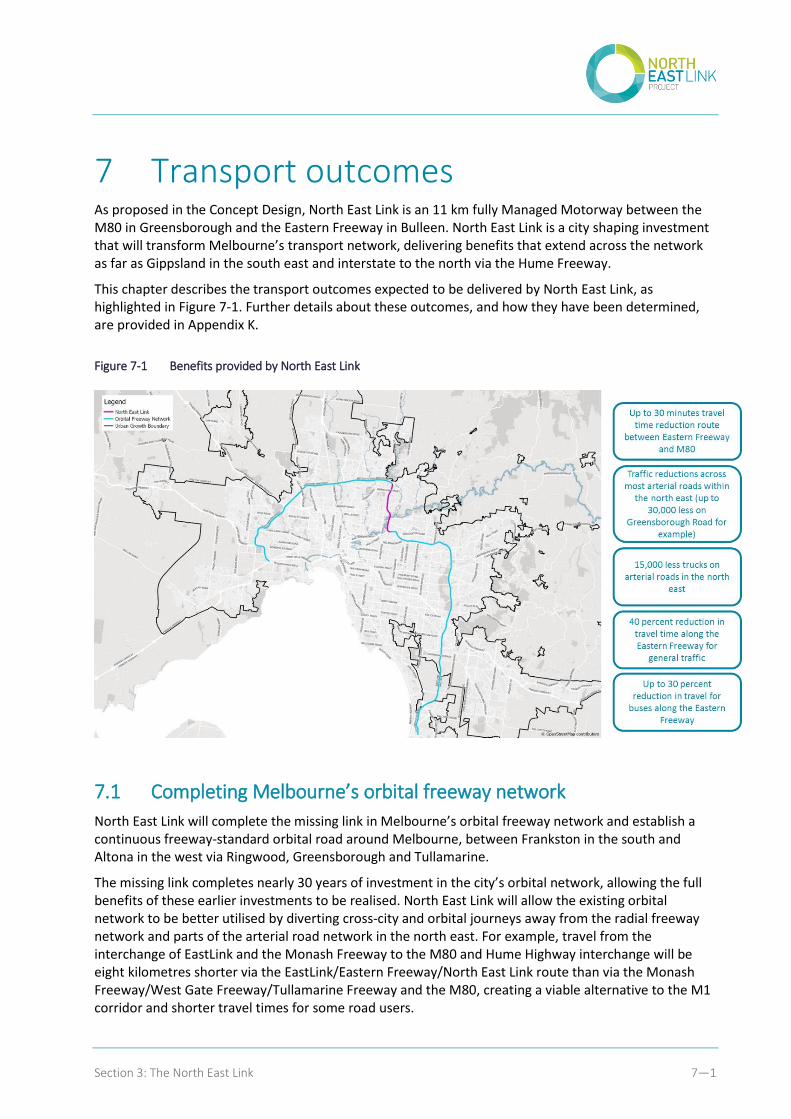
Once operational, North East Link is expected to deliver positive transport outcomes across the network as far as Gippsland in the south east and interstate to the north via the Hume Freeway. These outcomes are described in Chapter 7 and include:
Significant reductions in travel times, including up to 30 minutes in reduced travel time between the Eastern Freeway and the M80, and a 40 percent reduction in travel time along the Eastern Freeway
Significant traffic reductions across arterial roads in the north east
15,000 fewer trucks on arterial roads in the north east
Faster and more reliable travel times for cross-city and orbital freight movements
Congestion relief at the five north-south bridge crossings of the Yarra River
Traffic relief along the M1 corridor, allowing it to operate more efficiently with reduced traffic volumes
Up to 30 percent reduction in travel time for buses along the Eastern Freeway.
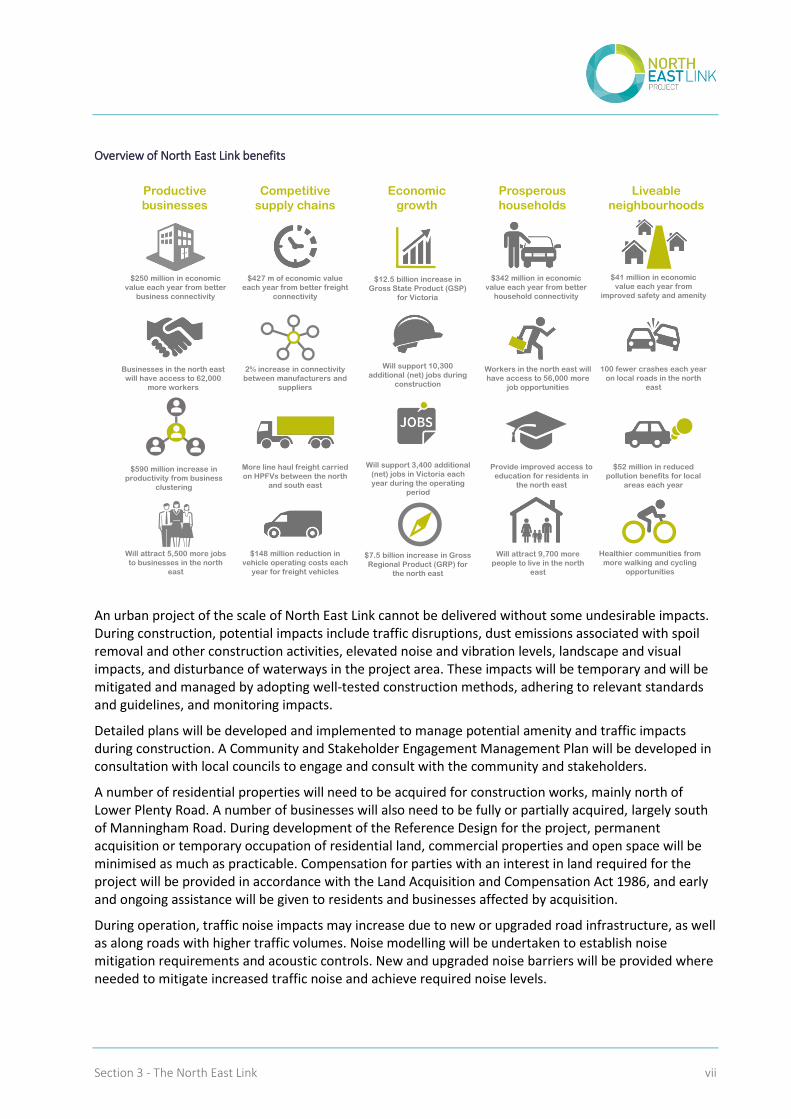
Chapter 8 reports the results of preliminary assessments of the project’s economic, social, environmental and business benefits and impacts. These assessments have identified that North East Link will deliver significant and tangible benefits to businesses and households in the north eastern suburbs of Melbourne, as well as the northern growth corridor and the south east of Melbourne. The project will also provide efficiencies to the freight sector and drive increased productivity for businesses across the broader Melbourne and Victorian economies. An overview of the project’s anticipated benefits is shown below.
Redacted – commercial-in-confidence
Section 3 - The North East Link vii
Overview of North East Link benefits
An urban project of the scale of North East Link cannot be delivered without some undesirable impacts. During construction, potential impacts include traffic disruptions, dust emissions associated with spoil removal and other construction activities, elevated noise and vibration levels, landscape and visual impacts, and disturbance of waterways in the project area. These impacts will be temporary and will be mitigated and managed by adopting well-tested construction methods, adhering to relevant standards and guidelines, and monitoring impacts.
Detailed plans will be developed and implemented to manage potential amenity and traffic impacts during construction. A Community and Stakeholder Engagement Management Plan will be developed in consultation with local councils to engage and consult with the community and stakeholders.
A number of residential properties will need to be acquired for construction works, mainly north of Lower Plenty Road. A number of businesses will also need to be fully or partially acquired, largely south of Manningham Road. During development of the Reference Design for the project, permanent acquisition or temporary occupation of residential land, commercial properties and open space will be minimised as much as practicable. Compensation for parties with an interest in land required for the project will be provided in accordance with the Land Acquisition and Compensation Act 1986, and early and ongoing assistance will be given to residents and businesses affected by acquisition.
During operation, traffic noise impacts may increase due to new or upgraded road infrastructure, as well as along roads with higher traffic volumes. Noise modelling will be undertaken to establish noise mitigation requirements and acoustic controls. New and upgraded noise barriers will be provided where needed to mitigate increased traffic noise and achieve required noise levels.
Productive
businesses
$250 million in economic
value each year from better
business connectivity
Businesses in the north east
will have access to 62,000
more workers
$590 million increase in
productivity from business
clustering
Competitive
supply chains
Economic
growth
Prosperous
households
Liveable
neighbourhoods
Will attract 5,500 more jobs
to businesses in the north
east
$12.5 billion increase in
Gross State Product (GSP)
for Victoria
$427 m of economic value
each year from better freight
connectivity
2% increase in connectivity
between manufacturers and
suppliers
More line haul freight carried
on HPFVs between the north
and south east
$148 million reduction in
vehicle operating costs each
year for freight vehicles
Will support 10,300
additional (net) jobs during
construction
Will support 3,400 additional
(net) jobs in Victoria each
year during the operating
period
$342 million in economic
value each year from better
household connectivity
Workers in the north east will
have access to 56,000 more
job opportunities
Provide improved access to
education for residents in
the north east
Will attract 9,700 more
people to live in the north
east
$41 million in economic
value each year from
improved safety and amenity
100 fewer crashes each year
on local roads in the north
east
$52 million in reduced
pollution benefits for local
areas each year
Healthier communities from
more walking and cycling
opportunities
$7.5 billion increase in Gross
Regional Product (GRP) for
the north east
Section 3: The North East Link viii
These and other potential longer term impacts will be investigated further as part of the planning and environmental approvals process, which will include the identification of appropriate measures to avoid, minimise or manage adverse impacts. A set of Environmental Performance Requirements (EPRs) will be developed for the project to define the minimum environmental outcomes that must be achieved for design, construction and operation. The EPRs are likely to include requirements to comply with specific regulations, policies and guidelines, achieve (or exceed) recognised thresholds and levels, and adopt industry best-practice or well-tested construction approaches and methods.
Chapter 9 presents the findings of the financial analysis performed for the North East Link Project for the business case.
The economic analysis performed for the business case (presented in Chapter 10) indicates that North East Link will deliver significant economic value for Victoria and the national economy, with total benefits around $3.1 billion greater than the capital and operating costs of the project.
The benefit cost ratio of the project is estimated to be 1.3, which means that for every dollar spent on the project, the Victorian economy will receive $1.30 of value in return. This is equivalent to an internal rate of return of 8.3 percent, demonstrating the positive economic value-for-money potentially delivered by the project. If land use and wider economic benefits (WEBs) are included, the estimated BCR improves to 1.4.
Defining the project scope
The assessments, analyses and appraisals required for this business case are based upon agreed design solutions, assumptions and scenarios.
Concept Design – a proposed design for North East Link that provides the basis for assessing the potential transport outcomes, benefits, impacts and economic value for money of the project. The Concept Design identifies the minimum infrastructure required to meet anticipated demand, based on a comprehensive options assessment process, engineering studies and technical investigations. The Concept Design is described in Chapter 6.
Reference Project – a broader definition of the North East Link Project developed for the purposes of estimating the costs, economic value and budgetary implications of the project. The Reference Project comprises three cost categories: State project development and management costs, design and construction (D&C) costs (based on the Concept Design) and operation and maintenance (O&M) costs. It also makes assumptions about tolling functions and responsibilities. The Reference Project is described in Chapter 9 and Appendix M.
Reference Case – a set of core assumptions about the future state of the transport network in Victoria, developed and updated by Transport for Victoria. These assumptions are designed to achieve consistency across strategic transport and traffic modelling undertaken for projects and initiatives in Victoria. Reference Case v1.09 (2017) assumptions used in the modelling conducted for the business case are described in Appendix R.
Reference Packaging Solution – a proposed packaging solution for the project that provides the basis for identifying and modelling procurement options and testing these options with the market. The Reference Packaging Solution assumes delivery of North East Link in the form of the Concept Design and adopting the tolling functions and responsibilities defined in the Reference Project. The Reference Packaging Solution is described in Chapter 11 and Appendix S.
Reference Design – a more detailed design for North East Link that refines the Concept Design and provides the basis for a comprehensive assessment of the project’s impacts. Should the project proceed past the business case stage, the Victorian Government will undertake more exhaustive consideration of all elements to refine the project scope and develop the Reference Design. This process is likely to result in changes to the Concept Design to improve aspects of the project, enhance its constructability and further reduce adverse impacts. The Reference Design is used as the ‘starting point’ for the statutory planning and environmental approvals process, and is assessed formally as part the Environment Effects Statement (EES) prepared for the project.
Redacted – commercial-in-confidence
Section 3 - The North East Link 6—1
6 The solution As described in Chapter 5, the detailed appraisal identified that corridor option A best addresses the problems arising from poor orbital connectivity through Melbourne’s north east and meets the Project Objectives and Guiding Principles for North East Link.
This part of the business case summarises the proposed project base scope for North East Link, referred to as a Concept Design. The Concept Design presented in this business case identifies the minimum infrastructure required to meet anticipated demand, based upon a comprehensive ‘optioneering’ process and engineering and other technical studies.
The Concept Design has been developed for the purposes of assessing the benefits, impacts and economic value for money of North East Link to enable the Victorian Government to make an informed investment decision. The Concept Design was developed to inform the business case. Should the project proceed past the business case stage, the State will undertake a more exhaustive consideration of all aspects of the project to refine the Concept Design, including further consideration of design options and construction methods.
This chapter also outlines potential complementary projects that could be delivered alongside North East Link. While some of these complementary projects are outside the base scope for North East Link and do not form part of the Concept Design, they would enable the State to capture additional benefits and value by capitalising on opportunities created by the project.
Additional reports describing the proposed Concept Design for North East Link and potential complementary projects are provided in Appendix J and I respectively.
6.1 Concept Design overview
The proposed North East Link will begin on the Eastern Freeway at Springvale Road before connecting via a new roadway to the M80 Ring Road at Greensborough.
The principal roadway will extend approximately 11 kilometres from the eastern end of the M80 Ring Road to the Eastern Freeway at Bulleen. The northern section of the new link will run at surface before descending into a cutting near Watsonia Road and then into tunnels at Lower Plenty Road, and then transitioning to a viaduct structure just north of Koonung Creek to connect to the Eastern Freeway. Connections will be provided between the freeway and Greensborough Bypass, Grimshaw Street, Lower Plenty Road and Manningham Road. Modernisation of the Eastern Freeway between Chandler Highway and Springvale Road, including new Doncaster Busway infrastructure, will provide greater capacity to accommodate cross-city orbital movements between North East Link and EastLink.
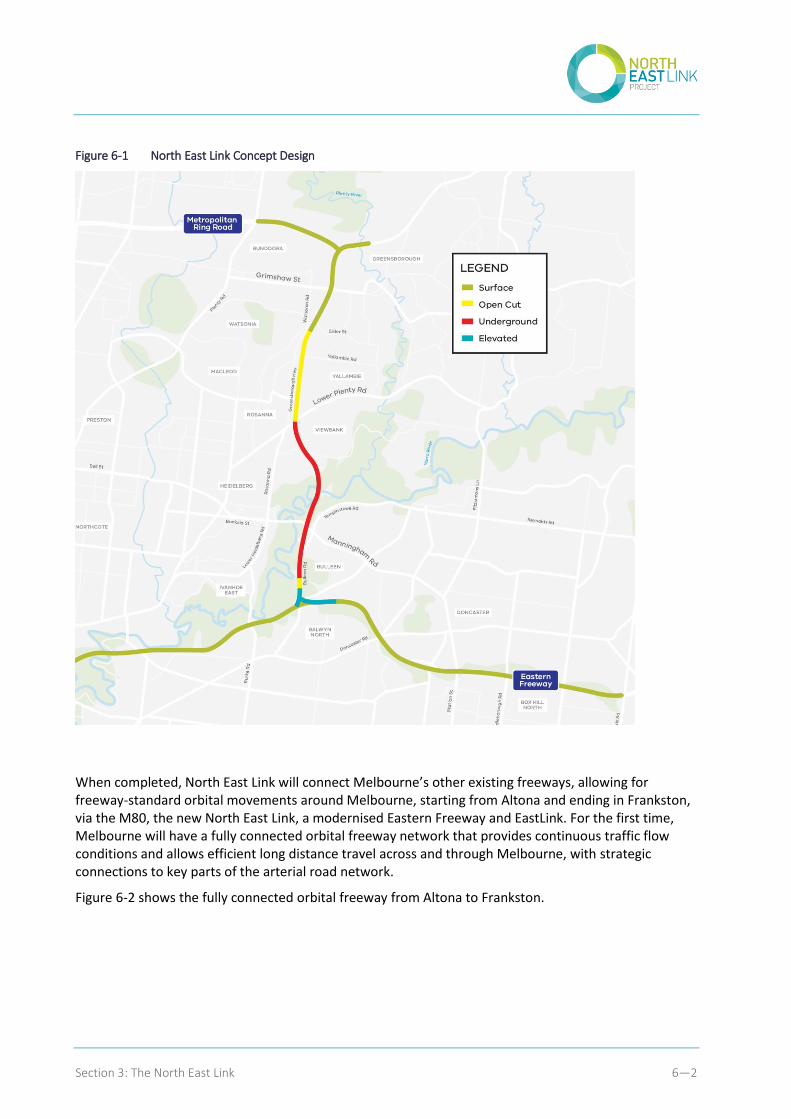
Figure 6-1 provides an overview of the proposed Concept Design for North East Link.
Section 3: The North East Link 6—2
Figure 6-1 North East Link Concept Design
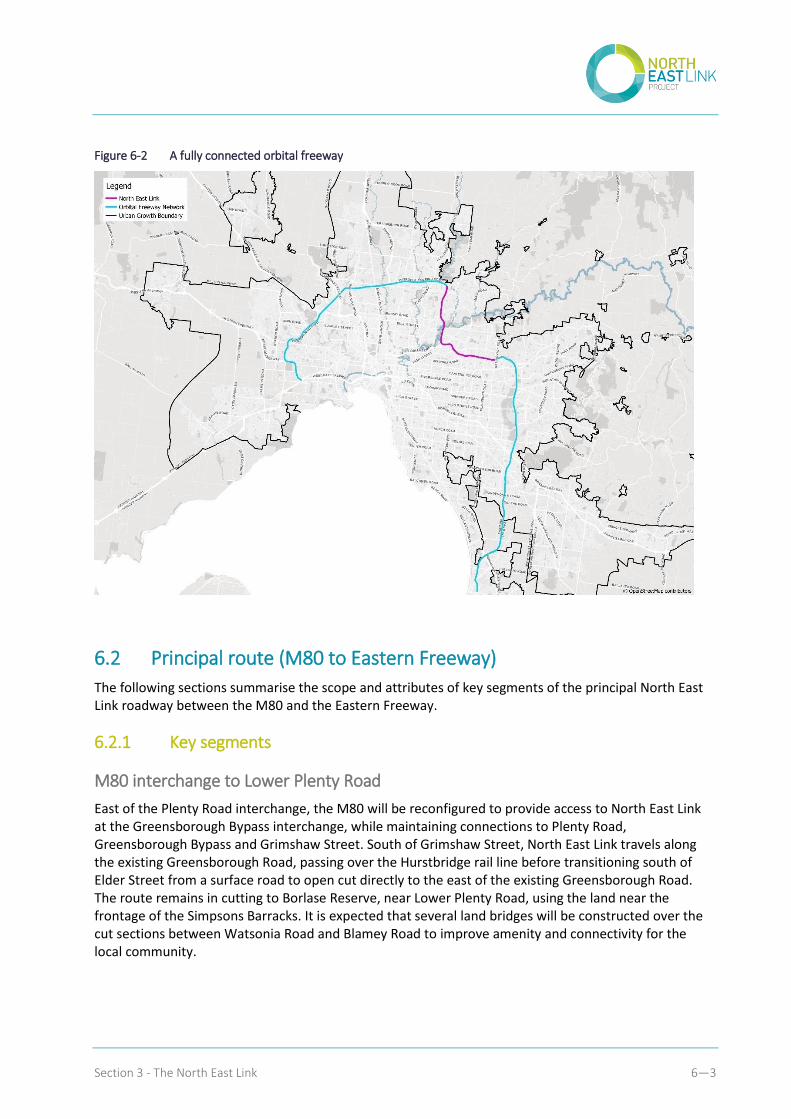
When completed, North East Link will connect Melbourne’s other existing freeways, allowing for freeway-standard orbital movements around Melbourne, starting from Altona and ending in Frankston, via the M80, the new North East Link, a modernised Eastern Freeway and EastLink. For the first time, Melbourne will have a fully connected orbital freeway network that provides continuous traffic flow conditions and allows efficient long distance travel across and through Melbourne, with strategic connections to key parts of the arterial road network.
Figure 6-2 shows the fully connected orbital freeway from Altona to Frankston.
Section 3 - The North East Link 6—3
Figure 6-2 A fully connected orbital freeway
6.2 Principal route (M80 to Eastern Freeway)
The following sections summarise the scope and attributes of key segments of the principal North East Link roadway between the M80 and the Eastern Freeway.
6.2.1 Key segments
M80 interchange to Lower Plenty Road
East of the Plenty Road interchange, the M80 will be reconfigured to provide access to North East Link at the Greensborough Bypass interchange, while maintaining connections to Plenty Road, Greensborough Bypass and Grimshaw Street. South of Grimshaw Street, North East Link travels along the existing Greensborough Road, passing over the Hurstbridge rail line before transitioning south of Elder Street from a surface road to open cut directly to the east of the existing Greensborough Road. The route remains in cutting to Borlase Reserve, near Lower Plenty Road, using the land near the frontage of the Simpsons Barracks. It is expected that several land bridges will be constructed over the cut sections between Watsonia Road and Blamey Road to improve amenity and connectivity for the local community.
Section 3: The North East Link 6—4
Lower Plenty Road to Manningham Road
From Lower Plenty Road, North East Link enters a tunnel portal and continues south in twin tunnels with three traffic lanes in each direction. The tunnels curve slightly eastwards to cross the Yarra River before realigning and connecting with the Bulleen Road corridor. An interchange at Manningham Road is provided within a cut and cover structure.
Manningham Road to Eastern Freeway interchange
Beyond the underground interchange at Manningham Road, North East Link continues in tunnel under Bulleen Road, before reaching the portal just north of Koonung Creek, rising onto viaducts to provide free flow ramp connections with the Eastern Freeway.
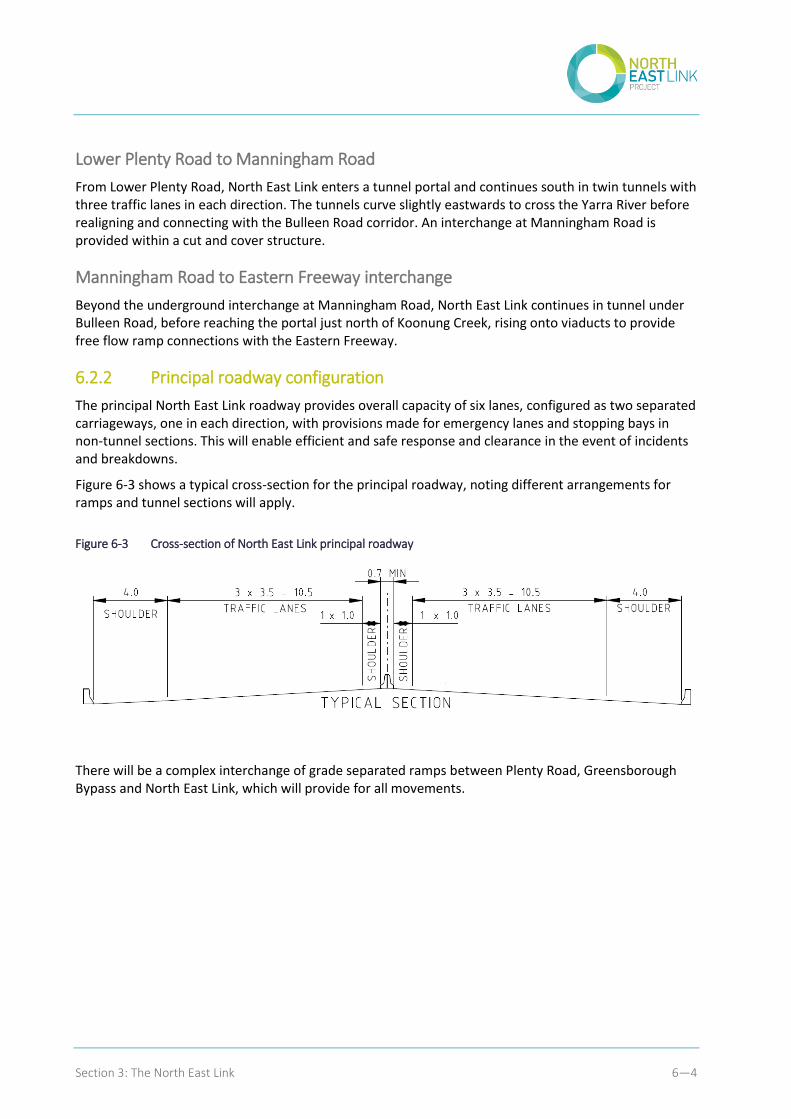
6.2.2 Principal roadway configuration
The principal North East Link roadway provides overall capacity of six lanes, configured as two separated carriageways, one in each direction, with provisions made for emergency lanes and stopping bays in non-tunnel sections. This will enable efficient and safe response and clearance in the event of incidents and breakdowns.
Figure 6-3 shows a typical cross-section for the principal roadway, noting different arrangements for ramps and tunnel sections will apply.
Figure 6-3 Cross-section of North East Link principal roadway
There will be a complex interchange of grade separated ramps between Plenty Road, Greensborough Bypass and North East Link, which will provide for all movements.
Section 3 - The North East Link 6—5
6.3 Strategic connections
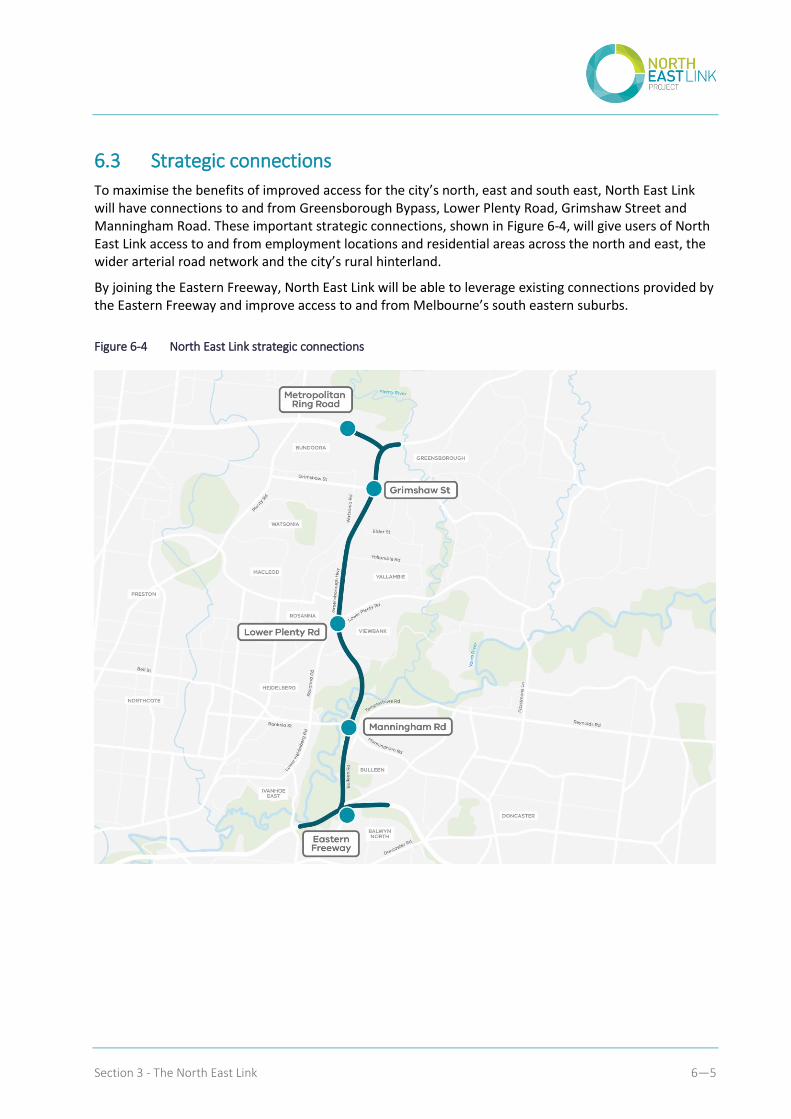
To maximise the benefits of improved access for the city’s north, east and south east, North East Link will have connections to and from Greensborough Bypass, Lower Plenty Road, Grimshaw Street and Manningham Road. These important strategic connections, shown in Figure 6-4, will give users of North East Link access to and from employment locations and residential areas across the north and east, the wider arterial road network and the city’s rural hinterland.
By joining the Eastern Freeway, North East Link will be able to leverage existing connections provided by the Eastern Freeway and improve access to and from Melbourne’s south eastern suburbs.
Figure 6-4 North East Link strategic connections
Section 3: The North East Link 6—6
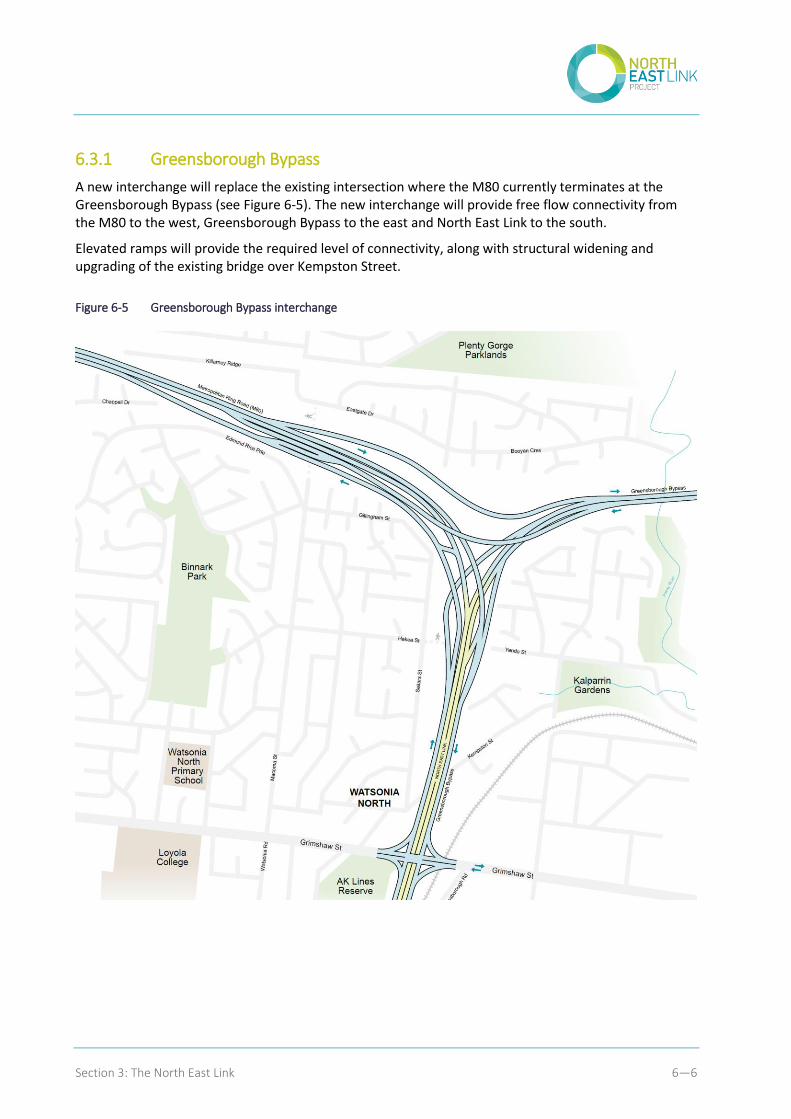
6.3.1 Greensborough Bypass
A new interchange will replace the existing intersection where the M80 currently terminates at the Greensborough Bypass (see Figure 6-5). The new interchange will provide free flow connectivity from the M80 to the west, Greensborough Bypass to the east and North East Link to the south.
Elevated ramps will provide the required level of connectivity, along with structural widening and upgrading of the existing bridge over Kempston Street.
Figure 6-5 Greensborough Bypass interchange
Section 3 - The North East Link 6—7
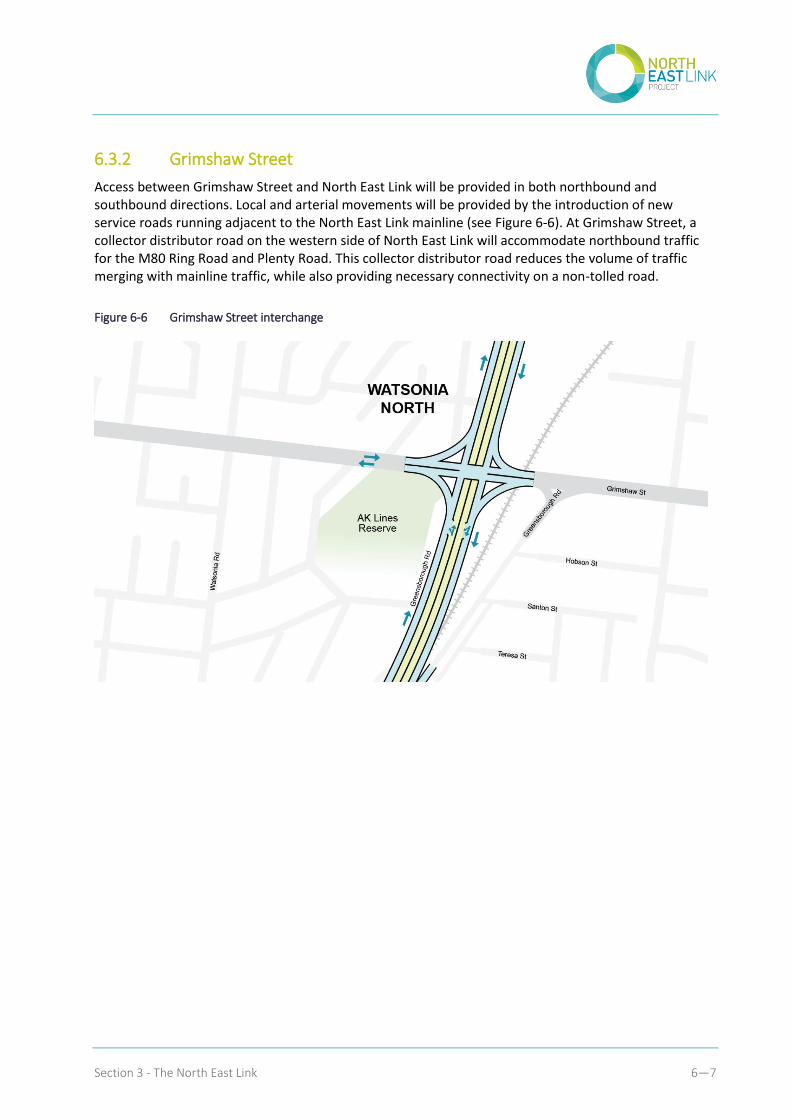
6.3.2 Grimshaw Street
Access between Grimshaw Street and North East Link will be provided in both northbound and southbound directions. Local and arterial movements will be provided by the introduction of new service roads running adjacent to the North East Link mainline (see Figure 6-6). At Grimshaw Street, a collector distributor road on the western side of North East Link will accommodate northbound traffic for the M80 Ring Road and Plenty Road. This collector distributor road reduces the volume of traffic merging with mainline traffic, while also providing necessary connectivity on a non-tolled road.
Figure 6-6 Grimshaw Street interchange
Section 3: The North East Link 6—8
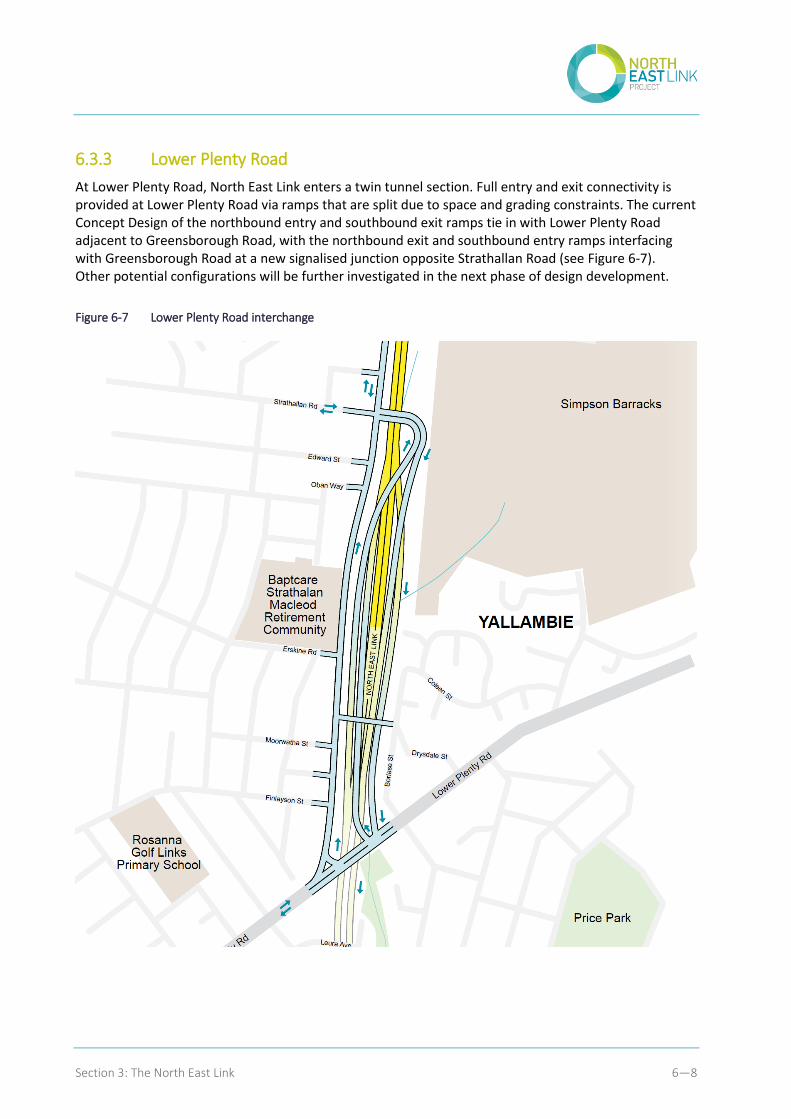
6.3.3 Lower Plenty Road
At Lower Plenty Road, North East Link enters a twin tunnel section. Full entry and exit connectivity is provided at Lower Plenty Road via ramps that are split due to space and grading constraints. The current Concept Design of the northbound entry and southbound exit ramps tie in with Lower Plenty Road adjacent to Greensborough Road, with the northbound exit and southbound entry ramps interfacing with Greensborough Road at a new signalised junction opposite Strathallan Road (see Figure 6-7). Other potential configurations will be further investigated in the next phase of design development.
Figure 6-7 Lower Plenty Road interchange
Section 3 - The North East Link 6—9
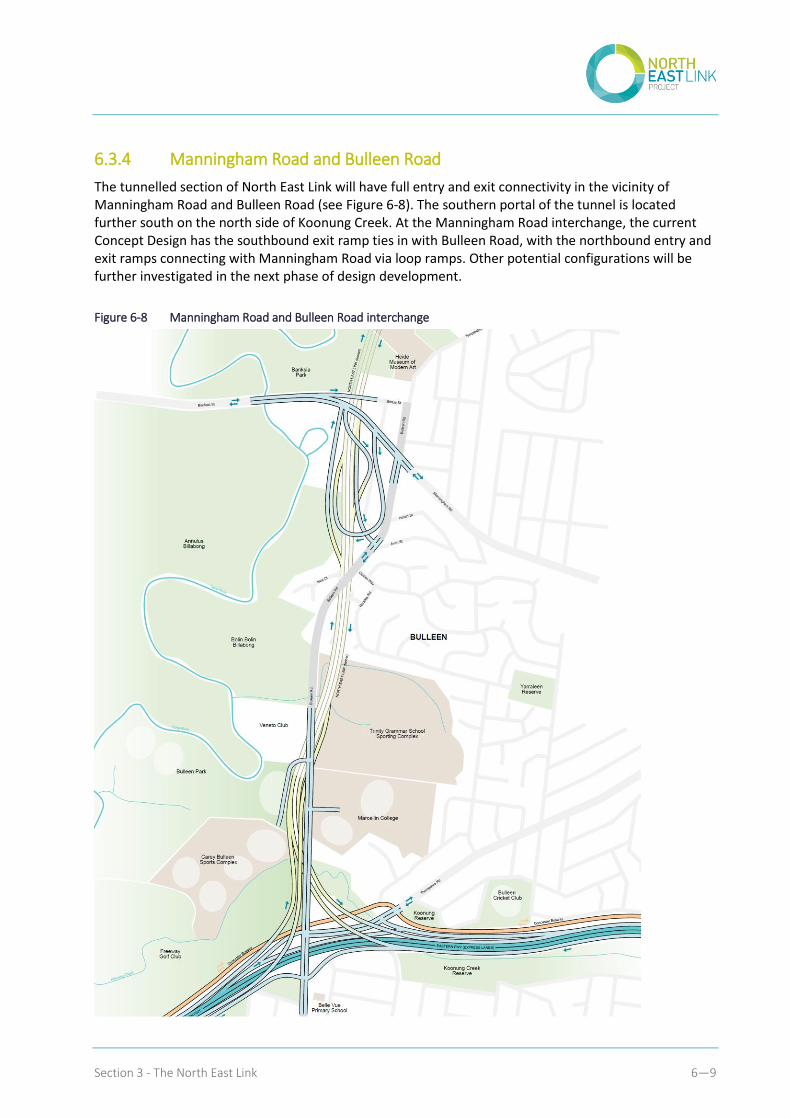
6.3.4 Manningham Road and Bulleen Road
The tunnelled section of North East Link will have full entry and exit connectivity in the vicinity of Manningham Road and Bulleen Road (see Figure 6-8). The southern portal of the tunnel is located further south on the north side of Koonung Creek. At the Manningham Road interchange, the current Concept Design has the southbound exit ramp ties in with Bulleen Road, with the northbound entry and exit ramps connecting with Manningham Road via loop ramps. Other potential configurations will be further investigated in the next phase of design development.
Figure 6-8 Manningham Road and Bulleen Road interchange
Section 3: The North East Link 6—10
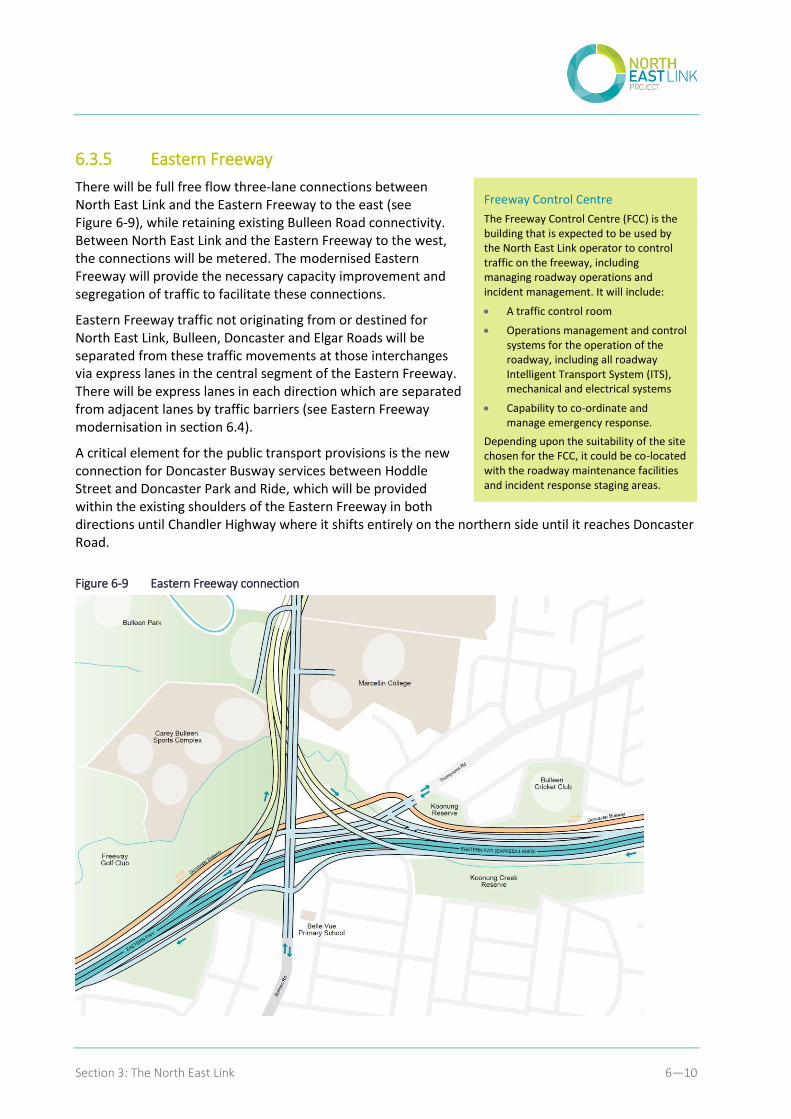
6.3.5 Eastern Freeway
There will be full free flow three-lane connections between North East Link and the Eastern Freeway to the east (see Figure 6-9), while retaining existing Bulleen Road connectivity. Between North East Link and the Eastern Freeway to the west, the connections will be metered. The modernised Eastern Freeway will provide the necessary capacity improvement and segregation of traffic to facilitate these connections.
Eastern Freeway traffic not originating from or destined for North East Link, Bulleen, Doncaster and Elgar Roads will be separated from these traffic movements at those interchanges via express lanes in the central segment of the Eastern Freeway. There will be express lanes in each direction which are separated from adjacent lanes by traffic barriers (see Eastern Freeway modernisation in section 6.4).
A critical element for the public transport provisions is the new connection for Doncaster Busway services between Hoddle Street and Doncaster Park and Ride, which will be provided within the existing shoulders of the Eastern Freeway in both directions until Chandler Highway where it shifts entirely on the northern side until it reaches Doncaster Road.
Figure 6-9 Eastern Freeway connection
Freeway Control Centre
The Freeway Control Centre (FCC) is the building that is expected to be used by the North East Link operator to control traffic on the freeway, including managing roadway operations and incident management. It will include:
A traffic control room
Operations management and control systems for the operation of the roadway, including all roadway Intelligent Transport System (ITS), mechanical and electrical systems
Capability to co-ordinate and manage emergency response.
Depending upon the suitability of the site chosen for the FCC, it could be co-located with the roadway maintenance facilities and incident response staging areas.
Section 3 - The North East Link 6—11
6.4 Eastern Freeway modernisation
The Eastern Freeway will be modernised to integrate effectively with North East Link and keep pace with increasing traffic volumes and changing travel demands. The modernisation will include the latest Managed Motorway technology installed from end to end, including dynamic lane use signs, variable message signs, increased CCTV, up to date automatic incident detection and ramp signals with associated ramp signs and travel time signs.
As the existing freeway passes under road and pedestrian crossings, and over waterways (Merri Creek, Yarra River and arch culvert crossings housing Koonung Creek), modifications to structures will be required. These works will include new or widened bridge structures, several modifications below existing bridges, some bridge replacements and creek and culvert works.
Eastbound
East of Burke Road, the eastbound carriageway of the Eastern Freeway will divide into two barrier-separated carriageways. The inner express carriageway will carry Eastern Freeway through traffic and remain separate from the interchanges and mainline freeway until Middleborough Road. The outer collector distributor carriageway will connect to North East Link and arterial road ramps.
The express lanes will continue in the central carriageway of the Eastern Freeway, while the collector distributor will provide access to Bulleen, Doncaster, Elgar and Middleborough Roads. A braided ramp will allow the express lanes carriageway to access Middleborough Road. Past this point, the two carriageways re-join into one.
Westbound
The westbound carriageway of the Eastern Freeway from Tram Road through to Burke Road will have a similar arrangement to the eastbound carriageway. West of Tram Road, the westbound carriageway will divide into two barrier-separated carriageways; one carriageway will provide express lanes and the other will provide collector distributor lanes. The inner carriageway will carry the Eastern Freeway through traffic.
The collector distributor lanes will provide access to and from North East Link, Bulleen and Doncaster Roads. The express lanes will re-join the collector distributor after the North East Link interchange, prior to Burke Road.
6.4.1 Doncaster Busway
A long-term transport policy objective of successive Victorian Governments has been to provide fast, efficient and reliable public transport running along the Eastern Freeway corridor to service the population catchment to the north of the Eastern Freeway.
Doncaster Busway was initially identified as a complementary project; however, the project design has evolved to incorporate Doncaster Busway as an integral component of the Eastern Freeway modernisation. The Doncaster Busway will contribute significantly to the improved accessibility delivered by the project (see Chapter 8).
Section 3: The North East Link 6—12
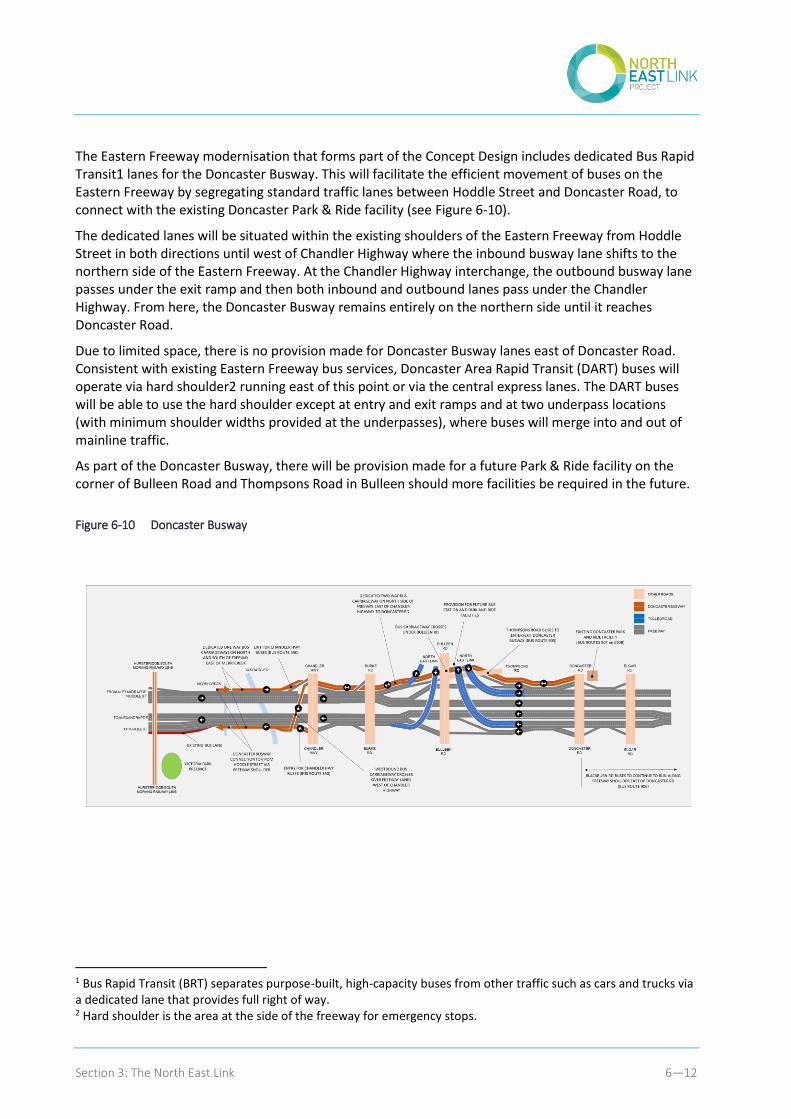
The Eastern Freeway modernisation that forms part of the Concept Design includes dedicated Bus Rapid Transit1 lanes for the Doncaster Busway. This will facilitate the efficient movement of buses on the Eastern Freeway by segregating standard traffic lanes between Hoddle Street and Doncaster Road, to connect with the existing Doncaster Park & Ride facility (see Figure 6-10).
The dedicated lanes will be situated within the existing shoulders of the Eastern Freeway from Hoddle Street in both directions until west of Chandler Highway where the inbound busway lane shifts to the northern side of the Eastern Freeway. At the Chandler Highway interchange, the outbound busway lane passes under the exit ramp and then both inbound and outbound lanes pass under the Chandler Highway. From here, the Doncaster Busway remains entirely on the northern side until it reaches Doncaster Road.
Due to limited space, there is no provision made for Doncaster Busway lanes east of Doncaster Road. Consistent with existing Eastern Freeway bus services, Doncaster Area Rapid Transit (DART) buses will operate via hard shoulder2 running east of this point or via the central express lanes. The DART buses will be able to use the hard shoulder except at entry and exit ramps and at two underpass locations (with minimum shoulder widths provided at the underpasses), where buses will merge into and out of mainline traffic.
As part of the Doncaster Busway, there will be provision made for a future Park & Ride facility on the corner of Bulleen Road and Thompsons Road in Bulleen should more facilities be required in the future.
Figure 6-10 Doncaster Busway
1 Bus Rapid Transit (BRT) separates purpose-built, high-capacity buses from other traffic such as cars and trucks via a dedicated lane that provides full right of way. 2 Hard shoulder is the area at the side of the freeway for emergency stops.
Section 3 - The North East Link 6—13
6.5 Bulleen Road upgrade
North East Link creates opportunities to enhance local access by improving the adjacent arterial road network that connects communities and employment hubs. Potential opportunities to improve amenity and safety, as well as address flooding issues, along Bulleen Road were identified initially as complementary projects. However, as the Concept Design has evolved, North East Link will now have an impact on parts of Bulleen Road, requiring it to be re-graded to accommodate the ramp connections to the Eastern Freeway (shown in Figure 6-8). As a result, access roads and modifications to existing access points along Bulleen Road are required to restore access to adjoining properties. This creates an opportunity to deliver proposed upgrades to Bulleen Road as part of Bulleen Road component of North East Link’s project scope.
The proposed upgrades to Bulleen Road between Manningham Road and the Eastern Freeway include:
Re-alignment of the access road into Bulleen Park and Carey Sports Complex, including a new signalised intersection with Bulleen Road and Marcellin College access point
New signalised intersection at the Veneto Club entrance and Bulleen Road
Provision of bicycle lanes on both carriageways
Raising the southbound carriageway to the same level of flood immunity as the northbound carriageway, mitigating some of the drainage issues in the area.
6.6 Local access
Maintaining local access for communities adjacent to North East Link is a priority for the project. Local access functions of all existing roads impacted by the project will be maintained along the principal North East Link route, between the M80 and Eastern Freeway, and crossing the Eastern Freeway.
Local access north of Grimshaw Street will be retained, with the junction at the M80 and service roads maintaining existing movements in the area. The intersection of Grimshaw Street and Greensborough Bypass will be reconfigured to increase capacity. The Greensborough Bypass bridge over Kempston Street will be widened to accommodate North East Link traffic lanes.
To the south of Grimshaw Street, local access is provided by two new roads along the existing service road alignment: one on each side of North East Link to reinstate the connection between Grimshaw Street and Watsonia Road and the railway station. Pedestrian access to Watsonia railway station from Elder Street will be relocated south to a new bridge along the existing transmission easement. The new bridge will also provide new road access directly to Watsonia Road. The junction between the existing Greensborough Bypass and Watsonia Road will be reconfigured to receive the service road traffic from the eastern side via a structure over North East Link. Access to Watsonia railway station carpark will be provided from this junction and reconfigured to accommodate the North East Link alignment.
Bridges over North East Link will be provided at Yallambie Road, Blamey Road and Drysdale Street to maintain current connectivity. At Manningham Road, Bridge Street’s westbound traffic lanes may be removed; however, all other existing access in the area will be retained. A number of industrial zoned properties will need to be acquired.
Local access will be maintained for communities spanning the Eastern Freeway, with several existing pedestrian bridges crossing the Eastern Freeway modernised to the most recent DDA standards.
Section 3: The North East Link 6—14
6.7 Value creation and complementary projects
North East Link is a high-value construction project with the potential for significant value creation and value capture (VCC) opportunities. The project is subject to the Victorian Government’s Value Creation and Capture Framework (VCC Framework) and is one of the first projects to implement the framework. The VCC Framework sets out an approach to systematically harness the potential of government investments to:
Create additional value for the community through the implementation of value creation mechanisms
Capture a portion of the incremental economic value created by government investments through the implementation of value capture mechanisms.
NELA is committed to delivering outcomes in accordance with the VCC Framework and has developed a Value Creation and Capture Plan (VCC Plan) that identifies opportunities to create additional public value above and beyond what would ordinarily be achieved by the project.
6.7.1 Project-specific VCC Plan
In accordance with the VCC Framework, NELA prepared a project-specific VCC plan with 19 recommendations (provided as Appendix F). Some of the value creation recommendations have been built into the North East Link Concept Design as complementary projects (see section 6.7.2 below), including the provision of new active and public transport infrastructure. Other opportunities – such as those related to property and planning mechanisms, third party incentives, urban design and procurement conditions – will continue to be explored and refined through the development of the Reference Design and the procurement process.
The plan’s value capture recommendations are discussed in Chapter 8.
Once approved, the plan will be used to guide and inform the identification and development of value creation and capture opportunities throughout the life of the project.
6.7.2 Complementary projects
Complementary projects have been identified to capitalise on opportunities created by North East Link and create value for Melbourne’s north east. These projects are designed to improve safety, enhance urban amenity, improve active transport and public transport services, and provide better access to key destinations such as schools, shopping centres, health services and community facilities.
Preliminary discussions, investigations and analysis conducted with Transport for Victoria, PTV, VicRoads and local councils have identified a number of potential complementary projects. These complementary projects, while not exhaustive, have been selected from a longer list of opportunities that directly or indirectly enhance the benefits delivered by North East Link.
The complementary projects shown in Figure 6-11 and discussed in this section have been recommended for delivery as part of North East Link’s project scope and have been fully considered in the project risks, costs, benefits, impacts and economic appraisal. Other complementary projects not included in the project scope and recommended for separate funding requests are discussed later in section 6.11.4.
Section 3 - The North East Link 6—15
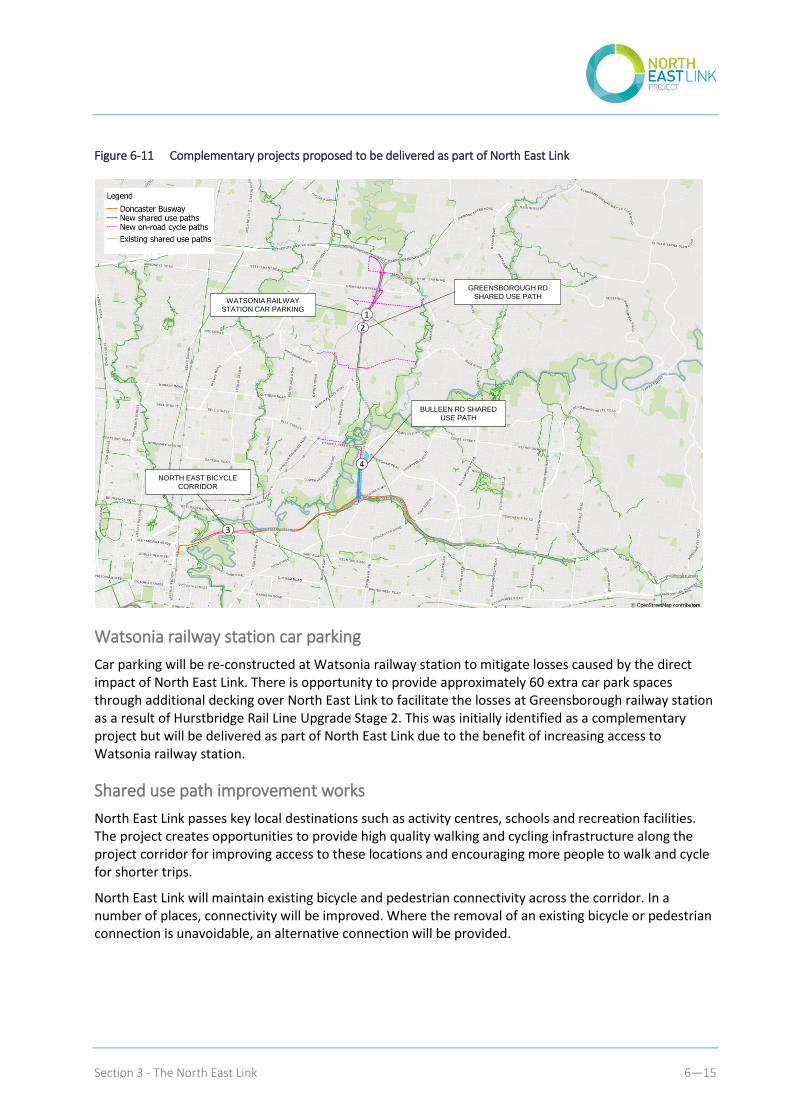
Figure 6-11 Complementary projects proposed to be delivered as part of North East Link
Watsonia railway station car parking
Car parking will be re-constructed at Watsonia railway station to mitigate losses caused by the direct impact of North East Link. There is opportunity to provide approximately 60 extra car park spaces through additional decking over North East Link to facilitate the losses at Greensborough railway station as a result of Hurstbridge Rail Line Upgrade Stage 2. This was initially identified as a complementary project but will be delivered as part of North East Link due to the benefit of increasing access to Watsonia railway station.
Shared use path improvement works
North East Link passes key local destinations such as activity centres, schools and recreation facilities. The project creates opportunities to provide high quality walking and cycling infrastructure along the project corridor for improving access to these locations and encouraging more people to walk and cycle for shorter trips.
North East Link will maintain existing bicycle and pedestrian connectivity across the corridor. In a number of places, connectivity will be improved. Where the removal of an existing bicycle or pedestrian connection is unavoidable, an alternative connection will be provided.
1
WATSONIA RAILWAY
STATION CAR PARKING
3
NORTH EAST BICYCLE
CORRIDOR
2
GREENSBOROUGH RD
SHARED USE PATH
4
BULLEEN RD SHARED
USE PATH
Section 3: The North East Link 6—16
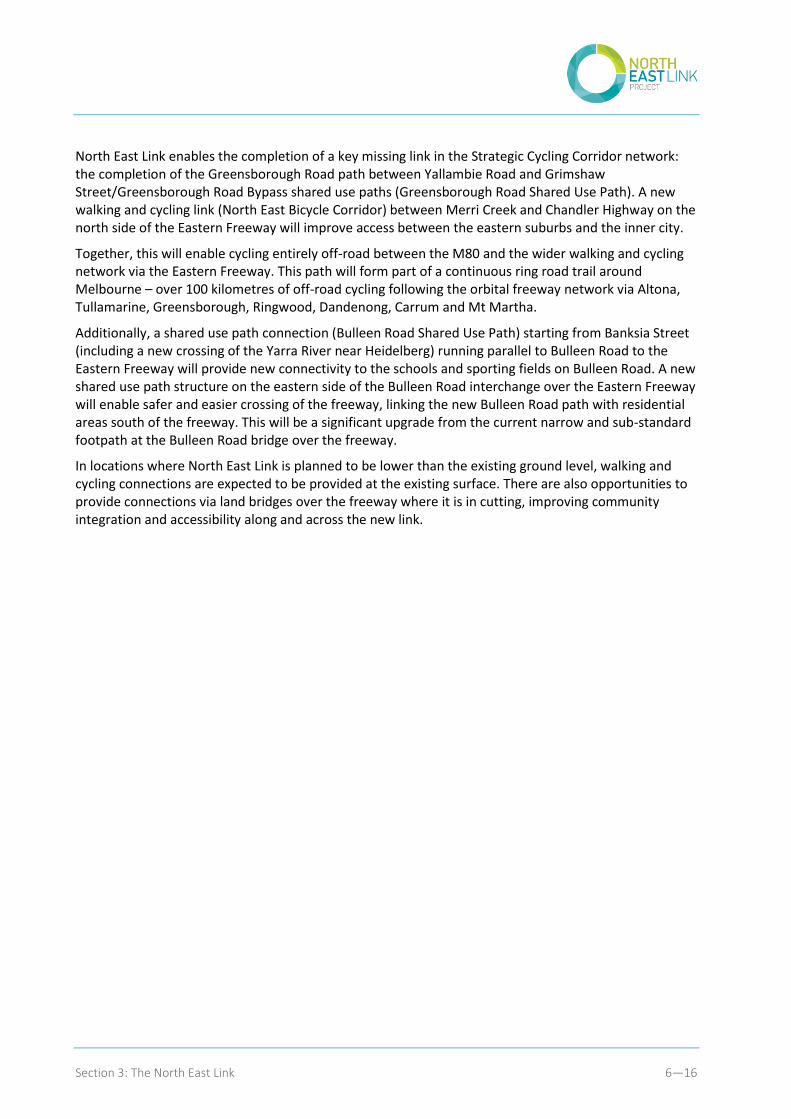
North East Link enables the completion of a key missing link in the Strategic Cycling Corridor network: the completion of the Greensborough Road path between Yallambie Road and Grimshaw Street/Greensborough Road Bypass shared use paths (Greensborough Road Shared Use Path). A new walking and cycling link (North East Bicycle Corridor) between Merri Creek and Chandler Highway on the north side of the Eastern Freeway will improve access between the eastern suburbs and the inner city.
Together, this will enable cycling entirely off-road between the M80 and the wider walking and cycling network via the Eastern Freeway. This path will form part of a continuous ring road trail around Melbourne – over 100 kilometres of off-road cycling following the orbital freeway network via Altona, Tullamarine, Greensborough, Ringwood, Dandenong, Carrum and Mt Martha.
Additionally, a shared use path connection (Bulleen Road Shared Use Path) starting from Banksia Street (including a new crossing of the Yarra River near Heidelberg) running parallel to Bulleen Road to the Eastern Freeway will provide new connectivity to the schools and sporting fields on Bulleen Road. A new shared use path structure on the eastern side of the Bulleen Road interchange over the Eastern Freeway will enable safer and easier crossing of the freeway, linking the new Bulleen Road path with residential areas south of the freeway. This will be a significant upgrade from the current narrow and sub-standard footpath at the Bulleen Road bridge over the freeway.
In locations where North East Link is planned to be lower than the existing ground level, walking and cycling connections are expected to be provided at the existing surface. There are also opportunities to provide connections via land bridges over the freeway where it is in cutting, improving community integration and accessibility along and across the new link.
Section 3 - The North East Link 6—17
Figure 6-12 North East Link walking and cycling infrastructure
Section 3: The North East Link 6—18
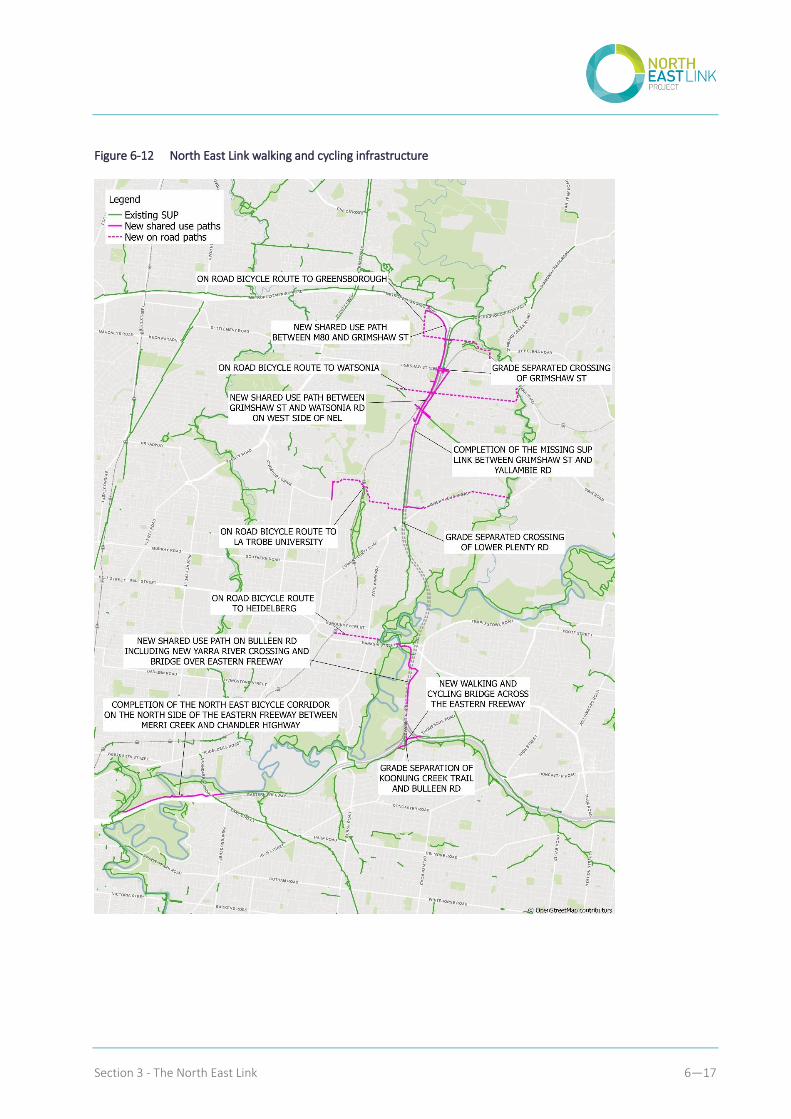
Connectivity across the corridor
North East Link will maintain east-west connectivity for pedestrians across the Greensborough Road corridor. Connectivity will be improved in several places, such as through a new shared use path structure near Elder Street over North East Link and Greensborough Road to improve connectivity from the east to Watsonia Station and the surrounding local network.
The intersection of Drysdale Street and Greensborough Road will be signalised to provide a new crossing point for cyclists and pedestrians across Greensborough Road. Crossing points of the above ground sections of North East Link will be provided at roughly 400 to 500 metre intervals.
As much of North East Link will be at surface level or in cutting between Lower Plenty Road and Grimshaw Street, there are opportunities to provide at-grade walking and cycling connections along this section of the principal roadway.
The east-west walking and cycling crossings of North East Link (and Greensborough Road) are shown in Figure 6-13.
Figure 6-13 Walking and cycling crossings of North East Link
Land bridges
North East Link will run along the road reserve on the eastern side of the existing Greensborough Road in a cutting structure. Land bridges will be constructed over North East Link between Watsonia Road and Yallambie Road to preserve local access and improve urban amenity in the area.
Section 3 - The North East Link 6—19
The Concept Design incorporates several bridges across the cutting section of North East Link including at the existing roads of Watsonia Road, Yallambie Road, Blamey Road and Drysdale Road. The bridges at Watsonia Road and Yallambie Road will be widened beyond the connectivity requirements to become land bridges to enhance access and local amenity. Three additional land bridges with no vehicle access are planned between Yallambie Road and Lenola Street. These land bridges will have a maximum length of 80 metres along the width of the cut and will provide local access to pedestrians crossing North East Link. Landscaping treatments and augmentation of the shared use path network to connect through the land bridges are being explored.
6.8 Tolling
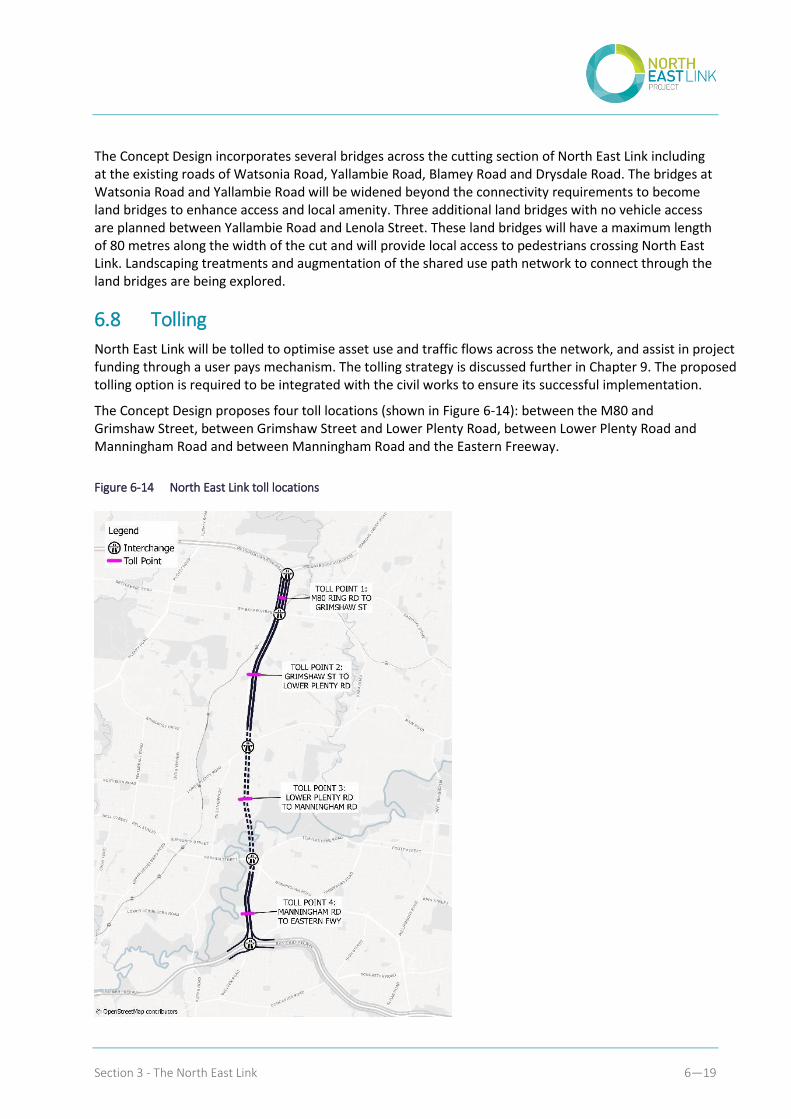
North East Link will be tolled to optimise asset use and traffic flows across the network, and assist in project funding through a user pays mechanism. The tolling strategy is discussed further in Chapter 9. The proposed tolling option is required to be integrated with the civil works to ensure its successful implementation.
The Concept Design proposes four toll locations (shown in Figure 6-14): between the M80 and Grimshaw Street, between Grimshaw Street and Lower Plenty Road, between Lower Plenty Road and Manningham Road and between Manningham Road and the Eastern Freeway.
Figure 6-14 North East Link toll locations
Section 3: The North East Link 6—20
6.9 Design and operating parameters
New roads and structures delivered as part of North East Link will be designed to be consistent with all relevant Austroads and VicRoads design guidelines and applicable Australian and international standards.
The design would also account for anticipated climate hazards, as projected by the Commonwealth Scientific and Industrial Research Organisation (CSIRO) and information provided by Melbourne Water. These hazards and their potential impacts on the project’s structures will be investigated further as part of the planning approvals process.
6.9.1 Vehicle speeds
The operating speed for North East Link will be in accordance with the Austroads Guide to Road Design (AGRD) and relevant VicRoads Supplements and designed to operate at 100km/h wherever possible. However, tunnels and the approach sections to tunnels must operate at no more than 80km/h.
Where existing carriageways are retained on the M80 and Eastern Freeway, these sections will be designed to maintain their current operating speeds. New carriageways will be designed to operate at 100km/h.
6.9.2 Capacity and performance
Road capacity provided by North East Link reflects modelled demand based on the tolling and capacity strategy set out in Appendix M1.
Grades will be reduced to optimise traffic throughput and will be in accordance with VicRoads and Austroads guidelines. This includes grades of no greater than four percent on main carriageways (including tunnelled sections) and ramp grades kept to less than six percent, where possible.
Tunnel standards will be based on the Austroads Guide to Road Tunnels (AGRT) and relevant international standards, as appropriate. This includes designing for clearance heights of up to 4.9 metres, providing automatic over-height vehicle and dangerous goods (placarded loads) vehicle detection systems, and incorporating fire and life safety (F&LS) considerations into the tunnel design that meet current industry best practices.
6.9.3 Safety
The project will be designed using a Safe Systems design approach. This approach will ensure that road safety issues and risks are considered fully, as well as allowing for early identification of broader health and safety risks associated with the project. The project will adopt the Safe Systems Matrix incorporated in the current Austroads Safe Systems Assessment Framework. This will include development of a health and safety risk register to eliminate or reduce potential risks.
6.9.4 Managed Motorway system
A dedicated Managed Motorway system will be implemented for North East Link, including the Eastern Freeway between Hoddle Street and Springvale Road. Intelligent Transport Systems (ITS) will be incorporated into the project as part of a Managed Motorway system that will integrate North East Link with connecting freeways and arterial roads and the broader city-wide freeway network. This will allow traffic and incidents to be managed upstream and downstream across operational boundaries in a coordinated and efficient manner.
The Managed Motorway elements proposed for North East Link will be used in combination to balance the needs of the network and achieve an efficient and safe flow of vehicles. These elements are outlined in Table 6-1.
Section 3 - The North East Link 6—21
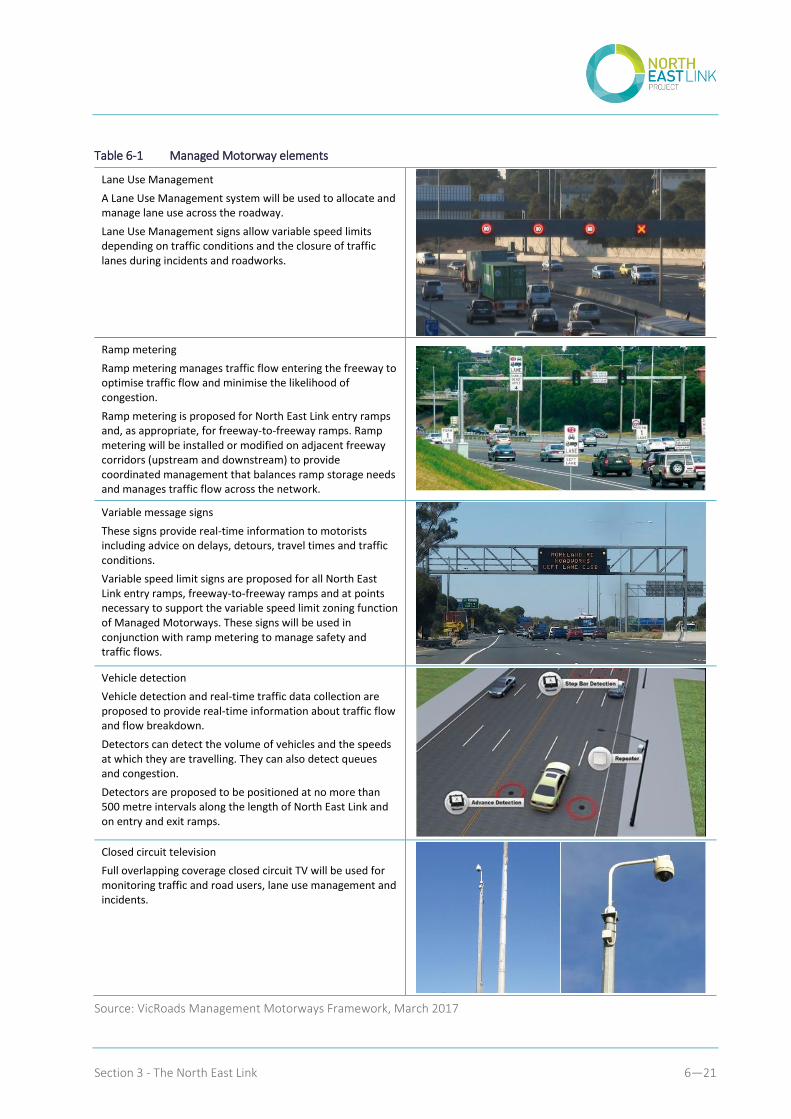
Table 6-1 Managed Motorway elements
Lane Use Management
A Lane Use Management system will be used to allocate and manage lane use across the roadway.
Lane Use Management signs allow variable speed limits depending on traffic conditions and the closure of traffic lanes during incidents and roadworks.
Ramp metering
Ramp metering manages traffic flow entering the freeway to optimise traffic flow and minimise the likelihood of congestion.
Ramp metering is proposed for North East Link entry ramps and, as appropriate, for freeway-to-freeway ramps. Ramp metering will be installed or modified on adjacent freeway corridors (upstream and downstream) to provide coordinated management that balances ramp storage needs and manages traffic flow across the network.
Variable message signs
These signs provide real-time information to motorists including advice on delays, detours, travel times and traffic conditions.
Variable speed limit signs are proposed for all North East Link entry ramps, freeway-to-freeway ramps and at points necessary to support the variable speed limit zoning function of Managed Motorways. These signs will be used in conjunction with ramp metering to manage safety and traffic flows.
Vehicle detection
Vehicle detection and real-time traffic data collection are proposed to provide real-time information about traffic flow and flow breakdown.
Detectors can detect the volume of vehicles and the speeds at which they are travelling. They can also detect queues and congestion.
Detectors are proposed to be positioned at no more than 500 metre intervals along the length of North East Link and on entry and exit ramps.
Closed circuit television
Full overlapping coverage closed circuit TV will be used for monitoring traffic and road users, lane use management and incidents.
Source: VicRoads Management Motorways Framework, March 2017
Section 3: The North East Link 6—22
6.10 Other key project components
6.10.1 Utilities
A number of existing utility services have been identified as being impacted by the Concept Design alignment for North East Link, requiring protection, modification or relocation. All associated works and proposed treatments will be coordinated with the relevant utility asset owner and carried out to appropriate standards and in accordance with the relevant regulations. Upon confirmation of the North East Link alignment, a detailed investigation will be undertaken to determine the exact locations of utility services and provide recommendations for possible solutions.
6.10.2 Noise management
Noise treatment will be in accordance with the current VicRoads Traffic Noise Reduction Policy. Any existing noise barriers will remain unless physically impacted by the project works. Where they are found not to meet the current standards, they will be replaced.
Impacted barriers and any existing timber noise barriers within the limit of works, including along the Eastern Freeway, will be replaced with equal or greater height if required. New noise barriers will be provided where necessary, including on elevated sections. These new barriers will be designed in accordance with the project’s urban design strategy.
6.10.3 Drainage and flood protection
Drainage will be provided in accordance with Austroads and VicRoads Standards and the requirements of the relevant drainage authorities, including Melbourne Water, Yarra Valley Water and local councils. The proposed drainage network will be designed to achieve the performance objectives set out in the CSIRO’s Urban Stormwater Best Practice Environmental Management Guidelines (BPEMG) and adopt principles of water sensitive urban design.
Flood protection will be required for the freeway, particularly for sections in cutting and around the tunnel portals. This will be provided at the north and south portals to the tunnel and, as appropriate, through the cut-and-cover section to mitigate the potential for flooding in the tunnel. Flood protection will be achieved through either the construction of flood walls or bunding.
Existing floodplain storage volumes will be considered in accordance with the requirements of the relevant water authorities and measures will be adopted to reduce flood risk as a result of the project. Performance criteria for floodplain planning and management will be developed specifically for North East Link and will be refined further as the project progresses.
Koonung Creek realignment will be required for some sections of North East Link to allow for widening of the existing road or cutting structures at shallow depths. In some sections, it is likely that lengths of creek will need to be covered or realigned, and creek structures (such as culverts) will need to be widened. The extent of potential impacts will be assessed in detail in the planning approvals stage, and strategies to reduce impacts on creek overall will be developed in consultation with Melbourne Water and the relevant local councils.
6.10.4 Urban design
An Urban Design Strategy will be developed to ensure a high quality and consistent approach to architecture, landscape and urban design for the project. The Urban Design Strategy will seek to:
Deliver a project design that considers local context and characteristics
Section 3 - The North East Link 6—23
Minimise impacts and maximise positive outcomes through enhancements to the urban realm, access, safety and amenity
Align the design with community aspirations and other strategic plans for the area, where appropriate.
As North East Link progresses, the Urban Design Strategy will be used to:
Ensure the project achieves high quality urban design outcomes
Establish the requirements expected in terms of performance outcomes and benchmarks for quality
Support the assessment and planning approvals
Support the procurement evaluation process
Establish an Urban Design Advisory Panel to provide feedback during the interactive bid process.
The Urban Design Strategy will include overarching principles and objectives that will outline what the project should achieve in relation to urban design outcomes. These will be supported by detailed requirements and qualitative benchmarks that will form the performance requirements upon which urban design proposals for North East Link will be developed and evaluated. The Urban Design Strategy will encourage collaborative, multi-disciplinary, integrated design thinking with key stakeholders to deliver maximum project benefits and leave a positive legacy.
6.10.5 Sustainability
Planning and project development work being undertaken for North East Link includes a focus on sustainability across the core sustainability themes of environment, society/community and economy. As the project progresses from the design and procurement phases through to the construction and operation phases, it will be guided by a Sustainability Management Plan. The Infrastructure Sustainability Council of Australia’s (ISCA) Infrastructure Sustainability Rating Tool will be used to measure the implementation of sustainability measures in the development and delivery of the project. The Sustainability Management Plan will set out how NELA will embed sustainability into the design process and management systems associated with various aspects of North East Link. It will define sustainability commitments relevant to the project and NELA’s approach to implementing, managing and measuring these commitments.
6.11 Other complementary projects
The complementary projects that have been recommended for delivery as part of North East Link are discussed in section 6.7. The complementary projects discussed in this section are outside North East Link’s project scope and do not form part of the Concept Design; they are proposed to leverage the opportunities created by North East Link to provide further benefits to the community.
A separate funding request will need to be prepared for these complementary works. Where the complementary project meets DTF’s High Value High Risk (HVHR) criteria, a detailed business case will need to be prepared in accordance with the HVHR guidelines and subject to the Gateway Review Process. Design development, risk analysis, cost refinement, procurement assessment, timing and financial and economic analysis will be undertaken as part of the preparation of funding requests and individual business cases.
The following sections summarise the potential complementary projects that have been identified initially. Further detail on the scope and indicative cost of each complementary project can be found in Appendix I.
Section 3: The North East Link 6—24
6.11.1 Road network improvement opportunities
North East Link provides opportunities to enhance local access by improving key arterial roads that connect communities and employment hubs. Many road network improvement opportunities have been identified to address major constraints in Melbourne’s existing transport network by developing a smarter way to manage the increasing number of trips experienced along these routes. These initiatives are not integral elements of this business case but could be delivered independently or in advance of the project as part of an early works package that would provide considerable benefits in conjunction with the project.
Arterial road network opportunities identified will need to be assessed within the context of broader network impacts and wider transport network planning, which will be the subject of refined modelling to be undertaken during the next phase of development work. Some opportunities will also require further community and stakeholder engagement to finalise scope definition.
E6 Transport Corridor
The E6 Transport Corridor (E6) is part of the broader Outer Metropolitan Ring (OMR), a reservation intended to accommodate a 100-kilometre long high-speed transport link for people and freight in Melbourne’s north and west. The E6 component is planned as a new freeway connection from the Hume Freeway, near Kalkallo to the M80 at Thomastown. The E6 has been reserved through a Public Acquisition Overlay in the planning scheme as part of the OMR.
The proposed E6 has a strong alignment with North East Link’s Project Objectives, particularly around improving access and growth in Melbourne’s north for businesses, households and freight. The delivery of the E6 is expected to provide significant benefits to Melbourne’s rapidly growing population in the outer north through improved accessibility and network operation.
Rosanna Road upgrade
Rosanna Road is an important link between Greensborough Highway and Lower Plenty Road, with more than 45,000 vehicles using the road daily. It provides access to schools, services and shops for the local community and businesses in the north east. North East Link is expected to attract large freight vehicles from Rosanna Road and free the road for local traffic. This allows an opportunity for upgrades on Rosanna Road to enhance local connectivity and improve safety.
North East Link creates opportunities for additional upgrades on Rosanna Road to enhance local connectivity and improve safety. The proposed upgrades include: removal of overhead power poles, relocation of the electrical and communications cabling underground, replacing street lighting on impact absorbing poles and other road safety improvements.
Diamond Creek Road upgrade
Diamond Creek Road plays an important role in providing a direct access to Greensborough Bypass, M80 and North East Link. It provides connections to the Greensborough Activity Centre for residents living in the outer northern suburbs. The outer northern suburbs are experiencing rapid population growth and are becoming more reliant on Greensborough Bypass and Diamond Creek Road to travel in and out of the area. North East Link and Yan Yean Road upgrade currently being delivered by VicRoads creates a specific opportunity to improve traffic movement on Diamond Creek Road and assist with the efficient operation of the freeway system.
Section 3 - The North East Link 6—25
Templestowe Road upgrade
Templestowe Road is a major east-west arterial road, carrying 24,000 vehicles in a two-lane two-way cross-section. Traffic flows during the peak periods are heavily tidal and exceed desirable maximum volumes for this type of road. There are also numerous direct access points onto the road, with many intersections lacking in-turn lanes, and poor conditions for right turns onto Templestowe Road due to the high traffic volumes. It is likely that North East Link will attract greater demands for Templestowe Road, acting as a feeder to the Banksia Street interchange, which will increase the need to upgrade it.
Grimshaw Street upgrade
Grimshaw Street is a key link to the Greensborough Activity Centre (The Circuit). There have been numerous pedestrian and bicycle accidents concentrated at Greensborough Road and Grimshaw Street, and in the vicinity of the schools on Grimshaw Street3). North East Link provides an opportunity to improve safety and operations along Grimshaw Street between Greensborough Highway and Main Street, where heavy traffic flow has been a major constraint to efficient vehicle movement and access.
6.11.2 Other shared use path opportunities
Additional opportunities for walking and cycling projects have been identified that may be delivered in parallel to North East Link as separate projects:
Completion of the East-West Power Easement trail – This trail runs between Plenty Road to the Plenty River Trail via Watsonia. This trail is incomplete in three sections, and has been identified as a high priority project by the Northern Regional Trails Strategy.
Bulleen Road on-road cycling lanes – There is a missing 400-metre section of on-road bicycle lanes between Fortune Avenue and the Koonung Creek Trail south of the Eastern Freeway. This project will create a continuous cycling route along Bulleen Road.
Construction of a new shared use path through Yarra Flats – Walking and cycling connectivity between Ivanhoe, Eaglemont and the Bulleen Road schools and recreational facilities is currently poor. A new crossing of the Yarra River and connection to Bulleen Road from the Main Yarra Trail will improve accessibility to this precinct from the west.
6.11.3 Public transport improvements
Public transport connections in the north east experience delays due to congestion, particularly at bottlenecks at existing crossings of the Yarra River for services between the northern and eastern suburbs. Bus services that run through the area are becoming increasingly inefficient, resulting in increasing travel times for users. Growth in residential areas to the north and expansions of commercial and educational precincts in the east and south east will continue to increase demand for these movements.
Bus service improvement opportunities
North East Link presents opportunities to improve the performance of bus services on the arterial road network throughout the north east. Further planning will be undertaken to identify how and where these improvements can be made.
3 Banyule City Council Road Safety Strategy.
Section 3: The North East Link 6—26
There are opportunities to install bus interchanges/stations at appropriate locations along the Doncaster Busway, upgrade the Doncaster Park & Ride facilities depending on demand, and operate additional bus services on the Doncaster Busway.
The enhanced orbital connectivity provided by North East Link also provides opportunities to build a more efficient and better connected city-wide bus network, including providing opportunities for commercially operated bus services to access Melbourne Airport from eastern and south eastern parts of Melbourne and Victoria. Other opportunities to serve destinations, such as Latrobe National Economic Cluster, could also be considered.
Watsonia railway station access improvements
Greensborough Highway, the main north-south movement corridor in the area, is a barrier to pedestrian access to Watsonia station from the east. There are cross-regional cycling connections from Watsonia to La Trobe University but minimal on-road and off-road cycling facilities to access Watsonia station. North East Link creates an opportunity to upgrade the station car park to multi-level parking and improve pedestrian access to the station.
Greensborough station transport plan
Greensborough railway station is renowned within the community for problems with access within its catchment area. Connectivity from the station to the surrounding arterial road network is poor, and pedestrian and cycle access to the nearby Greensborough Activity Centre is hampered by the steep gradient between the town centre (located at the top of a hill) and the station (located on the side of the hill).
The Level Crossing Removal Authority (LXRA) is investigating upgrade works to Greensborough railway station as part of the Hurstbridge Rail Line Upgrade Stage 2. In addition, NELA and TfV have identified potential opportunities created by North East Link to improve access for pedestrians and cyclists to Greensborough railway station, as well as improving bus priority on Para Road.
6.11.4 Other opportunities
North East Link has the potential to provide other opportunities to maximise benefits for the community in the north east with regards to road safety, cycling and walking facilities, and open space. Additional complementary projects were identified through community submissions and consultation with key stakeholders, including local councils. These opportunities could be delivered alongside North East Link to enhance the overall local amenity surrounding the project corridor.
These complementary projects include road safety improvements, cycling and walking facilities and open space initiatives, and are consistent with initiatives proposed in:
Banyule Integrated Transport Plan 2015-2035 and Northern Regional Trails Strategy 2016.
Manningham’s Integrated Transport Advisory Committee (ITAC) Terms of Reference 2015 and objectives in Manningham’s Council Plan 2017-2021
Boroondara’s Economic Development and Tourism Strategy 2016-2021 and Boroondara Bicycle Users Group
Nillumbik’s Health and Wellbeing Plan 2017-2021 (Draft)
La Trobe NEIC Draft Framework Plan 2017.
Section 3: The North East Link 7—1
7 Transport outcomes As proposed in the Concept Design, North East Link is an 11 km fully Managed Motorway between the M80 in Greensborough and the Eastern Freeway in Bulleen. North East Link is a city shaping investment that will transform Melbourne’s transport network, delivering benefits that extend across the network as far as Gippsland in the south east and interstate to the north via the Hume Freeway.
This chapter describes the transport outcomes expected to be delivered by North East Link, as highlighted in Figure 7-1. Further details about these outcomes, and how they have been determined, are provided in Appendix K.
Figure 7-1 Benefits provided by North East Link
7.1 Completing Melbourne’s orbital freeway network
North East Link will complete the missing link in Melbourne’s orbital freeway network and establish a continuous freeway-standard orbital road around Melbourne, between Frankston in the south and Altona in the west via Ringwood, Greensborough and Tullamarine.
The missing link completes nearly 30 years of investment in the city’s orbital network, allowing the full benefits of these earlier investments to be realised. North East Link will allow the existing orbital network to be better utilised by diverting cross-city and orbital journeys away from the radial freeway network and parts of the arterial road network in the north east. For example, travel from the interchange of EastLink and the Monash Freeway to the M80 and Hume Highway interchange will be eight kilometres shorter via the EastLink/Eastern Freeway/North East Link route than via the Monash Freeway/West Gate Freeway/Tullamarine Freeway and the M80, creating a viable alternative to the M1 corridor and shorter travel times for some road users.
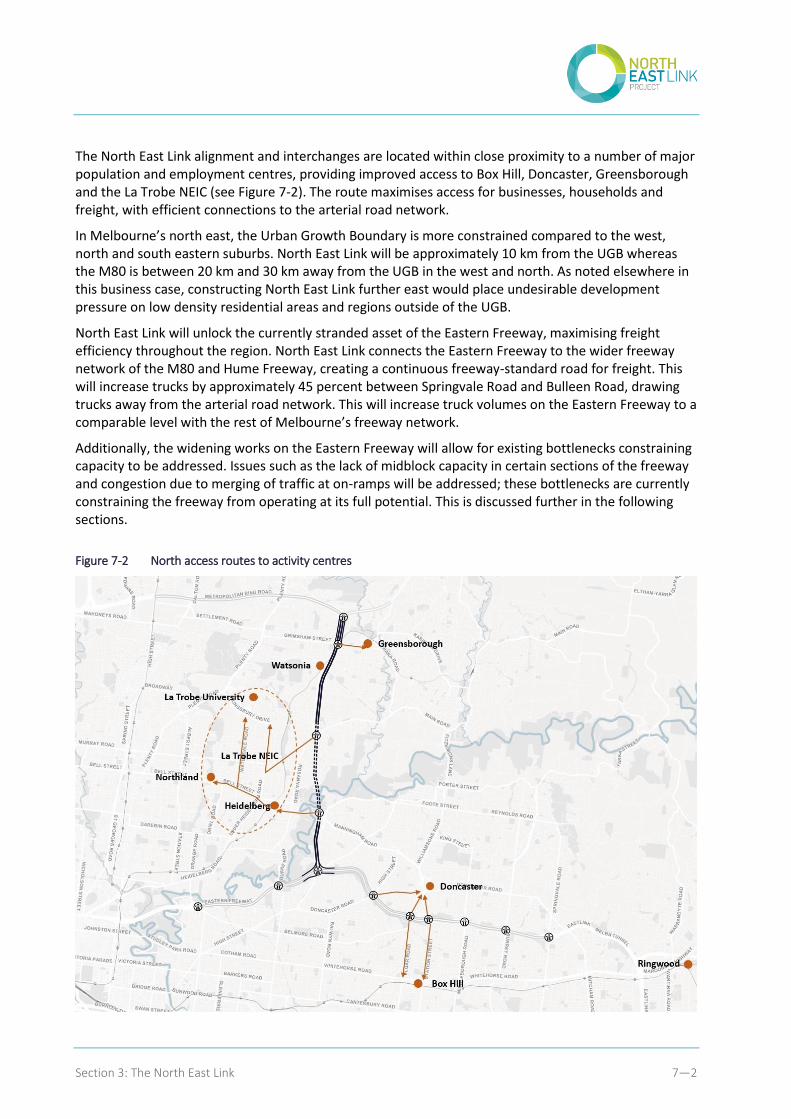
Section 3: The North East Link 7—2
The North East Link alignment and interchanges are located within close proximity to a number of major population and employment centres, providing improved access to Box Hill, Doncaster, Greensborough and the La Trobe NEIC (see Figure 7-2). The route maximises access for businesses, households and freight, with efficient connections to the arterial road network.
In Melbourne’s north east, the Urban Growth Boundary is more constrained compared to the west, north and south eastern suburbs. North East Link will be approximately 10 km from the UGB whereas the M80 is between 20 km and 30 km away from the UGB in the west and north. As noted elsewhere in this business case, constructing North East Link further east would place undesirable development pressure on low density residential areas and regions outside of the UGB.
North East Link will unlock the currently stranded asset of the Eastern Freeway, maximising freight efficiency throughout the region. North East Link connects the Eastern Freeway to the wider freeway network of the M80 and Hume Freeway, creating a continuous freeway-standard road for freight. This will increase trucks by approximately 45 percent between Springvale Road and Bulleen Road, drawing trucks away from the arterial road network. This will increase truck volumes on the Eastern Freeway to a comparable level with the rest of Melbourne’s freeway network.
Additionally, the widening works on the Eastern Freeway will allow for existing bottlenecks constraining capacity to be addressed. Issues such as the lack of midblock capacity in certain sections of the freeway and congestion due to merging of traffic at on-ramps will be addressed; these bottlenecks are currently constraining the freeway from operating at its full potential. This is discussed further in the following sections.
Figure 7-2 North access routes to activity centres
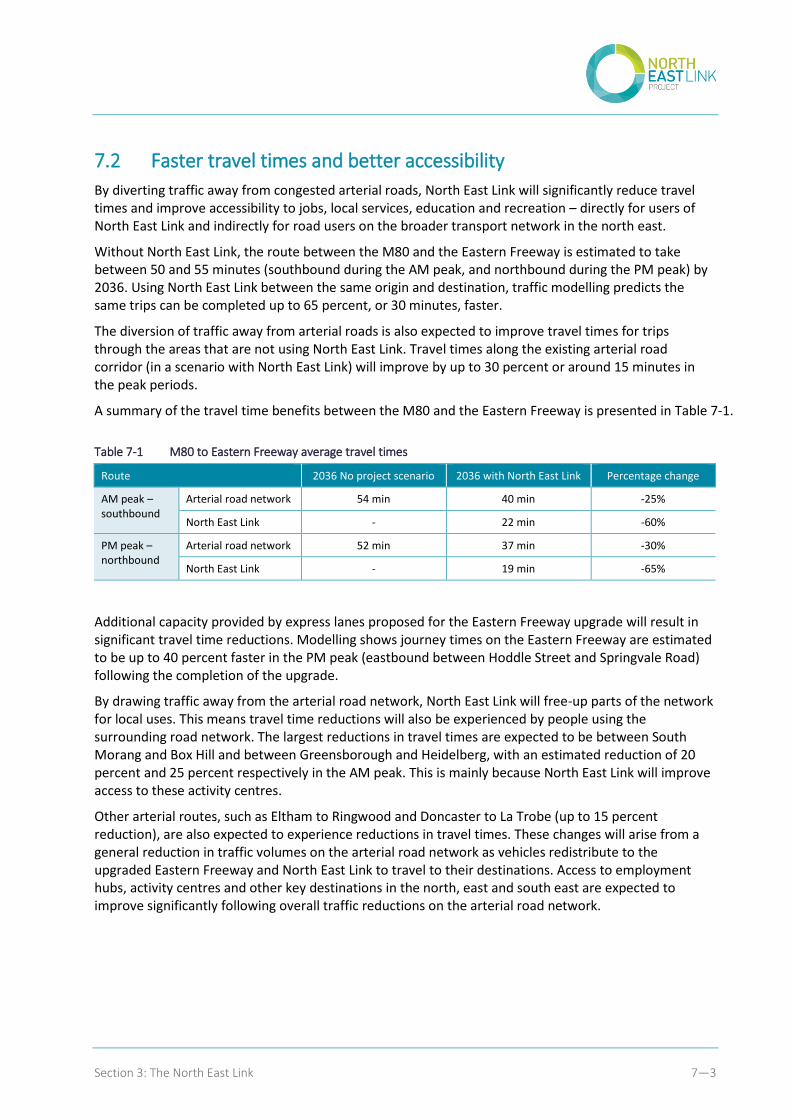
Section 3: The North East Link 7—3
7.2 Faster travel times and better accessibility
By diverting traffic away from congested arterial roads, North East Link will significantly reduce travel times and improve accessibility to jobs, local services, education and recreation – directly for users of North East Link and indirectly for road users on the broader transport network in the north east.
Without North East Link, the route between the M80 and the Eastern Freeway is estimated to take between 50 and 55 minutes (southbound during the AM peak, and northbound during the PM peak) by 2036. Using North East Link between the same origin and destination, traffic modelling predicts the same trips can be completed up to 65 percent, or 30 minutes, faster.
The diversion of traffic away from arterial roads is also expected to improve travel times for trips through the areas that are not using North East Link. Travel times along the existing arterial road corridor (in a scenario with North East Link) will improve by up to 30 percent or around 15 minutes in the peak periods.
A summary of the travel time benefits between the M80 and the Eastern Freeway is presented in Table 7-1.
Table 7-1 M80 to Eastern Freeway average travel times
Route 2036 No project scenario 2036 with North East Link Percentage change
AM peak – southbound
Arterial road network 54 min 40 min -25%
North East Link - 22 min -60%
PM peak – northbound
Arterial road network 52 min 37 min -30%
North East Link - 19 min -65%
Additional capacity provided by express lanes proposed for the Eastern Freeway upgrade will result in significant travel time reductions. Modelling shows journey times on the Eastern Freeway are estimated to be up to 40 percent faster in the PM peak (eastbound between Hoddle Street and Springvale Road) following the completion of the upgrade.
By drawing traffic away from the arterial road network, North East Link will free-up parts of the network for local uses. This means travel time reductions will also be experienced by people using the surrounding road network. The largest reductions in travel times are expected to be between South Morang and Box Hill and between Greensborough and Heidelberg, with an estimated reduction of 20 percent and 25 percent respectively in the AM peak. This is mainly because North East Link will improve access to these activity centres.
Other arterial routes, such as Eltham to Ringwood and Doncaster to La Trobe (up to 15 percent reduction), are also expected to experience reductions in travel times. These changes will arise from a general reduction in traffic volumes on the arterial road network as vehicles redistribute to the upgraded Eastern Freeway and North East Link to travel to their destinations. Access to employment hubs, activity centres and other key destinations in the north, east and south east are expected to improve significantly following overall traffic reductions on the arterial road network.
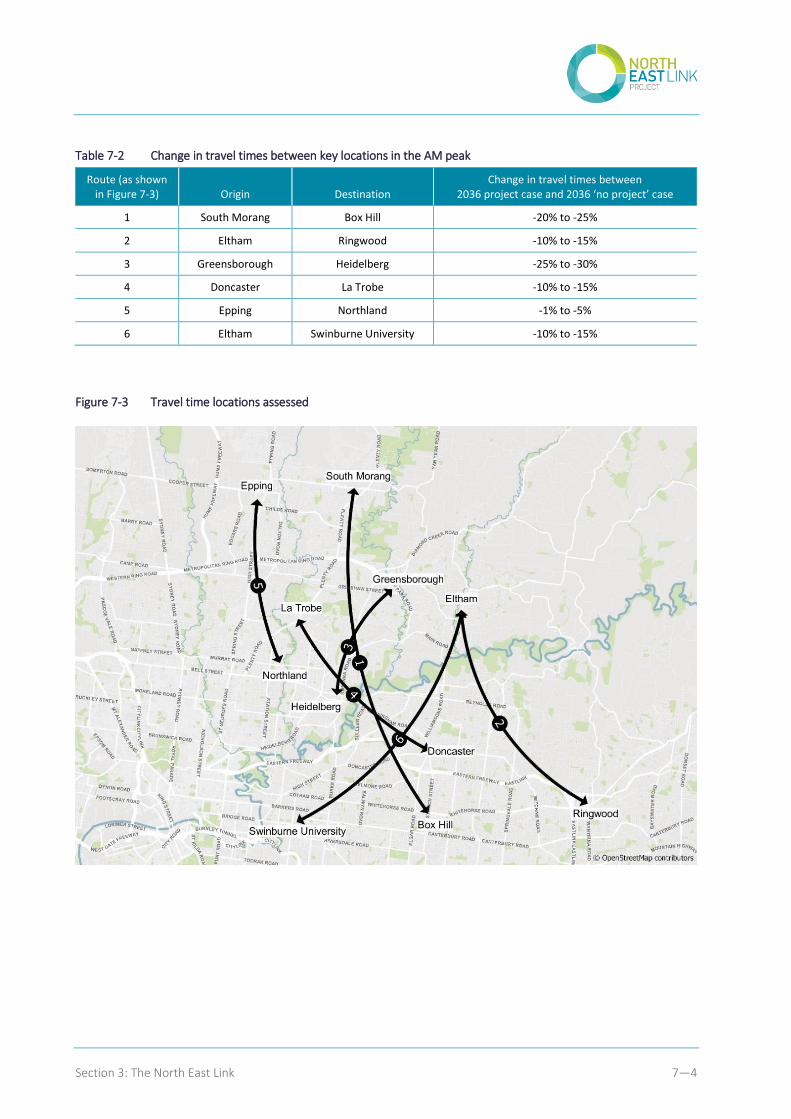
Section 3: The North East Link 7—4
Table 7-2 Change in travel times between key locations in the AM peak
Route (as shown in Figure 7-3) Origin Destination
Change in travel times between 2036 project case and 2036 ‘no project’ case
1 South Morang Box Hill -20% to -25%
2 Eltham Ringwood -10% to -15%
3 Greensborough Heidelberg -25% to -30%
4 Doncaster La Trobe -10% to -15%
5 Epping Northland -1% to -5%
6 Eltham Swinburne University -10% to -15%
Figure 7-3 Travel time locations assessed
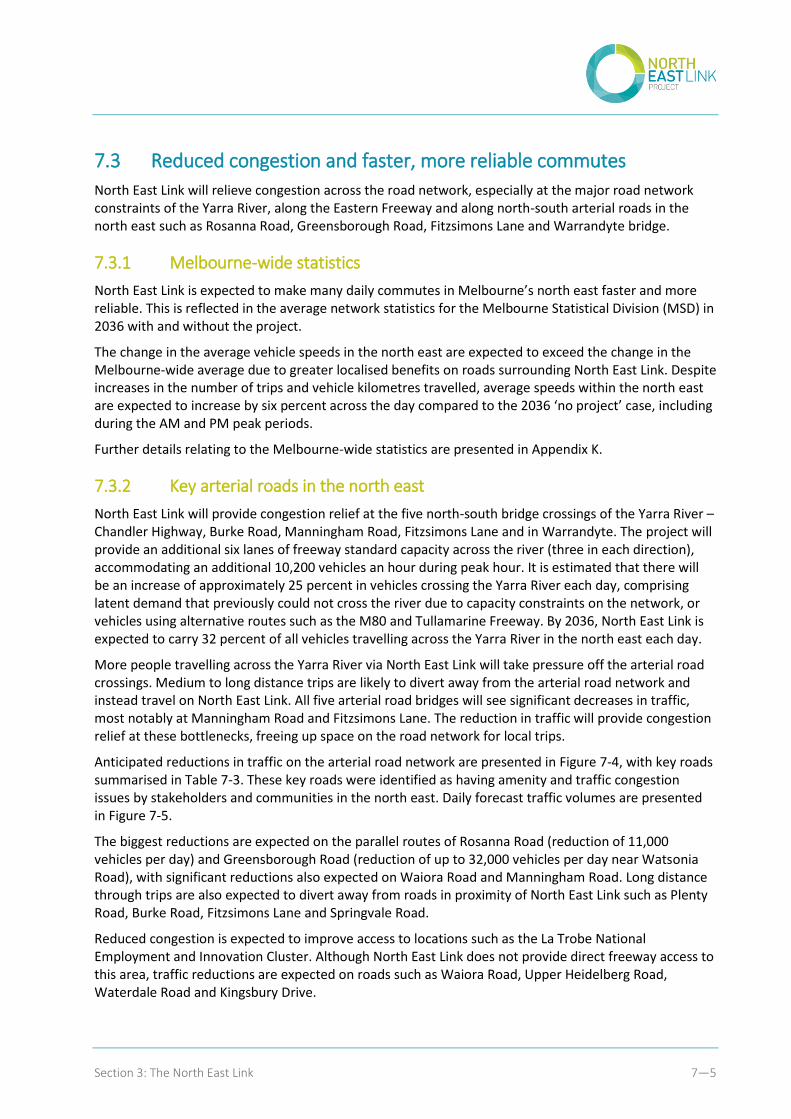
Section 3: The North East Link 7—5
7.3 Reduced congestion and faster, more reliable commutes
North East Link will relieve congestion across the road network, especially at the major road network constraints of the Yarra River, along the Eastern Freeway and along north-south arterial roads in the north east such as Rosanna Road, Greensborough Road, Fitzsimons Lane and Warrandyte bridge.
7.3.1 Melbourne-wide statistics
North East Link is expected to make many daily commutes in Melbourne’s north east faster and more reliable. This is reflected in the average network statistics for the Melbourne Statistical Division (MSD) in 2036 with and without the project.
The change in the average vehicle speeds in the north east are expected to exceed the change in the Melbourne-wide average due to greater localised benefits on roads surrounding North East Link. Despite increases in the number of trips and vehicle kilometres travelled, average speeds within the north east are expected to increase by six percent across the day compared to the 2036 ‘no project’ case, including during the AM and PM peak periods.
Further details relating to the Melbourne-wide statistics are presented in Appendix K.
7.3.2 Key arterial roads in the north east
North East Link will provide congestion relief at the five north-south bridge crossings of the Yarra River – Chandler Highway, Burke Road, Manningham Road, Fitzsimons Lane and in Warrandyte. The project will provide an additional six lanes of freeway standard capacity across the river (three in each direction), accommodating an additional 10,200 vehicles an hour during peak hour. It is estimated that there will be an increase of approximately 25 percent in vehicles crossing the Yarra River each day, comprising latent demand that previously could not cross the river due to capacity constraints on the network, or vehicles using alternative routes such as the M80 and Tullamarine Freeway. By 2036, North East Link is expected to carry 32 percent of all vehicles travelling across the Yarra River in the north east each day.
More people travelling across the Yarra River via North East Link will take pressure off the arterial road crossings. Medium to long distance trips are likely to divert away from the arterial road network and instead travel on North East Link. All five arterial road bridges will see significant decreases in traffic, most notably at Manningham Road and Fitzsimons Lane. The reduction in traffic will provide congestion relief at these bottlenecks, freeing up space on the road network for local trips.
Anticipated reductions in traffic on the arterial road network are presented in Figure 7-4, with key roads summarised in Table 7-3. These key roads were identified as having amenity and traffic congestion issues by stakeholders and communities in the north east. Daily forecast traffic volumes are presented in Figure 7-5.
The biggest reductions are expected on the parallel routes of Rosanna Road (reduction of 11,000 vehicles per day) and Greensborough Road (reduction of up to 32,000 vehicles per day near Watsonia Road), with significant reductions also expected on Waiora Road and Manningham Road. Long distance through trips are also expected to divert away from roads in proximity of North East Link such as Plenty Road, Burke Road, Fitzsimons Lane and Springvale Road.
Reduced congestion is expected to improve access to locations such as the La Trobe National Employment and Innovation Cluster. Although North East Link does not provide direct freeway access to this area, traffic reductions are expected on roads such as Waiora Road, Upper Heidelberg Road, Waterdale Road and Kingsbury Drive.
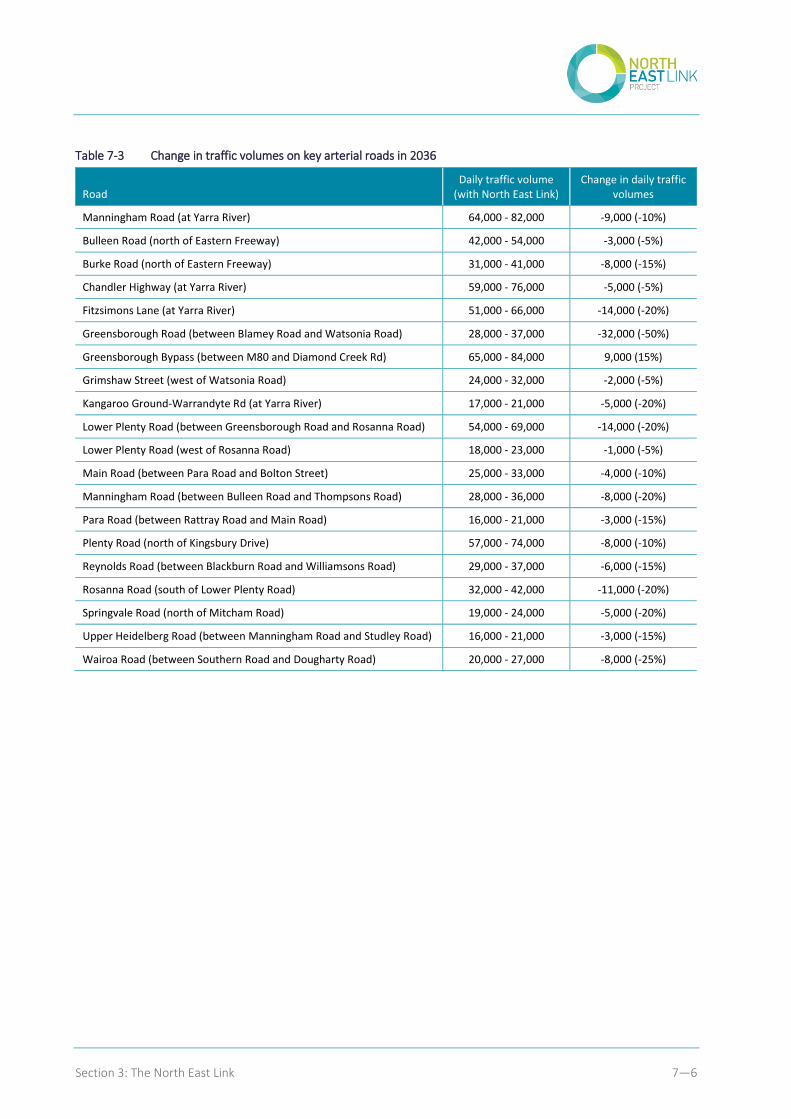
Section 3: The North East Link 7—6
Table 7-3 Change in traffic volumes on key arterial roads in 2036
Road Daily traffic volume
(with North East Link) Change in daily traffic
volumes
Manningham Road (at Yarra River) 64,000 - 82,000 -9,000 (-10%)
Bulleen Road (north of Eastern Freeway) 42,000 - 54,000 -3,000 (-5%)
Burke Road (north of Eastern Freeway) 31,000 - 41,000 -8,000 (-15%)
Chandler Highway (at Yarra River) 59,000 - 76,000 -5,000 (-5%)
Fitzsimons Lane (at Yarra River) 51,000 - 66,000 -14,000 (-20%)
Greensborough Road (between Blamey Road and Watsonia Road) 28,000 - 37,000 -32,000 (-50%)
Greensborough Bypass (between M80 and Diamond Creek Rd) 65,000 - 84,000 9,000 (15%)
Grimshaw Street (west of Watsonia Road) 24,000 - 32,000 -2,000 (-5%)
Kangaroo Ground-Warrandyte Rd (at Yarra River) 17,000 - 21,000 -5,000 (-20%)
Lower Plenty Road (between Greensborough Road and Rosanna Road) 54,000 - 69,000 -14,000 (-20%)
Lower Plenty Road (west of Rosanna Road) 18,000 - 23,000 -1,000 (-5%)
Main Road (between Para Road and Bolton Street) 25,000 - 33,000 -4,000 (-10%)
Manningham Road (between Bulleen Road and Thompsons Road) 28,000 - 36,000 -8,000 (-20%)
Para Road (between Rattray Road and Main Road) 16,000 - 21,000 -3,000 (-15%)
Plenty Road (north of Kingsbury Drive) 57,000 - 74,000 -8,000 (-10%)
Reynolds Road (between Blackburn Road and Williamsons Road) 29,000 - 37,000 -6,000 (-15%)
Rosanna Road (south of Lower Plenty Road) 32,000 - 42,000 -11,000 (-20%)
Springvale Road (north of Mitcham Road) 19,000 - 24,000 -5,000 (-20%)
Upper Heidelberg Road (between Manningham Road and Studley Road) 16,000 - 21,000 -3,000 (-15%)
Wairoa Road (between Southern Road and Dougharty Road) 20,000 - 27,000 -8,000 (-25%)
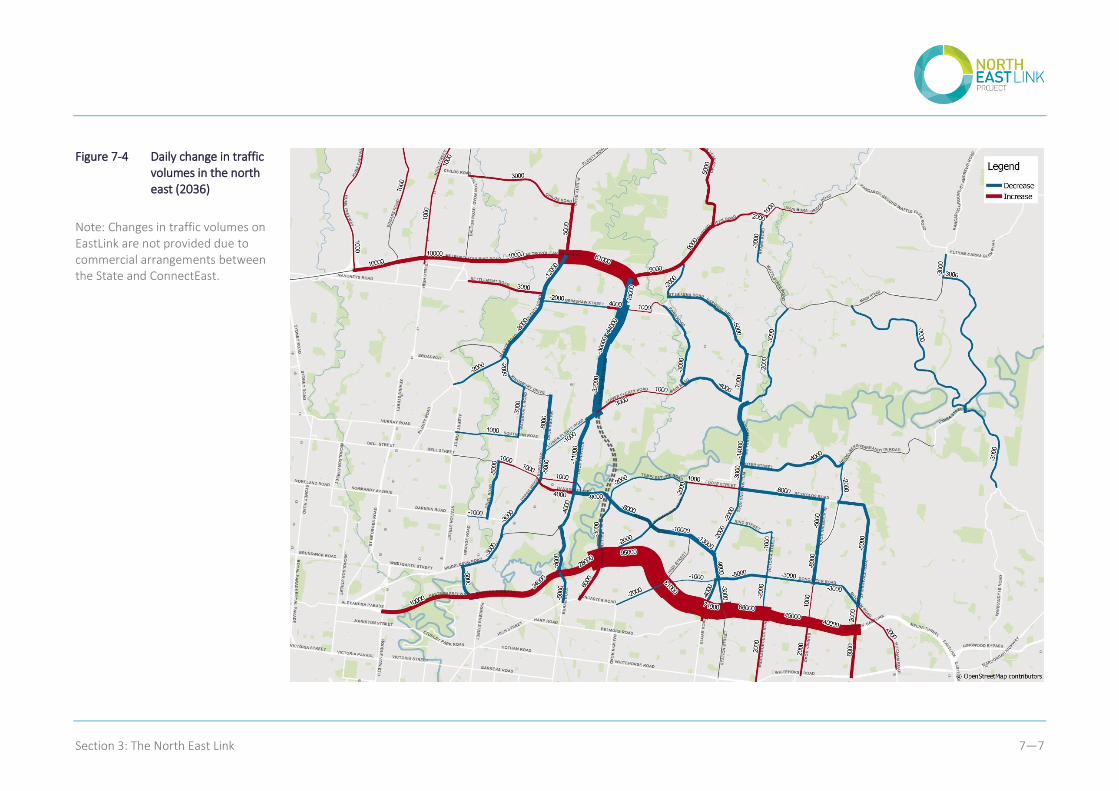
Section 3: The North East Link 7—7
Figure 7-4 Daily change in traffic volumes in the north east (2036)
Note: Changes in traffic volumes on EastLink are not provided due to commercial arrangements between the State and ConnectEast.
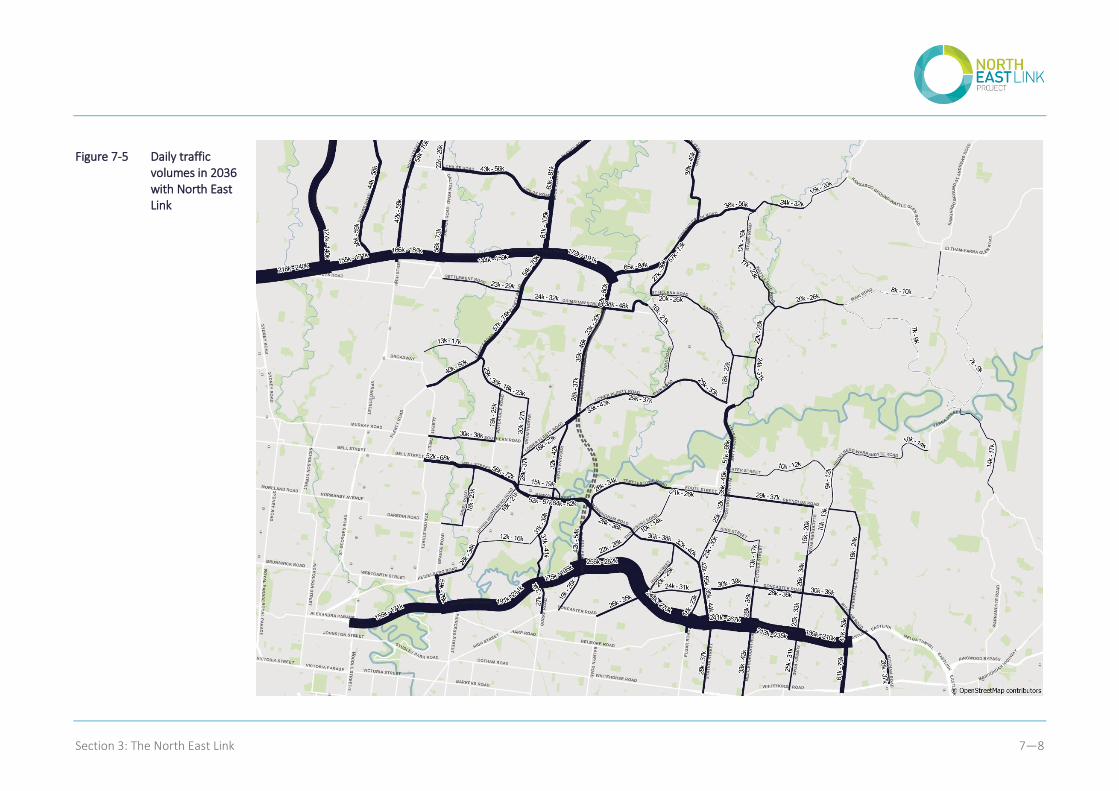
Section 3: The North East Link 7—8
Figure 7-5 Daily traffic volumes in 2036 with North East Link
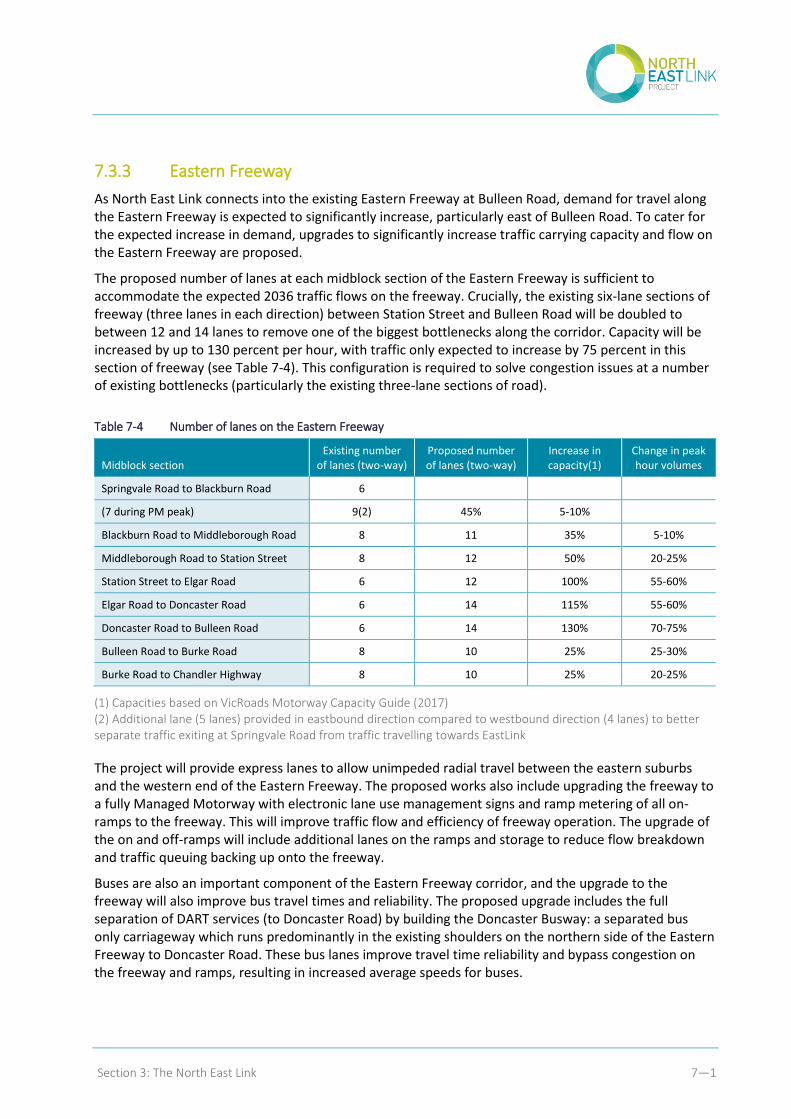
Section 3: The North East Link 7—1
7.3.3 Eastern Freeway
As North East Link connects into the existing Eastern Freeway at Bulleen Road, demand for travel along the Eastern Freeway is expected to significantly increase, particularly east of Bulleen Road. To cater for the expected increase in demand, upgrades to significantly increase traffic carrying capacity and flow on the Eastern Freeway are proposed.
The proposed number of lanes at each midblock section of the Eastern Freeway is sufficient to accommodate the expected 2036 traffic flows on the freeway. Crucially, the existing six-lane sections of freeway (three lanes in each direction) between Station Street and Bulleen Road will be doubled to between 12 and 14 lanes to remove one of the biggest bottlenecks along the corridor. Capacity will be increased by up to 130 percent per hour, with traffic only expected to increase by 75 percent in this section of freeway (see Table 7-4). This configuration is required to solve congestion issues at a number of existing bottlenecks (particularly the existing three-lane sections of road).
Table 7-4 Number of lanes on the Eastern Freeway
Midblock section Existing number
of lanes (two-way) Proposed number of lanes (two-way)
Increase in capacity(1)
Change in peak hour volumes
Springvale Road to Blackburn Road 6
(7 during PM peak) 9(2) 45% 5-10%
Blackburn Road to Middleborough Road 8 11 35% 5-10%
Middleborough Road to Station Street 8 12 50% 20-25%
Station Street to Elgar Road 6 12 100% 55-60%
Elgar Road to Doncaster Road 6 14 115% 55-60%
Doncaster Road to Bulleen Road 6 14 130% 70-75%
Bulleen Road to Burke Road 8 10 25% 25-30%
Burke Road to Chandler Highway 8 10 25% 20-25%
(1) Capacities based on VicRoads Motorway Capacity Guide (2017) (2) Additional lane (5 lanes) provided in eastbound direction compared to westbound direction (4 lanes) to better separate traffic exiting at Springvale Road from traffic travelling towards EastLink
The project will provide express lanes to allow unimpeded radial travel between the eastern suburbs and the western end of the Eastern Freeway. The proposed works also include upgrading the freeway to a fully Managed Motorway with electronic lane use management signs and ramp metering of all on-ramps to the freeway. This will improve traffic flow and efficiency of freeway operation. The upgrade of the on and off-ramps will include additional lanes on the ramps and storage to reduce flow breakdown and traffic queuing backing up onto the freeway.
Buses are also an important component of the Eastern Freeway corridor, and the upgrade to the freeway will also improve bus travel times and reliability. The proposed upgrade includes the full separation of DART services (to Doncaster Road) by building the Doncaster Busway: a separated bus only carriageway which runs predominantly in the existing shoulders on the northern side of the Eastern Freeway to Doncaster Road. These bus lanes improve travel time reliability and bypass congestion on the freeway and ramps, resulting in increased average speeds for buses.
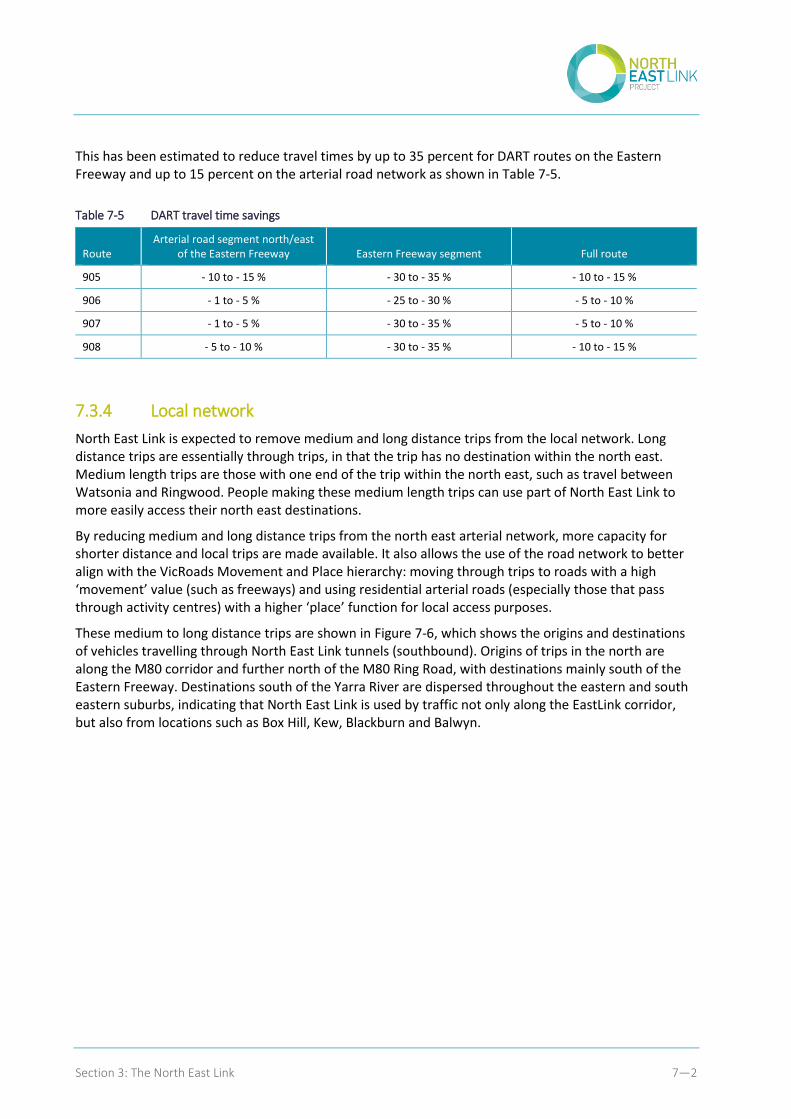
Section 3: The North East Link 7—2
This has been estimated to reduce travel times by up to 35 percent for DART routes on the Eastern Freeway and up to 15 percent on the arterial road network as shown in Table 7-5.
Table 7-5 DART travel time savings
Route Arterial road segment north/east
of the Eastern Freeway Eastern Freeway segment Full route
905 - 10 to - 15 % - 30 to - 35 % - 10 to - 15 %
906 - 1 to - 5 % - 25 to - 30 % - 5 to - 10 %
907 - 1 to - 5 % - 30 to - 35 % - 5 to - 10 %
908 - 5 to - 10 % - 30 to - 35 % - 10 to - 15 %
7.3.4 Local network
North East Link is expected to remove medium and long distance trips from the local network. Long distance trips are essentially through trips, in that the trip has no destination within the north east. Medium length trips are those with one end of the trip within the north east, such as travel between Watsonia and Ringwood. People making these medium length trips can use part of North East Link to more easily access their north east destinations.
By reducing medium and long distance trips from the north east arterial network, more capacity for shorter distance and local trips are made available. It also allows the use of the road network to better align with the VicRoads Movement and Place hierarchy: moving through trips to roads with a high ‘movement’ value (such as freeways) and using residential arterial roads (especially those that pass through activity centres) with a higher ‘place’ function for local access purposes.
These medium to long distance trips are shown in Figure 7-6, which shows the origins and destinations of vehicles travelling through North East Link tunnels (southbound). Origins of trips in the north are along the M80 corridor and further north of the M80 Ring Road, with destinations mainly south of the Eastern Freeway. Destinations south of the Yarra River are dispersed throughout the eastern and south eastern suburbs, indicating that North East Link is used by traffic not only along the EastLink corridor, but also from locations such as Box Hill, Kew, Blackburn and Balwyn.
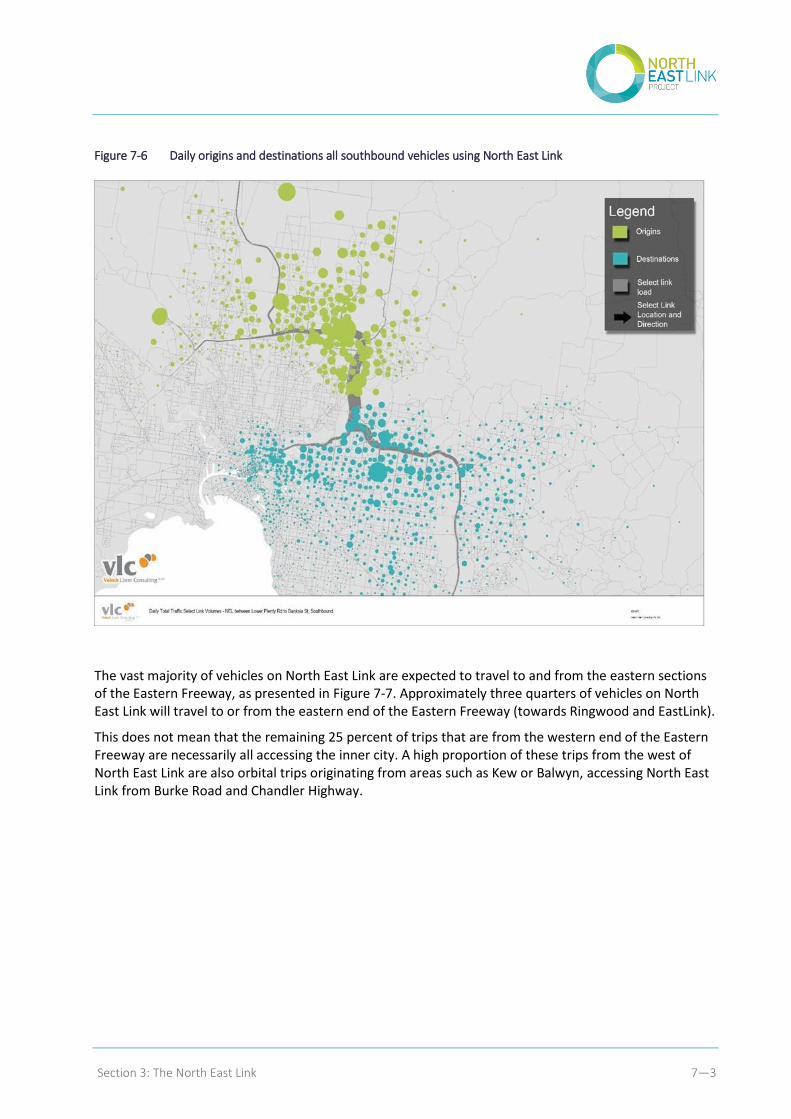
Section 3: The North East Link 7—3
Figure 7-6 Daily origins and destinations all southbound vehicles using North East Link
The vast majority of vehicles on North East Link are expected to travel to and from the eastern sections of the Eastern Freeway, as presented in Figure 7-7. Approximately three quarters of vehicles on North East Link will travel to or from the eastern end of the Eastern Freeway (towards Ringwood and EastLink).
This does not mean that the remaining 25 percent of trips that are from the western end of the Eastern Freeway are necessarily all accessing the inner city. A high proportion of these trips from the west of North East Link are also orbital trips originating from areas such as Kew or Balwyn, accessing North East Link from Burke Road and Chandler Highway.
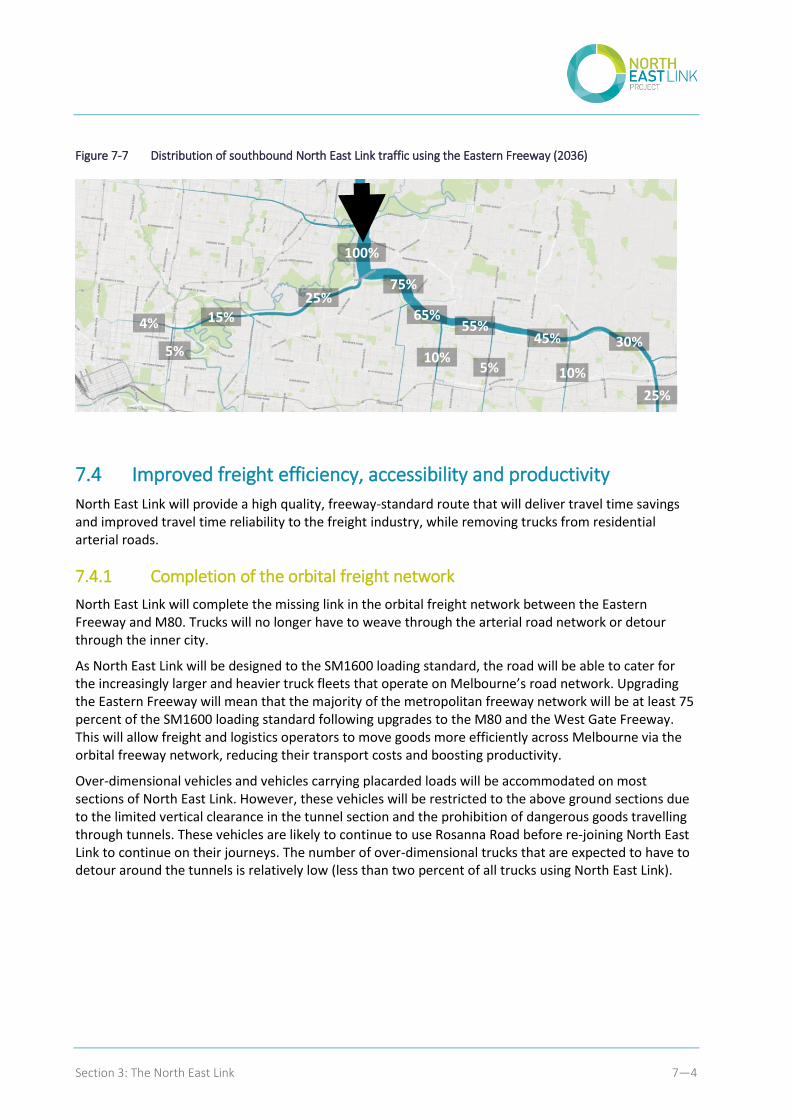
Section 3: The North East Link 7—4
Figure 7-7 Distribution of southbound North East Link traffic using the Eastern Freeway (2036)
7.4 Improved freight efficiency, accessibility and productivity
North East Link will provide a high quality, freeway-standard route that will deliver travel time savings and improved travel time reliability to the freight industry, while removing trucks from residential arterial roads.
7.4.1 Completion of the orbital freight network
North East Link will complete the missing link in the orbital freight network between the Eastern Freeway and M80. Trucks will no longer have to weave through the arterial road network or detour through the inner city.
As North East Link will be designed to the SM1600 loading standard, the road will be able to cater for the increasingly larger and heavier truck fleets that operate on Melbourne’s road network. Upgrading the Eastern Freeway will mean that the majority of the metropolitan freeway network will be at least 75 percent of the SM1600 loading standard following upgrades to the M80 and the West Gate Freeway. This will allow freight and logistics operators to move goods more efficiently across Melbourne via the orbital freeway network, reducing their transport costs and boosting productivity.
Over-dimensional vehicles and vehicles carrying placarded loads will be accommodated on most sections of North East Link. However, these vehicles will be restricted to the above ground sections due to the limited vertical clearance in the tunnel section and the prohibition of dangerous goods travelling through tunnels. These vehicles are likely to continue to use Rosanna Road before re-joining North East Link to continue on their journeys. The number of over-dimensional trucks that are expected to have to detour around the tunnels is relatively low (less than two percent of all trucks using North East Link).
100%
75%
45% 30% 55%
65%
25%
15%
5%
4%
25%
10% 10% 5%
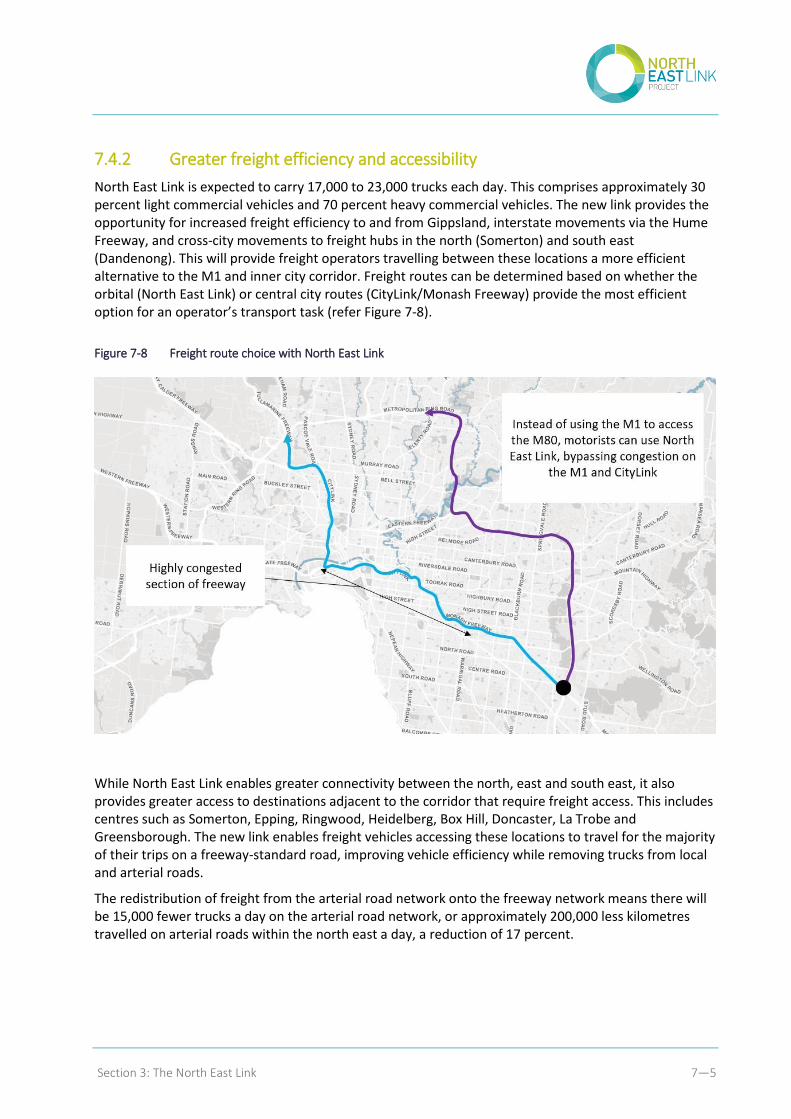
Section 3: The North East Link 7—5
7.4.2 Greater freight efficiency and accessibility
North East Link is expected to carry 17,000 to 23,000 trucks each day. This comprises approximately 30 percent light commercial vehicles and 70 percent heavy commercial vehicles. The new link provides the opportunity for increased freight efficiency to and from Gippsland, interstate movements via the Hume Freeway, and cross-city movements to freight hubs in the north (Somerton) and south east (Dandenong). This will provide freight operators travelling between these locations a more efficient alternative to the M1 and inner city corridor. Freight routes can be determined based on whether the orbital (North East Link) or central city routes (CityLink/Monash Freeway) provide the most efficient option for an operator’s transport task (refer Figure 7-8).
Figure 7-8 Freight route choice with North East Link
While North East Link enables greater connectivity between the north, east and south east, it also provides greater access to destinations adjacent to the corridor that require freight access. This includes centres such as Somerton, Epping, Ringwood, Heidelberg, Box Hill, Doncaster, La Trobe and Greensborough. The new link enables freight vehicles accessing these locations to travel for the majority of their trips on a freeway-standard road, improving vehicle efficiency while removing trucks from local and arterial roads.
The redistribution of freight from the arterial road network onto the freeway network means there will be 15,000 fewer trucks a day on the arterial road network, or approximately 200,000 less kilometres travelled on arterial roads within the north east a day, a reduction of 17 percent.
Section 3: The North East Link 7—6
North East Link will improve travel time reliability, allowing freight movements to bypass up to 18 sets of traffic lights along the regularly used Greensborough Road/Rosanna Road route between the M80 and Eastern Freeway. Travel time reliability improvements provides an opportunity for an improvement in fleet operations and scheduling. This could mean that a distributor requires fewer trucks as there is less loss time waiting in traffic. It will also enable additional trips to be completed within the same timeframes. When these benefits are applied across a fleet of trucks, significant cost savings can be achieved for industries.
7.5 Improved road safety
As discussed earlier, traffic volumes are generally expected to reduce on the arterial road network in the north east as a result of North East Link. For example, the proportion of trucks travelling along Rosanna Road will decrease from nine percent to five percent once North East Link is opened.
This will contribute to reduced safety risk by redirecting some traffic, particularly large trucks, away from local streets and collector roads, making them not only safer but more amenable for walking and cycling. A more steady flow of traffic at a constant speed will similarly help reduce the number of road incidents on the local road network.
VicRoads has undertaken detailed analysis of the Monash Freeway and the changes in crash rates due to the implantation of Managed Motorways. It found that in the five-year period after opening, the crash rate along the freeway decreased by 30 percent.4 This reduction in the crash rate was not observed on other freeways across Melbourne, indicating that it was a result of the introduction of the Managed Motorway.
The upgrading of the Eastern Freeway to a Managed Motorway is predicted to have similar reductions in crash rates, improving the safety of the corridor for all freeway users. Road safety is expected to be further increased through the separation of traffic movements, reducing the likelihood of crashes at merge, diverge and weaving sections of the freeway.
7.6 A more resilient and better managed freeway network
North East Link will give drivers a greater choice of routes to travel from one side of the city to the other, reducing reliance on the M1 corridor and improving resilience across the freeway network. It will also allow Melbourne's freeway network to transition to a fully Managed Motorway, which will allow wholesale optimisation of the network.
7.6.1 Greater network resilience and route choice
Currently, motorists from the south east do not have alternative freeway routes for travelling across the city. The M1 corridor travels through the central city, which then provides access to the north via the Tullamarine Freeway. However, this route has highly variable travel times. The West Gate Bridge has approximately 750 vehicle breakdowns a year – an indication of how often incidents occur along this key corridor.
When North East Link is completed, motorists will be able to use an alternative route to bypass the M1 while remaining on the freeway network to access their destinations. In addition, any avoidance of the M1 corridor – especially during peak hours – will provide relief to the M1 corridor, allowing it to operate more efficiently due to reduced traffic volumes.
4 VicRoads Managed Motorway Framework 2017, Appendix A
Section 3: The North East Link 7—7
Real-time information will be provided to drivers using variable message boards, advising of traffic conditions or incidents on the network ahead. These features enable motorists to make informed choices and select suitable routes to improve their travel times.
The upgrade to the Eastern Freeway includes the separation of the express and collector-distributor carriageways by solid safety barriers, providing additional network redundancy. A disruption caused by a substantial incident on the Eastern Freeway will be predominately contained to the carriageway it occurred in, reducing the overall disruption to the network and allowing the unaffected carriageway to keep flowing. This separation of carriageways will enable traffic flow to be maintained, where previously it may have closed the whole carriageway.
7.6.2 Better managed freeways
Since 2006, VicRoads has been implementing a Managed Motorway system across Melbourne’s freeway network. As outlined in Chapter 6, North East Link’s Concept Design incorporates a dedicated Managed Motorway system that includes ramp metering, a Lane Use Management System, real-time variable message signs and pavement detection studs.5 With the exception of EastLink, the entire inner urban freeway network will be a Managed Motorway once North East Link is completed (along with completion of the West Gate Tunnel Project, M80 Ring Road Upgrade and Monash Freeway Upgrade). This will give Melbourne one of the largest Managed Motorway networks in the world.
Managed Motorways require technologies that enable traffic conditions to be monitored, real-time information and the management of traffic flow. Its infrastructure allows the collection of data and active monitoring of traffic performance, enabling quick and effective responses to incidents or traffic congestion. As noted in Chapter 1, these technologies give road network managers sophisticated tools to manage urban freeway networks holistically, rather than in sections, improving the operation, performance, reliability and efficiency of the entire network.
VicRoads’ assessment of the impact of implementing a Managed Motorway system on the M1 corridor 6 identified a 19 percent increase in vehicle speeds in the AM peak and a 28 percent increase in speeds during the PM peak. There was also a 16 percent increase in freeway capacity, equivalent to approximately 0.7 new lanes of capacity in each direction.
This improvement in freeway capacity and vehicle speeds occurred primarily through the implementation of ramp metering. However, to enable the effective operation of ramp metering, other systems are required to be installed along the corridor to monitor traffic performance.
Managed Motorways also assist in quickly identifying abnormal traffic congestion due to incidents or flow breakdown. This is done through in-pavement detectors/studs that can identify flow breakdown and alert operators. Improved detection rates enable road managers to respond to flow breakdown, reducing the duration of the incident and therefore minimising flow-on impacts to the wider road network.
7.7 Faster, more reliable public transport
As discussed in Chapter 6, North East Link’s Concept Design provides for new dedicated bus lanes along the Eastern Freeway. The Doncaster Busway will include designated bus lanes creating an uninterrupted path for SmartBus services travelling between the eastern suburbs and the central city. Currently, the DART services are affected by mainline congestion on the Eastern Freeway, resulting in longer and more variable commutes for passengers.
5 See section 6.94 of Chapter 6 6 VicRoads, Managed Motorways Framework, March 2017
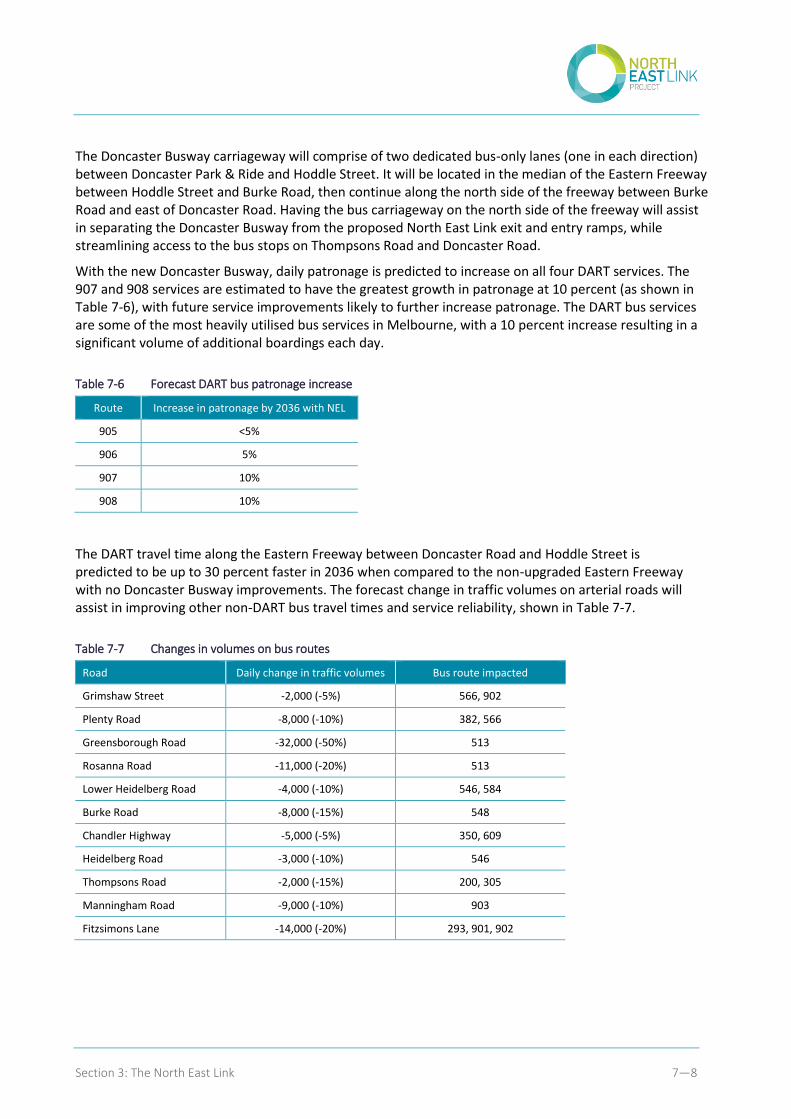
Section 3: The North East Link 7—8
The Doncaster Busway carriageway will comprise of two dedicated bus-only lanes (one in each direction) between Doncaster Park & Ride and Hoddle Street. It will be located in the median of the Eastern Freeway between Hoddle Street and Burke Road, then continue along the north side of the freeway between Burke Road and east of Doncaster Road. Having the bus carriageway on the north side of the freeway will assist in separating the Doncaster Busway from the proposed North East Link exit and entry ramps, while streamlining access to the bus stops on Thompsons Road and Doncaster Road.
With the new Doncaster Busway, daily patronage is predicted to increase on all four DART services. The 907 and 908 services are estimated to have the greatest growth in patronage at 10 percent (as shown in Table 7-6), with future service improvements likely to further increase patronage. The DART bus services are some of the most heavily utilised bus services in Melbourne, with a 10 percent increase resulting in a significant volume of additional boardings each day.
Table 7-6 Forecast DART bus patronage increase
Route Increase in patronage by 2036 with NEL
905 <5%
906 5%
907 10%
908 10%
The DART travel time along the Eastern Freeway between Doncaster Road and Hoddle Street is predicted to be up to 30 percent faster in 2036 when compared to the non-upgraded Eastern Freeway with no Doncaster Busway improvements. The forecast change in traffic volumes on arterial roads will assist in improving other non-DART bus travel times and service reliability, shown in Table 7-7.
Table 7-7 Changes in volumes on bus routes
Road Daily change in traffic volumes Bus route impacted
Grimshaw Street -2,000 (-5%) 566, 902
Plenty Road -8,000 (-10%) 382, 566
Greensborough Road -32,000 (-50%) 513
Rosanna Road -11,000 (-20%) 513
Lower Heidelberg Road -4,000 (-10%) 546, 584
Burke Road -8,000 (-15%) 548
Chandler Highway -5,000 (-5%) 350, 609
Heidelberg Road -3,000 (-10%) 546
Thompsons Road -2,000 (-15%) 200, 305
Manningham Road -9,000 (-10%) 903
Fitzsimons Lane -14,000 (-20%) 293, 901, 902
Section 3: The North East Link 7—9
7.8 High quality active transport connections
Freeways can be perceived to serve as a barrier to movement from either side. However, North East Link is not expected to reduce east-west connectivity for pedestrians across the Greensborough Road corridor and in some places, connectivity will be improved. For example, the proposed new land bridge over North East Link and Greensborough Road near Elder Street will improve connectivity from the east not only into Watsonia Station but also across the rail corridor to improve access from the eastern side of Greensborough Road to the Watsonia shops.
Cycling is more common in areas with well-connected bicycle pathways that allow people to ride from door to door safely and easily.7 Good walking and riding infrastructure can also extend the catchment of public transport services. North East Link presents an opportunity to provide high quality active transport infrastructure along the full length of the corridor by upgrading and extending existing walking and cycling infrastructure to improve accessibility to key local destinations and community places. This is likely to encourage a shift to more walking or riding, particularly for short journeys and help improve the capacity of the local road network.
The new freeway link will enable the completion of a key missing link in the Strategic Cycling Corridor network – the completion of the Greensborough Road path between Yallambie Road and Grimshaw Street. This will create an entirely off-road cycling route between the M80 and the wider walking and cycling network via the Eastern Freeway. This path will form part of a continuous ring road trail around Melbourne: over 100 kilometres of off-road cycling following the orbital freeway network via Altona, Tullamarine, Greensborough, Ringwood, Dandenong and Carrum.
A shared use path connection extending from Manningham Road to the Eastern Freeway will provide new connectivity to the schools and sporting fields on Bulleen Road from the south and the north. A new shared use path structure on the eastern side of the Bulleen Road interchange at the Eastern Freeway will enable safer and easier crossing of the freeway, linking the new Bulleen Road path with the residential areas south of the freeway. This will be a significant upgrade from the current narrow and sub-standard footpath at the freeway.
The upgrade of the Eastern Freeway also provides the opportunity to improve walking and cycling links into the inner city areas. A new shared use path is proposed between Merri Creek and Chandler Highway on the north side of the Eastern Freeway, providing a more direct route to the currently circuitous Main Yarra Trail or Yarra Boulevard. Combined with the shared use path upgrades along Chandler Highway and Grange Road, this new route will also provide an alternative to the Heidelberg Road on-road route.
At the eastern end, the path will connect to the Main Yarra Trail near Chandler Highway, continuing under Chandler Highway parallel to the Eastern Freeway. The path will then cross over the outbound off-ramp on a new bridge structure, before crossing Yarra Boulevard and Yarra Bend Road at grade, including a new bridge structure over the Yarra River. The path connects back to the Main Yarra Trail at the bridge crossing of Merri Creek (near Roseneath Street).
The proposed scope of the walking and cycling improvements proposed as part of North East Link are discussed in Chapter 6.
7 Walking, Riding and Access to Public Transport, Department of Infrastructure and Transport, Australian Government, 2013
Section 3: The North East Link 8—10
8 Project benefits and impacts During development of this business case, detailed assessments of economic, social, environmental and business benefits and impacts were undertaken. These assessments were undertaken considering the North East Link Project Objectives and Guiding Principles, including the criteria and measures developed and used as part of the options assessment process (see Chapter 5 and Appendix K).
8.1 Meeting the Project Objectives
This section summarises the key benefits and impacts that are expected to be provided by North East Link, which have been measured using a range of metrics in order to quantify the economic, social and environmental benefits and impacts of the project. These include impacts on economic, social and environmental resources such as the number of jobs, hours saved and the reduction in accidents and emissions, as well as monetised benefits that places a value on those resources (e.g. travel time benefits, increased gross regional product).
The main tool that has been used to quantify the benefits is cost-benefit analysis (CBA), which aims to identify and quantify, in monetary terms, all the costs and benefits of the project. CBA discounts future benefits and costs into today’s terms reflecting the time value of money. Benefits are accumulated over a 50 year appraisal period reflecting the asset life of key scope elements of North East Link and expressed as a single, discounted dollar value to represent what that future streams of benefits are worth today.
CBA is a well-established and widely accepted methodology which is commonly used by governments to not only assess the economic feasibility of a project or initiative, but also to compare it with others. Benefits have been estimated using best practice techniques outlined in domestic and international guidance, and based on the results of traffic, land use, economic and financial modelling undertaken as part of the development of the business case. Greater detail on the economic evaluation methodology and calculation of project benefits can be found in Appendix K.
In addition to the CBA, a range of tools and metrics have been used to assess the impacts of the project including Computable General Equilibrium (CGE) modelling to estimate the overall economic impact of the project in terms of output and employment, and accessibility metrics to assess the impact of the network improvements for households and businesses.
While not included in the CBA, these additional impacts have been presented to provide additional context and to demonstrate the wide reaching impacts of the project on the objectives.
The North East Link Project will deliver significant and tangible benefits to businesses and households in the north eastern suburbs of Melbourne, as well as the northern growth corridor and the south east of Melbourne. The project will provide efficiencies to the freight sector and drive increased productivity for businesses across the broader Melbourne and Victorian economies. This section describes the benefits assessed for the project alignment identified in the North East Link Concept Design (described in Chapter 6).
In addition to providing significant household value, and a boost to business productivity and economic growth, North East Link is estimated to have a major impact on employment opportunities across the Victorian economy.
Section 3: The North East Link 8—11
At the most basic level, the travel time savings that are a key feature of the project will mean that people in the north-east and other areas that benefits from lower congestion will have access to more job opportunities within suitable commuting timeframes than they would without the project. While that doesn’t immediately translate into more jobs, it represents an improvement in the economic potential of those residential areas and the opportunities available to people living there.
The economic modelling completed for the business case demonstrates the additional employment to be supported by North East Link during the construction and operating phases of the project. This reflects the contribution North East Link is expected to provide to the Victorian economy through up-front capital investment and ongoing productivity gains. The table below demonstrates how North East Link is estimated to support an additional 10,300 jobs during construction and 3,400 jobs each year during operations.
Analysis of land use modelling also presented in this chapter highlights the potential for the project to further influence where businesses and households choose to locate over the longer term in order to take advantage of the improved accessibility that is to be provided in key areas across the project catchment. This redistribution of forecast employment at the metro-wide level reinforces how the project could shape the economic structure of Melbourne, shifting its centre of gravity closer to the north-east and changing the way the transport system is used.
While both the measure of additional employment from the economic modelling and the measure of employment shifted to the north-east provide indications of the likely employment impacts of the project, they do so through different lens and therefore are not directly comparable or additive. Instead should be considered as complementary indicators of the overall benefits of North East Link.
Figure 8-1 provides a summary of the key benefits and impacts of the project, and highlights their alignment with the project objectives.
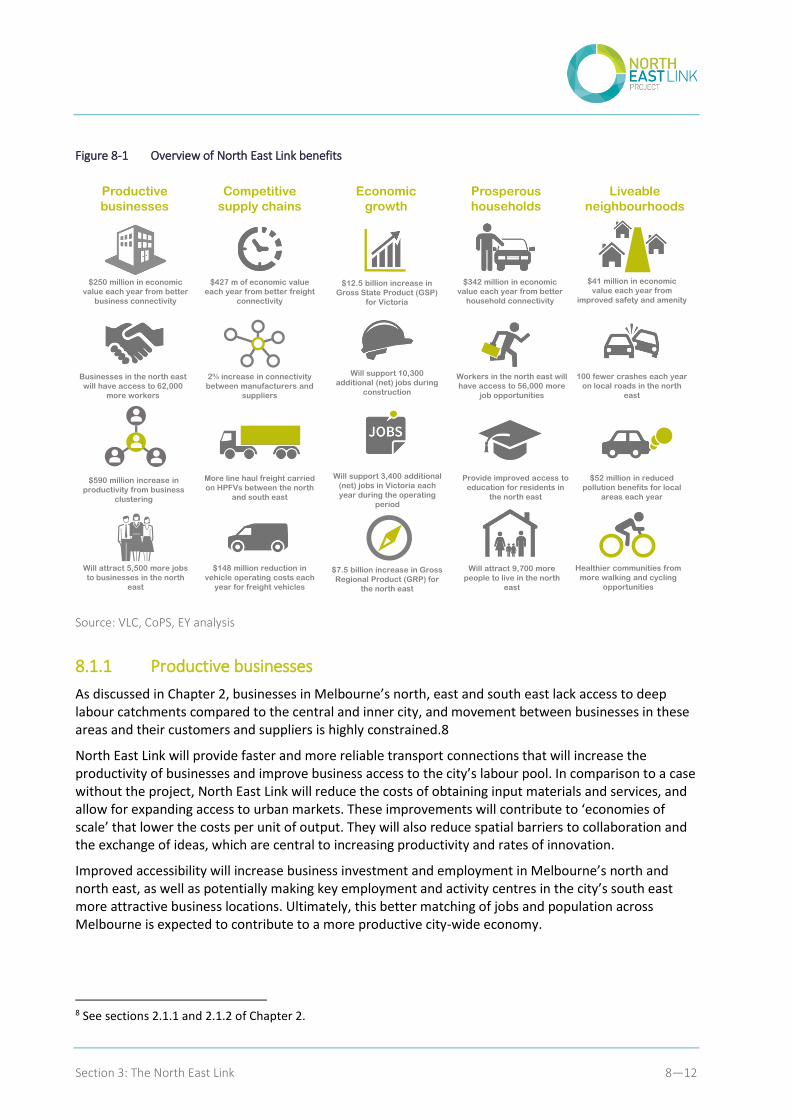
Section 3: The North East Link 8—12
Figure 8-1 Overview of North East Link benefits
Source: VLC, CoPS, EY analysis
8.1.1 Productive businesses
As discussed in Chapter 2, businesses in Melbourne’s north, east and south east lack access to deep labour catchments compared to the central and inner city, and movement between businesses in these areas and their customers and suppliers is highly constrained.8
North East Link will provide faster and more reliable transport connections that will increase the productivity of businesses and improve business access to the city’s labour pool. In comparison to a case without the project, North East Link will reduce the costs of obtaining input materials and services, and allow for expanding access to urban markets. These improvements will contribute to ‘economies of scale’ that lower the costs per unit of output. They will also reduce spatial barriers to collaboration and the exchange of ideas, which are central to increasing productivity and rates of innovation.
Improved accessibility will increase business investment and employment in Melbourne’s north and north east, as well as potentially making key employment and activity centres in the city’s south east more attractive business locations. Ultimately, this better matching of jobs and population across Melbourne is expected to contribute to a more productive city-wide economy.
8 See sections 2.1.1 and 2.1.2 of Chapter 2.
Productive
businesses
$250 million in economic
value each year from better
business connectivity
Businesses in the north east
will have access to 62,000
more workers
$590 million increase in
productivity from business
clustering
Competitive
supply chains
Economic
growth
Prosperous
households
Liveable
neighbourhoods
Will attract 5,500 more jobs
to businesses in the north
east
$12.5 billion increase in
Gross State Product (GSP)
for Victoria
$427 m of economic value
each year from better freight
connectivity
2% increase in connectivity
between manufacturers and
suppliers
More line haul freight carried
on HPFVs between the north
and south east
$148 million reduction in
vehicle operating costs each
year for freight vehicles
Will support 10,300
additional (net) jobs during
construction
Will support 3,400 additional
(net) jobs in Victoria each
year during the operating
period
$342 million in economic
value each year from better
household connectivity
Workers in the north east will
have access to 56,000 more
job opportunities
Provide improved access to
education for residents in
the north east
Will attract 9,700 more
people to live in the north
east
$41 million in economic
value each year from
improved safety and amenity
100 fewer crashes each year
on local roads in the north
east
$52 million in reduced
pollution benefits for local
areas each year
Healthier communities from
more walking and cycling
opportunities
$7.5 billion increase in Gross
Regional Product (GRP) for
the north east
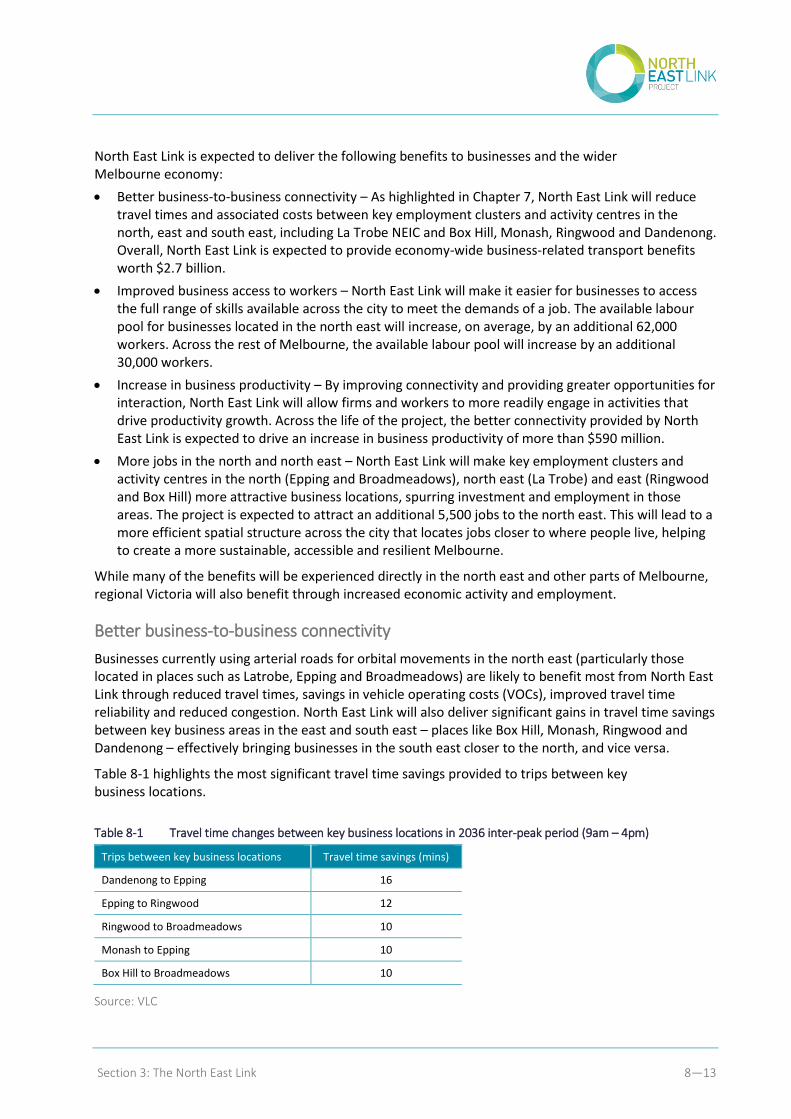
Section 3: The North East Link 8—13
North East Link is expected to deliver the following benefits to businesses and the wider Melbourne economy:
Better business-to-business connectivity – As highlighted in Chapter 7, North East Link will reduce travel times and associated costs between key employment clusters and activity centres in the north, east and south east, including La Trobe NEIC and Box Hill, Monash, Ringwood and Dandenong. Overall, North East Link is expected to provide economy-wide business-related transport benefits worth $2.7 billion.
Improved business access to workers – North East Link will make it easier for businesses to access the full range of skills available across the city to meet the demands of a job. The available labour pool for businesses located in the north east will increase, on average, by an additional 62,000 workers. Across the rest of Melbourne, the available labour pool will increase by an additional 30,000 workers.
Increase in business productivity – By improving connectivity and providing greater opportunities for interaction, North East Link will allow firms and workers to more readily engage in activities that drive productivity growth. Across the life of the project, the better connectivity provided by North East Link is expected to drive an increase in business productivity of more than $590 million.
More jobs in the north and north east – North East Link will make key employment clusters and activity centres in the north (Epping and Broadmeadows), north east (La Trobe) and east (Ringwood and Box Hill) more attractive business locations, spurring investment and employment in those areas. The project is expected to attract an additional 5,500 jobs to the north east. This will lead to a more efficient spatial structure across the city that locates jobs closer to where people live, helping to create a more sustainable, accessible and resilient Melbourne.
While many of the benefits will be experienced directly in the north east and other parts of Melbourne, regional Victoria will also benefit through increased economic activity and employment.
Better business-to-business connectivity
Businesses currently using arterial roads for orbital movements in the north east (particularly those located in places such as Latrobe, Epping and Broadmeadows) are likely to benefit most from North East Link through reduced travel times, savings in vehicle operating costs (VOCs), improved travel time reliability and reduced congestion. North East Link will also deliver significant gains in travel time savings between key business areas in the east and south east – places like Box Hill, Monash, Ringwood and Dandenong – effectively bringing businesses in the south east closer to the north, and vice versa.
Table 8-1 highlights the most significant travel time savings provided to trips between key business locations.
Table 8-1 Travel time changes between key business locations in 2036 inter-peak period (9am – 4pm)
Trips between key business locations Travel time savings (mins)
Dandenong to Epping 16
Epping to Ringwood 12
Ringwood to Broadmeadows 10
Monash to Epping 10
Box Hill to Broadmeadows 10
Source: VLC
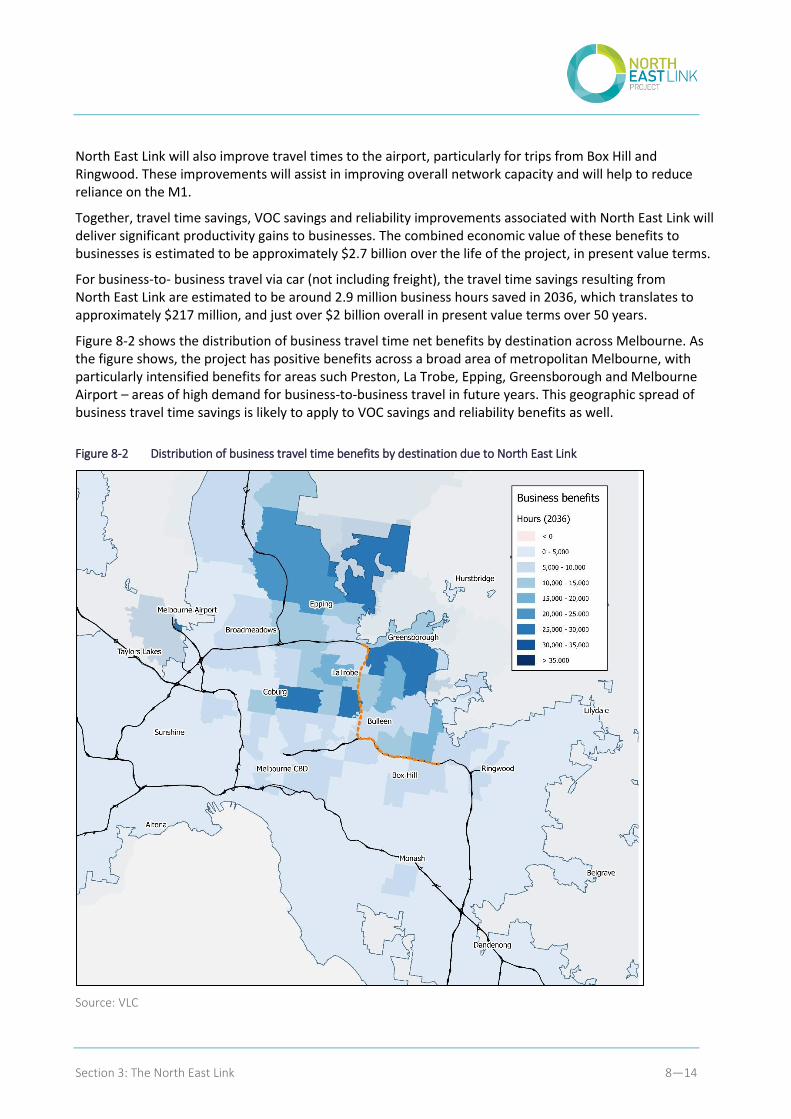
Section 3: The North East Link 8—14
North East Link will also improve travel times to the airport, particularly for trips from Box Hill and Ringwood. These improvements will assist in improving overall network capacity and will help to reduce reliance on the M1.
Together, travel time savings, VOC savings and reliability improvements associated with North East Link will deliver significant productivity gains to businesses. The combined economic value of these benefits to businesses is estimated to be approximately $2.7 billion over the life of the project, in present value terms.
For business-to- business travel via car (not including freight), the travel time savings resulting from North East Link are estimated to be around 2.9 million business hours saved in 2036, which translates to approximately $217 million, and just over $2 billion overall in present value terms over 50 years.
Figure 8-2 shows the distribution of business travel time net benefits by destination across Melbourne. As the figure shows, the project has positive benefits across a broad area of metropolitan Melbourne, with particularly intensified benefits for areas such Preston, La Trobe, Epping, Greensborough and Melbourne Airport – areas of high demand for business-to-business travel in future years. This geographic spread of business travel time savings is likely to apply to VOC savings and reliability benefits as well.
Figure 8-2 Distribution of business travel time benefits by destination due to North East Link
Source: VLC
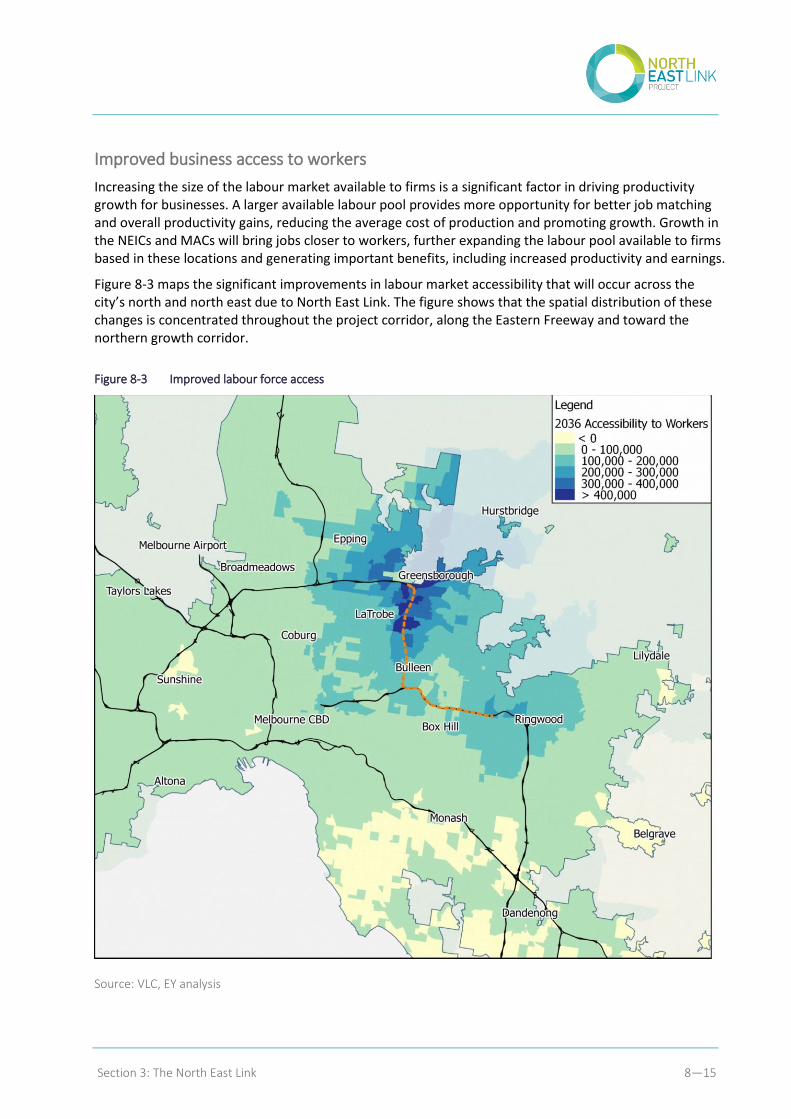
Section 3: The North East Link 8—15
Improved business access to workers
Increasing the size of the labour market available to firms is a significant factor in driving productivity growth for businesses. A larger available labour pool provides more opportunity for better job matching and overall productivity gains, reducing the average cost of production and promoting growth. Growth in the NEICs and MACs will bring jobs closer to workers, further expanding the labour pool available to firms based in these locations and generating important benefits, including increased productivity and earnings.
Figure 8-3 maps the significant improvements in labour market accessibility that will occur across the city’s north and north east due to North East Link. The figure shows that the spatial distribution of these changes is concentrated throughout the project corridor, along the Eastern Freeway and toward the northern growth corridor.
Figure 8-3 Improved labour force access
Source: VLC, EY analysis
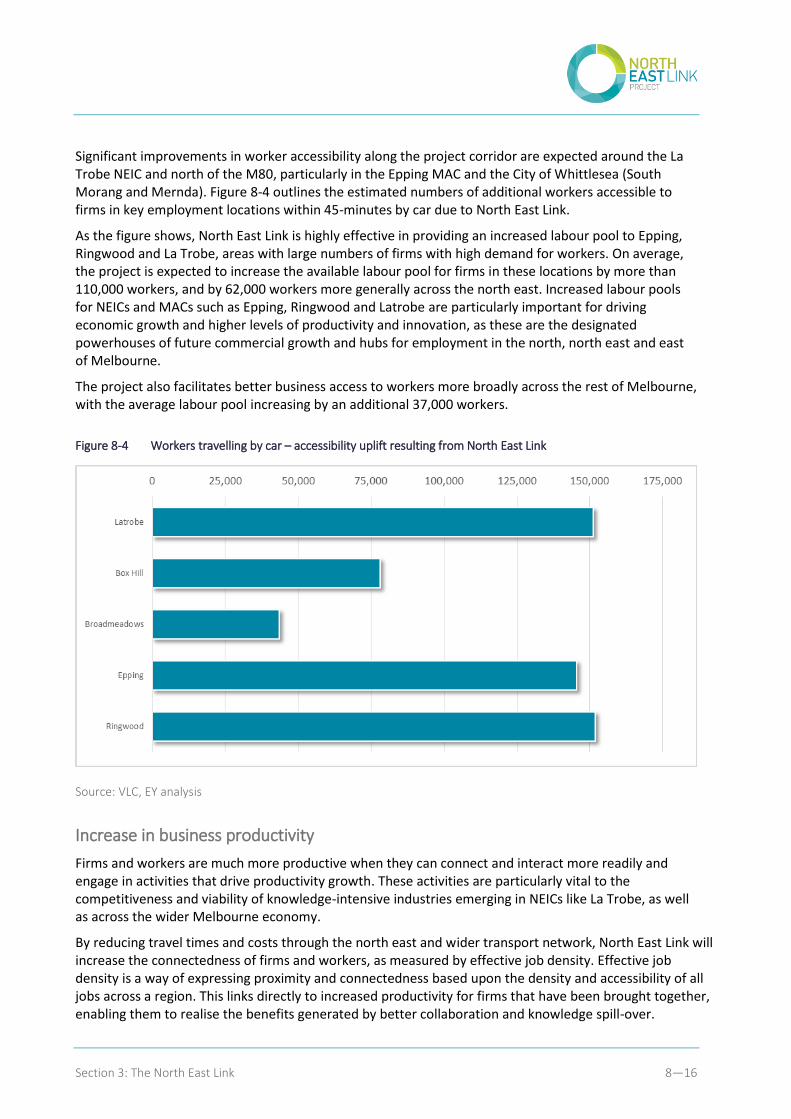
Section 3: The North East Link 8—16
Significant improvements in worker accessibility along the project corridor are expected around the La Trobe NEIC and north of the M80, particularly in the Epping MAC and the City of Whittlesea (South Morang and Mernda). Figure 8-4 outlines the estimated numbers of additional workers accessible to firms in key employment locations within 45-minutes by car due to North East Link.
As the figure shows, North East Link is highly effective in providing an increased labour pool to Epping, Ringwood and La Trobe, areas with large numbers of firms with high demand for workers. On average, the project is expected to increase the available labour pool for firms in these locations by more than 110,000 workers, and by 62,000 workers more generally across the north east. Increased labour pools for NEICs and MACs such as Epping, Ringwood and Latrobe are particularly important for driving economic growth and higher levels of productivity and innovation, as these are the designated powerhouses of future commercial growth and hubs for employment in the north, north east and east of Melbourne.
The project also facilitates better business access to workers more broadly across the rest of Melbourne, with the average labour pool increasing by an additional 37,000 workers.
Figure 8-4 Workers travelling by car – accessibility uplift resulting from North East Link
Source: VLC, EY analysis
Increase in business productivity
Firms and workers are much more productive when they can connect and interact more readily and engage in activities that drive productivity growth. These activities are particularly vital to the competitiveness and viability of knowledge-intensive industries emerging in NEICs like La Trobe, as well as across the wider Melbourne economy.
By reducing travel times and costs through the north east and wider transport network, North East Link will increase the connectedness of firms and workers, as measured by effective job density. Effective job density is a way of expressing proximity and connectedness based upon the density and accessibility of all jobs across a region. This links directly to increased productivity for firms that have been brought together, enabling them to realise the benefits generated by better collaboration and knowledge spill-over.
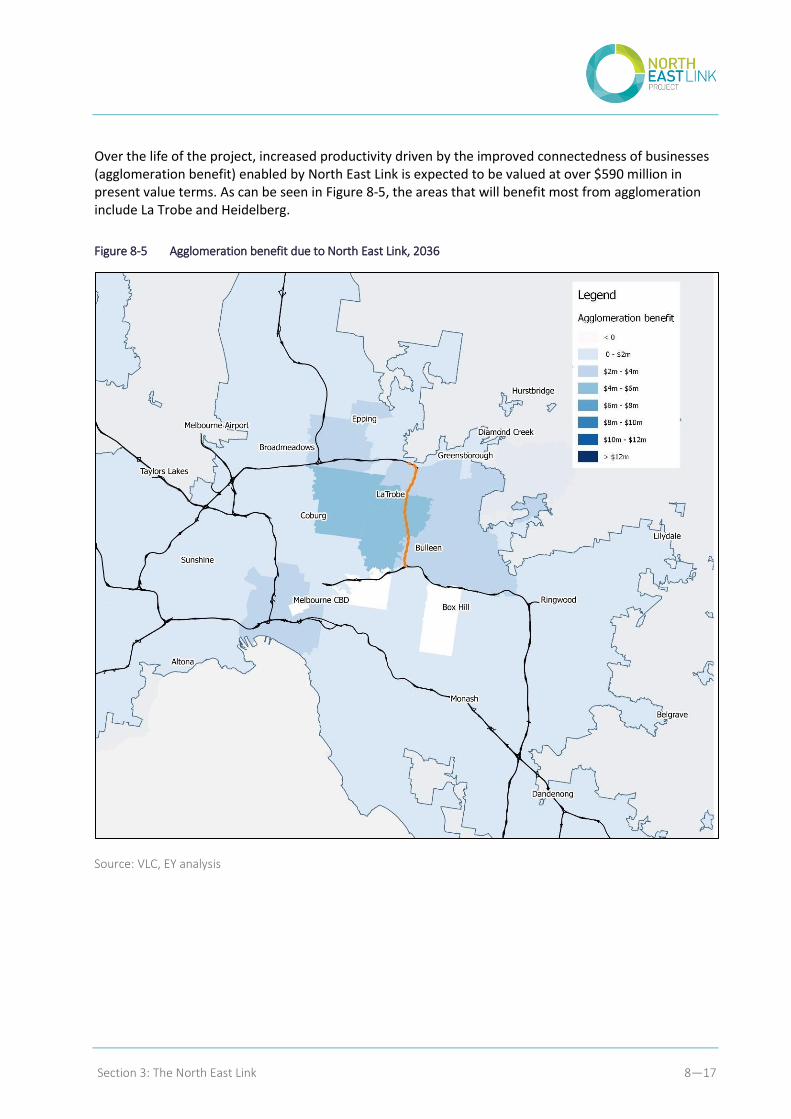
Section 3: The North East Link 8—17
Over the life of the project, increased productivity driven by the improved connectedness of businesses (agglomeration benefit) enabled by North East Link is expected to be valued at over $590 million in present value terms. As can be seen in Figure 8-5, the areas that will benefit most from agglomeration include La Trobe and Heidelberg.
Figure 8-5 Agglomeration benefit due to North East Link, 2036
Source: VLC, EY analysis
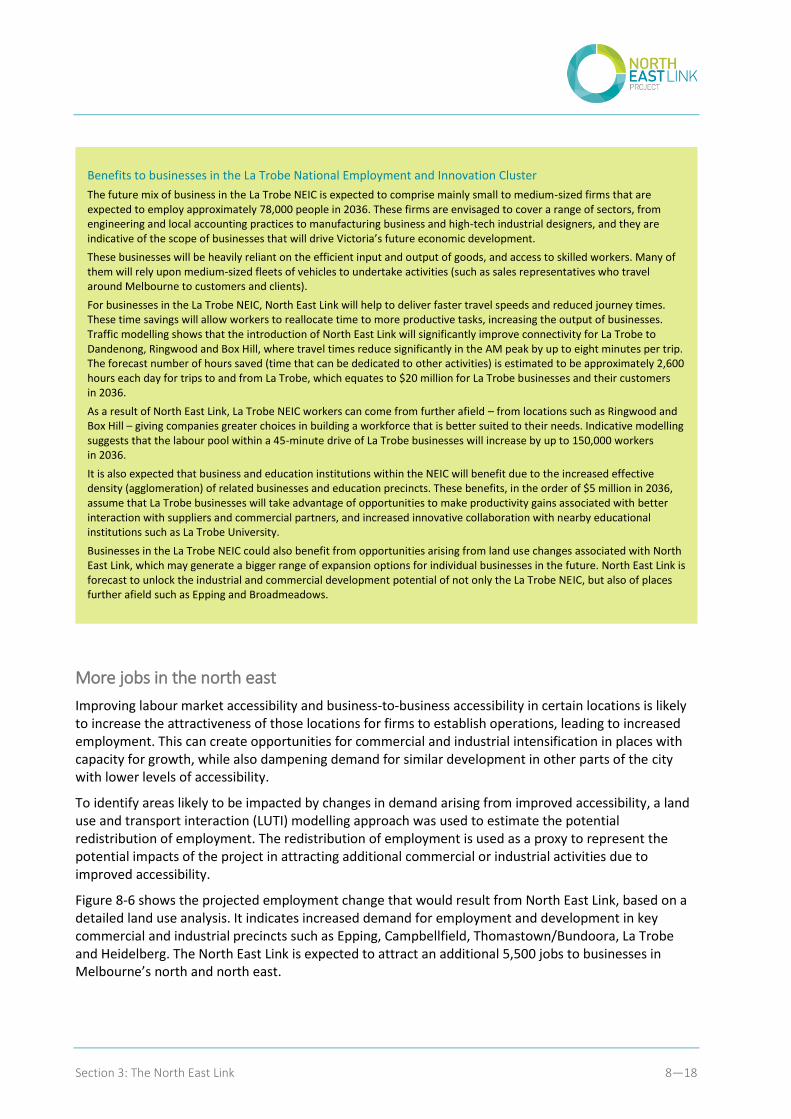
Section 3: The North East Link 8—18
More jobs in the north east
Improving labour market accessibility and business-to-business accessibility in certain locations is likely to increase the attractiveness of those locations for firms to establish operations, leading to increased employment. This can create opportunities for commercial and industrial intensification in places with capacity for growth, while also dampening demand for similar development in other parts of the city with lower levels of accessibility.
To identify areas likely to be impacted by changes in demand arising from improved accessibility, a land use and transport interaction (LUTI) modelling approach was used to estimate the potential redistribution of employment. The redistribution of employment is used as a proxy to represent the potential impacts of the project in attracting additional commercial or industrial activities due to improved accessibility.
Figure 8-6 shows the projected employment change that would result from North East Link, based on a detailed land use analysis. It indicates increased demand for employment and development in key commercial and industrial precincts such as Epping, Campbellfield, Thomastown/Bundoora, La Trobe and Heidelberg. The North East Link is expected to attract an additional 5,500 jobs to businesses in Melbourne’s north and north east.
Benefits to businesses in the La Trobe National Employment and Innovation Cluster
The future mix of business in the La Trobe NEIC is expected to comprise mainly small to medium-sized firms that are expected to employ approximately 78,000 people in 2036. These firms are envisaged to cover a range of sectors, from engineering and local accounting practices to manufacturing business and high-tech industrial designers, and they are indicative of the scope of businesses that will drive Victoria’s future economic development.
These businesses will be heavily reliant on the efficient input and output of goods, and access to skilled workers. Many of them will rely upon medium-sized fleets of vehicles to undertake activities (such as sales representatives who travel around Melbourne to customers and clients).
For businesses in the La Trobe NEIC, North East Link will help to deliver faster travel speeds and reduced journey times. These time savings will allow workers to reallocate time to more productive tasks, increasing the output of businesses. Traffic modelling shows that the introduction of North East Link will significantly improve connectivity for La Trobe to Dandenong, Ringwood and Box Hill, where travel times reduce significantly in the AM peak by up to eight minutes per trip. The forecast number of hours saved (time that can be dedicated to other activities) is estimated to be approximately 2,600 hours each day for trips to and from La Trobe, which equates to $20 million for La Trobe businesses and their customers in 2036.
As a result of North East Link, La Trobe NEIC workers can come from further afield – from locations such as Ringwood and Box Hill – giving companies greater choices in building a workforce that is better suited to their needs. Indicative modelling suggests that the labour pool within a 45-minute drive of La Trobe businesses will increase by up to 150,000 workers in 2036.
It is also expected that business and education institutions within the NEIC will benefit due to the increased effective density (agglomeration) of related businesses and education precincts. These benefits, in the order of $5 million in 2036, assume that La Trobe businesses will take advantage of opportunities to make productivity gains associated with better interaction with suppliers and commercial partners, and increased innovative collaboration with nearby educational institutions such as La Trobe University.
Businesses in the La Trobe NEIC could also benefit from opportunities arising from land use changes associated with North East Link, which may generate a bigger range of expansion options for individual businesses in the future. North East Link is forecast to unlock the industrial and commercial development potential of not only the La Trobe NEIC, but also of places further afield such as Epping and Broadmeadows.
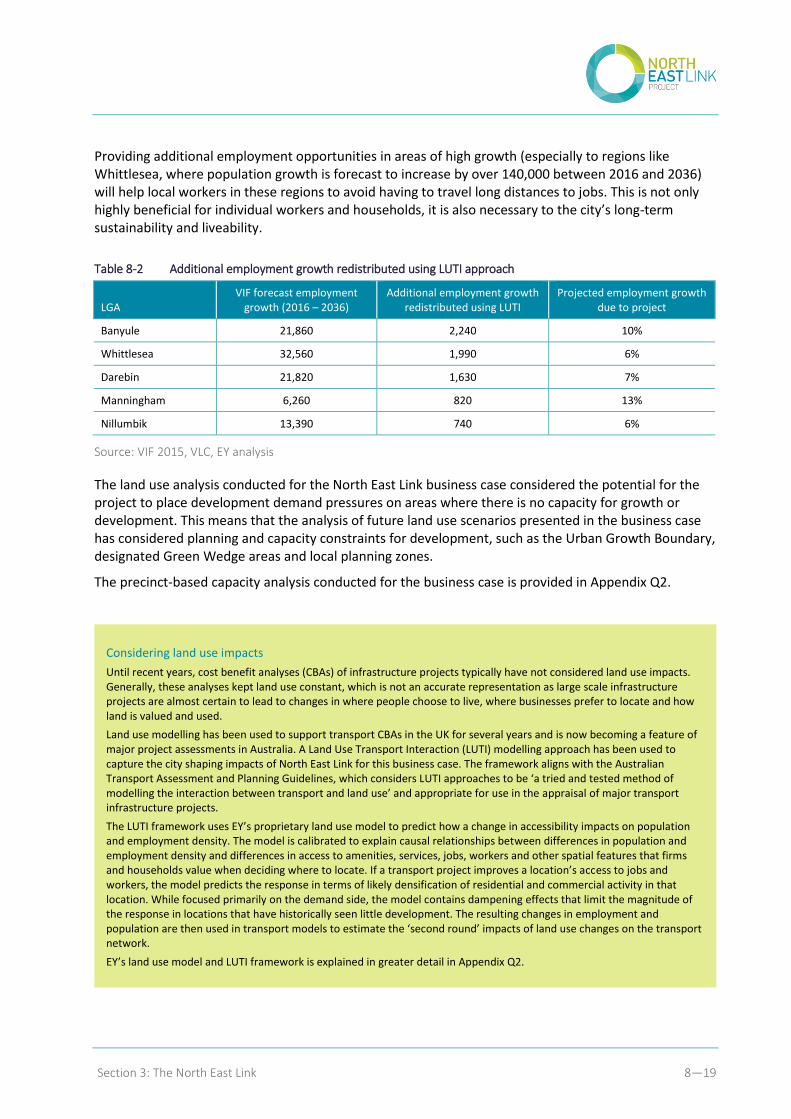
Section 3: The North East Link 8—19
Providing additional employment opportunities in areas of high growth (especially to regions like Whittlesea, where population growth is forecast to increase by over 140,000 between 2016 and 2036) will help local workers in these regions to avoid having to travel long distances to jobs. This is not only highly beneficial for individual workers and households, it is also necessary to the city’s long-term sustainability and liveability.
Table 8-2 Additional employment growth redistributed using LUTI approach
LGA VIF forecast employment
growth (2016 – 2036) Additional employment growth
redistributed using LUTI Projected employment growth
due to project
Banyule 21,860 2,240 10%
Whittlesea 32,560 1,990 6%
Darebin 21,820 1,630 7%
Manningham 6,260 820 13%
Nillumbik 13,390 740 6%
Source: VIF 2015, VLC, EY analysis
The land use analysis conducted for the North East Link business case considered the potential for the project to place development demand pressures on areas where there is no capacity for growth or development. This means that the analysis of future land use scenarios presented in the business case has considered planning and capacity constraints for development, such as the Urban Growth Boundary, designated Green Wedge areas and local planning zones.
The precinct-based capacity analysis conducted for the business case is provided in Appendix Q2.
Considering land use impacts
Until recent years, cost benefit analyses (CBAs) of infrastructure projects typically have not considered land use impacts. Generally, these analyses kept land use constant, which is not an accurate representation as large scale infrastructure projects are almost certain to lead to changes in where people choose to live, where businesses prefer to locate and how land is valued and used.
Land use modelling has been used to support transport CBAs in the UK for several years and is now becoming a feature of major project assessments in Australia. A Land Use Transport Interaction (LUTI) modelling approach has been used to capture the city shaping impacts of North East Link for this business case. The framework aligns with the Australian Transport Assessment and Planning Guidelines, which considers LUTI approaches to be ‘a tried and tested method of modelling the interaction between transport and land use’ and appropriate for use in the appraisal of major transport infrastructure projects.
The LUTI framework uses EY’s proprietary land use model to predict how a change in accessibility impacts on population and employment density. The model is calibrated to explain causal relationships between differences in population and employment density and differences in access to amenities, services, jobs, workers and other spatial features that firms and households value when deciding where to locate. If a transport project improves a location’s access to jobs and workers, the model predicts the response in terms of likely densification of residential and commercial activity in that location. While focused primarily on the demand side, the model contains dampening effects that limit the magnitude of the response in locations that have historically seen little development. The resulting changes in employment and population are then used in transport models to estimate the ‘second round’ impacts of land use changes on the transport network.
EY’s land use model and LUTI framework is explained in greater detail in Appendix Q2.
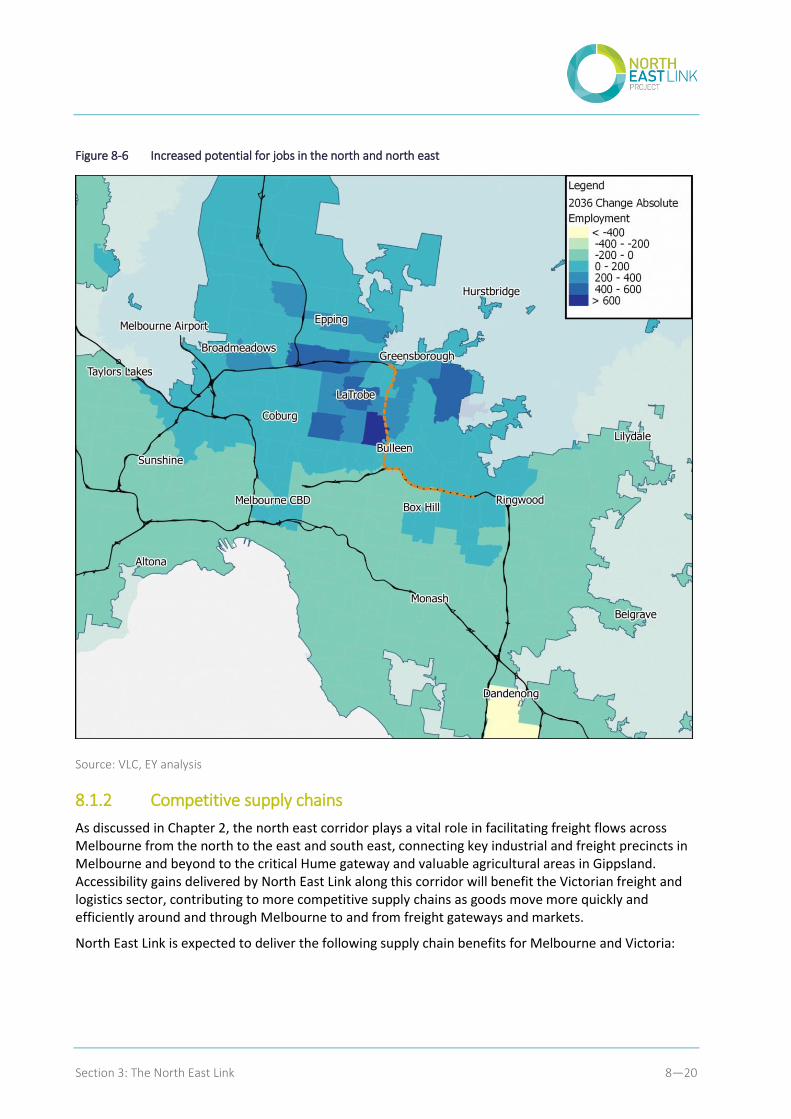
Section 3: The North East Link 8—20
Figure 8-6 Increased potential for jobs in the north and north east
Source: VLC, EY analysis
8.1.2 Competitive supply chains
As discussed in Chapter 2, the north east corridor plays a vital role in facilitating freight flows across Melbourne from the north to the east and south east, connecting key industrial and freight precincts in Melbourne and beyond to the critical Hume gateway and valuable agricultural areas in Gippsland. Accessibility gains delivered by North East Link along this corridor will benefit the Victorian freight and logistics sector, contributing to more competitive supply chains as goods move more quickly and efficiently around and through Melbourne to and from freight gateways and markets.
North East Link is expected to deliver the following supply chain benefits for Melbourne and Victoria:
Section 3: The North East Link 8—21
Better freight connectivity – Direct benefits for road freight operators include commercial vehicle travel time savings, improved travel time reliability, truck operating cost savings and reduced congestion on freight routes. These benefits will extend across light and heavy commercial vehicles, including high productivity freight vehicles (HPFVs). In turn, this will reduce the costs of ‘last mile’ deliveries and enable a more efficient metropolitan logistics system.
Improved access between industrial precincts – North East Link will improve supply chain efficiency by reducing the time to travel between Melbourne’s major industrial precincts. For example, travel times between Dandenong and Epping are expected to reduce by 16minutes, reducing costs for heavy vehicles by approximately $50 per trip.
Greater freight productivity – North East Link will increase the amount of deliveries road freight operators can make within a given time, reducing their labour and fuel costs and improving their productivity, and enabling greater HPFV access through the north east. These cost savings can be passed on to producers and suppliers, increasing their ability to compete across larger distances and reducing the ‘landed’ cost of goods for consumers.
A more efficient metropolitan logistics system – North East Link will enable the logistics industry to organise and execute a more efficient metropolitan goods storage and transport system by locating at the northern apex of the city, which will provide rapid access around the city and to the local road network and reduce the cost of last mile deliveries.
The benefits delivered to the freight and supply chain industry are important from a state-wide economic perspective because they increase the potential for businesses to gain access to goods and supplies. Because the freight industry impacts almost every other industry, these benefits accrue to the entire economy.
Better freight connectivity and improved access between industrial precincts
Commercial vehicle trips to and from industrial and commercial precincts in and out of the north east corridor (particularly Latrobe, Epping and Broadmeadows) are likely to benefit from North East Link through reduced travel times, VOC savings, traffic decongestion and improved travel reliability.
The combined economic value of these benefits to the freight industry is estimated to be in in the range of $4.1 billion over the life of the project, in present value terms. This includes around $2.4 billion in value from the 4.0 million freight hours estimated to be saved each year and $1.2 billion in VOC savings. Further gains are also expected from improved journey reliability and avoiding excessive congestion that causes driver frustration.
Figure 8-7 shows the distribution of light and heavy commercial vehicle travel time net benefits by origin across metropolitan Melbourne. These benefits accrue to areas along the M80 corridor around Mill Park, Campbellfield and Doncaster, as well as in Dandenong, which is a major freight and logistics hub.
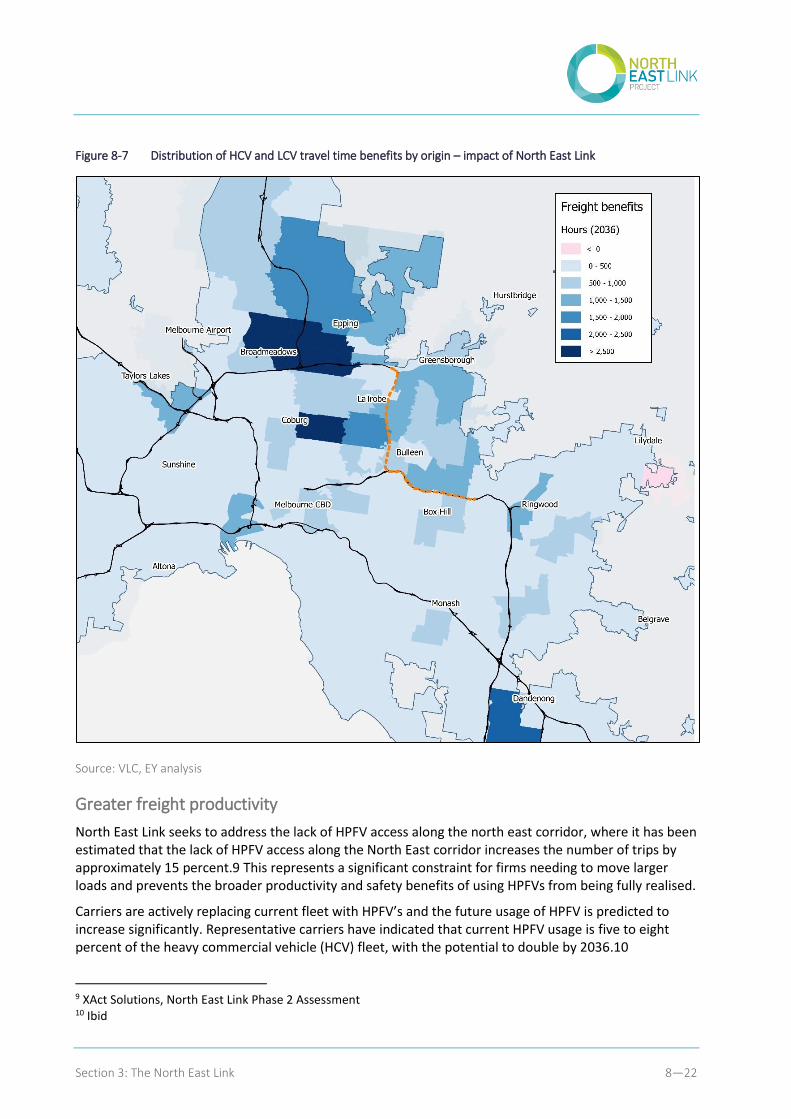
Section 3: The North East Link 8—22
Figure 8-7 Distribution of HCV and LCV travel time benefits by origin – impact of North East Link
Source: VLC, EY analysis
Greater freight productivity
North East Link seeks to address the lack of HPFV access along the north east corridor, where it has been estimated that the lack of HPFV access along the North East corridor increases the number of trips by approximately 15 percent.9 This represents a significant constraint for firms needing to move larger loads and prevents the broader productivity and safety benefits of using HPFVs from being fully realised.
Carriers are actively replacing current fleet with HPFV’s and the future usage of HPFV is predicted to increase significantly. Representative carriers have indicated that current HPFV usage is five to eight percent of the heavy commercial vehicle (HCV) fleet, with the potential to double by 2036.10
9 XAct Solutions, North East Link Phase 2 Assessment 10 Ibid
Section 3: The North East Link 8—23
North East Link will be designed to carry trucks up to 160 tonnes, catering for an increasingly larger and heavier fleet of trucks on Melbourne’s road network. By modernising the Eastern Freeway to an improved structural standard, freight and logistics operators will be able to move goods more efficiently across Melbourne via the orbital freeway network compared to what they can achieve using existing motorway connections.11,12 Following planned upgrades to the M80 and the West Gate Freeway, this increased standard on the Eastern Freeway will mean that most of the metropolitan freeway network will be accessible by larger truck fleets. This will enable a greater proportion of line-haul freight movements to be carried on HPFVs between the north and south east and increase the efficiency of the freight and supply chain systems.
For operators currently taking longer routes via the M1 and M80 on the existing HPFV network, the reduction in distance travelled enabled by North East Link could reduce travel times for intrastate and interstate freight movements, including journeys from Melbourne’s south east and beyond into Victoria’s regional south east to key freight locations in the north of Melbourne and through the northern gateway to markets in Sydney. Reducing travel distances and time means lower costs for operators in terms of fuel, vehicle operating costs and driver wages, which are typically passed on to the purchasers of freight services (shippers).
Due to data limitations it has not been possible to estimate the full benefits for HPFVs. If the carriers sampled are assumed to be representative of wider industry averages, then the project could deliver an additional $120m in benefits based on the current vehicle mix.13 Further benefits could be provided as more users increase their use of HPFVs to take advantage of the enhanced orbital network.
To secure the benefits provided by HPFVs – and maintain an efficient cross-city freight network – future land use planning in the north, north east and south east will need to protect key industrial precincts and freight and logistics hubs and ensure that these locations remain viable options for freight operators.
A more efficient metropolitan logistics system
With Melbourne’s major consumer populations located to the east and south east, and the bulk of warehousing and logistics located in the west, most goods moving around the city travel from west to east via congested routes taking in the West Gate Bridge and M1, which also serve as the key access routes to the Port of Melbourne and central city. As Melbourne’s population and economy grows, travel demand along these routes will increase, leading to further congestion and delays for commuter and freight traffic, reduced landside access for the Port of Melbourne, and a less than optimal logistics landscape.
Furthermore, the establishment of mega distribution centres in Melbourne’s south east (Woolworths and Amazon) is expected to increase demand for freight movement between the north and south east. Construction of North East Link will facilitate the movement of HPFVs to and from these locations and enhance supply chain productivity.
11 North East Link is designed to SM 1600 standard, capable of carrying trucks up to 160 tonnes. 12 The Eastern Freeway will be upgraded to 75 percent of SM 1600 standard. 13 Based on the assumption that HPFV account for 5% of the total HCV fleet mix
Section 3: The North East Link 8—24
All firms along the supply chain are constantly watching changing transport, land, labour and other factors that impact costs and act accordingly when they make new location decisions for production and distribution centres. A logistics system that prioritises warehousing and distribution centres at the northern apex of the metropolitan area will increasingly make sense as population growth continues to occur in Melbourne’s west and as congestion on the M1 and West Gate Bridge makes cross-city movements less economically viable.
Given the imperatives of mobility and accessibility required by operators, improvements to orbital movement through the north east will allow the logistics industry to organise and execute a more efficient metropolitan goods storage and transport system. By improving access between the north, east and south east, North East Link will provide industrial and warehousing precincts in the north with access to a much greater proportion of the metropolitan population, and allow logistics firms to optimise their costs around improved transport links.
Improving the location of regional distribution centres to service Melbourne markets is particularly relevant for last mile deliveries, which are the most expensive component of the supply chain and logistically inefficient. Costs increase faster with time than point-to-point deliveries as congestion limits the productive time available to complete deliveries. For example, if operators take 10 percent longer, they will need 10 percent more delivery fleet, 10 percent more drivers and 10 percent more fuel. Providing rapid access around the city and to the local road network from well-located distribution centres will be increasingly important, particularly as e-commerce models continue to drive significant changes to distribution networks and create demand for more complex distribution systems.
Because logistics is an end-to-end supply chain process that involves more than just transport of goods, an optimised logistics system will have significant productivity benefits because it affects all of Victoria’s other industries.
Section 3: The North East Link 8—25
8.1.3 Economic growth
Accessibility gains to businesses in Melbourne’s north, north east and south east are expected to result in increased productivity across the Victorian economy over the economic life of North East Link. The benefits to businesses from greater orbital connectivity include higher economic production levels and increased profits. These benefits are important from a state-wide economic perspective because they increase the capacity and capability of firms to undertake their business functions efficiently.
To measure these benefits, an economic impact assessment was undertaken by Victoria University’s Centre of Policy Studies using a Computable General Equilibrium (CGE) model. This model estimates the macroeconomic benefits of a project, including job creation and increased Gross State Product.
Macroeconomic benefits were estimated by incorporating relevant direct impacts of the North East Link Project in the CGE model to estimate the flow-on and total impacts across the Victorian economy. The direct impacts used as first-round inputs to the modelling include cost estimates and the major measures of productivity change estimated in the Cost Benefit Analysis, such as travel time savings, vehicle operating costs, accident costs and agglomeration benefit.
Benefits to commercial vehicle operators
Analysis undertaken for the business case considered the example of freight and logistics operators located in Epping, with operations reaching across the north of Melbourne and to the south east towards Gippsland, and operating mixed fleets including light commercial vehicles (rigid trucks), heavy commercial vehicles (articulated Austroads class 4-12) and small numbers of HPFVs.
North East Link will help these freight and logistics operators to achieve reduced trip times for pick-up and delivery of goods to and from industrial precincts, distribution centres and commercial areas. Truck companies value efficient travel time as it enables more deliveries and pick-ups each day. Drivers appreciate the reduced congestion and less in-vehicle travel time. Companies and drivers also appreciate less variable journey times, which allow them to meet tight delivery timelines, reduce unproductive time spent waiting to unload and keep customers satisfied.
Traffic modelling suggests that average travel times to and from freight depots in Epping will reduce by six minutes per journey in 2036 with the introduction of North East Link. The estimated number of hours saved (time that can be dedicated to additional trips) for drivers travelling in and out of Epping is estimated to be about 1,300 hours per day, which (by applying a freight value of time) equates to an economic value of $33.5 million saved for operators over the course of the year.
Freight operators with small, medium or large fleets will benefit from reduced freight operating costs for LCVs, HCVs and HPFV fleets and increased productivity from reduced travel times, reliability improvements and congestion relief will create efficiencies for their businesses. For example, with travel times reducing from Epping to Ringwood by 12 mins due to North East Link, fleet operation and maintenance costs for trucks making that journey could reduce by $18 per trip in the case of light rigid trucks or $46 per trip in the case of heavy articulated vehicles.
Access to industrial-based employment in Epping is also forecast to increase with North East Link, with freight operators in Epping having better access to more qualified staff, logistic professionals and office support staff, giving rise to productivity gains. Traffic modelling suggests that the available labour pool of workers within a 45-minute drive of Epping will increase by up to 150,000 people in 2036.
Truck operators in Epping may also benefit from potential industrial land use changes, with North East Link helping to increase the industrial development potential in areas like Mill Park.
Source: VLC, EY analysis
Section 3: The North East Link 8—26
The key areas of economic growth identified for the project are:
Increased economic activity – as measured by changes to Gross State Product (GSP)14
Employment growth – as measured by changes in the number of full time equivalent workers in the Victorian economy (FTEs)15.
As a significant proportion of the benefits of the project will be provided to business and freight users, the project is expected to result in significant productivity gains throughout the economy which in turn, will help to stimulate economic activity. The analysis undertaken by the Centre of Policy Studies (CoPS) suggests that productivity improvements provided by the project will increase GSP by about $12.5 billion through to 2046.
The project is also expected to stimulate significant additional employment growth across the state during the construction phase and due to ongoing productivity gains provided by the project. CGE modelling suggests that the project will support an average of 10,300 additional (net) jobs across Victoria during the construction period, while over the first 20 years of the operating period, the project will support 3,800 additional (net) jobs across Victoria.
As can be seen in Figure 8-8, the project is expected to provide the most significant boost to gross regional product (GRP) for the Eastern Metro region, worth $5.2 billion through to 2046. The remainder of the economic impact of the project is expected to be spread across the Northern, Western and South East metro regions, providing significant improvements to GRP across all three.
14 Gross State Product (GSP) measures the value of production by summing the net value of goods and services across all industries in Victoria. 15 Employment by FTE workers measures the number of additional fulltime equivalent (FTE) jobs in the economy. Differences in the hours worked between industries and employee types (casual, part time and full time) are standardised by calculating the total hours worked across all employees and dividing this by the average hours worked per full time employee.
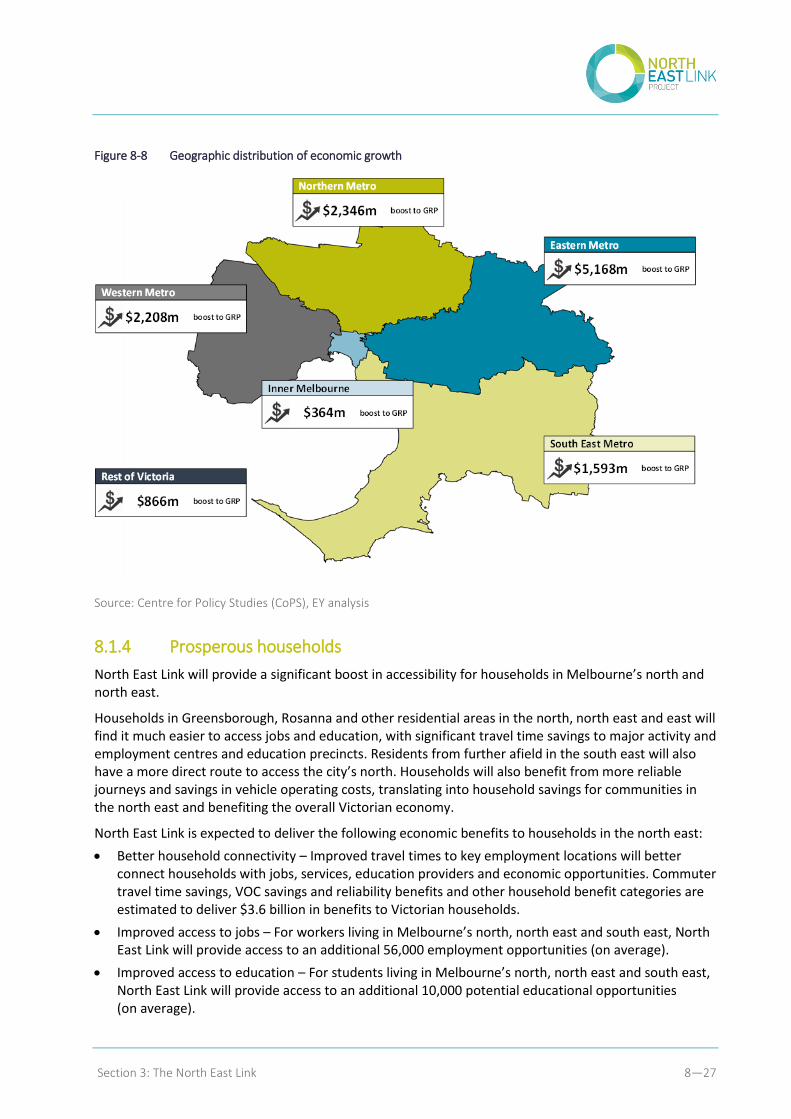
Section 3: The North East Link 8—27
Figure 8-8 Geographic distribution of economic growth
Source: Centre for Policy Studies (CoPS), EY analysis
8.1.4 Prosperous households
North East Link will provide a significant boost in accessibility for households in Melbourne’s north and north east.
Households in Greensborough, Rosanna and other residential areas in the north, north east and east will find it much easier to access jobs and education, with significant travel time savings to major activity and employment centres and education precincts. Residents from further afield in the south east will also have a more direct route to access the city’s north. Households will also benefit from more reliable journeys and savings in vehicle operating costs, translating into household savings for communities in the north east and benefiting the overall Victorian economy.
North East Link is expected to deliver the following economic benefits to households in the north east:
Better household connectivity – Improved travel times to key employment locations will better connect households with jobs, services, education providers and economic opportunities. Commuter travel time savings, VOC savings and reliability benefits and other household benefit categories are estimated to deliver $3.6 billion in benefits to Victorian households.
Improved access to jobs – For workers living in Melbourne’s north, north east and south east, North East Link will provide access to an additional 56,000 employment opportunities (on average).
Improved access to education – For students living in Melbourne’s north, north east and south east, North East Link will provide access to an additional 10,000 potential educational opportunities (on average).
Section 3: The North East Link 8—28
More sustainable urban structure – Improved accessibility and liveability will contribute to a rebalancing of future urban residential developments in Melbourne’s north and north east, leading ultimately to a more sustainable city-wide spatial structure with jobs located closer to where people live.
These benefits for households are important from a state-wide economic perspective, because they improve individuals’ access to appropriate employment opportunities, generating higher incomes and leading to increased contributions to the Victorian economy and GSP.
Better household connectivity
Car and bus trips to and from households in and out of the north east corridor (particularly Greensborough, Watsonia, Diamond Creek and Eltham) will benefit from the project through reduced travel times, lower vehicle operating costs and traffic decongestion, and improved travel reliability.
North East Link is expected to deliver significant benefits for road users between key residential areas in the east and south east, such as Box Hill, Monash, Ringwood and Dandenong, effectively bringing households in the north closer to the south east and vice versa.
The combined economic value of these benefits to households is estimated to be in in the range of $342 million per year (in 2036) and $3.6 billion over the life of the project, in present value terms. The largest component of household benefit is accounted for by travel time savings (57 percent of total household benefits) for all non-work based car trips across the metropolitan Melbourne road network, followed by decongestion relief benefits (17 percent), VOC savings (at 14 percent), and travel time reliability (seven percent).
Figure 8-9 shows the distribution of household travel time benefits by origin across metropolitan Melbourne. The largest benefits will be experienced in areas along the project corridor including Rosanna and Greensborough, while households further north near Epping and further south near Box Hill are also expected to experience considerable travel time benefits. Overall, households are expected to save about 12.1 million hours each year due to North East Link.
Notably, suburbs in the far north, including Craigieburn and Wollert, are expected to experience net dis-benefits. This is due to considerable induced demand forecast for arterial roads connecting to North East Link, suggesting there is insufficient existing infrastructure in the far north for households to take full advantage of the new link. Therefore, a project such as the E6 transport corridor which would add extra capacity in the north, would likely alleviate these disbenefits and allow the North East Link to better achieve its objectives.
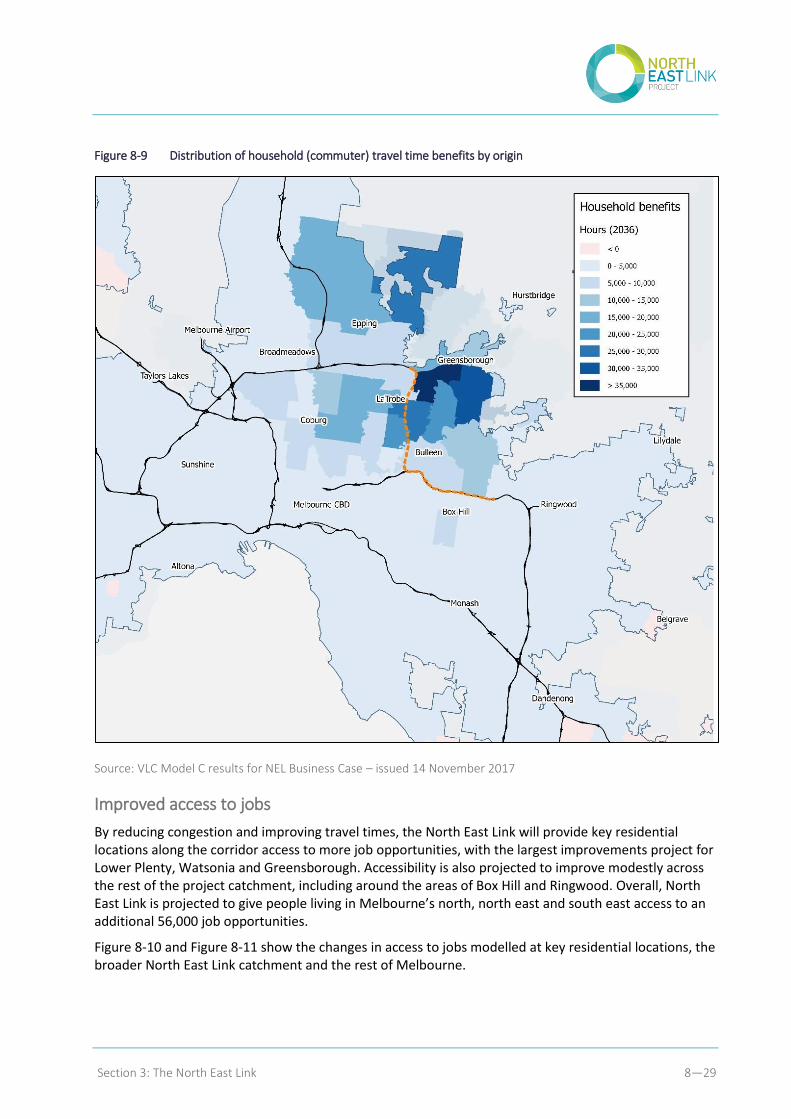
Section 3: The North East Link 8—29
Figure 8-9 Distribution of household (commuter) travel time benefits by origin
Source: VLC Model C results for NEL Business Case – issued 14 November 2017
Improved access to jobs
By reducing congestion and improving travel times, the North East Link will provide key residential locations along the corridor access to more job opportunities, with the largest improvements project for Lower Plenty, Watsonia and Greensborough. Accessibility is also projected to improve modestly across the rest of the project catchment, including around the areas of Box Hill and Ringwood. Overall, North East Link is projected to give people living in Melbourne’s north, north east and south east access to an additional 56,000 job opportunities.
Figure 8-10 and Figure 8-11 show the changes in access to jobs modelled at key residential locations, the broader North East Link catchment and the rest of Melbourne.
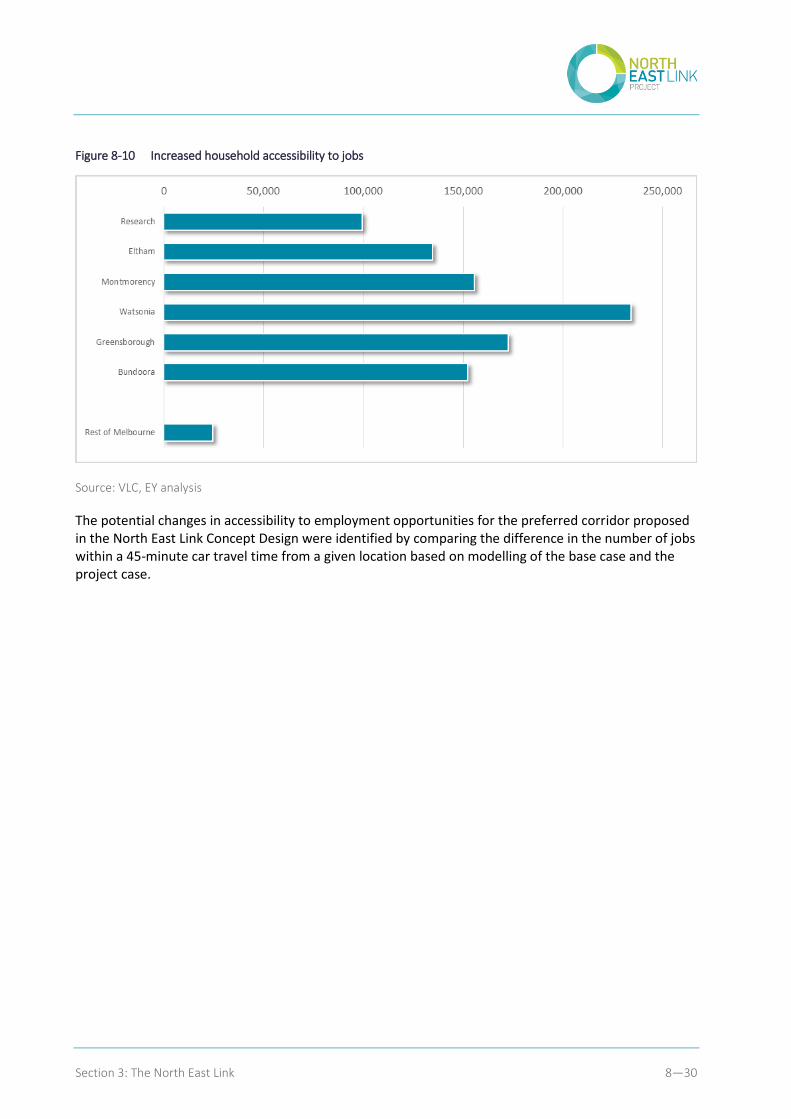
Section 3: The North East Link 8—30
Figure 8-10 Increased household accessibility to jobs
Source: VLC, EY analysis
The potential changes in accessibility to employment opportunities for the preferred corridor proposed in the North East Link Concept Design were identified by comparing the difference in the number of jobs within a 45-minute car travel time from a given location based on modelling of the base case and the project case.
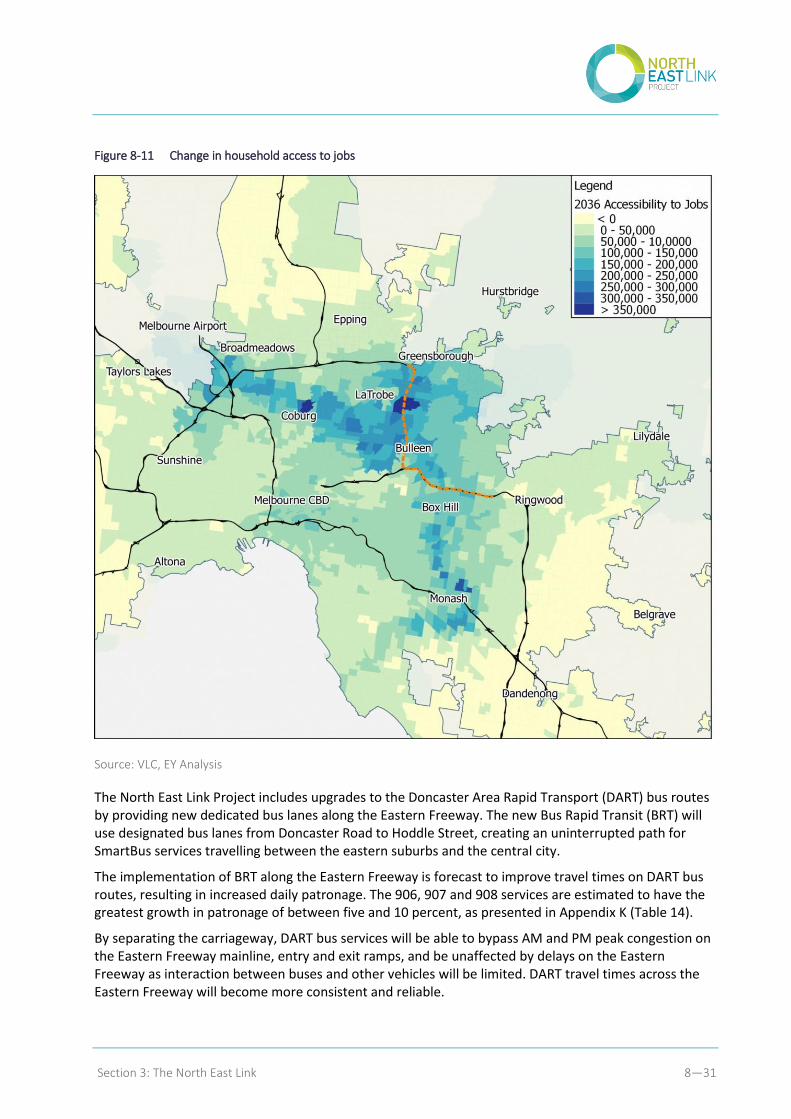
Section 3: The North East Link 8—31
Figure 8-11 Change in household access to jobs
Source: VLC, EY Analysis
The North East Link Project includes upgrades to the Doncaster Area Rapid Transport (DART) bus routes by providing new dedicated bus lanes along the Eastern Freeway. The new Bus Rapid Transit (BRT) will use designated bus lanes from Doncaster Road to Hoddle Street, creating an uninterrupted path for SmartBus services travelling between the eastern suburbs and the central city.
The implementation of BRT along the Eastern Freeway is forecast to improve travel times on DART bus routes, resulting in increased daily patronage. The 906, 907 and 908 services are estimated to have the greatest growth in patronage of between five and 10 percent, as presented in Appendix K (Table 14).
By separating the carriageway, DART bus services will be able to bypass AM and PM peak congestion on the Eastern Freeway mainline, entry and exit ramps, and be unaffected by delays on the Eastern Freeway as interaction between buses and other vehicles will be limited. DART travel times across the Eastern Freeway will become more consistent and reliable.
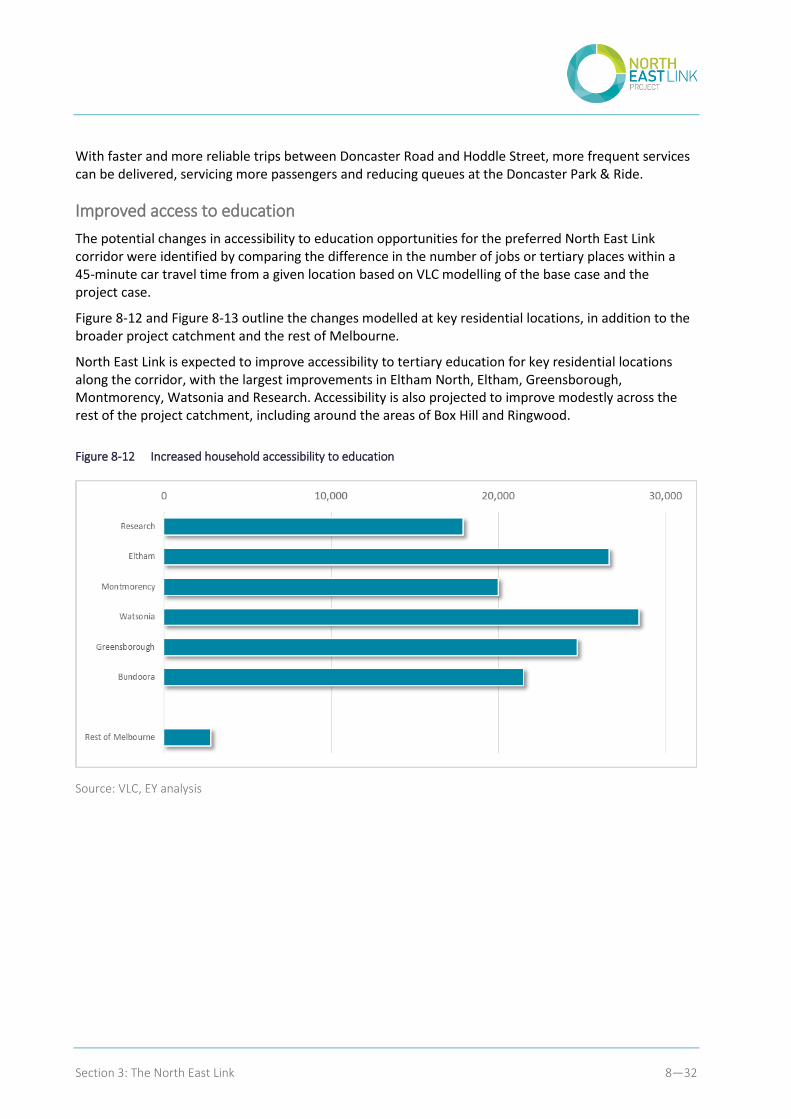
Section 3: The North East Link 8—32
With faster and more reliable trips between Doncaster Road and Hoddle Street, more frequent services can be delivered, servicing more passengers and reducing queues at the Doncaster Park & Ride.
Improved access to education
The potential changes in accessibility to education opportunities for the preferred North East Link corridor were identified by comparing the difference in the number of jobs or tertiary places within a 45-minute car travel time from a given location based on VLC modelling of the base case and the project case.
Figure 8-12 and Figure 8-13 outline the changes modelled at key residential locations, in addition to the broader project catchment and the rest of Melbourne.
North East Link is expected to improve accessibility to tertiary education for key residential locations along the corridor, with the largest improvements in Eltham North, Eltham, Greensborough, Montmorency, Watsonia and Research. Accessibility is also projected to improve modestly across the rest of the project catchment, including around the areas of Box Hill and Ringwood.
Figure 8-12 Increased household accessibility to education
Source: VLC, EY analysis
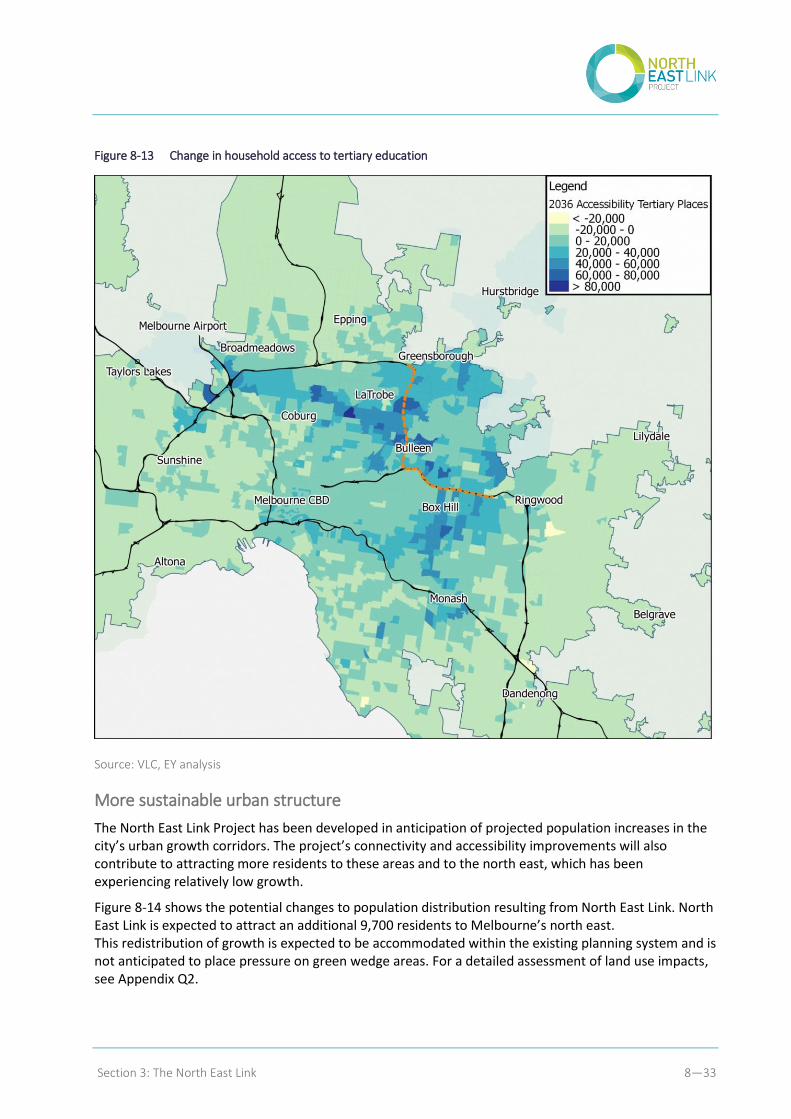
Section 3: The North East Link 8—33
Figure 8-13 Change in household access to tertiary education
Source: VLC, EY analysis
More sustainable urban structure
The North East Link Project has been developed in anticipation of projected population increases in the city’s urban growth corridors. The project’s connectivity and accessibility improvements will also contribute to attracting more residents to these areas and to the north east, which has been experiencing relatively low growth.
Figure 8-14 shows the potential changes to population distribution resulting from North East Link. North East Link is expected to attract an additional 9,700 residents to Melbourne’s north east. This redistribution of growth is expected to be accommodated within the existing planning system and is not anticipated to place pressure on green wedge areas. For a detailed assessment of land use impacts, see Appendix Q2.
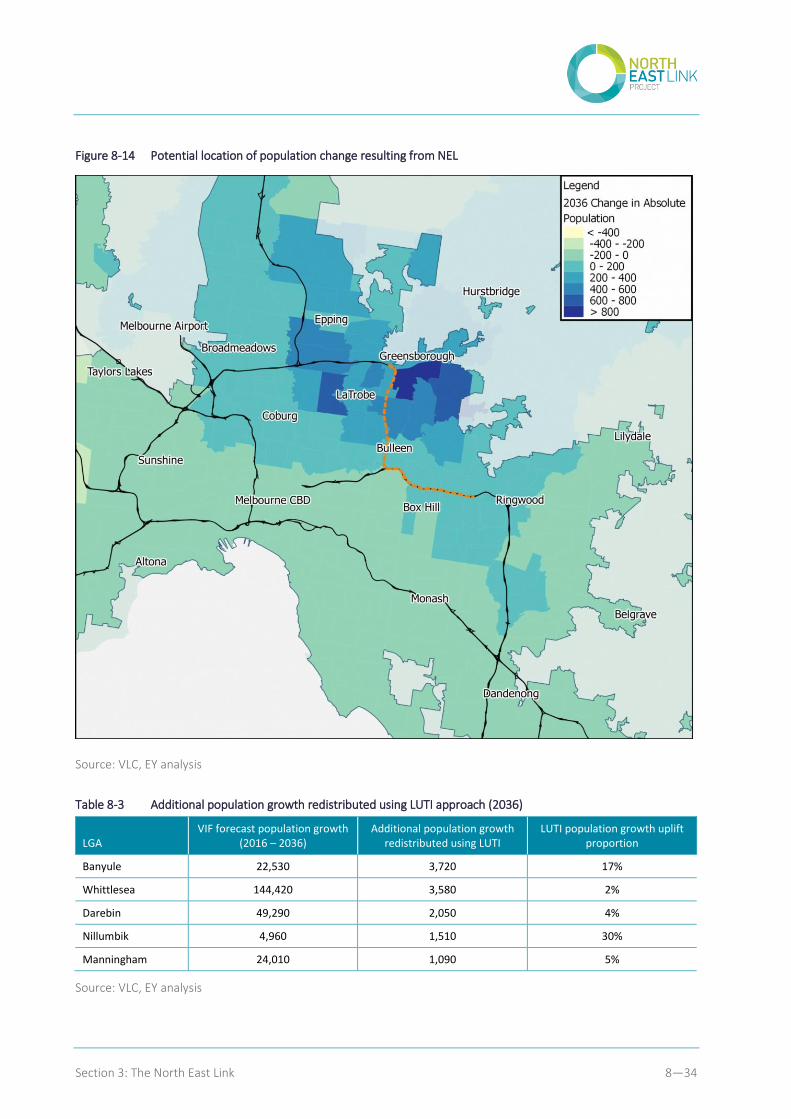
Section 3: The North East Link 8—34
Figure 8-14 Potential location of population change resulting from NEL
Source: VLC, EY analysis
Table 8-3 Additional population growth redistributed using LUTI approach (2036)
LGA VIF forecast population growth
(2016 – 2036) Additional population growth
redistributed using LUTI LUTI population growth uplift
proportion
Banyule 22,530 3,720 17%
Whittlesea 144,420 3,580 2%
Darebin 49,290 2,050 4%
Nillumbik 4,960 1,510 30%
Manningham 24,010 1,090 5%
Source: VLC, EY analysis
Section 3: The North East Link 8—35
8.1.5 Liveable neighbourhoods
Decreased reliance on local and arterial roads as key orbital routes through Melbourne’s north east will boost amenity in these areas through reduced noise pollution, improved air quality, safer local roads, less time lost sitting in traffic and better connections to local destinations. This will contribute to making Melbourne a more liveable city and to improving economic opportunities for the north eastern suburbs by creating the conditions for increased business investment and employment.
Overall, an additional $41 million in benefits is expected to be provided to local communities in the north east each year because of the project. This figure includes the following liveability benefits to households in the north east:
Improved local access to key places and services – Reduced congestion on local roads and subsequent improved public transport service performance will give residents easier access to local destinations.
Safer roads and fewer crashes – By reducing the number vehicle kilometres (especially trucks) on local roads and arterials, the likelihood of road accidents decreases with the implementation of North East Link.
Healthier communities – The North East Link Concept Design incorporates improvements to walking and cycling infrastructure and facilities, including on-road and shared use paths. These active transport improvements along the project corridor will result in benefits for local residents and public transport.
Less local pollution from vehicle emissions – Reduced car and truck kilometres on local and arterial roads with the implementation of North East Link will decrease air pollution and noise.
Benefits to households in Greensborough
According to the 2016 ABS Census, there are approximately 8,150 households in Greensborough, each with on average 2.7 occupants. Over 70 percent of Greensborough residents travel to work by car to a dispersed range of locations, and it is generally assumed that time spent travelling is considered relatively unproductive.
For households in Greensborough, North East Link delivers reduced traffic volumes and faster road speeds, and reduced in-vehicle times for commuting to work and conducting other household errands (such as shopping and after school pickups), resulting in increased leisure time. In particular, traffic modelling suggests that average travel times to and from the family home in Greensborough will reduce by an average of 2.6 minutes per journey in 2036 with the introduction of North East Link.
The number of hours saved (time that can be dedicated to leisure activities) is estimated to be about 14 hours per family member, which (by applying an average non-work value of time) equates to an economic value of $250 saved for the average Greensborough family over the course of a year. Reduced vehicle operating costs, travel time reliability improvements and congestion relief will also create budget efficiencies for families in the order of $125 per family per annum.
Households in Greensborough will benefit from employment and education accessibility gains due to North East Link. Residents of working age can access better jobs, giving them greater career choices to work at firms better suited to their skillsets. Furthermore, students will have better access to tertiary education opportunities. Traffic modelling suggests that the employment and education opportunities within a 45-minute drive of a typical Greensborough home will increase by up to 173,000 jobs and 25,000 tertiary places respectively in 2036.
Through the impact of North East Link, households in Greensborough may also benefit from potential land use changes, with the project helping to unlock residential development potential in Banyule and Nillumbik to accommodate an additional 5,230 people.
Source: VLC, EY analysis
Section 3: The North East Link 8—36
Improved local access to key places and services
By helping to redistribute traffic away from local roads, the project will improve household access in key residential areas to important services such as hospitals and schools, as well as other places used for leisure activities such as parks and sporting facilities.
The reliability and frequency of bus services in the north east are heavily dependent upon the performance of the road network. By reducing traffic congestion and removing competing modes on key arterial roads, North East Link will improve the extent to which priority can be given to bus services and reduce delays arising from traffic congestion. Quicker, more reliable and more frequent bus services make sustainable travel modes more attractive for commuters, which means fewer cars on the road.
In addition to benefits arising from existing services, improvements along key arterial roads will allow PTV to provide a higher level of public transport accessibility by increasing the frequency and coverage of bus services.
The value of the benefits arising from improved local public transport service levels in the north east is estimated at $100 million in present value terms over the life of the project.
Safer roads and fewer crashes
North East Link will provide significant safety improvements by removing traffic from local roads and shifting this traffic to safer, higher order roads such as arterial roads and freeways.
Improvements to the north eastern road network enabled through the project are likely to have two, partially offsetting, effects on crash numbers and severity. First, there are likely to be improvements for existing transport users due to improved speeds and road quality. Secondly, there is potential for an increase in crashes due to additional road travel associated with users changing modes and destinations.
The valuation of crash cost reductions was undertaken by applying Zenith forecast VKTs by road type (primary divided, primary undivided, secondary and local) to geospatial crash rates from the Australian Road Research Board’s speed limit and Victorian crash cost estimates, using ATAP guidance that values a single fatal, serious injury or other injury crash.
The forecast number or crashes avoided on local roads through the implementation of North East Link is around 100 crashes each year over the life of the project. Network-wide, the present value of crash cost savings for the project is estimated at $324 million.
Healthier communities
North East Link will create opportunities to provide high quality walking and cycling infrastructure along the project corridor to improve access to key local destinations and encourage more people to walk or cycle for shorter trips.
As outlined in Chapter 6, the Concept Design incorporates improvements to active transport infrastructure and facilities, including completion of the Greensborough Road path between Yallambie Road and Grimshaw Street and new shared use paths.
Section 3: The North East Link 8—37
These cycling and walking path projects along the North East Link corridor will result in benefits for local residents and public transport. A recent Queensland Government study16 found that, for a typical off-road path in an inner urban area, economic benefits per kilometre walked or cycled include:
Decongestion (20.7 cents per kilometre walked or cycled)
Health (up to 168.0 cents per kilometre)
Vehicle operating costs (35.0 cents per kilometre)
Infrastructure savings (6.8 cents per kilometre)
Environment (5.9 cents per kilometre).
This means (indicatively) that for each person who cycles 20 minutes to work and back, the economy benefits by $14.30 per day; and for each person who walks 20 minutes to work and back, the economy benefits by $8.48 per day.
Less local pollution from vehicle emissions
As mentioned previously, the project will divert significant amounts of traffic (particularly freight) away from residential areas and local roads. Additionally, by providing a more direct and efficient route for road users, the project is expected to help reduce fuel consumption and, as a result, greenhouse gas emissions. It is expected that emissions in local and collector streets within residential areas will decline, providing $52 million in community benefits from reduced air and noise pollution for residents in Melbourne’s north eastern suburbs.
8.2 How the project solution minimises project impacts
The North East Link Project is expected to deliver significant benefits, but may also result in some negative heritage, environmental, business and social impacts, particularly during the construction phase.
In developing the business case Concept Design for North East Link, a number of investigations were undertaken to identify and evaluate potential impacts of the project. The following sections summarise the key findings of these investigations, includaing potential impacts arising from the Concept Design as presented in this business case, as well as initial mitigation strategies. More detail on these potential impacts is provided in Appendix G and Appendix H. As development of North East Link continues, including preparation of an Environment Effects Statement (EES), further investigation of these impacts will be undertaken, along with the development of appropriate mitigation and management strategies.
8.2.1 Potential heritage impacts
Heritage sites have been identified in or near the project corridor. These sites include areas with defined Aboriginal cultural heritage sensitivity, as well as early European residential sites and activities and developments in proximity to the Yarra River. Where possible, the project will avoid or mitigate negative impacts to heritage places and values.
16 Queensland Department of Transport and Main Roads (2011) Benefits of inclusion of active transport in infrastructure projects.
Section 3: The North East Link 8—38
Aboriginal cultural heritage
The project corridor runs past several areas with defined Aboriginal cultural heritage sensitivity, including the Banyule flats, the Yarra River and Bolin Bolin Billabong. Impacts on Aboriginal cultural heritage during construction may arise from works that impact registered places or culturally sensitive areas where surface works are proposed at the M80 and Greensborough Road interchange, along the western boundary of Simpson Barracks and at the southern tunnel portal, however the tunnel extends past the most sensitive areas to minimise potential impacts. No impacts are expected during the operation of the project.
A Cultural Heritage Management Plan (CHMP) will be prepared to assess and manage the risk to Aboriginal cultural heritage. The CHMP will provide a process to manage potential harm to known Aboriginal cultural heritage (as well as Aboriginal cultural heritage identified during construction activities) through detailed management conditions and contingency plans.
Historical heritage
There is potential for the project to have direct and indirect adverse impacts on sites of historical heritage and archaeological significance, including sites listed on the Victorian Heritage Register and Victorian Heritage Inventory and Heritage Overlay sites identified in local planning schemes. Where possible, North East Link will be designed to avoid adverse impacts to these sites In addition, there is potential for the discovery of unidentified sites with heritage significance during construction.
Construction activities associated with North East Link have the potential to result in damage to heritage buildings and structures through ground movement and vibration. Risks will be assessed and, depending upon the level of risk identified, measures will be developed to minimise or eliminate potential impacts.
Further work will be undertaken to support the EES required for the project, including additional investigations to establish existing conditions within the project corridor and surrounding area, preparation of a land use history for the area, inspections of heritage places in close proximity to project structures and predictive archaeological modelling to identify the likelihood of unlisted archaeological sites.
8.2.2 Potential environmental impacts
Work undertaken in developing the business case Concept Design for North East Link included the identification and evaluation of potential environmental impacts of the project during operation and construction, as well as possible strategies to avoid, mitigate or manage these impacts. Further investigations will be undertaken for each of these environmental aspects as part of the EES process.
Air quality
Road works and tunnel construction will involve substantial civil construction work. During construction, dust emissions associated with excavation, spoil handling and removal and other construction activities may impact surrounding residents, businesses and communities. Standard mitigation will be applied to manage these impacts, including dust monitoring according to the requirements of the Environment Protection Authority (EPA) Victoria.
Operational impacts will include emissions from vehicles using existing, new and upgrade surface roads however, predicted traffic volumes are expected to be no greater than volumes for other roads in Melbourne.
Section 3: The North East Link 8—39
Emissions from ventilation structures located at each of the tunnel ports will be managed through the design and implementation of a tunnel ventilation system that achieves zero portal emissions during operation. Additionally, an air quality monitoring program will be implemented to monitor ambient and in-tunnel air quality during operation of North East Link. Further investigations for the EES will include assessing the changes in air quality in the vicinity of surface roads and due to the ventilation system using an assessment methodology developed in consultation with EPA Victoria.
Contaminated land and spoil management
Based on a review of past and current land uses in the project corridor, a number of areas have been identified as having some potential for soil and groundwater contamination. These are generally associated with land uses such as dry cleaners, service stations, vehicle service and repair centres and industrial manufacturing, as well as former landfills and areas of possible uncontrolled fills. Impacts from contaminated land and spoil management are expected to occur during the construction phase only. The generation, handling, storage, re-use and/or disposal of contaminated spoil (soil and rock) can potentially have adverse impacts on human health and the environment.
Potential impacts will be managed by adherence to relevant policies and regulations and through the preparation and implementation of a number of plans, including a Spoil Management Plan (SMP). These plans will set out well-tested controls and practices to avoid, mitigate and manage potential impacts associated with contaminated soil, including requirements for storage, handling, transport and disposal.
Targeted further investigations will assess the risk associated with individual sites. Appropriate mitigation measures will be developed as potential impacts are identified.
Ecology
A number of threatened ecological species and communities are known or have the potential to occur in the project area, including those listed under the Commonwealth Environment Protection and Biodiversity Conservation Act 1999 (EPBC Act) and the Victorian Flora and Fauna Guarantee Act 1988 (FFG Act).
Surface construction activities have the potential to result in removal of native vegetation, scattered trees, amenity trees or habitat for EPBC Act or State listed flora and fauna. There may also be impacts associated with spread or introduction of weeds or pathogen, and impacts to water quality from sedimentation and run-off.
Long-term impacts are expected to include a reduction of light and rain from bridges and viaduct structures, potentially leading to the loss of vegetation cover, habitat and water quality, and impeding the passage of some species. Increases of artificial light, noise and vibration are expected to cause disturbance to native fauna species. Changes to stormwater inputs to waterways, groundwater or surface water levels will result potentially in changed ecohydrology and aquatic habitat quality.
Further investigations will be carried out to support the preparation of the EES and the referral to the Commonwealth Department of Environment and Energy required by the EPBC Act. These include detailed flora and fauna assessments, targeted ecological field surveys or habitat assessments, shade modelling and arboriculture surveys to confirm existing conditions, identify potential impacts and determine offset requirements. Impact mitigation measures and practices will be developed and implemented under the guidance of an ecologist. Measures will also be adopted to avoid the introduction or spread of weeds and pathogens during construction, including for ‘no-go’ zones.
Section 3: The North East Link 8—40
Greenhouse gas
During construction of the project, the embodied carbon in materials used by the project (such as concrete and steel) will represent the largest source of greenhouse gas emissions. The use of fossil fuels such as diesel or grid-powered electricity to operate plant, equipment and tunnel boring machines will also have a greenhouse gas impact. During operation, greenhouse gas emissions will be generated by the use of electricity for the tunnel pumps, lighting and ventilation. However, operational emissions impacts are expected to be relatively minor.
Sustainable design practices will be integrated into the project’s design process and the consequence of greenhouse gas emissions can be further managed by implementing leading practices in infrastructure sustainability such as the Infrastructure Sustainability Rating Tool (IS Tool,) that evaluates sustainability initiatives and potential environmental, social and economic impacts of infrastructure projects.
Ground movement
The potential for ground movement to occur during construction activities is influenced by local geotechnical and hydro-geological conditions. Construction activities that modify existing landforms at the surface or remove soil, rock and groundwater at depth have the potential to affect buildings and structures due to ground movement. Ground movement may occur as a result of subsidence due to excavated soil or groundwater inflow, settlement from constructing on weaker compressible soil or from land slip when constructing on, or creating, a slope that is too steep.
Experience from tunnelling projects around the world shows that typically, tunnels represent a higher level of risk and cost when compared to surface road construction. This is due to the variable nature of the ground in which the tunnel is constructed and the complex interaction between the tunnelling process and the ground response.
To investigate and address these potential impacts, an assessment of volume loss and drawdown settlement and risk to existing utilities and buildings will be undertaken. In addition, a detailed three dimensional geological/geotechnical model will be prepared of existing ground conditions along the project alignment. Appropriate engineering solutions and mitigation measures will be developed for structures that are assessed as ‘having moderate’ or higher risk of damage. These measures may include modifying the tunnel process or method, pre-support of the ground, or structural support of affected structures.
Groundwater
A range of possible impacts to groundwater could occur as a result of construction activities above and below ground. These include groundwater contamination caused by chemical or fuel spills, groundwater drawdown affecting groundwater users or groundwater dependent ecosystems, and the mobilisation and migration of contaminated groundwater.
The operation of the project has the potential to indirectly interact with groundwater through chemical or fuel spills or discharge of wastewater. There is also potential for impacts on groundwater quality through mobilisation of existing contamination in groundwater plumes.
A geotechnical drilling program will be undertaken to acquire an accurate understanding of interactions between the project and the groundwater environment. This program will support development of a geological and hydrogeological model, establishment of a groundwater monitoring network and further investigation of potential impacts associated with specific project elements.
Section 3: The North East Link 8—41
Potential impacts to groundwater users and groundwater quality will be mitigated through management plans for monitoring, reuse and disposal of groundwater inflows that comply with relevant legislation and guidelines.
Surface water and hydrology
Construction and operation of the project have the potential to impact water quality and the frequency and depth of flooding in the project area. Possible impacts include flooding and inundation of property and infrastructure, increased sediment and pollutants in waterways and erosion of waterway beds or banks. Increases to paved areas may affect stormwater flow rates and downstream waterways. There may also be temporary and permanent impacts associated with the potential realignment of Banyule Creek and Koonung Creek.
Hydrologic and hydraulic models of existing flood conditions have been developed for the investigation of flood risks and potential impacts to surface water. For construction works, a Surface Water Management Plan will be prepared and implemented, setting out the requirements and methods to be followed for best practice sediment and erosion control and monitoring.
The project will be designed and constructed so that all permanent structures and associated temporary construction works do not increase flood risk associated with overland flow paths. Water sensitive urban and road design assessments will be undertaken. Any additional pavement area will meet water sensitive road design criteria and provide water treatment and flow retention as necessary.
Land use planning
Adverse land use impacts may arise from temporary and permanent changes to land use, particularly as a result of land acquisition, removal or relocation of existing local vehicle access routes and severance of existing pedestrian and cycling links. During the operation phase, permanent acquisition may impact the long-term use and, in some cases, development potential of land.
Further investigation will include additional consultation with councils in relation to impacts associated with activity centres and industrial precincts, and any other risks to land use.
Landscape and visual impact
Adverse landscape and visual impacts are expected during construction of North East Link. This is due to works associated with construction compounds, temporary buildings, laydown areas, hoardings, large equipment, vegetation removal and changes to walking and cycling access and links.
Permanent impacts of the project on the visual and landscape character are likely to be associated with the removal of vegetation, the placement of structures (such as tunnel portals, viaducts and ventilation outlets) and disruptions to the way the community uses and interacts with public spaces. Additional shared use paths, including pedestrian and cycling links, provided as part of North East Link may have a positive impact.
To address these impacts, landscape and visual performance measures will be included as part of the project’s Urban Design Strategy. A landscape concept design will be developed as part of the reference design, which will identify design features and activities to enhance landscape and visual outcomes and avoid or minimise negative visual impacts.
Section 3: The North East Link 8—42
Noise and vibration
Noise and vibration impacts are expected from activities required to construct North East Link. Without mitigation, noise levels at adjacent residential and community buildings and outdoor recreational areas are likely to be high at times, including during blasting which may be required in some areas to improve the efficiency of excavation activities. During construction, tunnelling would induce vibration and regenerated noise, however these impacts are expected to be transitory in nature.
During operation, traffic noise impacts may increase due to the introduction of new or upgraded road infrastructure, as well as along roads where traffic volumes may increase as a result of the project. Traffic noise is expected to impact sensitive receptors including residential dwellings, schools, health and aged care facilities, outdoor recreational and public open spaces immediately adjacent to the alignment. Operational impacts are also expected in the form of noise emissions from tunnel ventilation unit, although these impacts would be localised.
A Construction Noise and Vibration Management Plan (CNVMP) will be prepared and implemented. The plan will identify measures to mitigate noise impacts and ensure the project complies with relevant guidelines. Further detailed modelling of tunnel vibration and regenerated noise levels will be undertaken based on the preferred designs for tunnel and dive structure arrangements.
Noise modelling will be undertaken to establish noise mitigation requirements and acoustic controls. Noise from tunnel ventilation structures and surrounding land uses will be considered when locating these structures. New or upgraded noise barriers may be required to mitigate increased traffic noise.
8.2.3 Potential business impacts
Four business precincts are located in the vicinity of North East Link, along with a number of isolated and small clusters of businesses. The Greensborough Plaza, Watsonia station, Heidelberg station and Bulleen Road precincts are the largest business precincts likely to be affected by North East Link. These precincts contain a diverse mix of business types and include an Activity Centre Zone, large scale supermarkets, retail trade businesses, health care and social assistance businesses, professional, scientific and technical services businesses, schools, several sports centres, industry and commercial areas (including a hub of automotive businesses) and the Heide Museum of Modern Art.
Impacts to access during construction
Changes to traffic patterns during construction may impact businesses positively or negatively, depending on their catchments and the composition of their client and supplier bases. The principal potential impacts arising from changes to access during construction include:
Businesses reliant on passing trade that experience a reduction of traffic due to road closures are likely to experience a negative impact during construction. Businesses that experience greater passing traffic due to diversions are likely to benefit
Reduced availability of parking, especially in areas where construction staff may park, may adversely impact businesses that rely on customers parking nearby
Works that significantly delay or prevent direct and convenient access from one side of the project area to the other could significantly reduce these customer and employment catchments, potentially affecting a large number of businesses
Freight and logistics businesses may experience increased vehicle travel times, leading to increased labour and vehicle operating costs
Section 3: The North East Link 8—43
Amenity impacts associated with dust and noise could temporarily reduce the number of customers for some hospitality and retail businesses with outdoor areas. The impact associated with this may be slightly offset by spending from construction staff that would otherwise not occur.
Impacts due to acquisition of properties containing businesses
A number of businesses will need to be fully or partially acquired for construction of North East Link, particularly south of Bridge Street in Bulleen. Businesses could potentially relocate to another business precinct or suitably zoned land nearby without substantial loss of their customer base if they are not dependent on passing trade, are not co-located with interrelated or complementary businesses and do not depend on special permits/approvals to operate in their current locations. Other businesses may rely upon the efficiencies and benefits associated with agglomeration economies. In these circumstances, acquisition of businesses could potentially reduce the viability of interdependent non-acquired businesses, with flow-on impacts for local employment opportunities.
Impacts during operation
It is expected that many businesses will experience long-term benefits resulting from reduced travel times. However, the operation of North East Link is likely to positively and negatively impact businesses that rely on passing trade, depending on the redistribution of traffic.
Further investigations and management measures
Further investigations will be undertaken during the reference design and planning approvals phase to confirm the number and type of businesses potentially impacted by the project. This will include analysis of land use data collected and maintained by councils, and consultation with key stakeholders including the owners and operators of businesses.
Management measures will be implemented to minimise potential business impacts. During development of the reference design, permanent acquisition or temporary occupation of land will be minimised as much as practicable. Early and ongoing engagement will be undertaken with businesses affected by land acquisition and temporary occupation to assist them to relocate, modify their operations or reconfigure their sites. Compensation and assistance for businesses with an interest in land required for the project will be provided in accordance with the Land Acquisition and Compensation Act 1986.
During construction, impacts on the level of access for businesses and their amenity or function will be minimised. Where impacts are unavoidable, affected businesses will be notified of potential impacts and temporary access arrangements. Where temporary access arrangements are implemented, access will be restored or relocated as agreed with the property owner when construction work is complete.
8.2.4 Potential social impacts
North East Link travels through six local government areas (LGAs) in Melbourne’s north-east: Banyule, Boroondara, Manningham, Nillumbik, Whitehorse and Yarra. At the 2016 Census, these LGAs had a combined resident population of over 715,000. When compared to the Melbourne average, most of these LGAs have higher rates of home ownership and a higher proportion of family households. Compared to the Melbourne average, higher proportions of residents have lived at the same address for five years or more. This low level of mobility may indicate a deep level of attachment to the community among residents.
Section 3: The North East Link 8—44
Potential displacement impacts due to property acquisition
North East Link requires the acquisition of residential properties, particularly north of Lower Plenty Road. Many of these residents are likely to have a strong attachment to their properties and the local community. Impacts are expected to be more significant for vulnerable residents, with moving likely viewed as a stressful event and finding a suitable alternative property potentially challenging.
A number of sporting and recreational facilities are expected to be affected by the project. Most of the land acquisition is expected to be partial, with these facilities remaining open and retaining their functions. Where this is not possible, appropriate planning and consultation will occur and facilities or services relocated to another suitable site.
Areas of public open space, including shared use paths and car parking, are expected to be acquired. This loss of public open space, which will be temporary in some cases and permanent in others, is expected to displace organised sports and passive recreation. Impacts on recreational spaces may be significant to the relevant user groups if acceptable local alternatives cannot easily be found.
Lost or diminished access to properties and services during construction
Project-related construction works may temporarily inhibit access to residential properties, community facilities or open space close to the project but outside the acquisition boundary. Access to parking may also be reduced in some locations. Barriers to access to community facilities and open space can include congestion and detours due to construction traffic, which can result in people avoiding making their usual trips.
Impacts on travel, traffic and infrastructure
Traffic diversions, delays and additional construction vehicles will likely contribute to traffic congestion and longer routes, potentially lengthening current travel times during construction. It is likely that all modes of local transport could experience some disruptions and delays. Higher heavy vehicle numbers and changed traffic conditions during construction can adversely impact local road safety.
In the long term, travel times are expected to improve as vehicles are encouraged to shift from local roads to North East Link.
Potential severance, connectedness and cohesion impacts
The construction of new road infrastructure can be perceived as creating physical and psychological barriers that result in community severance and may impact on community cohesion. Increased truck and general traffic movements and changes to local access can sever community networks and alter access patterns, particularly for young families, the elderly and those with mobility constraints. These potential impacts may occur during construction and operation.
In the long term, community and household connectivity in the north east is expected to improve through new and upgraded walking and cycling links and faster travel times to local destinations.
Section 3: The North East Link 8—45
Impacts on amenity and local community character
Amenity impacts relate to community character, air quality, noise levels, visual landscape and environmental values that attract people to a local area. Any project-related loss of tree cover could be viewed as altering the streetscape and adversely impacting the look and feel of the community. The presence of a large construction workforce and equipment, along with the light-spill from any night works, could temporarily alter local amenity and community character. If the amenity of community facilities is perceived to be significantly reduced, fewer residents may use these facilities, potentially affecting their viability. In general, these impacts will be lower for facilities located further away from North East Link.
During operation, it is expected that the project will encourage trucks off some local roads, such as Rosanna Road, which is expected to improve amenity and safety on these residential streets. The extent of impacts on traffic, noise, air quality and visual impact will be confirmed in the EES, including how and where pedestrian access will be facilitated, acoustic mitigations and details of the urban design strategy.
Potential stress and anxiety impacts
Property impacts associated with residential acquisition, changes in amenity and potential property damage due to tunnelling may cause stress and anxiety among affected property owners. The extent to which this impact is felt is likely to vary significantly by individual, depending on a person’s circumstances and their capacity for, and experience in, responding to change. Vulnerable persons are likely to be more susceptible to these impacts. In some cases, stress and anxiety are heightened by a lack of information and are reduced once full information is provided (for example, providing an understanding of the compensation process for land acquisition and details about tunnel depth and location, and the likely duration of tunnelling activities).
Further investigations and management measures
Further investigations will be undertaken during the reference design and planning approvals phase to confirm the number and type of residential properties, community facilities and public open space potentially impacted. This will include analysis of local demographics, review and analysis of legislation, social policies and plans at federal, State and local levels, and further consultation with residents, councils, community organisations and other key stakeholders.
Management measures will be implemented to minimise potential social impacts. During development of the reference design, permanent acquisition or temporary occupation of residential land will be minimised as much as practicable. Compensation for parties with an interest in land required for the project will be provided in accordance with the Land Acquisition and Compensation Act 1986, and early and ongoing assistance will be given to residents and households affected by acquisition.
Further investigations as part of the EES process will determine where construction activities may reduce access to community facilities and public open space and identify appropriate measures to retain access where possible, modify access arrangements as required and restore access post-construction. A Community and Stakeholder Engagement Management Plan will be developed in consultation with affected local councils to engage and consult the community and stakeholders. Where construction activities directly impact sports clubs or recreational facilities, the affected clubs and land managers will be consulted to identify local alternative facilities for the period of disruption.
Potential amenity and traffic impacts will be managed through the development and implementation of detailed plans during the project’s construction phase. Road users, residents and businesses will be kept informed about amenity and traffic issues associated with construction activities.
Section 3: The North East Link 8—46
8.2.5 Environmental management framework
Extensive environmental assessments will be undertaken in developing the North East Link Project. These assessments will consider the potential impacts associated with the project’s construction and operation phases, and provide a management framework to ensure that any impacts are mitigated, monitored and managed appropriately.
The mitigation of actual or potential adverse impacts associated with the project will take place within an overarching Environmental Management Framework (EMF). This framework will provide a transparent and accountable framework for managing environmental aspects of the project’s delivery in accordance with applicable legislation and approval conditions.
A set of Environmental Performance Requirements (EPRs) will be developed for the project during detailed assessment to define the minimum environmental outcomes that must be achieved for design, construction and operation. The EPRs are likely to include requirements to comply with specific regulations, policies and guidelines set by government and statutory authorities; achieve recognised thresholds and levels; and adopt industry best-practice or well-tested construction approaches and methods.
The EPRs will be performance-based and expressed in terms of outcomes to be achieved for net community benefits, while allowing flexibility in the detailed design response or for specific measures to be put in place to achieve the required outcome.
The EPRs will be developed during preparation of the EES, assessed by an independent panel appointed by the Minister for Planning, and considered by the Minister during assessment of the EES.
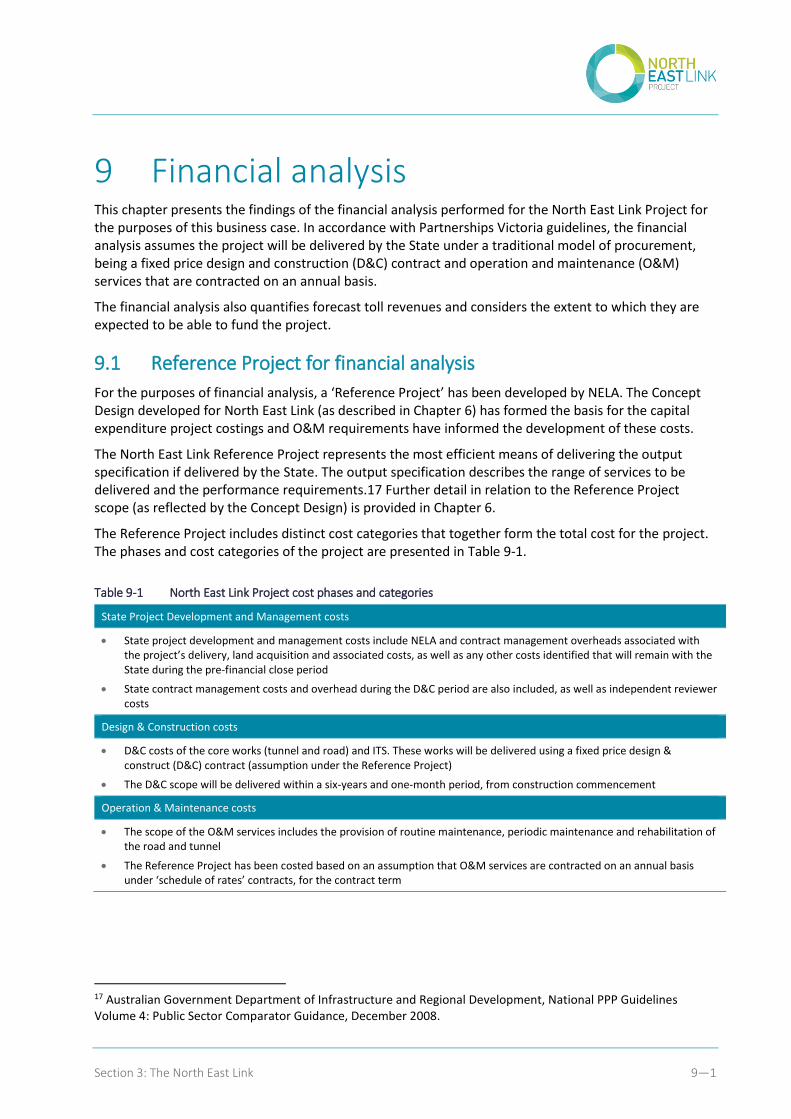
Section 3: The North East Link 9—1
9 Financial analysis This chapter presents the findings of the financial analysis performed for the North East Link Project for the purposes of this business case. In accordance with Partnerships Victoria guidelines, the financial analysis assumes the project will be delivered by the State under a traditional model of procurement, being a fixed price design and construction (D&C) contract and operation and maintenance (O&M) services that are contracted on an annual basis.
The financial analysis also quantifies forecast toll revenues and considers the extent to which they are expected to be able to fund the project.
9.1 Reference Project for financial analysis
For the purposes of financial analysis, a ‘Reference Project’ has been developed by NELA. The Concept Design developed for North East Link (as described in Chapter 6) has formed the basis for the capital expenditure project costings and O&M requirements have informed the development of these costs.
The North East Link Reference Project represents the most efficient means of delivering the output specification if delivered by the State. The output specification describes the range of services to be delivered and the performance requirements.17 Further detail in relation to the Reference Project scope (as reflected by the Concept Design) is provided in Chapter 6.
The Reference Project includes distinct cost categories that together form the total cost for the project. The phases and cost categories of the project are presented in Table 9-1.
Table 9-1 North East Link Project cost phases and categories
State Project Development and Management costs
State project development and management costs include NELA and contract management overheads associated with the project’s delivery, land acquisition and associated costs, as well as any other costs identified that will remain with the State during the pre-financial close period
State contract management costs and overhead during the D&C period are also included, as well as independent reviewer costs
Design & Construction costs
D&C costs of the core works (tunnel and road) and ITS. These works will be delivered using a fixed price design & construct (D&C) contract (assumption under the Reference Project)
The D&C scope will be delivered within a six-years and one-month period, from construction commencement
Operation & Maintenance costs
The scope of the O&M services includes the provision of routine maintenance, periodic maintenance and rehabilitation of the road and tunnel
The Reference Project has been costed based on an assumption that O&M services are contracted on an annual basis under ‘schedule of rates’ contracts, for the contract term
17 Australian Government Department of Infrastructure and Regional Development, National PPP Guidelines Volume 4: Public Sector Comparator Guidance, December 2008.
Section 3: The North East Link 9—2
Toll revenue18
The Reference Project assumes that a State Toll Co. is established to perform the tolling function and will retain toll revenue risk
The State Toll Co. will be responsible for the capex required for the establishment of the tolling system and associated O&M
The State Toll Co. will be responsible for toll revenue collection
9.2 Risk adjusted cost estimate
The risk adjusted cost estimate for the North East Link Reference Project is presented in Table 9-2.
Table 9-2 P90 Risk adjusted project cost and revenue summary
18 The business case recommends that the State retains toll revenue risk through the establishment of a State Toll Co. Toll revenue risk is broadly a function of the risk of inaccuracy in forecasting traffic volumes and the risk that underlying assumptions regarding future macro-economic factors that support long-term traffic growth forecasts are inaccurate.
Redacted – commercial-in-confidence

Section 3: The North East Link 9—3
The risk adjusted project costs are presented on a percentage basis in the figure below.
Redacted – commercial-in-confidence
Section 3: The North East Link 9—4
9.3 Financial analysis
9.3.1 Financial analysis methodology
A discounted cash flow (DCF) financial model has been developed to present the cost and revenue estimates. The financial model captures all the cost and revenue components of the North East Link Reference Project and presents the costs on a nominal (inclusive of escalation) and net present cost (NPC) basis.
The North East Link Reference Project has been estimated by the cost estimator on a real basis (October 2017), for each Reference Project component (State Project Development and Management costs, D&C costs and O&M costs). The cost estimator has produced costs on a P90 risk adjusted basis (90 percent statistical confidence level for the estimates provided).
Toll revenue has been forecast based on traffic volume forecasts developed by Veitch Lister Consulting (VLC) and the toll pricing regime adopted for the business case.
9.3.2 Key assumptions
The key financial and timing assumptions that have been used to develop the financial analysis are provided in Table 9-3.
Table 9-3 Key financial assumptions
Redacted – commercial-in-confidence
Section 3: The North East Link 9—5
9.4 Costs
The risk adjusted costs (P90) for the key components of the North East Link Reference Project are presented in the sections below.
Further detail in relation to these costs are provided in the Financial Analysis Report in Appendix M.
9.4.1 State Project Development and Management cost estimate (risk adjusted)
The risk adjusted (P90) State development and management costs are presented in Table 9-4. Whilst the analysis assumes a State-funded D&C, these costs would be incurred irrespective of the procurement model. State Project Development and Management costs are related to costs expended during the pre-construction and construction periods, and include State development, management, overhead, land acquisition costs and Independent Reviewer costs. The inherent and contingent risk adjustment has also been presented.
Table 9-4 Risk adjusted State project development and management and land acquisition costs
Redacted – commercial-in-confidence
Section 3: The North East Link 9—6
The risk adjusted State project development and management and land acquisition costs are presented on a percentage basis in the figure below.
Redacted – commercial-in-confidence
Section 3: The North East Link 9—7
9.4.2 Capital expenditure estimate (risk adjusted)
The risk adjusted (P90) capital expenditure costs are presented in Table 9-5. The capital expenditure costs are based on the D&C cost estimate cash flows developed by the cost estimator for the North East Link Reference Project and are presented in NPC and nominal terms. The inherent and contingent risk adjustment is also presented.
Table 9-5 Risk adjusted capital expenditure costs
The risk adjusted capital expenditure costs are presented on a percentage basis in the figure below.
Redacted – commercial-in-confidence
Redacted – commercial-in-confidence
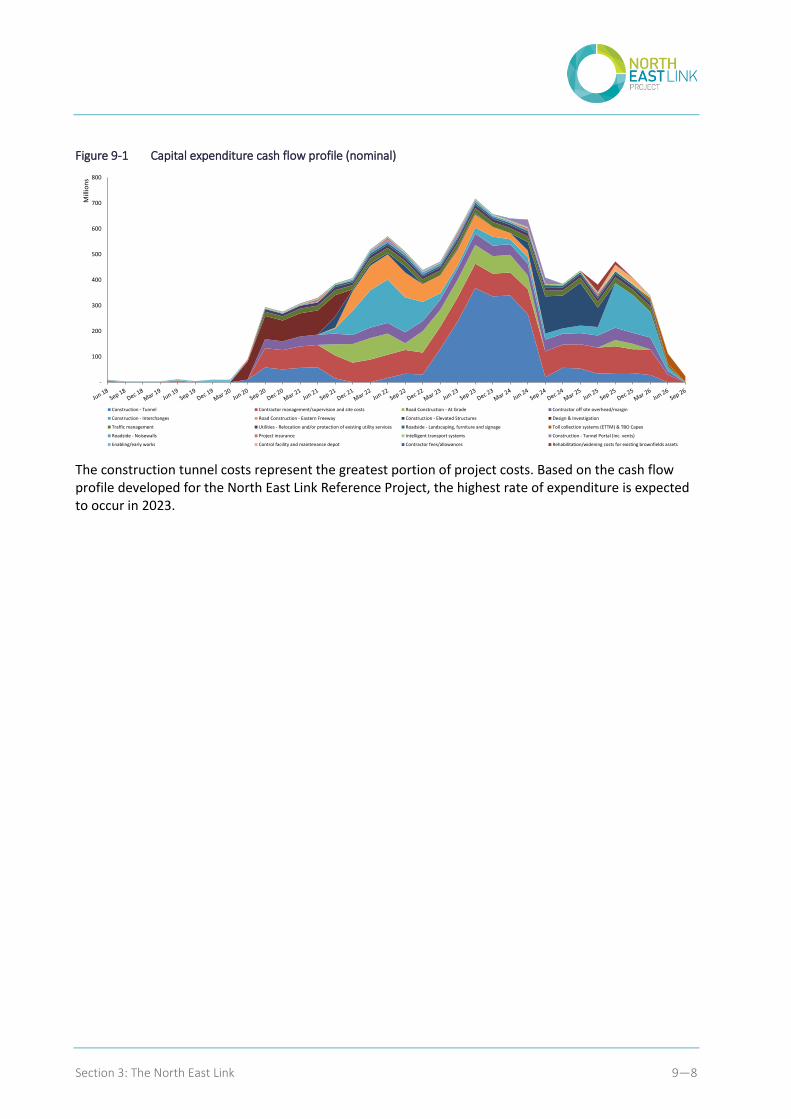
Section 3: The North East Link 9—8
Figure 9-1 Capital expenditure cash flow profile (nominal)
The construction tunnel costs represent the greatest portion of project costs. Based on the cash flow profile developed for the North East Link Reference Project, the highest rate of expenditure is expected to occur in 2023.
-
100
200
300
400
500
600
700
800
Mill
ion
s
Construction - Tunnel Contractor management/supervision and site costs Road Construction - At Grade Contractor off site overhead/margin
Construction - Interchanges Road Construction - Eastern Freeway Construction - Elevated Structures Design & Investigation
Traffic management Utilities - Relocation and/or protection of existing utility services Roadside - Landscaping, furniture and signage Toll collection systems (ETTM) & TBO Capex
Roadside - Noisewalls Project insurance Intelligent transport systems Construction - Tunnel Portal (inc. vents)
Enabling/early works Control facility and maintenance depot Contractor fees/allowances Rehabilitation/widening costs for existing brownfields assets
Section 3: The North East Link 9—9
9.4.3 Operation & Maintenance expenditure estimate (risk adjusted)
The risk adjusted (P90) O&M costs are presented in Table 9-6. The O&M costs include routine, periodic and lifecycle maintenance costs and operational costs associated with the toll road.
Table 9-6 Risk adjusted O&M Costs
Redacted – commercial-in-confidence
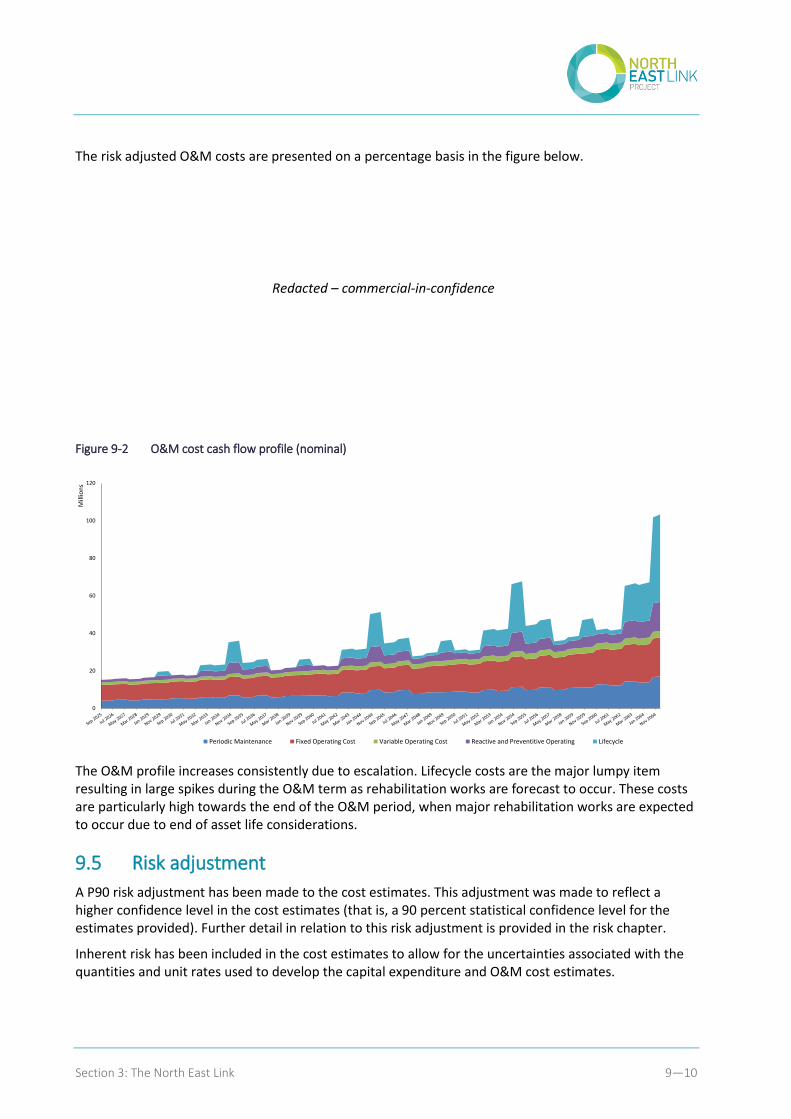
Section 3: The North East Link 9—10
The risk adjusted O&M costs are presented on a percentage basis in the figure below.
Figure 9-2 O&M cost cash flow profile (nominal)
The O&M profile increases consistently due to escalation. Lifecycle costs are the major lumpy item resulting in large spikes during the O&M term as rehabilitation works are forecast to occur. These costs are particularly high towards the end of the O&M period, when major rehabilitation works are expected to occur due to end of asset life considerations.
9.5 Risk adjustment
A P90 risk adjustment has been made to the cost estimates. This adjustment was made to reflect a higher confidence level in the cost estimates (that is, a 90 percent statistical confidence level for the estimates provided). Further detail in relation to this risk adjustment is provided in the risk chapter.
Inherent risk has been included in the cost estimates to allow for the uncertainties associated with the quantities and unit rates used to develop the capital expenditure and O&M cost estimates.
0
20
40
60
80
100
120
Mill
ion
s
Periodic Maintenance Fixed Operating Cost Variable Operating Cost Reactive and Preventitive Operating Lifecycle
Redacted – commercial-in-confidence
Section 3: The North East Link 9—11
Contingent risk has been included in the cost estimates to quantify the risks related to the project. The contingent risk adjustment is in addition to the inherent risk adjustment.
The broader project risks were identified through workshops facilitated in July 2017. A risk register was developed from this process to quantify the risks associated with the Reference Project. The quantification of the contingent risks was undertaken in risk quantification workshops in August 2017.
The risk quantification process was conducted in accordance with NELA risk management methodology (which applies DEDJTR risk management requirements) and complies with the risk management process outlined in ISO 31000 – Risk Management Principles and Guidelines. Risk identification and quantification workshops were attended by the NELA project team and the outputs of the workshops were modelled in @Risk (a software program that performs risk analysis using Monte Carlo simulation).
9.6 Toll revenue
9.6.1 Toll revenue - key assumptions and methodology
Toll revenue has been forecast for the Reference Tolling Solution adopted for the business case, Redacted- commercial-in-confidence
A set of tolling principles (the Tolling Principles) were developed to inform the objectives of the North East Link Project. The Tolling Principles informed the development of the long list of strategic tolling options and refinement to a short-list of strategic tolling options that were subjected to assessment in line with tolling criteria to support the recommendation of the Reference Tolling Solution for adoption in the business case.
The Reference Tolling Solution adopted for the purposes of the business case is intended to represent a reasonable toll price structure for the purposes of estimating forecast project toll revenues for use in the financial analysis as well as understanding the impact on the adjacent transport network. The forecast project toll revenues have been based on the assumptions and methodology presented below, including key assumptions in relation to traffic volumes and toll pricing.
Traffic volume forecasts have been produced for the North East Link Reference Project by using a transport model. Veitch Lister Consulting (VLC) has been engaged by NELA to perform the traffic modelling for the project to produce a demand forecast for use in the business case. VLC has used the Zenith model for the project, which is a four-step transport model used to forecast demand and evaluate the economic benefits of new transport infrastructure.
The Zenith model produces a demand forecast using the behavioural traits of the key vehicle classes that currently feature in Melbourne’s existing toll road pricing regimes:
Car
Light Commercial Vehicle (LCV)
Heavy Commercial Vehicle (HCV)
High Productivity Freight Vehicle.
For the purposes of the business case, motorcycle traffic has been deemed immaterial. The business case has also adopted pricing for a fourth vehicle class: High Productivity Freight Vehicles (HPFV). This has not been specifically modelled in Zenith, but it has been estimated for the purposes of the financial analysis as comprising one percent of the HCV fleet mix.
Redacted – commercial-in-confidence
Section 3: The North East Link 9—12
The key output of the Zenith model is the Average Weekday Traffic (AWDT) result, which represents the demand for the project for a standard week day, exclusive of school and public holidays for each of the project’s nominated reference years. The reference years adopted for the project are 2026, 2036 and 2051. These years are used as the basis for determining the AWDT in the intervening years between the reference years.
To convert these daily projected volumes into yearly volumes, annualisation factors are applied. These factors consider the likely use of the link on the weekend compared to weekday traffic and how these volumes may change as a proportion of the total annual traffic volume over time.
NELA determined a toll pricing regime to be used for the purposes of estimating tolling revenue. The toll pricing regime was the subject of an evidence-based assessment in line with the tolling principles and tolling criteria adopted for the project and approved by the State.
Table 9-7 Toll pricing (real 2017, inclusive of GST)
Redacted – commercial-in-confidence
Redacted – commercial-in-confidence
Redacted – commercial-in-confidence
Section 3: The North East Link 9—13
9.6.2 Toll revenue
The forecast toll revenue for the project based on the methodology developed for the business case is presented in Table 9-8, on a Net Present Value (NPV) and nominal basis.
Table 9-8 Toll revenue
9.6.3 Toll revenue sensitivity testing
The financial impact of toll revenue being materially different from forecast revenue may have a significant impact on the funding split. For this purpose, a low toll revenue scenario is presented below.
Key assumptions of the tolling revenue stream have been sensitised to identify the impact on the NPV of tolling revenue. The assumptions selected for sensitivity testing are traffic volumes and the long-term CPI forecast rate. The impact is presented in the tables below in NPV terms.
Table 9-9 Traffic volumes reduction
Redacted – commercial-in-confidence
Redacted – commercial-in-confidence
Section 3: The North East Link 9—14
Table 9-10 Toll price escalation
Table 9-11 Traffic volume reduction and CPI
Whilst this sensitivity analysis is focused on the impact on toll revenue, the reductions in traffic volumes and escalation may also reduce O&M costs, however, this has not been factored into the above analysis.
9.7 Notional funding split
The notional funding split reflects funding generated from net toll revenues and funding required from other sources to cover the project’s State Project Development and D&C costs. The funding required from other sources has been calculated as the total funds required less a notional contribution of net toll revenues valued at a commercial rate of return and assuming up-front monetisation at commencement of construction.
There are several ways to assess the funding split for the North East Link Reference Project. This method calculates the discounted value of net toll revenues (gross toll revenues less O&M costs) and compares this value to the total nominal construction and development cost value of the Reference Project. This approach has been developed by the Victorian Government and applied for precedent toll road project analysis.
Figure 9-3 shows the nominal development and construction period costs and notional funding split.
Figure 9-3 Nominal development and construction period costs and notional funding split
Redacted – commercial-in-confidence
Redacted – commercial-in-confidence
Redacted – commercial-in-confidence
Section 3: The North East Link 9—15
9.7.1 Approach to determining the notional funding split
Table 9-12 Costs that can be funded from toll revenues
Table 9-13 Funding split
Redacted – commercial-in-confidence
Redacted – commercial-in-confidence
Redacted – commercial-in-confidence
Section 3: The North East Link 9—16
9.8 Project funding and budget and accounting
Pre-Global Financial Crisis (GFC), construction of PPP projects was typically fully privately financed and effectively repaid over the concession period. Post-GFC, however, State funding contributions have become more common than fully financed deals and have been used as a means of reducing total private sector financing requirements, and therefore financing costs payable by the State.
A State funding contribution scenario has been applied to the Reference Packaging Solution (defined in Chapter 11) to determine the likely cash flows and budget and accounting impacts of the project. Further detail in relation to the State funding contribution scenario and budget and accounting is provided in Chapter 12.
9.9 Independent cost review
An independent review of the cost estimates developed by the cost estimator was conducted by the independent cost reviewer.
The independent cost reviewer’s final report ‘North East Link – Corridor A, Base Case Independent Cost Review’ dated 27 November 2017 provided an independent review of the concept design cost estimate for the North East Link Project, prepared by the cost estimator, and is included in Appendix P.
The independent cost review included the following key findings:
The independent cost reviewer’s independent estimate of the base case capital expenditure concept design exceeds the cost estimator’s base case estimate by 3.4% but is still within the range of costs that would be anticipated from a competitive tender process.
Total P50 capital expenditure contingency provision equates to 17.9 percent. The expected range for a project at this stage of design is 15-18 percent and is therefore appropriate.
Total P90 capital expenditure contingency provision equates to 26.6 percent. The expected range for a project at this stage of design is 25-40 percent and the P90 contingency provision is therefore within the expected range, though at the lower end of the scale. This is most likely due to the level of detail that has been put into the inherent risk, contingent risk and Agency risk.
The independent cost reviewer noted that a very high level of detail was provided in the O&M modelling given that this project is at the business case stage.
The O&M assumptions that have been made by the cost estimator are based on previous projects and assumed ‘best practice’, which is typically over and above that of VicRoads standards.
A second independent cost review was performed to provide an additional review in relation to the appropriateness of the risk adjusted cost estimate.
The second independent cost review determined that the risk adjusted cost estimate developed by NELA represents a robust measure by which to assess value for money offered by the private sector tenders and the key findings of the review are summarised below:
The scope can likely be delivered within the expected range of variance for the risk adjusted capital cost estimate.
The forecast project completion timing may be achievable, subject to satisfactory resolution of the program issues.
The operating, maintenance and lifecycle costs are appropriate for the scope of work to be undertaken.
Section 3: The North East Link 10—1
10 Economic analysis This chapter presents the findings of the economic analysis prepared for North East Link for the purposes of this business case. The objective of the economic analysis is to assess the project’s impact across economic, social and environmental dimensions, and to provide government and stakeholders with the information they need to make investment decisions for North East Link.
10.1 Approach to economic analysis
10.1.1 General approach
The economic analysis conducted for North East Link has assessed the project’s economic, social and environmental impacts. This holistic approach is envisaged by Victoria’s Transport Integration Act 2010, which explicitly requires transport system decision-makers to adopt a ‘triple bottom line’ perspective.
The main tool that has been used is Cost Benefit Analysis (CBA), which aims to identify and quantify, in monetary terms, all the costs and benefits of the project. As noted in Chapter 8, CBA is a well-established and widely accepted methodology commonly used by governments to not only assess the economic feasibility of a project or initiative, but also to compare it with others.
As described in Chapter 7, the project is expected to provide substantial benefits to road users in the north east by helping to reduce congestion and taking significant amounts of traffic (particularly heavy vehicles) off local roads. This will provide travel time savings across the transport network, as well as reducing vehicle operating costs for road users (including reduced freight costs), which will benefit consumers and businesses.
As described in Chapter 8, the project is also expected to provide substantial wider economic benefits to businesses. By reducing the cost of travel, the project will effectively bring businesses closer together, while also providing them access to a broader labour catchment.
These direct transport and wider economic benefits are a key part of the benefits framework adopted in the CBA for the project. This is consistent with the benefits typically captured in traditional transport CBAs.
The project is also expected to have an impact on Melbourne’s city structure by encouraging households and businesses to locate in areas that will benefit from the accessibility improvements provided by North East Link (see Chapter 8). These induced land use changes can create benefits and costs in addition to standard benefits that are usually included in transport CBAs.
Accordingly, while the project considers a traditional CBA framework to estimate a Benefit Cost Ratio (BCR), it also goes further and uses land use modelling to estimate the land use impacts, as well as the ‘second round’ effects on the transport network, that will be provided by the project. By taking into account this additional source of induced demand that is often omitted from project assessments, this also helps project designers and decision-makers understand the drivers of longer term demand for the project and the surrounding arterial road network and the impacts of these drivers. This approach addresses requirements of infrastructure bodies such as Infrastructure Australia and criticisms of previous assessments by the Victorian Auditor General.
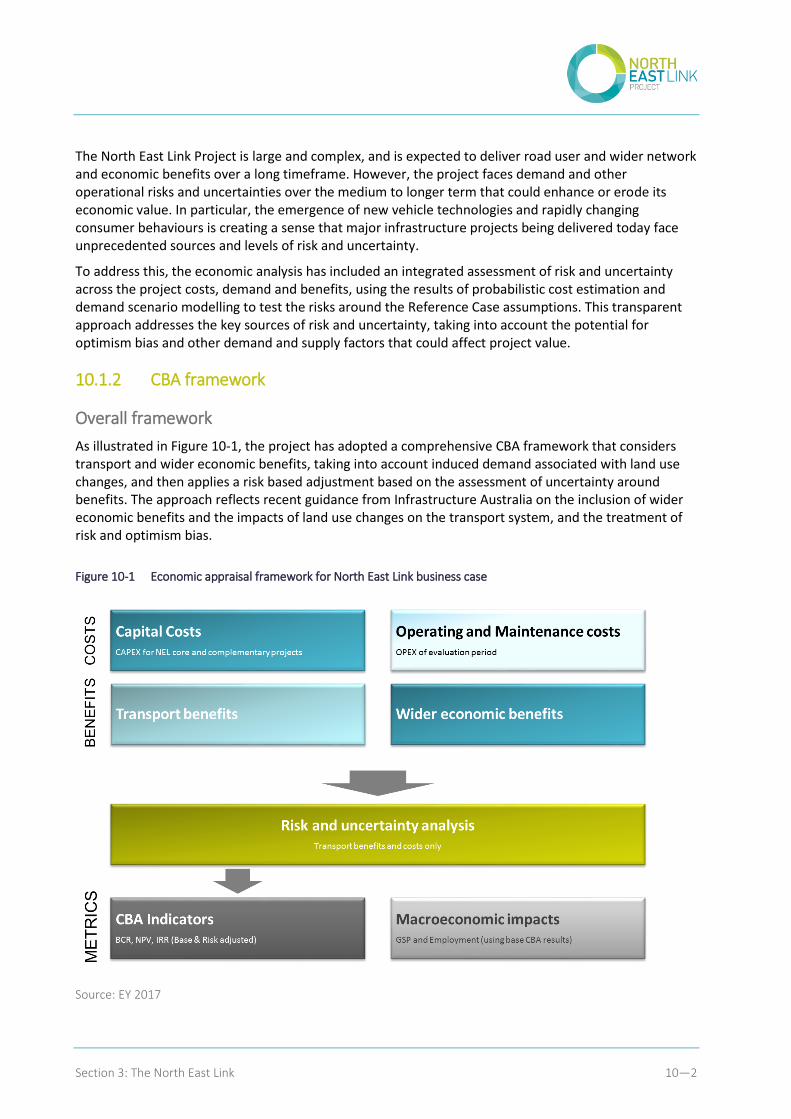
Section 3: The North East Link 10—2
The North East Link Project is large and complex, and is expected to deliver road user and wider network and economic benefits over a long timeframe. However, the project faces demand and other operational risks and uncertainties over the medium to longer term that could enhance or erode its economic value. In particular, the emergence of new vehicle technologies and rapidly changing consumer behaviours is creating a sense that major infrastructure projects being delivered today face unprecedented sources and levels of risk and uncertainty.
To address this, the economic analysis has included an integrated assessment of risk and uncertainty across the project costs, demand and benefits, using the results of probabilistic cost estimation and demand scenario modelling to test the risks around the Reference Case assumptions. This transparent approach addresses the key sources of risk and uncertainty, taking into account the potential for optimism bias and other demand and supply factors that could affect project value.
10.1.2 CBA framework
Overall framework
As illustrated in Figure 10-1, the project has adopted a comprehensive CBA framework that considers transport and wider economic benefits, taking into account induced demand associated with land use changes, and then applies a risk based adjustment based on the assessment of uncertainty around benefits. The approach reflects recent guidance from Infrastructure Australia on the inclusion of wider economic benefits and the impacts of land use changes on the transport system, and the treatment of risk and optimism bias.
Figure 10-1 Economic appraisal framework for North East Link business case
Source: EY 2017
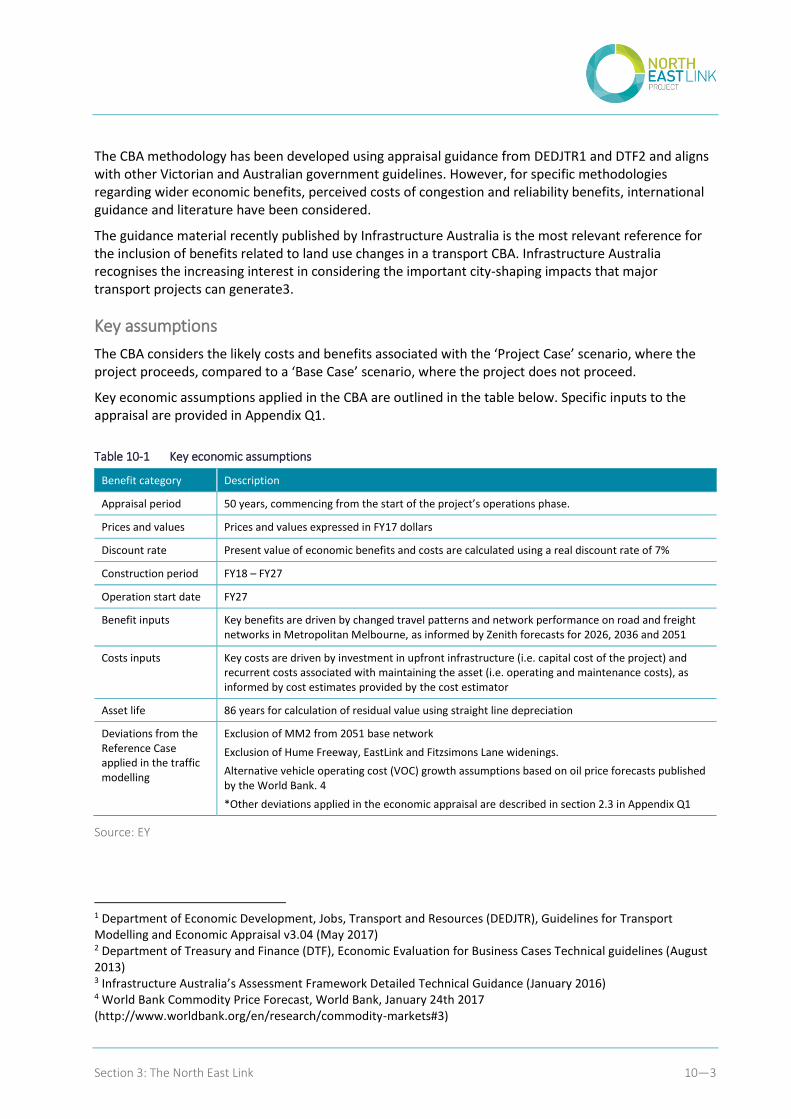
Section 3: The North East Link 10—3
The CBA methodology has been developed using appraisal guidance from DEDJTR1 and DTF2 and aligns with other Victorian and Australian government guidelines. However, for specific methodologies regarding wider economic benefits, perceived costs of congestion and reliability benefits, international guidance and literature have been considered.
The guidance material recently published by Infrastructure Australia is the most relevant reference for the inclusion of benefits related to land use changes in a transport CBA. Infrastructure Australia recognises the increasing interest in considering the important city-shaping impacts that major transport projects can generate3.
Key assumptions
The CBA considers the likely costs and benefits associated with the ‘Project Case’ scenario, where the project proceeds, compared to a ‘Base Case’ scenario, where the project does not proceed.
Key economic assumptions applied in the CBA are outlined in the table below. Specific inputs to the appraisal are provided in Appendix Q1.
Table 10-1 Key economic assumptions
Benefit category Description
Appraisal period 50 years, commencing from the start of the project’s operations phase.
Prices and values Prices and values expressed in FY17 dollars
Discount rate Present value of economic benefits and costs are calculated using a real discount rate of 7%
Construction period FY18 – FY27
Operation start date FY27
Benefit inputs Key benefits are driven by changed travel patterns and network performance on road and freight networks in Metropolitan Melbourne, as informed by Zenith forecasts for 2026, 2036 and 2051
Costs inputs Key costs are driven by investment in upfront infrastructure (i.e. capital cost of the project) and recurrent costs associated with maintaining the asset (i.e. operating and maintenance costs), as informed by cost estimates provided by the cost estimator
Asset life 86 years for calculation of residual value using straight line depreciation
Deviations from the Reference Case applied in the traffic modelling
Exclusion of MM2 from 2051 base network
Exclusion of Hume Freeway, EastLink and Fitzsimons Lane widenings.
Alternative vehicle operating cost (VOC) growth assumptions based on oil price forecasts published by the World Bank. 4
*Other deviations applied in the economic appraisal are described in section 2.3 in Appendix Q1
Source: EY
1 Department of Economic Development, Jobs, Transport and Resources (DEDJTR), Guidelines for Transport Modelling and Economic Appraisal v3.04 (May 2017) 2 Department of Treasury and Finance (DTF), Economic Evaluation for Business Cases Technical guidelines (August 2013) 3 Infrastructure Australia’s Assessment Framework Detailed Technical Guidance (January 2016) 4 World Bank Commodity Price Forecast, World Bank, January 24th 2017 (http://www.worldbank.org/en/research/commodity-markets#3)
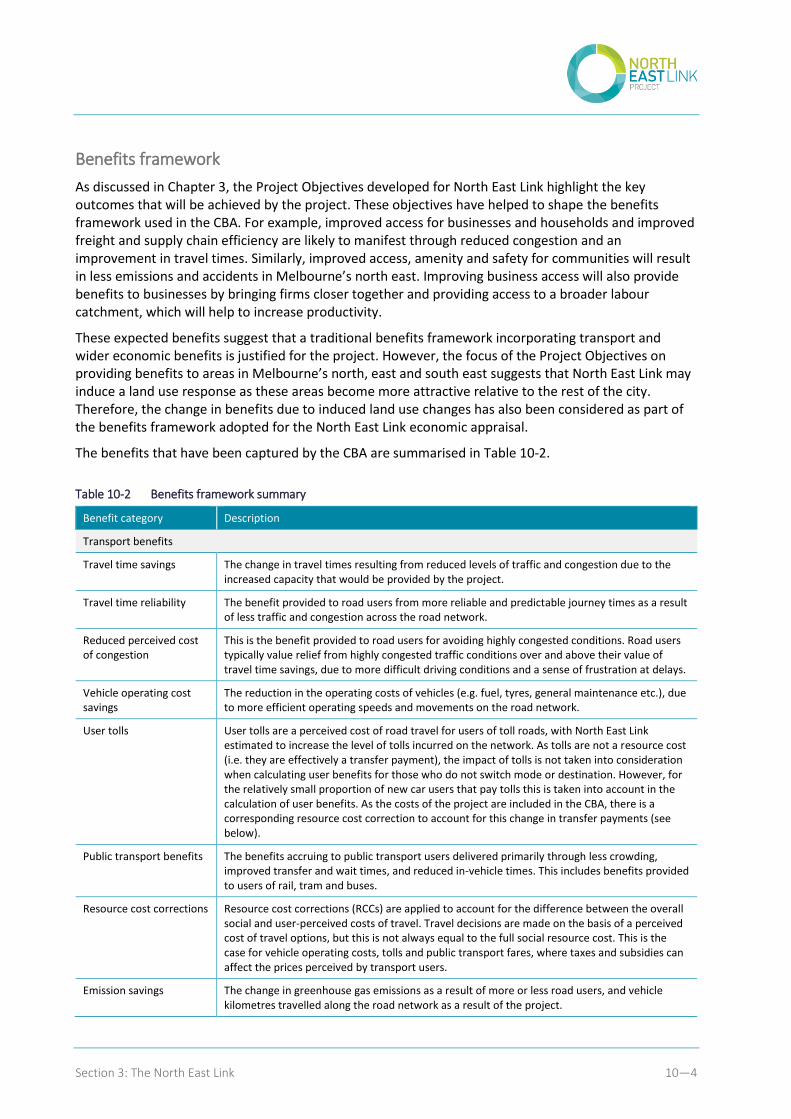
Section 3: The North East Link 10—4
Benefits framework
As discussed in Chapter 3, the Project Objectives developed for North East Link highlight the key outcomes that will be achieved by the project. These objectives have helped to shape the benefits framework used in the CBA. For example, improved access for businesses and households and improved freight and supply chain efficiency are likely to manifest through reduced congestion and an improvement in travel times. Similarly, improved access, amenity and safety for communities will result in less emissions and accidents in Melbourne’s north east. Improving business access will also provide benefits to businesses by bringing firms closer together and providing access to a broader labour catchment, which will help to increase productivity.
These expected benefits suggest that a traditional benefits framework incorporating transport and wider economic benefits is justified for the project. However, the focus of the Project Objectives on providing benefits to areas in Melbourne’s north, east and south east suggests that North East Link may induce a land use response as these areas become more attractive relative to the rest of the city. Therefore, the change in benefits due to induced land use changes has also been considered as part of the benefits framework adopted for the North East Link economic appraisal.
The benefits that have been captured by the CBA are summarised in Table 10-2.
Table 10-2 Benefits framework summary
Benefit category Description
Transport benefits
Travel time savings The change in travel times resulting from reduced levels of traffic and congestion due to the increased capacity that would be provided by the project.
Travel time reliability The benefit provided to road users from more reliable and predictable journey times as a result of less traffic and congestion across the road network.
Reduced perceived cost of congestion
This is the benefit provided to road users for avoiding highly congested conditions. Road users typically value relief from highly congested traffic conditions over and above their value of travel time savings, due to more difficult driving conditions and a sense of frustration at delays.
Vehicle operating cost savings
The reduction in the operating costs of vehicles (e.g. fuel, tyres, general maintenance etc.), due to more efficient operating speeds and movements on the road network.
User tolls User tolls are a perceived cost of road travel for users of toll roads, with North East Link estimated to increase the level of tolls incurred on the network. As tolls are not a resource cost (i.e. they are effectively a transfer payment), the impact of tolls is not taken into consideration when calculating user benefits for those who do not switch mode or destination. However, for the relatively small proportion of new car users that pay tolls this is taken into account in the calculation of user benefits. As the costs of the project are included in the CBA, there is a corresponding resource cost correction to account for this change in transfer payments (see below).
Public transport benefits The benefits accruing to public transport users delivered primarily through less crowding, improved transfer and wait times, and reduced in-vehicle times. This includes benefits provided to users of rail, tram and buses.
Resource cost corrections Resource cost corrections (RCCs) are applied to account for the difference between the overall social and user-perceived costs of travel. Travel decisions are made on the basis of a perceived cost of travel options, but this is not always equal to the full social resource cost. This is the case for vehicle operating costs, tolls and public transport fares, where taxes and subsidies can affect the prices perceived by transport users.
Emission savings The change in greenhouse gas emissions as a result of more or less road users, and vehicle kilometres travelled along the road network as a result of the project.
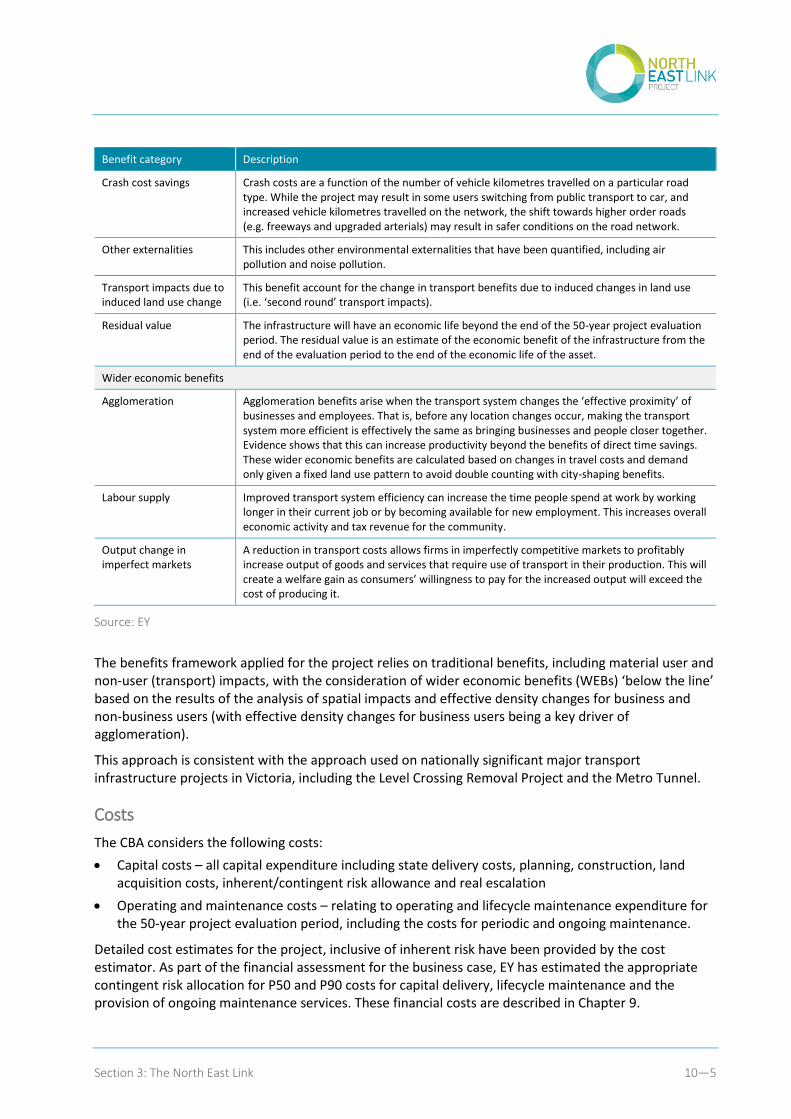
Section 3: The North East Link 10—5
Benefit category Description
Crash cost savings Crash costs are a function of the number of vehicle kilometres travelled on a particular road type. While the project may result in some users switching from public transport to car, and increased vehicle kilometres travelled on the network, the shift towards higher order roads (e.g. freeways and upgraded arterials) may result in safer conditions on the road network.
Other externalities This includes other environmental externalities that have been quantified, including air pollution and noise pollution.
Transport impacts due to induced land use change
This benefit account for the change in transport benefits due to induced changes in land use (i.e. ‘second round’ transport impacts).
Residual value The infrastructure will have an economic life beyond the end of the 50-year project evaluation period. The residual value is an estimate of the economic benefit of the infrastructure from the end of the evaluation period to the end of the economic life of the asset.
Wider economic benefits
Agglomeration Agglomeration benefits arise when the transport system changes the ‘effective proximity’ of businesses and employees. That is, before any location changes occur, making the transport system more efficient is effectively the same as bringing businesses and people closer together. Evidence shows that this can increase productivity beyond the benefits of direct time savings. These wider economic benefits are calculated based on changes in travel costs and demand only given a fixed land use pattern to avoid double counting with city-shaping benefits.
Labour supply Improved transport system efficiency can increase the time people spend at work by working longer in their current job or by becoming available for new employment. This increases overall economic activity and tax revenue for the community.
Output change in imperfect markets
A reduction in transport costs allows firms in imperfectly competitive markets to profitably increase output of goods and services that require use of transport in their production. This will create a welfare gain as consumers’ willingness to pay for the increased output will exceed the cost of producing it.
Source: EY
The benefits framework applied for the project relies on traditional benefits, including material user and non-user (transport) impacts, with the consideration of wider economic benefits (WEBs) ‘below the line’ based on the results of the analysis of spatial impacts and effective density changes for business and non-business users (with effective density changes for business users being a key driver of agglomeration).
This approach is consistent with the approach used on nationally significant major transport infrastructure projects in Victoria, including the Level Crossing Removal Project and the Metro Tunnel.
Costs
The CBA considers the following costs:
Capital costs – all capital expenditure including state delivery costs, planning, construction, land acquisition costs, inherent/contingent risk allowance and real escalation
Operating and maintenance costs – relating to operating and lifecycle maintenance expenditure for the 50-year project evaluation period, including the costs for periodic and ongoing maintenance.
Detailed cost estimates for the project, inclusive of inherent risk have been provided by the cost estimator. As part of the financial assessment for the business case, EY has estimated the appropriate contingent risk allocation for P50 and P90 costs for capital delivery, lifecycle maintenance and the provision of ongoing maintenance services. These financial costs are described in Chapter 9.
Section 3: The North East Link 10—6
P50 costs are generally considered the appropriate level for inclusion in a CBA. This is because the P50 estimate, as the central value, should be the closest to the expected cost, just as the benefits estimate is a central, best estimate (the alternative P90 value is the estimate of the project cost based on a 90 percent probability that the cost will not be exceeded). The difference between a P50 and a P90 cost essentially relates to different levels of risk and escalation from the application of a full quantitative risk assessment.
It is important to note that while the costs used for purposes of the economic appraisal are based on the same costs presented as part of the financial assessment, the economic costs are presented as real values that have been adjusted from the nominal costs to remove the effects of inflation over time. The financial assessment presents the costs of the project as nominal values that retain the effects of inflation over time.
Therefore, the nominal cash flows as presented in the financial assessment of the project, have been adjusted to account for inflation (assumed to be 2.5 percent per annum) to calculate the real costs of the project, while also excluding profit margin (as it is perceived as a transfer) and any sunk costs that will have already been incurred prior to the investment decision being made (in accordance with ATAP guidelines).
The real costs of the project have then been discounted at seven percent to obtain the present value cost used for the CBA.
Risk and uncertainty
North East Link is a large and complex project that will deliver road user and wider network and economic benefits over a long timeframe.
As noted in section 10.1.1, there is a sense that major infrastructure projects being delivered today face unprecedented sources and levels of risk and uncertainty. This suggests that, in addition to construction and other short-term delivery risks, the project may face a range of demand and other operational risks and uncertainties over the medium to longer term.
To address this, an assessment of risk and uncertainty has been included to add robustness to the economic appraisal. Different demand and benefit scenarios and sensitivity tests have been modelled in Zenith and the CBA to assess the potential impact of the key drivers of uncertainty, complementing the risk modelling that has been applied to the project costs.
The base demand and benefits scenario reflects the application of the DEDJTR Reference Case assumptions and alternative assumptions for VOC growth, public transport and road networks as outlined in Table 10-1.
The following areas have been identified for analysis within the uncertainty framework:
Population and employment change
Autonomous vehicles
Trip demand (behavioural change)
Induced demand profile (lag-effects)
Real income levels
Cost of travel
Practical road capacity
Trip lengths
Section 3: The North East Link 10—7
Public transport constraints
Demand for business travel.
The approach to the uncertainty analysis is based on identifying key uncertainty drivers and modelling alternative low/high scenarios for comparison with the base scenario. These alternate scenarios and the drivers of uncertainty are described in section 10.2.4.
An assessment of potential likelihood is then used to fit a log-normally distributed probability function to the range of results. Monte Carlo simulations that integrate the probabilistic project cost estimates are then undertaken to create a distribution of possible outcomes for benefits, costs and the benefit cost ratio.
Real options
Real options are another important consideration when assessing the economic value of major infrastructure projects.
Government investment decisions are typically undertaken within a dynamic and complex operational and political environment. This investment environment generates significant longer term risks and uncertainties that can have a material impact on project benefits and returns; at the extreme, it can lead to instances of ‘investment regret’.
While construction costs are subjected to a detailed risk assessment in the development of probabilistic (P50/P90) estimates, there has been less of a focus on considering the longer term risks and uncertainties and building these into investment decision-making. Generally, the current approach relies on limited and often inflexible forecasting frameworks for understanding a project’s long-term operational drivers and risks, resulting in a ‘fixed’ or ‘linear’ approach to project delivery.
The risk and uncertainty analysis included in the economic appraisal for the North East Link Project addresses this issue to some extent. However, the consideration of ‘real options’ goes further by seeking to embed flexibility into the design and delivery of projects to manage and respond to uncertainties. Real options provide investors in a physical asset with the right to undertake initiatives or actions to optimise the investment over its lifetime (and minimise the risk of investment regret). As such, typical real options include measures such as staging, re-sizing and ‘future proofing’ some or all of a project’s scope.
DTF guidelines currently stipulate that real options should be considered initially during the development of the business case and developed in more detail as part of the procurement phase, when they may potentially be built into tender and contract documentation.
The consideration of potential real options for the North East Link Project has leveraged the risk and uncertainty identification and analysis that is being undertaken to inform the demand modelling and cost-benefit analysis. After selecting key uncertainties to form the basis of the real options analysis, a range of real options have been identified and discussed in this chapter.
These options will be considered as part of the detailed design stage and included in the commercial analysis that will be undertaken as part of the delivery of the project (subject to a funding decision by the Victorian Government).
Section 3: The North East Link 10—8
CBA measures
The following economic performance measures have been calculated to estimate the economic viability of the project:
Benefit Cost Ratio (BCR) – a measure of the magnitude of net benefit to society derived from the capital investment in the project, as equal to the present value of benefits minus operating costs, divided by the present value of capital costs. A BCR greater than 1.0 indicates that quantified project benefits exceed project costs. However, projects with BCRs less than 1.0 may have net benefits if some of the benefits cannot be fully captured and monetised within a CBA framework. Such projects may still be considered on the basis that CBA is one of a number of considerations for decision-makers.
Net Present Value (NPV) – the difference between the present value of total incremental benefits and the present value of the total incremental costs, which allows comparison of options on the same basis and determination of the greatest net benefit to the community or the most efficient use of resources. A positive NPV indicates that the (discounted) incremental benefits of a scenario exceed the incremental costs over the evaluation period.
Internal Rate of Return (IRR) – the discount rate at which the present value of costs equals the present value of benefits (i.e. the breakeven point)
Analysis of the results has considered the above metrics using only the standard transport benefits in the CBA (without WEBs) as the primary measures of economic viability. The same metrics calculated inclusive of transport benefits, WEBs and land-use benefits provide a secondary measure of viability.
10.2 Cost benefit analysis
This section provides an overview of the economic costs and benefits of the project, and highlights the key results from the CBA.
10.2.1 Economic costs
As previously mentioned, the risk adjusted nominal cash flows presented in the financial assessment of the project, have been adjusted to account for inflation (assumed to be 2.5 percent per annum) to calculate the real costs of the project, and to also exclude any sunk costs that will have already been incurred prior to the investment decision being made (in accordance with ATAP guidelines).
Undertaking CBA requires the comparison of monetised economic costs and benefits that are realised over different timeframes. For North East Link (like many transport projects) this involves comparing large upfront capital expenditures with a much larger total stream of economic benefits over the appraisal horizon (i.e. 50 years after opening). Discounting future cost and benefit profiles to their present values enables a like-for-like comparison of future costs and benefits in determining the net present value of a project and the calculation of the benefit-cost ratio. The real costs of the project have therefore been discounted at seven percent real to obtain the present value cost used for the CBA.
While recognising the importance of these adjustments for the purposes of the CBA, it is important to note that the actual (nominal) cost of delivering the project does not change.
The table below summarises the economic cost adjustments made using P50 cost estimates.
Redacted – commercial-in-confidence
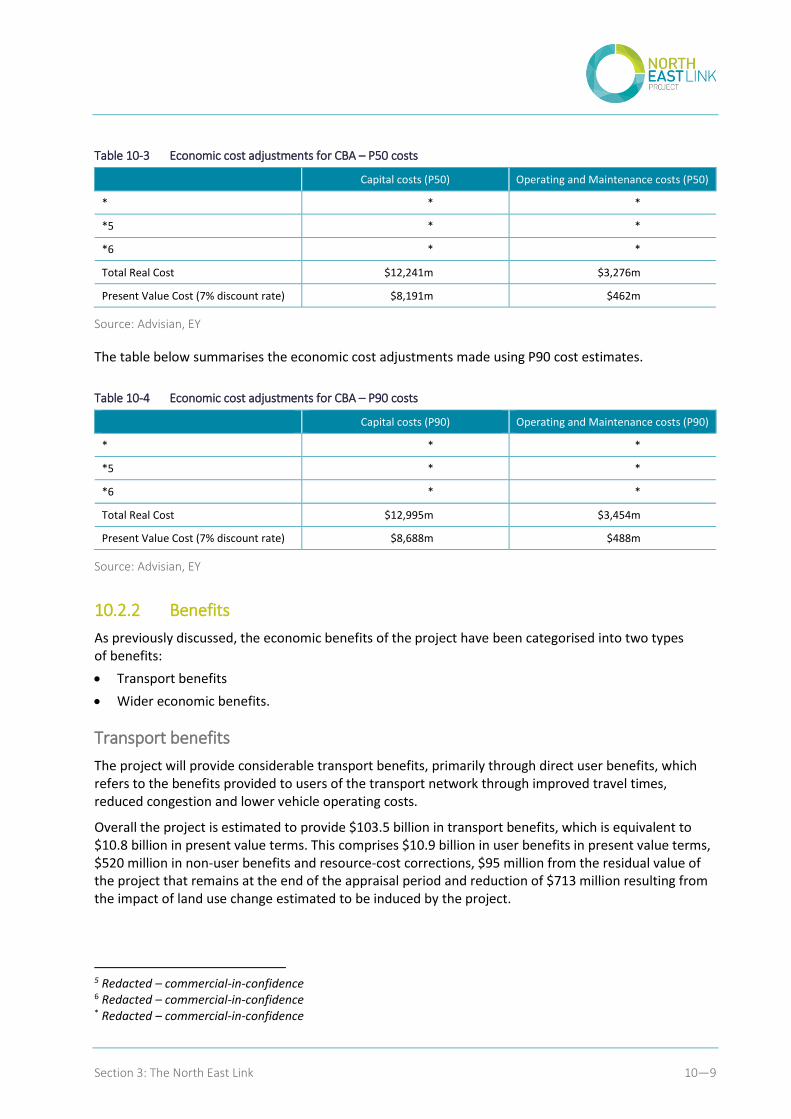
Section 3: The North East Link 10—9
Table 10-3 Economic cost adjustments for CBA – P50 costs
Capital costs (P50) Operating and Maintenance costs (P50)
* * *
*5 * *
*6 * *
Total Real Cost $12,241m $3,276m
Present Value Cost (7% discount rate) $8,191m $462m
Source: Advisian, EY
The table below summarises the economic cost adjustments made using P90 cost estimates.
Table 10-4 Economic cost adjustments for CBA – P90 costs
Capital costs (P90) Operating and Maintenance costs (P90)
* * *
*5 * *
*6 * *
Total Real Cost $12,995m $3,454m
Present Value Cost (7% discount rate) $8,688m $488m
Source: Advisian, EY
10.2.2 Benefits
As previously discussed, the economic benefits of the project have been categorised into two types of benefits:
Transport benefits
Wider economic benefits.
Transport benefits
The project will provide considerable transport benefits, primarily through direct user benefits, which refers to the benefits provided to users of the transport network through improved travel times, reduced congestion and lower vehicle operating costs.
Overall the project is estimated to provide $103.5 billion in transport benefits, which is equivalent to $10.8 billion in present value terms. This comprises $10.9 billion in user benefits in present value terms, $520 million in non-user benefits and resource-cost corrections, $95 million from the residual value of the project that remains at the end of the appraisal period and reduction of $713 million resulting from the impact of land use change estimated to be induced by the project.
5 Redacted – commercial-in-confidence 6 Redacted – commercial-in-confidence * Redacted – commercial-in-confidence
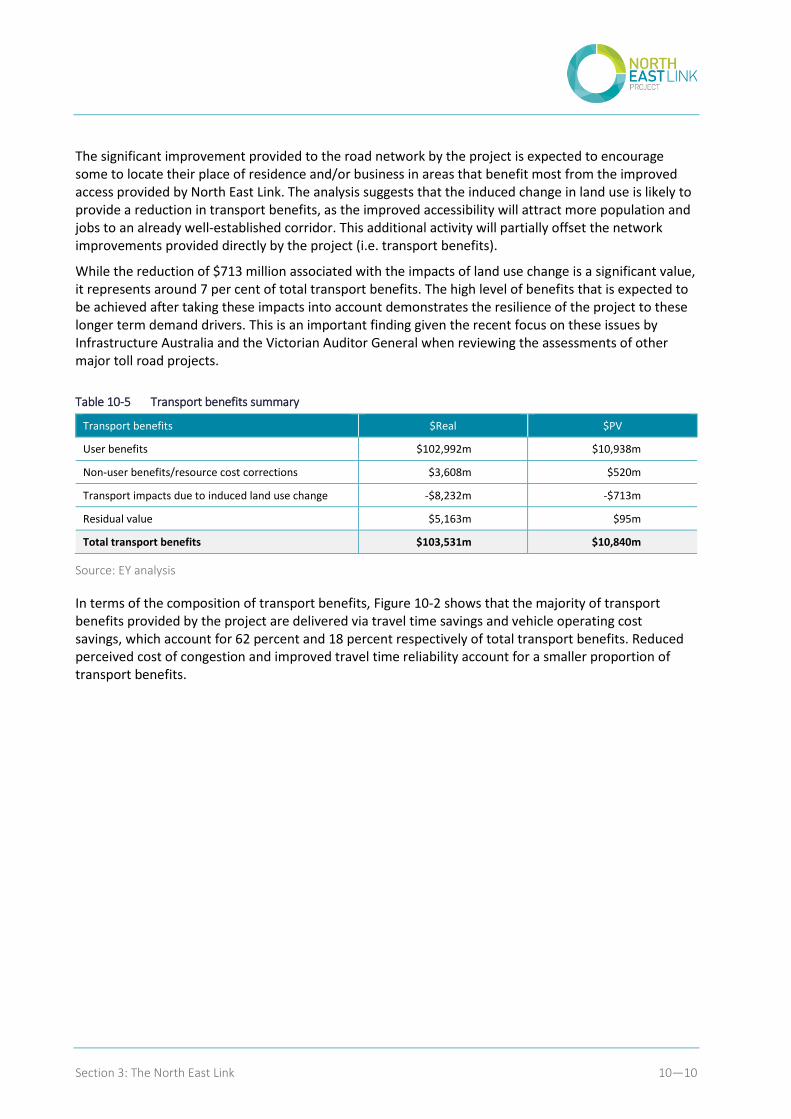
Section 3: The North East Link 10—10
The significant improvement provided to the road network by the project is expected to encourage some to locate their place of residence and/or business in areas that benefit most from the improved access provided by North East Link. The analysis suggests that the induced change in land use is likely to provide a reduction in transport benefits, as the improved accessibility will attract more population and jobs to an already well-established corridor. This additional activity will partially offset the network improvements provided directly by the project (i.e. transport benefits).
While the reduction of $713 million associated with the impacts of land use change is a significant value, it represents around 7 per cent of total transport benefits. The high level of benefits that is expected to be achieved after taking these impacts into account demonstrates the resilience of the project to these longer term demand drivers. This is an important finding given the recent focus on these issues by Infrastructure Australia and the Victorian Auditor General when reviewing the assessments of other major toll road projects.
Table 10-5 Transport benefits summary
Transport benefits $Real $PV
User benefits $102,992m $10,938m
Non-user benefits/resource cost corrections $3,608m $520m
Transport impacts due to induced land use change -$8,232m -$713m
Residual value $5,163m $95m
Total transport benefits $103,531m $10,840m
Source: EY analysis
In terms of the composition of transport benefits, Figure 10-2 shows that the majority of transport benefits provided by the project are delivered via travel time savings and vehicle operating cost savings, which account for 62 percent and 18 percent respectively of total transport benefits. Reduced perceived cost of congestion and improved travel time reliability account for a smaller proportion of transport benefits.
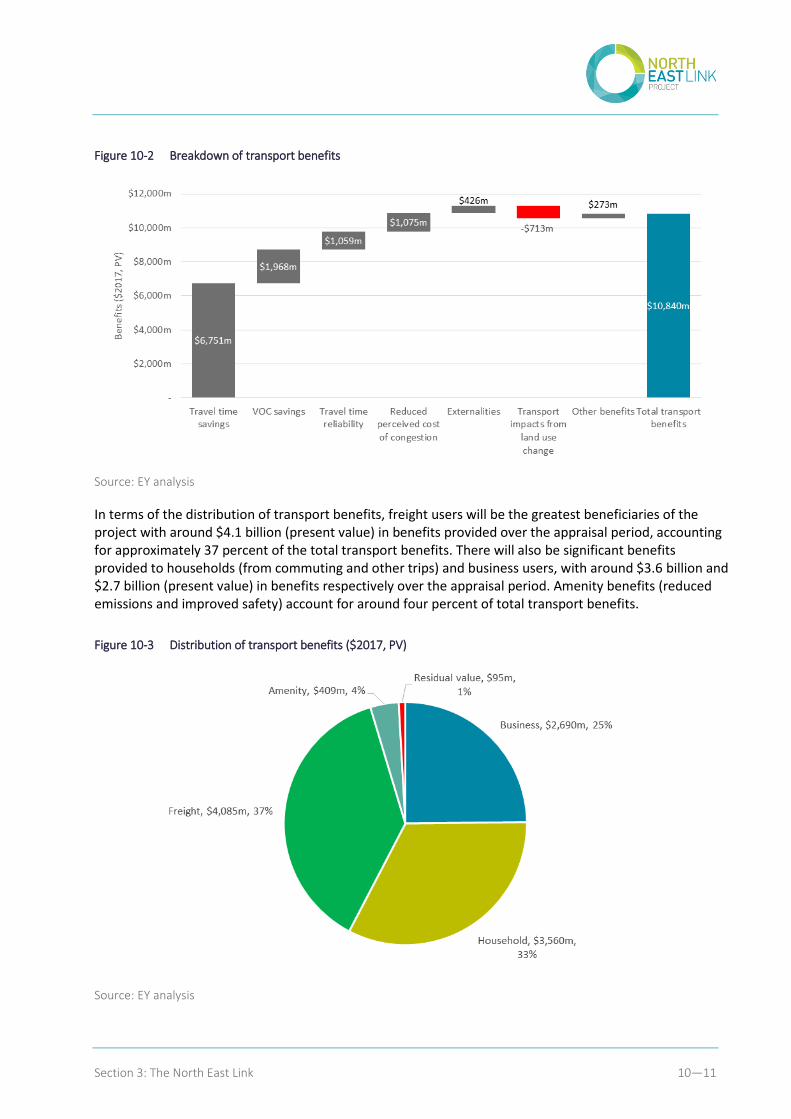
Section 3: The North East Link 10—11
Figure 10-2 Breakdown of transport benefits
Source: EY analysis
In terms of the distribution of transport benefits, freight users will be the greatest beneficiaries of the project with around $4.1 billion (present value) in benefits provided over the appraisal period, accounting for approximately 37 percent of the total transport benefits. There will also be significant benefits provided to households (from commuting and other trips) and business users, with around $3.6 billion and $2.7 billion (present value) in benefits respectively over the appraisal period. Amenity benefits (reduced emissions and improved safety) account for around four percent of total transport benefits.
Figure 10-3 Distribution of transport benefits ($2017, PV)
Source: EY analysis
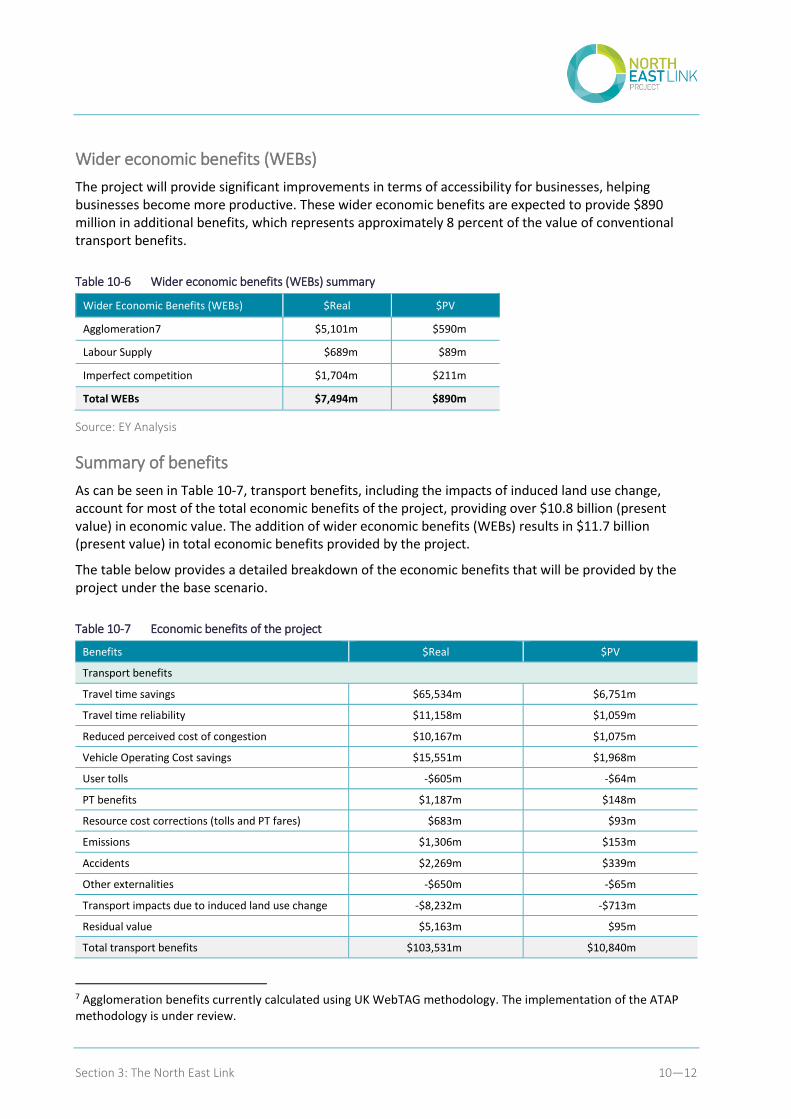
Section 3: The North East Link 10—12
Wider economic benefits (WEBs)
The project will provide significant improvements in terms of accessibility for businesses, helping businesses become more productive. These wider economic benefits are expected to provide $890 million in additional benefits, which represents approximately 8 percent of the value of conventional transport benefits.
Table 10-6 Wider economic benefits (WEBs) summary
Wider Economic Benefits (WEBs) $Real $PV
Agglomeration7 $5,101m $590m
Labour Supply $689m $89m
Imperfect competition $1,704m $211m
Total WEBs $7,494m $890m
Source: EY Analysis
Summary of benefits
As can be seen in Table 10-7, transport benefits, including the impacts of induced land use change, account for most of the total economic benefits of the project, providing over $10.8 billion (present value) in economic value. The addition of wider economic benefits (WEBs) results in $11.7 billion (present value) in total economic benefits provided by the project.
The table below provides a detailed breakdown of the economic benefits that will be provided by the project under the base scenario.
Table 10-7 Economic benefits of the project
Benefits $Real $PV
Transport benefits
Travel time savings $65,534m $6,751m
Travel time reliability $11,158m $1,059m
Reduced perceived cost of congestion $10,167m $1,075m
Vehicle Operating Cost savings $15,551m $1,968m
User tolls -$605m -$64m
PT benefits $1,187m $148m
Resource cost corrections (tolls and PT fares) $683m $93m
Emissions $1,306m $153m
Accidents $2,269m $339m
Other externalities -$650m -$65m
Transport impacts due to induced land use change -$8,232m -$713m
Residual value $5,163m $95m
Total transport benefits $103,531m $10,840m
7 Agglomeration benefits currently calculated using UK WebTAG methodology. The implementation of the ATAP methodology is under review.
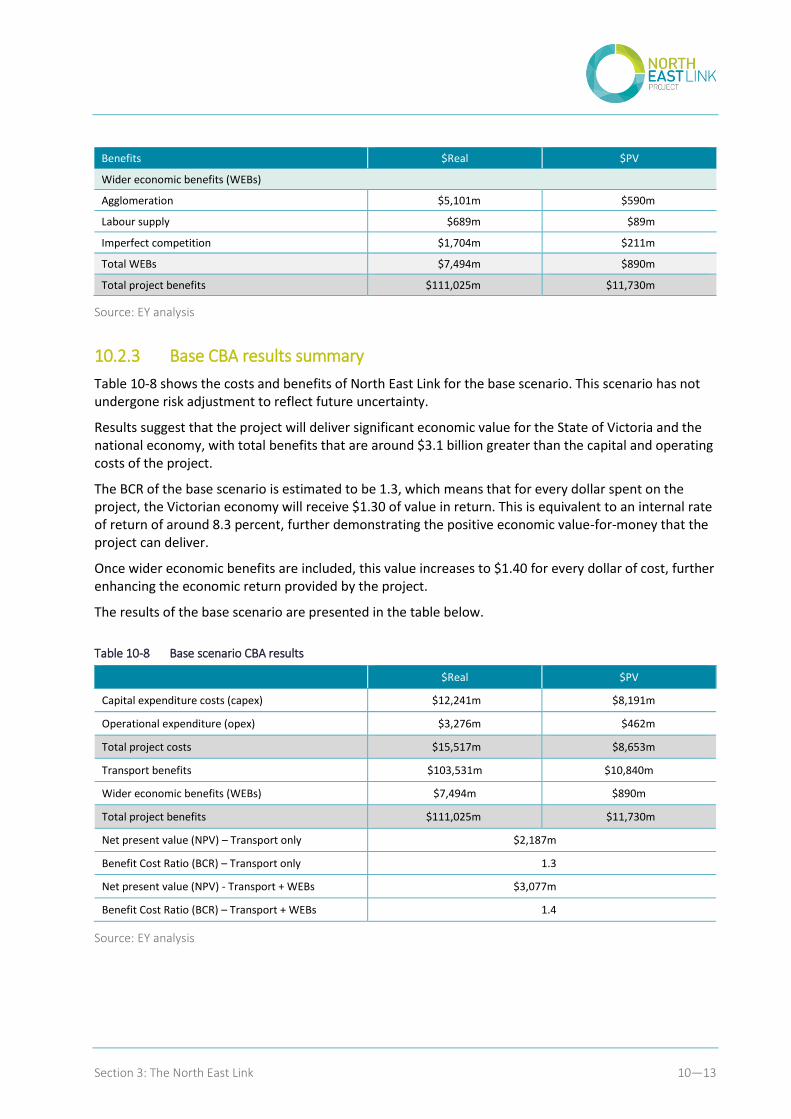
Section 3: The North East Link 10—13
Benefits $Real $PV
Wider economic benefits (WEBs)
Agglomeration $5,101m $590m
Labour supply $689m $89m
Imperfect competition $1,704m $211m
Total WEBs $7,494m $890m
Total project benefits $111,025m $11,730m
Source: EY analysis
10.2.3 Base CBA results summary
Table 10-8 shows the costs and benefits of North East Link for the base scenario. This scenario has not undergone risk adjustment to reflect future uncertainty.
Results suggest that the project will deliver significant economic value for the State of Victoria and the national economy, with total benefits that are around $3.1 billion greater than the capital and operating costs of the project.
The BCR of the base scenario is estimated to be 1.3, which means that for every dollar spent on the project, the Victorian economy will receive $1.30 of value in return. This is equivalent to an internal rate of return of around 8.3 percent, further demonstrating the positive economic value-for-money that the project can deliver.
Once wider economic benefits are included, this value increases to $1.40 for every dollar of cost, further enhancing the economic return provided by the project.
The results of the base scenario are presented in the table below.
Table 10-8 Base scenario CBA results
$Real $PV
Capital expenditure costs (capex) $12,241m $8,191m
Operational expenditure (opex) $3,276m $462m
Total project costs $15,517m $8,653m
Transport benefits $103,531m $10,840m
Wider economic benefits (WEBs) $7,494m $890m
Total project benefits $111,025m $11,730m
Net present value (NPV) – Transport only $2,187m
Benefit Cost Ratio (BCR) – Transport only 1.3
Net present value (NPV) - Transport + WEBs $3,077m
Benefit Cost Ratio (BCR) – Transport + WEBs 1.4
Source: EY analysis
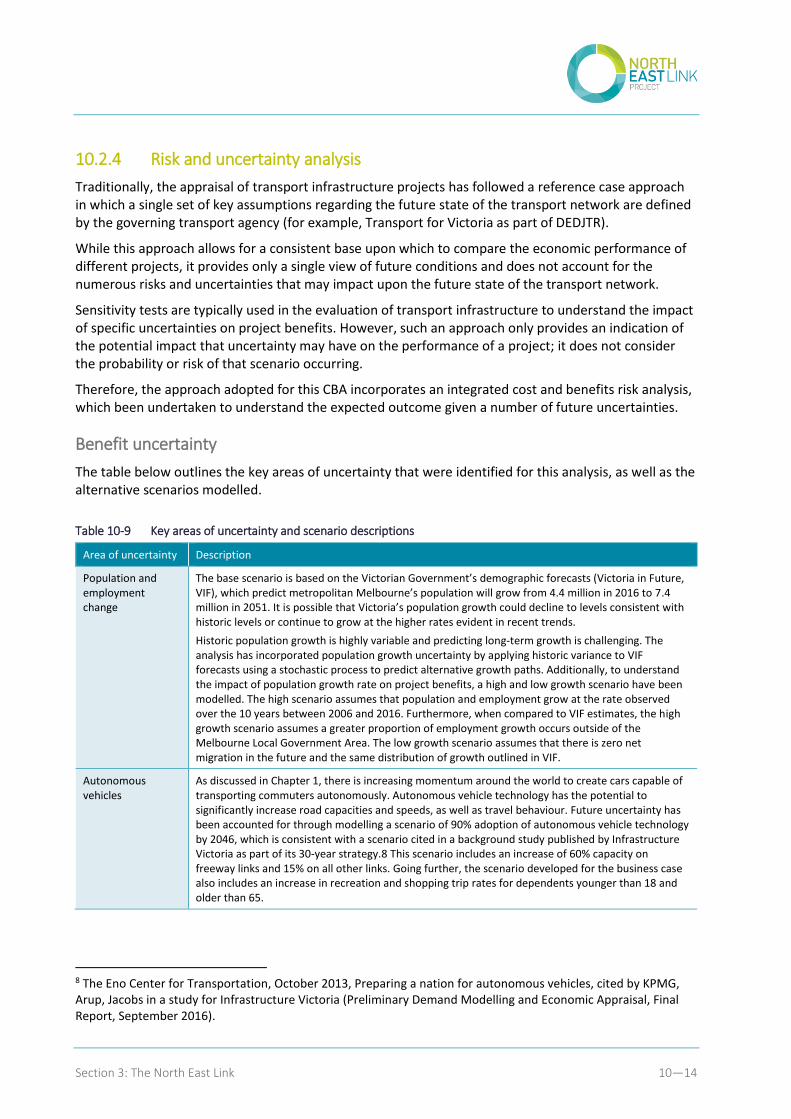
Section 3: The North East Link 10—14
10.2.4 Risk and uncertainty analysis
Traditionally, the appraisal of transport infrastructure projects has followed a reference case approach in which a single set of key assumptions regarding the future state of the transport network are defined by the governing transport agency (for example, Transport for Victoria as part of DEDJTR).
While this approach allows for a consistent base upon which to compare the economic performance of different projects, it provides only a single view of future conditions and does not account for the numerous risks and uncertainties that may impact upon the future state of the transport network.
Sensitivity tests are typically used in the evaluation of transport infrastructure to understand the impact of specific uncertainties on project benefits. However, such an approach only provides an indication of the potential impact that uncertainty may have on the performance of a project; it does not consider the probability or risk of that scenario occurring.
Therefore, the approach adopted for this CBA incorporates an integrated cost and benefits risk analysis, which been undertaken to understand the expected outcome given a number of future uncertainties.
Benefit uncertainty
The table below outlines the key areas of uncertainty that were identified for this analysis, as well as the alternative scenarios modelled.
Table 10-9 Key areas of uncertainty and scenario descriptions
Area of uncertainty Description
Population and employment change
The base scenario is based on the Victorian Government’s demographic forecasts (Victoria in Future, VIF), which predict metropolitan Melbourne’s population will grow from 4.4 million in 2016 to 7.4 million in 2051. It is possible that Victoria’s population growth could decline to levels consistent with historic levels or continue to grow at the higher rates evident in recent trends.
Historic population growth is highly variable and predicting long-term growth is challenging. The analysis has incorporated population growth uncertainty by applying historic variance to VIF forecasts using a stochastic process to predict alternative growth paths. Additionally, to understand the impact of population growth rate on project benefits, a high and low growth scenario have been modelled. The high scenario assumes that population and employment grow at the rate observed over the 10 years between 2006 and 2016. Furthermore, when compared to VIF estimates, the high growth scenario assumes a greater proportion of employment growth occurs outside of the Melbourne Local Government Area. The low growth scenario assumes that there is zero net migration in the future and the same distribution of growth outlined in VIF.
Autonomous vehicles
As discussed in Chapter 1, there is increasing momentum around the world to create cars capable of transporting commuters autonomously. Autonomous vehicle technology has the potential to significantly increase road capacities and speeds, as well as travel behaviour. Future uncertainty has been accounted for through modelling a scenario of 90% adoption of autonomous vehicle technology by 2046, which is consistent with a scenario cited in a background study published by Infrastructure Victoria as part of its 30-year strategy.8 This scenario includes an increase of 60% capacity on freeway links and 15% on all other links. Going further, the scenario developed for the business case also includes an increase in recreation and shopping trip rates for dependents younger than 18 and older than 65.
8 The Eno Center for Transportation, October 2013, Preparing a nation for autonomous vehicles, cited by KPMG, Arup, Jacobs in a study for Infrastructure Victoria (Preliminary Demand Modelling and Economic Appraisal, Final Report, September 2016).
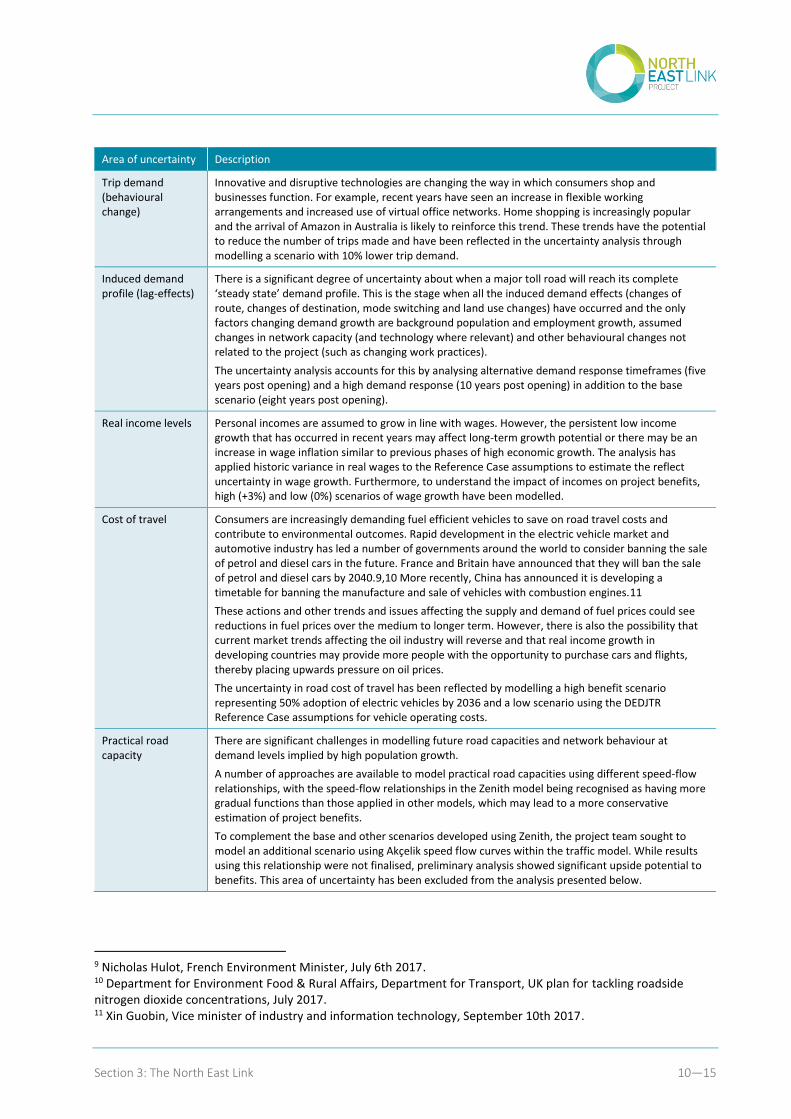
Section 3: The North East Link 10—15
Area of uncertainty Description
Trip demand (behavioural change)
Innovative and disruptive technologies are changing the way in which consumers shop and businesses function. For example, recent years have seen an increase in flexible working arrangements and increased use of virtual office networks. Home shopping is increasingly popular and the arrival of Amazon in Australia is likely to reinforce this trend. These trends have the potential to reduce the number of trips made and have been reflected in the uncertainty analysis through modelling a scenario with 10% lower trip demand.
Induced demand profile (lag-effects)
There is a significant degree of uncertainty about when a major toll road will reach its complete ‘steady state’ demand profile. This is the stage when all the induced demand effects (changes of route, changes of destination, mode switching and land use changes) have occurred and the only factors changing demand growth are background population and employment growth, assumed changes in network capacity (and technology where relevant) and other behavioural changes not related to the project (such as changing work practices).
The uncertainty analysis accounts for this by analysing alternative demand response timeframes (five years post opening) and a high demand response (10 years post opening) in addition to the base scenario (eight years post opening).
Real income levels Personal incomes are assumed to grow in line with wages. However, the persistent low income growth that has occurred in recent years may affect long-term growth potential or there may be an increase in wage inflation similar to previous phases of high economic growth. The analysis has applied historic variance in real wages to the Reference Case assumptions to estimate the reflect uncertainty in wage growth. Furthermore, to understand the impact of incomes on project benefits, high (+3%) and low (0%) scenarios of wage growth have been modelled.
Cost of travel Consumers are increasingly demanding fuel efficient vehicles to save on road travel costs and contribute to environmental outcomes. Rapid development in the electric vehicle market and automotive industry has led a number of governments around the world to consider banning the sale of petrol and diesel cars in the future. France and Britain have announced that they will ban the sale of petrol and diesel cars by 2040.9,10 More recently, China has announced it is developing a timetable for banning the manufacture and sale of vehicles with combustion engines.11
These actions and other trends and issues affecting the supply and demand of fuel prices could see reductions in fuel prices over the medium to longer term. However, there is also the possibility that current market trends affecting the oil industry will reverse and that real income growth in developing countries may provide more people with the opportunity to purchase cars and flights, thereby placing upwards pressure on oil prices.
The uncertainty in road cost of travel has been reflected by modelling a high benefit scenario representing 50% adoption of electric vehicles by 2036 and a low scenario using the DEDJTR Reference Case assumptions for vehicle operating costs.
Practical road capacity
There are significant challenges in modelling future road capacities and network behaviour at demand levels implied by high population growth.
A number of approaches are available to model practical road capacities using different speed-flow relationships, with the speed-flow relationships in the Zenith model being recognised as having more gradual functions than those applied in other models, which may lead to a more conservative estimation of project benefits.
To complement the base and other scenarios developed using Zenith, the project team sought to model an additional scenario using Akçelik speed flow curves within the traffic model. While results using this relationship were not finalised, preliminary analysis showed significant upside potential to benefits. This area of uncertainty has been excluded from the analysis presented below.
9 Nicholas Hulot, French Environment Minister, July 6th 2017. 10 Department for Environment Food & Rural Affairs, Department for Transport, UK plan for tackling roadside nitrogen dioxide concentrations, July 2017. 11 Xin Guobin, Vice minister of industry and information technology, September 10th 2017.
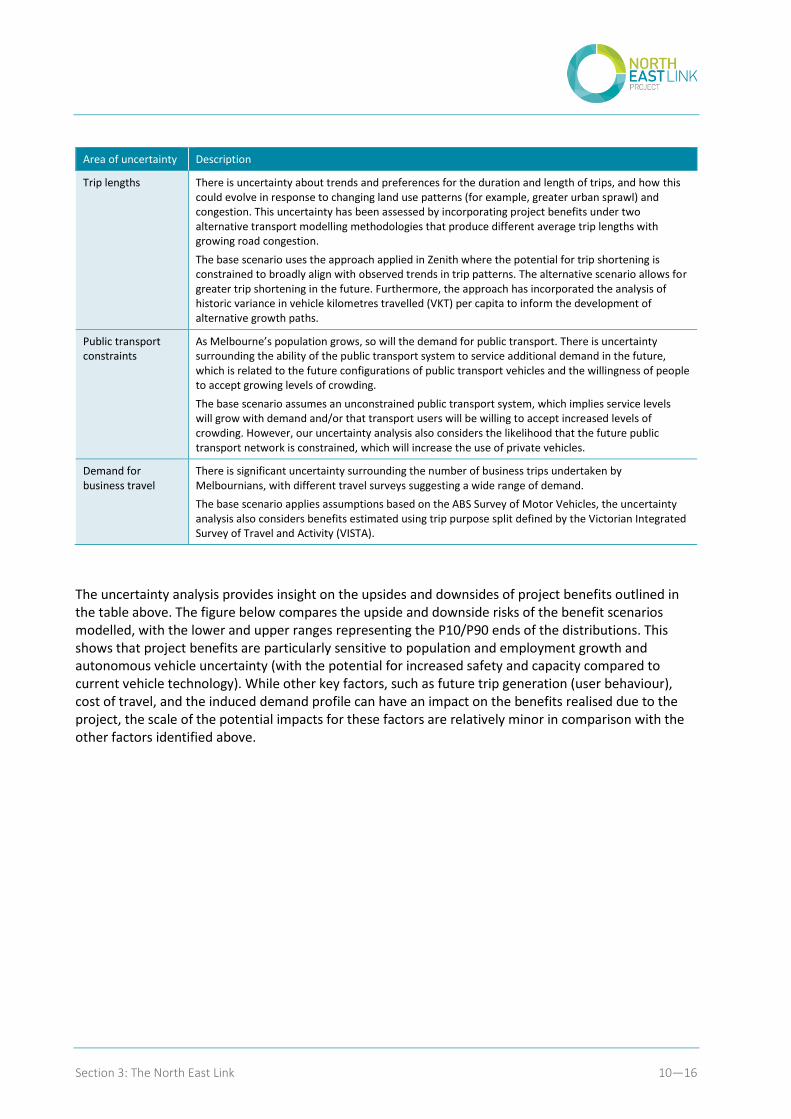
Section 3: The North East Link 10—16
Area of uncertainty Description
Trip lengths There is uncertainty about trends and preferences for the duration and length of trips, and how this could evolve in response to changing land use patterns (for example, greater urban sprawl) and congestion. This uncertainty has been assessed by incorporating project benefits under two alternative transport modelling methodologies that produce different average trip lengths with growing road congestion.
The base scenario uses the approach applied in Zenith where the potential for trip shortening is constrained to broadly align with observed trends in trip patterns. The alternative scenario allows for greater trip shortening in the future. Furthermore, the approach has incorporated the analysis of historic variance in vehicle kilometres travelled (VKT) per capita to inform the development of alternative growth paths.
Public transport constraints
As Melbourne’s population grows, so will the demand for public transport. There is uncertainty surrounding the ability of the public transport system to service additional demand in the future, which is related to the future configurations of public transport vehicles and the willingness of people to accept growing levels of crowding.
The base scenario assumes an unconstrained public transport system, which implies service levels will grow with demand and/or that transport users will be willing to accept increased levels of crowding. However, our uncertainty analysis also considers the likelihood that the future public transport network is constrained, which will increase the use of private vehicles.
Demand for business travel
There is significant uncertainty surrounding the number of business trips undertaken by Melbournians, with different travel surveys suggesting a wide range of demand.
The base scenario applies assumptions based on the ABS Survey of Motor Vehicles, the uncertainty analysis also considers benefits estimated using trip purpose split defined by the Victorian Integrated Survey of Travel and Activity (VISTA).
The uncertainty analysis provides insight on the upsides and downsides of project benefits outlined in the table above. The figure below compares the upside and downside risks of the benefit scenarios modelled, with the lower and upper ranges representing the P10/P90 ends of the distributions. This shows that project benefits are particularly sensitive to population and employment growth and autonomous vehicle uncertainty (with the potential for increased safety and capacity compared to current vehicle technology). While other key factors, such as future trip generation (user behaviour), cost of travel, and the induced demand profile can have an impact on the benefits realised due to the project, the scale of the potential impacts for these factors are relatively minor in comparison with the other factors identified above.
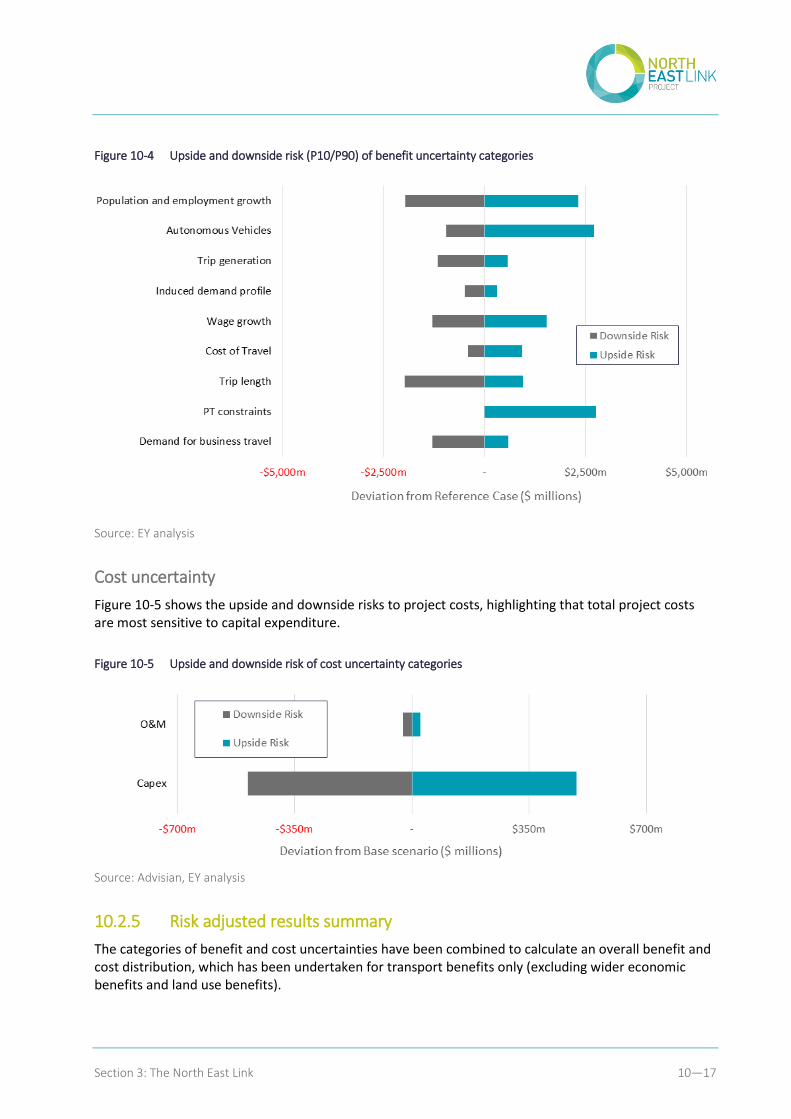
Section 3: The North East Link 10—17
Figure 10-4 Upside and downside risk (P10/P90) of benefit uncertainty categories
Source: EY analysis
Cost uncertainty
Figure 10-5 shows the upside and downside risks to project costs, highlighting that total project costs are most sensitive to capital expenditure.
Figure 10-5 Upside and downside risk of cost uncertainty categories
Source: Advisian, EY analysis
10.2.5 Risk adjusted results summary
The categories of benefit and cost uncertainties have been combined to calculate an overall benefit and cost distribution, which has been undertaken for transport benefits only (excluding wider economic benefits and land use benefits).
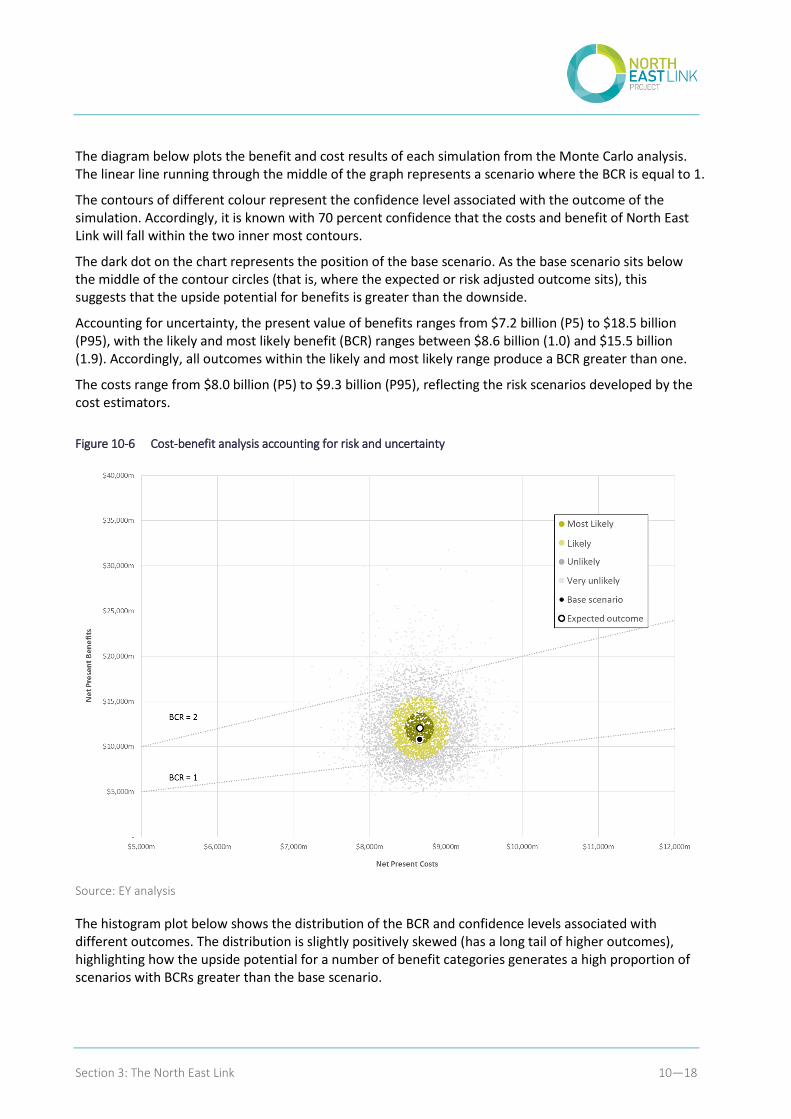
Section 3: The North East Link 10—18
The diagram below plots the benefit and cost results of each simulation from the Monte Carlo analysis. The linear line running through the middle of the graph represents a scenario where the BCR is equal to 1.
The contours of different colour represent the confidence level associated with the outcome of the simulation. Accordingly, it is known with 70 percent confidence that the costs and benefit of North East Link will fall within the two inner most contours.
The dark dot on the chart represents the position of the base scenario. As the base scenario sits below the middle of the contour circles (that is, where the expected or risk adjusted outcome sits), this suggests that the upside potential for benefits is greater than the downside.
Accounting for uncertainty, the present value of benefits ranges from $7.2 billion (P5) to $18.5 billion (P95), with the likely and most likely benefit (BCR) ranges between $8.6 billion (1.0) and $15.5 billion (1.9). Accordingly, all outcomes within the likely and most likely range produce a BCR greater than one.
The costs range from $8.0 billion (P5) to $9.3 billion (P95), reflecting the risk scenarios developed by the cost estimators.
Figure 10-6 Cost-benefit analysis accounting for risk and uncertainty
Source: EY analysis
The histogram plot below shows the distribution of the BCR and confidence levels associated with different outcomes. The distribution is slightly positively skewed (has a long tail of higher outcomes), highlighting how the upside potential for a number of benefit categories generates a high proportion of scenarios with BCRs greater than the base scenario.
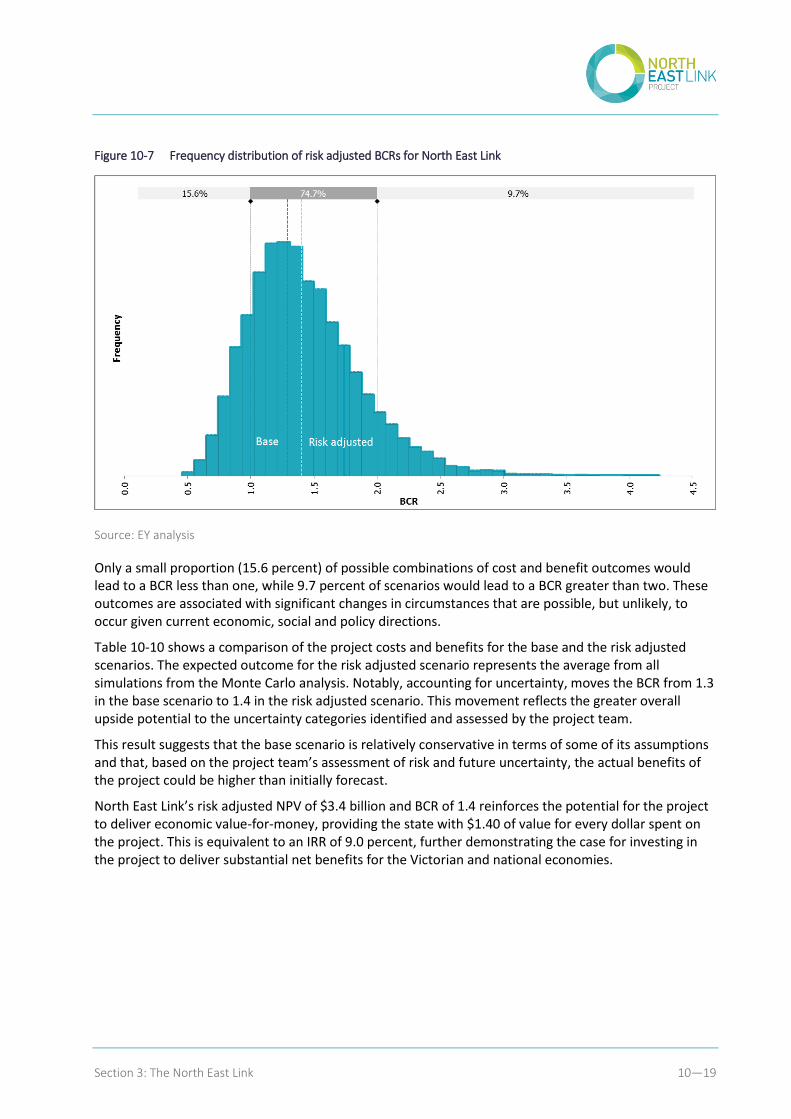
Section 3: The North East Link 10—19
Figure 10-7 Frequency distribution of risk adjusted BCRs for North East Link
Source: EY analysis
Only a small proportion (15.6 percent) of possible combinations of cost and benefit outcomes would lead to a BCR less than one, while 9.7 percent of scenarios would lead to a BCR greater than two. These outcomes are associated with significant changes in circumstances that are possible, but unlikely, to occur given current economic, social and policy directions.
Table 10-10 shows a comparison of the project costs and benefits for the base and the risk adjusted scenarios. The expected outcome for the risk adjusted scenario represents the average from all simulations from the Monte Carlo analysis. Notably, accounting for uncertainty, moves the BCR from 1.3 in the base scenario to 1.4 in the risk adjusted scenario. This movement reflects the greater overall upside potential to the uncertainty categories identified and assessed by the project team.
This result suggests that the base scenario is relatively conservative in terms of some of its assumptions and that, based on the project team’s assessment of risk and future uncertainty, the actual benefits of the project could be higher than initially forecast.
North East Link’s risk adjusted NPV of $3.4 billion and BCR of 1.4 reinforces the potential for the project to deliver economic value-for-money, providing the state with $1.40 of value for every dollar spent on the project. This is equivalent to an IRR of 9.0 percent, further demonstrating the case for investing in the project to deliver substantial net benefits for the Victorian and national economies.
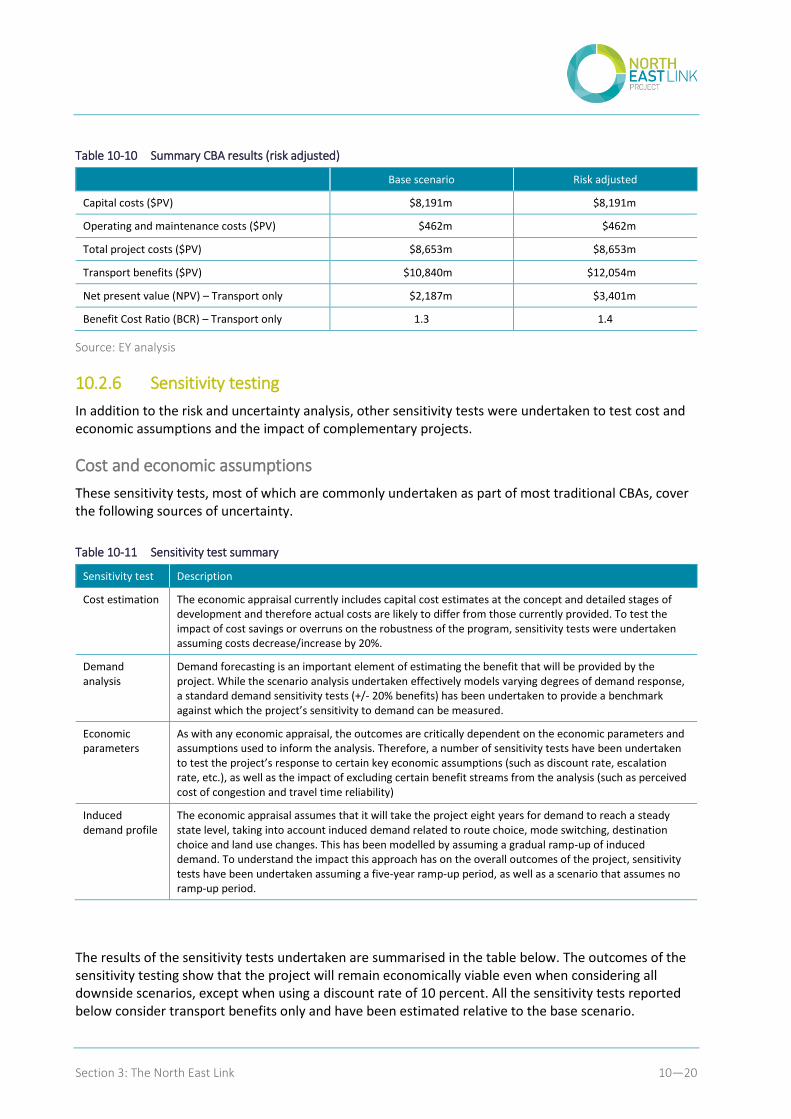
Section 3: The North East Link 10—20
Table 10-10 Summary CBA results (risk adjusted)
Base scenario Risk adjusted
Capital costs ($PV) $8,191m $8,191m
Operating and maintenance costs ($PV) $462m $462m
Total project costs ($PV) $8,653m $8,653m
Transport benefits ($PV) $10,840m $12,054m
Net present value (NPV) – Transport only $2,187m $3,401m
Benefit Cost Ratio (BCR) – Transport only 1.3 1.4
Source: EY analysis
10.2.6 Sensitivity testing
In addition to the risk and uncertainty analysis, other sensitivity tests were undertaken to test cost and economic assumptions and the impact of complementary projects.
Cost and economic assumptions
These sensitivity tests, most of which are commonly undertaken as part of most traditional CBAs, cover the following sources of uncertainty.
Table 10-11 Sensitivity test summary
Sensitivity test Description
Cost estimation The economic appraisal currently includes capital cost estimates at the concept and detailed stages of development and therefore actual costs are likely to differ from those currently provided. To test the impact of cost savings or overruns on the robustness of the program, sensitivity tests were undertaken assuming costs decrease/increase by 20%.
Demand analysis
Demand forecasting is an important element of estimating the benefit that will be provided by the project. While the scenario analysis undertaken effectively models varying degrees of demand response, a standard demand sensitivity tests (+/- 20% benefits) has been undertaken to provide a benchmark against which the project’s sensitivity to demand can be measured.
Economic parameters
As with any economic appraisal, the outcomes are critically dependent on the economic parameters and assumptions used to inform the analysis. Therefore, a number of sensitivity tests have been undertaken to test the project’s response to certain key economic assumptions (such as discount rate, escalation rate, etc.), as well as the impact of excluding certain benefit streams from the analysis (such as perceived cost of congestion and travel time reliability)
Induced demand profile
The economic appraisal assumes that it will take the project eight years for demand to reach a steady state level, taking into account induced demand related to route choice, mode switching, destination choice and land use changes. This has been modelled by assuming a gradual ramp-up of induced demand. To understand the impact this approach has on the overall outcomes of the project, sensitivity tests have been undertaken assuming a five-year ramp-up period, as well as a scenario that assumes no ramp-up period.
The results of the sensitivity tests undertaken are summarised in the table below. The outcomes of the sensitivity testing show that the project will remain economically viable even when considering all downside scenarios, except when using a discount rate of 10 percent. All the sensitivity tests reported below consider transport benefits only and have been estimated relative to the base scenario.
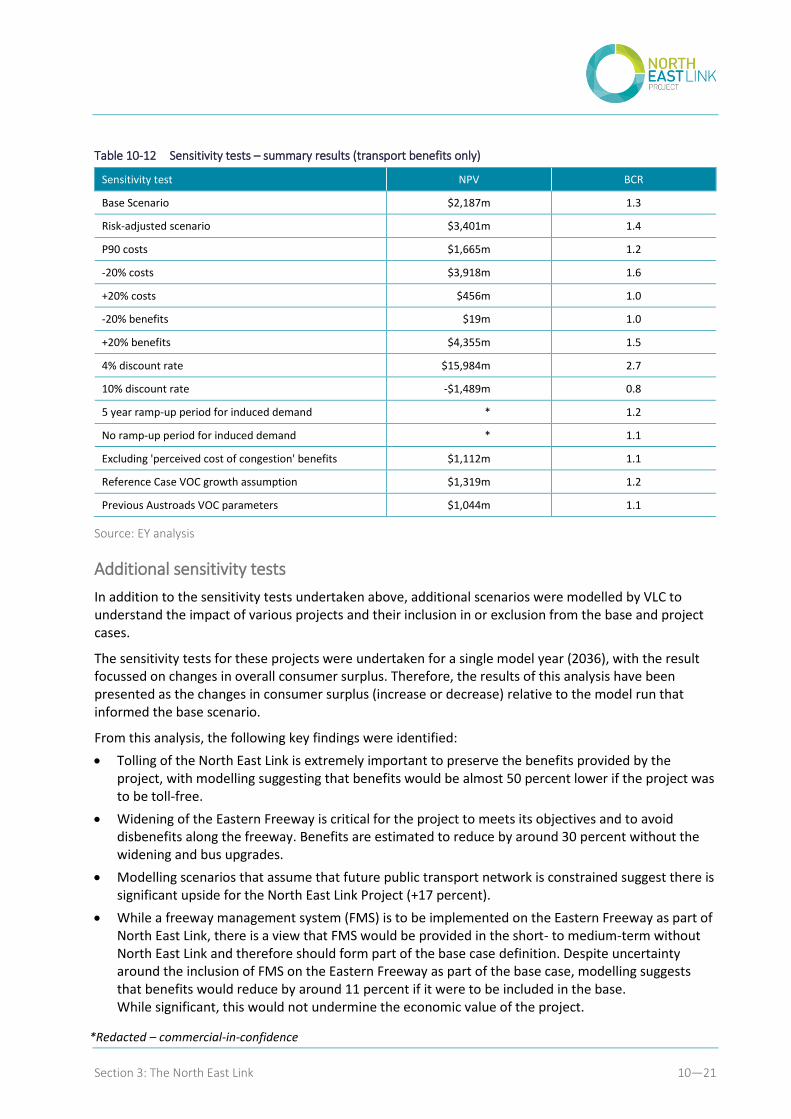
Section 3: The North East Link 10—21
Table 10-12 Sensitivity tests – summary results (transport benefits only)
Sensitivity test NPV BCR
Base Scenario $2,187m 1.3
Risk-adjusted scenario $3,401m 1.4
P90 costs $1,665m 1.2
-20% costs $3,918m 1.6
+20% costs $456m 1.0
-20% benefits $19m 1.0
+20% benefits $4,355m 1.5
4% discount rate $15,984m 2.7
10% discount rate -$1,489m 0.8
5 year ramp-up period for induced demand * 1.2
No ramp-up period for induced demand * 1.1
Excluding 'perceived cost of congestion' benefits $1,112m 1.1
Reference Case VOC growth assumption $1,319m 1.2
Previous Austroads VOC parameters $1,044m 1.1
Source: EY analysis
Additional sensitivity tests
In addition to the sensitivity tests undertaken above, additional scenarios were modelled by VLC to understand the impact of various projects and their inclusion in or exclusion from the base and project cases.
The sensitivity tests for these projects were undertaken for a single model year (2036), with the result focussed on changes in overall consumer surplus. Therefore, the results of this analysis have been presented as the changes in consumer surplus (increase or decrease) relative to the model run that informed the base scenario.
From this analysis, the following key findings were identified:
Tolling of the North East Link is extremely important to preserve the benefits provided by the project, with modelling suggesting that benefits would be almost 50 percent lower if the project was to be toll-free.
Widening of the Eastern Freeway is critical for the project to meets its objectives and to avoid disbenefits along the freeway. Benefits are estimated to reduce by around 30 percent without the widening and bus upgrades.
Modelling scenarios that assume that future public transport network is constrained suggest there is significant upside for the North East Link Project (+17 percent).
While a freeway management system (FMS) is to be implemented on the Eastern Freeway as part of North East Link, there is a view that FMS would be provided in the short- to medium-term without North East Link and therefore should form part of the base case definition. Despite uncertainty around the inclusion of FMS on the Eastern Freeway as part of the base case, modelling suggests that benefits would reduce by around 11 percent if it were to be included in the base. While significant, this would not undermine the economic value of the project.
*Redacted – commercial-in-confidence
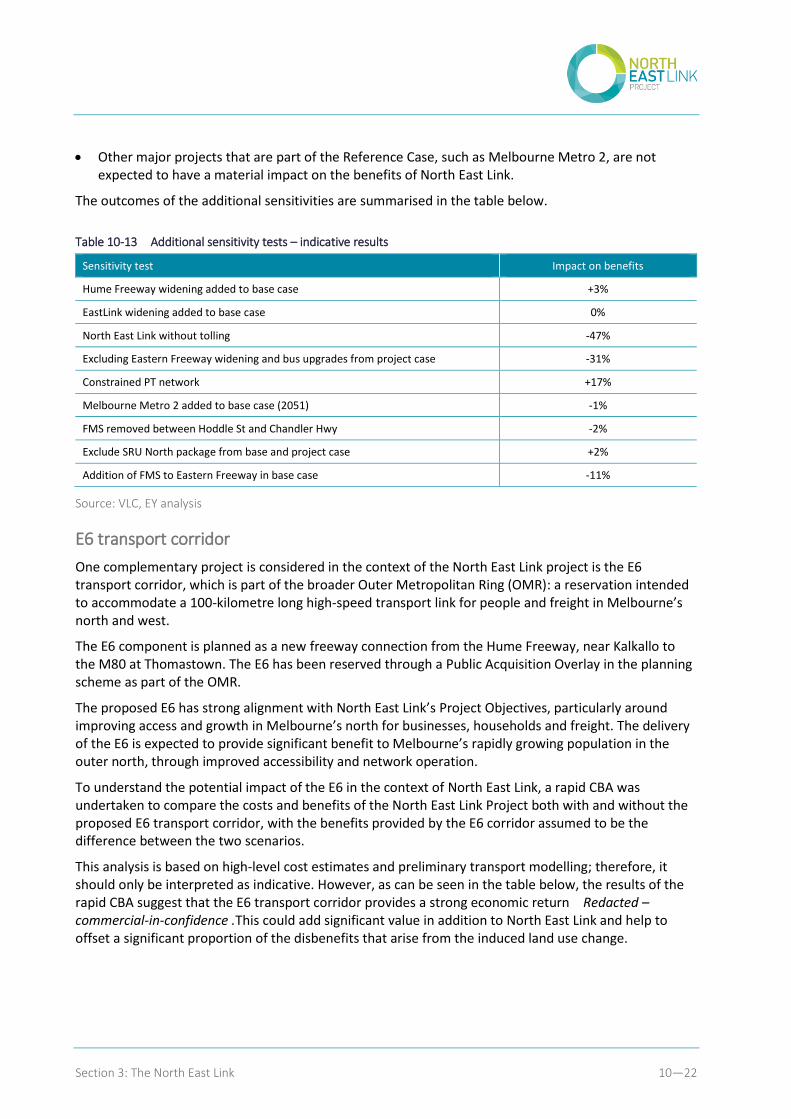
Section 3: The North East Link 10—22
Other major projects that are part of the Reference Case, such as Melbourne Metro 2, are not expected to have a material impact on the benefits of North East Link.
The outcomes of the additional sensitivities are summarised in the table below.
Table 10-13 Additional sensitivity tests – indicative results
Sensitivity test Impact on benefits
Hume Freeway widening added to base case +3%
EastLink widening added to base case 0%
North East Link without tolling -47%
Excluding Eastern Freeway widening and bus upgrades from project case -31%
Constrained PT network +17%
Melbourne Metro 2 added to base case (2051) -1%
FMS removed between Hoddle St and Chandler Hwy -2%
Exclude SRU North package from base and project case +2%
Addition of FMS to Eastern Freeway in base case -11%
Source: VLC, EY analysis
E6 transport corridor
One complementary project is considered in the context of the North East Link project is the E6 transport corridor, which is part of the broader Outer Metropolitan Ring (OMR): a reservation intended to accommodate a 100-kilometre long high-speed transport link for people and freight in Melbourne’s north and west.
The E6 component is planned as a new freeway connection from the Hume Freeway, near Kalkallo to the M80 at Thomastown. The E6 has been reserved through a Public Acquisition Overlay in the planning scheme as part of the OMR.
The proposed E6 has strong alignment with North East Link’s Project Objectives, particularly around improving access and growth in Melbourne’s north for businesses, households and freight. The delivery of the E6 is expected to provide significant benefit to Melbourne’s rapidly growing population in the outer north, through improved accessibility and network operation.
To understand the potential impact of the E6 in the context of North East Link, a rapid CBA was undertaken to compare the costs and benefits of the North East Link Project both with and without the proposed E6 transport corridor, with the benefits provided by the E6 corridor assumed to be the difference between the two scenarios.
This analysis is based on high-level cost estimates and preliminary transport modelling; therefore, it should only be interpreted as indicative. However, as can be seen in the table below, the results of the rapid CBA suggest that the E6 transport corridor provides a strong economic return Redacted – commercial-in-confidence .This could add significant value in addition to North East Link and help to offset a significant proportion of the disbenefits that arise from the induced land use change.
Section 3: The North East Link 10—23
Table 10-14 E6 transport corridor – Rapid CBA summary results
10.3 Real options
10.3.1 Background
Given the nature of the project and the wide-ranging uncertainties it faces over its operational life, there are likely to be a very large number of real options that could be identified and analysed. For the purposes of the business case, only the key drivers of uncertainty and real options that materially impact on project returns have been considered.
This section summarises the key drivers of uncertainty that, depending upon how they play out over the medium to longer term, could have implications for North East Link and potentially give rise to investment regret. These drivers are based on an initial qualitative risk assessment and include:
General demand for North East Link and surrounding networks affecting the optimal timing of capacity provision on the link and intersecting networks, as well as the tolling strategy
Automation technology changing the way the infrastructure is used and what it is required to provide
Emerging customer models that could change operating paradigms and affect the tolling concession
Government policy actions, including:
– Network pricing and wider transport governance reforms, which could affect tolling concession
– Responding to demands to cater to placarded loads on the North East Link.
General demand for North East Link and surrounding networks
As with most transport projects, a major source of uncertainty relates to predicting future levels of demand, which stems from trying to predict a range of drivers including general levels of population and employment growth, household and business location decisions, industry mix and propensity to travel for work and other trip purposes.
Demand uncertainties that relate to changing socio-economic dynamics and human behaviours can be exacerbated further by changing technologies and market trends, government policy actions and network issues.
Redacted – commercial-in-confidence
Section 3: The North East Link 10—24
For example, significantly higher demand for North East Link than predicted using the Reference Case assumptions could result if population growth linked to immigration continues at current rates (where Victoria in Future assumes a slowdown), potentially increasing general levels of transport demand, especially to/from growth areas in Melbourne’s north12. This would generate a significant increase in demand for North East Link and surrounding freeways and arterial roads, which could be exacerbated if global trends in fuel efficient and electric vehicles change the vehicle mix in Australia such that the financial cost of driving decreases relative to public transport.
The implications of significantly higher demand are that North East Link may quickly reach capacity, leading to deteriorating operating performance. This could create the need to increase the capacity of the link and interchanges or impose tighter access controls and/or higher pricing to manage demand as a way of preserving performance levels. There may also be a need to bring forward other investments to increase the capacity of the surrounding network that physically intersects with North East Link (such as E6, EastLink, Eastern Freeway, M80 and connecting arterial roads).
Significantly lower demand for North East Link than predicted under the Reference Case assumptions could result if population growth linked to immigration reduces to near zero or reverses, and if there is a decline in natural growth, which could happen with changing immigration policies and/or global migration patterns, as well as from changing the trajectory for births and deaths. This would reduce levels of general transport and North East Link demand, especially to/from growth areas in the north. This could be exacerbated if flexible working increases and/or if automation and changing preferences permanently reduces the level of employment. A return to higher oil and petrol prices, to levels before 2011-12, would also discourage motor vehicle use.
The implications of significantly lower demand are that it may take a long time for North East Link to reach capacity, calling into question the level of capacity provided on Day 1 for some or all of the project and/or the efficiency of the tolling strategy, as well as the need for other upgrades to the surrounding network.
However, as the State retains toll revenue risk under the preferred procurement approach, it also retains the flexibility/option to reduce tolls to encourage additional demand should this outcome eventuate. While toll revenues would be lower than expected under the base case, the asset would be operating more efficiently.
Automation technology changing the way the infrastructure is used and what it is required to provide
Industry is moving quickly to develop autonomous driving technologies, with expectations growing around possible deployment of high to fully automated vehicles over the next 10-15 years.13 However, the adoption and effectiveness of these technologies also requires a supportive national and state regulatory landscape, and the willingness of industry and consumers to overcome implementation challenges (such as user privacy concerns).
12 Victoria in Future predicts that annual population growth will decline from current levels of 1.8 percent per annum to around 1.3 percent per annum by 2040 (https://www.planning.vic.gov.au/land-use-and-population-research/victoria-in-future-2016) 13 http://www.europarl.europa.eu/RegData/etudes/BRIE/2016/573902/EPRS_BRI(2016)573902_EN.pdf
Section 3: The North East Link 10—25
Depending on the level of regulatory support and the take-up of automated vehicles, this will have major implications for the future safety and capacity of the project and wider road network. For example, the initial deployment of lower levels of automation are expected to significantly improve safety and reduce disruption linked to accidents, and the deployment of higher levels of automation is expected to boost the practical capacity of freeways by changing the way vehicles can use the road infrastructure (for example, reduced vehicle spacing due to platooning). Estimates of safety and capacity enhancements are wide ranging14. One study suggests that safety risks could fall to near zero and that lane capacities could increase by over 80 percent15.
VicRoads’ Draft ITS Technology Roadmap (Fit in time: Getting VicRoads Fit in Time by 2020) identifies actions that VicRoads and government must take to support the deployment of automated vehicles. In relation to road infrastructure, there may be future requirements for suitable standards in road spacing and line marking, as well as for the integration of Cooperative Intelligent Transport System (C-ITS) to enable effective vehicle-to-vehicle and vehicle-infrastructure communications.
The implications of this for North East Link are that there could be a need to modify or augment the infrastructure to comply with future standards and provide the telecommunications capacity required for C-ITS.
Emerging customer models
Greater use of mobile/digital technology is expected to support a move to the implementation of ‘frictionless’ access and payment methods across transport modes to enhance the customer experience and support alternative pricing and access strategies.
Mobile applications are supporting a trend toward the use of more ride sharing and car sharing services, and vehicle automation may support these trends.
Failure to apply state-of-the-art customer models, payment applications and enforcement approaches may constrain take-up of North East Link accounts and reduce the demand for and benefits of the project.
Government policy actions in relation to network pricing and wider transport governance reforms
The national reform agenda is increasingly focused on road network pricing, with the possibility of significant policy changes over the next 10 to 15 years. A related issue that is gaining interest is road and wider transport network governance reform, which could change the way parts of the network are invested in and operated, with the potential for a greater role for private sector operators and links to network pricing reform.
These policy actions could alter patterns of transport and land use. They could also change mode share depending on approaches taken to pricing public transport. Such changes could have implications for the level of demand for road use and North East Link, and create issues for toll road concessions that may need to be integrated into a broader network pricing and/or governance framework.
14 https://www.gov.uk/government/uploads/system/uploads/attachment_data/file/530092/impacts-of-connected-and-autonomous-vehicles-on-traffic-flow-evidence-review.pdf 15 https://www.enotrans.org/wp-content/uploads/AV-paper.pdf
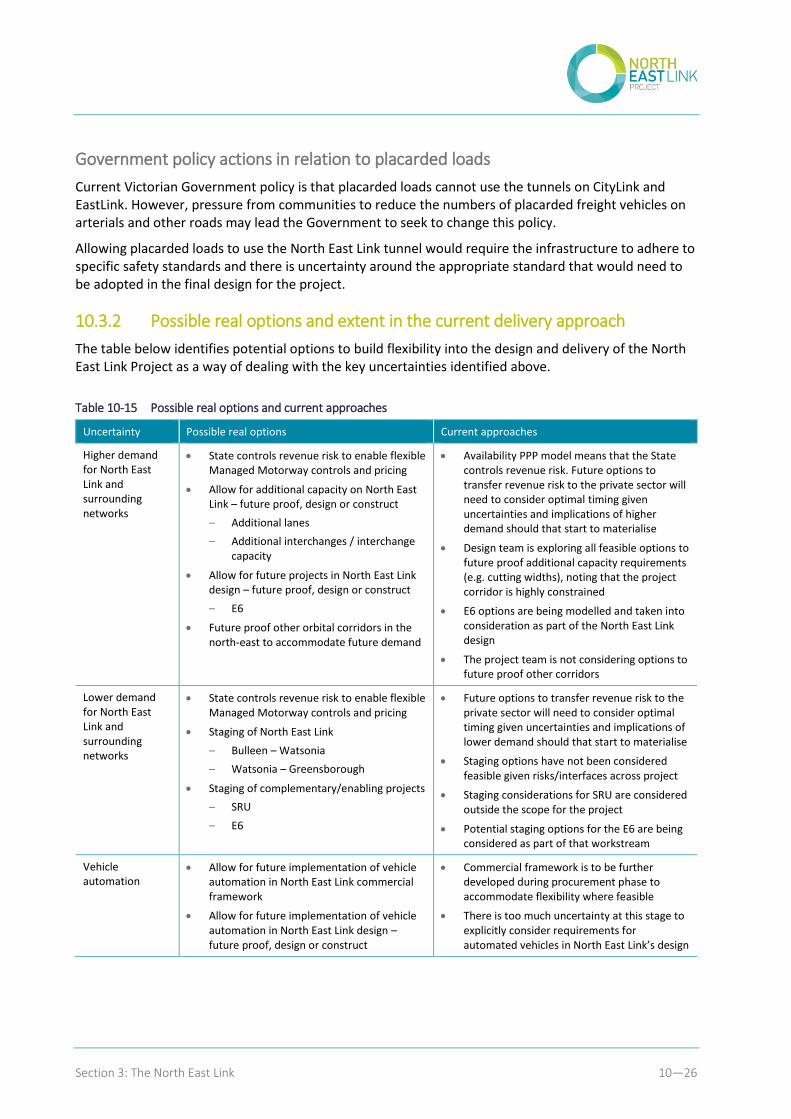
Section 3: The North East Link 10—26
Government policy actions in relation to placarded loads
Current Victorian Government policy is that placarded loads cannot use the tunnels on CityLink and EastLink. However, pressure from communities to reduce the numbers of placarded freight vehicles on arterials and other roads may lead the Government to seek to change this policy.
Allowing placarded loads to use the North East Link tunnel would require the infrastructure to adhere to specific safety standards and there is uncertainty around the appropriate standard that would need to be adopted in the final design for the project.
10.3.2 Possible real options and extent in the current delivery approach
The table below identifies potential options to build flexibility into the design and delivery of the North East Link Project as a way of dealing with the key uncertainties identified above.
Table 10-15 Possible real options and current approaches
Uncertainty Possible real options Current approaches
Higher demand for North East Link and surrounding networks
State controls revenue risk to enable flexible Managed Motorway controls and pricing
Allow for additional capacity on North East Link – future proof, design or construct
– Additional lanes
– Additional interchanges / interchange capacity
Allow for future projects in North East Link design – future proof, design or construct
– E6
Future proof other orbital corridors in the north-east to accommodate future demand
Availability PPP model means that the State controls revenue risk. Future options to transfer revenue risk to the private sector will need to consider optimal timing given uncertainties and implications of higher demand should that start to materialise
Design team is exploring all feasible options to future proof additional capacity requirements (e.g. cutting widths), noting that the project corridor is highly constrained
E6 options are being modelled and taken into consideration as part of the North East Link design
The project team is not considering options to future proof other corridors
Lower demand for North East Link and surrounding networks
State controls revenue risk to enable flexible Managed Motorway controls and pricing
Staging of North East Link
– Bulleen – Watsonia
– Watsonia – Greensborough
Staging of complementary/enabling projects
– SRU
– E6
Future options to transfer revenue risk to the private sector will need to consider optimal timing given uncertainties and implications of lower demand should that start to materialise
Staging options have not been considered feasible given risks/interfaces across project
Staging considerations for SRU are considered outside the scope for the project
Potential staging options for the E6 are being considered as part of that workstream
Vehicle automation
Allow for future implementation of vehicle automation in North East Link commercial framework
Allow for future implementation of vehicle automation in North East Link design – future proof, design or construct
Commercial framework is to be further developed during procurement phase to accommodate flexibility where feasible
There is too much uncertainty at this stage to explicitly consider requirements for automated vehicles in North East Link’s design
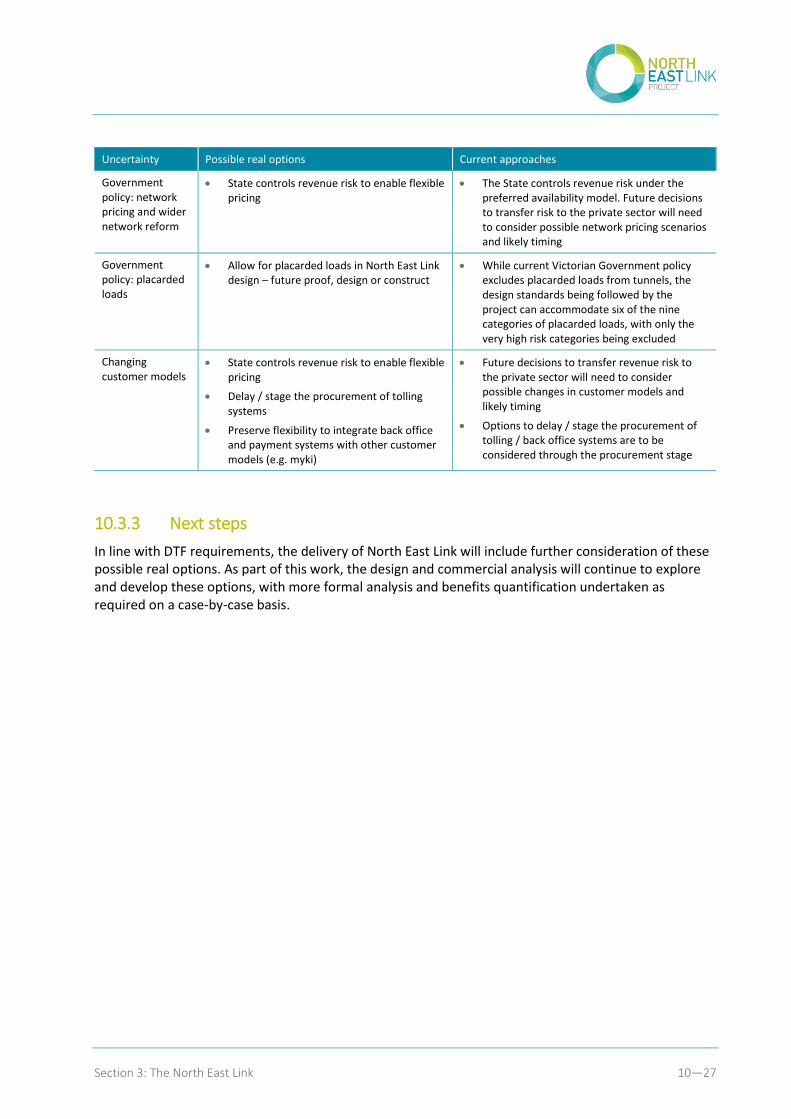
Section 3: The North East Link 10—27
Uncertainty Possible real options Current approaches
Government policy: network pricing and wider network reform
State controls revenue risk to enable flexible pricing
The State controls revenue risk under the preferred availability model. Future decisions to transfer risk to the private sector will need to consider possible network pricing scenarios and likely timing
Government policy: placarded loads
Allow for placarded loads in North East Link design – future proof, design or construct
While current Victorian Government policy excludes placarded loads from tunnels, the design standards being followed by the project can accommodate six of the nine categories of placarded loads, with only the very high risk categories being excluded
Changing customer models
State controls revenue risk to enable flexible pricing
Delay / stage the procurement of tolling systems
Preserve flexibility to integrate back office and payment systems with other customer models (e.g. myki)
Future decisions to transfer revenue risk to the private sector will need to consider possible changes in customer models and likely timing
Options to delay / stage the procurement of tolling / back office systems are to be considered through the procurement stage
10.3.3 Next steps
In line with DTF requirements, the delivery of North East Link will include further consideration of these possible real options. As part of this work, the design and commercial analysis will continue to explore and develop these options, with more formal analysis and benefits quantification undertaken as required on a case-by-case basis.