Embed Size (px)
Citation preview
6-1
Section 6: Examples of Evaluation Measures
Section 6 includes tables that list sample measures you might use to evaluate your HIE project. Each table includes possible measures, suggested data sources for each measure, practical notes, considerations, and, when available, links to suggested resources. The tables are not exhaustive, but rather highlight measures that have been commonly used to evaluate HIE projects. You should not try to incorporate all or a large number of measures into your evaluation; it is likely that only a small subset of the measures is directly applicable and relevant to your project. Your evaluation team should carefully consider whether a measure is important and applicable to your HIE project, based in part on having an understanding of the resources required to develop the study design and collect and analyze the data for the measures. For example, some data sources may be difficult to access or costly, and patient data may require informed consent. Based on the information provided, do your best to determine whether the value of a given measure outweighs the corresponding cost to your project’s resources.
Section 6 is divided into three subsections:
1. “Measures to evaluate the process of creating an HIE organization” provides a set of mostly process measures to evaluate progress in planning and implementing an HIE system.
2. “Measures for specific types of data exchange” provides details about specific measures, based on the kind of data that are being exchanged among the health care providers participating in the HIE project.
3. “Measures for clinical outcome and clinical process evaluation” provides suggested outcome, impact, and financial measures to use in analyzing the process and quality of clinical care.
Measures To Evaluate the Process of Creating an HIE OrganizationThe tables in this subsection provide examples of measures that are based on the structure and function of an HIE organization. Most of these measures are “Yes/No” measures, and can be ascertained from strategic planning, operations planning, legal, technical, and other documents (e.g., meeting minutes, Gantt charts, and organizational charts). The tables list measures in the following categories:
z Table 6-1. Measures of the infrastructure development effort;
z Table 6-2. Measures of process.
Guide to Evaluating Health Information Exchange Projects
6-2
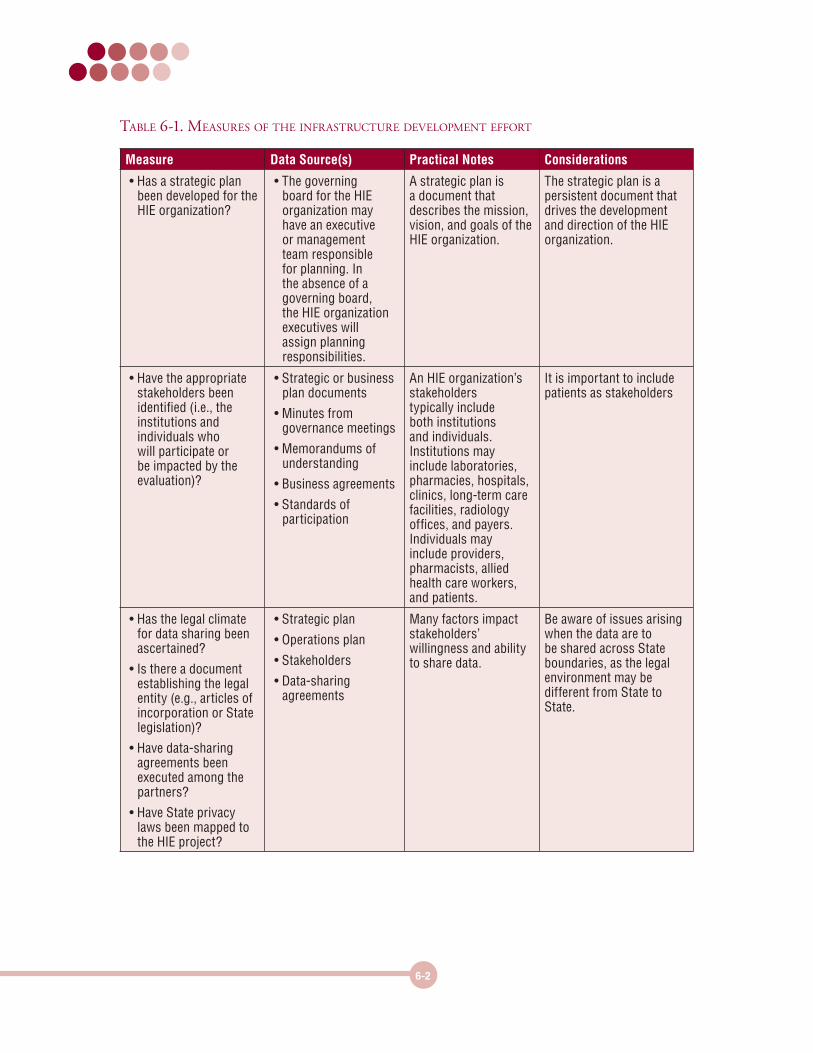
Table 6-1. measures of The infrasTruCTure developmenT efforT
Measure Data Source(s) Practical Notes Considerations
• Has a strategic plan been developed for the HIE organization?
• The governing board for the HIE organization may have an executive or management team responsible for planning. In the absence of a governing board, the HIE organization executives will assign planning responsibilities.
A strategic plan is a document that describes the mission, vision, and goals of the HIE organization.
The strategic plan is a persistent document that drives the development and direction of the HIE organization.
• Have the appropriate stakeholders been identified (i.e., the institutions and individuals who will participate or be impacted by the evaluation)?
• Strategic or business plan documents
• Minutes from governance meetings
• Memorandums of understanding
• Business agreements
• Standards of participation
An HIE organization’s stakeholders typically include both institutions and individuals. Institutions may include laboratories, pharmacies, hospitals, clinics, long-term care facilities, radiology offices, and payers. Individuals may include providers, pharmacists, allied health care workers, and patients.
It is important to include patients as stakeholders
• Has the legal climate for data sharing been ascertained?
• Is there a document establishing the legal entity (e.g., articles of incorporation or State legislation)?
• Have data-sharing agreements been executed among the partners?
• Have State privacy laws been mapped to the HIE project?
• Strategic plan
• Operations plan
• Stakeholders
• Data-sharing agreements
Many factors impact stakeholders’ willingness and ability to share data.
Be aware of issues arising when the data are to be shared across State boundaries, as the legal environment may be different from State to State.
6-3
Measure Data Source(s) Practical Notes Considerations
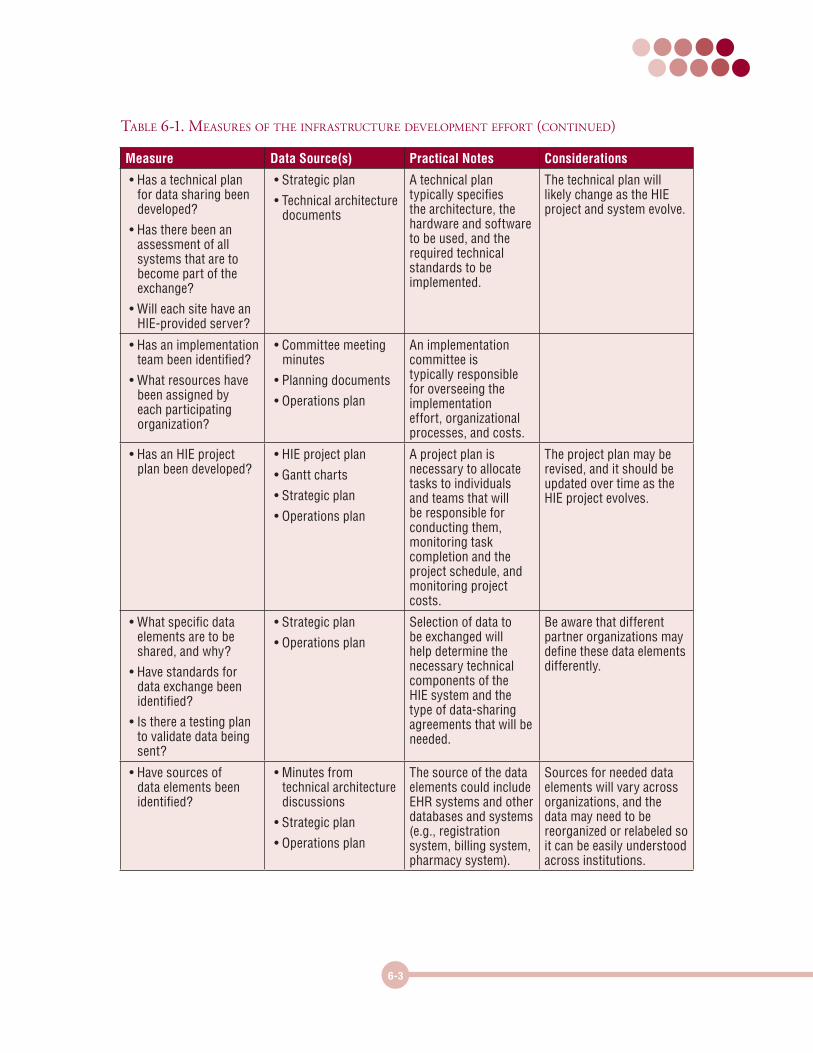
• Has a technical plan for data sharing been developed?
• Has there been an assessment of all systems that are to become part of the exchange?
• Will each site have an HIE-provided server?
• Strategic plan
• Technical architecture documents
A technical plan typically specifies the architecture, the hardware and software to be used, and the required technical standards to be implemented.
The technical plan will likely change as the HIE project and system evolve.
• Has an implementation team been identified?
• What resources have been assigned by each participating organization?
• Committee meeting minutes
• Planning documents
• Operations plan
An implementation committee is typically responsible for overseeing the implementation effort, organizational processes, and costs.
• Has an HIE project plan been developed?
• HIE project plan
• Gantt charts
• Strategic plan
• Operations plan
A project plan is necessary to allocate tasks to individuals and teams that will be responsible for conducting them, monitoring task completion and the project schedule, and monitoring project costs.
The project plan may be revised, and it should be updated over time as the HIE project evolves.
• What specific data elements are to be shared, and why?
• Have standards for data exchange been identified?
• Is there a testing plan to validate data being sent?
• Strategic plan
• Operations plan
Selection of data to be exchanged will help determine the necessary technical components of the HIE system and the type of data-sharing agreements that will be needed.
Be aware that different partner organizations may define these data elements differently.
• Have sources of data elements been identified?
• Minutes from technical architecture discussions
• Strategic plan
• Operations plan
The source of the data elements could include EHR systems and other databases and systems (e.g., registration system, billing system, pharmacy system).
Sources for needed data elements will vary across organizations, and the data may need to be reorganized or relabeled so it can be easily understood across institutions.
Table 6-1. measures of The infrasTruCTure developmenT efforT (ConTinued)
6-4
Measure Data Source(s) Practical Notes Considerations
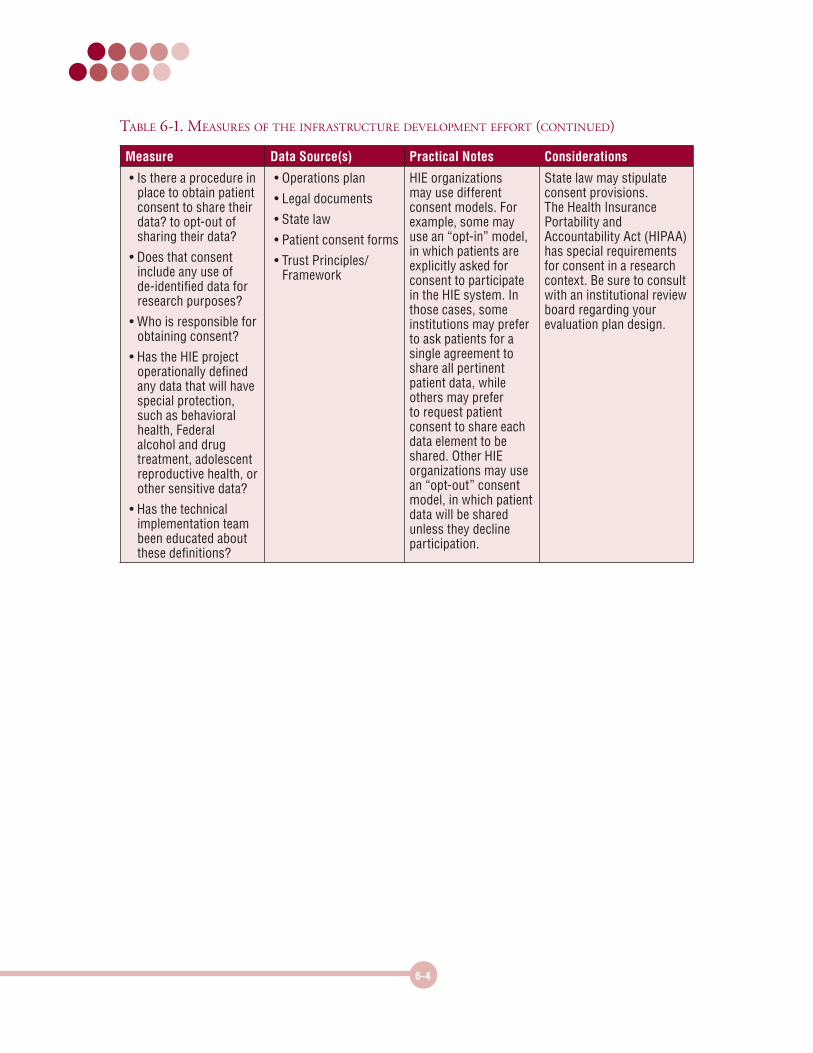
• Is there a procedure in place to obtain patient consent to share their data? to opt-out of sharing their data?
• Does that consent include any use of de-identified data for research purposes?
• Who is responsible for obtaining consent?
• Has the HIE project operationally defined any data that will have special protection, such as behavioral health, Federal alcohol and drug treatment, adolescent reproductive health, or other sensitive data?
• Has the technical implementation team been educated about these definitions?
• Operations plan
• Legal documents
• State law
• Patient consent forms
• Trust Principles/Framework
HIE organizations may use different consent models. For example, some may use an “opt-in” model, in which patients are explicitly asked for consent to participate in the HIE system. In those cases, some institutions may prefer to ask patients for a single agreement to share all pertinent patient data, while others may prefer to request patient consent to share each data element to be shared. Other HIE organizations may use an “opt-out” consent model, in which patient data will be shared unless they decline participation.
State law may stipulate consent provisions. The Health Insurance Portability and Accountability Act (HIPAA) has special requirements for consent in a research context. Be sure to consult with an institutional review board regarding your evaluation plan design.
Table 6-1. measures of The infrasTruCTure developmenT efforT (ConTinued)
6-5
Measure Data Source(s) Practical Notes Considerations
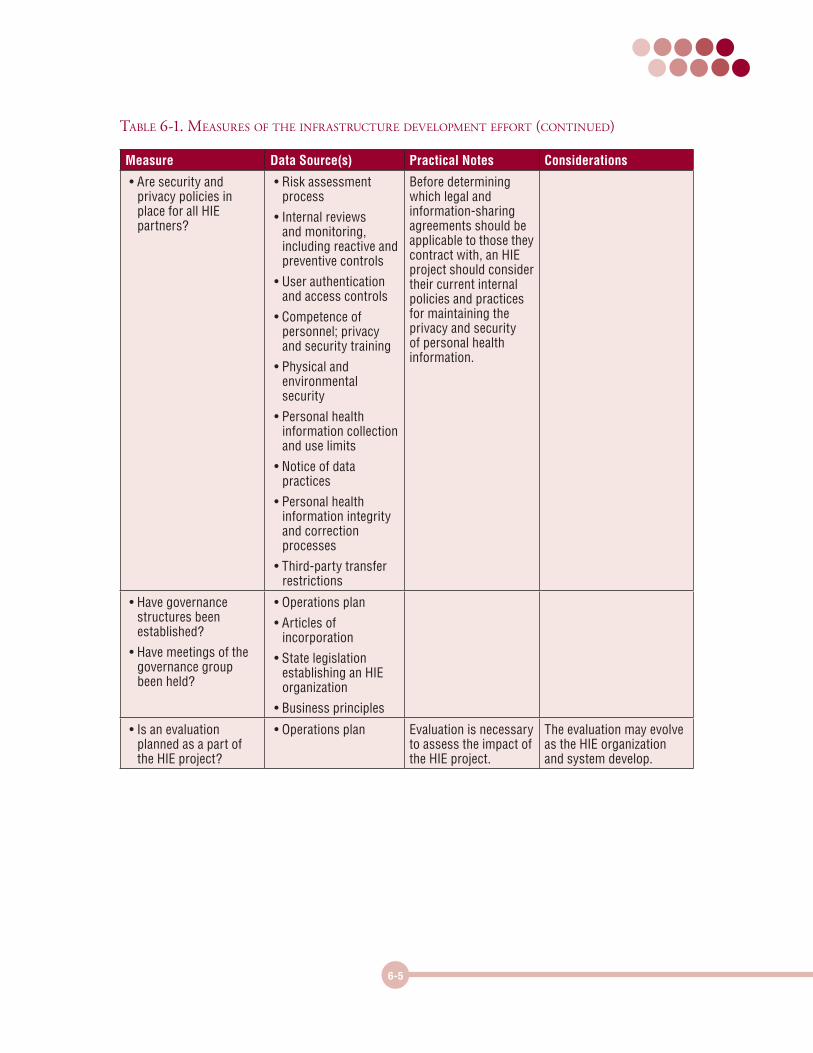
• Are security and privacy policies in place for all HIE partners?
• Risk assessment process
• Internal reviews and monitoring, including reactive and preventive controls
• User authentication and access controls
• Competence of personnel; privacy and security training
• Physical and environmental security
• Personal health information collection and use limits
• Notice of data practices
• Personal health information integrity and correction processes
• Third-party transfer restrictions
Before determining which legal and information-sharing agreements should be applicable to those they contract with, an HIE project should consider their current internal policies and practices for maintaining the privacy and security of personal health information.
• Have governance structures been established?
• Have meetings of the governance group been held?
• Operations plan
• Articles of incorporation
• State legislation establishing an HIE organization
• Business principles
• Is an evaluation planned as a part of the HIE project?
• Operations plan Evaluation is necessary to assess the impact of the HIE project.
The evaluation may evolve as the HIE organization and system develop.
Table 6-1. measures of The infrasTruCTure developmenT efforT (ConTinued)
6-6
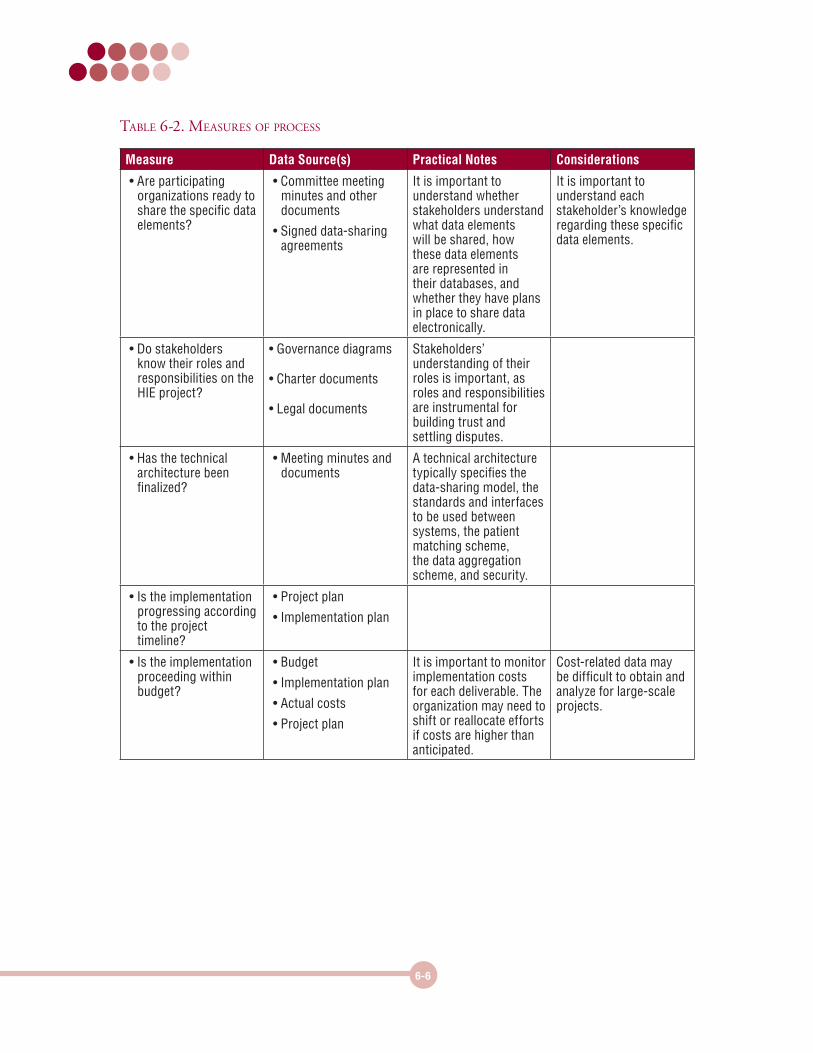
Table 6-2. measures of proCess
Measure Data Source(s) Practical Notes Considerations
• Are participating organizations ready to share the specific data elements?
• Committee meeting minutes and other documents
• Signed data-sharing agreements
It is important to understand whether stakeholders understand what data elements will be shared, how these data elements are represented in their databases, and whether they have plans in place to share data electronically.
It is important to understand each stakeholder’s knowledge regarding these specific data elements.
• Do stakeholders know their roles and responsibilities on the HIE project?
• Governance diagrams
• Charter documents
• Legal documents
Stakeholders’ understanding of their roles is important, as roles and responsibilities are instrumental for building trust and settling disputes.
• Has the technical architecture been finalized?
• Meeting minutes and documents
A technical architecture typically specifies the data-sharing model, the standards and interfaces to be used between systems, the patient matching scheme, the data aggregation scheme, and security.
• Is the implementation progressing according to the project timeline?
• Project plan
• Implementation plan
• Is the implementation proceeding within budget?
• Budget
• Implementation plan
• Actual costs
• Project plan
It is important to monitor implementation costs for each deliverable. The organization may need to shift or reallocate efforts if costs are higher than anticipated.
Cost-related data may be difficult to obtain and analyze for large-scale projects.
6-7
Measures for Specific Types of Data ExchangeThe tables in this subsection provide examples of measures based on five types of data exchange. Each table provides measures regarding the value of one particular type of data exchange. Some measures are “exchange capability questions,” which are simple “Yes/No” questions as to whether the exchange has achieved certain capabilities. These capability questions do not require every participating organization to have achieved the functionalities, but it is necessary to demonstrate that the exchange organization and technical infrastructure can support the functionalities. The tables list measures in the following categories:
z Table 6-3. Data exchange between providers and laboratories
z Table 6-4. Data exchange between providers and pharmacies
z Table 6-5. Data exchange between providers
z Table 6-6. Data exchange between providers and radiology centers
z Table 6-7. Data exchange between providers and public health departments
6-8
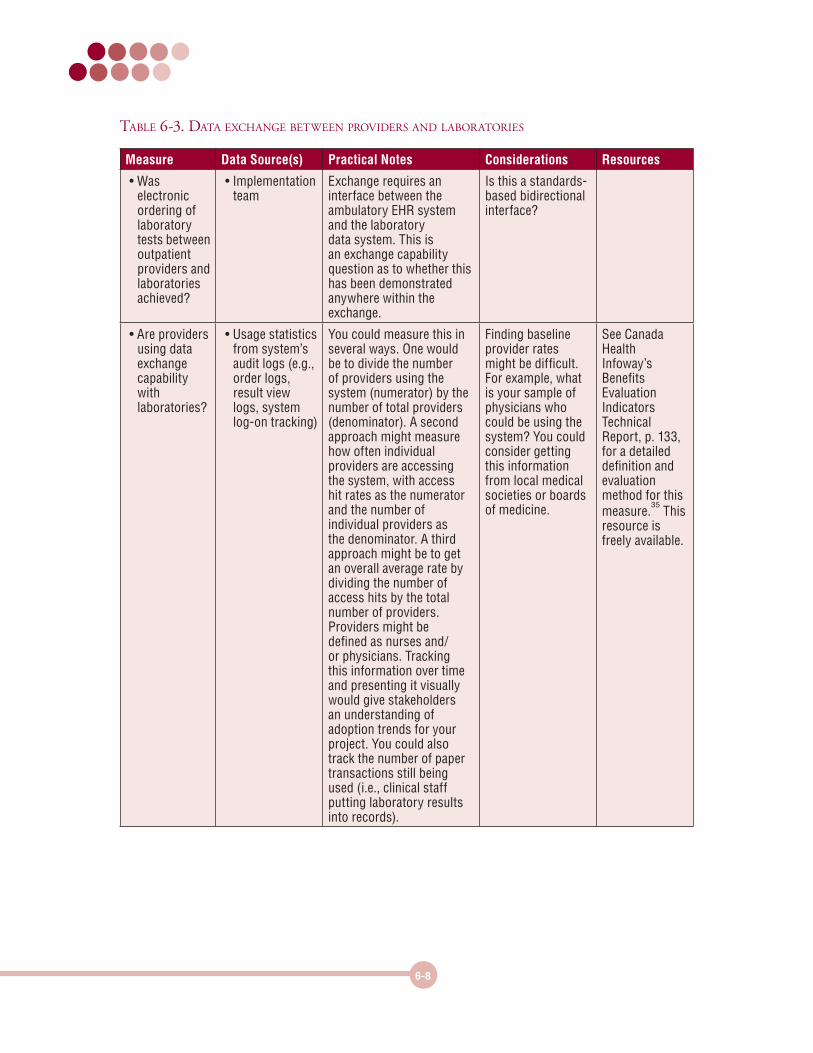
Table 6-3. daTa exChange beTween providers and laboraTories
Measure Data Source(s) Practical Notes Considerations Resources
• Was electronic ordering of laboratory tests between outpatient providers and laboratories achieved?
• Implementation team
Exchange requires an interface between the ambulatory EHR system and the laboratory data system. This is an exchange capability question as to whether this has been demonstrated anywhere within the exchange.
Is this a standards-based bidirectional interface?
• Are providers using data exchange capability with laboratories?
• Usage statistics from system’s audit logs (e.g., order logs, result view logs, system log-on tracking)
You could measure this in several ways. One would be to divide the number of providers using the system (numerator) by the number of total providers (denominator). A second approach might measure how often individual providers are accessing the system, with access hit rates as the numerator and the number of individual providers as the denominator. A third approach might be to get an overall average rate by dividing the number of access hits by the total number of providers. Providers might be defined as nurses and/or physicians. Tracking this information over time and presenting it visually would give stakeholders an understanding of adoption trends for your project. You could also track the number of paper transactions still being used (i.e., clinical staff putting laboratory results into records).
Finding baseline provider rates might be difficult. For example, what is your sample of physicians who could be using the system? You could consider getting this information from local medical societies or boards of medicine.
See Canada Health Infoway’s Benefits Evaluation Indicators Technical Report, p. 133, for a detailed definition and evaluation method for this measure.
35 This
resource is freely available.
6-9
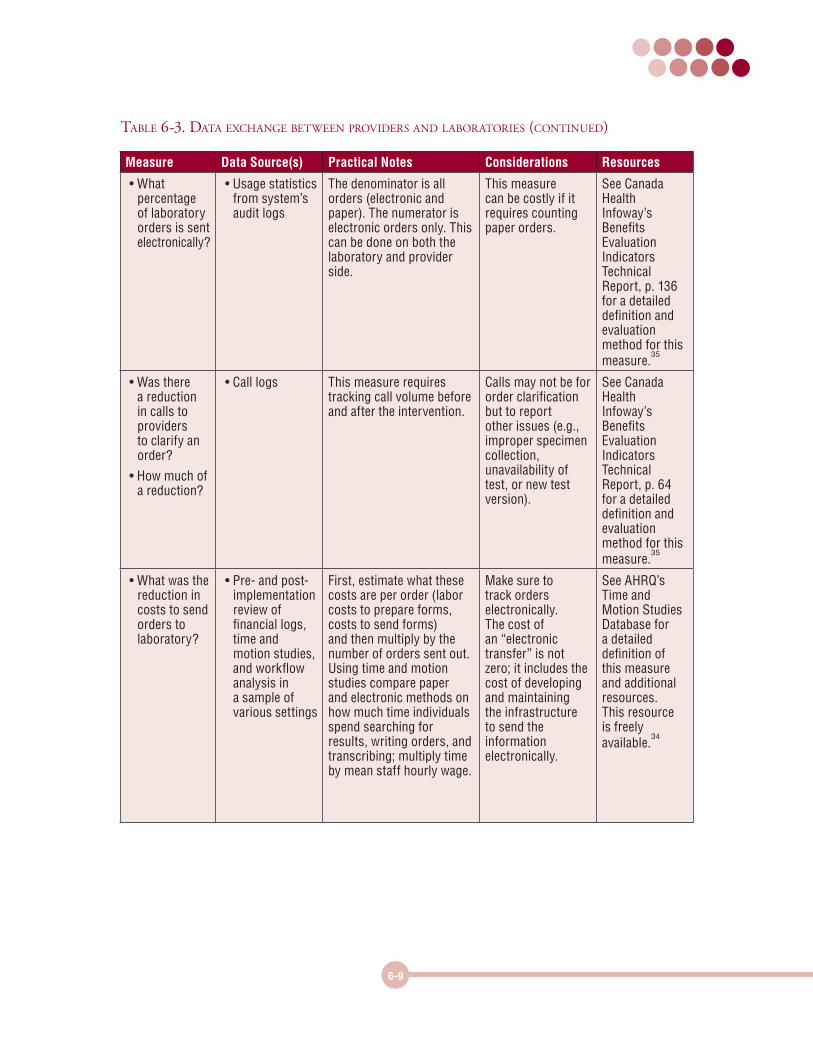
Measure Data Source(s) Practical Notes Considerations Resources
• What percentage of laboratory orders is sent electronically?
• Usage statistics from system’s audit logs
The denominator is all orders (electronic and paper). The numerator is electronic orders only. This can be done on both the laboratory and provider side.
This measure can be costly if it requires counting paper orders.
See Canada Health Infoway’s Benefits Evaluation Indicators Technical Report, p. 136 for a detailed definition and evaluation method for this measure.
35
• Was there a reduction in calls to providers to clarify an order?
• How much of a reduction?
• Call logs This measure requires tracking call volume before and after the intervention.
Calls may not be for order clarification but to report other issues (e.g., improper specimen collection, unavailability of test, or new test version).
See Canada Health Infoway’s Benefits Evaluation Indicators Technical Report, p. 64 for a detailed definition and evaluation method for this measure.
35
• What was the reduction in costs to send orders to laboratory?
• Pre- and post-implementation review of financial logs, time and motion studies, and workflow analysis in a sample of various settings
First, estimate what these costs are per order (labor costs to prepare forms, costs to send forms) and then multiply by the number of orders sent out. Using time and motion studies compare paper and electronic methods on how much time individuals spend searching for results, writing orders, and transcribing; multiply time by mean staff hourly wage.
Make sure to track orders electronically. The cost of an “electronic transfer” is not zero; it includes the cost of developing and maintaining the infrastructure to send the information electronically.
See AHRQ’s Time and Motion Studies Database for a detailed definition of this measure and additional resources. This resource is freely available.
34
Table 6-3. daTa exChange beTween providers and laboraTories (ConTinued)
6-10
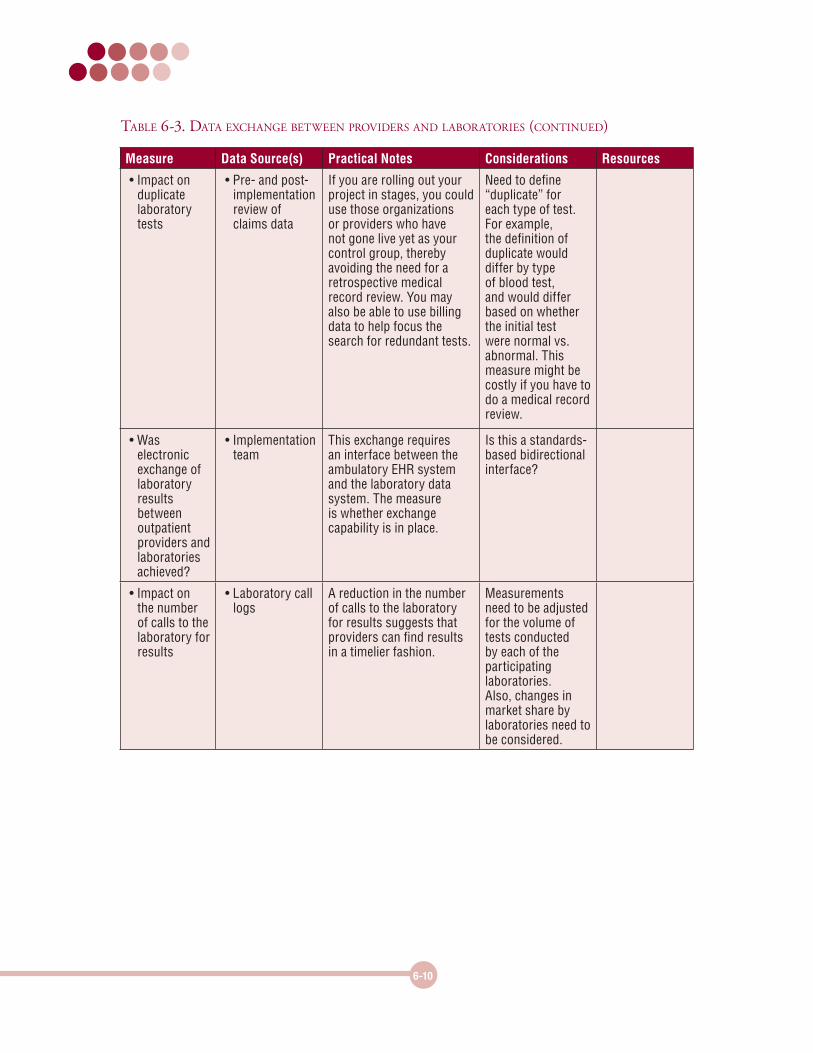
Measure Data Source(s) Practical Notes Considerations Resources
• Impact on duplicate laboratory tests
• Pre- and post-implementation review of claims data
If you are rolling out your project in stages, you could use those organizations or providers who have not gone live yet as your control group, thereby avoiding the need for a retrospective medical record review. You may also be able to use billing data to help focus the search for redundant tests.
Need to define “duplicate” for each type of test. For example, the definition of duplicate would differ by type of blood test, and would differ based on whether the initial test were normal vs. abnormal. This measure might be costly if you have to do a medical record review.
• Was electronic exchange of laboratory results between outpatient providers and laboratories achieved?
• Implementation team
This exchange requires an interface between the ambulatory EHR system and the laboratory data system. The measure is whether exchange capability is in place.
Is this a standards-based bidirectional interface?
• Impact on the number of calls to the laboratory for results
• Laboratory call logs
A reduction in the number of calls to the laboratory for results suggests that providers can find results in a timelier fashion.
Measurements need to be adjusted for the volume of tests conducted by each of the participating laboratories. Also, changes in market share by laboratories need to be considered.
Table 6-3. daTa exChange beTween providers and laboraTories (ConTinued)
6-11
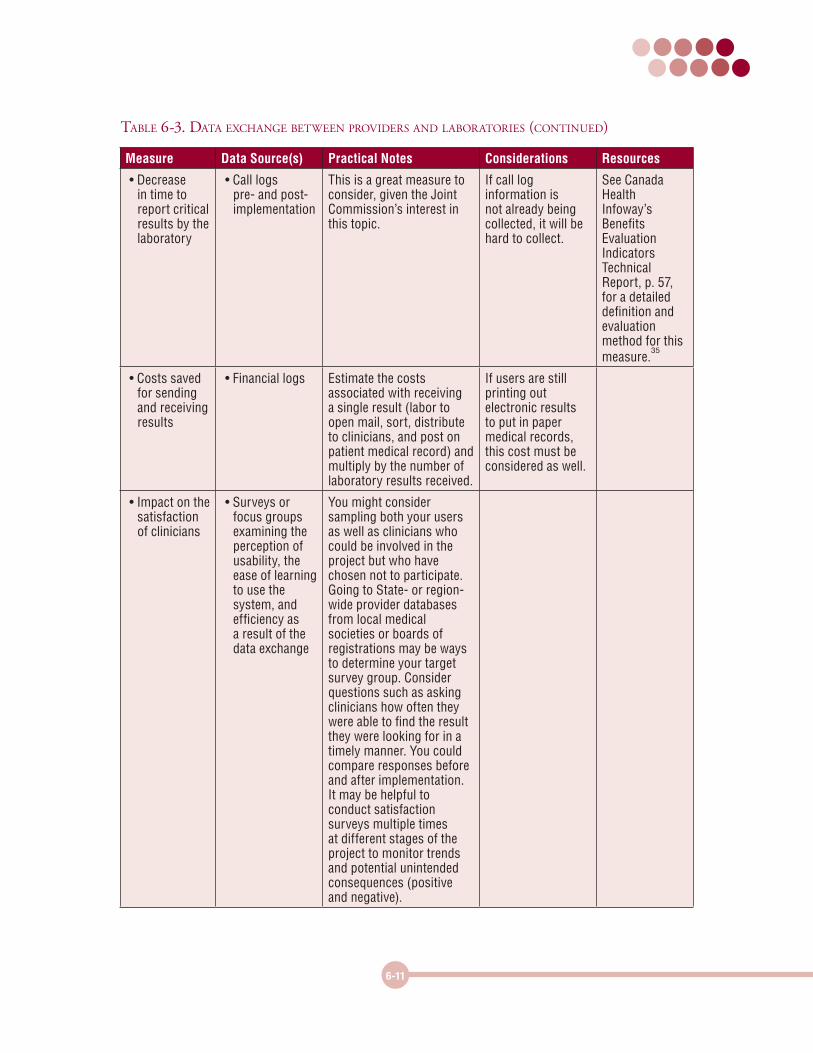
Measure Data Source(s) Practical Notes Considerations Resources
• Decrease in time to report critical results by the laboratory
• Call logs pre- and post-implementation
This is a great measure to consider, given the Joint Commission’s interest in this topic.
If call log information is not already being collected, it will be hard to collect.
See Canada Health Infoway’s Benefits Evaluation Indicators Technical Report, p. 57, for a detailed definition and evaluation method for this measure.
35
• Costs saved for sending and receiving results
• Financial logs Estimate the costs associated with receiving a single result (labor to open mail, sort, distribute to clinicians, and post on patient medical record) and multiply by the number of laboratory results received.
If users are still printing out electronic results to put in paper medical records, this cost must be considered as well.
• Impact on the satisfaction of clinicians
• Surveys or focus groups examining the perception of usability, the ease of learning to use the system, and efficiency as a result of the data exchange
You might consider sampling both your users as well as clinicians who could be involved in the project but who have chosen not to participate. Going to State- or region-wide provider databases from local medical societies or boards of registrations may be ways to determine your target survey group. Consider questions such as asking clinicians how often they were able to find the result they were looking for in a timely manner. You could compare responses before and after implementation. It may be helpful to conduct satisfaction surveys multiple times at different stages of the project to monitor trends and potential unintended consequences (positive and negative).
Table 6-3. daTa exChange beTween providers and laboraTories (ConTinued)
6-12
Measure Data Source(s) Practical Notes Considerations Resources
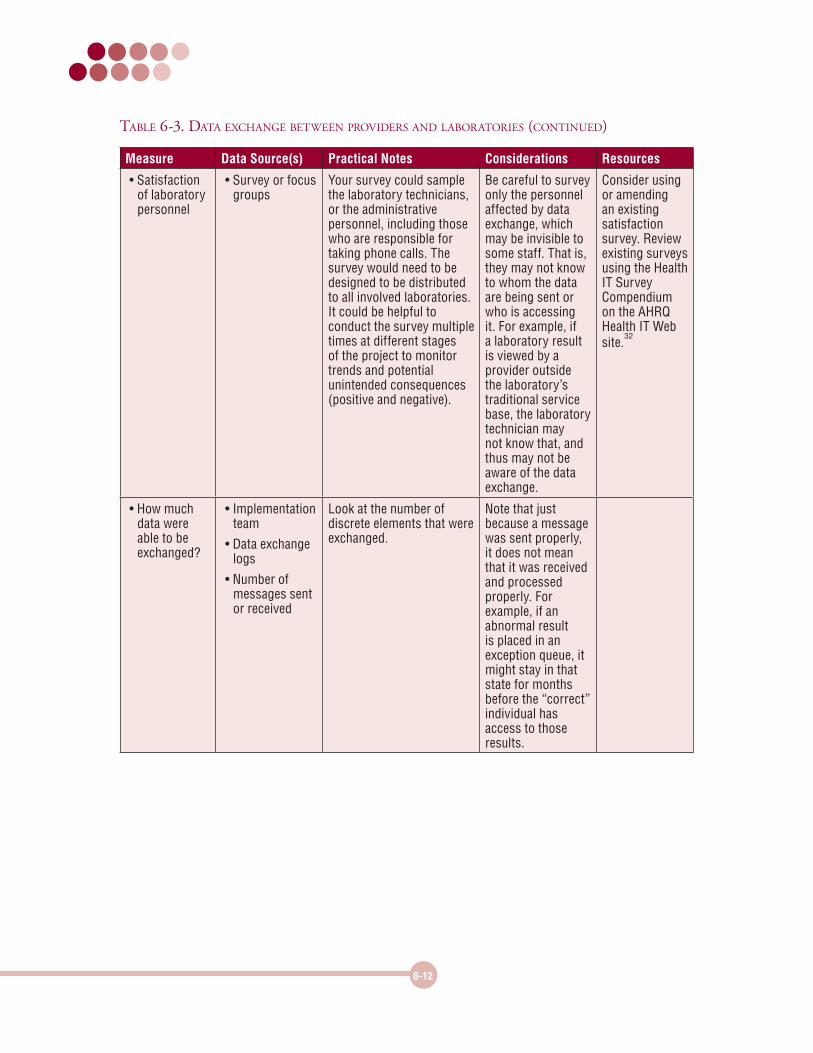
• Satisfaction of laboratory personnel
• Survey or focus groups
Your survey could sample the laboratory technicians, or the administrative personnel, including those who are responsible for taking phone calls. The survey would need to be designed to be distributed to all involved laboratories. It could be helpful to conduct the survey multiple times at different stages of the project to monitor trends and potential unintended consequences (positive and negative).
Be careful to survey only the personnel affected by data exchange, which may be invisible to some staff. That is, they may not know to whom the data are being sent or who is accessing it. For example, if a laboratory result is viewed by a provider outside the laboratory’s traditional service base, the laboratory technician may not know that, and thus may not be aware of the data exchange.
Consider using or amending an existing satisfaction survey. Review existing surveys using the Health IT Survey Compendium on the AHRQ Health IT Web site.
32
• How much data were able to be exchanged?
• Implementation team
• Data exchange logs
• Number of messages sent or received
Look at the number of discrete elements that were exchanged.
Note that just because a message was sent properly, it does not mean that it was received and processed properly. For example, if an abnormal result is placed in an exception queue, it might stay in that state for months before the “correct” individual has access to those results.
Table 6-3. daTa exChange beTween providers and laboraTories (ConTinued)
6-13
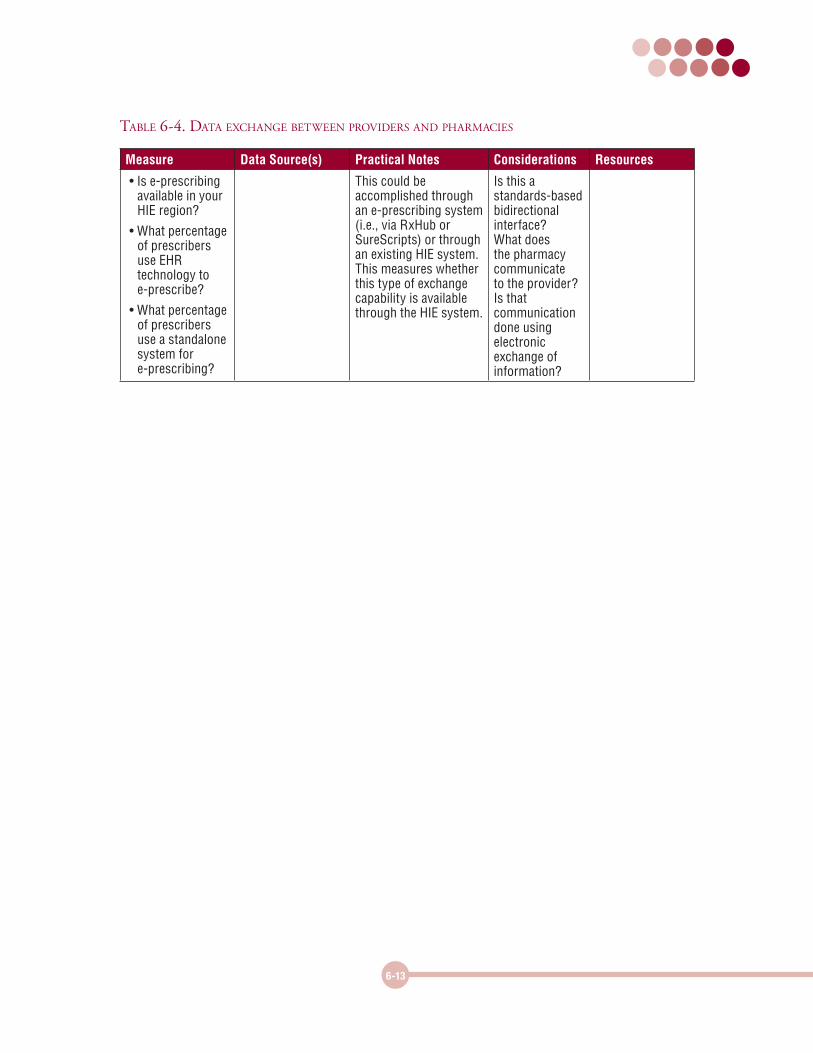
Table 6-4. daTa exChange beTween providers and pharmaCies
Measure Data Source(s) Practical Notes Considerations Resources
• Is e-prescribing available in your HIE region?
• What percentage of prescribers use EHR technology to e-prescribe?
• What percentage of prescribers use a standalone system for e-prescribing?
This could be accomplished through an e-prescribing system (i.e., via RxHub or SureScripts) or through an existing HIE system. This measures whether this type of exchange capability is available through the HIE system.
Is this a standards-based bidirectional interface? What does the pharmacy communicate to the provider? Is that communication done using electronic exchange of information?
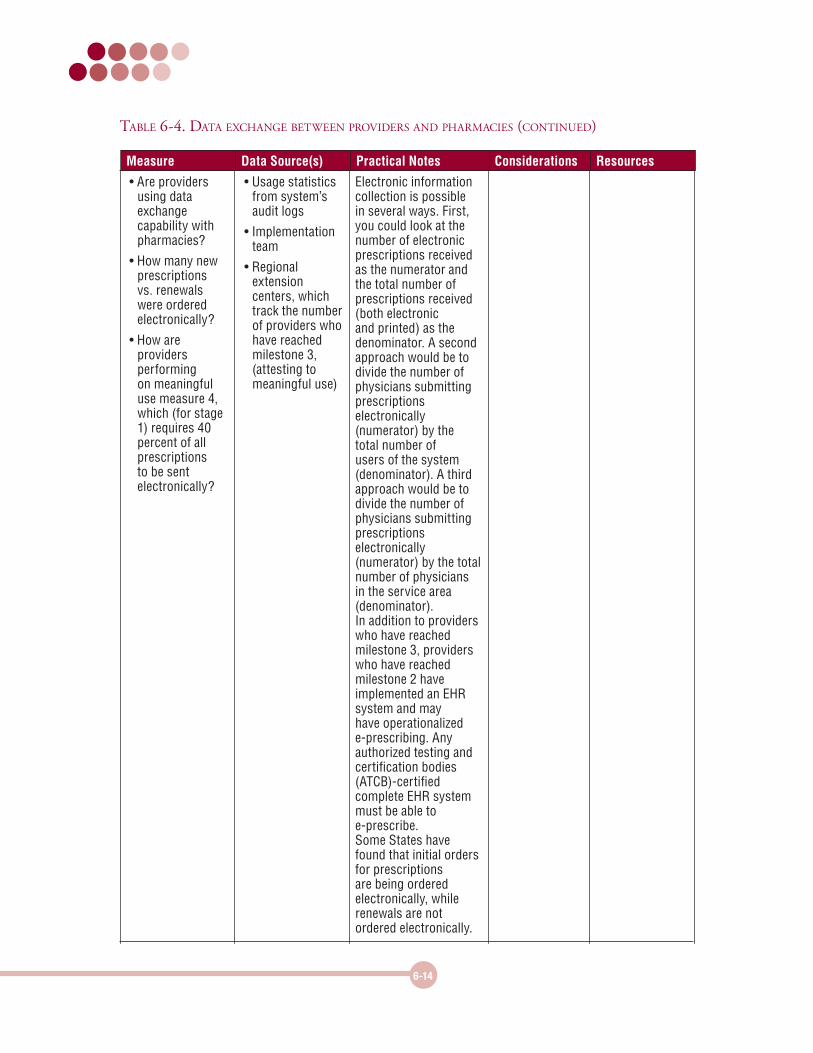
• Are providers using data exchange capability with pharmacies?
• How many new prescriptions vs. renewals were ordered electronically?
• How are providers performing on meaningful use measure 4, which (for stage 1) requires 40 percent of all prescriptions to be sent electronically?
• Usage statistics from system’s audit logs
• Implementation team
• Regional extension centers, which track the number of providers who have reached milestone 3, (attesting to meaningful use)
Electronic information collection is possible in several ways. First, you could look at the number of electronic prescriptions received as the numerator and the total number of prescriptions received (both electronic and printed) as the denominator. A second approach would be to divide the number of physicians submitting prescriptions electronically (numerator) by the total number of users of the system (denominator). A third approach would be to divide the number of physicians submitting prescriptions electronically (numerator) by the total number of physicians in the service area (denominator). In addition to providers who have reached milestone 3, providers who have reached milestone 2 have implemented an EHR system and may have operationalized e-prescribing. Any authorized testing and certification bodies (ATCB)-certified complete EHR system must be able to e-prescribe. Some States have found that initial orders for prescriptions are being ordered electronically, while renewals are not ordered electronically.
Measure Data Source(s) Practical Notes Considerations Resources
Table 6-4. daTa exChange beTween providers and pharmaCies (ConTinued)
6-14
6-15
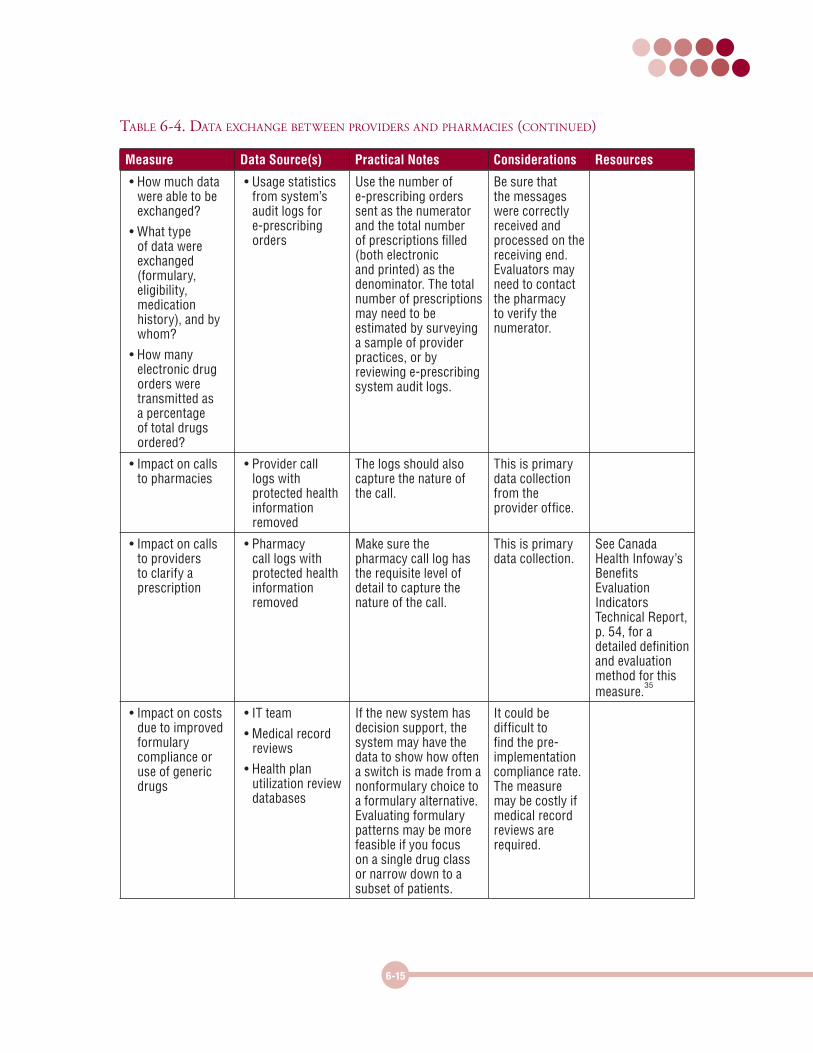
• How much data were able to be exchanged?
• What type of data were exchanged (formulary, eligibility, medication history), and by whom?
• How many electronic drug orders were transmitted as a percentage of total drugs ordered?
• Usage statistics from system’s audit logs for e-prescribing orders
Use the number of e-prescribing orders sent as the numerator and the total number of prescriptions filled (both electronic and printed) as the denominator. The total number of prescriptions may need to be estimated by surveying a sample of provider practices, or by reviewing e-prescribing system audit logs.
Be sure that the messages were correctly received and processed on the receiving end. Evaluators may need to contact the pharmacy to verify the numerator.
• Impact on calls to pharmacies
• Provider call logs with protected health information removed
The logs should also capture the nature of the call.
This is primary data collection from the provider office.
• Impact on calls to providers to clarify a prescription
• Pharmacy call logs with protected health information removed
Make sure the pharmacy call log has the requisite level of detail to capture the nature of the call.
This is primary data collection.
See Canada Health Infoway’s Benefits Evaluation Indicators Technical Report, p. 54, for a detailed definition and evaluation method for this measure.
35
• Impact on costs due to improved formulary compliance or use of generic drugs
• IT team
• Medical record reviews
• Health plan utilization review databases
If the new system has decision support, the system may have the data to show how often a switch is made from a nonformulary choice to a formulary alternative. Evaluating formulary patterns may be more feasible if you focus on a single drug class or narrow down to a subset of patients.
It could be difficult to find the pre-implementation compliance rate. The measure may be costly if medical record reviews are required.
Measure Data Source(s) Practical Notes Considerations Resources
Table 6-4. daTa exChange beTween providers and pharmaCies (ConTinued)
6-16
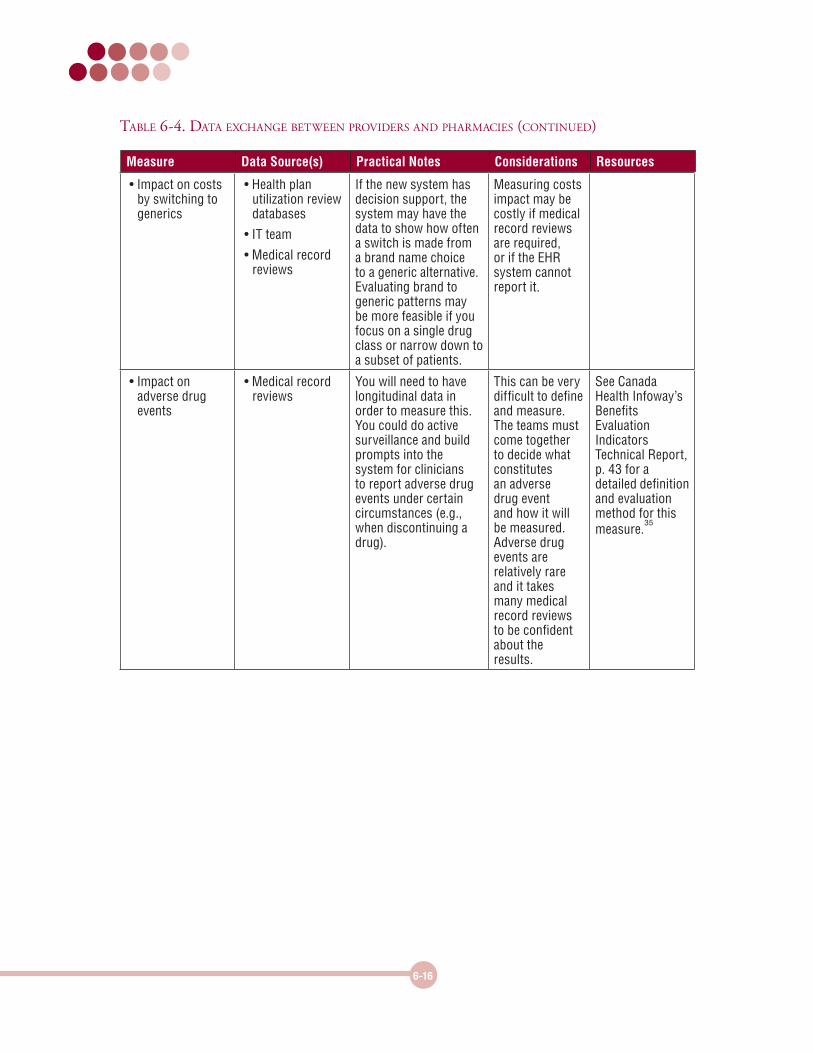
• Impact on costs by switching to generics
• Health plan utilization review databases
• IT team
• Medical record reviews
If the new system has decision support, the system may have the data to show how often a switch is made from a brand name choice to a generic alternative. Evaluating brand to generic patterns may be more feasible if you focus on a single drug class or narrow down to a subset of patients.
Measuring costs impact may be costly if medical record reviews are required, or if the EHR system cannot report it.
• Impact on adverse drug events
• Medical record reviews
You will need to have longitudinal data in order to measure this.You could do active surveillance and build prompts into the system for clinicians to report adverse drug events under certain circumstances (e.g., when discontinuing a drug).
This can be very difficult to define and measure. The teams must come together to decide what constitutes an adverse drug event and how it will be measured. Adverse drug events are relatively rare and it takes many medical record reviews to be confident about the results.
See Canada Health Infoway’s Benefits Evaluation Indicators Technical Report, p. 43 for a detailed definition and evaluation method for this measure.
35
Measure Data Source(s) Practical Notes Considerations Resources
Table 6-4. daTa exChange beTween providers and pharmaCies (ConTinued)
6-17
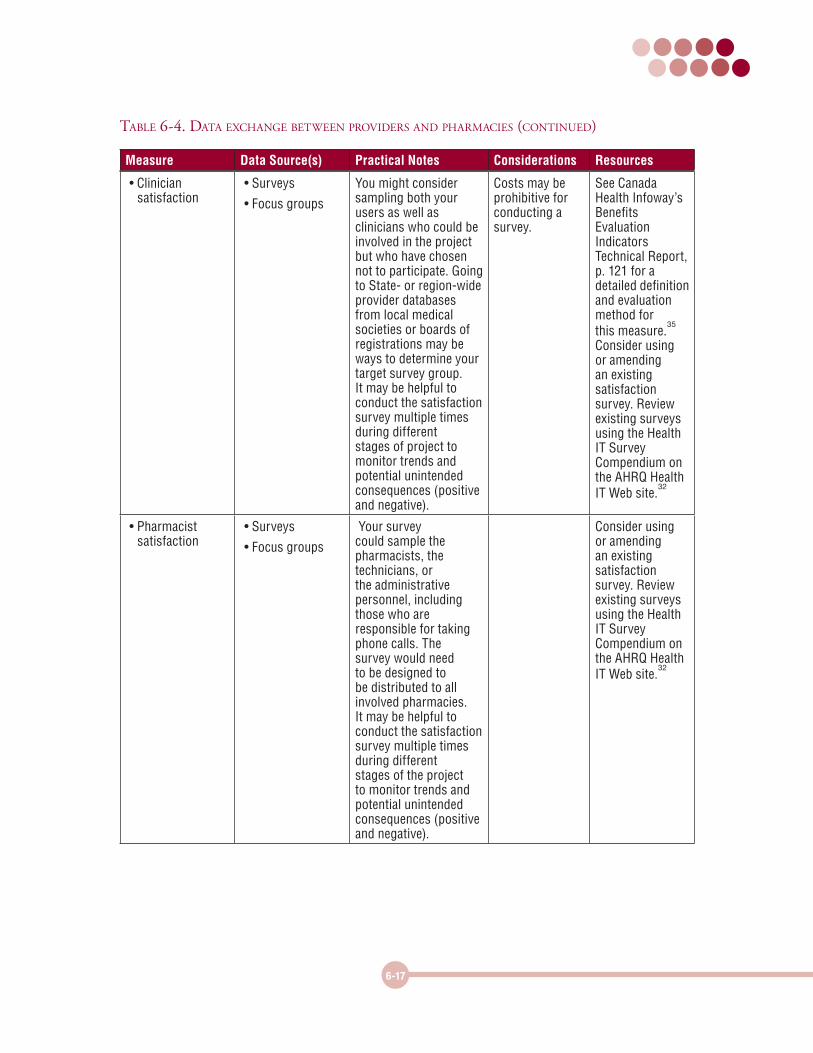
• Clinician satisfaction
• Surveys
• Focus groups
You might consider sampling both your users as well as clinicians who could be involved in the project but who have chosen not to participate. Going to State- or region-wide provider databases from local medical societies or boards of registrations may be ways to determine your target survey group. It may be helpful to conduct the satisfaction survey multiple times during different stages of project to monitor trends and potential unintended consequences (positive and negative).
Costs may be prohibitive for conducting a survey.
See Canada Health Infoway’s Benefits Evaluation Indicators Technical Report, p. 121 for a detailed definition and evaluation method for this measure.
35
Consider using or amending an existing satisfaction survey. Review existing surveys using the Health IT Survey Compendium on the AHRQ Health IT Web site.
32
• Pharmacist satisfaction
• Surveys
• Focus groups
Your survey could sample the pharmacists, the technicians, or the administrative personnel, including those who are responsible for taking phone calls. The survey would need to be designed to be distributed to all involved pharmacies. It may be helpful to conduct the satisfaction survey multiple times during different stages of the project to monitor trends and potential unintended consequences (positive and negative).
Consider using or amending an existing satisfaction survey. Review existing surveys using the Health IT Survey Compendium on the AHRQ Health IT Web site.
32
Measure Data Source(s) Practical Notes Considerations Resources
Table 6-4. daTa exChange beTween providers and pharmaCies (ConTinued)

6-18
• Patient satisfaction
• Surveys
• Focus groups
One approach is to give patients a survey along with the prescription.
Consider using or amending an existing satisfaction survey. Review existing surveys using the Health IT Survey Compendium on the AHRQ Health IT Web site.
32
Measure Data Source(s) Practical Notes Considerations Resources
Table 6-4. daTa exChange beTween providers and pharmaCies (ConTinued)
6-19
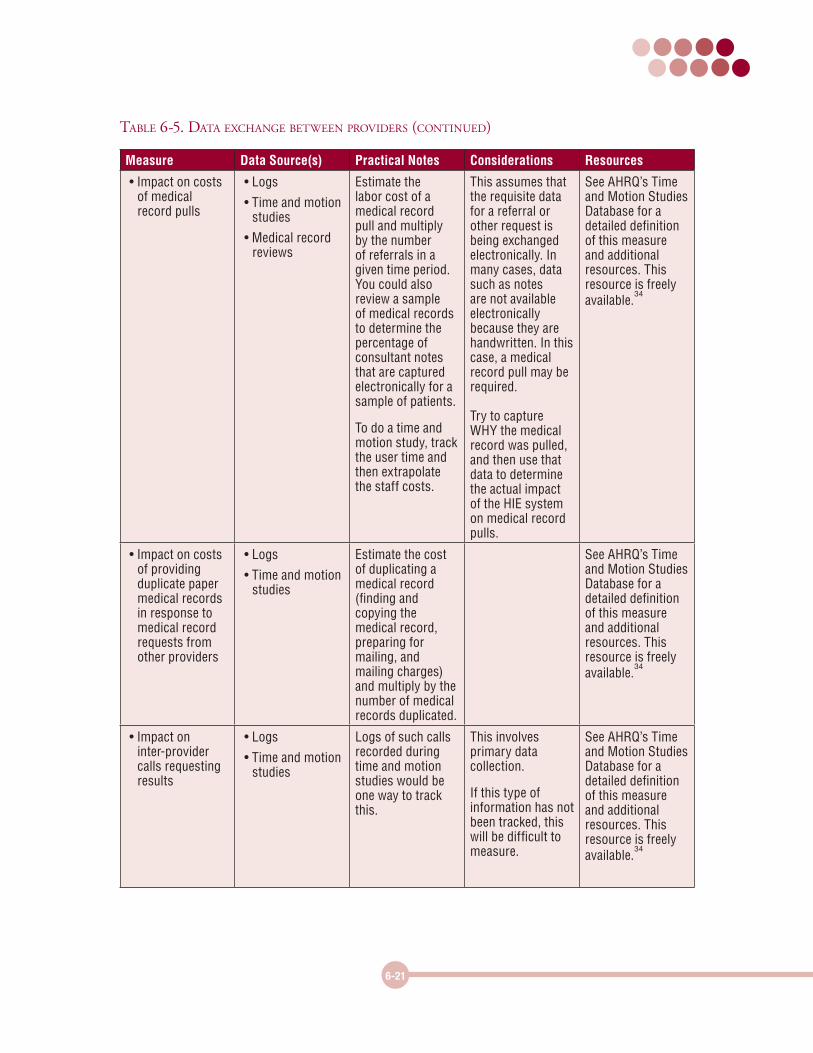
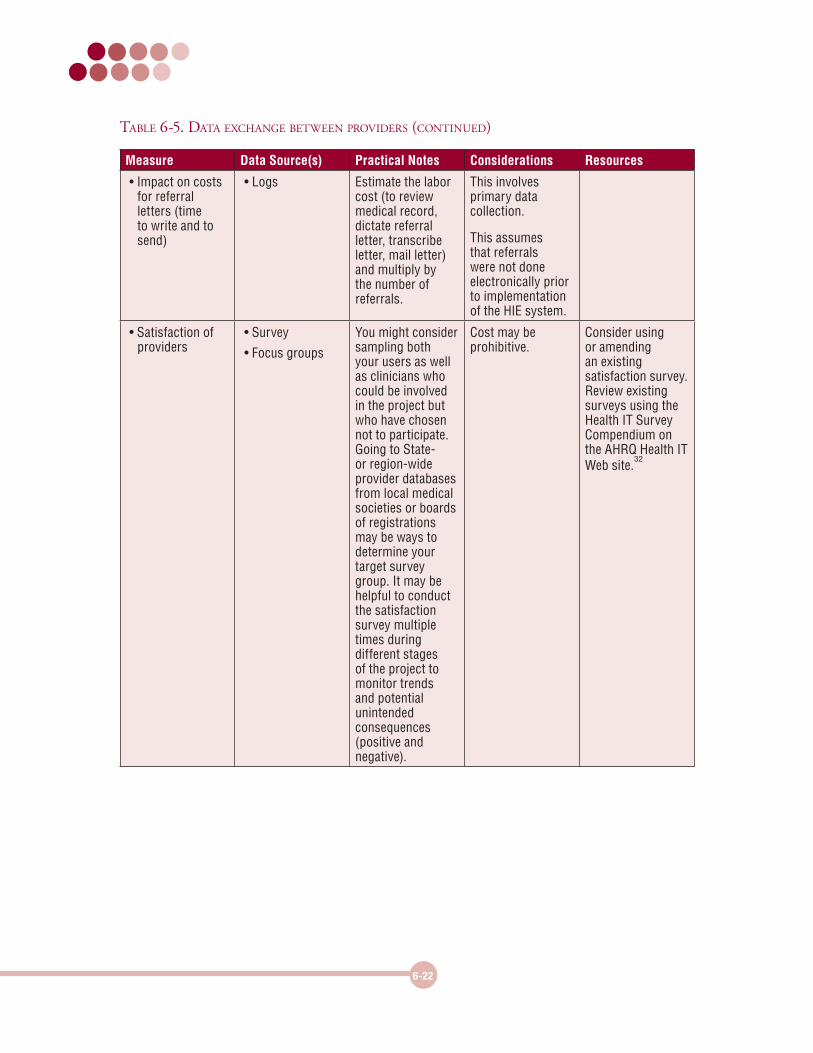
Table 6-5. daTa exChange beTween providers
Measure Data Source(s) Practical Notes Considerations Resources
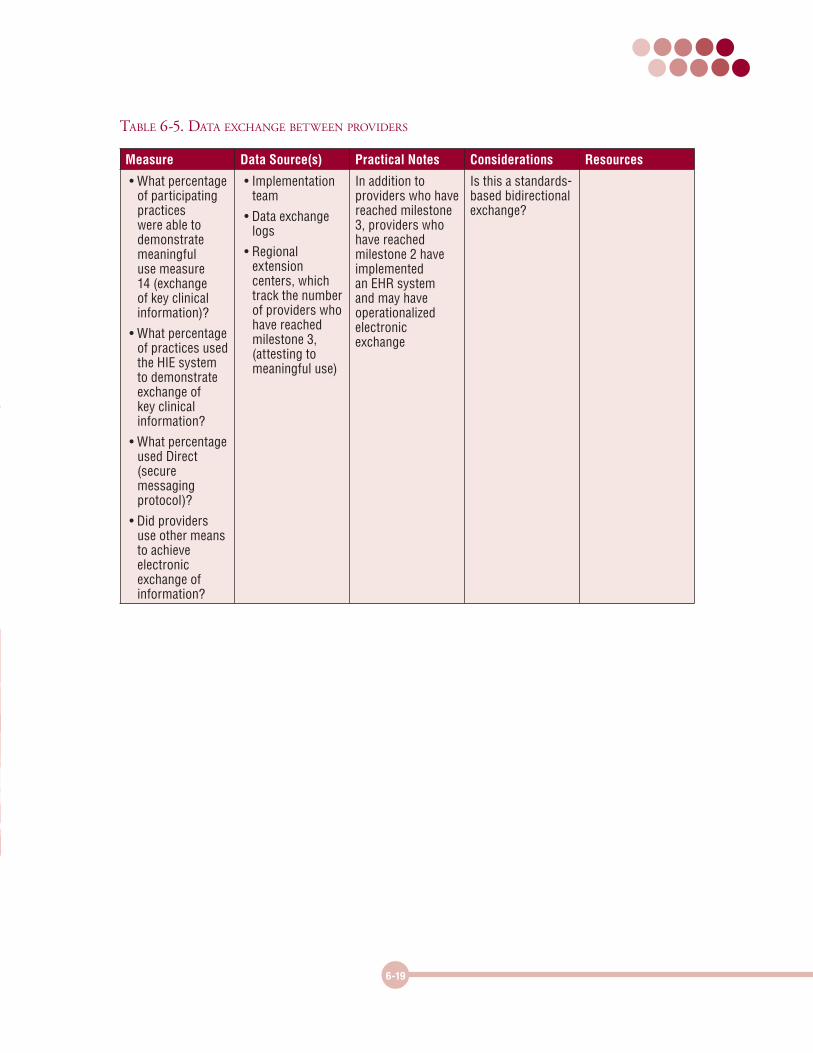
• What percentage of participating practices were able to demonstrate meaningful use measure 14 (exchange of key clinical information)?
• What percentage of practices used the HIE system to demonstrate exchange of key clinical information?
• What percentage used Direct (secure messaging protocol)?
• Did providers use other means to achieve electronic exchange of information?
• Implementation team
• Data exchange logs
• Regional extension centers, which track the number of providers who have reached milestone 3, (attesting to meaningful use)
In addition to providers who have reached milestone 3, providers who have reached milestone 2 have implemented an EHR system and may have operationalized electronic exchange
Is this a standards-based bidirectional exchange?
6-20
Measure Data Source(s) Practical Notes Considerations Resources
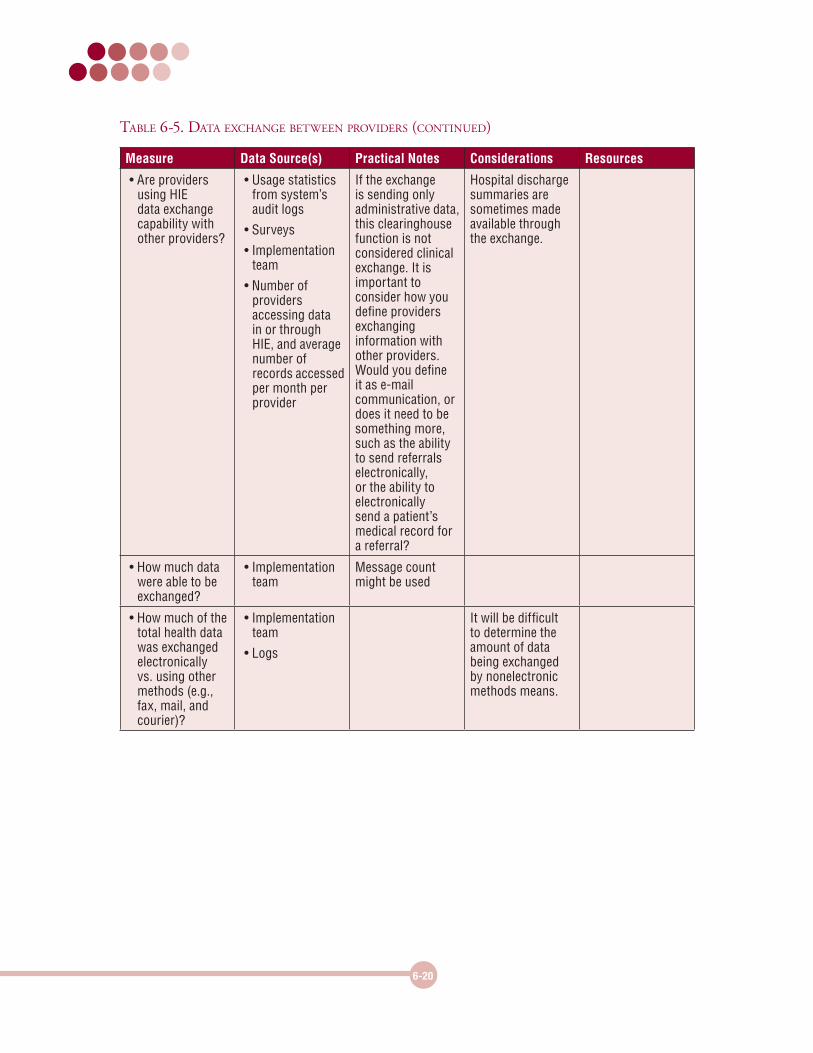
• Are providers using HIE data exchange capability with other providers?
• Usage statistics from system’s audit logs
• Surveys
• Implementation team
• Number of providers accessing data in or through HIE, and average number of records accessed per month per provider
If the exchange is sending only administrative data, this clearinghouse function is not considered clinical exchange. It is important to consider how you define providers exchanging information with other providers. Would you define it as e-mail communication, or does it need to be something more, such as the ability to send referrals electronically, or the ability to electronically send a patient’s medical record for a referral?
Hospital discharge summaries are sometimes made available through the exchange.
• How much data were able to be exchanged?
• Implementation team
Message count might be used
• How much of the total health data was exchanged electronically vs. using other methods (e.g., fax, mail, and courier)?
• Implementation team
• Logs
It will be difficult to determine the amount of data being exchanged by nonelectronic methods means.
Table 6-5. daTa exChange beTween providers (ConTinued)
6-21
Measure Data Source(s) Practical Notes Considerations Resources
• Impact on costs of medical record pulls
• Logs
• Time and motion studies
• Medical record reviews
Estimate the labor cost of a medical record pull and multiply by the number of referrals in a given time period. You could also review a sample of medical records to determine the percentage of consultant notes that are captured electronically for a sample of patients.
To do a time and motion study, track the user time and then extrapolate the staff costs.
This assumes that the requisite data for a referral or other request is being exchanged electronically. In many cases, data such as notes are not available electronically because they are handwritten. In this case, a medical record pull may be required. Try to capture WHY the medical record was pulled, and then use that data to determine the actual impact of the HIE system on medical record pulls.
See AHRQ’s Time and Motion Studies Database for a detailed definition of this measure and additional resources. This resource is freely available.
34
• Impact on costs of providing duplicate paper medical records in response to medical record requests from other providers
• Logs
• Time and motion studies
Estimate the cost of duplicating a medical record (finding and copying the medical record, preparing for mailing, and mailing charges) and multiply by the number of medical records duplicated.
See AHRQ’s Time and Motion Studies Database for a detailed definition of this measure and additional resources. This resource is freely available.
34
• Impact on inter-provider calls requesting results
• Logs
• Time and motion studies
Logs of such calls recorded during time and motion studies would be one way to track this.
This involves primary data collection.
If this type of information has not been tracked, this will be difficult to measure.
See AHRQ’s Time and Motion Studies Database for a detailed definition of this measure and additional resources. This resource is freely available.
34
Table 6-5. daTa exChange beTween providers (ConTinued)
6-22
Measure Data Source(s) Practical Notes Considerations Resources
• Impact on costs for referral letters (time to write and to send)
• Logs Estimate the labor cost (to review medical record, dictate referral letter, transcribe letter, mail letter) and multiply by the number of referrals.
This involves primary data collection.
This assumes that referrals were not done electronically prior to implementation of the HIE system.
• Satisfaction of providers
• Survey
• Focus groups
You might consider sampling both your users as well as clinicians who could be involved in the project but who have chosen not to participate. Going to State- or region-wide provider databases from local medical societies or boards of registrations may be ways to determine your target survey group. It may be helpful to conduct the satisfaction survey multiple times during different stages of the project to monitor trends and potential unintended consequences (positive and negative).
Cost may be prohibitive.
Consider using or amending an existing satisfaction survey. Review existing surveys using the Health IT Survey Compendium on the AHRQ Health IT Web site.
32
Table 6-5. daTa exChange beTween providers (ConTinued)
6-23
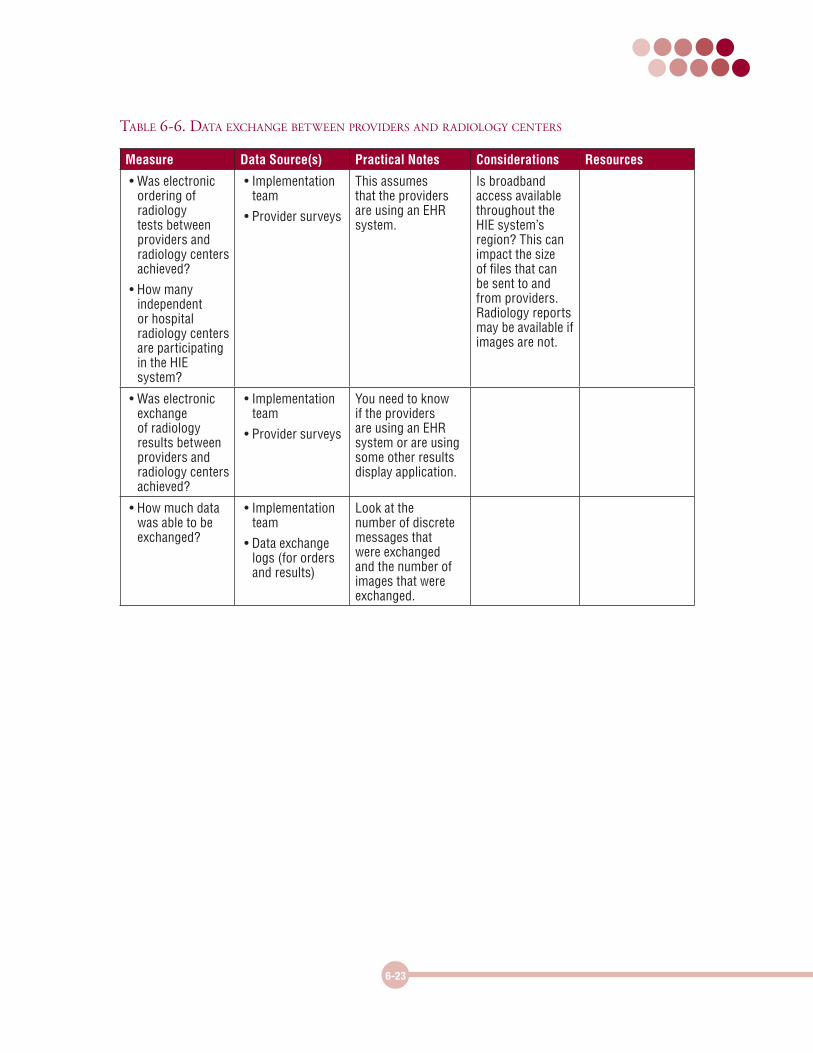
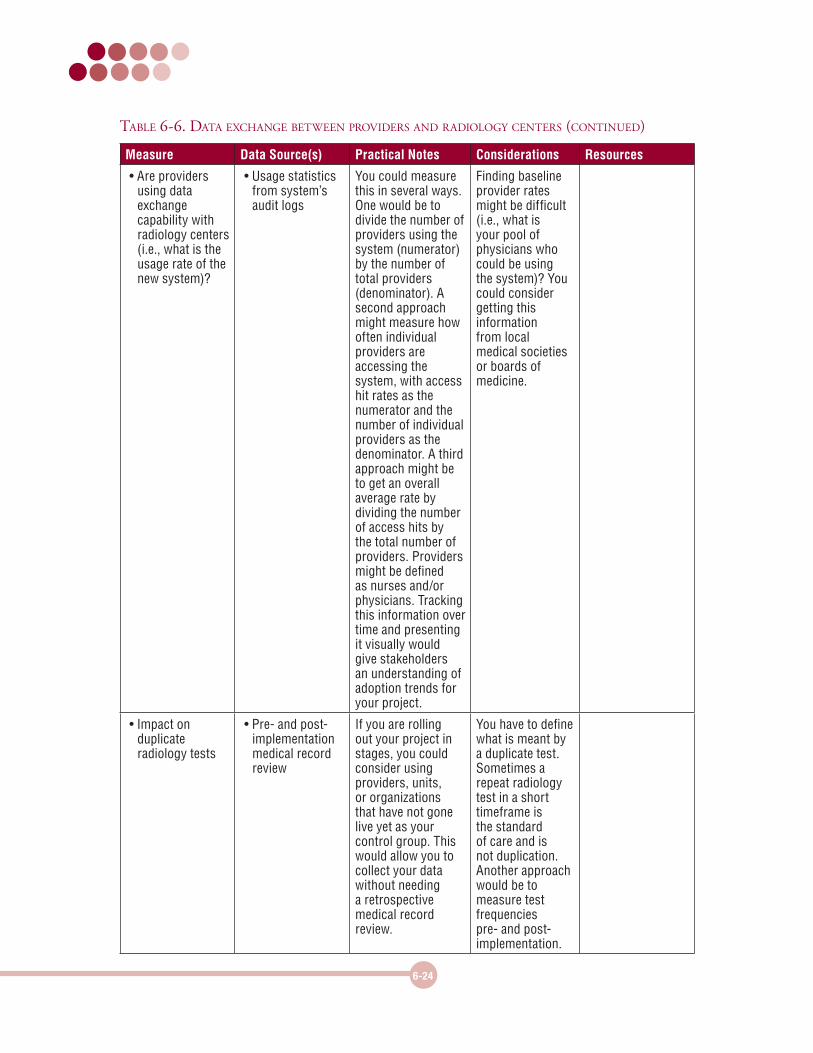
Table 6-6. daTa exChange beTween providers and radiology CenTers
Measure Data Source(s) Practical Notes Considerations Resources
• Was electronic ordering of radiology tests between providers and radiology centers achieved?
• How many independent or hospital radiology centers are participating in the HIE system?
• Implementation team
• Provider surveys
This assumes that the providers are using an EHR system.
Is broadband access available throughout the HIE system’s region? This can impact the size of files that can be sent to and from providers. Radiology reports may be available if images are not.
• Was electronic exchange of radiology results between providers and radiology centers achieved?
• Implementation team
• Provider surveys
You need to know if the providers are using an EHR system or are using some other results display application.
• How much data was able to be exchanged?
• Implementation team
• Data exchange logs (for orders and results)
Look at the number of discrete messages that were exchanged and the number of images that were exchanged.
6-24
Measure Data Source(s) Practical Notes Considerations Resources
• Are providers using data exchange capability with radiology centers (i.e., what is the usage rate of the new system)?
• Usage statistics from system’s audit logs
You could measure this in several ways. One would be to divide the number of providers using the system (numerator) by the number of total providers (denominator). A second approach might measure how often individual providers are accessing the system, with access hit rates as the numerator and the number of individual providers as the denominator. A third approach might be to get an overall average rate by dividing the number of access hits by the total number of providers. Providers might be defined as nurses and/or physicians. Tracking this information over time and presenting it visually would give stakeholders an understanding of adoption trends for your project.
Finding baseline provider rates might be difficult (i.e., what is your pool of physicians who could be using the system)? You could consider getting this information from local medical societies or boards of medicine.
• Impact on duplicate radiology tests
• Pre- and post-implementation medical record review
If you are rolling out your project in stages, you could consider using providers, units, or organizations that have not gone live yet as your control group. This would allow you to collect your data without needing a retrospective medical record review.
You have to define what is meant by a duplicate test. Sometimes a repeat radiology test in a short timeframe is the standard of care and is not duplication. Another approach would be to measure test frequencies pre- and post-implementation.
Table 6-6. daTa exChange beTween providers and radiology CenTers (ConTinued)
6-25
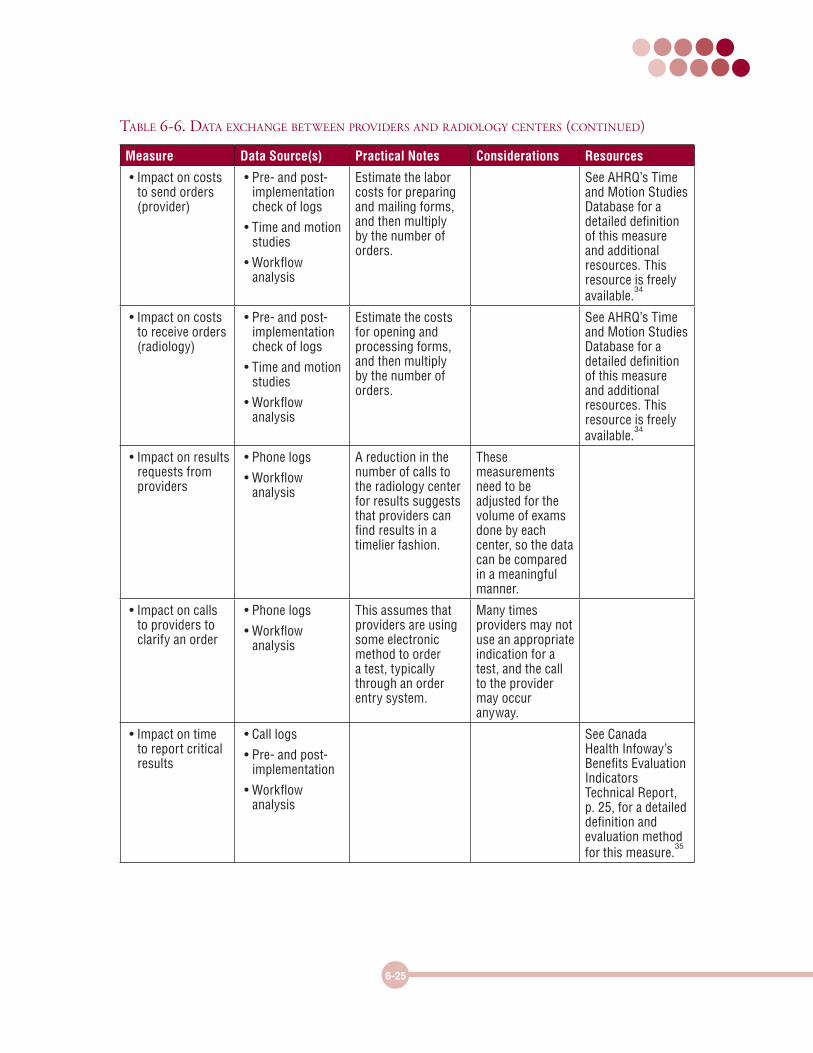
Measure Data Source(s) Practical Notes Considerations Resources
• Impact on costs to send orders (provider)
• Pre- and post-implementation check of logs
• Time and motion studies
• Workflow analysis
Estimate the labor costs for preparing and mailing forms, and then multiply by the number of orders.
See AHRQ’s Time and Motion Studies Database for a detailed definition of this measure and additional resources. This resource is freely available.
34
• Impact on costs to receive orders (radiology)
• Pre- and post-implementation check of logs
• Time and motion studies
• Workflow analysis
Estimate the costs for opening and processing forms, and then multiply by the number of orders.
See AHRQ’s Time and Motion Studies Database for a detailed definition of this measure and additional resources. This resource is freely available.
34
• Impact on results requests from providers
• Phone logs
• Workflow analysis
A reduction in the number of calls to the radiology center for results suggests that providers can find results in a timelier fashion.
These measurements need to be adjusted for the volume of exams done by each center, so the data can be compared in a meaningful manner.
• Impact on calls to providers to clarify an order
• Phone logs
• Workflow analysis
This assumes that providers are using some electronic method to order a test, typically through an order entry system.
Many times providers may not use an appropriate indication for a test, and the call to the provider may occur anyway.
• Impact on time to report critical results
• Call logs
• Pre- and post-implementation
• Workflow analysis
See Canada Health Infoway’s Benefits Evaluation Indicators Technical Report, p. 25, for a detailed definition and evaluation method for this measure.
35
Table 6-6. daTa exChange beTween providers and radiology CenTers (ConTinued)
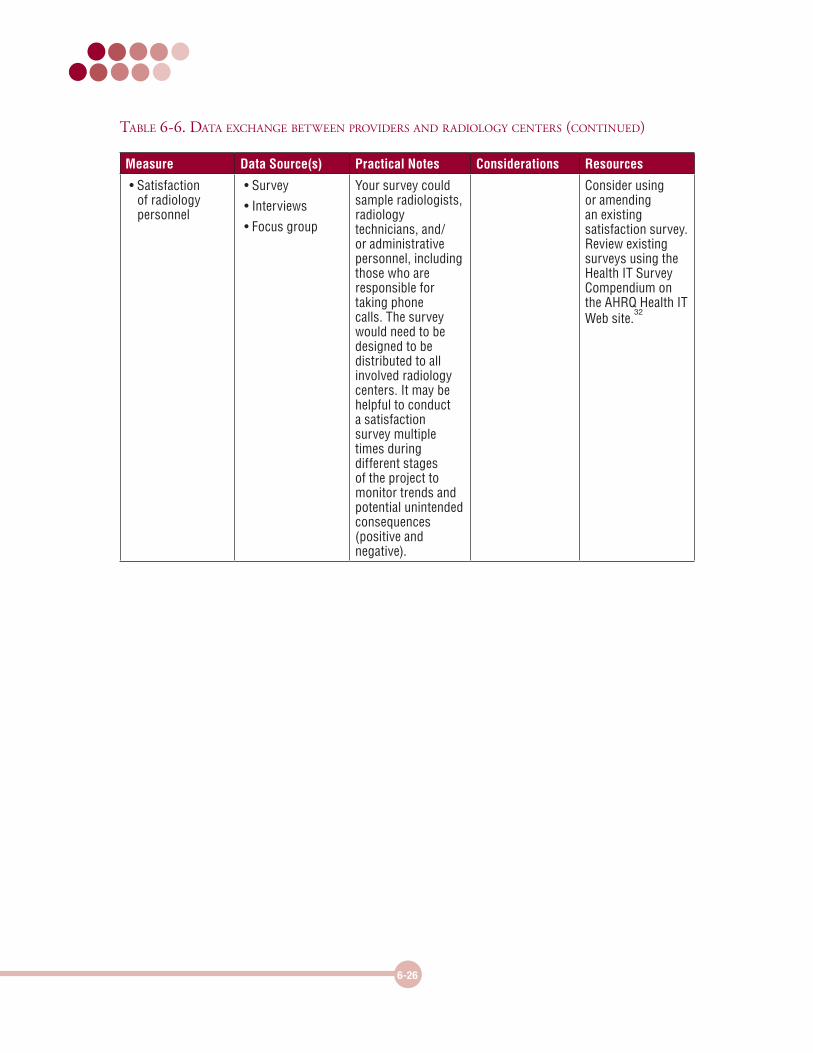
Measure Data Source(s) Practical Notes Considerations Resources
• Satisfaction of radiology personnel
• Survey
• Interviews
• Focus group
Your survey could sample radiologists, radiology technicians, and/or administrative personnel, including those who are responsible for taking phone calls. The survey would need to be designed to be distributed to all involved radiology centers. It may be helpful to conduct a satisfaction survey multiple times during different stages of the project to monitor trends and potential unintended consequences (positive and negative).
Consider using or amending an existing satisfaction survey. Review existing surveys using the Health IT Survey Compendium on the AHRQ Health IT Web site.
32
6-26
Table 6-6. daTa exChange beTween providers and radiology CenTers (ConTinued)
6-27
Measure Data Source(s) Practical Notes Considerations Resources
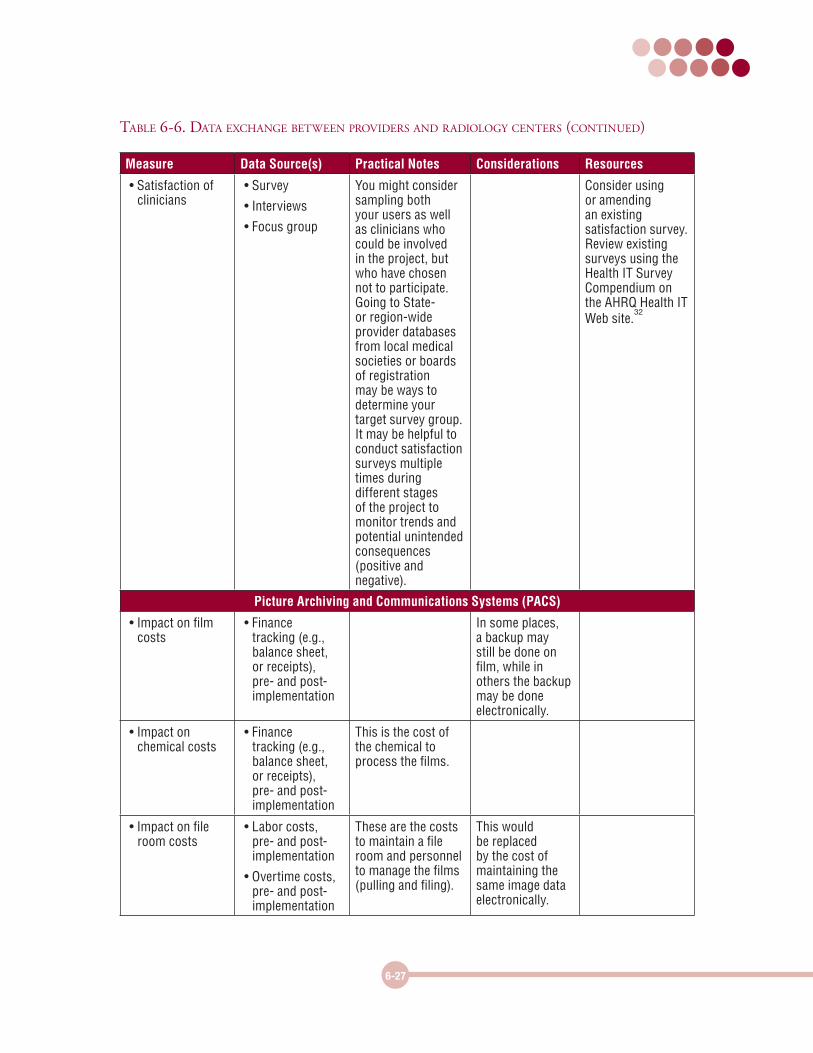
• Satisfaction of clinicians
• Survey
• Interviews
• Focus group
You might consider sampling both your users as well as clinicians who could be involved in the project, but who have chosen not to participate. Going to State- or region-wide provider databases from local medical societies or boards of registration may be ways to determine your target survey group. It may be helpful to conduct satisfaction surveys multiple times during different stages of the project to monitor trends and potential unintended consequences (positive and negative).
Consider using or amending an existing satisfaction survey. Review existing surveys using the Health IT Survey Compendium on the AHRQ Health IT Web site.
32
Picture Archiving and Communications Systems (PACS)
• Impact on film costs
• Finance tracking (e.g., balance sheet, or receipts), pre- and post-implementation
In some places, a backup may still be done on film, while in others the backup may be done electronically.
• Impact on chemical costs
• Finance tracking (e.g., balance sheet, or receipts), pre- and post-implementation
This is the cost of the chemical to process the films.
• Impact on file room costs
• Labor costs, pre- and post-implementation
• Overtime costs, pre- and post-implementation
These are the costs to maintain a file room and personnel to manage the films (pulling and filing).
This would be replaced by the cost of maintaining the same image data electronically.
Table 6-6. daTa exChange beTween providers and radiology CenTers (ConTinued)
6-28
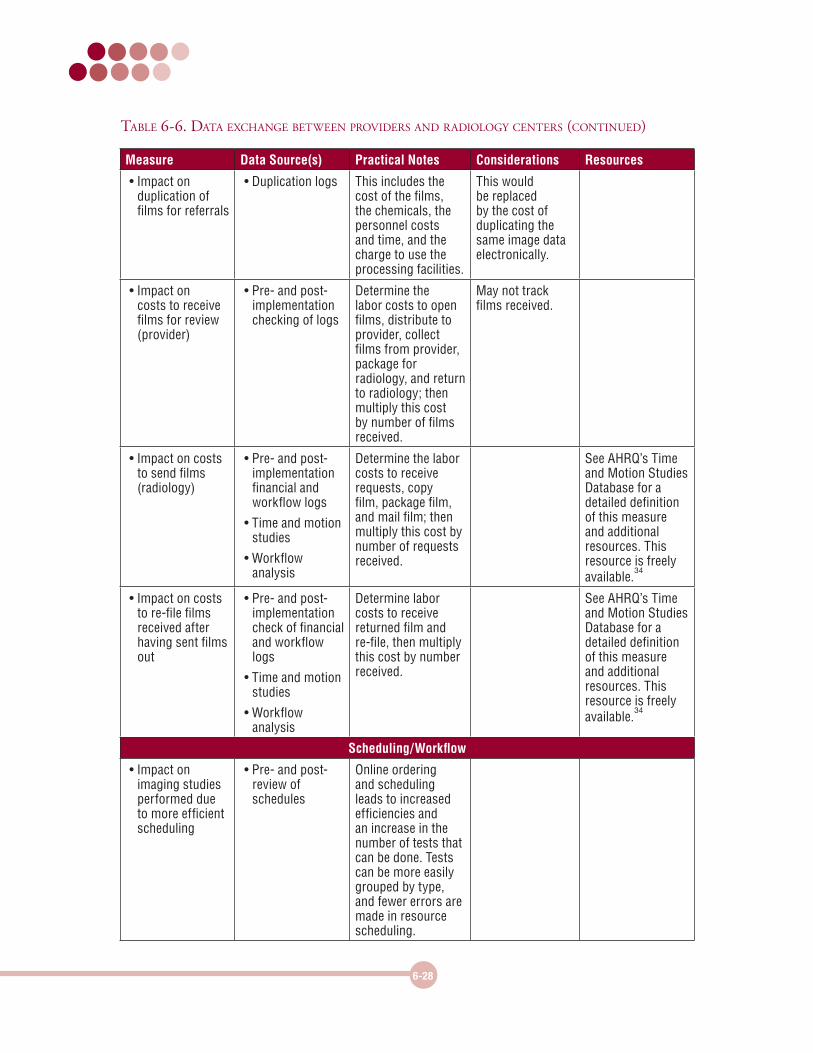
Measure Data Source(s) Practical Notes Considerations Resources
• Impact on duplication of films for referrals
• Duplication logs This includes the cost of the films, the chemicals, the personnel costs and time, and the charge to use the processing facilities.
This would be replaced by the cost of duplicating the same image data electronically.
• Impact on costs to receive films for review (provider)
• Pre- and post-implementation checking of logs
Determine the labor costs to open films, distribute to provider, collect films from provider, package for radiology, and return to radiology; then multiply this cost by number of films received.
May not track films received.
• Impact on costs to send films (radiology)
• Pre- and post-implementation financial and workflow logs
• Time and motion studies
• Workflow analysis
Determine the labor costs to receive requests, copy film, package film, and mail film; then multiply this cost by number of requests received.
See AHRQ’s Time and Motion Studies Database for a detailed definition of this measure and additional resources. This resource is freely available.
34
• Impact on costs to re-file films received after having sent films out
• Pre- and post-implementation check of financial and workflow logs
• Time and motion studies
• Workflow analysis
Determine labor costs to receive returned film and re-file, then multiply this cost by number received.
See AHRQ’s Time and Motion Studies Database for a detailed definition of this measure and additional resources. This resource is freely available.
34
Scheduling/Workflow
• Impact on imaging studies performed due to more efficient scheduling
• Pre- and post-review of schedules
Online ordering and scheduling leads to increased efficiencies and an increase in the number of tests that can be done. Tests can be more easily grouped by type, and fewer errors are made in resource scheduling.
Table 6-6. daTa exChange beTween providers and radiology CenTers (ConTinued)
6-29
Measure Data Source(s) Practical Notes Considerations Resources
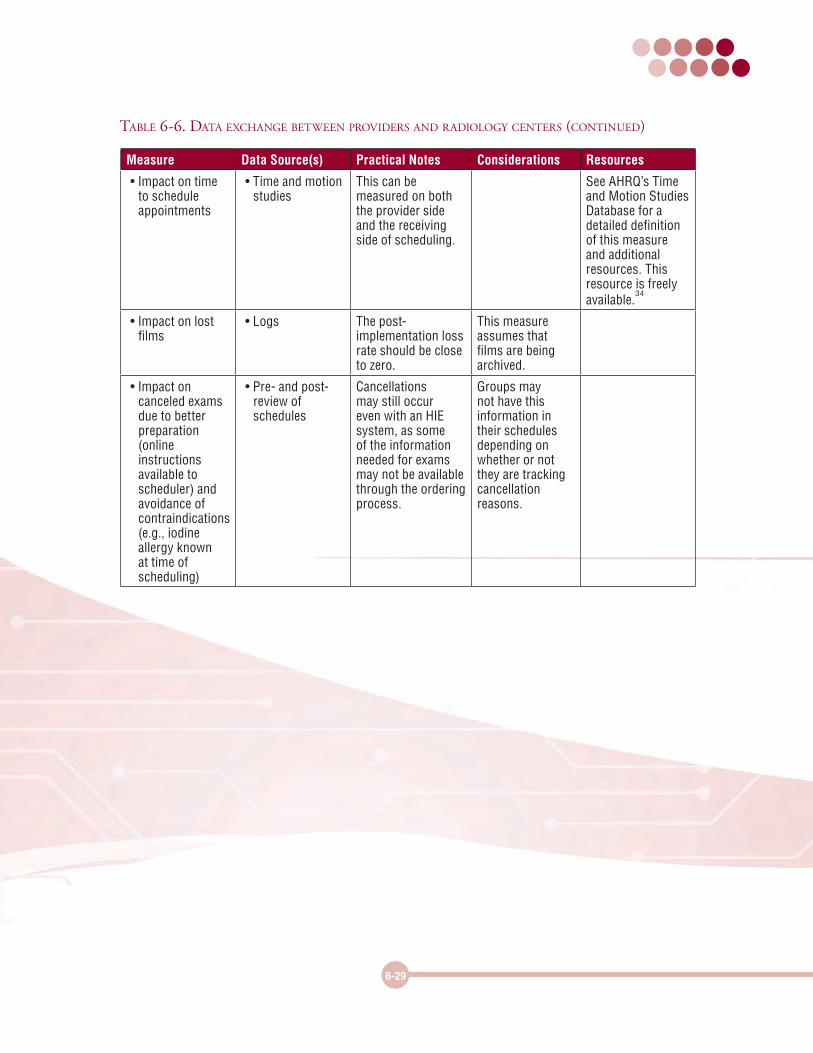
• Impact on time to schedule appointments
• Time and motion studies
This can be measured on both the provider side and the receiving side of scheduling.
See AHRQ’s Time and Motion Studies Database for a detailed definition of this measure and additional resources. This resource is freely available.
34
• Impact on lost films
• Logs The post-implementation loss rate should be close to zero.
This measure assumes that films are being archived.
• Impact on canceled exams due to better preparation (online instructions available to scheduler) and avoidance of contraindications (e.g., iodine allergy known at time of scheduling)
• Pre- and post-review of schedules
Cancellations may still occur even with an HIE system, as some of the information needed for exams may not be available through the ordering process.
Groups may not have this information in their schedules depending on whether or not they are tracking cancellation reasons.
Table 6-6. daTa exChange beTween providers and radiology CenTers (ConTinued)

6-30
Table 6-7. daTa exChange beTween providers and publiC healTh deparTmenTs
Measure Data Source(s) Practical Notes Considerations Resources
• Was electronic exchange of public health information between providers and public health departments achieved?
• Are local or State public health partners in the exchange?
• Implementation team
• Data exchange logs for reportable health conditions
Evaluators may want to consider bidirectional data flow (to public health for reportable conditions, and from public health for treatment guidelines).
This is an exchange capability measure.
Is there an immunization registry for your area? Evaluators may need to take into consideration that, in many States, this information transfer happens by other means already. Therefore, evaluators need to determine how much of the information flow is occurring due to the new HIE system.
• How much data were able to be exchanged?
• Have participation levels in the immunization system increased?
• Implementation team
• Data exchange logs
• State or regional public health offices
Look at the number of discrete messages that were exchanged.
Evaluators may need to take into consideration that, in many States, this information transfer happens by other means already. Therefore, evaluators need to determine how much of the information flow is occurring due to the new HIE system.
• Impact on costs to prepare reports
• Reports prepared
• Time and motion studies
Estimate labor costs to find information and prepare a report, then multiply by the number of reports prepared.
See AHRQ’s Time and Motion Studies Database for a detailed definition of this measure and additional resources. This resource is freely available.
34
6-31
Measure Data Source(s) Practical Notes Considerations Resources
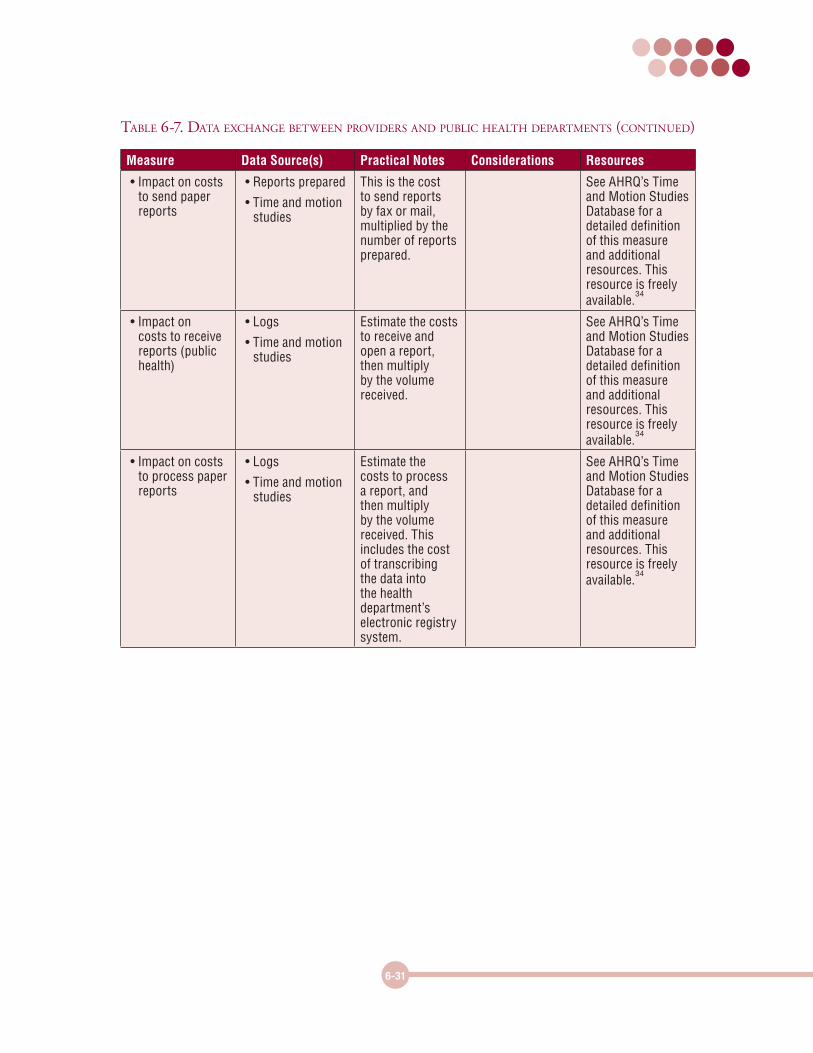
• Impact on costs to send paper reports
• Reports prepared
• Time and motion studies
This is the cost to send reports by fax or mail, multiplied by the number of reports prepared.
See AHRQ’s Time and Motion Studies Database for a detailed definition of this measure and additional resources. This resource is freely available.
34
• Impact on costs to receive reports (public health)
• Logs
• Time and motion studies
Estimate the costs to receive and open a report, then multiply by the volume received.
See AHRQ’s Time and Motion Studies Database for a detailed definition of this measure and additional resources. This resource is freely available.
34
• Impact on costs to process paper reports
• Logs
• Time and motion studies
Estimate the costs to process a report, and then multiply by the volume received. This includes the cost of transcribing the data into the health department’s electronic registry system.
See AHRQ’s Time and Motion Studies Database for a detailed definition of this measure and additional resources. This resource is freely available.
34
Table 6-7. daTa exChange beTween providers and publiC healTh deparTmenTs (ConTinued)
6-32
Measure Data Source(s) Practical Notes Considerations Resources
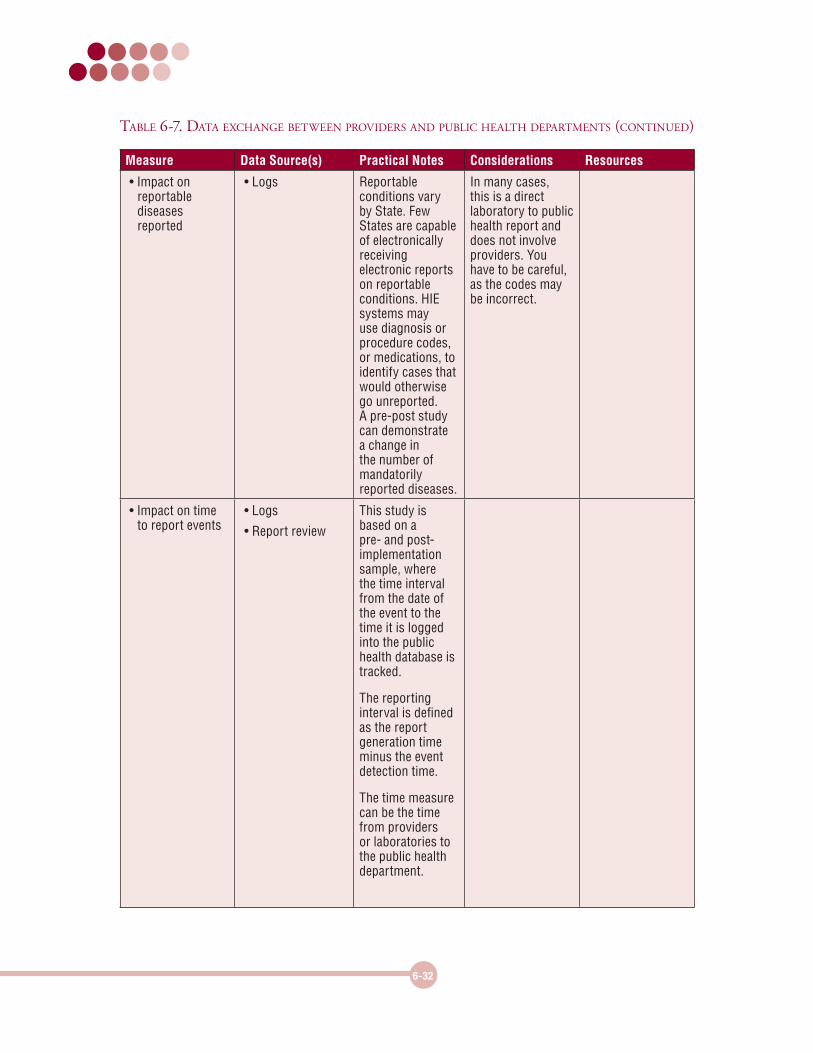
• Impact on reportable diseases reported
• Logs Reportable conditions vary by State. Few States are capable of electronically receiving electronic reports on reportable conditions. HIE systems may use diagnosis or procedure codes, or medications, to identify cases that would otherwise go unreported. A pre-post study can demonstrate a change in the number of mandatorily reported diseases.
In many cases, this is a direct laboratory to public health report and does not involve providers. You have to be careful, as the codes may be incorrect.
• Impact on time to report events
• Logs
• Report review
This study is based on a pre- and post-implementation sample, where the time interval from the date of the event to the time it is logged into the public health database is tracked.
The reporting interval is defined as the report generation time minus the event detection time.
The time measure can be the time from providers or laboratories to the public health department.
Table 6-7. daTa exChange beTween providers and publiC healTh deparTmenTs (ConTinued)
6-33
Measure Data Source(s) Practical Notes Considerations Resources
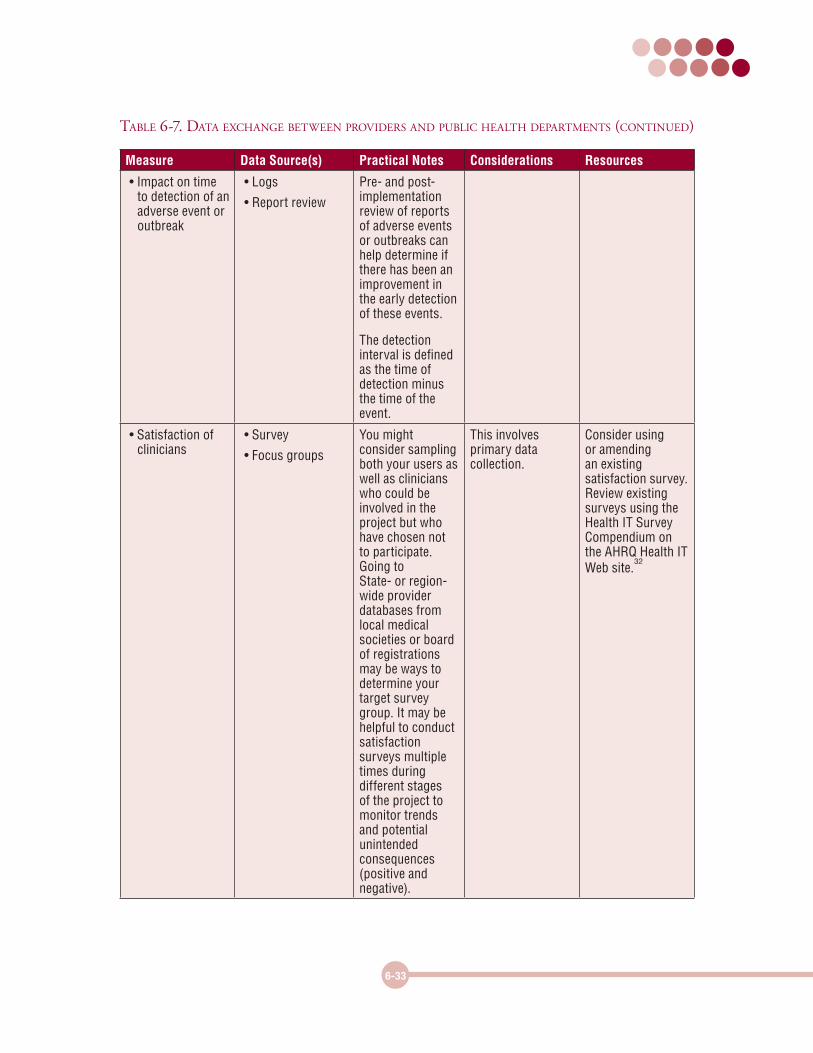
• Impact on time to detection of an adverse event or outbreak
• Logs
• Report review
Pre- and post-implementation review of reports of adverse events or outbreaks can help determine if there has been an improvement in the early detection of these events.
The detection interval is defined as the time of detection minus the time of the event.
• Satisfaction of clinicians
• Survey
• Focus groups
You might consider sampling both your users as well as clinicians who could be involved in the project but who have chosen not to participate. Going to State- or region-wide provider databases from local medical societies or board of registrations may be ways to determine your target survey group. It may be helpful to conduct satisfaction surveys multiple times during different stages of the project to monitor trends and potential unintended consequences (positive and negative).
This involves primary data collection.
Consider using or amending an existing satisfaction survey. Review existing surveys using the Health IT Survey Compendium on the AHRQ Health IT Web site.
32
Table 6-7. daTa exChange beTween providers and publiC healTh deparTmenTs (ConTinued)
6-34
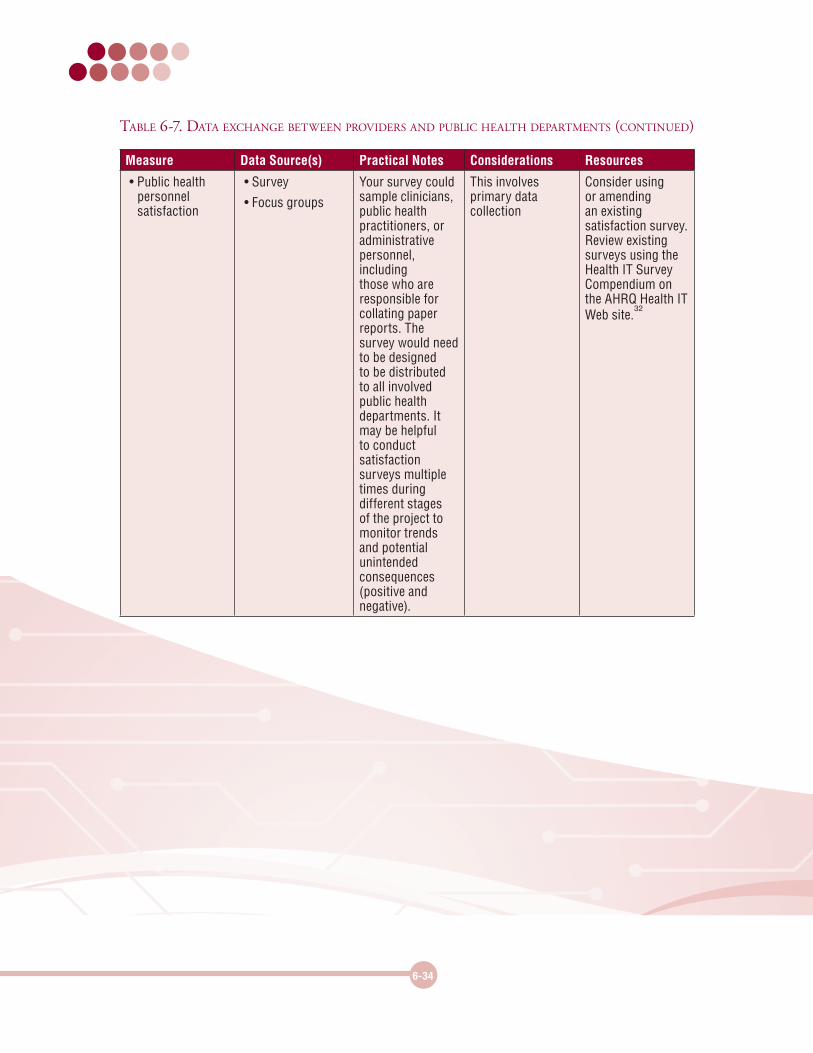
Measure Data Source(s) Practical Notes Considerations Resources
• Public health personnel satisfaction
• Survey
• Focus groups
Your survey could sample clinicians, public health practitioners, or administrative personnel, including those who are responsible for collating paper reports. The survey would need to be designed to be distributed to all involved public health departments. It may be helpful to conduct satisfaction surveys multiple times during different stages of the project to monitor trends and potential unintended consequences (positive and negative).
This involves primary data collection
Consider using or amending an existing satisfaction survey. Review existing surveys using the Health IT Survey Compendium on the AHRQ Health IT Web site.
32
Table 6-7. daTa exChange beTween providers and publiC healTh deparTmenTs (ConTinued)
6-35
Measures for Clinical Outcome and Clinical Process EvaluationThe tables in this subsection provide examples of measures for the four types of outcomes: process outcomes, intermediate outcomes (e.g., provider adoption and attitudes, patient knowledge and attitudes, impact on workflow), clinical outcomes, and financial outcomes. The tables list measures in the following categories:
z Table 6-8. Clinical outcomes measures
z Table 6-9. Clinical process measures
z Table 6-10. Provider adoption and attitudes measures
z Table 6-11. Patient knowledge and attitudes measures
z Table 6-12. Workflow impact measures
z Table 6-13. Financial impact measures
6-36
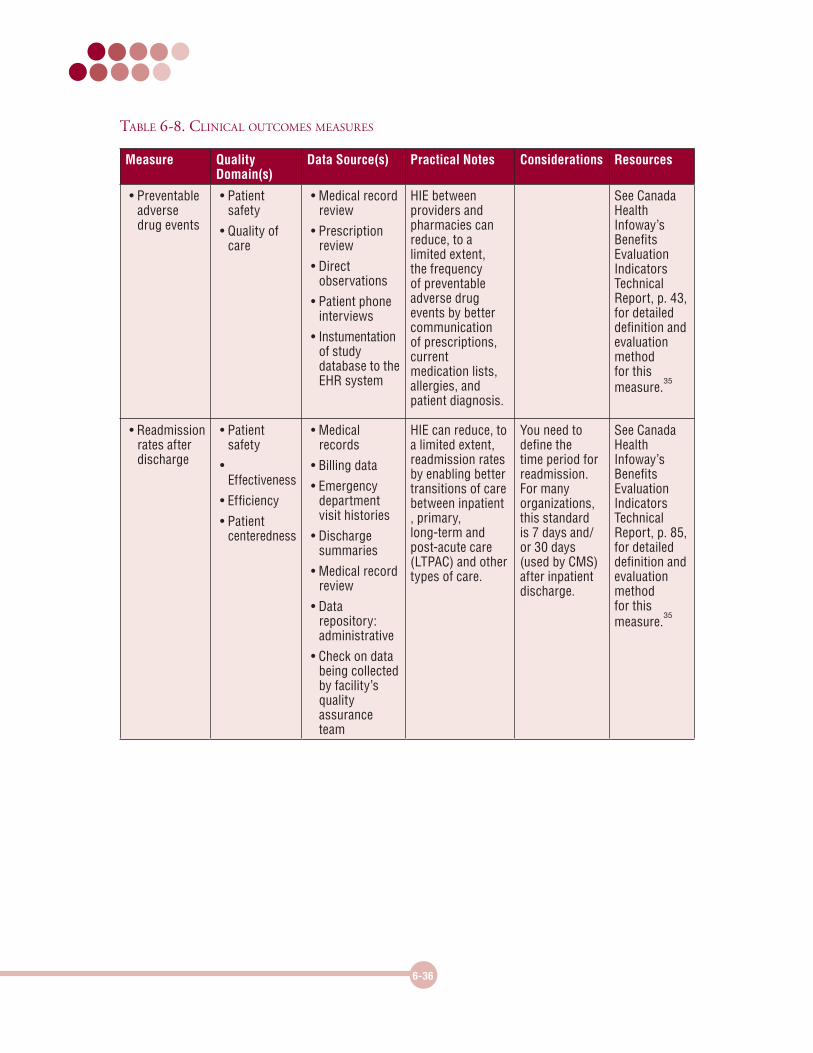
Table 6-8. CliniCal ouTComes measures
Measure Quality Domain(s)
Data Source(s) Practical Notes Considerations Resources
• Preventable adverse drug events
• Patient safety
• Quality of care
• Medical record review
• Prescription review
• Direct observations
• Patient phone interviews
• Instumentation of study database to the EHR system
HIE between providers and pharmacies can reduce, to a limited extent, the frequency of preventable adverse drug events by better communication of prescriptions, current medication lists, allergies, and patient diagnosis.
See Canada Health Infoway’s Benefits Evaluation Indicators Technical Report, p. 43, for detailed definition and evaluation method for this measure.
35
• Readmission rates after discharge
• Patient safety
• Effectiveness
• Efficiency
• Patient centeredness
• Medical records
• Billing data
• Emergency department visit histories
• Discharge summaries
• Medical record review
• Data repository: administrative
• Check on data being collected by facility’s quality assurance team
HIE can reduce, to a limited extent, readmission rates by enabling better transitions of care between inpatient , primary, long-term and post-acute care (LTPAC) and other types of care.
You need to define the time period for readmission. For many organizations, this standard is 7 days and/or 30 days (used by CMS) after inpatient discharge.
See Canada Health Infoway’s Benefits Evaluation Indicators Technical Report, p. 85, for detailed definition and evaluation method for this measure.
35
6-37
Measure Quality Domain(s)
Data Source(s) Practical Notes Considerations Resources
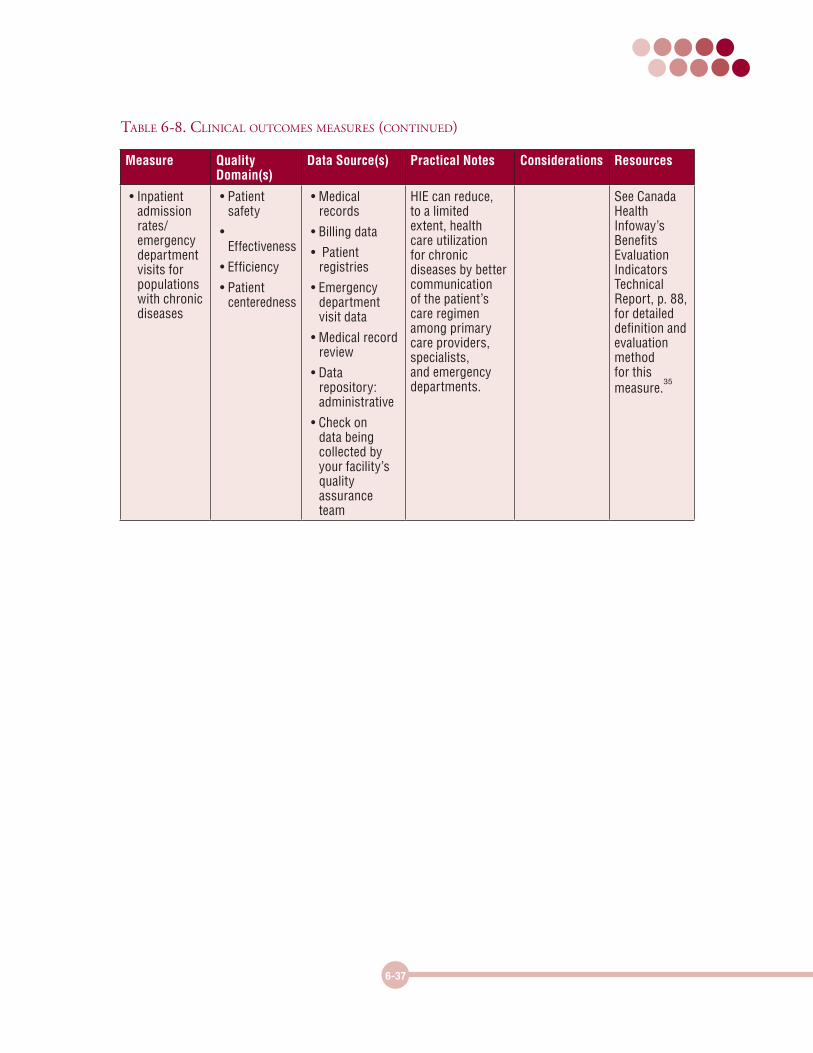
• Inpatient admission rates/ emergency department visits for populations with chronic diseases
• Patient safety
• Effectiveness
• Efficiency
• Patient centeredness
• Medical records
• Billing data
• Patient registries
• Emergency department visit data
• Medical record review
• Data repository: administrative
• Check on data being collected by your facility’s quality assurance team
HIE can reduce, to a limited extent, health care utilization for chronic diseases by better communication of the patient’s care regimen among primary care providers, specialists, and emergency departments.
See Canada Health Infoway’s Benefits Evaluation Indicators Technical Report, p. 88, for detailed definition and evaluation method for this measure.
35
Table 6-8. CliniCal ouTComes measures (ConTinued)
6-38
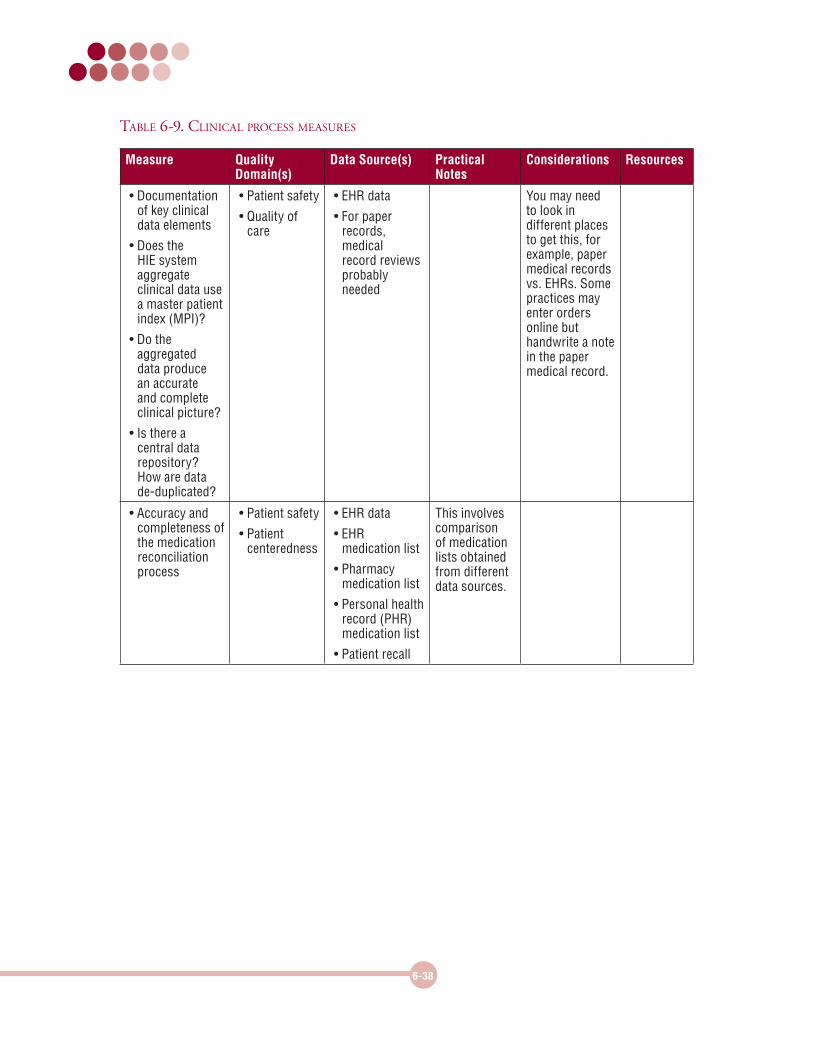
Table 6-9. CliniCal proCess measures
Measure Quality Domain(s)
Data Source(s) Practical Notes
Considerations Resources
• Documentation of key clinical data elements
• Does the HIE system aggregate clinical data use a master patient index (MPI)?
• Do the aggregated data produce an accurate and complete clinical picture?
• Is there a central data repository? How are data de-duplicated?
• Patient safety
• Quality of care
• EHR data
• For paper records, medical record reviews probably needed
You may need to look in different places to get this, for example, paper medical records vs. EHRs. Some practices may enter orders online but handwrite a note in the paper medical record.
• Accuracy and completeness of the medication reconciliation process
• Patient safety
• Patient centeredness
• EHR data
• EHR medication list
• Pharmacy medication list
• Personal health record (PHR) medication list
• Patient recall
This involves comparison of medication lists obtained from different data sources.
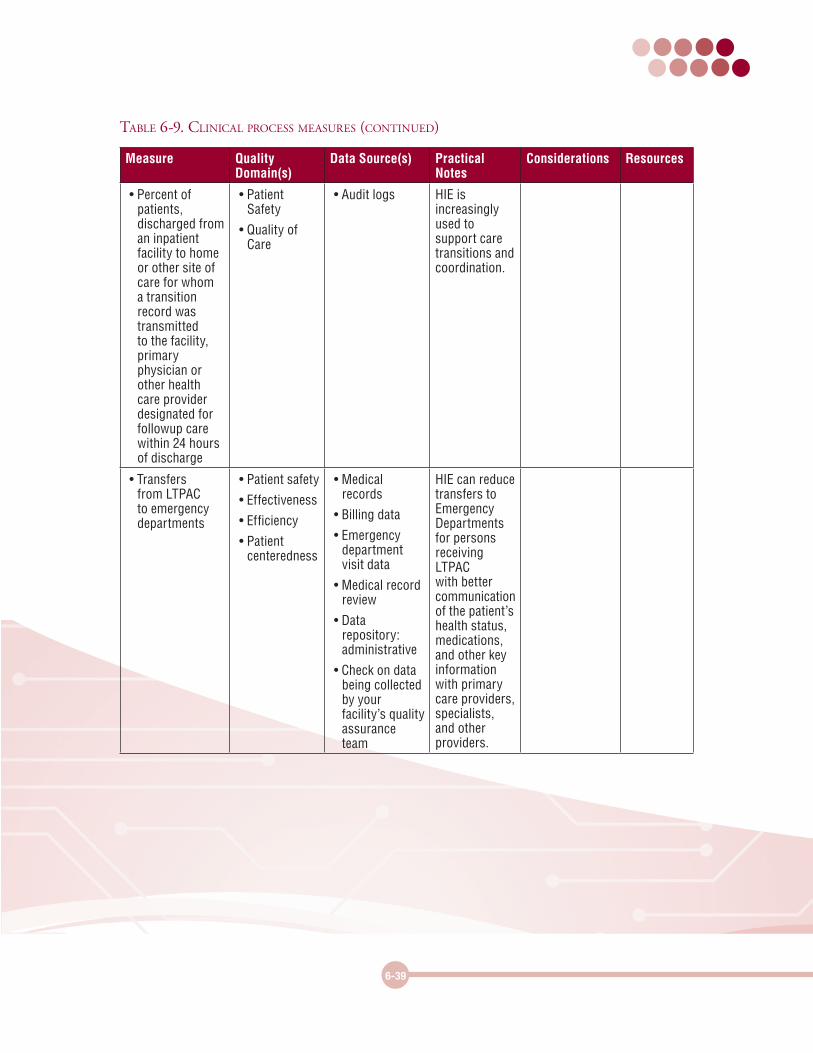
6-39
Measure Quality Domain(s)
Data Source(s) Practical Notes
Considerations Resources
• Percent of patients, discharged from an inpatient facility to home or other site of care for whom a transition record was transmitted to the facility, primary physician or other health care provider designated for followup care within 24 hours of discharge
• Patient Safety
• Quality of Care
• Audit logs HIE is increasingly used to support care transitions and coordination.
• Transfers from LTPAC to emergency departments
• Patient safety
• Effectiveness
• Efficiency
• Patient centeredness
• Medical records
• Billing data
• Emergency department visit data
• Medical record review
• Data repository: administrative
• Check on data being collected by your facility’s quality assurance team
HIE can reduce transfers to Emergency Departments for persons receiving LTPAC with better communication of the patient’s health status, medications, and other key information with primary care providers, specialists, and other providers.
Table 6-9. CliniCal proCess measures (ConTinued)
6-40
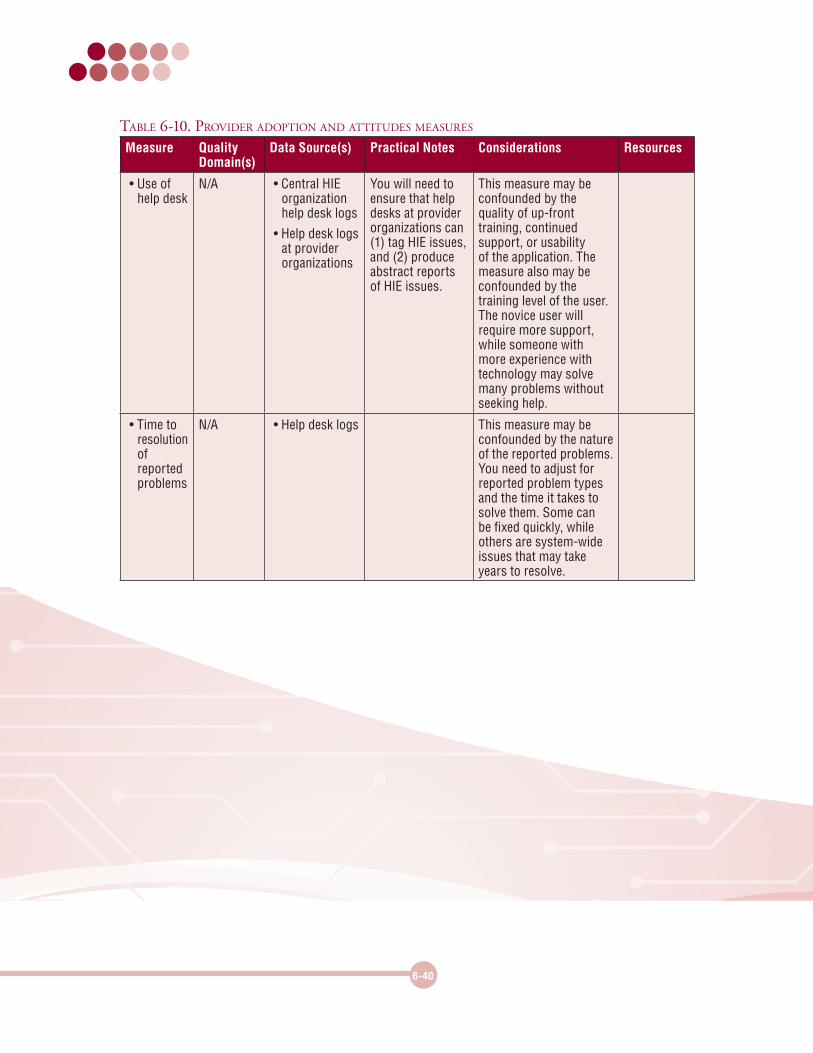
Table 6-10. provider adopTion and aTTiTudes measures
Measure Quality Domain(s)
Data Source(s) Practical Notes Considerations Resources
• Use of help desk
N/A • Central HIE organization help desk logs
• Help desk logs at provider organizations
You will need to ensure that help desks at provider organizations can (1) tag HIE issues, and (2) produce abstract reports of HIE issues.
This measure may be confounded by the quality of up-front training, continued support, or usability of the application. The measure also may be confounded by the training level of the user. The novice user will require more support, while someone with more experience with technology may solve many problems without seeking help.
• Time to resolution of reported problems
N/A • Help desk logs This measure may be confounded by the nature of the reported problems. You need to adjust for reported problem types and the time it takes to solve them. Some can be fixed quickly, while others are system-wide issues that may take years to resolve.
6-41
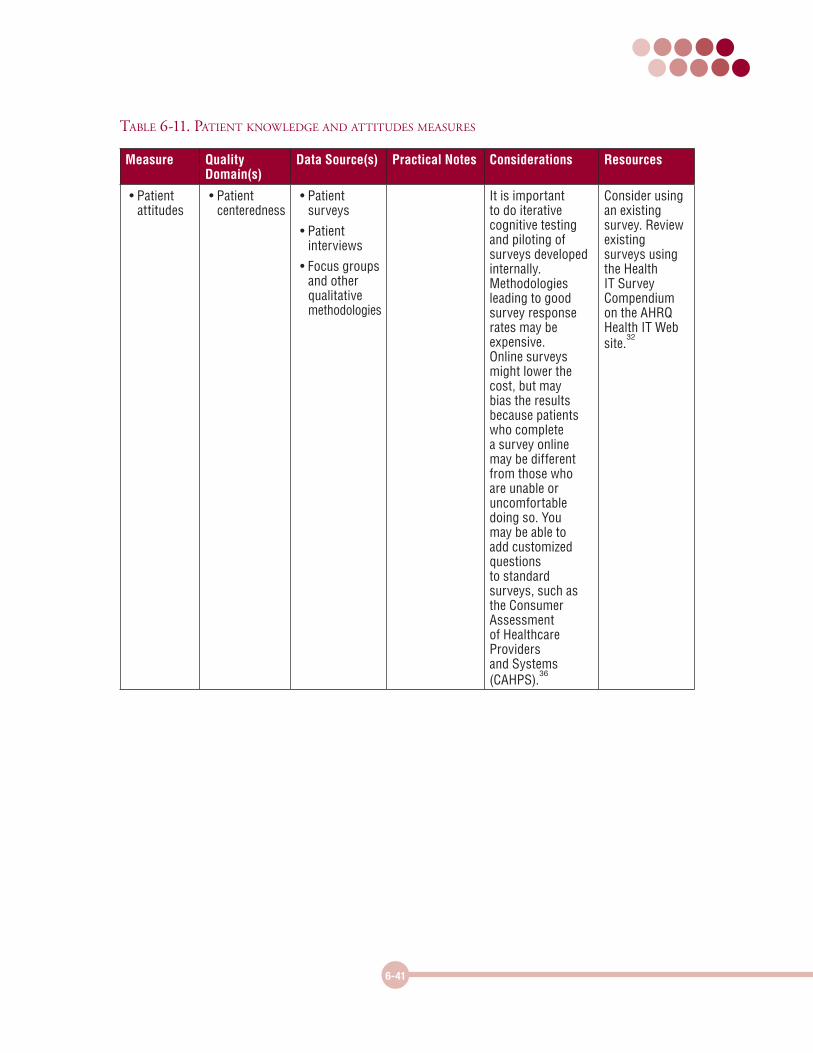
Table 6-11. paTienT knowledge and aTTiTudes measures
Measure Quality Domain(s)
Data Source(s) Practical Notes Considerations Resources
• Patient attitudes
• Patient centeredness
• Patient surveys
• Patient interviews
• Focus groups and other qualitative methodologies
It is important to do iterative cognitive testing and piloting of surveys developed internally. Methodologies leading to good survey response rates may be expensive. Online surveys might lower the cost, but may bias the results because patients who complete a survey online may be different from those who are unable or uncomfortable doing so. You may be able to add customized questions to standard surveys, such as the Consumer Assessment of Healthcare Providers and Systems (CAHPS).
36
Consider using an existing survey. Review existing surveys using the Health IT Survey Compendium on the AHRQ Health IT Web site.
32
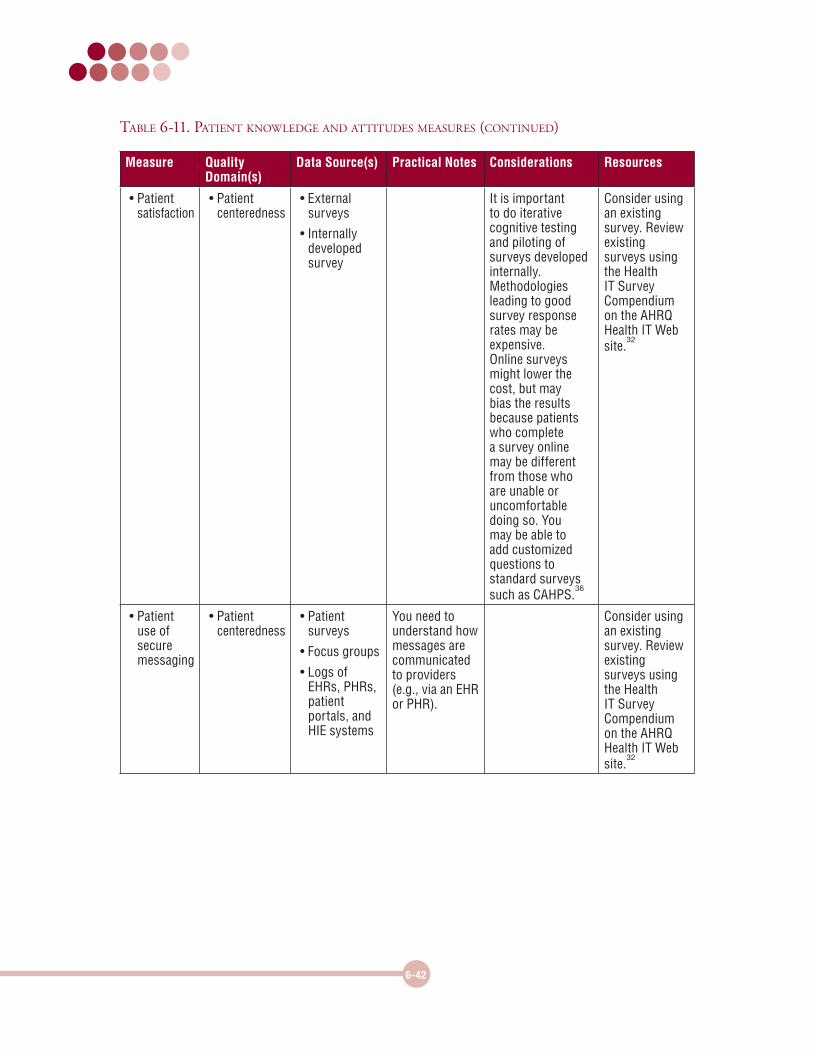
Measure Quality Domain(s)
Data Source(s) Practical Notes Considerations Resources
• Patient satisfaction
• Patient centeredness
• External surveys
• Internally developed survey
It is important to do iterative cognitive testing and piloting of surveys developed internally. Methodologies leading to good survey response rates may be expensive. Online surveys might lower the cost, but may bias the results because patients who complete a survey online may be different from those who are unable or uncomfortable doing so. You may be able to add customized questions to standard surveys such as CAHPS.
36
Consider using an existing survey. Review existing surveys using the Health IT Survey Compendium on the AHRQ Health IT Web site.
32
• Patient use of secure messaging
• Patient centeredness
• Patient surveys
• Focus groups
• Logs of EHRs, PHRs, patient portals, and HIE systems
You need to understand how messages are communicated to providers (e.g., via an EHR or PHR).
Consider using an existing survey. Review existing surveys using the Health IT Survey Compendium on the AHRQ Health IT Web site.
32
6-42
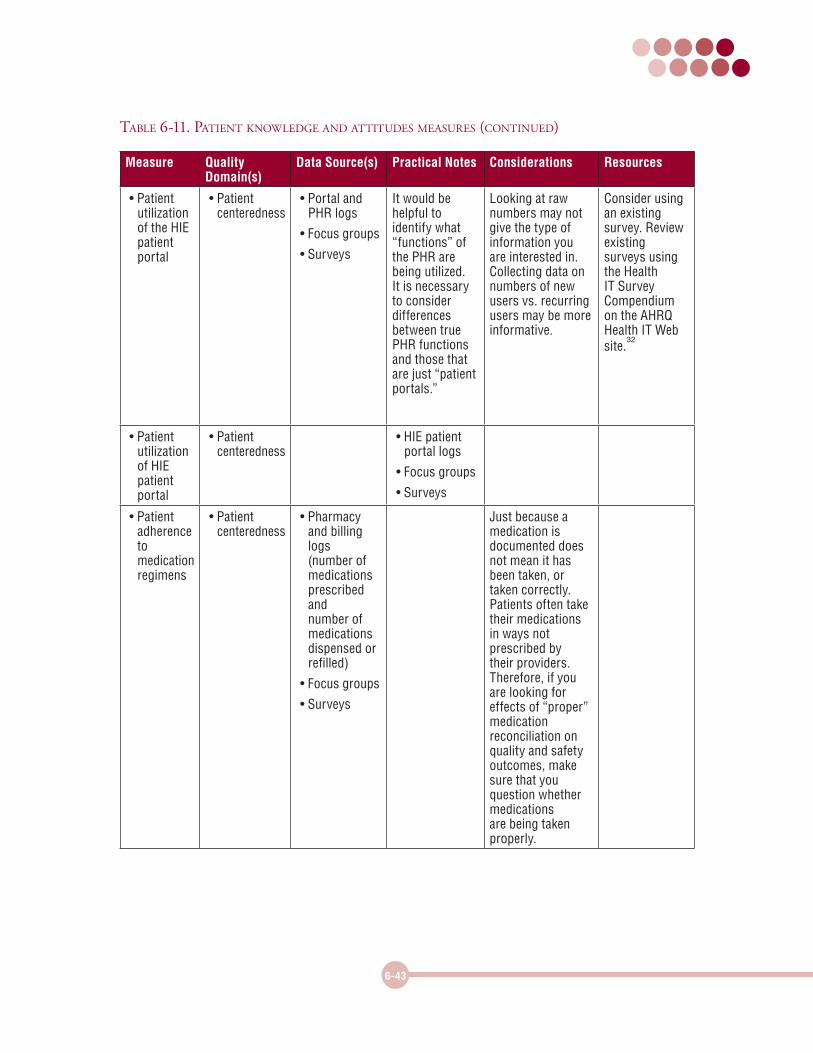
Table 6-11. paTienT knowledge and aTTiTudes measures (ConTinued)
6-43
Measure Quality Domain(s)
Data Source(s) Practical Notes Considerations Resources
• Patient utilization of the HIE patient portal
• Patient centeredness
• Portal and PHR logs
• Focus groups
• Surveys
It would be helpful to identify what “functions” of the PHR are being utilized. It is necessary to consider differences between true PHR functions and those that are just “patient portals.”
Looking at raw numbers may not give the type of information you are interested in. Collecting data on numbers of new users vs. recurring users may be more informative.
Consider using an existing survey. Review existing surveys using the Health IT Survey Compendium on the AHRQ Health IT Web site.
32
• Patient utilization of HIE patient portal
• Patient centeredness
• HIE patient portal logs
• Focus groups
• Surveys
• Patient adherence to medication regimens
• Patient centeredness
• Pharmacy and billing logs (number of medications prescribed and number of medications dispensed or refilled)
• Focus groups
• Surveys
Just because a medication is documented does not mean it has been taken, or taken correctly. Patients often take their medications in ways not prescribed by their providers. Therefore, if you are looking for effects of “proper” medication reconciliation on quality and safety outcomes, make sure that you question whether medications are being taken properly.
Table 6-11. paTienT knowledge and aTTiTudes measures (ConTinued)
6-44
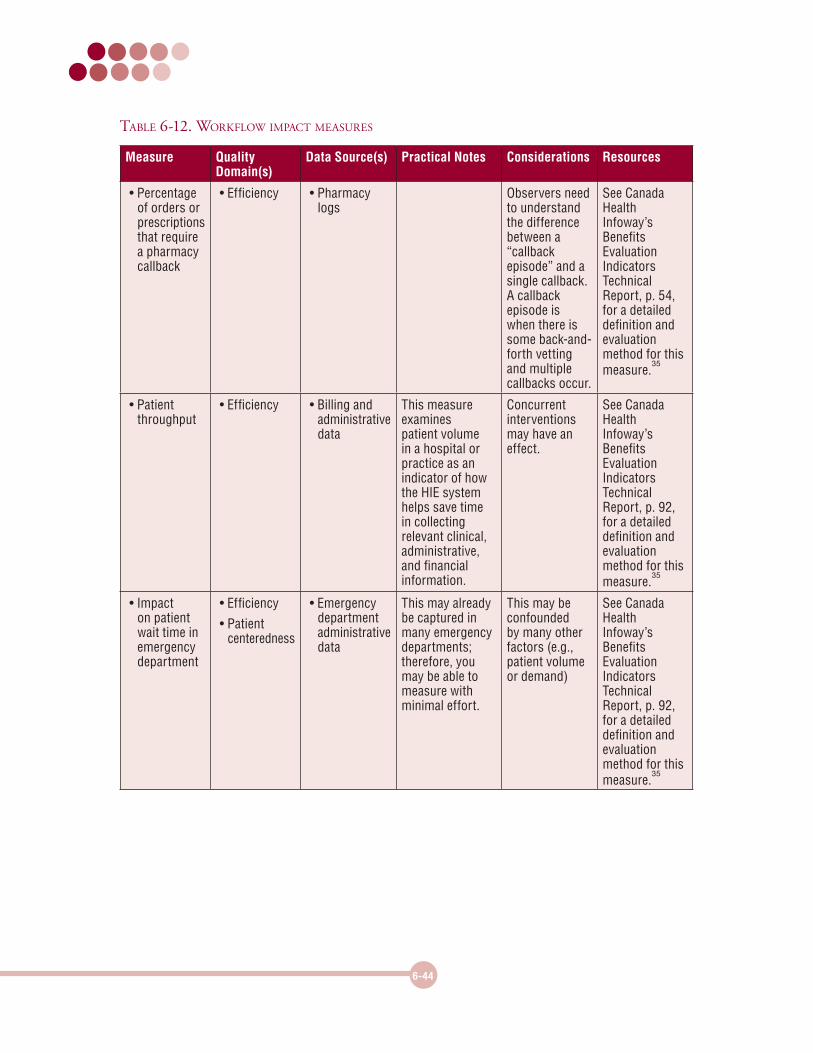
Table 6-12. workflow impaCT measures
Measure Quality Domain(s)
Data Source(s) Practical Notes Considerations Resources
• Percentage of orders or prescriptions that require a pharmacy callback
• Efficiency • Pharmacy logs
Observers need to understand the difference between a “callback episode” and a single callback. A callback episode is when there is some back-and-forth vetting and multiple callbacks occur.
See Canada Health Infoway’s Benefits Evaluation Indicators Technical Report, p. 54, for a detailed definition and evaluation method for this measure.
35
• Patient throughput
• Efficiency • Billing and administrative data
This measure examines patient volume in a hospital or practice as an indicator of how the HIE system helps save time in collecting relevant clinical, administrative, and financial information.
Concurrent interventions may have an effect.
See Canada Health Infoway’s Benefits Evaluation Indicators Technical Report, p. 92, for a detailed definition and evaluation method for this measure.
35
• Impact on patient wait time in emergency department
• Efficiency
• Patient centeredness
• Emergency department administrative data
This may already be captured in many emergency departments; therefore, you may be able to measure with minimal effort.
This may be confounded by many other factors (e.g., patient volume or demand)
See Canada Health Infoway’s Benefits Evaluation Indicators Technical Report, p. 92, for a detailed definition and evaluation method for this measure.
35
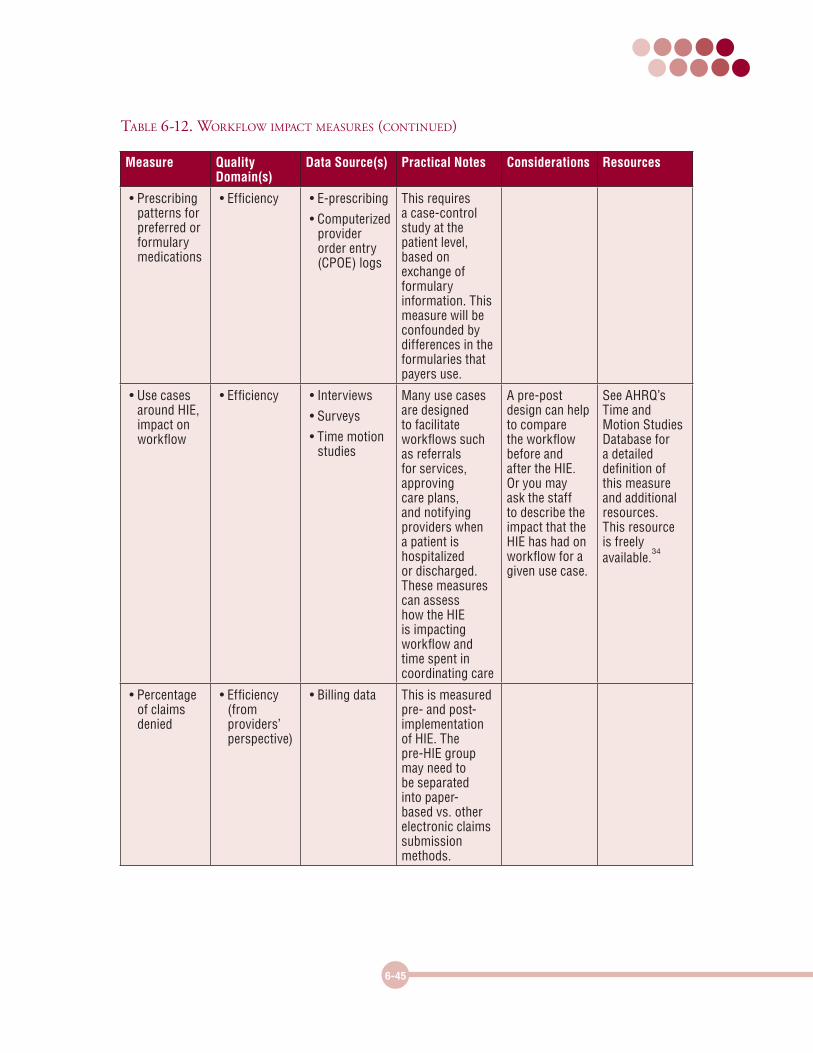
6-45
Measure Quality Domain(s)
Data Source(s) Practical Notes Considerations Resources
• Prescribing patterns for preferred or formulary medications
• Efficiency • E-prescribing
• Computerized provider order entry (CPOE) logs
This requires a case-control study at the patient level, based on exchange of formulary information. This measure will be confounded by differences in the formularies that payers use.
• Use cases around HIE, impact on workflow
• Efficiency • Interviews
• Surveys
• Time motion studies
Many use cases are designed to facilitate workflows such as referrals for services, approving care plans, and notifying providers when a patient is hospitalized or discharged. These measures can assess how the HIE is impacting workflow and time spent in coordinating care
A pre-post design can help to compare the workflow before and after the HIE. Or you may ask the staff to describe the impact that the HIE has had on workflow for a given use case.
See AHRQ’s Time and Motion Studies Database for a detailed definition of this measure and additional resources. This resource is freely available.
34
• Percentage of claims denied
• Efficiency (from providers’ perspective)
• Billing data This is measured pre- and post-implementation of HIE. The pre-HIE group may need to be separated into paper-based vs. other electronic claims submission methods.
Table 6-12. workflow impaCT measures (ConTinued)
6-46
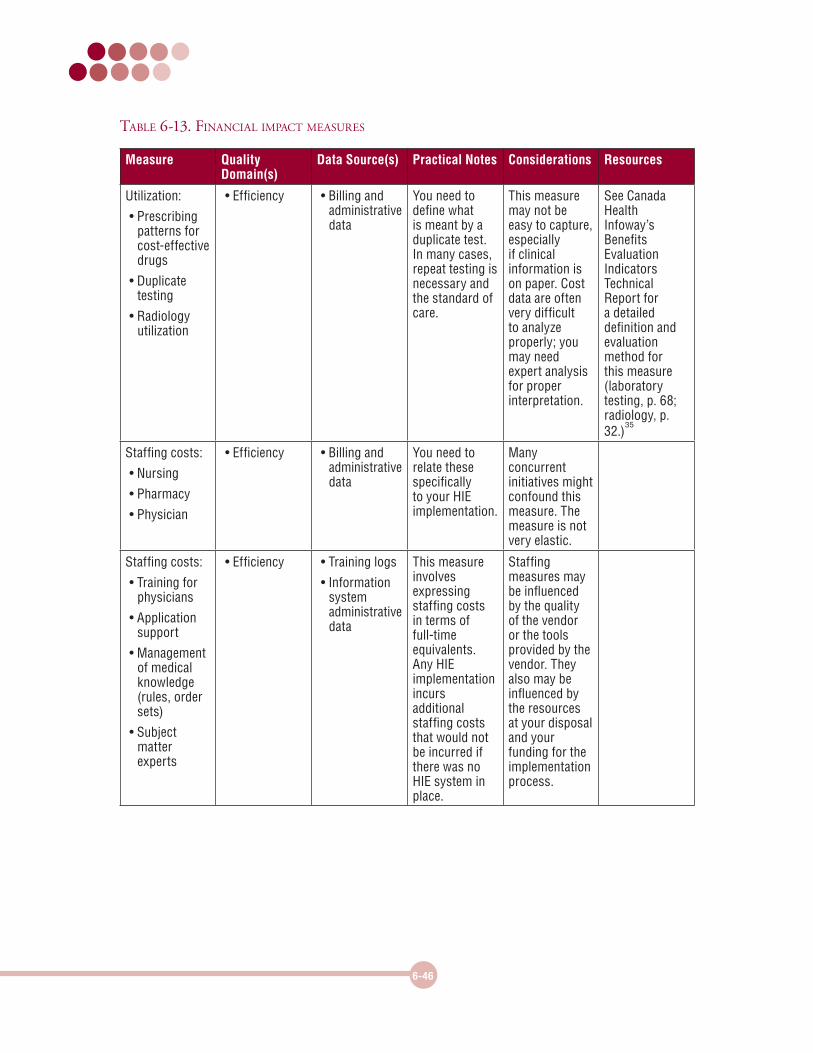
Table 6-13. finanCial impaCT measures
Measure Quality Domain(s)
Data Source(s) Practical Notes Considerations Resources
Utilization:
• Prescribing patterns for cost-effective drugs
• Duplicate testing
• Radiology utilization
• Efficiency • Billing and administrative data
You need to define what is meant by a duplicate test. In many cases, repeat testing is necessary and the standard of care.
This measure may not be easy to capture, especially if clinical information is on paper. Cost data are often very difficult to analyze properly; you may need expert analysis for proper interpretation.
See Canada Health Infoway’s Benefits Evaluation Indicators Technical Report for a detailed definition and evaluation method for this measure (laboratory testing, p. 68; radiology, p. 32.)
35
Staffing costs:
• Nursing
• Pharmacy
• Physician
• Efficiency • Billing and administrative data
You need to relate these specifically to your HIE implementation.
Many concurrent initiatives might confound this measure. The measure is not very elastic.
Staffing costs:
• Training for physicians
• Application support
• Management of medical knowledge (rules, order sets)
• Subject matter experts
• Efficiency • Training logs
• Information system administrative data
This measure involves expressing staffing costs in terms of full-time equivalents. Any HIE implementation incurs additional staffing costs that would not be incurred if there was no HIE system in place.
Staffing measures may be influenced by the quality of the vendor or the tools provided by the vendor. They also may be influenced by the resources at your disposal and your funding for the implementation process.

6-47
Measure Quality Domain(s)
Data Source(s) Practical Notes Considerations Resources
• Risk reduction, based on Centers for Medicare & Medicaid Services fines for readmissions
• Patient safety
• Efficiency
• Billing and administrative data
It is very hard to define what is meant by “readmission.” For example, in many cases a readmission may be the result of the natural history of a disease and not because of the health IT system.
NOTE: Some measures in other categories may overlap with the ones included in this table (e.g., effect on length of hospital stay in Table 6-11).
Table 6-13. finanCial impaCT measures (ConTinued)

••••• ••••
------------------~·