Embed Size (px)
Citation preview
1
SECURITY VALUATION
STOCK VALUATION
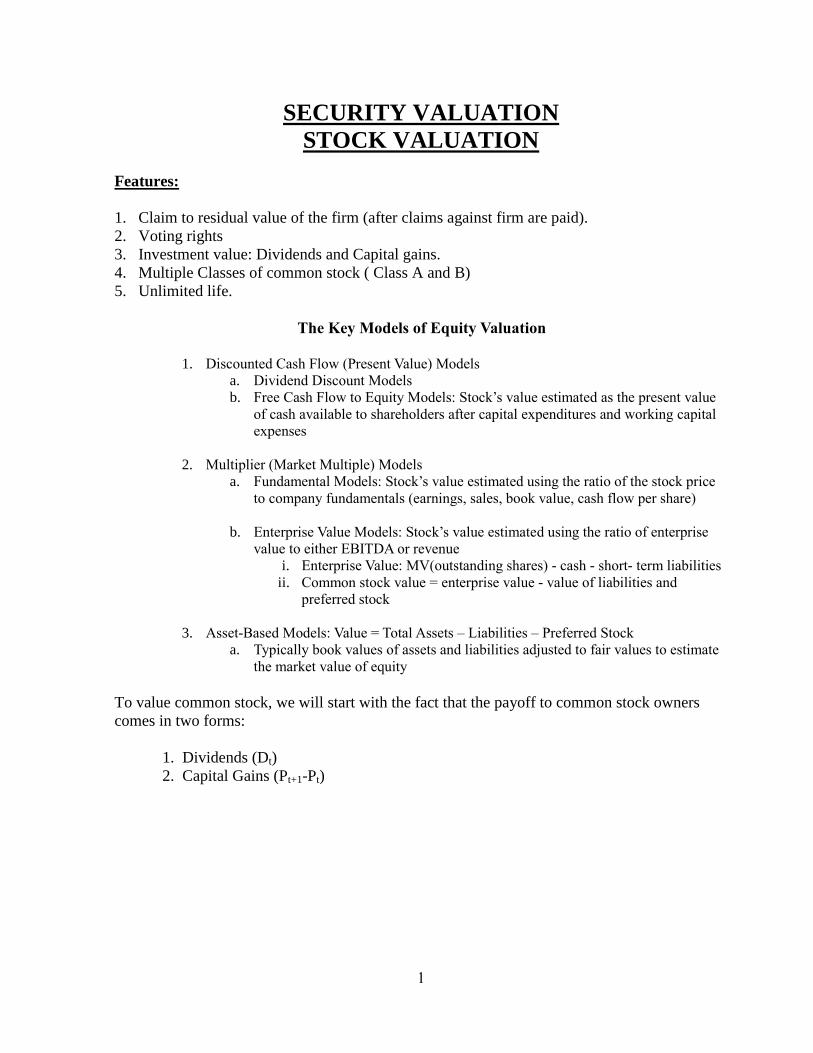
Features:
1. Claim to residual value of the firm (after claims against firm are paid).
2. Voting rights
3. Investment value: Dividends and Capital gains.
4. Multiple Classes of common stock ( Class A and B)
5. Unlimited life.
The Key Models of Equity Valuation
1. Discounted Cash Flow (Present Value) Models
a. Dividend Discount Models
b. Free Cash Flow to Equity Models: Stock’s value estimated as the present value
of cash available to shareholders after capital expenditures and working capital
expenses
2. Multiplier (Market Multiple) Models
a. Fundamental Models: Stock’s value estimated using the ratio of the stock price
to company fundamentals (earnings, sales, book value, cash flow per share)
b. Enterprise Value Models: Stock’s value estimated using the ratio of enterprise
value to either EBITDA or revenue
i. Enterprise Value: MV(outstanding shares) - cash - short- term liabilities
ii. Common stock value = enterprise value - value of liabilities and
preferred stock
3. Asset-Based Models: Value = Total Assets – Liabilities – Preferred Stock
a. Typically book values of assets and liabilities adjusted to fair values to estimate
the market value of equity
To value common stock, we will start with the fact that the payoff to common stock owners
comes in two forms:
1. Dividends (Dt)
2. Capital Gains (Pt+1-Pt)
2
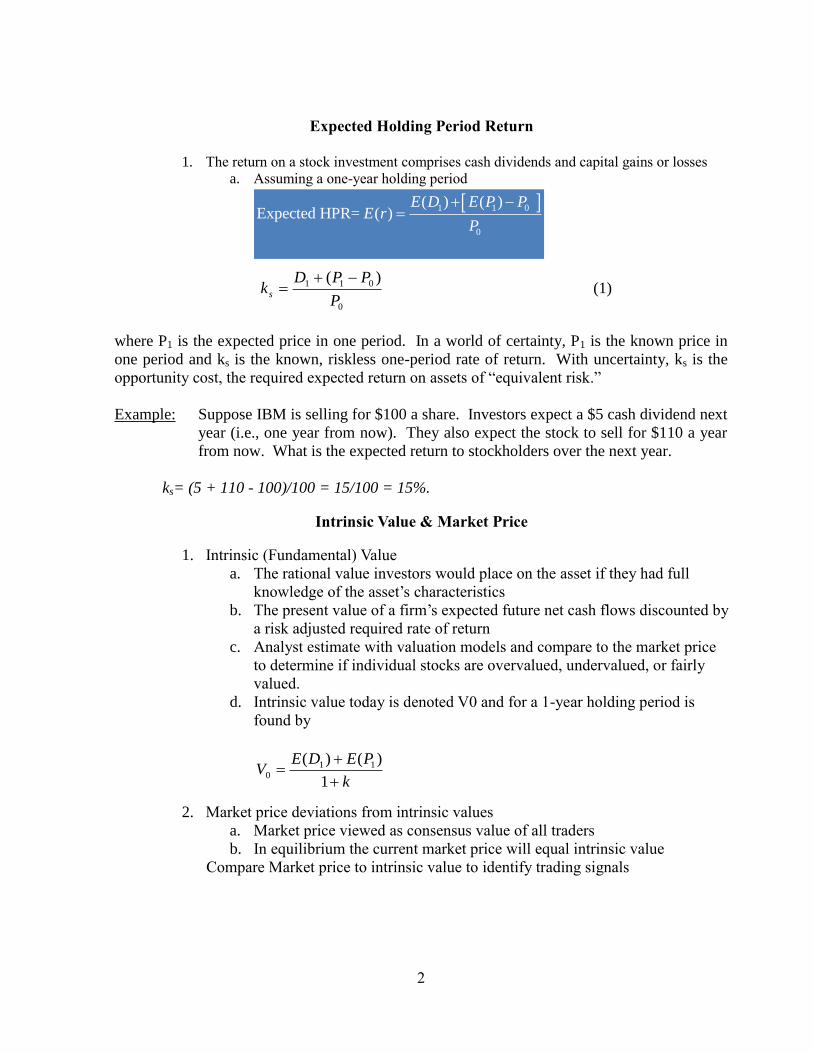
Expected Holding Period Return
1. The return on a stock investment comprises cash dividends and capital gains or losses
a. Assuming a one-year holding period
0
011 )(
P
PPDk s
(1)
where P1 is the expected price in one period. In a world of certainty, P1 is the known price in
one period and ks is the known, riskless one-period rate of return. With uncertainty, ks is the
opportunity cost, the required expected return on assets of “equivalent risk.”
Example: Suppose IBM is selling for $100 a share. Investors expect a $5 cash dividend next
year (i.e., one year from now). They also expect the stock to sell for $110 a year
from now. What is the expected return to stockholders over the next year.
ks= (5 + 110 - 100)/100 = 15/100 = 15%.
Intrinsic Value & Market Price
1. Intrinsic (Fundamental) Value
a. The rational value investors would place on the asset if they had full
knowledge of the asset’s characteristics
b. The present value of a firm’s expected future net cash flows discounted by
a risk adjusted required rate of return
c. Analyst estimate with valuation models and compare to the market price
to determine if individual stocks are overvalued, undervalued, or fairly
valued.
d. Intrinsic value today is denoted V0 and for a 1-year holding period is
found by
2. Market price deviations from intrinsic values
a. Market price viewed as consensus value of all traders
b. In equilibrium the current market price will equal intrinsic value
Compare Market price to intrinsic value to identify trading signals
1 1 0
0
( ) ( )Expected HPR= ( )
E D E P PE r
P
k
PEDEV
1
)()( 110
3
Intrinsic Value > Market Price Undervalued
Buy
Intrinsic Value < Market Price Overvalued
Sell or Short Sell
Intrinsic Value = Market Price Fairly Priced
Hold
Security Valuation
Profitable Security Valuation Depends On
Market prices being able to deviate from intrinsic value now and converge
towards it in the future
Market Price More Likely Correct If:
Followed by many analyst
Unconfident in inputs and applicability of the model
Present Value Models: Dividend Discount Model (DDM)
1. Rationale
a. Intrinsic value of stock is the present value of its future dividends
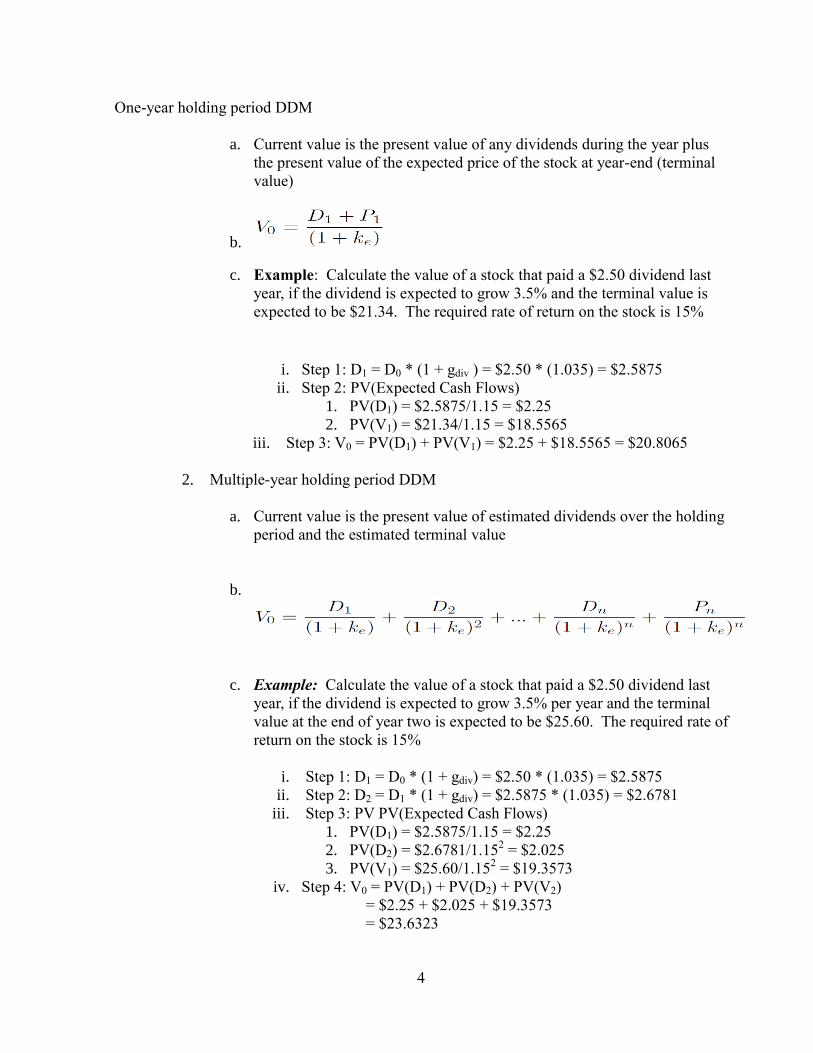
2. General Form
i. V0 = current stock value
ii. Dt = dividend at time t
iii. ke = required rate of return on common equity
b. Uses infinite holding period because a corporation has an indefinite life
The value of one share of common stock is simply the present value of all expected future
dividends paid to that share of stock discounted at the firm’s cost of capital
4
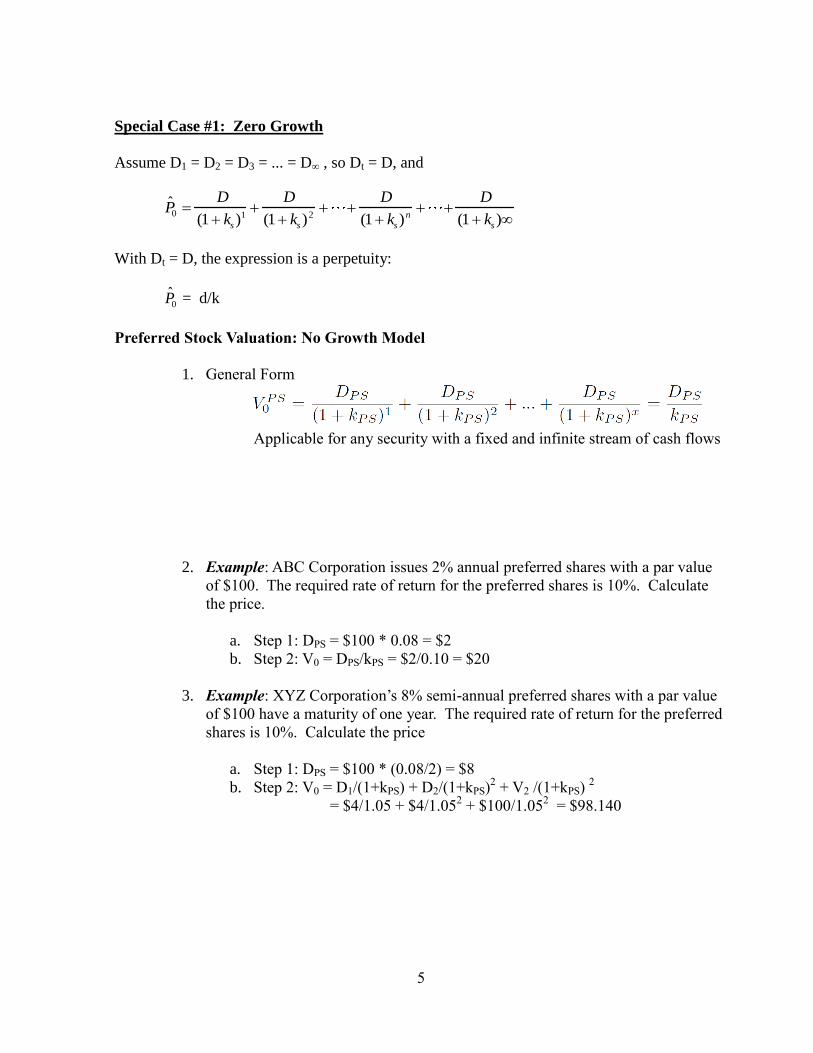
One-year holding period DDM
a. Current value is the present value of any dividends during the year plus
the present value of the expected price of the stock at year-end (terminal
value)
b.
c. Example: Calculate the value of a stock that paid a $2.50 dividend last
year, if the dividend is expected to grow 3.5% and the terminal value is
expected to be $21.34. The required rate of return on the stock is 15%
i. Step 1: D1 = D0 * (1 + gdiv ) = $2.50 * (1.035) = $2.5875
ii. Step 2: PV(Expected Cash Flows)
1. PV(D1) = $2.5875/1.15 = $2.25
2. PV(V1) = $21.34/1.15 = $18.5565
iii. Step 3: V0 = PV(D1) + PV(V1) = $2.25 + $18.5565 = $20.8065
2. Multiple-year holding period DDM
a. Current value is the present value of estimated dividends over the holding
period and the estimated terminal value
b. f
c. Example: Calculate the value of a stock that paid a $2.50 dividend last
year, if the dividend is expected to grow 3.5% per year and the terminal
value at the end of year two is expected to be $25.60. The required rate of
return on the stock is 15%
i. Step 1: D1 = D0 * (1 + gdiv) = $2.50 * (1.035) = $2.5875
ii. Step 2: D2 = D1 * (1 + gdiv) = $2.5875 * (1.035) = $2.6781
iii. Step 3: PV PV(Expected Cash Flows)
1. PV(D1) = $2.5875/1.15 = $2.25
2. PV(D2) = $2.6781/1.152 = $2.025
3. PV(V1) = $25.60/1.152 = $19.3573
iv. Step 4: V0 = PV(D1) + PV(D2) + PV(V2)
= $2.25 + $2.025 + $19.3573
= $23.6323
5
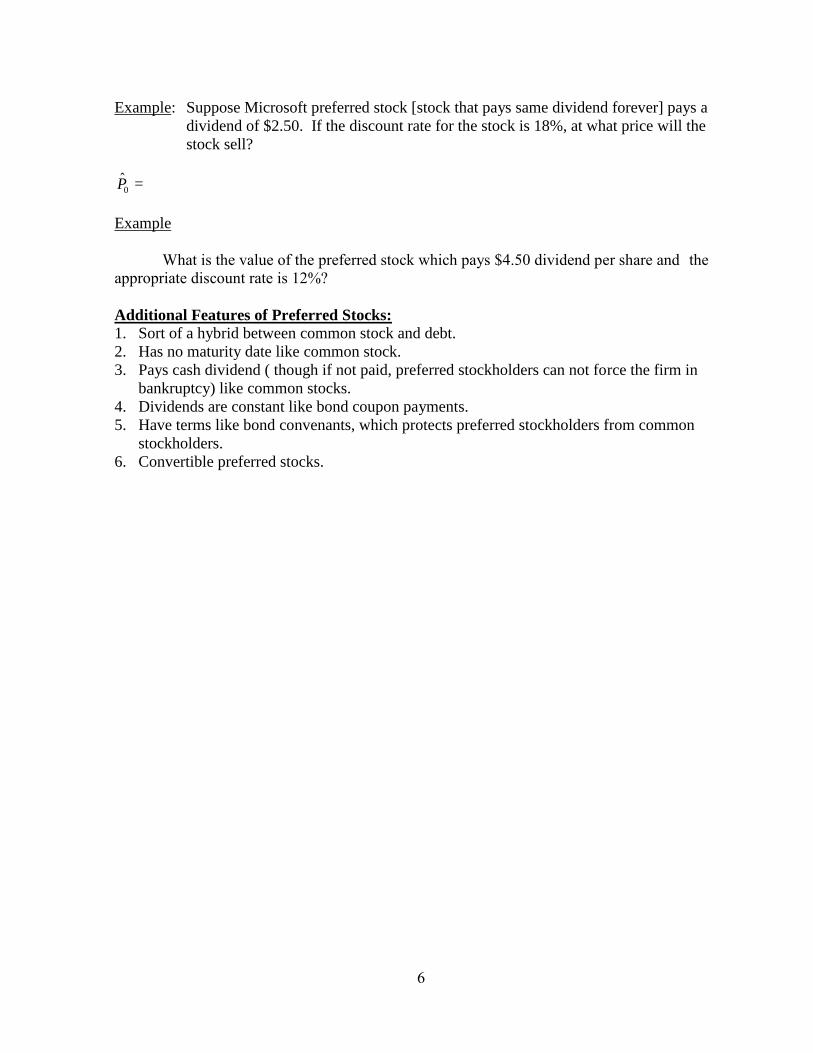
Special Case #1: Zero Growth
Assume D1 = D2 = D3 = ... = D∞ , so Dt = D, and
ˆ P 0 D
(1 ks)1
D
(1 ks)2
D
(1 ks)n
D
(1 ks)
With Dt = D, the expression is a perpetuity:
ˆ P 0 = d/k
Preferred Stock Valuation: No Growth Model
1. General Form
Applicable for any security with a fixed and infinite stream of cash flows
2. Example: ABC Corporation issues 2% annual preferred shares with a par value
of $100. The required rate of return for the preferred shares is 10%. Calculate
the price.
a. Step 1: DPS = $100 * 0.08 = $2
b. Step 2: V0 = DPS/kPS = $2/0.10 = $20
3. Example: XYZ Corporation’s 8% semi-annual preferred shares with a par value
of $100 have a maturity of one year. The required rate of return for the preferred
shares is 10%. Calculate the price
a. Step 1: DPS = $100 * (0.08/2) = $8
b. Step 2: V0 = D1/(1+kPS) + D2/(1+kPS)2 + V2 /(1+kPS)
2
= $4/1.05 + $4/1.052 + $100/1.05
2 = $98.140
6
Example: Suppose Microsoft preferred stock [stock that pays same dividend forever] pays a
dividend of $2.50. If the discount rate for the stock is 18%, at what price will the
stock sell?
ˆ P 0 =
Example
What is the value of the preferred stock which pays $4.50 dividend per share and the
appropriate discount rate is 12%?
Additional Features of Preferred Stocks:
1. Sort of a hybrid between common stock and debt.
2. Has no maturity date like common stock.
3. Pays cash dividend ( though if not paid, preferred stockholders can not force the firm in
bankruptcy) like common stocks.
4. Dividends are constant like bond coupon payments.
5. Have terms like bond convenants, which protects preferred stockholders from common
stockholders.
6. Convertible preferred stocks.
7
Special Case #2: Constant Growth Dividend Model (Gordon Growth Model)
1. Assumptions Needed for the Model to Be Appropriate
a. Dividends are the appropriate measure of shareholder wealth
b. The constant dividend growth rate, gc , and the required return on stock,
ke , are never expected to change
c. ke > gc
2. General Form
Comparing No Growth and Constant Growth Models
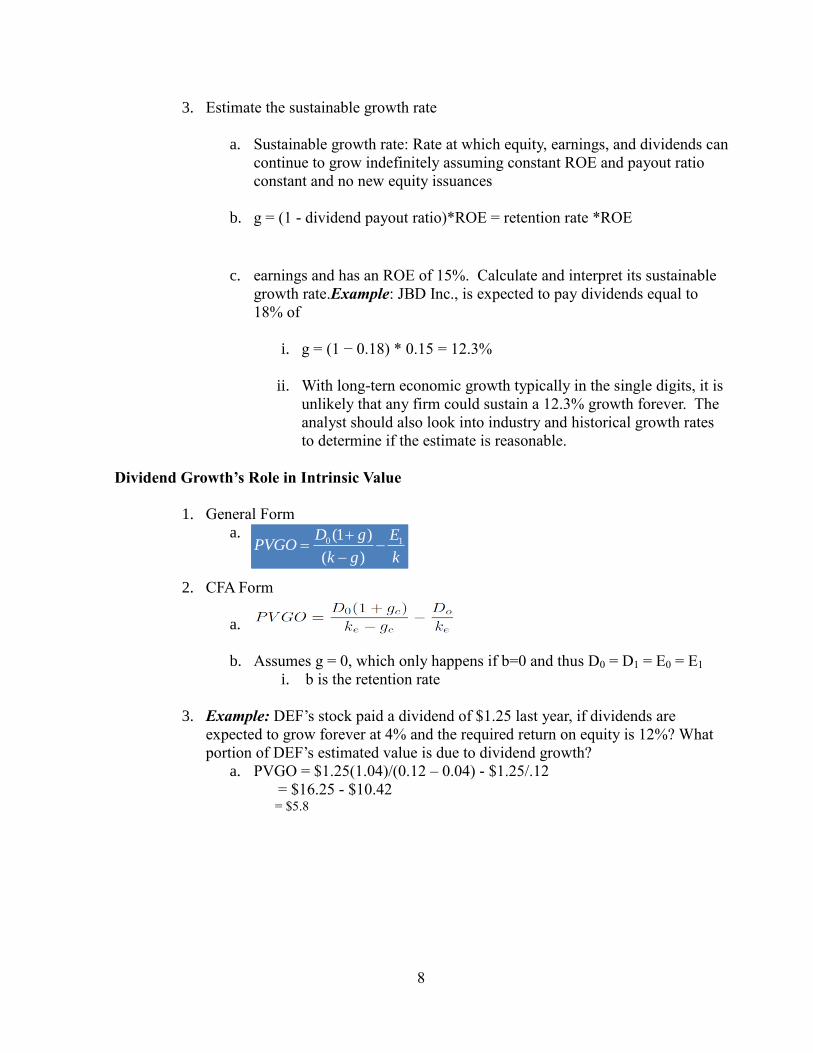
1. Despite having the same dividend and required rate of return, why do you have to
pay more for HIJ’s stock than ABC’s stock?
a. ABC is zero growth and HIJ is constant growth, and you must pay more
for expected growth
2. What is the one year rate of return for each stock?
a. 3. Is one a better buy than the other?
a. Not if both are actually priced at their intrinsic value
Methods for Estimating the Growth Rate in
Dividends
1. Use historical growth in dividends for the firm
2. Use the median industry dividend growth rate
ABC (No Growth) HIJ (ConstantGrowth)
V0 = $20.00 V0 = $53.00
D = $2.00 D0 = $2.00
V1 = $2/0.10 = $20.00 V1 = ($2.00*1.062)/(0.10 – 0.06) = $56.18
k = ($20 - $20 + $2)/$20 = 10% k = ($56.18 -$53 + $2.12)/$53 = 10%
8
3. Estimate the sustainable growth rate
a. Sustainable growth rate: Rate at which equity, earnings, and dividends can
continue to grow indefinitely assuming constant ROE and payout ratio
constant and no new equity issuances
b. g = (1 - dividend payout ratio)*ROE = retention rate *ROE
c. earnings and has an ROE of 15%. Calculate and interpret its sustainable
growth rate.Example: JBD Inc., is expected to pay dividends equal to
18% of
i. g = (1 − 0.18) * 0.15 = 12.3%
ii. With long-tern economic growth typically in the single digits, it is
unlikely that any firm could sustain a 12.3% growth forever. The
analyst should also look into industry and historical growth rates
to determine if the estimate is reasonable.
Dividend Growth’s Role in Intrinsic Value
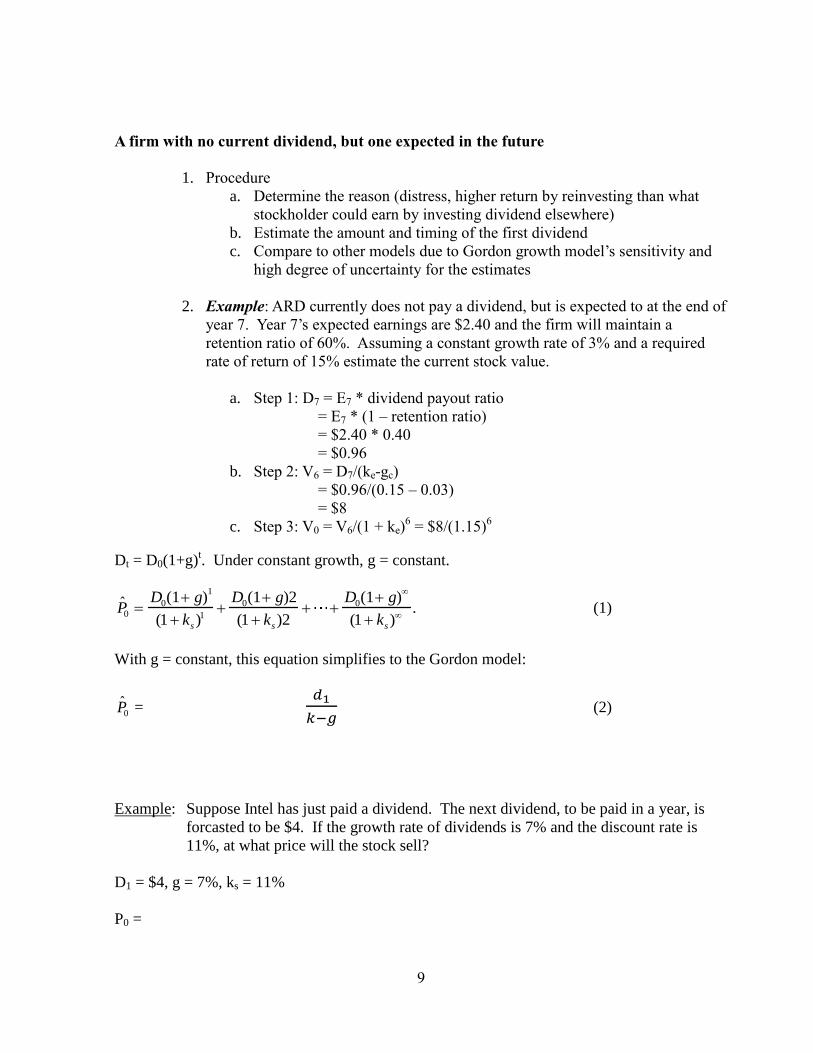
1. General Form
a. A
2. CFA Form
a.
b. Assumes g = 0, which only happens if b=0 and thus D0 = D1 = E0 = E1
i. b is the retention rate
3. Example: DEF’s stock paid a dividend of $1.25 last year, if dividends are
expected to grow forever at 4% and the required return on equity is 12%? What
portion of DEF’s estimated value is due to dividend growth?
a. PVGO = $1.25(1.04)/(0.12 – 0.04) - $1.25/.12
= $16.25 - $10.42 = $5.8
0 1(1 )
( )
D g EPVGO
k g k
9
A firm with no current dividend, but one expected in the future
1. Procedure
a. Determine the reason (distress, higher return by reinvesting than what
stockholder could earn by investing dividend elsewhere)
b. Estimate the amount and timing of the first dividend
c. Compare to other models due to Gordon growth model’s sensitivity and
high degree of uncertainty for the estimates
2. Example: ARD currently does not pay a dividend, but is expected to at the end of
year 7. Year 7’s expected earnings are $2.40 and the firm will maintain a
retention ratio of 60%. Assuming a constant growth rate of 3% and a required
rate of return of 15% estimate the current stock value.
a. Step 1: D7 = E7 * dividend payout ratio
= E7 * (1 – retention ratio)
= $2.40 * 0.40
= $0.96
b. Step 2: V6 = D7/(ke-gc)
= $0.96/(0.15 – 0.03)
= $8
c. Step 3: V0 = V6/(1 + ke)6 = $8/(1.15)
6
Dt = D0(1+g)t. Under constant growth, g = constant.
ˆ P 0 D0(1 g)
1
(1 ks)1
D0(1 g)2
(1 ks)2
D0(1 g)
(1 ks)
. (1)
With g = constant, this equation simplifies to the Gordon model:
ˆ P 0 = 𝑑1
𝑘−𝑔 (2)
Example: Suppose Intel has just paid a dividend. The next dividend, to be paid in a year, is
forcasted to be $4. If the growth rate of dividends is 7% and the discount rate is
11%, at what price will the stock sell?
D1 = $4, g = 7%, ks = 11%
P0 =
10
Example
What is the value of XYZ’s share if the corporation is expecting to pay a $2 dividend per share
at the end of this year and the dividend is expected to grow at 5% forever and the discount rate
is 12%?
1. Most applicable to
a. Stable and mature, non-cyclical, dividend-paying firms
2. Example: What is the intrinsic value of a HIJ’s stock that paid a dividend of
$2.00 last year, if dividends are expected to grow forever at 6% and the required
return on equity is 10%?
a. Step 1: D1 = D0 (1 + gc) = $2.00(1.06) = $2.12
b. Step 2: V0 = D1/(ke – gc) = $2.12/(0.10-0.06) = $53.00
3. Key Relationships
a. An increase (decrease) in (ke – gc) → decrease (increase) in stock value
b. Small changes in (ke – gc) can cause large changes in the stock value
Note: There are 4 unknowns in the constant growth dividend model: P0, D1 or D0, ks, and g. If
you know 3 of the unknowns, you can figure out the other.
Example: Ford can grow at 4 percent rate for the indefinite future. A share of Ford’s stock is
selling for $37.50, and is expected to pay a dividend of $3 next year. Suppose
GM shares are an equally risky investment. What is the expected rate of return
from investing in GM?
GM’s expected return is equal to Ford’s expected return of 12% per year.
Example
If the XYZ is currently selling at $50 per share, expected dividend at the end of this
year $3 per share and the growth rate 5% for ever, what is the required rate of return?
Example
11
What is the price of common share of XYZ if the company paid a dividend last year
$3 per share( or just paid today) and the growth rate is 5% forever? The appropriate discount
rate is 11%
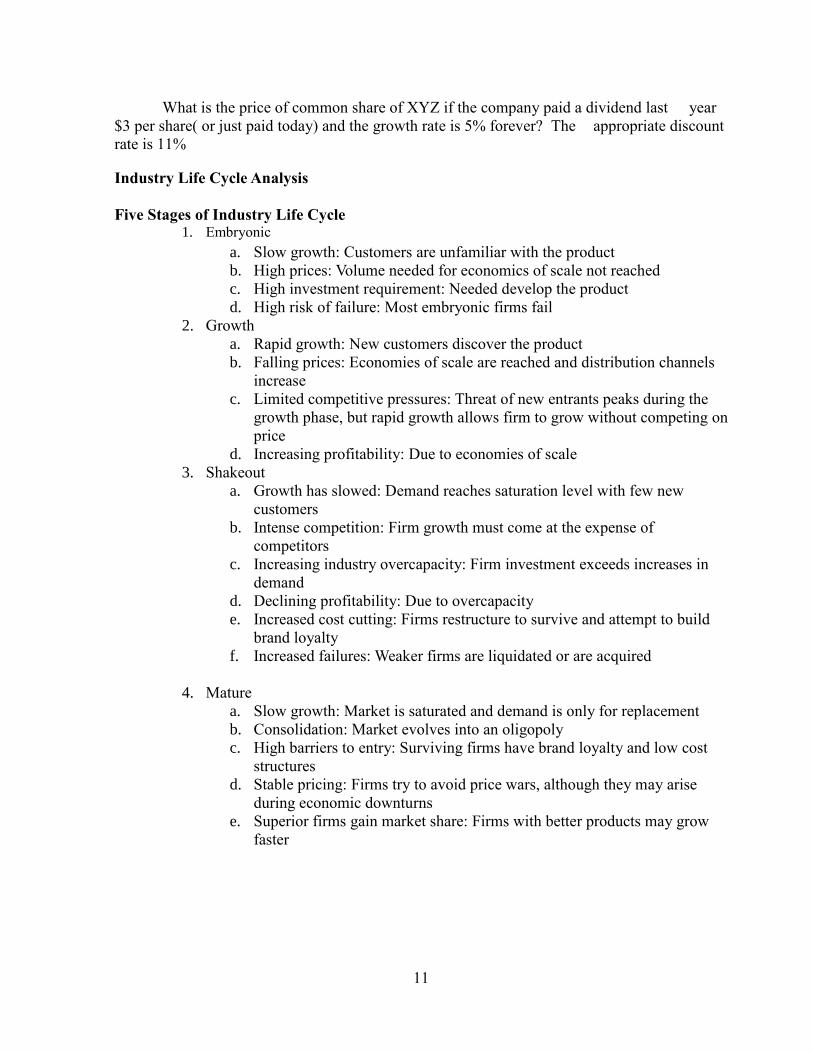
Industry Life Cycle Analysis
Five Stages of Industry Life Cycle 1. Embryonic
a. Slow growth: Customers are unfamiliar with the product
b. High prices: Volume needed for economics of scale not reached
c. High investment requirement: Needed develop the product
d. High risk of failure: Most embryonic firms fail
2. Growth
a. Rapid growth: New customers discover the product
b. Falling prices: Economies of scale are reached and distribution channels
increase
c. Limited competitive pressures: Threat of new entrants peaks during the
growth phase, but rapid growth allows firm to grow without competing on
price
d. Increasing profitability: Due to economies of scale
3. Shakeout
a. Growth has slowed: Demand reaches saturation level with few new
customers
b. Intense competition: Firm growth must come at the expense of
competitors
c. Increasing industry overcapacity: Firm investment exceeds increases in
demand
d. Declining profitability: Due to overcapacity
e. Increased cost cutting: Firms restructure to survive and attempt to build
brand loyalty
f. Increased failures: Weaker firms are liquidated or are acquired
4. Mature
a. Slow growth: Market is saturated and demand is only for replacement
b. Consolidation: Market evolves into an oligopoly
c. High barriers to entry: Surviving firms have brand loyalty and low cost
structures
d. Stable pricing: Firms try to avoid price wars, although they may arise
during economic downturns
e. Superior firms gain market share: Firms with better products may grow
faster
12
5. Decline
a. Negative growth: Due to development of substitutes, societal change, or
global competition
b. Declining prices: Intense competition and price wars due to overcapacity
c. Consolidation: Firm exit or merge
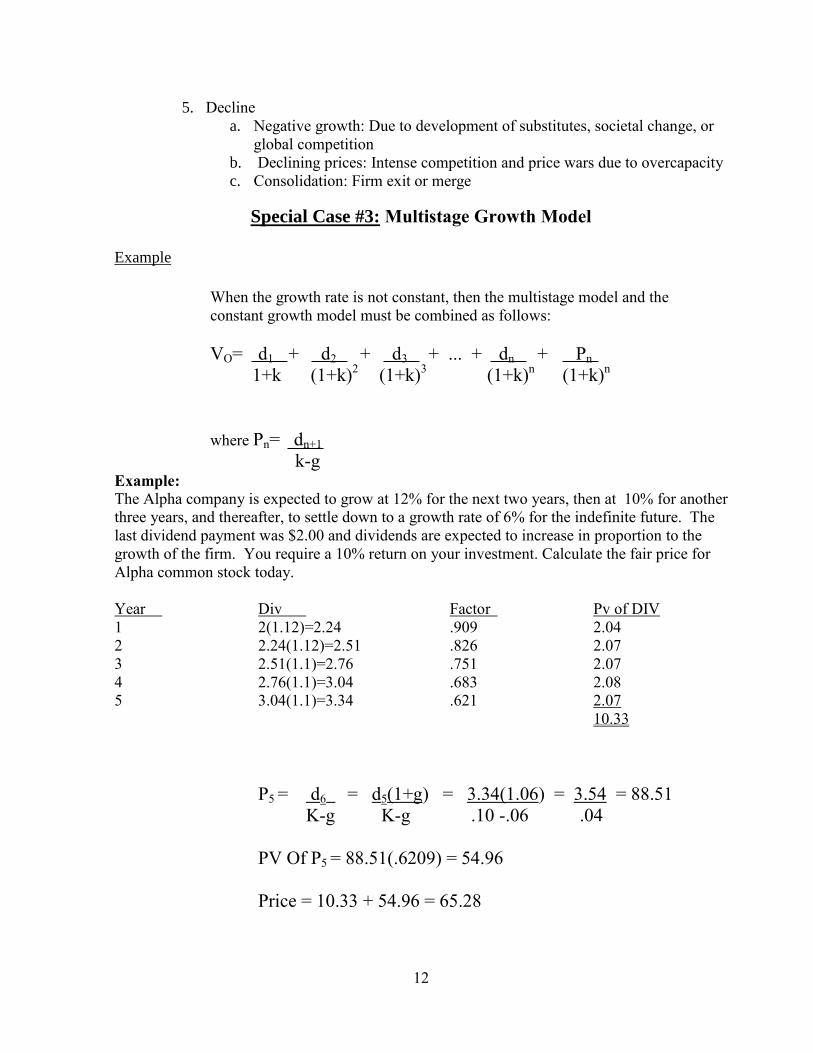
Special Case #3: Multistage Growth Model
Example
When the growth rate is not constant, then the multistage model and the
constant growth model must be combined as follows:
VO= d1 + d2 + d3 + ... + dn + Pn
1+k (1+k)2
(1+k)3 (1+k)
n (1+k)
n
where Pn= dn+1
k-g Example:
The Alpha company is expected to grow at 12% for the next two years, then at 10% for another
three years, and thereafter, to settle down to a growth rate of 6% for the indefinite future. The
last dividend payment was $2.00 and dividends are expected to increase in proportion to the
growth of the firm. You require a 10% return on your investment. Calculate the fair price for
Alpha common stock today.
Year Div Factor Pv of DIV
1 2(1.12)=2.24 .909 2.04
2 2.24(1.12)=2.51 .826 2.07
3 2.51(1.1)=2.76 .751 2.07
4 2.76(1.1)=3.04 .683 2.08
5 3.04(1.1)=3.34 .621 2.07
10.33
P5 = d6 = d5(1+g) = 3.34(1.06) = 3.54 = 88.51
K-g K-g .10 -.06 .04
PV Of P5 = 88.51(.6209) = 54.96
Price = 10.33 + 54.96 = 65.28
13
1. Most applicable to
a. Firms that are expected to grow rapidly, slowly, or erratically over some
period, followed by constant dividend growth
2. Procedure
a. Determine the discount rate, ke
b. Project the size and duration of the high initial growth rate, gH
c. Estimate dividends during the high-growth period
d. Estimate the constant growth rate at the end of the high-growth period, gc
e. Estimate the first dividend that will grow at the constant rate
f. Use the constant growth value to calculate the terminal stock value
g. Add the PV of all dividends to the PV of the terminal stock value
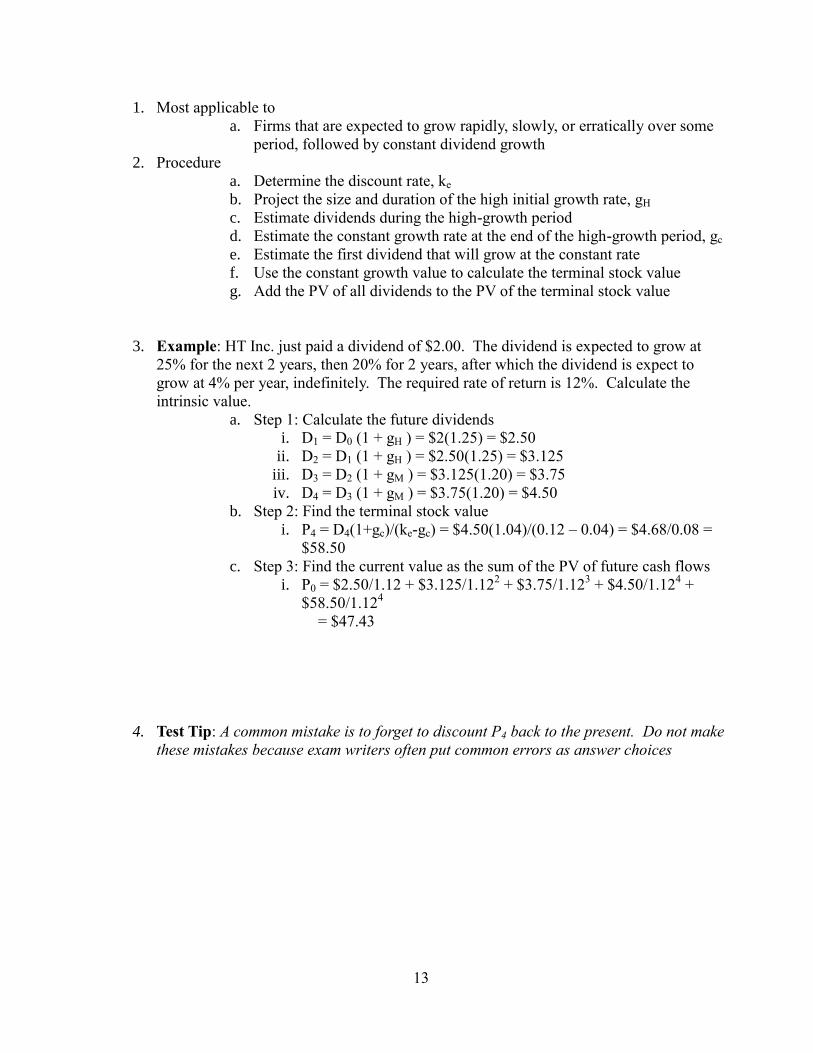
3. Example: HT Inc. just paid a dividend of $2.00. The dividend is expected to grow at
25% for the next 2 years, then 20% for 2 years, after which the dividend is expect to
grow at 4% per year, indefinitely. The required rate of return is 12%. Calculate the
intrinsic value.
a. Step 1: Calculate the future dividends
i. D1 = D0 (1 + gH ) = $2(1.25) = $2.50
ii. D2 = D1 (1 + gH ) = $2.50(1.25) = $3.125
iii. D3 = D2 (1 + gM ) = $3.125(1.20) = $3.75
iv. D4 = D3 (1 + gM ) = $3.75(1.20) = $4.50
b. Step 2: Find the terminal stock value
i. P4 = D4(1+gc)/(ke-gc) = $4.50(1.04)/(0.12 – 0.04) = $4.68/0.08 =
$58.50
c. Step 3: Find the current value as the sum of the PV of future cash flows
i. P0 = $2.50/1.12 + $3.125/1.122 + $3.75/1.12
3 + $4.50/1.12
4 +
$58.50/1.124
= $47.43
4. Test Tip: A common mistake is to forget to discount P4 back to the present. Do not make
these mistakes because exam writers often put common errors as answer choices
14
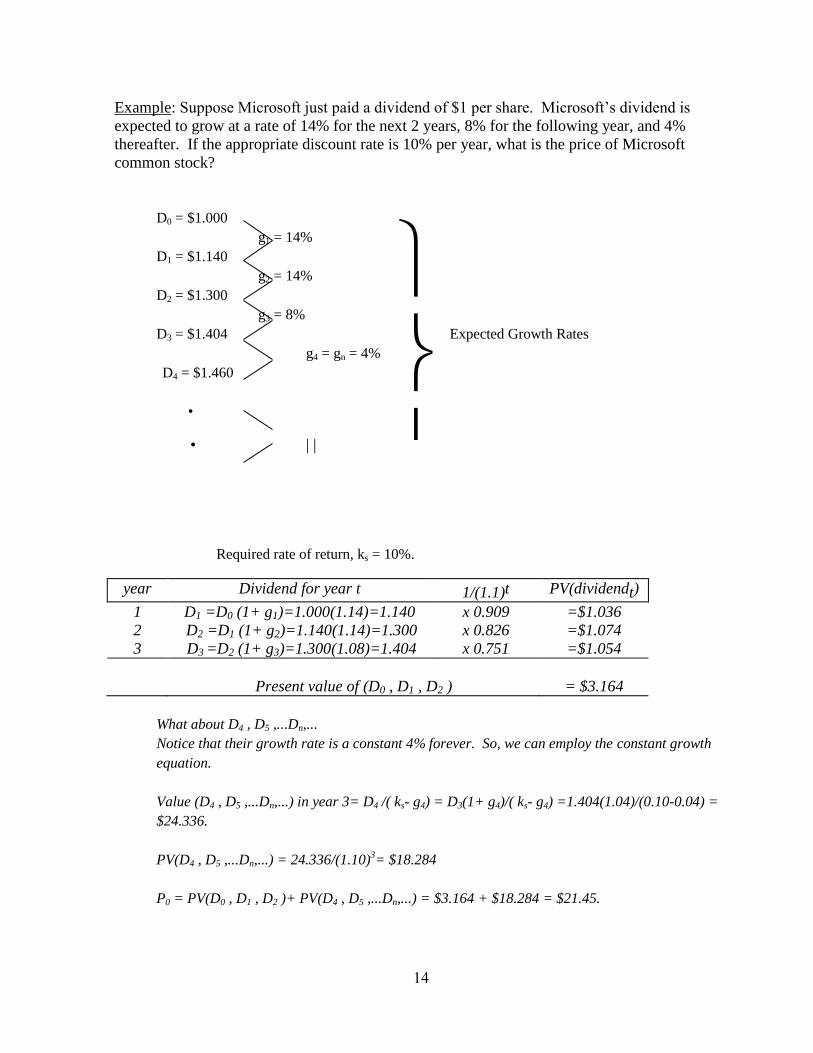
Example: Suppose Microsoft just paid a dividend of $1 per share. Microsoft’s dividend is
expected to grow at a rate of 14% for the next 2 years, 8% for the following year, and 4%
thereafter. If the appropriate discount rate is 10% per year, what is the price of Microsoft
common stock?
D0 = $1.000
g1 = 14%
D1 = $1.140
g2 = 14%
D2 = $1.300
g3 = 8%
D3 = $1.404 Expected Growth Rates
g4 = gn = 4%
D4 = $1.460
•
• | |
Required rate of return, ks = 10%.
year Dividend for year t 1/(1.1)t PV(dividendt)
1 D1 =D0 (1+ g1)=1.000(1.14)=1.140 x 0.909 =$1.036
2 D2 =D1 (1+ g2)=1.140(1.14)=1.300 x 0.826 =$1.074
3 D3 =D2 (1+ g3)=1.300(1.08)=1.404 x 0.751 =$1.054
Present value of (D0 , D1 , D2 ) = $3.164
What about D4 , D5 ,...Dn,...
Notice that their growth rate is a constant 4% forever. So, we can employ the constant growth
equation.
Value (D4 , D5 ,...Dn,...) in year 3= D4 /( ks- g4) = D3(1+ g4)/( ks- g4) =1.404(1.04)/(0.10-0.04) =
$24.336.
PV(D4 , D5 ,...Dn,...) = 24.336/(1.10)3= $18.284
P0 = PV(D0 , D1 , D2 )+ PV(D4 , D5 ,...Dn,...) = $3.164 + $18.284 = $21.45.
15
Free Cash Flow to Equity (FCFE) Discount Models
1. FCFE: Cash remaining after a firm meets all of its debt obligations and provides for the
capex needed to maintain existing assets and to purchase the new assets need to support the
assumed growth of the company
a. FCFE = NI + Depr - Increase in working capital - Fixed Capital Inv
(FCInv) - Dept principal repayments + New debt issues
b. FCFE = OCF - FCInv + Net borrowing
a. Net borrowing is the increase in debt during the period (amount
borrowed minus amount repaid) 2. Rationale
a. FCFE reflects the firms capacity to pay dividends
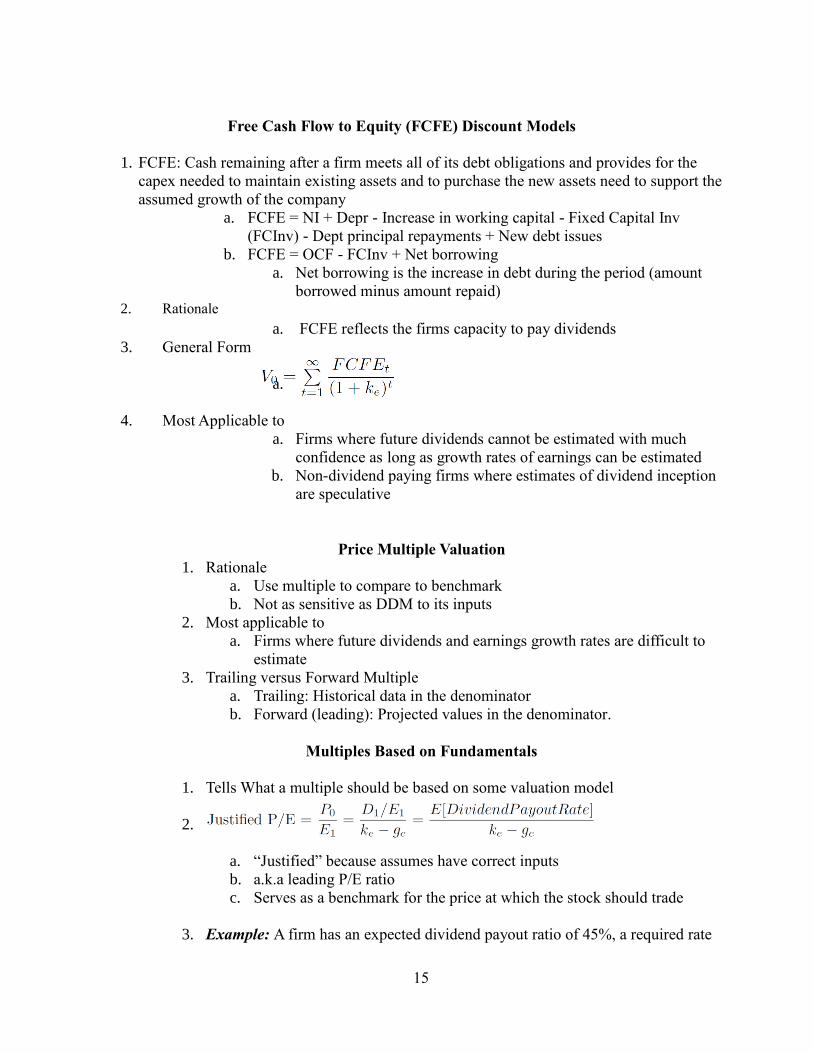
3. General Form
a.
4. Most Applicable to
a. Firms where future dividends cannot be estimated with much
confidence as long as growth rates of earnings can be estimated
b. Non-dividend paying firms where estimates of dividend inception
are speculative
Price Multiple Valuation
1. Rationale
a. Use multiple to compare to benchmark
b. Not as sensitive as DDM to its inputs
2. Most applicable to
a. Firms where future dividends and earnings growth rates are difficult to
estimate
3. Trailing versus Forward Multiple
a. Trailing: Historical data in the denominator
b. Forward (leading): Projected values in the denominator.
Multiples Based on Fundamentals
1. Tells What a multiple should be based on some valuation model
2.
a. “Justified” because assumes have correct inputs
b. a.k.a leading P/E ratio
c. Serves as a benchmark for the price at which the stock should trade
3. Example: A firm has an expected dividend payout ratio of 45%, a required rate
16
of return of 12%, and an expected dividend growth rate of 7%. Calculate the
firm’s expected P/E ratio. Interpret this number is the actual P/E is 12.
a. Expected P/E = 0.45/(0.12 – 0.07) = 9
b. Since the expected P/E is lower than the actual P/E the stock is considered
overvalued
4. Justified P/E will increase (all else equal) with:
a. Higher dividend payout rate
b. Higher growth rate
c. Lower required rate of return
5. Dividend Displacement of Earnings
a. All else is not equal because a higher dividend payout rate will lower the
firm’s growth rate so the net effect is uncertain
b.
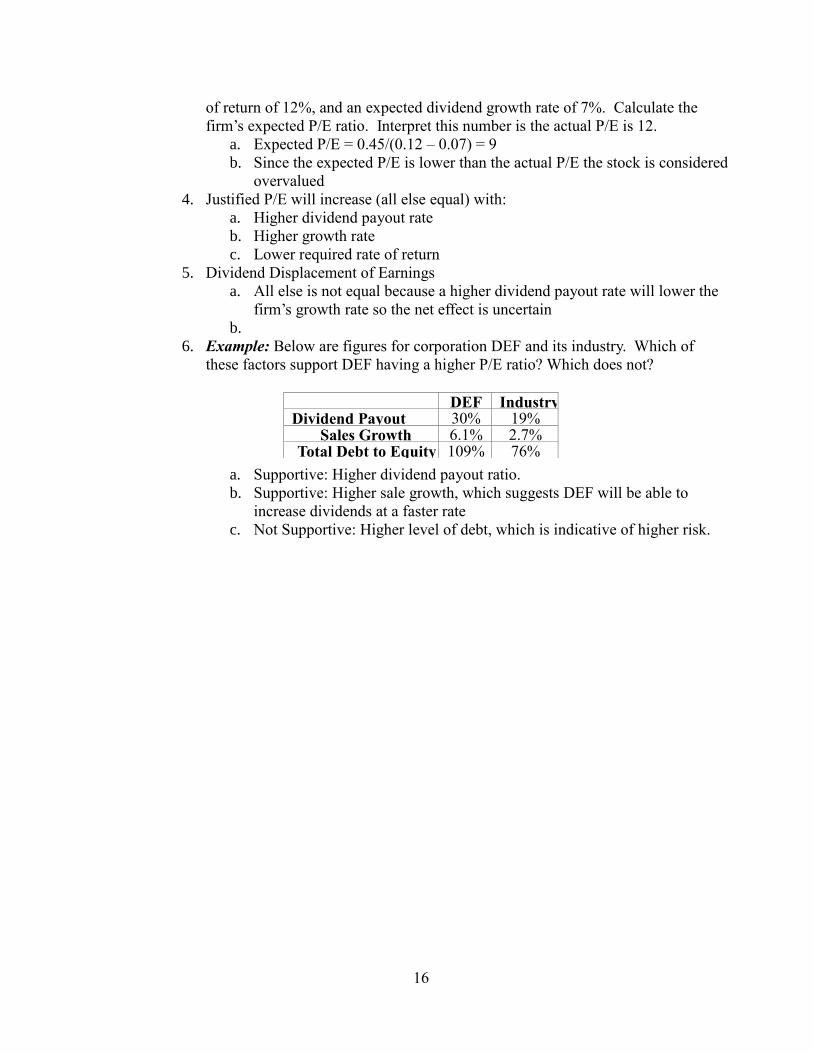
6. Example: Below are figures for corporation DEF and its industry. Which of
these factors support DEF having a higher P/E ratio? Which does not?
a. Supportive: Higher dividend payout ratio.
b. Supportive: Higher sale growth, which suggests DEF will be able to
increase dividends at a faster rate
c. Not Supportive: Higher level of debt, which is indicative of higher risk.
DEF Industry Dividend Payout
Ratio
30% 19% Sales Growth 6.1% 2.7%
Total Debt to Equity 109% 76%
17