Embed Size (px)
Citation preview
Sediment Toxicity in Mid-Continent Great Rivers (USA)
Herman J. Haring • Karen A. Blocksom • Mark E. Smith •
Theodore Angradi • Melissa C. Wratschko • Brandon Armstrong •
David Bolgrien • James M. Lazorchak
Received: 6 April 2010 / Accepted: 9 August 2010 / Published online: 27 August 2010
� US Government 2010
Abstract As part of the Environmental Monitoring and
Assessment Program for Great River Ecosystems (EMAP-
GRE), sediment samples were collected from 447 ran-
domly selected littoral sites along the main channels of the
Ohio, Missouri, and Upper Mississippi Rivers between
2004 and 2006. Toxicity of these sediment samples was
measured using a 7-day Hyalella azteca survival and
growth test. Sixty-five sites (14.5%) exhibited lethal tox-
icity, and 130 sites (29.1%) exhibited decreased growth. In
the EMAP-GRE probabilistic sampling design, each sam-
pled site had a weight associated with it that determined the
length (and proportion) of the river represented by that
sample point in the population. Weighted whole-river
estimates indicated that of the 4721 river km sampled,
sediment from 15.9 ± 3.0% of the river (752 ± 50 km)
were lethally toxic, 27.4 ± 3.5% (1289 ± 57 km) were
toxic by way of growth inhibition, and 40.0 ± 3.7%
(1887 ± 68 km) exhibited either lethal or growth toxicity.
Selected toxic samples were analyzed for 21 pesticides, 20
polychlorinated biphenyl congeners, and 6 polybrominated
diphenyl ether congeners. For all of the samples tested, the
concentration levels of these analytes were mostly lower
than known toxicity thresholds, and neither unionized
ammonia concentration nor osmotic stress (as measured by
conductivity) could account for the toxicity found in sed-
iments. The spatial pattern of sediment toxicity cannot be
readily explained by urbanization or agricultural land use at
the subcatchment scale. We speculate that the distribution
of toxic sediment is more likely due to a combination of
localized sources, including polluted tributaries, and the
redistribution of contaminated sediments from upriver. The
sediment toxicity results from this study will be used, in
combination with other sediment, biologic, and habitat
metrics and indicators collected in the EMAP-GRE study,
to help interpret and assess the condition of the Ohio,
Upper Mississippi, and Missouri Rivers.
Agricultural and urban runoff are the two leading causes of
surface water impairment in the United States (Tucker and
Burton 1999). When assessing pollution sources and their
effects on aquatic ecosystems, and before implementing
source controls, it is necessary to define the stressors and
receptors of exposure. Toxicity assays are a key component
in integrated assessments, which may also include physical
habitat, chemical, and biotic community characterization.
Short-term growth and survival toxicity of urban and
agricultural runoff have been measured both in the labo-
ratory and in situ. Urban runoff is often more toxic to
organisms in the laboratory than demonstrated in in situ
H. J. Haring � M. E. Smith � M. C. Wratschko � B. Armstrong
The McConnell Group, National Exposure Research Laboratory,
Office of Research and Development, United States
Environmental Protection Agency, 26 W. Martin Luther King
Drive, Cincinnati, OH 45268, USA
K. A. Blocksom
National Health and Environmental Effects Research
Laboratory, Office of Research and Development, United States
Environmental Protection Agency, 200 SW 35th St., Corvallis,
OR 97333, USA
T. Angradi � D. Bolgrien
National Health and Environmental Effects Research
Laboratory, Office of Research and Development, United States
Environmental Protection Agency, 6201 Congdon Boulevard,
Duluth, MN 55804, USA
J. M. Lazorchak (&)
National Exposure Research Laboratory, Office of Research and
Development, United States Environmental Protection Agency,
26 W. Martin Luther King Drive, Cincinnati, OH 45268, USA
e-mail: [email protected]
123
Arch Environ Contam Toxicol (2011) 60:57–67
DOI 10.1007/s00244-010-9592-4
studies; conversely, toxicity to organisms at agricultural
sites is often greater during in situ exposures compared
with laboratory studies (Tucker and Burton 1999).
Subacute-duration sediment toxicity testing has become
important in regulatory, monitoring, and scientific pro-
grams, serving as an indicator of pollution exposure for
benthic organisms. Data compiled from Atlantic, Gulf of
Mexico, and Pacific coastal (United States) studies by Hunt
et al. (2001) showed that in 92% of the samples classified
as toxic, at least one measure of benthic diversity or
abundance indicated an impact (e.g., value \median of
reference), and in 67% of the toxic samples, at least one
measure of benthic abundance or diversity indicated a
severe impact (value \10th percentile of reference). Hunt
et al. (2001) concluded that impacts on the benthic fauna
frequently corresponded to decreased amphipod survival in
the laboratory toxicity tests. Other studies from marine
systems have shown similar relations between sediment
toxicity and benthic macroinvertebrate impacts (Long et al.
2001; Preston 2002; Kuhn et al. 2002; Stronkhorst et al.
2003; Greenstein et al. 2008).
Toxicity testing of sediments collected from Great
Rivers, such as the Mississippi, Ohio, and Missouri rivers,
has been conducted on both a site-specific and stressor-
specific basis. Three studies were performed in the
Mississippi River in the late 1990s: two on the Upper
Mississippi River (UMR) and one on the Lower Mississippi
(LMR; Canfield et al. 1998; Brunson et al. 1998; Winger and
Lasier 1998). In the UMR studies, sample locations were
chosen based on historic chemistry data measured in soft
sediments from 13 navigational pools. In the first study,
correlations between field-collected benthic measures, tox-
icity, sediment chemistry, and other abiotic parameters were
weak (Canfield et al. 1998). This suggested that benthic
invertebrate distribution and assemblage structure were
most likely controlled by factors independent of contami-
nant concentrations in the sediment. The second UMR study
examined bioaccumulation of polychlorinated biphenyls
(PCBs) and polycyclic aromatic hydrocarbons (PAHs) in the
sediment from these same sites using laboratory exposures
of oligochaetes (Brunson et al. 1998). Correlations for
concentrations of individual compounds between labora-
tory-exposed and field-collected oligochaetes were stron-
gest for benzo(e)pyrene, perylene, benzo(b,k)fluoranthene,
and pyrene. Approximately 90% of the paired PAH con-
centrations in laboratory-exposed and field-collected oli-
gochaetes were within a factor of three, and the investigators
believed that laboratory extrapolations to the field could be
made with reasonable certainty (Brunson et al. 1998). The
third study, conducted on the LMR, examined sediment
samples collected at sites above and below five major cities
(Winger and Lasier 1998). Toxicity of sediment and sedi-
ment porewater was used to assess the effects of cities on
sediment quality along the LMR. Acute toxicity was deter-
mined by exposing Hyalella azteca to solid-phase sediment
for 10 days and to sediment porewater under static condi-
tions for 96 hours. Sediments were analyzed for organics
(organochlorine pesticides, PCBs, organophosphate insec-
ticides, and PAHs) and metals [chromium (Cr), copper (Cu),
lead (Pb), manganese (Mn), nickel (Ni), and zinc (Zn)]. Due
to the heterogeneity of depositional sediments in the
Mississippi River system, samples collected at four sites
upstream and four sites downstream of each city were
averaged for comparative purposes (i.e., upstream vs.
downstream comparisons by city; Winger and Lasier 1998).
Although bottom sediments are perpetually being redis-
tributed by way of erosion and deposition, Winger and
Lasier (1998) believed that the variability found in indi-
vidual site toxicities within each city may reflect the influ-
ence of point-source discharges, which are common in this
system.
The United States Environmental Protection Agency’s
(USEPA) Environmental Monitoring and Assessment
Program for Great River Ecosystems (EMAP-GRE)
worked, in partnership with states, other federal agencies,
and tribes, to develop bioassessment tools for the nation’s
largest rivers (USEPA 2004). A goal of EMAP-GRE was to
develop methods that yielded unbiased data that could be
used to inform management decisions for the Great Rivers.
The key questions that EMAP-GRE attempted to answer
were as follows: (1) What are the current conditions of our
national aquatic ecosystems? (2) What stressors are asso-
ciated with biologic conditions? (3) Where are the condi-
tions improving or decreasing? and (4) Are management
programs and policies working? A variety of water quality,
sediment, biologic assemblage, and habitat metrics and
indicators were collected at each of the sites selected in the
EMAP-GRE study. During the summers of 2004 to 2006,
EMAP-GRE crews collected sediment samples in the UMR
(from Cairo, IL, to St. Paul, MN), in the Ohio River (from
Pittsburgh, PA, to Cairo, IL), and in the Missouri River
(from northeastern Montana to St. Louis, MO). These
sediment samples were sent to the USEPA laboratory in
Cincinnati, OH, to test for toxicity by way of survival and
growth end points. Sediment toxicity testing was conducted
to help address questions no. 1 and 2 mentioned previously
because they pertain to sediment quality and habitat con-
dition. Unlike previous studies on Great Rivers (Canfield
et al. 1998; Brunson et al. 1998; Winger and Lasier 1998;
USEPA 2004), EMAP-GRE samples were collected at
randomly selected locations, rather than at or near known
or suspected contaminated sites or contaminant sources.
This article reports the extent of sediment toxicity found in
the Ohio and Missouri rivers and the UMR based on sur-
vival and growth toxicity end points using a 7-day
amphipod (H. azteca) test method.
58 Arch Environ Contam Toxicol (2011) 60:57–67
123
Materials and Methods
Site Selection
A probability survey algorithm with an explicit random
element was used to select sample sites on each river in the
site-selection process (Stevens 1997), with spatial balance
incorporated to disperse the sites longitudinally and increase
the representativeness of the samples (see McDonald et al.
(2004), Schweiger et al. (2004), and Angradi et al. (2009a)
for further details of site selection). As part of the probabi-
listic sampling design, each site received a weight indicating
the length (in km) and proportion of the river represented by
that sampling site based on whole-river estimates (see
www.epa.gov/nheerl/arm for additional design details). This
site-selection process allowed site level results to be
extrapolated to whole-river estimates of the extent and
magnitude of sediment toxicity.
Sediment Collection
Sediment samples were collected, using a hand scoop or
petite ponar, at 10 evenly spaced locations along a 500-m
shoreline transect at each site. The top 2 cm of fine sub-
strate within a 225-cm2 area (15 9 15 cm) was obtained at
each sampling location at a depth of B0.3 m (USEPA
2006). Four liters of sediment were collected and com-
posited for each site. The composite sample was stored in a
polyethylene bag and held on ice before shipment to the
laboratory. All of the sediment samples were refrigerated at
4�C until tested; testing was conducted within 8 weeks of
sample collection (USEPA 2006).
During the summers of 2004 through 2006, sediment
samples were collected at 447 sites, representing 4721 river
km. Toxicity assays were conducted within the allowed
sample holding period (i.e., within 8 weeks of collection)
and run in manageable batches of B20 samples, including
control (USEPA 2002a).
Sediment Test Procedure
Reformulated moderately hard reconstituted water
(RMHRW; hardness 100 mg/L as CaCO3) (USEPA 2002a)
was used as the overlying water in the sediment toxicity
tests. RMHRW was prepared using Super-Q (Millipore,
Billerica, MA) ultrapure water and reagent-grade chemi-
cals at least 3 days before the start of the test to allow time
for stabilization. Washed grade 40 silica sand was used as
control sediment.
EMAP-GRE sediment testing generally followed the
standard 10-day H. azteca sediment toxicity procedure
(USEPA 2002a), with minor modifications, including the
use of a 7-day exposure at 25�C (USEPA 1994, 2002b;
Smith et al. 1997; Tabak et al. 2003). Samples were
homogenized using a stainless-steel paint mixing paddle
attached to a power drill. Forty-milliliter subsamples of
sediment from each site were dispensed into four 250-mL
test beakers as replicates; control samples of washed sand
were prepared in a similar fashion. One hundred sixty
milliliter RMHRW was gently added to each beaker to
minimize any disturbance of the sediment. Samples were
held overnight at 25 ± 1�C. The next day, 20 7- to 10-day
old H. azteca were added to each test beaker to initiate
testing.
Routine chemical parameters (dissolved oxygen, pH,
and conductivity) were measured at day 0, before organ-
isms were added, and again on day 7, before test takedown;
temperature was measured on a daily basis. One hundred
percent of the water was exchanged daily, then animals
each beaker were fed 2 mL H. azteca test food, a 1:1 ratio
of algae Pseudokirchneriella subcapitata to alfalfa (Tabak
et al. 2003).
Beaker contents were sieved with a #30-mesh (500-lm)
sieve to retrieve surviving organisms at the conclusion of
exposures. Live amphipods were washed from the sieve
into a glass dish and counted. They were dried for 24 h at
60�C and cooled in a desiccator for 1 h. All of the animals
from each replicate beaker were weighed as a group to the
nearest 0.01 mg on tared pans.
Statistical Analysis
The sample survival and growth data were analyzed against
the control survival and growth data for each test batch
using Student t tests (Excel v 2003; Microsoft, Redmond,
WA). The data were tested for basic parametric assump-
tions, and it was determine that mortality and growth
toxicity would be determined by comparison of respective
replicate control and sample data by way of one-tailed
two-sample Student t test assuming unequal variance
(a = 0.05).
A sample was classified as lethally toxic if the p-value
of the Student t test was\0.05, and survival was\80% in
the sample. A sample significantly different from the
control with survival C80% was considered nontoxic. Test-
acceptability criteria used in this study was a minimum
control survival C80%.
A sample was classified as growth inhibitory if the mean
dry weight of test organisms was significantly less than the
control (p \ 0.05). No minimally acceptable growth cri-
teria have yet been determined for controls. The extent of
river km in each river exhibiting lethal toxicity, growth
inhibition, or general toxicity (lethal or growth-inhibitory
toxicity or both) were determined based on the individual
weights of sites from the probability design. Both number
and % of river km in each condition were calculated using
Arch Environ Contam Toxicol (2011) 60:57–67 59
123
R statistical software (v. 2.4.0; R Foundation for Statistical
Computing, Vienna, Austria) and an R-contributed library,
psurvey.analysis (v. 1.4; USEPA; http://www.epa.gov/
nheerl/arm), developed specifically for the statistical anal-
ysis of probability survey design data. The details of using
this statistical package are described by Stoddard et al.
(2005).
In addition, two types of regressions were performed on
the data. First, two stepwise logistic regressions were
performed for each river to predict the occurrence of lethal
and growth-inhibitory toxicity. A Hosmer-Lemeshow test
(Agresti 1996) was used to evaluate the fit of each final
model. Then, a best subsets regression was conducted, with
mean % survival corrected for control survival (i.e., divi-
ded by control survival) as the response variable. Mallow’s
Cp (Myers 1990) used to identify the best models for best
subsets regression for each river separately. Thirty abiotic
variables, including land use and sediment chemistry
(discussed later in text), were used as predictors in each
model (Table 1), and each variable was transformed
according to its use in a stressor gradient developed in
Angradi et al. (2009b).
Land Use–Toxicity Relation Analysis
The 2001 National Land Cover Data set (NCLD; Homer
et al. 2004) was used to determine % developed (NLCD
classes 21 to 24) and % agriculture (NLCD classes 81 to
82) land use within a subcatchment at each sample site.
Any National Hydrography Data set Plus (NHDPlus;
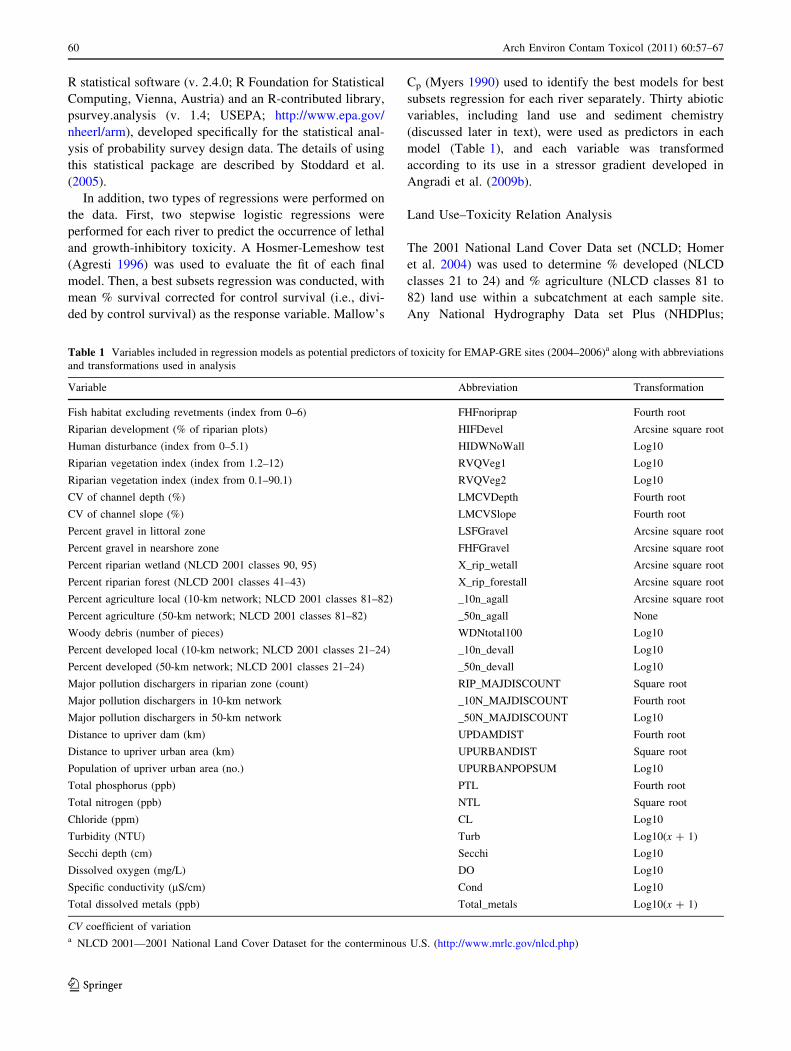
Table 1 Variables included in regression models as potential predictors of toxicity for EMAP-GRE sites (2004–2006)a along with abbreviations
and transformations used in analysis
Variable Abbreviation Transformation
Fish habitat excluding revetments (index from 0–6) FHFnoriprap Fourth root
Riparian development (% of riparian plots) HIFDevel Arcsine square root
Human disturbance (index from 0–5.1) HIDWNoWall Log10
Riparian vegetation index (index from 1.2–12) RVQVeg1 Log10
Riparian vegetation index (index from 0.1–90.1) RVQVeg2 Log10
CV of channel depth (%) LMCVDepth Fourth root
CV of channel slope (%) LMCVSlope Fourth root
Percent gravel in littoral zone LSFGravel Arcsine square root
Percent gravel in nearshore zone FHFGravel Arcsine square root
Percent riparian wetland (NLCD 2001 classes 90, 95) X_rip_wetall Arcsine square root
Percent riparian forest (NLCD 2001 classes 41–43) X_rip_forestall Arcsine square root
Percent agriculture local (10-km network; NLCD 2001 classes 81–82) _10n_agall Arcsine square root
Percent agriculture (50-km network; NLCD 2001 classes 81–82) _50n_agall None
Woody debris (number of pieces) WDNtotal100 Log10
Percent developed local (10-km network; NLCD 2001 classes 21–24) _10n_devall Log10
Percent developed (50-km network; NLCD 2001 classes 21–24) _50n_devall Log10
Major pollution dischargers in riparian zone (count) RIP_MAJDISCOUNT Square root
Major pollution dischargers in 10-km network _10N_MAJDISCOUNT Fourth root
Major pollution dischargers in 50-km network _50N_MAJDISCOUNT Log10
Distance to upriver dam (km) UPDAMDIST Fourth root
Distance to upriver urban area (km) UPURBANDIST Square root
Population of upriver urban area (no.) UPURBANPOPSUM Log10
Total phosphorus (ppb) PTL Fourth root
Total nitrogen (ppb) NTL Square root
Chloride (ppm) CL Log10
Turbidity (NTU) Turb Log10(x ? 1)
Secchi depth (cm) Secchi Log10
Dissolved oxygen (mg/L) DO Log10
Specific conductivity (lS/cm) Cond Log10
Total dissolved metals (ppb) Total_metals Log10(x ? 1)
CV coefficient of variationa NLCD 2001—2001 National Land Cover Dataset for the conterminous U.S. (http://www.mrlc.gov/nlcd.php)
60 Arch Environ Contam Toxicol (2011) 60:57–67
123
http://www.horizon-systems.com/nhdplus) catchment that
intersected the Great River or one of its tributaries within a
50-km flow distance upstream of the sample site was used in
the analysis. Angradi et al. (2010) found subcatchments of
this size to be useful for identifying major urban areas along
mid-continent Great Rivers. The estimated land use for each
sample location was calculated by summing the total land
use area within the selected NHDPlus catchments.
Sediment Chemistry Analysis
Sediment samples that were toxic to amphipods were pri-
oritized for chemical analysis. Due to limited analytic
capacity, analyses were performed only on those samples
exhibiting the highest toxicity. Samples expressing toxicity
in both survival and growth were given the highest priority,
followed by those expressing only toxicity based on sur-
vival, and, finally, those expressing only toxicity based on
amphipod growth. Samples were analyzed for 21 organic
pesticides [aldrin (309-00-2); chlordane-cis (5103-71-9);
chlordane-trans (5103-74-2); 2,40-DDD (53-19-0); 4,40-DDD (72-54-8); 2,40-DDE (3424-82-6); 4,40-DDE (72-55-
9); 2,40-DDT (789-02-6); 4,40-DDT (50-29-3); dieldrin
(60-57-1); endosulfan I (959-98-8); endosulfan II (33213-
65-9); endrin (72-20-8); heptachlor (76-44-8); hepta-
chlor epoxide (1024-57-3); hexachlorobenzene (118-74-1);
hexacholorocyclohexane (Gamma-BHC/Lindane, 58-89-9);
mirex (2385-85-5); trans-nonachlor (3765-80-5); cis-nona-
chlor (5103-73-1); oxychlordane (27304-13-8)], 6 polybro-
minated diphenyl ethers (PBDEs; 47, 99, 100, 153, 154, and
183), and 20 PCB congeners [8, 18, 28, 52, 44, 66, 101, 77
(coplanar), 118, 153, 105, 138, 187, 128, 180, 170, 195, 206,
209, 1 and 26 (coplanar)]. The detection limit for all of ana-
lytes was 0.001 ppm. These analytes were chosen because
they represent legacy contaminants most often measured in
sediments and were also measured and reported in an
associated EMAP-GRE study examining fish tissue
(Blocksom et al. 2010).
When samples were being prepared for sediment tox-
icity, a subsample was collected and frozen in a glass jar at
-20�C for chemical analysis. When samples were selected
for chemical analysis, the samples were thawed to room
temperature and mixed with a spatula before extraction.
For samples consisting of B50% water, a 15-g sample was
dried using sodium sulfate and loaded into an ASE-200
accelerated solvent extractor (Dionex, Sunnyvale, CA). For
samples with [50% water, the sample mass was first
adjusted so there was no more than 7 g of water in a
sample. An extraction solvent of acetone and hexane
(50:50 v/v) was used, and each sample was extracted at
100�C and 1000 psi for two 7-min cycles. The extract was
concentrated to 10 mL and dried through a 25-g sodium
sulfate column. A 2-mL aliquot was then loaded onto an
alumina column (3 g), and the column was eluted with
14 mL hexane and methylene chloride (80:20 v/v). The
sample extract was reconcentrated under nitrogen at 50�C to
a final volume of 1 mL. This extraction procedure was based
on USEPA method no. 508.1 (USEPA 1995). For samples
that contained sulfur, the 1-mL alumina-cleaned extract was
transferred to a centrifuge tube with 2 g oxide-cleaned
copper and mixed for 1 min. The sample was separated from
the copper by centrifugation at 3000 rpm for 5 min, and the
solvent layer decanted as described by USEPA method no.
3660B (USEPA 2008). Samples were analyzed using an
Agilent 6890 gas chromatograph (Agilent, Palo Alto, CA)
equipped with a micro electron capture detector that used a
dual-column system for analyte confirmation.
All 447 sediment samples were analyzed for total
ammonia. Levels of unionized ammonia (NH3), the
ammonia species responsible for lethality toxicity in
aquatic organisms, were calculated from total ammonia
concentration, pH, and temperature within the water col-
umn. Ammonia concentration was measured on day 0
using an Orion Expandable Ion Analyzer (EA 940; Orion
Research, Boston, MA).
Nonparametric Spearman rank correlation analysis (SY-
STAT v 11; Systat, San Jose, CA) was used to determine the
relation of unionized ammonia concentrations to survival.
The effect of unionized ammonia concentration on survival
and growth end points was examined using logistic regres-
sion (PROC LOGISTIC, SAS v9.1; SAS, Cary, NC). From
these logistic regressions, the log likelihood (L), a measure
of model fit with lower numbers indicating better fit, and
the likelihood ratio (LR), a measure of the significance of
the model, were used to determine the importance of rela-
tions between log10-transformed unionized ammonia and
toxicity.
Results
Sediment Toxicity Test Results
Sediment from 65 of the 447 sites visited in this study
(14.5%) was found to be acutely toxic to H. azteca (Fig. 1),
and sediment from 130 sites (29.1%) was found to inhibit
growth in H. azteca. One-hundred eighty-two sites (40.7%)
were characterized as lethally toxic, growth inhibitory, or
both. Table 2 lists the sediment toxicity results for each of
the Great Rivers.
Of the 447 sites assessed, 144 were on the Mississippi
River, 183 were on the Missouri River, and 120 were on
the Ohio River. Twenty-six of the 144 Mississippi River
sites (18.1%) were characterized as acutely toxic, whereas
37 (25.7%) were found to inhibit growth within 7 days.
Fifty-six sites (38.9%) expressed toxicity for at least one
Arch Environ Contam Toxicol (2011) 60:57–67 61
123
end point, with 19 (33.9%) revealing acute toxicity only,
30 (53.6%) exhibiting only inhibition of growth within
7 days, and 7 (12.5%) displaying toxicity both for survival
and growth.
On the Missouri River, twenty-five (25) of the 183 sites
(13.7%) were characterized as acutely toxic, whereas 58
(31.7%) were found to inhibit growth within 7 days. Sev-
enty-nine (79) sites (43.2%) expressed toxicity for at least
one end point, with 21 (26.6%) revealing acute toxicity
only, 54 (68.4%) exhibiting only inhibition of growth
within 7 days, and 4 (5.1%) displaying toxicity both for
survival and growth.
Fourteen of the 120 Ohio River sites assessed (11.7%)
were characterized acutely toxic, whereas 35 (29.2%) were
found to inhibit growth within 7 days. Forty-seven (47)
sites (39.2%) expressed toxicity for at least one end point,
with 12 (25.5%) revealing acute toxicity only, 33 (70.2%)
exhibiting only inhibition of growth within 7 days, and 2
(4.3%) displaying toxicity both for survival and growth.
From the EMAP-GRE probabilistic sampling design,
each sampled site previously reported had a weight asso-
ciated with it that determined the length (in km) and pro-
portion of the river represented by that sample point in the
population. Using those weights, of the 4721 river km
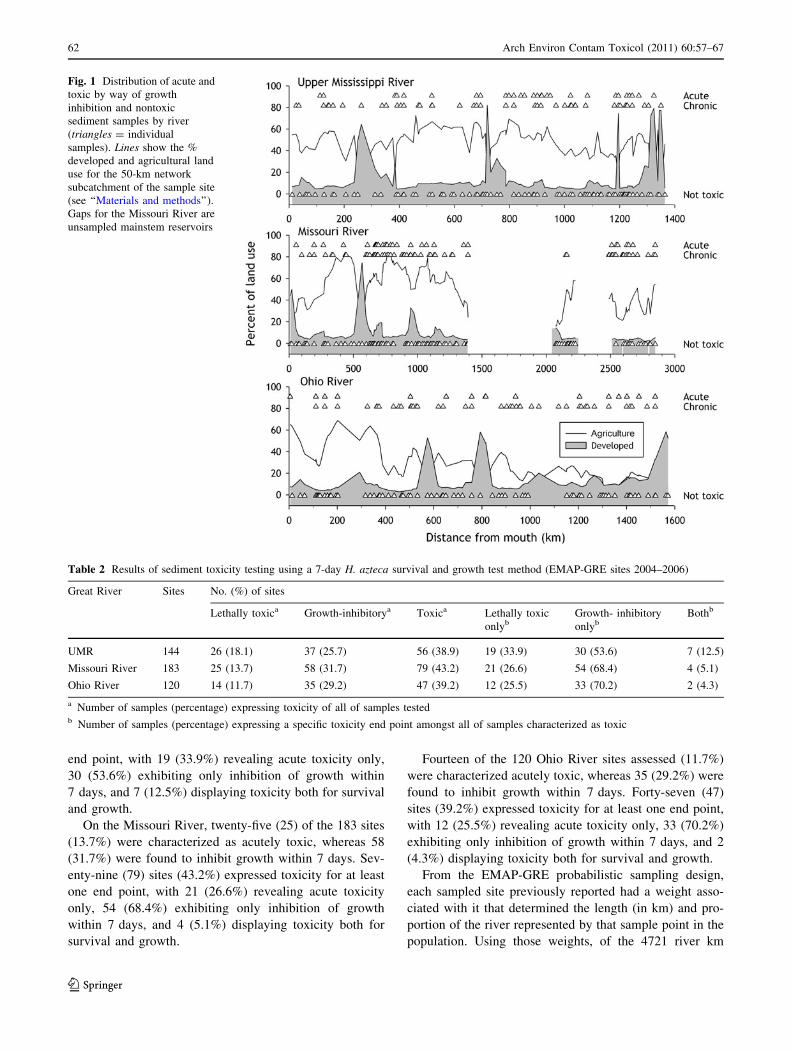
Fig. 1 Distribution of acute and
toxic by way of growth
inhibition and nontoxic
sediment samples by river
(triangles = individual
samples). Lines show the %
developed and agricultural land
use for the 50-km network
subcatchment of the sample site
(see ‘‘Materials and methods’’).
Gaps for the Missouri River are
unsampled mainstem reservoirs
Table 2 Results of sediment toxicity testing using a 7-day H. azteca survival and growth test method (EMAP-GRE sites 2004–2006)
Great River Sites No. (%) of sites
Lethally toxica Growth-inhibitorya Toxica Lethally toxic
onlybGrowth- inhibitory
onlybBothb
UMR 144 26 (18.1) 37 (25.7) 56 (38.9) 19 (33.9) 30 (53.6) 7 (12.5)
Missouri River 183 25 (13.7) 58 (31.7) 79 (43.2) 21 (26.6) 54 (68.4) 4 (5.1)
Ohio River 120 14 (11.7) 35 (29.2) 47 (39.2) 12 (25.5) 33 (70.2) 2 (4.3)
a Number of samples (percentage) expressing toxicity of all of samples testedb Number of samples (percentage) expressing a specific toxicity end point amongst all of samples characterized as toxic
62 Arch Environ Contam Toxicol (2011) 60:57–67
123
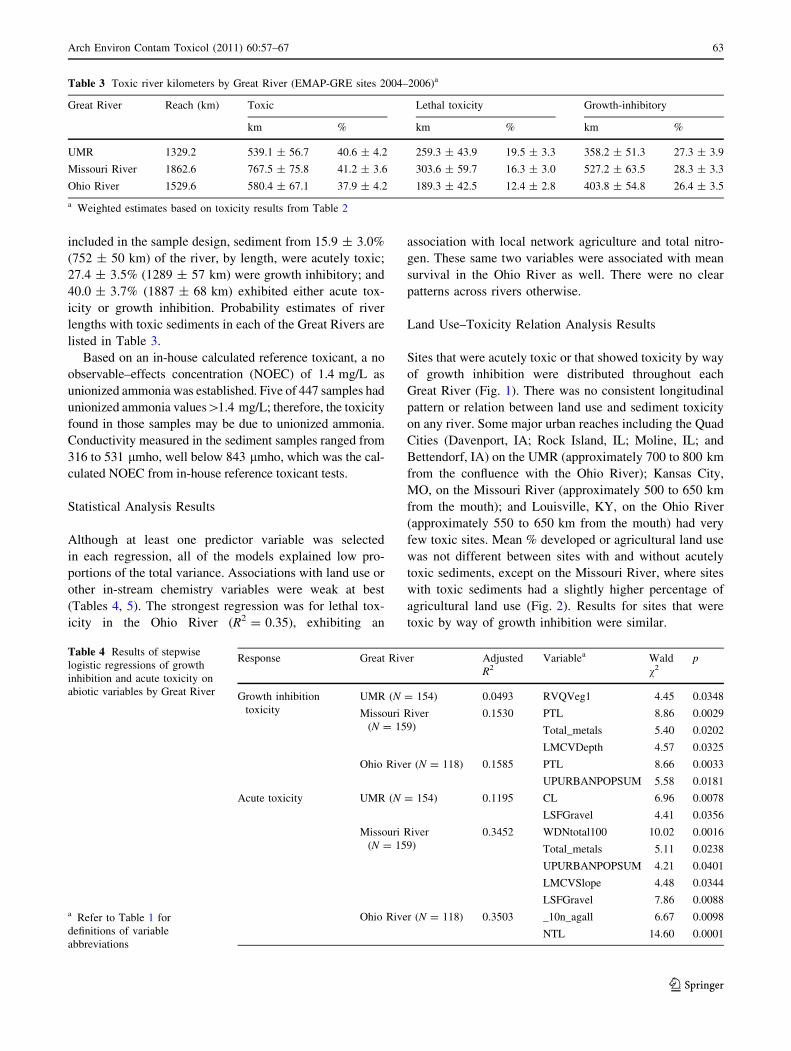
included in the sample design, sediment from 15.9 ± 3.0%
(752 ± 50 km) of the river, by length, were acutely toxic;
27.4 ± 3.5% (1289 ± 57 km) were growth inhibitory; and
40.0 ± 3.7% (1887 ± 68 km) exhibited either acute tox-
icity or growth inhibition. Probability estimates of river
lengths with toxic sediments in each of the Great Rivers are
listed in Table 3.
Based on an in-house calculated reference toxicant, a no
observable–effects concentration (NOEC) of 1.4 mg/L as
unionized ammonia was established. Five of 447 samples had
unionized ammonia values[1.4 mg/L; therefore, the toxicity
found in those samples may be due to unionized ammonia.
Conductivity measured in the sediment samples ranged from
316 to 531 lmho, well below 843 lmho, which was the cal-
culated NOEC from in-house reference toxicant tests.
Statistical Analysis Results
Although at least one predictor variable was selected
in each regression, all of the models explained low pro-
portions of the total variance. Associations with land use or
other in-stream chemistry variables were weak at best
(Tables 4, 5). The strongest regression was for lethal tox-
icity in the Ohio River (R2 = 0.35), exhibiting an
association with local network agriculture and total nitro-
gen. These same two variables were associated with mean
survival in the Ohio River as well. There were no clear
patterns across rivers otherwise.
Land Use–Toxicity Relation Analysis Results
Sites that were acutely toxic or that showed toxicity by way
of growth inhibition were distributed throughout each
Great River (Fig. 1). There was no consistent longitudinal
pattern or relation between land use and sediment toxicity
on any river. Some major urban reaches including the Quad
Cities (Davenport, IA; Rock Island, IL; Moline, IL; and
Bettendorf, IA) on the UMR (approximately 700 to 800 km
from the confluence with the Ohio River); Kansas City,
MO, on the Missouri River (approximately 500 to 650 km
from the mouth); and Louisville, KY, on the Ohio River
(approximately 550 to 650 km from the mouth) had very
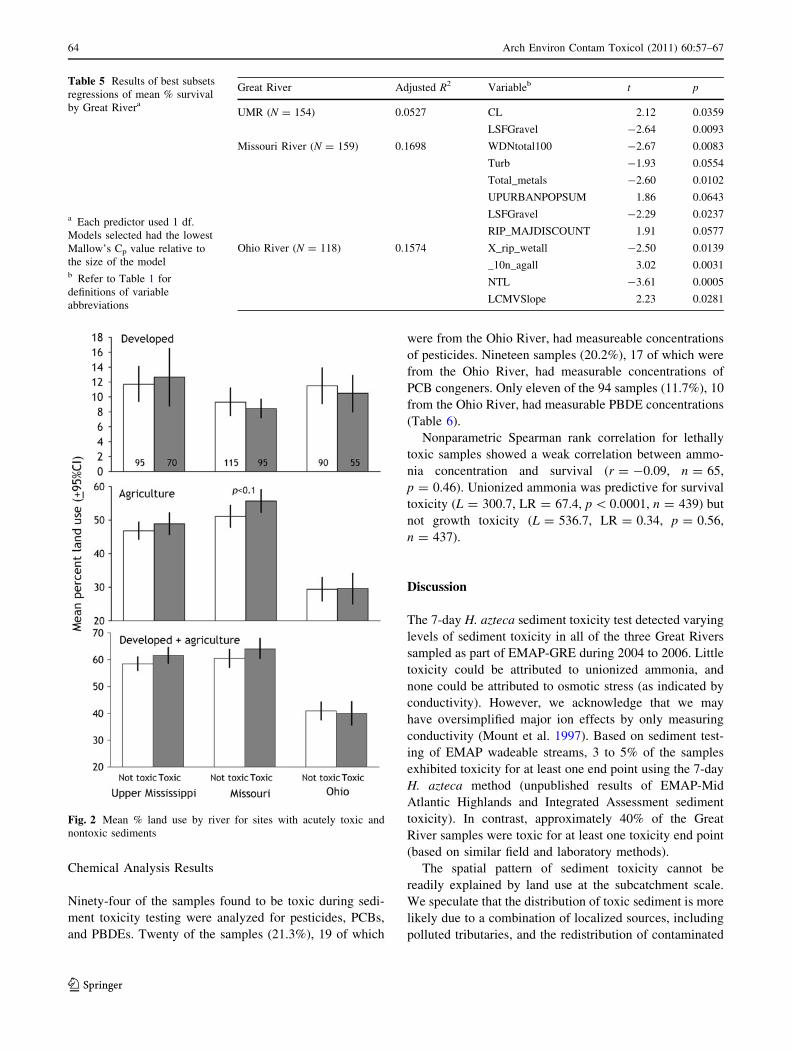
few toxic sites. Mean % developed or agricultural land use
was not different between sites with and without acutely
toxic sediments, except on the Missouri River, where sites
with toxic sediments had a slightly higher percentage of
agricultural land use (Fig. 2). Results for sites that were
toxic by way of growth inhibition were similar.
Table 3 Toxic river kilometers by Great River (EMAP-GRE sites 2004–2006)a
Great River Reach (km) Toxic Lethal toxicity Growth-inhibitory
km % km % km %
UMR 1329.2 539.1 ± 56.7 40.6 ± 4.2 259.3 ± 43.9 19.5 ± 3.3 358.2 ± 51.3 27.3 ± 3.9
Missouri River 1862.6 767.5 ± 75.8 41.2 ± 3.6 303.6 ± 59.7 16.3 ± 3.0 527.2 ± 63.5 28.3 ± 3.3
Ohio River 1529.6 580.4 ± 67.1 37.9 ± 4.2 189.3 ± 42.5 12.4 ± 2.8 403.8 ± 54.8 26.4 ± 3.5
a Weighted estimates based on toxicity results from Table 2
Table 4 Results of stepwise
logistic regressions of growth
inhibition and acute toxicity on
abiotic variables by Great River
a Refer to Table 1 for
definitions of variable
abbreviations
Response Great River Adjusted
R2Variablea Wald
v2p
Growth inhibition
toxicity
UMR (N = 154) 0.0493 RVQVeg1 4.45 0.0348
Missouri River
(N = 159)
0.1530 PTL 8.86 0.0029
Total_metals 5.40 0.0202
LMCVDepth 4.57 0.0325
Ohio River (N = 118) 0.1585 PTL 8.66 0.0033
UPURBANPOPSUM 5.58 0.0181
Acute toxicity UMR (N = 154) 0.1195 CL 6.96 0.0078
LSFGravel 4.41 0.0356
Missouri River
(N = 159)
0.3452 WDNtotal100 10.02 0.0016
Total_metals 5.11 0.0238
UPURBANPOPSUM 4.21 0.0401
LMCVSlope 4.48 0.0344
LSFGravel 7.86 0.0088
Ohio River (N = 118) 0.3503 _10n_agall 6.67 0.0098
NTL 14.60 0.0001
Arch Environ Contam Toxicol (2011) 60:57–67 63
123
Chemical Analysis Results
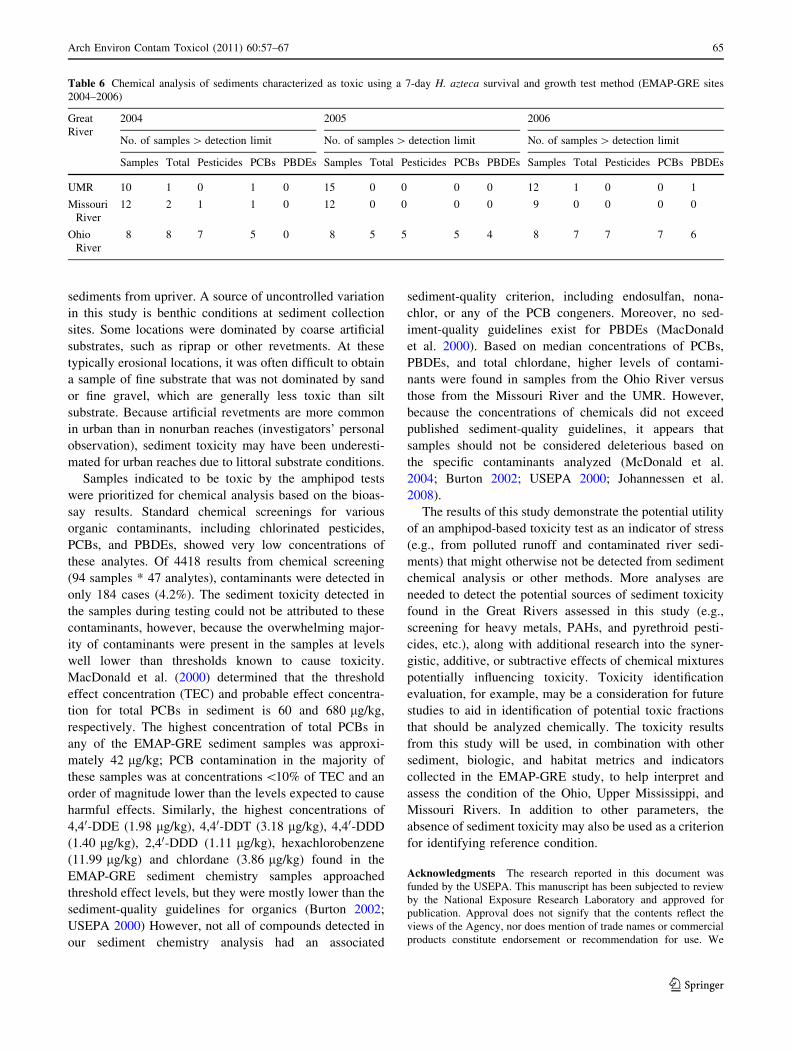
Ninety-four of the samples found to be toxic during sedi-
ment toxicity testing were analyzed for pesticides, PCBs,
and PBDEs. Twenty of the samples (21.3%), 19 of which
were from the Ohio River, had measureable concentrations
of pesticides. Nineteen samples (20.2%), 17 of which were
from the Ohio River, had measurable concentrations of
PCB congeners. Only eleven of the 94 samples (11.7%), 10
from the Ohio River, had measurable PBDE concentrations
(Table 6).
Nonparametric Spearman rank correlation for lethally
toxic samples showed a weak correlation between ammo-
nia concentration and survival (r = -0.09, n = 65,
p = 0.46). Unionized ammonia was predictive for survival
toxicity (L = 300.7, LR = 67.4, p \ 0.0001, n = 439) but
not growth toxicity (L = 536.7, LR = 0.34, p = 0.56,
n = 437).
Discussion
The 7-day H. azteca sediment toxicity test detected varying
levels of sediment toxicity in all of the three Great Rivers
sampled as part of EMAP-GRE during 2004 to 2006. Little
toxicity could be attributed to unionized ammonia, and
none could be attributed to osmotic stress (as indicated by
conductivity). However, we acknowledge that we may
have oversimplified major ion effects by only measuring
conductivity (Mount et al. 1997). Based on sediment test-
ing of EMAP wadeable streams, 3 to 5% of the samples
exhibited toxicity for at least one end point using the 7-day
H. azteca method (unpublished results of EMAP-Mid
Atlantic Highlands and Integrated Assessment sediment
toxicity). In contrast, approximately 40% of the Great
River samples were toxic for at least one toxicity end point
(based on similar field and laboratory methods).
The spatial pattern of sediment toxicity cannot be
readily explained by land use at the subcatchment scale.
We speculate that the distribution of toxic sediment is more
likely due to a combination of localized sources, including
polluted tributaries, and the redistribution of contaminated
Table 5 Results of best subsets
regressions of mean % survival
by Great Rivera
a Each predictor used 1 df.
Models selected had the lowest
Mallow’s Cp value relative to
the size of the modelb Refer to Table 1 for
definitions of variable
abbreviations
Great River Adjusted R2 Variableb t p
UMR (N = 154) 0.0527 CL 2.12 0.0359
LSFGravel -2.64 0.0093
Missouri River (N = 159) 0.1698 WDNtotal100 -2.67 0.0083
Turb -1.93 0.0554
Total_metals -2.60 0.0102
UPURBANPOPSUM 1.86 0.0643
LSFGravel -2.29 0.0237
RIP_MAJDISCOUNT 1.91 0.0577
Ohio River (N = 118) 0.1574 X_rip_wetall -2.50 0.0139
_10n_agall 3.02 0.0031
NTL -3.61 0.0005
LCMVSlope 2.23 0.0281
Fig. 2 Mean % land use by river for sites with acutely toxic and
nontoxic sediments
64 Arch Environ Contam Toxicol (2011) 60:57–67
123
sediments from upriver. A source of uncontrolled variation
in this study is benthic conditions at sediment collection
sites. Some locations were dominated by coarse artificial
substrates, such as riprap or other revetments. At these
typically erosional locations, it was often difficult to obtain
a sample of fine substrate that was not dominated by sand
or fine gravel, which are generally less toxic than silt
substrate. Because artificial revetments are more common
in urban than in nonurban reaches (investigators’ personal
observation), sediment toxicity may have been underesti-
mated for urban reaches due to littoral substrate conditions.
Samples indicated to be toxic by the amphipod tests
were prioritized for chemical analysis based on the bioas-
say results. Standard chemical screenings for various
organic contaminants, including chlorinated pesticides,
PCBs, and PBDEs, showed very low concentrations of
these analytes. Of 4418 results from chemical screening
(94 samples * 47 analytes), contaminants were detected in
only 184 cases (4.2%). The sediment toxicity detected in
the samples during testing could not be attributed to these
contaminants, however, because the overwhelming major-
ity of contaminants were present in the samples at levels
well lower than thresholds known to cause toxicity.
MacDonald et al. (2000) determined that the threshold
effect concentration (TEC) and probable effect concentra-
tion for total PCBs in sediment is 60 and 680 lg/kg,
respectively. The highest concentration of total PCBs in
any of the EMAP-GRE sediment samples was approxi-
mately 42 lg/kg; PCB contamination in the majority of
these samples was at concentrations \10% of TEC and an
order of magnitude lower than the levels expected to cause
harmful effects. Similarly, the highest concentrations of
4,40-DDE (1.98 lg/kg), 4,40-DDT (3.18 lg/kg), 4,40-DDD
(1.40 lg/kg), 2,40-DDD (1.11 lg/kg), hexachlorobenzene
(11.99 lg/kg) and chlordane (3.86 lg/kg) found in the
EMAP-GRE sediment chemistry samples approached
threshold effect levels, but they were mostly lower than the
sediment-quality guidelines for organics (Burton 2002;
USEPA 2000) However, not all of compounds detected in
our sediment chemistry analysis had an associated
sediment-quality criterion, including endosulfan, nona-
chlor, or any of the PCB congeners. Moreover, no sed-
iment-quality guidelines exist for PBDEs (MacDonald
et al. 2000). Based on median concentrations of PCBs,
PBDEs, and total chlordane, higher levels of contami-
nants were found in samples from the Ohio River versus
those from the Missouri River and the UMR. However,
because the concentrations of chemicals did not exceed
published sediment-quality guidelines, it appears that
samples should not be considered deleterious based on
the specific contaminants analyzed (McDonald et al.
2004; Burton 2002; USEPA 2000; Johannessen et al.
2008).
The results of this study demonstrate the potential utility
of an amphipod-based toxicity test as an indicator of stress
(e.g., from polluted runoff and contaminated river sedi-
ments) that might otherwise not be detected from sediment
chemical analysis or other methods. More analyses are
needed to detect the potential sources of sediment toxicity
found in the Great Rivers assessed in this study (e.g.,
screening for heavy metals, PAHs, and pyrethroid pesti-
cides, etc.), along with additional research into the syner-
gistic, additive, or subtractive effects of chemical mixtures
potentially influencing toxicity. Toxicity identification
evaluation, for example, may be a consideration for future
studies to aid in identification of potential toxic fractions
that should be analyzed chemically. The toxicity results
from this study will be used, in combination with other
sediment, biologic, and habitat metrics and indicators
collected in the EMAP-GRE study, to help interpret and
assess the condition of the Ohio, Upper Mississippi, and
Missouri Rivers. In addition to other parameters, the
absence of sediment toxicity may also be used as a criterion
for identifying reference condition.
Acknowledgments The research reported in this document was
funded by the USEPA. This manuscript has been subjected to review
by the National Exposure Research Laboratory and approved for
publication. Approval does not signify that the contents reflect the
views of the Agency, nor does mention of trade names or commercial
products constitute endorsement or recommendation for use. We
Table 6 Chemical analysis of sediments characterized as toxic using a 7-day H. azteca survival and growth test method (EMAP-GRE sites
2004–2006)
Great
River
2004 2005 2006
No. of samples [ detection limit No. of samples [ detection limit No. of samples [ detection limit
Samples Total Pesticides PCBs PBDEs Samples Total Pesticides PCBs PBDEs Samples Total Pesticides PCBs PBDEs
UMR 10 1 0 1 0 15 0 0 0 0 12 1 0 0 1
Missouri
River
12 2 1 1 0 12 0 0 0 0 9 0 0 0 0
Ohio
River
8 8 7 5 0 8 5 5 5 4 8 7 7 7 6
Arch Environ Contam Toxicol (2011) 60:57–67 65
123
thank Amy Parks, Gerilyn Ahlers, and Sarah Watson for the chemical
analyses of the sediment samples found to be toxic. Review com-
ments provided by Mari Nord and John Dorkin, USEPA, Region 5,
and Frank McCormick, United States Forest Service, were most
helpful, as was the technical review provided by Justicia Rhodus,
Dynamac Corporation.
References
Agresti A (1996) An introduction to categorical data analysis. Wiley,
New York
Angradi TR, Bolgrien DW, Jicha TM, Pearson MS, Hill BH, Taylor
DL (2009a) A bioassessment approach for mid-continent Great
Rivers: The Upper Mississippi, Missouri and Ohio (USA).
Environ Monit Assess 152:425–442
Angradi TR, Pearson MS, Jicha TM, Taylor DL, Bolgrien DW,
Moffett MF (2009b) Using stressor gradients to determine
reference expectations for Great River fish assemblages. Ecol
Indic 9:748–764
Angradi TR, Bolgrien DW, Jicha TM, Moffett MF (2010) Macroin-
vertebrate assemblage response to urbanization in three mid-
continent USA great rivers. Fund Appl Limnol Arch Hydrobiol
176:183–196
Blocksom KA, Walters DM, Jicha TM, Lazorchak JM, Angradi TR,
Bolgrien DW (2010) Persistent organic pollutants in fish tissue in
the mid-continental great rivers of the United States. Sci Total
Environ 408:1180–1189
Brunson EL, Canfield TJ, Dwyer FJ, Ingersoll CG, Kemble NE
(1998) Assessing the bioaccumulation of contaminants from
sediments of the Upper Mississippi River using field-collected
oligochaetes and laboratory-exposed Lumbriculus variegates.
Arch Environ Contam Toxicol 35:191–201
Burton GA Jr (2002) Sediment quality criteria in use around the
world. Limnology 3:65–75
Canfield TC, Brunson EL, Dwyer FJ, Ingersoll CG, Kemble NE (1998)
Assessing sediments from Upper Mississippi River navigational
pools using a benthic invertebrate community evaluation and the
sediment quality triad approach. Arch Environ Contam Toxicol
35:202–212
Greenstein D, Bay S, Anderson B, Chandler T, Farrar JD, Keppler C
et al (2008) Comparison of methods for evaluating acute and
chronic toxicity in marine sediments. Environ Toxicol Chem
27:933–944
Homer C, Huang C, Yang L, Wylie B, Coan M (2004) Development
of a 2001 national land cover database for the United States.
Photogramm Eng Remote Sensing 70:824–840
Hunt JW, Anderson BA, Phillips BM, Tjeerdema RS, Taberski KM,
Wilson CJ (2001) A large-scale categorization of sites in San
Francisco Bay, USA, based on the sediment quality triad,
toxicity identification evaluations, and gradient studies. Environ
Toxicol Chem 20:1252–1265
Johannessen SC, Macdonald RW, Wright CA, Burd B, Shaw DP, van
Roodselaar A (2008) Joined by geochemistry, divided by
history: PCBs and PBDEs in Strait of Georgia sediments. Mar
Environ Res 66(Suppl 1):S112–S120
Kuhn A, Munns WA Jr, Serbst J, Edwards P, Cantwell MG, Gleason
T et al (2002) Evaluating the ecological significance of
laboratory response data to predict population-level effects for
the estuarine amphipod Ampelisca abdita. Environ Toxicol
Chem 21:865–874
Long ER, Hong CB, Severn CG (2001) Relationships between acute
sediment toxicity in laboratory tests and abundance and diversity
of benthic infauna in marine sediments: a review. Environ
Toxicol Chem 20:46–60
MacDonald DD, Ingersoll CG, Berger TA (2000) Development and
evaluation of consensus based sediment quality guidelines for
freshwater ecosystems. Arch Environ Toxicol 39:20–31
McDonald M, Blair R, Bolgrien D, Brown B, Dlugosz J, Hale S (2004)
The U.S. Environmental Protection Agency’s Environmental
Monitoring and Assessment Program. In: Wiersma GB et al (eds)
Environmental monitoring. CRC, New York, pp 649–668
Mount DR, Gulley DD, Hockett JR, Garrison TD, Evans JM (1997)
Statistical models to predict the toxicity of major ions to
Ceriodaphnia dubia, Daphnia magna and Pimephales promelas(fathead minnows). Environ Toxicol Chem 16:2009–2019
Myers RH (1990) Classical and modern regression with applications,
2nd edn. Duxbury, Belmont
Preston B (2002) Spatial patterns in benthic biodiversity of Chesa-
peake Bay, USA (1984–1999): association with water quality
and sediment toxicity. Environ Toxicol Chem 20:151–162
Schweiger EW, Bolgrien DW, Angradi TR, Kelly JR (2004)
Environmental monitoring and assessment of a Great River
ecosystem: The Upper Missouri River pilot. Environ Monit
Assess 103:5–20
Smith ME, Lazorchak JM, Herrin LE, Brewer-Swartz S, Thoeny WT
(1997) A reformulated reconstituted water for testing the
freshwater amphipod, Hyalella azteca. Environ Toxicol Chem
16:1229–1233
Stevens DL Jr (1997) Variable density grid-based sampling designs
for continuous spatial populations. Environometrics 8:167–195
Stoddard JL, Peck DV, Olsen AR, Larsen DP, Van Sickle J, Hawkins
CP et al (2005) Environmental Monitoring and Assessment
Program (EMAP): western streams and rivers statistical sum-
mary. EPA/620/R-05/006. USEPA, Office of Research and
Development, Washington, DC
Stronkhorst J, Schipper C, Brils J, Dubbeldam M, Postma J, Van De
Hoevenzz N (2003) Using marine bioassays to classify the
toxicity of Dutch Harbor sediments. Environ Toxicol Chem
22:1535–1547
Tabak HH, Lazorchak JM, Li L, Khodadoust AP, Antia RB, Suidan
MT (2003) Studies on bioremediation of polycyclic aromatic
hydrocarbons contaminated sediments: bioavailability, biode-
gradability and toxicity issues. Environ Toxicol Chem 22:
473–482
Tucker KA, Burton GA (1999) Assessment of nonpoint-source runoff
in a stream using in situ and laboratory approaches. Environ
Toxicol Chem 18:2797–2803
United States Environmental Protection Agency (1994) Environmen-
tal monitoring, assessment program, surface waters, region 3
regional environmental monitoring and assessment program:
1994 laboratory methods manual for streams. EPA/620/R-94/
003. USEPA, Washington, DC
United States Environmental Protection Agency (1995) Determina-
tion of chlorinated pesticides, herbicides, and organohalides by
liquid-solid extraction and electron capture gas chromatography,
508.1. USEPA, Office of Research and Development, National
Exposure Research Laboratory, Cincinnati
United States Environmental Protection Agency (2000) Prediction of
sediment toxicity using consensus-based freshwater sediment
quality guidelines. EPA 905-R-00–007. USEPA, Washington, DC
United States Environmental Protection Agency (2002a) Methods for
measuring the toxicity and bioaccumulation of sediment-associ-
ated contaminants with freshwater invertebrates, 2nd edn. EPA-
600-R-99-064. USEPA, Office of Water, Washington, DC
United States Environmental Protection Agency (2002b). Methods for
measuring the acute toxicity of effluents and receiving waters to
freshwater and marine organisms, 4th edn. EPA-821-R-02-012.
USEPA, Office of Water, Washington, DC
United States Environmental Protection Agency (2004) EPA collab-
orates with state and federal partners to study the state of the
66 Arch Environ Contam Toxicol (2011) 60:57–67
123

great rivers. Fact sheet. USEPA, Office of Research and
Development, Washington, DC
United States Environmental Protection Agency (2006) Environmen-
tal Monitoring and Assessment Program: Great River ecosys-
tems field operations manual. EPA/620/R-06/002. USEPA,
Office of Research and Development, Washington, DC
United States Environmental Protection Agency (2008) Method
3660B, Sulfur cleanup, Rev. 2 (December 1996). In: Test
methods for evaluating solid waste, physical/chemical methods,
3rd edn. Final update IV. SW-846. USEPA, Washington, DC.
http://www.epa.gov/epawaste/hazard/testmethods/sw846/pdfs/
3660b.pdf
Winger PV, Lasier PJ (1998) Toxicity of sediment collected upriver
and downriver of major cities along the Lower Mississippi River.
Arch Environ Contam Toxicol 35:213–217
Arch Environ Contam Toxicol (2011) 60:57–67 67
123