Embed Size (px)
Citation preview
Segmenting the market intopowerful pictures: Applicationof the Business FacilitiesMeasure (BFM)
June 2010
Roland V. Pearson, Jr.
Pub
lic D
iscl
osur
e A
utho
rized
Pub
lic D
iscl
osur
e A
utho
rized
Pub
lic D
iscl
osur
e A
utho
rized
Pub
lic D
iscl
osur
e A
utho
rized
Pub
lic D
iscl
osur
e A
utho
rized
Pub
lic D
iscl
osur
e A
utho
rized
Pub
lic D
iscl
osur
e A
utho
rized
Pub
lic D
iscl
osur
e A
utho
rized
2
About this publication
This report forms part of the findings of the Zambia Business Survey (ZBS). The ZBS comprised two
separate surveys. The MSME Survey was a nationally representative survey across all nine provinces
of individuals who owned and ran their own businesses and employed up to 50 individuals. The
supplementary Large Business Survey (LBS) was a survey of 161 large enterprises employing 51 or
more individuals.
The results of the ZBS are in the main summary report, The profile and productivity of Zambian
businesses. Analysis of the data resulted in four technical papers, including this one. The other
papers cover:
• The business landscape, which looks at the environment in which Zambian businesses operate
(The business landscape for MSMEs and large enterprises in Zambia)
• Productivity, which examines the productivity of Zambian enterprises (Who’s productive in
Zambia’s private sector? – Evidence from the Zambia Business Survey)
• Access to finance, which explores the demand-side data relating to access to financial services
(Demand-side analysis of access to financial services for businesses in Zambia)
These reports are available via the web or from the offices of the four partner agencies that
produced this work: Zambia Business Forum (www.zbf.org.zm, [email protected]); Private
Sector Development Reform Programme (www.psdrp.org.zm); FinMark Trust (www.finmark.org.za,
[email protected]); and World Bank Zambia Country Office (www.worldbank.org/Zambia,
Pyramid Plaza, Plot No 746 Church Road, Lusaka. Tel: 260-1 252 811).
Acknowledgements
This report was prepared Roland V. Pearson, Jr. of Siana Strategic Advisors. The Business Facilitation
Measure (BFM) model was compiled by Bob Currin and Michael O’Donovan of AfricaScope. The
review team comprised George R. Clarke, Texas A&M International University, Manju Kedia Shah,
research economist and consultant at the World Bank in Washington DC, Marie Sheppard, World
Bank Group, Zambia, Juliet Munro, FinMark Trust, and members of staff of the Private Sector
Development Reform Programme and the Zambia Business Forum.
3
Contents
1. EXECUTIVE SUMMARY .................................................................................................................... 4
2. INTRODUCTION, METHODOLOGY AND APPLICATION ................................................................. 10 2.1. What is the BFM? ..................................................................................................................... 10
2.2. What the BFM can tell us ......................................................................................................... 12
3. BUSINESS PROFILES BASED ON THE BFM ..................................................................................... 20
3.1. Key elements of the MSME BFM profiles ................................................................................ 20
3.2. Perceived obstacles to doing business among MSMEs ........................................................... 24
3.3. Key elements of the large business BFM profiles .................................................................... 26
3.4. Perceived obstacles to doing business among large enterprises ............................................ 26
3.5. Significant differentiators by large business BFM ................................................................... 30
4. KEY DYNAMICS WITHIN THE MSME BFMs ................................................................................... 33
4.1. Gap between BFM 4 and BFM 5 .............................................................................................. 33
4.2. The continuum from BFM 1 to BFM 4 ..................................................................................... 35
4.2. Other differentiating factors along the BFM continuum ......................................................... 39
4.4. Specific zones of transition ...................................................................................................... 41
5. CONCLUSIONS .............................................................................................................................. 42
6. ANNEX 1: Variables used in developing the MSME BFM ............................................................. 45
7. ANNEX 2 – Detailed descriptions of BFMs 1 to 8 ......................................................................... 50
8. ANNEX 3 – Detailed Descriptions of BFMs 9 to 12 ....................................................................... 52
Abbreviations
BFM Business Facilities Measure
BSM Business Sophistication Measure
ICT Information communication technology
LBS Large Business Survey
MSMEs Micro, small and medium enterprises
NAPSA National Pension Scheme Authority
NRC National registration card
PACRO Patents and Company Registrar
PCA Principal component analysis
PAM Partitioning about medoids
PAYE Pay As You Earn
PLC Publicly listed company
TPIN Tax identification number
VAT Value added tax
ZBS Zambia Business Survey
4
1. Executive summary
Policymakers, service providers, donors and other market actors often need to segment businesses
into groups that show differences among businesses, within a defined continuum. Dividing the
business landscape into component parts can facilitate the targeting of policy, assistance, products
and services to different market segments, making these more efficient and effective. To be useful,
the segments must be well defined, and while related to each other within defined parameters,
sufficiently differentiated to discern one segment from the next. The segments must not be so small
that they are too numerous to address, but also not so large that they are barely discernible from
the overall market.
Traditionally policymakers and service providers have tried different ways to segment businesses in
Zambia and around the world. Many use the number of full-time employees as a way to define and
segment the market. Others may cluster businesses according to whether they are registered or
not. Annual income, asset sizes, business sectors, and demographic attributes, such as age of the
business owners, also offer potential axes on which to segment the market.
The literature on Zambia shows application of all of these approaches to market segmentation, as
well as others. A predominant method in Zambia is the classification of businesses by the number of
employees. Also, much debate about enterprises in Zambia focuses on whether or not businesses
are formally registered.
Yet, it would seem that both of these measures may not meet the basic tests of useful segmentation
to support efficient and effective targeting of policy, support, and product and service provision. As
the data from the Zambia Business Survey (ZBS) shows, no other typical ways of describing
businesses in Zambia offer either sufficient differentiation or relevance. For example, 65% to 70% of
all enterprises are micro or single-person enterprises; 95% of all enterprises in Zambia may be
classified as informal as they are unregistered; more than 70% of Zambian enterprises are based in
rural areas, and/or trade in the agricultural sector. Thus traditional ways of segmenting the market,
i.e. by size, formality, sector or location, all yield blocks of undifferentiated enterprises, which, in
turn, would complicate policymaking, programme development and service delivery.
Attempts to divide the market by bands of turnover or assets may provide more differentiation, but
as the ZBS and other surveys have shown, these numbers, as reported by Micro, Small and Medium
Enterprises (MSMEs) (especially with such a large proportion being unregistered and not keeping
reliable financial records), are often questionable and incomplete, thereby undermining the integrity
of any segmentation based on such figures.
To assist in providing greater insight into the MSME market, FinMark Trust has developed the
Business Facilities Measure (BFM), which provides a uniquely differentiated and directly relevant
model by which to segment the entire landscape of enterprises in Zambia. Spanning every type, size
and location of enterprise in Zambia, the BFM includes 12 segments – 1 through 8 for MSMEs, and 9
through 12 for large enterprises – that define the gradation of enterprises in Zambia. Each segment
is comprised of a composite picture of the unique set of characteristics that define each cluster of
enterprises. Table 1 captures these pictures along the continuum for MSMEs.
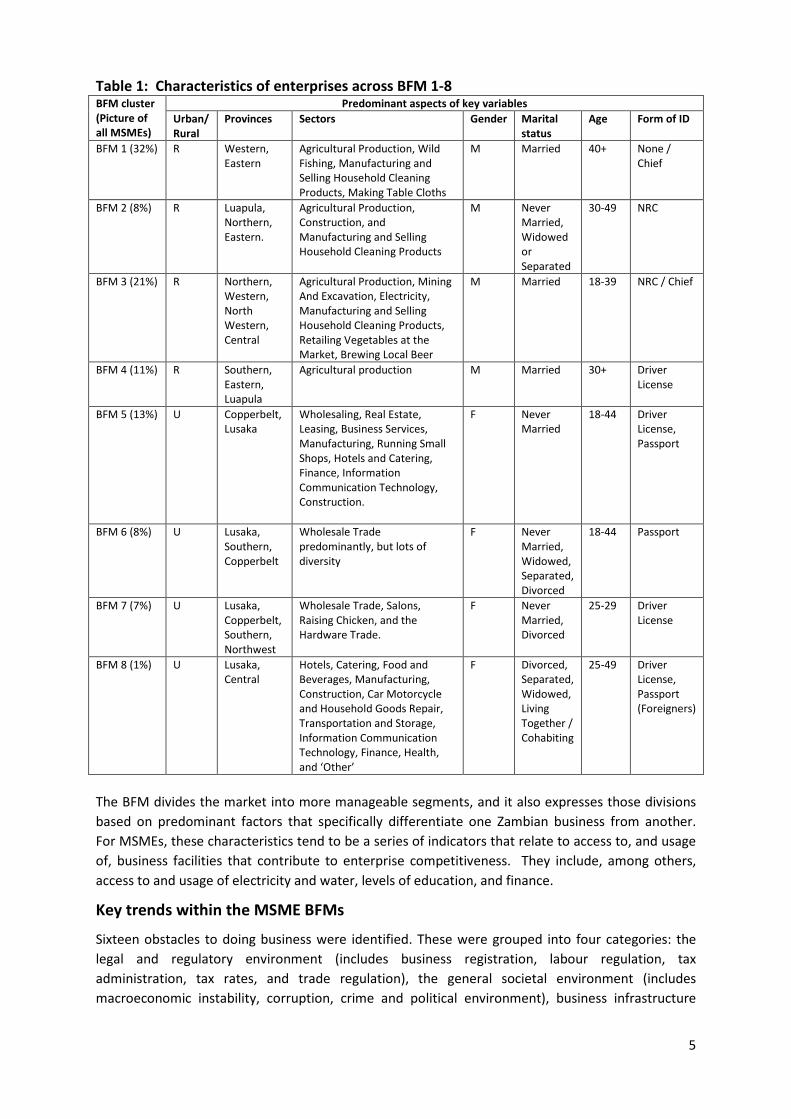
5
Table 1: Characteristics of enterprises across BFM 1-8 BFM cluster
(Picture of
all MSMEs)
Predominant aspects of key variables
Urban/
Rural
Provinces Sectors Gender Marital
status
Age Form of ID
BFM 1 (32%) R Western,
Eastern
Agricultural Production, Wild
Fishing, Manufacturing and
Selling Household Cleaning
Products, Making Table Cloths
M Married 40+ None /
Chief
BFM 2 (8%) R Luapula,
Northern,
Eastern.
Agricultural Production,
Construction, and
Manufacturing and Selling
Household Cleaning Products
M Never
Married,
Widowed
or
Separated
30-49 NRC
BFM 3 (21%) R Northern,
Western,
North
Western,
Central
Agricultural Production, Mining
And Excavation, Electricity,
Manufacturing and Selling
Household Cleaning Products,
Retailing Vegetables at the
Market, Brewing Local Beer
M Married 18-39 NRC / Chief
BFM 4 (11%) R Southern,
Eastern,
Luapula
Agricultural production M Married 30+ Driver
License
BFM 5 (13%) U Copperbelt,
Lusaka
Wholesaling, Real Estate,
Leasing, Business Services,
Manufacturing, Running Small
Shops, Hotels and Catering,
Finance, Information
Communication Technology,
Construction.
F Never
Married
18-44 Driver
License,
Passport
BFM 6 (8%) U Lusaka,
Southern,
Copperbelt
Wholesale Trade
predominantly, but lots of
diversity
F Never
Married,
Widowed,
Separated,
Divorced
18-44 Passport
BFM 7 (7%) U Lusaka,
Copperbelt,
Southern,
Northwest
Wholesale Trade, Salons,
Raising Chicken, and the
Hardware Trade.
F Never
Married,
Divorced
25-29 Driver
License
BFM 8 (1%) U Lusaka,
Central
Hotels, Catering, Food and
Beverages, Manufacturing,
Construction, Car Motorcycle
and Household Goods Repair,
Transportation and Storage,
Information Communication
Technology, Finance, Health,
and ‘Other’
F Divorced,
Separated,
Widowed,
Living
Together /
Cohabiting
25-49 Driver
License,
Passport
(Foreigners)
The BFM divides the market into more manageable segments, and it also expresses those divisions
based on predominant factors that specifically differentiate one Zambian business from another.
For MSMEs, these characteristics tend to be a series of indicators that relate to access to, and usage
of, business facilities that contribute to enterprise competitiveness. They include, among others,
access to and usage of electricity and water, levels of education, and finance.
Key trends within the MSME BFMs
Sixteen obstacles to doing business were identified. These were grouped into four categories: the
legal and regulatory environment (includes business registration, labour regulation, tax
administration, tax rates, and trade regulation), the general societal environment (includes
macroeconomic instability, corruption, crime and political environment), business infrastructure
6
(includes electricity, transportation, telecommunications, access to land and worker skills), and
finance (includes cost of finance and access to finance.
Grouping these 16 obstacles across the eight MSME BFMs shows that the only substantial changes in
perception are within the legal and regulatory cluster, which makes intuitive sense, since the BFM is
a measure of robustness, or is, in other words akin to formality. In turn, the data shows that legal
and regulatory issues are of demonstrably greater concern to the higher BFMs.
The lower end BFM groups from 1 to 4 tend to be a lot more rural than the top-end BFM groups
from 5 to 8. The major break between BFM 4 and 5 is mainly because of the drastic reduction in the
number of agricultural businesses.
When viewed through the BFM lens, there is clear evidence of greater percentage of female
participation in the higher MSME BFM groups. In all four of the upper BFMs, women comprise no
less than 41% of the sample, while comprising only 33% of the overall MSME population. Women
are also a disproportionately higher percentage of wholesale/retail businesses, which tend to yield
higher levels of productivity than the male-predominated agricultural businesses.
BFMs 5 to 8 share common problems with variables such as tax rates, licensing and permits, labour
regulations and electricity problems being perceived as the most serious. Conversely, BFMs 1 and 2
share common problems of crime, theft and disorder and transportation problems.
Zones of transition within the MSME BFM continuum
We gauged the potential for growth and assessed opportunities for innovation in product and
service delivery by determining where the largest potential for growth lies within two of the MSME
BFM continuums. There is a clear schism between BFM 4 and 5. Direct comparison clearly shows
that BFM 4 and below are rural, while BFM 5 and above are urban. BFM 4 and below tend to be
more male and older, whereas BFM 5 and above trend toward being younger and female. BFM 4 and
below also are less educated than BFM 5 and above. Thus, we looked at BFM 1 to 4 and BFM 5 to 8
separately.
Plotting the many different variables along the business continuums made it possible to determine
at what point businesses are starting to show signs of growth and operating effectively. The ability
to pinpoint these businesses can assist organisations providing support and financial access to
MSMEs and large firms. Furthermore the segmentation of businesses enables identification of long
and short term intervention strategies. A useful tool in determining the impact points is the analysis
of the “zones of transition”.
The first zone of transition in Zambia appears to be between BFM 2 and 3, where attaining
secondary education appears to important in moving MSMEs from the lowest two segments, at least
to the third or fourth segments. Moving from a BFM 3 to segment 4 appears to be related to the
type of agriculture, whereas the higher BFMs tend towards livestock rearing as opposed to growing
crops.
Another zone of transition appears among BFM 6, 7 and 8, where two phenomena stand out. Firstly,
attaining vocational education seems to align closely with upward BFM mobility. Secondly, marked
entrepreneurial attitude emerges in BFM 8, suggesting ample opportunity for more aggressive
support to enterprises that will look to thrive and compete, not just survive.
Generally, the businesses in BFM 5 and above are where stakeholders should most quickly see the
results of their interventions at relatively reasonable costs, including many prospects for public and
private sector led approaches. Businesses in BFM 5 and 6 show the greatest potential of becoming
sustainable contributors to the economy and job creators. Longer-term strategies and significant
7
resources are needed to support the lower BFM entities, and in many instances this means systemic
investments in basic infrastructure and education.
Large enterprise BFMs
Although the survey methodologies between the MSME Survey and the Large Business Survey (LBS)
were different, an attempt was made to integrate the two surveys to link them to allow analysis
across them both. As expected, large businesses formed the basis for an exclusive stand-alone
cluster. To extend the continuum and create the necessary differentiation among large enterprises,
a separate analysis of the differentiating variables within the LBS data alone was conducted.
For large enterprises, access to and usage of business facilities still provides a robust basis on which
to segment the market; but measuring this involves the use of more sophisticated products. Access
to and usage of basic inputs, such as electricity or water, offers sufficient differentiation among
MSMEs; however, access to and usage of things like the internet, email, outsourced business
services (e.g. accounting or legal services), as well as higher order financial products such as
insurance or foreign currency accounts, were used to yield a more insightful analysis of large
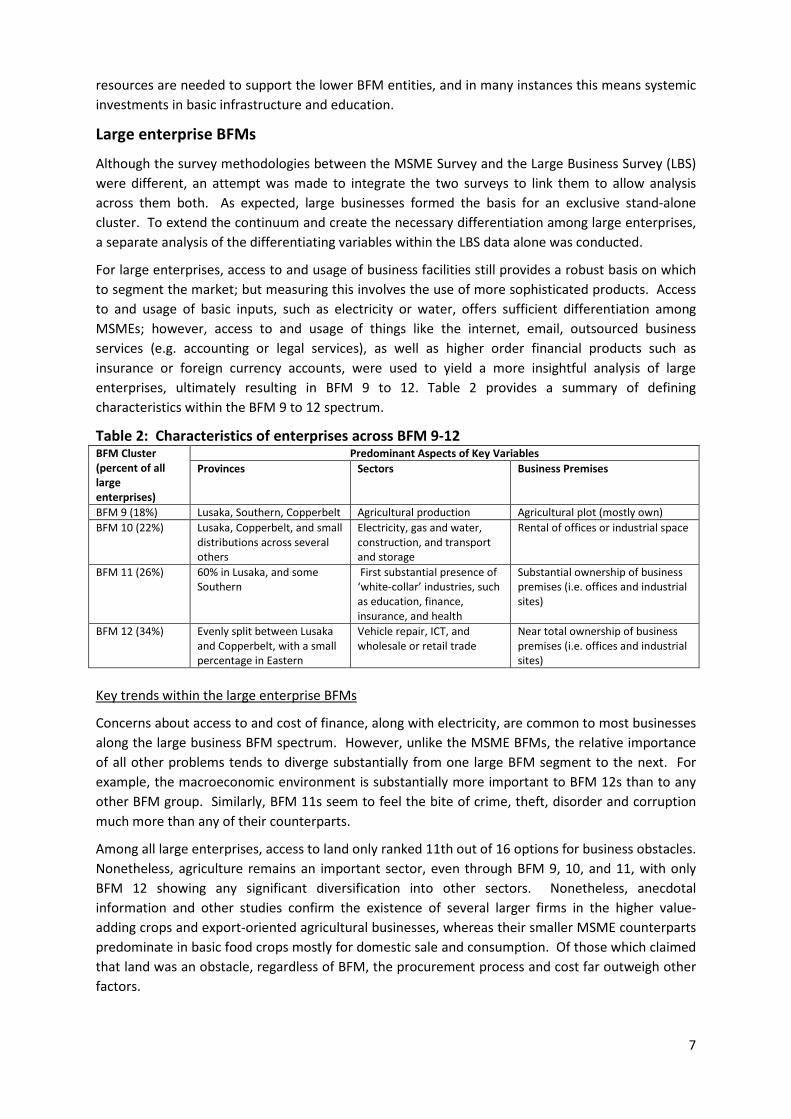
enterprises, ultimately resulting in BFM 9 to 12. Table 2 provides a summary of defining
characteristics within the BFM 9 to 12 spectrum.
Table 2: Characteristics of enterprises across BFM 9-12 BFM Cluster
(percent of all
large
enterprises)
Predominant Aspects of Key Variables
Provinces Sectors Business Premises
BFM 9 (18%) Lusaka, Southern, Copperbelt Agricultural production Agricultural plot (mostly own)
BFM 10 (22%) Lusaka, Copperbelt, and small
distributions across several
others
Electricity, gas and water,
construction, and transport
and storage
Rental of offices or industrial space
BFM 11 (26%) 60% in Lusaka, and some
Southern
First substantial presence of
‘white-collar’ industries, such
as education, finance,
insurance, and health
Substantial ownership of business
premises (i.e. offices and industrial
sites)
BFM 12 (34%) Evenly split between Lusaka
and Copperbelt, with a small
percentage in Eastern
Vehicle repair, ICT, and
wholesale or retail trade
Near total ownership of business
premises (i.e. offices and industrial
sites)
Key trends within the large enterprise BFMs
Concerns about access to and cost of finance, along with electricity, are common to most businesses
along the large business BFM spectrum. However, unlike the MSME BFMs, the relative importance
of all other problems tends to diverge substantially from one large BFM segment to the next. For
example, the macroeconomic environment is substantially more important to BFM 12s than to any
other BFM group. Similarly, BFM 11s seem to feel the bite of crime, theft, disorder and corruption
much more than any of their counterparts.
Among all large enterprises, access to land only ranked 11th out of 16 options for business obstacles.
Nonetheless, agriculture remains an important sector, even through BFM 9, 10, and 11, with only
BFM 12 showing any significant diversification into other sectors. Nonetheless, anecdotal
information and other studies confirm the existence of several larger firms in the higher value-
adding crops and export-oriented agricultural businesses, whereas their smaller MSME counterparts
predominate in basic food crops mostly for domestic sale and consumption. Of those which claimed
that land was an obstacle, regardless of BFM, the procurement process and cost far outweigh other
factors.
8
All large businesses have access to and use electricity. The main source of energy is from the
national grid for most large businesses, although BFM 9 shows meaningful use of generators instead
of grid electricity – indicating that even into the large enterprise segment, consistent access to
electricity remains as a business challenge.
Looking at access to finance as an obstacle to doing business, we see the most concern among BFMs
9 and 12. We suspect these trends reflect two different sets of impetuses. For BFM 9s, their
perceived high cost of finance may reflect their relatively weak bargaining positions with the banks.
For BFM 12s, the seriousness of this obstacle may reflect less on the actual price of finance, but on
its cost, relative to overall firm profitability. Also, as the access to finance paper illustrates, even
large businesses transact heavily in cash (deposits and withdrawals), which are typically among the
most expensive banking transactions.
In terms of loan products, a loan from a bank is greatest in the BFM 12 group, with microfinance and
other loan finance used by businesses in BFM 9. Although, as noted in the access to finance paper,
nearly 50% of respondents in each large enterprise BFM category indicated that they do not have a
loan from any institution.
With the highest levels of formal registration, including for tax purposes, BFM 12s demonstrate the
greatest sensitivity to tax rates. On the other hand, BFM 9s have lower levels of formal registration,
perhaps because they perceive tax rates as high.
There is wide membership of business associations across all large business BFM groups with the
exception of BFM 9, which reflects a profile much more akin to that seen among MSMEs, i.e. lower
business association membership.
There are no distinct patterns in the type of customers across the upper BFM groups, with all groups
having customers in much the same areas. All of the large business BFMs report that about 40% of
their customers come from among MSMEs, including individuals.
There is not a strong trend towards any type of suppliers across the upper BFM groups. It is
interesting to see nearly a third of all suppliers across all four large enterprise BFMs coming from
among individuals.
There may be some relationship between the slightly greater tendency toward international supplier
relationships among the large business BFMs and their relatively higher sensitivity to the
macroeconomic environment. They also tend to have higher awareness of cost and price shifts in
the market than their smaller counterparts.
Credit control appears to be marginally better in BFM 9, with a lesser percentage of firms reporting
bad debt, as compared to their large enterprise peers. Nonetheless, all upper BFM groups show
high levels of bad debt.
In terms of savings and investment, BFM 12 businesses tends to invest the most in new technology,
although this is in evidence across all groups. Most groups also claim to invest most heavily in the
expansion of their businesses.
Conclusions
The BFM offers public, private and donor stakeholders a targeted and nuanced approach to
delivering policy, support and services to the full range of MSMEs and large enterprises in Zambia.
In particular, the methodology should allow easier and more vigorous identification of those MSMEs
that show the greatest promise of growth and competitiveness in the short to medium term.
Similarly, the BFM has revealed priority interventions for large enterprises that should yield the
greatest benefits to them in the most efficient manner.
9
This segmentation approach should prove much more useful than traditional ways of looking at the
business landscape, especially among MSMEs. In short, the BFM provides a view of the market that
clearly shows that not all informal enterprises are the same, and that not all microenterprises are
survivalists. This segmentation tool offers composite sketches of groups of MSMEs and large
businesses that share a substantial set of common attributes, which in turn, can help to differentiate
and pinpoint varying approaches to supporting and interacting with them.
Our zone of transition analysis tells us that BFM 5 enterprises, estimated at about 13% of businesses
nationwide, represent the ‘sweet spot’ of high potential, but experience low service penetration.
Although markedly more urban than their lower BFM counterparts, 60% of BFM 5 businesses are still
found in rural areas, meaning that this segmentation methodology need not leave rural enterprises
out, but instead encourages a national spread, albeit with the rural component focussing on the
fringe towns of Lusaka and Copperbelt provinces and their neighbouring areas. Several
characteristics of this segment indicate that many would fall in the more easily achieved financial
service access ‘market enablement zone’1, and therefore could be reached more easily and quickly
than lower segments.
Interventions in the lower four BFM segments, making up 77% of the MSME market, require
systemic, cross-sectoral, and cross-ministerial cooperation and solutions. This will command greater
depth and breadth of resource commitments that are likely to cost more and take longer to show
any results. For example, the lower MSME BFM enterprises generally do not have access to and do
not use electricity. Such strong evidence creates a compelling case to look at business infrastructure
generally, and electricity specifically, as a potentially major boost to overall MSME competitiveness.
The 12% of MSMEs in the much smaller BFM 6, 7 and 8 segments are relatively more urbanised,
better educated, and into value-adding businesses, thus making them excellent candidates for quick
and relatively light and less expensive interventions that could leverage substantial outcomes, both
for the enterprises themselves and for those providing new services to them.
The BFM tool also sets out highly differentiated issues that help to set a clear agenda for action
among large enterprises. Coupled with the descriptions of each of these four upper BFMs, key
stakeholders and support agencies may target specific audiences within the large business segment
as a whole. Many of the most important large business challenges, like taxes, customs and trade
regulations, and the macroeconomic environment, require government leadership and direct
involvement. Yet others, such as a better educated workforce, the cost of finance, and even crime,
theft and disorder, may open opportunities for private sector leadership, in a cooperative alliance
with government.
1 The market enablement zone includes those businesses that are within reach of the market, given the
parameters of an existing product, but do not currently have the product. This zone can be further sub-
segmented into those enterprises that actively choose not to have a product, and therefore lie beyond the
natural limits of the market, and those that have not yet purchased the product but are candidates for doing
so.
10
2. Introduction, methodology and application
Policymakers, service providers, donors and other market actors often need to segment businesses
into groups that show differences among businesses, within a defined continuum. Dividing the
business landscape into component parts facilitates the efficient and effective targeting of policy,
assistance, products and services. To be useful, the segments must be well defined, and while
related to each other within defined parameters, sufficiently differentiated to discern one segment
from the next. The segments must also not be so small that they are too numerous to address, but
also not so large that they are barely discernible from the overall market.
Traditionally policymakers and service providers have tried different ways to segment businesses in
Zambia and around the world. Many use the number of full-time employees as a way to define and
segment the market. Others may cluster businesses according to whether they are registered or
not. Annual income, asset sizes, business sectors, and demographic attributes, such as age of the
business owners also offer potential axes on which to segment the market.
The literature on Zambia shows application of all of these approaches to market segmentation, as
well as others. A predominant segmentation approach in Zambia seems to be classification of
businesses by the number of employees. Also, much debate about enterprises in Zambia focuses on
whether or not businesses are formally registered.
Yet, it would seem that both of these measures may not meet the basic tests of useful segmentation
to support efficient and effective targeting of policy, support, and product or service provision. The
majority of MSMEs employ fewer than five people. The Zambia Business Survey (ZBS) shows that as
many as 91% of MSMEs in Zambia have between one and five full-time employees. The ZBS also
shows that almost 95% of MSMEs in Zambia are not registered. Both of these measures would
create segmentations that comprised a huge, and mostly undifferentiated, chunk of either very tiny
MSMEs or unregistered MSMEs. Attempts to divide the market by bands of turnover or assets may
provide more differentiation, but as the ZBS and other surveys have shown, these numbers, as
reported by MSMEs (especially with such a large proportion being unregistered and not keeping
reliable financial records), are often questionable and incomplete, thereby undermining the integrity
of any segmentation based on such figures.
2.1 What is the BFM?
These traditional methods of measuring the market often do not provide much insight into the
MSME market (or the large business sector) because of the large numbers of businesses that fall into
one or the other of the traditional categories. In turn, policy, support and commercial ventures may
not work at all or only work sub-optimally, because they rely on insufficiently differentiated market
segmentation. For example, a government or donor programme designed to target
‘microenterprises’, based on a definition deriving from the number of employees, may find it
untenable to efficiently and effectively deliver services to 90% of all MSMEs. Similarly, a programme
in Zambia meant to target ‘rural enterprises’ would find itself in the unwieldy position of trying to
reach 70% or more of the MSME market. Government dialogue with ‘large business’ about tax or
import/export regulations may prove more fruitful if entered into with the segment of the large
business population which consider this issue a relatively greater priority.
To assist in providing greater insight into the MSME and large business markets, FinMark Trust has
developed a model, called the Business Facilities Measure (BFM), which attempts to segment the
market into a greater number of clusters by using more than one or two variables from the dataset
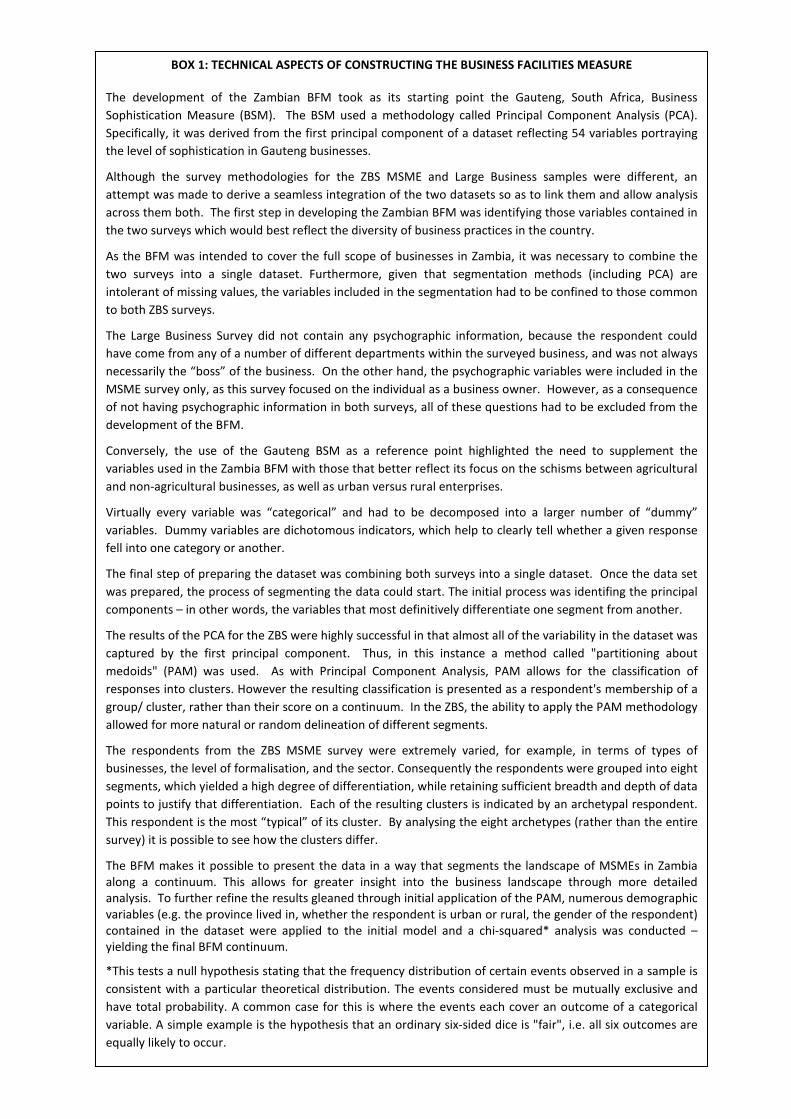
(see box Techncial aspects of constructing the Business Facilities Measure on page 11).
11
BOX 1: TECHNICAL ASPECTS OF CONSTRUCTING THE BUSINESS FACILITIES MEASURE
The development of the Zambian BFM took as its starting point the Gauteng, South Africa, Business
Sophistication Measure (BSM). The BSM used a methodology called Principal Component Analysis (PCA).
Specifically, it was derived from the first principal component of a dataset reflecting 54 variables portraying
the level of sophistication in Gauteng businesses.
Although the survey methodologies for the ZBS MSME and Large Business samples were different, an
attempt was made to derive a seamless integration of the two datasets so as to link them and allow analysis
across them both. The first step in developing the Zambian BFM was identifying those variables contained in
the two surveys which would best reflect the diversity of business practices in the country.
As the BFM was intended to cover the full scope of businesses in Zambia, it was necessary to combine the
two surveys into a single dataset. Furthermore, given that segmentation methods (including PCA) are
intolerant of missing values, the variables included in the segmentation had to be confined to those common
to both ZBS surveys.
The Large Business Survey did not contain any psychographic information, because the respondent could
have come from any of a number of different departments within the surveyed business, and was not always
necessarily the “boss” of the business. On the other hand, the psychographic variables were included in the
MSME survey only, as this survey focused on the individual as a business owner. However, as a consequence
of not having psychographic information in both surveys, all of these questions had to be excluded from the
development of the BFM.
Conversely, the use of the Gauteng BSM as a reference point highlighted the need to supplement the
variables used in the Zambia BFM with those that better reflect its focus on the schisms between agricultural
and non-agricultural businesses, as well as urban versus rural enterprises.
Virtually every variable was “categorical” and had to be decomposed into a larger number of “dummy”
variables. Dummy variables are dichotomous indicators, which help to clearly tell whether a given response
fell into one category or another.
The final step of preparing the dataset was combining both surveys into a single dataset. Once the data set
was prepared, the process of segmenting the data could start. The initial process was identifing the principal
components – in other words, the variables that most definitively differentiate one segment from another.
The results of the PCA for the ZBS were highly successful in that almost all of the variability in the dataset was
captured by the first principal component. Thus, in this instance a method called "partitioning about
medoids" (PAM) was used. As with Principal Component Analysis, PAM allows for the classification of
responses into clusters. However the resulting classification is presented as a respondent's membership of a
group/ cluster, rather than their score on a continuum. In the ZBS, the ability to apply the PAM methodology
allowed for more natural or random delineation of different segments.
The respondents from the ZBS MSME survey were extremely varied, for example, in terms of types of
businesses, the level of formalisation, and the sector. Consequently the respondents were grouped into eight
segments, which yielded a high degree of differentiation, while retaining sufficient breadth and depth of data
points to justify that differentiation. Each of the resulting clusters is indicated by an archetypal respondent.
This respondent is the most “typical” of its cluster. By analysing the eight archetypes (rather than the entire
survey) it is possible to see how the clusters differ.
The BFM makes it possible to present the data in a way that segments the landscape of MSMEs in Zambia
along a continuum. This allows for greater insight into the business landscape through more detailed
analysis. To further refine the results gleaned through initial application of the PAM, numerous demographic
variables (e.g. the province lived in, whether the respondent is urban or rural, the gender of the respondent)
contained in the dataset were applied to the initial model and a chi-squared* analysis was conducted –
yielding the final BFM continuum.
*This tests a null hypothesis stating that the frequency distribution of certain events observed in a sample is
consistent with a particular theoretical distribution. The events considered must be mutually exclusive and
have total probability. A common case for this is where the events each cover an outcome of a categorical
variable. A simple example is the hypothesis that an ordinary six-sided dice is "fair", i.e. all six outcomes are
equally likely to occur.
12
This segmentation model complements, supplements, and enriches the analyses found in the other
ZBS technical reports. For example, the access to finance report shows dramatic differences in
access, based on whether or not an enterprise is rural or urban. The productivity paper clearly
shows the increases in productivity related to higher levels of education. The landscape paper offers
many perspectives on the percentages of firms that are, for example, male or female headed, rural
or urban, in one province or another.
Yet, firms are multi-dimensional. The BFM segmentation model provides composite sketches of
MSMEs and large businesses. For example, instead of proceeding with policy or other interventions
to broadly promote more finance in rural areas, application of the BFM may allow policymakers and
others to discern and implement interventions that focus on a finer, more appropriate level of detail.
The BFM segments include further delineation of which rural areas, the kinds of enterprises in those
particular areas, the typical educational profile of the business owners in those areas, and other
factors that would nuance the approach. This enables the allocation of resources to more
manageable segments of the MSME population, rather than just “rural enterprises”.
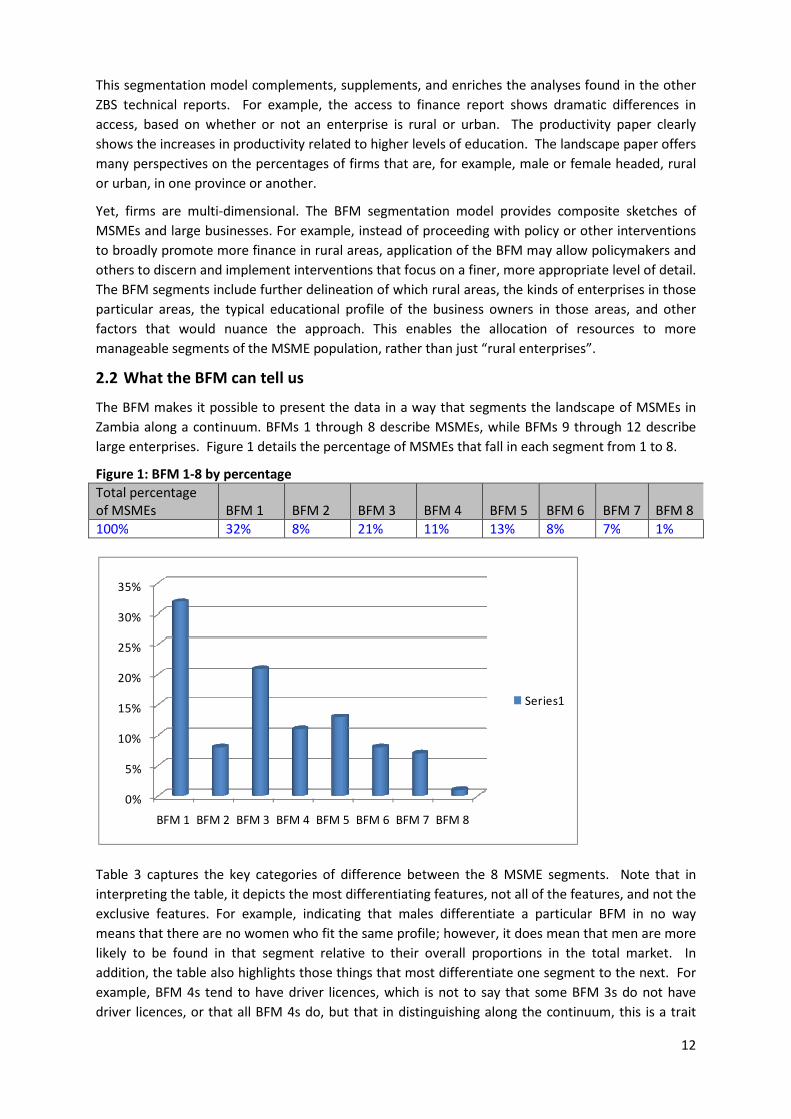
2.2 What the BFM can tell us
The BFM makes it possible to present the data in a way that segments the landscape of MSMEs in
Zambia along a continuum. BFMs 1 through 8 describe MSMEs, while BFMs 9 through 12 describe
large enterprises. Figure 1 details the percentage of MSMEs that fall in each segment from 1 to 8.
Figure 1: BFM 1-8 by percentage
Total percentage
of MSMEs BFM 1 BFM 2 BFM 3 BFM 4 BFM 5 BFM 6 BFM 7 BFM 8
100% 32% 8% 21% 11% 13% 8% 7% 1%
Table 3 captures the key categories of difference between the 8 MSME segments. Note that in
interpreting the table, it depicts the most differentiating features, not all of the features, and not the
exclusive features. For example, indicating that males differentiate a particular BFM in no way
means that there are no women who fit the same profile; however, it does mean that men are more
likely to be found in that segment relative to their overall proportions in the total market. In
addition, the table also highlights those things that most differentiate one segment to the next. For
example, BFM 4s tend to have driver licences, which is not to say that some BFM 3s do not have
driver licences, or that all BFM 4s do, but that in distinguishing along the continuum, this is a trait
0%
5%
10%
15%
20%
25%
30%
35%
BFM 1 BFM 2 BFM 3 BFM 4 BFM 5 BFM 6 BFM 7 BFM 8
Series1
13
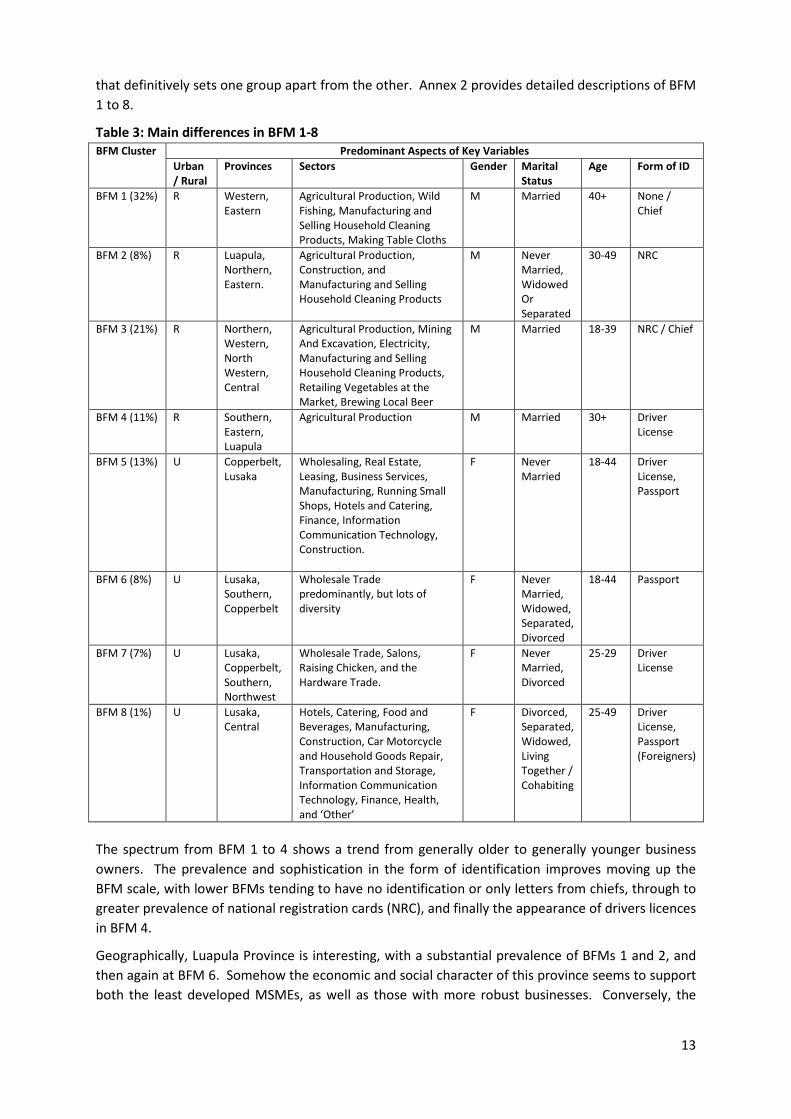
that definitively sets one group apart from the other. Annex 2 provides detailed descriptions of BFM
1 to 8.
Table 3: Main differences in BFM 1-8
BFM Cluster Predominant Aspects of Key Variables
Urban
/ Rural
Provinces Sectors Gender Marital
Status
Age Form of ID
BFM 1 (32%) R Western,
Eastern
Agricultural Production, Wild
Fishing, Manufacturing and
Selling Household Cleaning
Products, Making Table Cloths
M Married 40+ None /
Chief
BFM 2 (8%) R Luapula,
Northern,
Eastern.
Agricultural Production,
Construction, and
Manufacturing and Selling
Household Cleaning Products
M Never
Married,
Widowed
Or
Separated
30-49 NRC
BFM 3 (21%) R Northern,
Western,
North
Western,
Central
Agricultural Production, Mining
And Excavation, Electricity,
Manufacturing and Selling
Household Cleaning Products,
Retailing Vegetables at the
Market, Brewing Local Beer
M Married 18-39 NRC / Chief
BFM 4 (11%) R Southern,
Eastern,
Luapula
Agricultural Production M Married 30+ Driver
License
BFM 5 (13%) U Copperbelt,
Lusaka
Wholesaling, Real Estate,
Leasing, Business Services,
Manufacturing, Running Small
Shops, Hotels and Catering,
Finance, Information
Communication Technology,
Construction.
F Never
Married
18-44 Driver
License,
Passport
BFM 6 (8%) U Lusaka,
Southern,
Copperbelt
Wholesale Trade
predominantly, but lots of
diversity
F Never
Married,
Widowed,
Separated,
Divorced
18-44 Passport
BFM 7 (7%) U Lusaka,
Copperbelt,
Southern,
Northwest
Wholesale Trade, Salons,
Raising Chicken, and the
Hardware Trade.
F Never
Married,
Divorced
25-29 Driver
License
BFM 8 (1%) U Lusaka,
Central
Hotels, Catering, Food and
Beverages, Manufacturing,
Construction, Car Motorcycle
and Household Goods Repair,
Transportation and Storage,
Information Communication
Technology, Finance, Health,
and ‘Other’
F Divorced,
Separated,
Widowed,
Living
Together /
Cohabiting
25-49 Driver
License,
Passport
(Foreigners)
The spectrum from BFM 1 to 4 shows a trend from generally older to generally younger business
owners. The prevalence and sophistication in the form of identification improves moving up the
BFM scale, with lower BFMs tending to have no identification or only letters from chiefs, through to
greater prevalence of national registration cards (NRC), and finally the appearance of drivers licences
in BFM 4.
Geographically, Luapula Province is interesting, with a substantial prevalence of BFMs 1 and 2, and
then again at BFM 6. Somehow the economic and social character of this province seems to support
both the least developed MSMEs, as well as those with more robust businesses. Conversely, the
14
other provinces fall into a more predictable pattern, with predominantly rural provinces appearing
mostly among the lower BFMs and urban provinces among the upper BFMs.
Some interesting business sector trends also emerge from the data. Between BFMs 1 and 2, a
potentially skilled enterprise category, namely construction first appears. BFM 3s are the first
segment to see any meaningful participation in the mining sector (along with electricity and brewing
local beer). From BFM 5 to 6 there is a greater presence of wholesaling businesses, and generally a
greater diversity of enterprises.
In terms of social and demographic profiles, three areas are particularly interesting. Firstly, the data
shows that BFMs 1 to 4 tend to be married more often than BFMs 5 to 8. Also, BFM 1 and BFM 8
both show a greater incidence than others for foreigners. Finally, we see that women are
disproportionately represented in BFMs 5 to 8, wherein they comprise no less than 41% of any single
BFM segment, but only comprise 33% of the total MSME population. Conversely, men are
disproportionately over-represented in the lower BFM 1 to 4 segments.
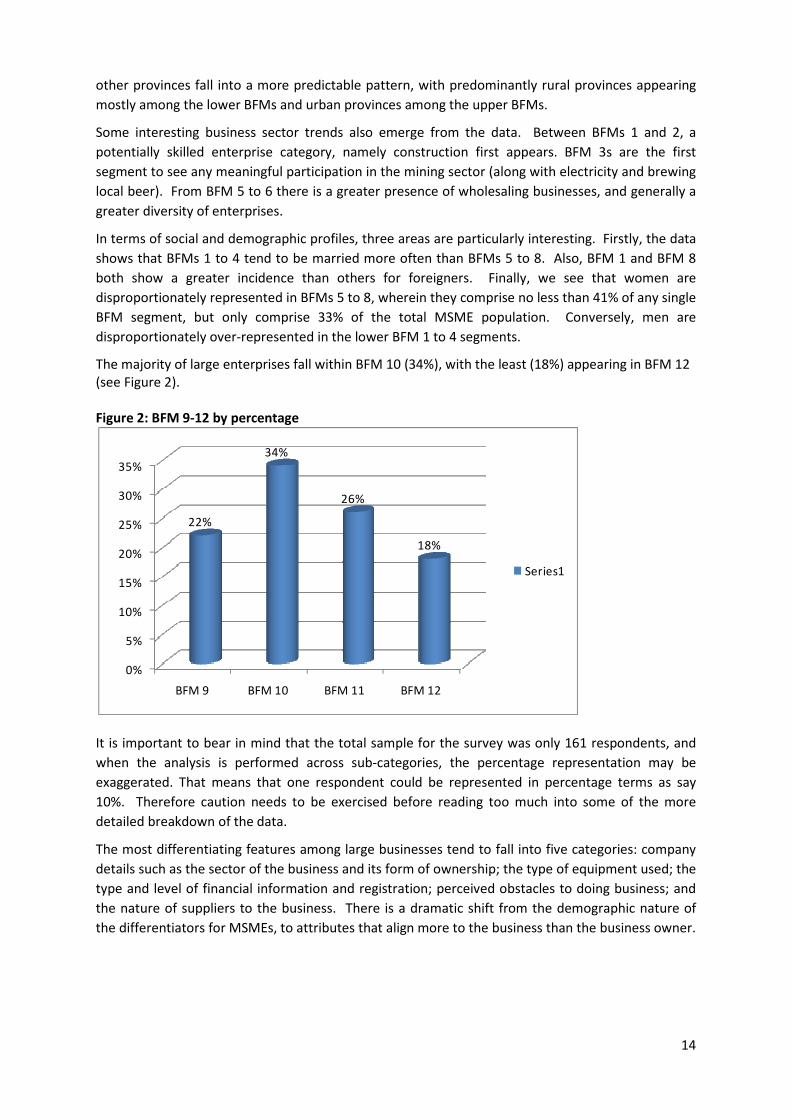
The majority of large enterprises fall within BFM 10 (34%), with the least (18%) appearing in BFM 12
(see Figure 2).
Figure 2: BFM 9-12 by percentage
It is important to bear in mind that the total sample for the survey was only 161 respondents, and
when the analysis is performed across sub-categories, the percentage representation may be
exaggerated. That means that one respondent could be represented in percentage terms as say
10%. Therefore caution needs to be exercised before reading too much into some of the more
detailed breakdown of the data.
The most differentiating features among large businesses tend to fall into five categories: company
details such as the sector of the business and its form of ownership; the type of equipment used; the
type and level of financial information and registration; perceived obstacles to doing business; and
the nature of suppliers to the business. There is a dramatic shift from the demographic nature of
the differentiators for MSMEs, to attributes that align more to the business than the business owner.
0%
5%
10%
15%
20%
25%
30%
35%
BFM 9 BFM 10 BFM 11 BFM 12
22%
34%
26%
18%
Series1
15
BFM 9 (22% of the large business sample)
Company details
The dominant business sector tends to be agriculture production, including aqua culture, although
many other business sectors are evident. Because of the skew towards agriculture, there is also a
skew to farm locations, although formal business premises are also important. BFM 9 businesses
tend to own the premises.
These firms tend to be in Central, Southern, Northern, Western and Luapula provinces.
Shareholders are private foreign individuals, companies or organisations and government/state.
The legal status of the business is varied, including partnerships, single owner/sole proprietorship,
co-operatives, and close corporations.
Equipment
The equipment that differentiates BFM 9 is ownership of items like farming equipment, such as a
tractor, cash register/till, a fax machine, a security alarm system, factory machinery, credit card
machine, treadle pump, motor vehicle for company use, photocopier, storage space for business,
and hammer mills.
Computer use tends to be for online selling of products/services and for business correspondence.
BFM 9 businesses tend to have access to a post box address and have a website for the business.
Financials and registration
One of the differentiating factors about this group is that their financial records are not always
audited every year, even though they have up-to-date financial accounts.
Businesses in the BFM 9 group are not always registered with the Patents and Company Registrar
(PACRO) or with any local government agency, and sometimes do not have a tax identification
number (TPIN) from the Zambia Revenue Authority.
The majority have not operated without being registered; however, the group does include
businesses that say they have operated without being registered. When these businesses do
register, the reasons given include the need to obtain access to finance more easily and for
moral/ethical considerations. They also claim that they grew too large to remain unregistered and
they registered to gain access to aid programs.
The tax payments they claim to make are other government taxes/levies, unofficial levies by
government, turnover tax and customs payments.
Reasons for not being registered include that they do not comply with all the registration
requirements, it costs too much money, or that the process is complicated.
In terms of visits from tax officials, BFM 9 businesses tend to refuse to answer on the number of
visits and whether unofficial payments are being asked for or paid. Among those that did respond to
this question, most of those firms say that they had not been fined as a result of the visits.
Performance and obstacles
BFM 9 monitors their business performance using cost of inputs/overheads and asset value,
profitability, turnover and cost of sales as measures.
Perceived major obstacles to doing business include tax administration, cost of finance, business
licensing and permits, inadequately educated workforce, crime, theft, disorder, access to finance,
and telecommunications challenges.
16
Perceived obstacles to accessing land for expansion include the small size of land ownership,
government ownership of land and that land is expensive to acquire.
Business suppliers
The main source of information about suppliers comes from friends/family, business associates, the
internet and the radio. Business suppliers tend to be individuals and other businesses mostly located
within specific areas inside Zambia. Some do import.
BFM 9 businesses regularly suffer losses because of delivery delays, with the average percentage loss
of sales reported between 10% and 20%. Reasons given for the delays are suppliers’ transportation
problems and payment of gifts or bribes.
Those that import report delays in receipt of their goods of between two and 30 days. There is no
actual delay in obtaining an import license, and they are not paying gifts on importation of goods,
but they do report the need to pay a gift to obtain an import license.
BFM 10 (34% of the large business sample)
Company details
BFM 10 businesses tend to be located in the North Western, Eastern, Western and Copperbelt
provinces. They operate to a lesser degree from farms than BFM 9, and from home. The
differentiating factor in BFM 10 is that the business property is rented.
The legal status of these businesses tends to be co-operatives, close corporations and privately held
limited companies. Shareholders tend to be private foreign individuals and companies or
organisations.
The business sectors are varied. Unlike BFM 9, sectors such as electricity, gas and water, the
construction sector, transportation and storage dominate over agricultural production.
Manufacturing, including the processing of agricultural and fishing products, is also evident. Other
sectors include hotels, catering, food and beverages, insurance and packaging materials.
Equipment
Businesses in BFM 10 have a wide range of facilities. Motor vehicle for company use is a big
discriminator, followed by items such as credit card machine, safe place for keeping cash/vault,
security alarm system, storage space for the business, fax machine, photocopier and a tractor.
They tend to have computers for the business and use these for keeping business records, providing
computer services to customers and for accessing the internet. They also have a website for the
business.
Financials and registration
BFM 10 businesses claim that they have been visited/inspected or met with a tax official during the
past 12 months, and that they would expect up to four visits. They refuse to say if gifts or informal
payments were expected or requested.
The majority of businesses in BFM 10 are registered with PACRO, although some have operated
without being registered. The reasons for not being registered tend to be that they do not comply
with all the requirements, it costs too much money, or it is too complicated.
The reasons given for being registered are that they grew too large to remain unregistered, to obtain
access to financing more easily, because it is a legal requirement, and because their customers only
deal with registered entities. These businesses tend to hold an operating license with local
government agencies, as well as having a TPIN from the Zambia Revenue Authority.
17
Tax payments tend to be income tax, customs duties, land and building tax, state pensions (e.g.
NAPSA) and PAYE (Pay As You Earn).
Financial records are audited every year, but the financials are not always up to date.
Performance and obstacles
Business performance is monitored or measured and the methods of measurement tend to be the
number of customers, turnover and cost of inputs/overheads.
The main obstacles that are significantly different in BFM 10 tend to be an inadequately educated
workforce, customs and trade regulations, business licensing and permits, electricity,
telecommunications, transportation, the political environment and corruption.
Obstacles to accessing land for expansion tend to focus on the availability of infrastructure and
disputed ownership, or they do not experience obstacles.
Business suppliers
Business suppliers tend to be other businesses in different countries. Gifts have been requested for
imports. Delivery delays are experienced and the percentage loss in sales as a result of the delays is
estimated at between 20% and 50% of sales. These delays are less than 10 days. Delays are reported
in obtaining import licenses.
The main source of information about suppliers comes from newspapers and other publications, the
internet, billboards and television.
The main cause of delivery delays tends to be suppliers’ transportation problems, insufficient
suppliers, the financial constraints of suppliers, payment of gifts and bribes or border/customs
delays. Gifts have been expected for import licenses.
BFM 11 (26% of the large business sample)
Company details
BFM 11 differs from BFM 10 in the locale and tenure type for the operation of the business.
BFM 11s have a higher tendency to operate from formal business premises, which they own. The
business sectors that are significantly different are education, finance, car, motorcycle and
household goods repair, wholesale and retail trade, real estate, leasing and business services, health
services, insurance and security services.
Shareholders are private domestic individuals, companies or organisations and government. Current
legal status of business is a publicly listed company (PLC), close corporation or single owner/ sole
proprietorships.
Equipment
BFM 11s use a wide range of equipment. Items that differentiate are a hammer mill, storage space
for the business, treddle pump, security alarm system, factory machinery, photocopier, motor
vehicle for company use, tractor, cash register/till, fax machine, and a safe place for keeping
cash/vault.
A significant differentiator is that there are businesses that do not own or have access to a computer
in BFM 112. Those that have computers use them for business correspondence and keeping business
2 Some caution needs to be exercised in extrapolating the findings of the LBS to the entire population of large
enterprises, as data points such as this one may be represented by only a tiny number of enterprises, but in
percentage terms, seem significant.
18
records. They have access to the internet at the business location and have access to e-mail, along
with a post box address.
Financials and registration
The significant differentiator in this group is the claim that their financial records are audited every
year. However, some businesses do say that their financials are not up to date.
BFM 11 businesses claim to be visited on multiple occasions by tax officials in the past twelve
months and admit that they have been fined as a result of the meetings. They also admit that gifts or
informal payments were expected or requested.
Another differentiator is that some of the businesses are not registered with PACRO. For those that
are registered in some way, they do so because they have customers who deal only with registered
entities, for moral/ethical considerations, or because they learned of the procedures required to
register. Those that are not registered claim that the business does not comply with all the
requirements and it costs too much money.
The majority of businesses in BFM 11 do have a TPIN from the Zambia Revenue Authority, but some
do not. The tax payments that differentiate this group are unofficial levies by government, other
government taxes/levies, turnover tax, PAYE and the state pension (e.g. NAPSA).
Businesses claim to be operating with licences from local government agencies.
Performance and obstacles
A significant differentiator in BFM 11 is businesses that claim not to be monitoring performance.
Where business performance is monitored, they consider the number of employees, the number of
customers, cost of sales and asset value.
The major obstacles to doing business are perceived to be crime, theft, disorder, corruption and cost
of finance, access to finance, tax rates, transportation, labour regulations, the political environment
and access to land for expansion/relocation.
In terms of access to land for expansion, the obstacles they see are not enough land, the small size
of land ownership, the cost of land and government ownership of land.
Business suppliers
The location of most business suppliers tends to be from throughout Zambia; but a number of
businesses also indicate frequent use of suppliers from specific areas, such as Lusaka. Business
suppliers tend to be individuals, co-operatives and government.
They hear about the suppliers through word of mouth, friends and family, the radio, other business
associates and television.
They do not generally experience delivery delays from suppliers, but when there are delays, these
are due to financial constraints of suppliers, transportation problems of suppliers and payment of
gifts or bribes. They claim that these losses could amount to as much as 30% of sales.
They do not report delays in obtaining import licenses, nor do they pay bribes for the licenses.
BFM 12 (18% of the large business sample)
Company details
These businesses are located mainly in the provinces of Lusaka, Copperbelt and Eastern. Some,
although in lesser proportions, appear in Western Province, as well. They operate from formal
business premises and own the premises they operate from.
19
Current legal status of the business is a close corporation or privately held limited company.
Shareholders are private domestic individuals or companies or organisations.
The business sectors that differentiate this segment are car, motorcycle and household goods
repairs, information and communication technology, wholesale and/or retail including agricultural,
hotels, catering, food and beverages, real estate, leasing and business services, mining and
excavation, insurance and packaging materials.
Equipment
BFM 12 has a wide range of equipment available with little significant differentiation over BFM 11.
A significant differentiator, however, is the ownership of computers and that they run a website for
the business. They use a computer for accessing the internet, for online selling of their products and
services, and for providing computer services to customers. A minority of businesses do not own but
have access to computers.
Financials and registration
Not surprisingly the significant differentiators in BFM 12 are that their financial records are up to
date, and that they are audited every year.
They have been frequently inspected or required to meet with tax officials in the past 12 months and
the majority claim that no gift or informal payment was expected or requested. They do, however,
refuse to admit if they had been fined as a result of the meetings.
The tax payments made include VAT (Value Added Tax), state pension (e.g. NAPSA), income tax,
turnover tax and customs duties.
The majority are registered with PACRO. The reasons given for registration were to obtain access to
financing more easily, for moral/ethical considerations, or because it is a legal requirement. Those
not registered in any way claim that the business does not comply with all the requirements, it costs
too much money, or that it is too complicated.
Performance and obstacles
Performance of the business is measured by the ruling prices of product/ services, turnover,
profitability, or the number of employees.
Obstacles in accessing land for expansion tend to be the procurement process and the cost of land.
Major obstacles include the macro-economic environment (inflation, exchange rate, and interest
rates), tax rates, access to land for expansion or relocation, tax administration, the political
environment and labour regulations.
Business suppliers
Most business suppliers to BFM 12 come from other countries. Sales lost as a result of delays from
suppliers is not frequent but could result in up to 19% of sales being lost. The main causes of delivery
delays are the payment of gifts or bribes, and there being insufficient suppliers.
The main source of information about suppliers is a bit vague, but is reported as billboards, word of
mouth, the radio, the internet or television.
Businesses report the payment gifts for import licences.
20
3. Business profiles based on the BFM
3.1 Key elements of the MSME BFM profiles
In order to visualise how the BFM groups relate to the key data, a series of cross-tabs were
performed to illustrate how the BFM could be used to better explain the data.
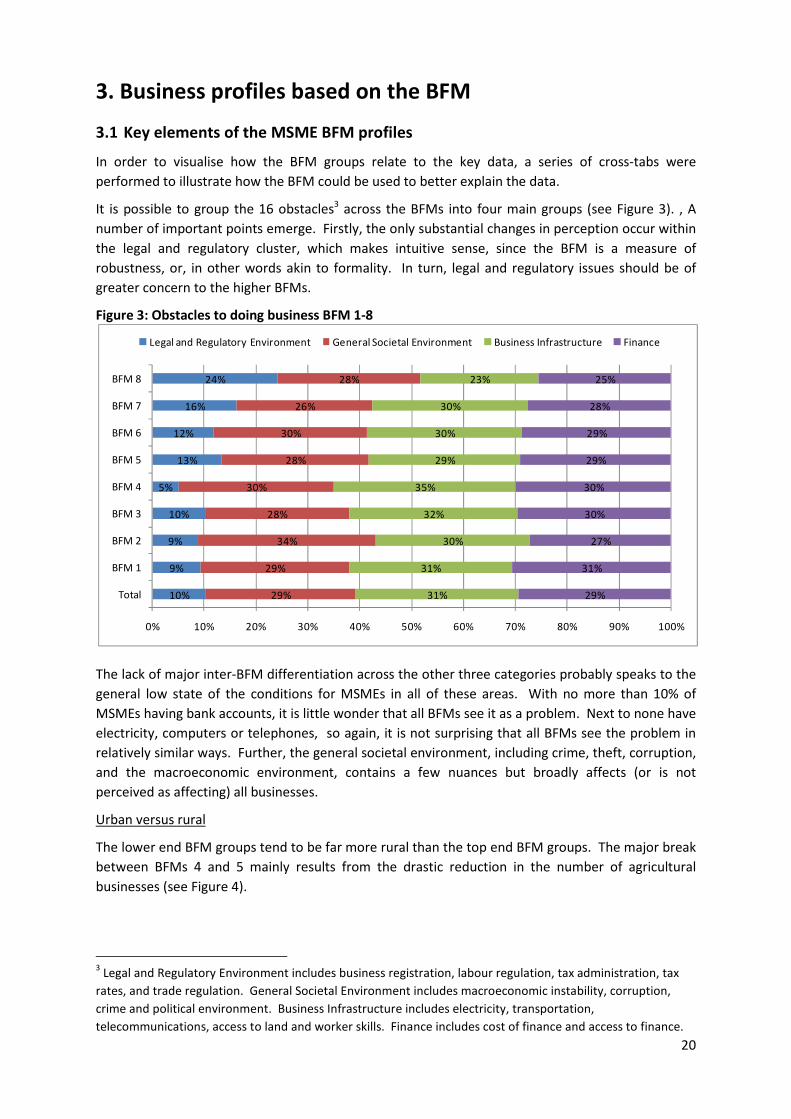
It is possible to group the 16 obstacles3 across the BFMs into four main groups (see Figure 3). , A
number of important points emerge. Firstly, the only substantial changes in perception occur within
the legal and regulatory cluster, which makes intuitive sense, since the BFM is a measure of
robustness, or, in other words akin to formality. In turn, legal and regulatory issues should be of
greater concern to the higher BFMs.
Figure 3: Obstacles to doing business BFM 1-8
The lack of major inter-BFM differentiation across the other three categories probably speaks to the
general low state of the conditions for MSMEs in all of these areas. With no more than 10% of
MSMEs having bank accounts, it is little wonder that all BFMs see it as a problem. Next to none have
electricity, computers or telephones, so again, it is not surprising that all BFMs see the problem in
relatively similar ways. Further, the general societal environment, including crime, theft, corruption,
and the macroeconomic environment, contains a few nuances but broadly affects (or is not
perceived as affecting) all businesses.
Urban versus rural
The lower end BFM groups tend to be far more rural than the top end BFM groups. The major break
between BFMs 4 and 5 mainly results from the drastic reduction in the number of agricultural
businesses (see Figure 4).
3 Legal and Regulatory Environment includes business registration, labour regulation, tax administration, tax
rates, and trade regulation. General Societal Environment includes macroeconomic instability, corruption,
crime and political environment. Business Infrastructure includes electricity, transportation,
telecommunications, access to land and worker skills. Finance includes cost of finance and access to finance.
10%
9%
9%
10%
5%
13%
12%
16%
24%
29%
29%
34%
28%
30%
28%
30%
26%
28%
31%
31%
30%
32%
35%
29%
30%
30%
23%
29%
31%
27%
30%
30%
29%
29%
28%
25%
0% 10% 20% 30% 40% 50% 60% 70% 80% 90% 100%
Total
BFM 1
BFM 2
BFM 3
BFM 4
BFM 5
BFM 6
BFM 7
BFM 8
Legal and Regulatory Environment General Societal Environment Business Infrastructure Finance
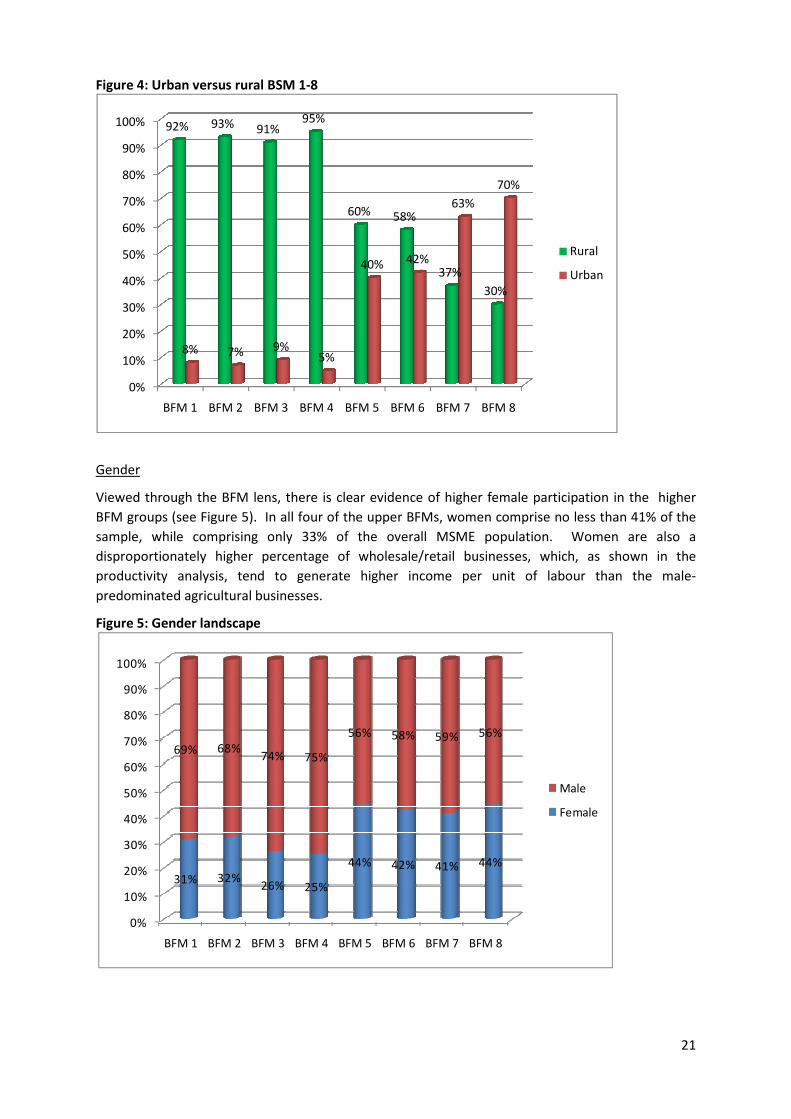
Figure 4: Urban versus rural BSM 1
Gender
Viewed through the BFM lens, there is clear evidence of higher female participation in the higher
BFM groups (see Figure 5). In all four of the upper BFMs, women comprise no less than 41% of the
sample, while comprising only 33% of the overall
disproportionately higher percentage of wholesale/retail businesses, which, as shown in the
productivity analysis, tend to generate higher income per unit of labour than the male
predominated agricultural businesses
Figure 5: Gender landscape
0%
10%
20%
30%
40%
50%
60%
70%
80%
90%
100%
BFM 1 BFM 2 BFM 3
92% 93% 91%
8% 7% 9%
0%
10%
20%
30%
40%
50%
60%
70%
80%
90%
100%
BFM 1 BFM 2 BFM 3
31% 32%26%
69% 68%74%
BSM 1-8
Viewed through the BFM lens, there is clear evidence of higher female participation in the higher
BFM groups (see Figure 5). In all four of the upper BFMs, women comprise no less than 41% of the
sample, while comprising only 33% of the overall MSME population. Women are also a
disproportionately higher percentage of wholesale/retail businesses, which, as shown in the
, tend to generate higher income per unit of labour than the male
predominated agricultural businesses.
BFM 3 BFM 4 BFM 5 BFM 6 BFM 7 BFM 8
95%
60% 58%
37%
30%
9%5%
40% 42%
63%
70%
Rural
Urban
BFM 4 BFM 5 BFM 6 BFM 7 BFM 8
25%
44% 42% 41% 44%
75%
56% 58% 59% 56%
Male
Female
21
Viewed through the BFM lens, there is clear evidence of higher female participation in the higher
BFM groups (see Figure 5). In all four of the upper BFMs, women comprise no less than 41% of the
MSME population. Women are also a
disproportionately higher percentage of wholesale/retail businesses, which, as shown in the
, tend to generate higher income per unit of labour than the male-
Rural
Urban
Male
Female
22
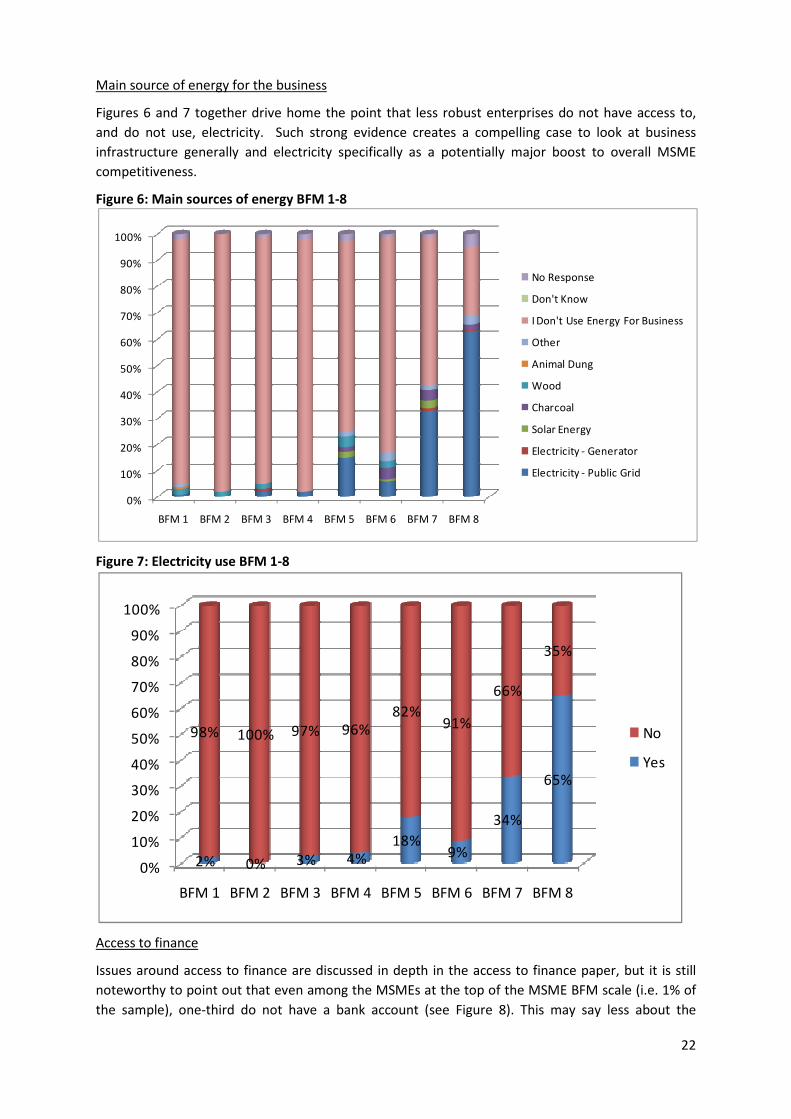
Main source of energy for the business
Figures 6 and 7 together drive home the point that less robust enterprises do not have access to,
and do not use, electricity. Such strong evidence creates a compelling case to look at business
infrastructure generally and electricity specifically as a potentially major boost to overall MSME
competitiveness.
Figure 6: Main sources of energy BFM 1-8
Figure 7: Electricity use BFM 1-8
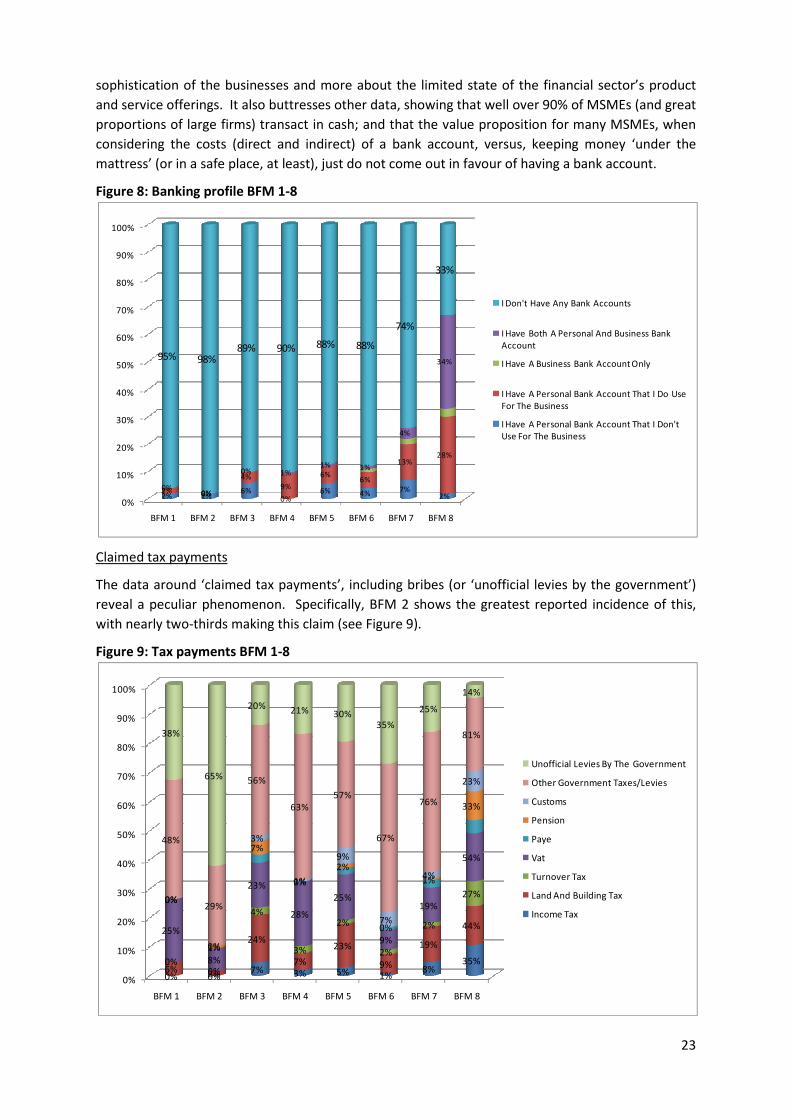
Access to finance
Issues around access to finance are discussed in depth in the access to finance paper, but it is still
noteworthy to point out that even among the MSMEs at the top of the MSME BFM scale (i.e. 1% of
the sample), one-third do not have a bank account (see Figure 8). This may say less about the
0%
10%
20%
30%
40%
50%
60%
70%
80%
90%
100%
BFM 1 BFM 2 BFM 3 BFM 4 BFM 5 BFM 6 BFM 7 BFM 8
No Response
Don't Know
I Don't Use Energy For Business
Other
Animal Dung
Wood
Charcoal
Solar Energy
Electricity - Generator
Electricity - Public Grid
0%
10%
20%
30%
40%
50%
60%
70%
80%
90%
100%
BFM 1 BFM 2 BFM 3 BFM 4 BFM 5 BFM 6 BFM 7 BFM 8
2% 0% 3% 4%
18%9%
34%
65%
98% 100% 97% 96%
82%91%
66%
35%
No
Yes
23
sophistication of the businesses and more about the limited state of the financial sector’s product
and service offerings. It also buttresses other data, showing that well over 90% of MSMEs (and great
proportions of large firms) transact in cash; and that the value proposition for many MSMEs, when
considering the costs (direct and indirect) of a bank account, versus, keeping money ‘under the
mattress’ (or in a safe place, at least), just do not come out in favour of having a bank account.
Figure 8: Banking profile BFM 1-8
Claimed tax payments
The data around ‘claimed tax payments’, including bribes (or ‘unofficial levies by the government’)
reveal a peculiar phenomenon. Specifically, BFM 2 shows the greatest reported incidence of this,
with nearly two-thirds making this claim (see Figure 9).
Figure 9: Tax payments BFM 1-8
0%
10%
20%
30%
40%
50%
60%
70%
80%
90%
100%
BFM 1 BFM 2 BFM 3 BFM 4 BFM 5 BFM 6 BFM 7 BFM 8
2% 2%6%
0%6% 4%
7%2%
2% 0%
4%
9%
6%6%
13%28%
0%0%
0% 1%1% 1%
4%
34%95% 98%
89% 90% 88% 88%
74%
33%
I Don't Have Any Bank Accounts
I Have Both A Personal And Business Bank
Account
I Have A Business Bank Account Only
I Have A Personal Bank Account That I Do Use
For The Business
I Have A Personal Bank Account That I Don't
Use For The Business
0%
10%
20%
30%
40%
50%
60%
70%
80%
90%
100%
BFM 1 BFM 2 BFM 3 BFM 4 BFM 5 BFM 6 BFM 7 BFM 8
0% 0%7% 3% 5% 1%
8%35%
6%2%
24%
7%
23%
9%
19%
44%
0%0%
4%
3%
2%
2%
2%
27%
25%
8%
23%
28%
25%
9%
19%
54%
0%
1%
7%
0%
2%
0%
1%
33%
0%
0%
3%
1%
9%
7%
4%
23%
48%
29%
56%
63%
57%
67%
76%
81%38%
65%
20%21% 30%
35%
25%
14%
Unofficial Levies By The Government
Other Government Taxes/Levies
Customs
Pension
Paye
Vat
Turnover Tax
Land And Building Tax
Income Tax
24
Note that none of these businesses report having been visited by a ‘tax official’, so the question
arises as to whether some other government official (e.g. an extension worker) is visiting these
kinds of predominantly male, middle-aged, rural dwellers and farmers. Generally, they would seem
to be too cash poor to warrant repeated approaches for bribes, and thus it may be possible that
these unofficial levies are in-kind favours. The possibility that the levies may be legitimate must also
be considered, but that this market segment is uninformed about them, and thus perceives them as
bribes. This may also be a statistical anomaly, and thus may not reflect reality in this segment.
3.1 Perceived obstacles to doing business among MSMEs
It is evident from the “most serious” problems listed by MSME owners that varying degrees of
importance would be ascribed to the problems by different business owners, depending on their
circumstances.
For example, if someone has never had electricity, the supply of electricity might not be listed as a
top-of-mind problem. To better understand and interpret the list of “most serious” problems
perceived to be experienced by MSME businesses in Zambia, the BFM analysis was used in
conjunction with a chi-squared analysis.
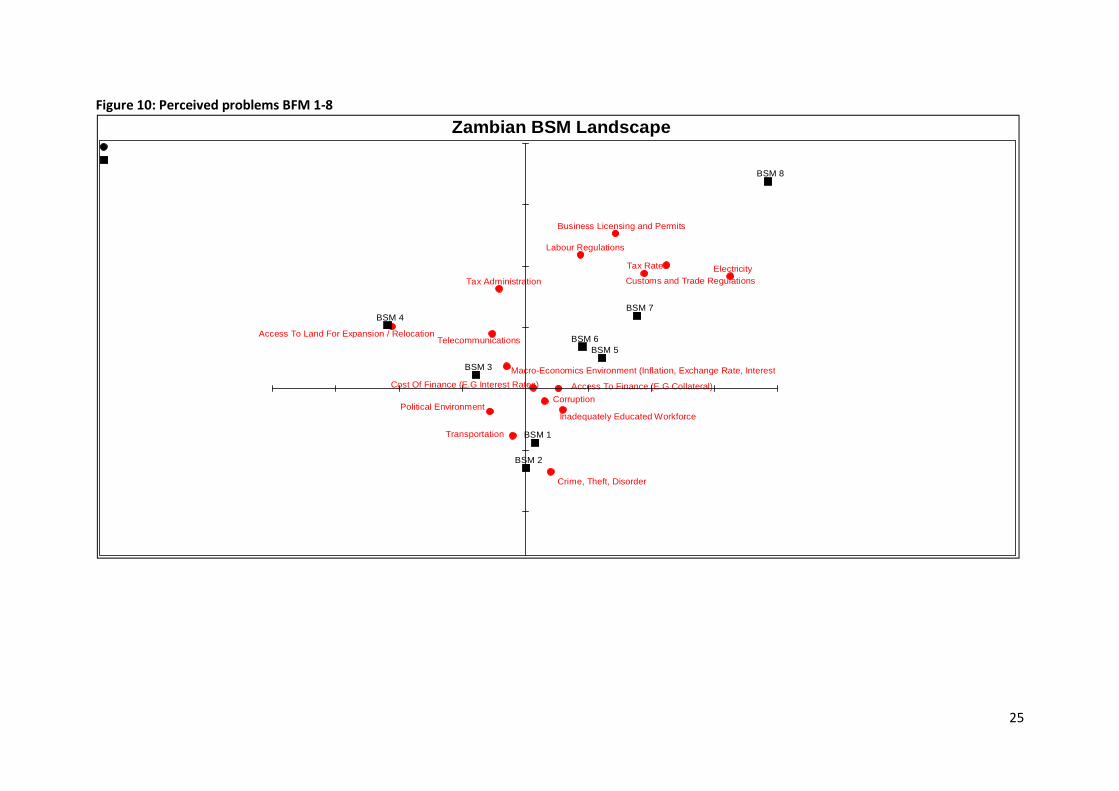
Figure 10 shows the relative importance of the various perceived problems of MSME business
owners along the BFM continuum face.
The two axes represent divergence from the “norm”. Access to, and cost of finance, are common to
most businesses along the BFM spectrum and hence lie on the horizontal axis. BFM 5 to 8 share
common problems with variables such as tax rates, licensing and permits, labour regulations and
electricity problems being perceived as the most serious at that end on the business spectrum.
BFMs 3 and 4 share concerns about access to land and telecommunications, more so than their
other BFM counterparts. At the lowest end of the scale, BFMs 1 and 2 share common problems of
crime, theft and disorder and transportation problems.
In practical application, it becomes possible to identify a strategy aimed at improving transport for
MSMEs that may focus in the areas and on the types of entrepreneurs found mostly in BFMs 1 and 2.
Discussions about taxes and licensing would most likely yield meagre results if engaging with a
profile of firms found in BFMs 1 and 2, but more likely to be perceived as important, and more likely
to have demonstrable impact, if targeted at businesses fitting the BFM 5 to 8 profile.
25
Figure 10: Perceived problems BFM 1-8
Zambian BSM Landscape
Telecommunications
Electricity
Transportation
Tax Rates Tax Administration Customs and Trade Regulations
Labour Regulations
Inadequately Educated Workforce
Business Licensing and Permits
Access To Finance (E.G Collateral) Cost Of Finance (E.G Interest Rates) Political Environment
Macro-Economics Environment (Inflation, Exchange Rate, Interest
Corruption
Crime, Theft, Disorder
Access To Land For Expansion / Relocation
BSM 1
BSM 2
BSM 3
BSM 4
BSM 5 BSM 6
BSM 7
BSM 8
26
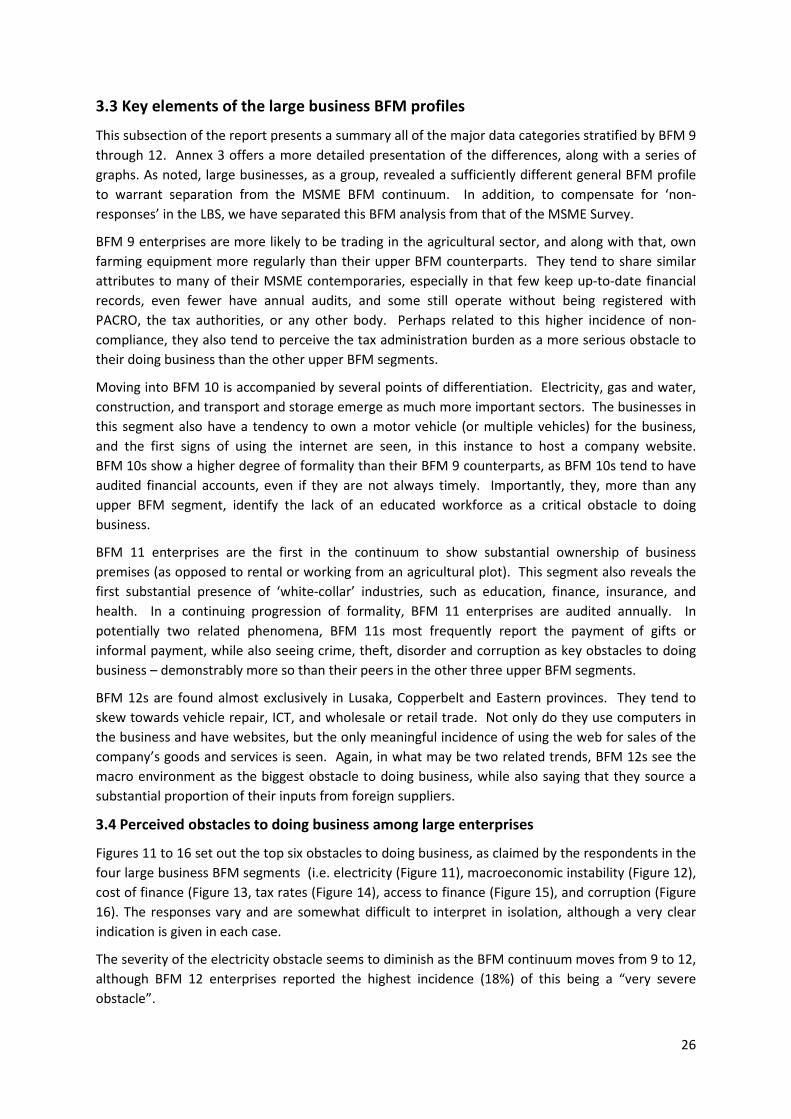
3.3 Key elements of the large business BFM profiles
This subsection of the report presents a summary all of the major data categories stratified by BFM 9
through 12. Annex 3 offers a more detailed presentation of the differences, along with a series of
graphs. As noted, large businesses, as a group, revealed a sufficiently different general BFM profile
to warrant separation from the MSME BFM continuum. In addition, to compensate for ‘non-
responses’ in the LBS, we have separated this BFM analysis from that of the MSME Survey.
BFM 9 enterprises are more likely to be trading in the agricultural sector, and along with that, own
farming equipment more regularly than their upper BFM counterparts. They tend to share similar
attributes to many of their MSME contemporaries, especially in that few keep up-to-date financial
records, even fewer have annual audits, and some still operate without being registered with
PACRO, the tax authorities, or any other body. Perhaps related to this higher incidence of non-
compliance, they also tend to perceive the tax administration burden as a more serious obstacle to
their doing business than the other upper BFM segments.
Moving into BFM 10 is accompanied by several points of differentiation. Electricity, gas and water,
construction, and transport and storage emerge as much more important sectors. The businesses in
this segment also have a tendency to own a motor vehicle (or multiple vehicles) for the business,
and the first signs of using the internet are seen, in this instance to host a company website.
BFM 10s show a higher degree of formality than their BFM 9 counterparts, as BFM 10s tend to have
audited financial accounts, even if they are not always timely. Importantly, they, more than any
upper BFM segment, identify the lack of an educated workforce as a critical obstacle to doing
business.
BFM 11 enterprises are the first in the continuum to show substantial ownership of business
premises (as opposed to rental or working from an agricultural plot). This segment also reveals the
first substantial presence of ‘white-collar’ industries, such as education, finance, insurance, and
health. In a continuing progression of formality, BFM 11 enterprises are audited annually. In
potentially two related phenomena, BFM 11s most frequently report the payment of gifts or
informal payment, while also seeing crime, theft, disorder and corruption as key obstacles to doing
business – demonstrably more so than their peers in the other three upper BFM segments.
BFM 12s are found almost exclusively in Lusaka, Copperbelt and Eastern provinces. They tend to
skew towards vehicle repair, ICT, and wholesale or retail trade. Not only do they use computers in
the business and have websites, but the only meaningful incidence of using the web for sales of the
company’s goods and services is seen. Again, in what may be two related trends, BFM 12s see the
macro environment as the biggest obstacle to doing business, while also saying that they source a
substantial proportion of their inputs from foreign suppliers.
3.4 Perceived obstacles to doing business among large enterprises
Figures 11 to 16 set out the top six obstacles to doing business, as claimed by the respondents in the
four large business BFM segments (i.e. electricity (Figure 11), macroeconomic instability (Figure 12),
cost of finance (Figure 13, tax rates (Figure 14), access to finance (Figure 15), and corruption (Figure
16). The responses vary and are somewhat difficult to interpret in isolation, although a very clear
indication is given in each case.
The severity of the electricity obstacle seems to diminish as the BFM continuum moves from 9 to 12,
although BFM 12 enterprises reported the highest incidence (18%) of this being a “very severe
obstacle”.
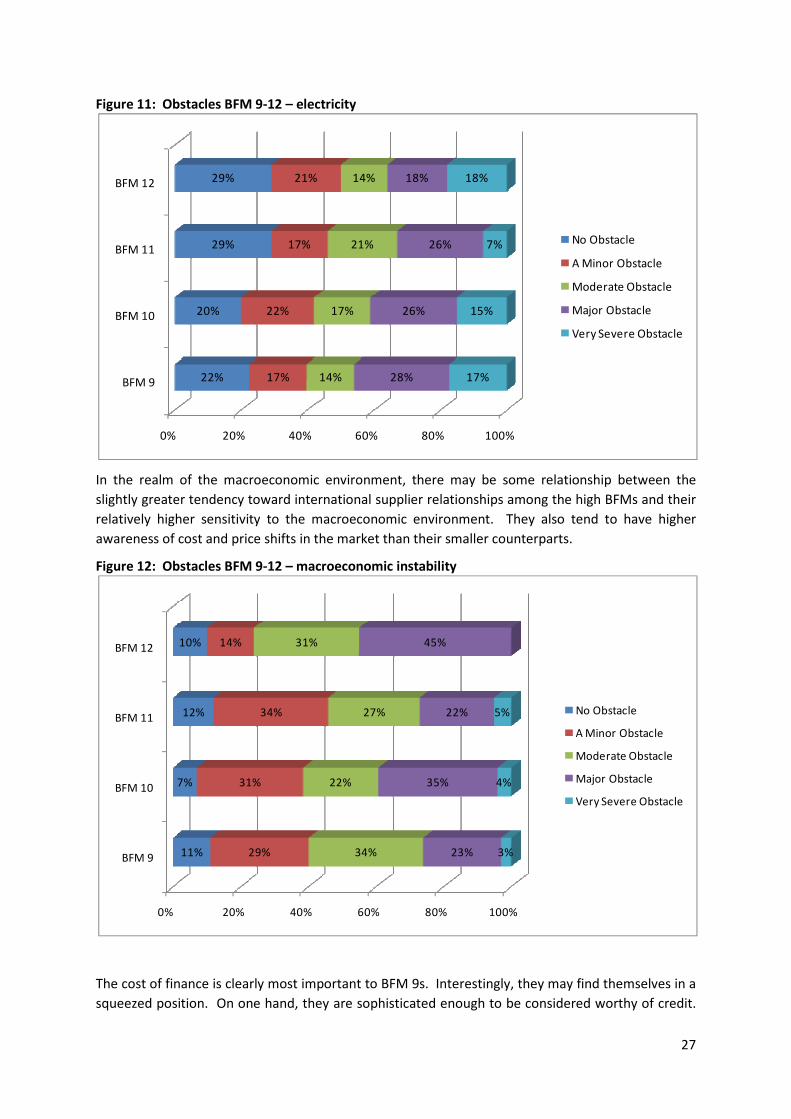
27
Figure 11: Obstacles BFM 9-12 – electricity
In the realm of the macroeconomic environment, there may be some relationship between the
slightly greater tendency toward international supplier relationships among the high BFMs and their
relatively higher sensitivity to the macroeconomic environment. They also tend to have higher
awareness of cost and price shifts in the market than their smaller counterparts.
Figure 12: Obstacles BFM 9-12 – macroeconomic instability
The cost of finance is clearly most important to BFM 9s. Interestingly, they may find themselves in a
squeezed position. On one hand, they are sophisticated enough to be considered worthy of credit.
0% 20% 40% 60% 80% 100%
BFM 9
BFM 10
BFM 11
BFM 12
22%
20%
29%
29%
17%
22%
17%
21%
14%
17%
21%
14%
28%
26%
26%
18%
17%
15%
7%
18%
No Obstacle
A Minor Obstacle
Moderate Obstacle
Major Obstacle
Very Severe Obstacle
0% 20% 40% 60% 80% 100%
BFM 9
BFM 10
BFM 11
BFM 12
11%
7%
12%
10%
29%
31%
34%
14%
34%
22%
27%
31%
23%
35%
22%
45%
3%
4%
5% No Obstacle
A Minor Obstacle
Moderate Obstacle
Major Obstacle
Very Severe Obstacle
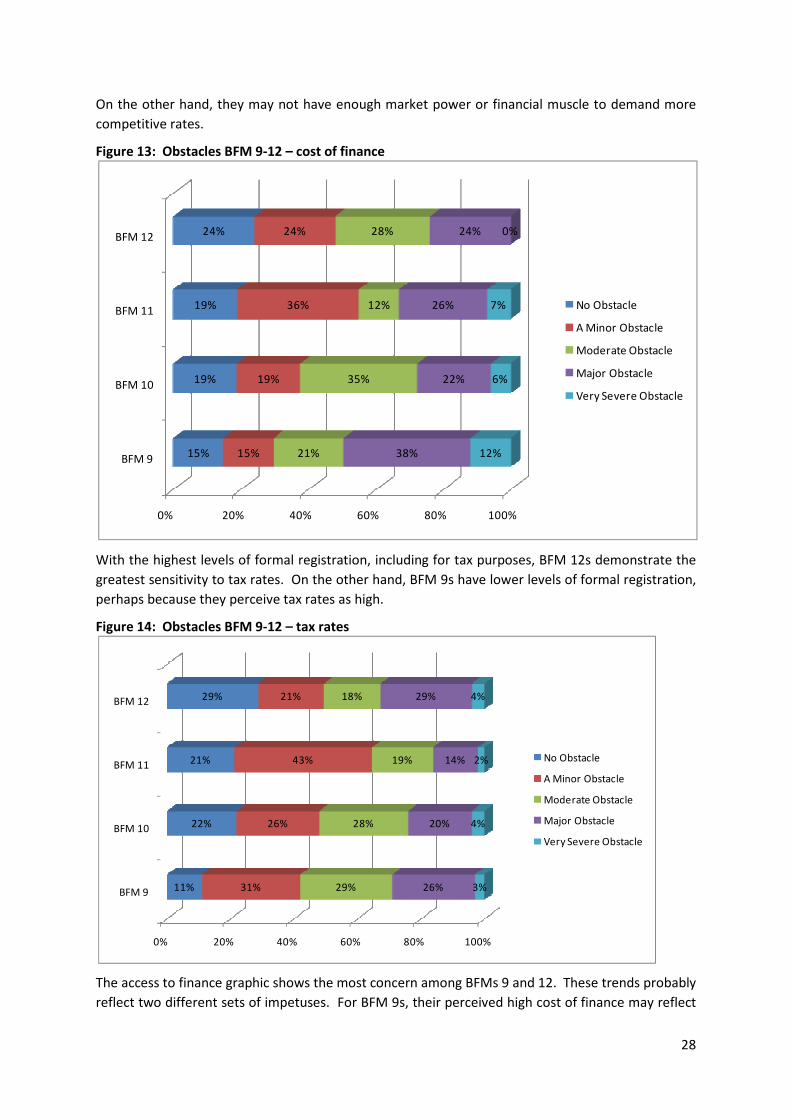
28
On the other hand, they may not have enough market power or financial muscle to demand more
competitive rates.
Figure 13: Obstacles BFM 9-12 – cost of finance
With the highest levels of formal registration, including for tax purposes, BFM 12s demonstrate the
greatest sensitivity to tax rates. On the other hand, BFM 9s have lower levels of formal registration,
perhaps because they perceive tax rates as high.
Figure 14: Obstacles BFM 9-12 – tax rates
The access to finance graphic shows the most concern among BFMs 9 and 12. These trends probably
reflect two different sets of impetuses. For BFM 9s, their perceived high cost of finance may reflect
0% 20% 40% 60% 80% 100%
BFM 9
BFM 10
BFM 11
BFM 12
15%
19%
19%
24%
15%
19%
36%
24%
21%
35%
12%
28%
38%
22%
26%
24%
12%
6%
7%
0%
No Obstacle
A Minor Obstacle
Moderate Obstacle
Major Obstacle
Very Severe Obstacle
0% 20% 40% 60% 80% 100%
BFM 9
BFM 10
BFM 11
BFM 12
11%
22%
21%
29%
31%
26%
43%
21%
29%
28%
19%
18%
26%
20%
14%
29%
3%
4%
2%
4%
No Obstacle
A Minor Obstacle
Moderate Obstacle
Major Obstacle
Very Severe Obstacle
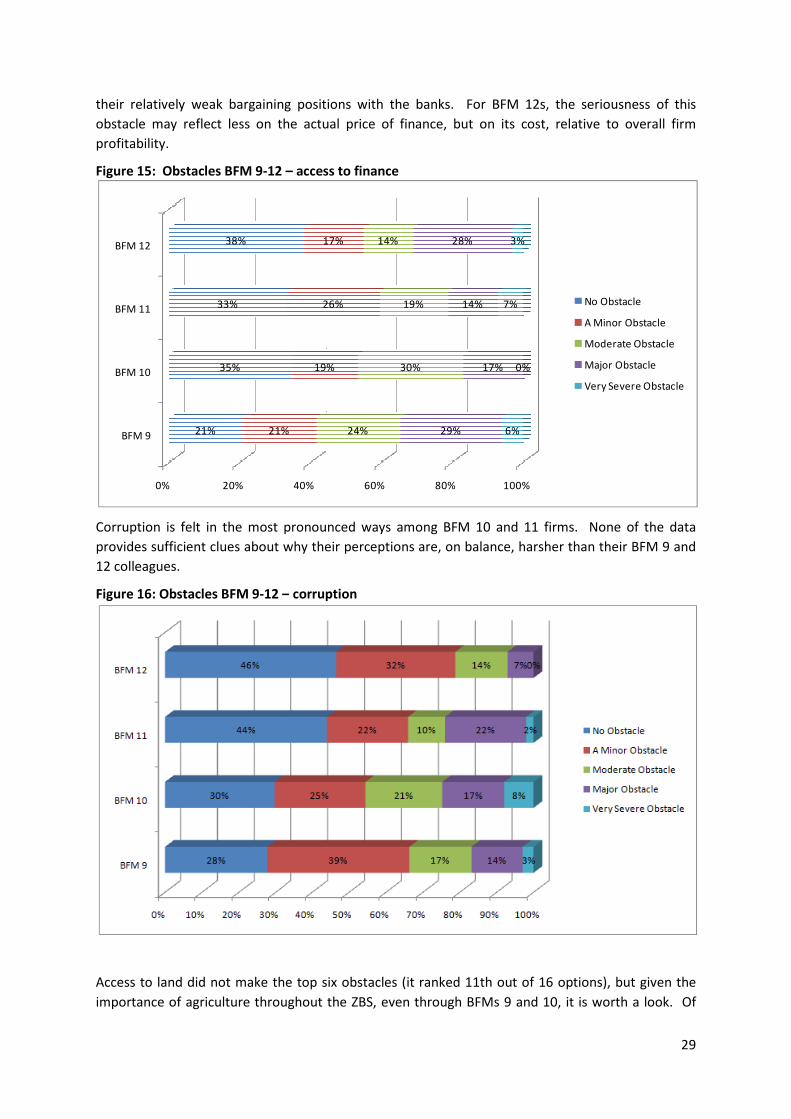
their relatively weak bargaining positions with the banks. For BFM 12s, the seriousness of this
obstacle may reflect less on the
profitability.
Figure 15: Obstacles BFM 9-12 –
Corruption is felt in the most pronounced ways among BFM 10 and 11 firms. None of the data
provides sufficient clues about why their perceptio
12 colleagues.
Figure 16: Obstacles BFM 9-12 –
Access to land did not make the top six obstacles (it ranked 11
importance of agriculture throughout the ZBS,
0% 20%
BFM 9
BFM 10
BFM 11
BFM 12
21%
35%
33%
38%
21%
their relatively weak bargaining positions with the banks. For BFM 12s, the seriousness of this
obstacle may reflect less on the actual price of finance, but on its cost, relative to overall firm
– access to finance
Corruption is felt in the most pronounced ways among BFM 10 and 11 firms. None of the data
sufficient clues about why their perceptions are, on balance, harsher than their BFM 9 and
– corruption
Access to land did not make the top six obstacles (it ranked 11th out of 16 options), but given the
importance of agriculture throughout the ZBS, even through BFMs 9 and 10, it is worth a look. Of
40% 60% 80% 100%
21%
19%
26%
17%
24%
30%
19%
14%
29%
17%
14%
28%
6%
0%
7%
3%
29
their relatively weak bargaining positions with the banks. For BFM 12s, the seriousness of this
, but on its cost, relative to overall firm
Corruption is felt in the most pronounced ways among BFM 10 and 11 firms. None of the data
ns are, on balance, harsher than their BFM 9 and
options), but given the
even through BFMs 9 and 10, it is worth a look. Of
No Obstacle
A Minor Obstacle
Moderate Obstacle
Major Obstacle
Very Severe Obstacle
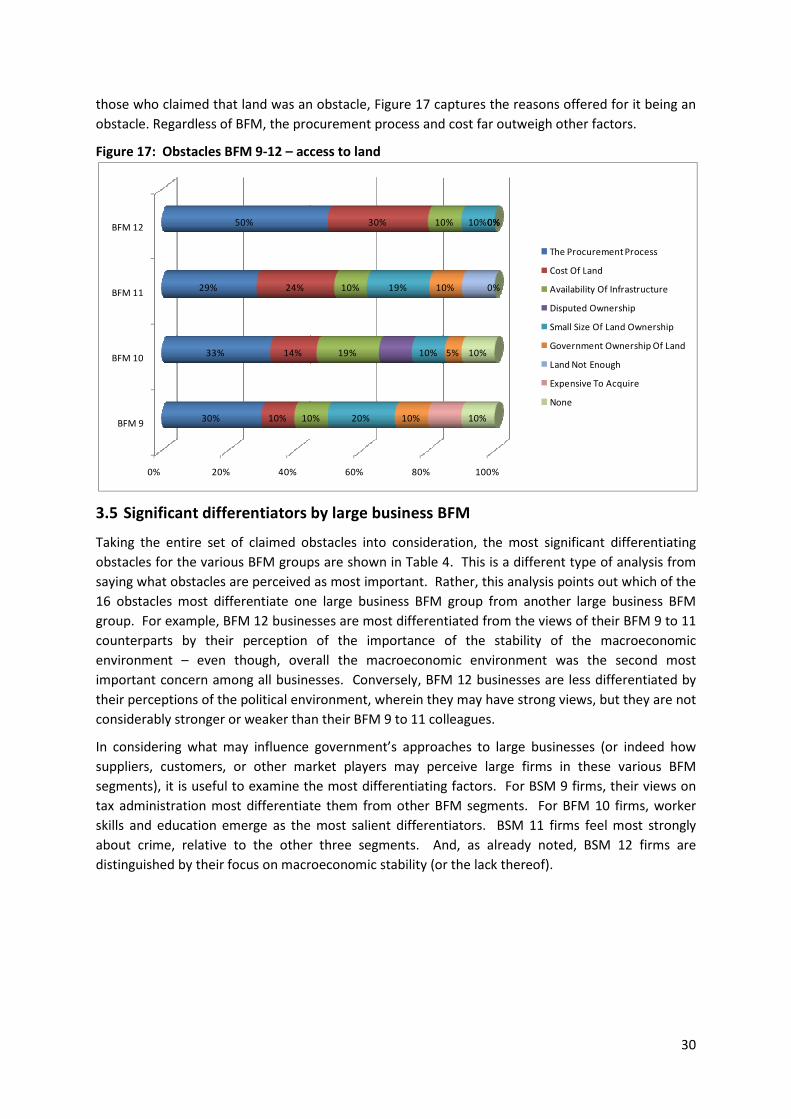
30
those who claimed that land was an obstacle, Figure 17 captures the reasons offered for it being an
obstacle. Regardless of BFM, the procurement process and cost far outweigh other factors.
Figure 17: Obstacles BFM 9-12 – access to land
3.5 Significant differentiators by large business BFM
Taking the entire set of claimed obstacles into consideration, the most significant differentiating
obstacles for the various BFM groups are shown in Table 4. This is a different type of analysis from
saying what obstacles are perceived as most important. Rather, this analysis points out which of the
16 obstacles most differentiate one large business BFM group from another large business BFM
group. For example, BFM 12 businesses are most differentiated from the views of their BFM 9 to 11
counterparts by their perception of the importance of the stability of the macroeconomic
environment – even though, overall the macroeconomic environment was the second most
important concern among all businesses. Conversely, BFM 12 businesses are less differentiated by
their perceptions of the political environment, wherein they may have strong views, but they are not
considerably stronger or weaker than their BFM 9 to 11 colleagues.
In considering what may influence government’s approaches to large businesses (or indeed how
suppliers, customers, or other market players may perceive large firms in these various BFM
segments), it is useful to examine the most differentiating factors. For BSM 9 firms, their views on
tax administration most differentiate them from other BFM segments. For BFM 10 firms, worker
skills and education emerge as the most salient differentiators. BSM 11 firms feel most strongly
about crime, relative to the other three segments. And, as already noted, BSM 12 firms are
distinguished by their focus on macroeconomic stability (or the lack thereof).
0% 20% 40% 60% 80% 100%
BFM 9
BFM 10
BFM 11
BFM 12
30%
33%
29%
50%
10%
14%
24%
30%
10%
19%
10%
10%
20%
10%
19%
10%
10%
5%
10%
0%
10%
10%
0%
0%
The Procurement Process
Cost Of Land
Availability Of Infrastructure
Disputed Ownership
Small Size Of Land Ownership
Government Ownership Of Land
Land Not Enough
Expensive To Acquire
None
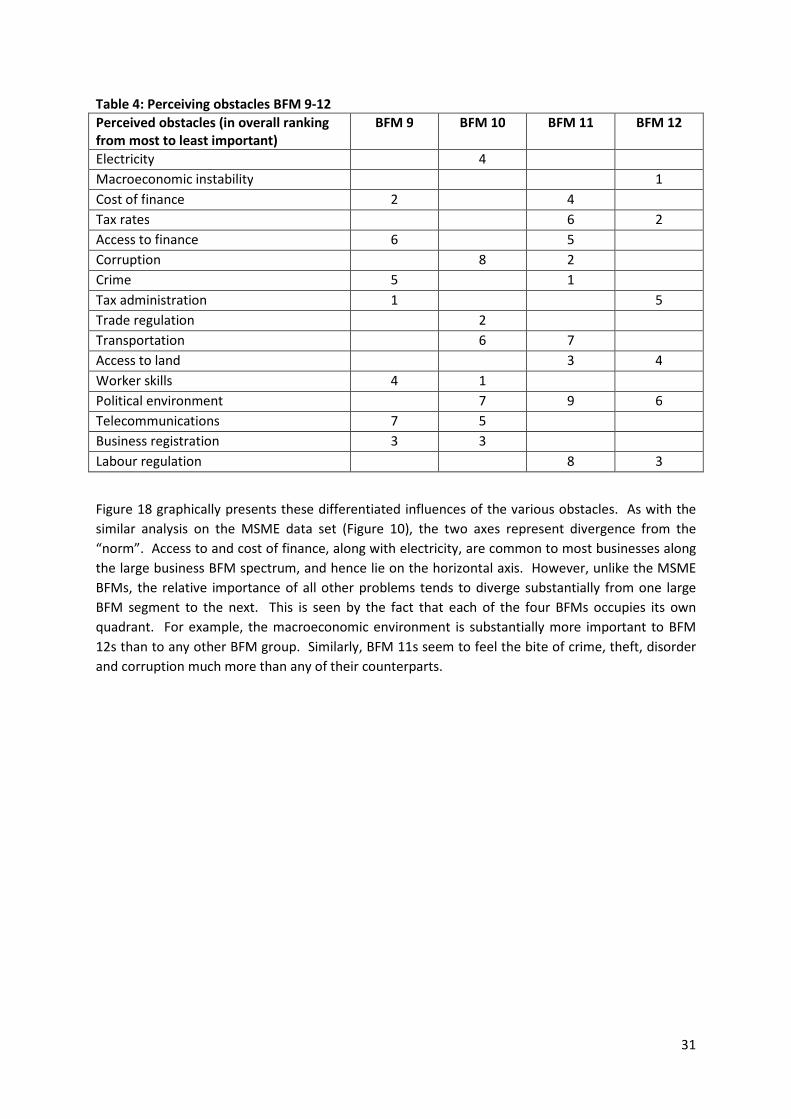
31
Table 4: Perceiving obstacles BFM 9-12 Perceived obstacles (in overall ranking
from most to least important) BFM 9 BFM 10 BFM 11 BFM 12
Electricity 4
Macroeconomic instability 1
Cost of finance 2 4
Tax rates 6 2
Access to finance 6 5
Corruption 8 2
Crime 5 1
Tax administration 1 5
Trade regulation 2
Transportation 6 7
Access to land 3 4
Worker skills 4 1
Political environment 7 9 6
Telecommunications 7 5
Business registration 3 3
Labour regulation 8 3
Figure 18 graphically presents these differentiated influences of the various obstacles. As with the
similar analysis on the MSME data set (Figure 10), the two axes represent divergence from the
“norm”. Access to and cost of finance, along with electricity, are common to most businesses along
the large business BFM spectrum, and hence lie on the horizontal axis. However, unlike the MSME
BFMs, the relative importance of all other problems tends to diverge substantially from one large
BFM segment to the next. This is seen by the fact that each of the four BFMs occupies its own
quadrant. For example, the macroeconomic environment is substantially more important to BFM
12s than to any other BFM group. Similarly, BFM 11s seem to feel the bite of crime, theft, disorder
and corruption much more than any of their counterparts.
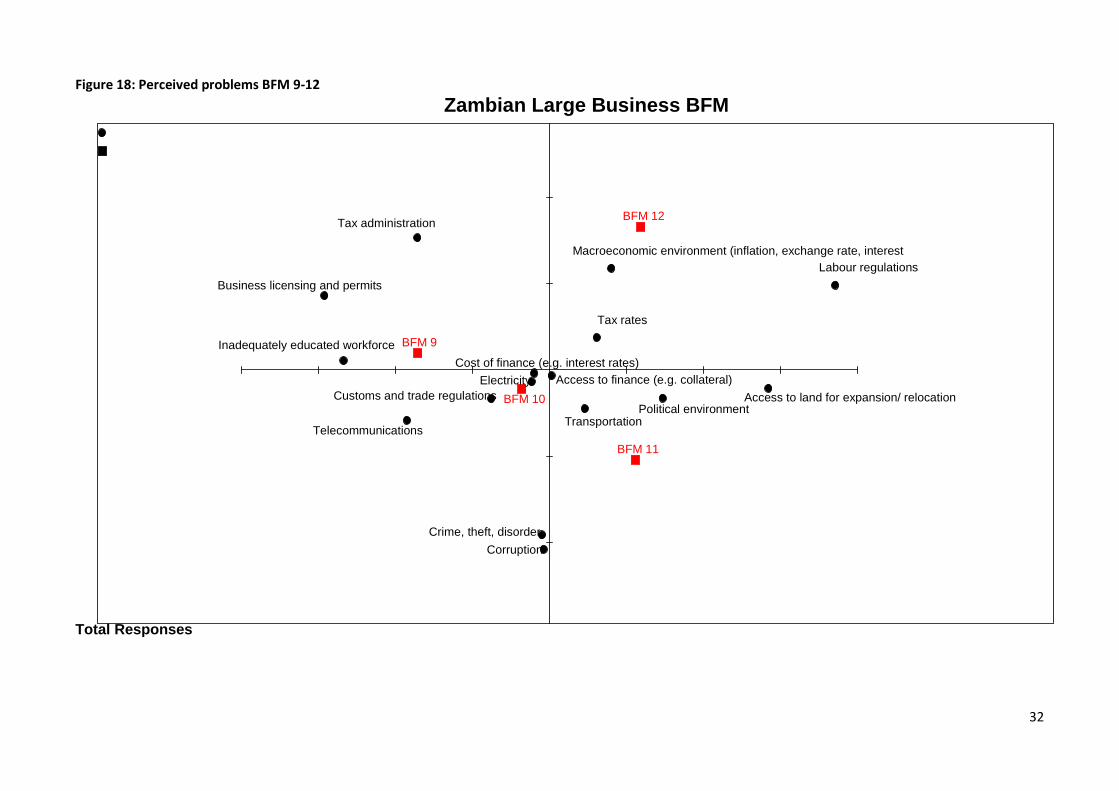
32
Figure 18: Perceived problems BFM 9-12
Zambian Large Business BFM
Telecommunications
Electricity
Transportation
Tax rates
Tax administration
Customs and trade regulations
Labour regulations
Inadequately educated workforce
Business licensing and permits
Access to finance (e.g. collateral) Cost of finance (e.g. interest rates)
Political environment
Macroeconomic environment (inflation, exchange rate, interest
Corruption Crime, theft, disorder
Access to land for expansion/ relocation
BFM 9
BFM 10
BFM 11
BFM 12
Total Responses
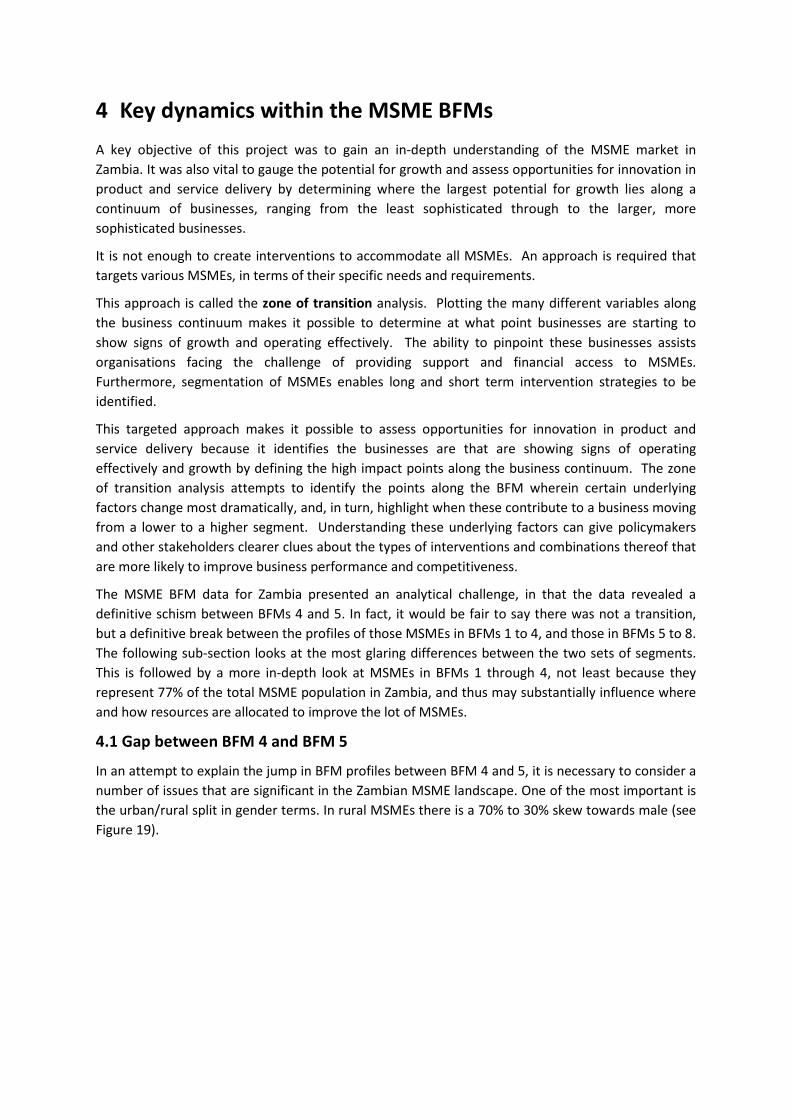
4 Key dynamics within the MSME BFMs
A key objective of this project was to gain an in-depth understanding of the MSME market in
Zambia. It was also vital to gauge the potential for growth and assess opportunities for innovation in
product and service delivery by determining where the largest potential for growth lies along a
continuum of businesses, ranging from the least sophisticated through to the larger, more
sophisticated businesses.
It is not enough to create interventions to accommodate all MSMEs. An approach is required that
targets various MSMEs, in terms of their specific needs and requirements.
This approach is called the zone of transition analysis. Plotting the many different variables along
the business continuum makes it possible to determine at what point businesses are starting to
show signs of growth and operating effectively. The ability to pinpoint these businesses assists
organisations facing the challenge of providing support and financial access to MSMEs.
Furthermore, segmentation of MSMEs enables long and short term intervention strategies to be
identified.
This targeted approach makes it possible to assess opportunities for innovation in product and
service delivery because it identifies the businesses are that are showing signs of operating
effectively and growth by defining the high impact points along the business continuum. The zone
of transition analysis attempts to identify the points along the BFM wherein certain underlying
factors change most dramatically, and, in turn, highlight when these contribute to a business moving
from a lower to a higher segment. Understanding these underlying factors can give policymakers
and other stakeholders clearer clues about the types of interventions and combinations thereof that
are more likely to improve business performance and competitiveness.
The MSME BFM data for Zambia presented an analytical challenge, in that the data revealed a
definitive schism between BFMs 4 and 5. In fact, it would be fair to say there was not a transition,
but a definitive break between the profiles of those MSMEs in BFMs 1 to 4, and those in BFMs 5 to 8.
The following sub-section looks at the most glaring differences between the two sets of segments.
This is followed by a more in-depth look at MSMEs in BFMs 1 through 4, not least because they
represent 77% of the total MSME population in Zambia, and thus may substantially influence where
and how resources are allocated to improve the lot of MSMEs.
4.1 Gap between BFM 4 and BFM 5
In an attempt to explain the jump in BFM profiles between BFM 4 and 5, it is necessary to consider a
number of issues that are significant in the Zambian MSME landscape. One of the most important is
the urban/rural split in gender terms. In rural MSMEs there is a 70% to 30% skew towards male (see
Figure 19).
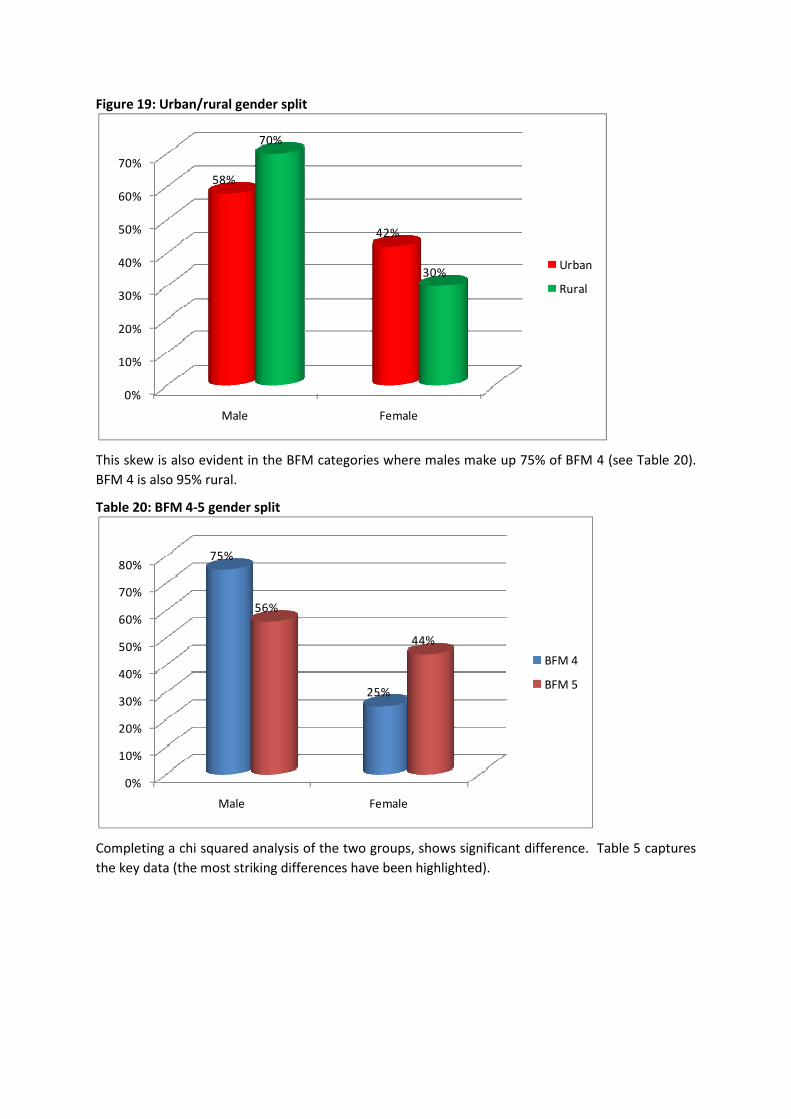
Figure 19: Urban/rural gender split
This skew is also evident in the BFM categories where males make up 75% of BFM 4 (see Table 20).
BFM 4 is also 95% rural.
Table 20: BFM 4-5 gender split
Completing a chi squared analysis of the two groups, shows significant difference. Table 5 captures
the key data (the most striking differences have been highlighted).
0%
10%
20%
30%
40%
50%
60%
70%
Male Female
58%
42%
70%
30%Urban
Rural
0%
10%
20%
30%
40%
50%
60%
70%
80%
Male Female
75%
25%
56%
44%
BFM 4
BFM 5
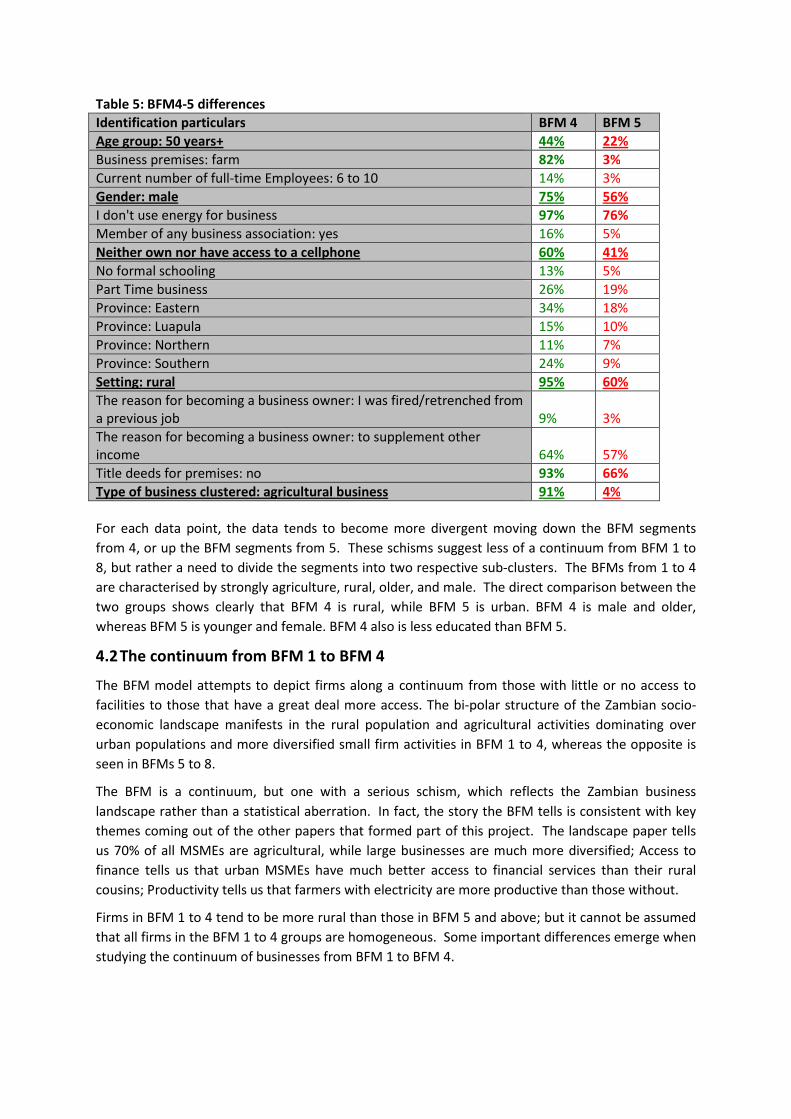
Table 5: BFM4-5 differences
Identification particulars BFM 4 BFM 5
Age group: 50 years+ 44% 22%
Business premises: farm 82% 3%
Current number of full-time Employees: 6 to 10 14% 3%
Gender: male 75% 56%
I don't use energy for business 97% 76%
Member of any business association: yes 16% 5%
Neither own nor have access to a cellphone 60% 41%
No formal schooling 13% 5%
Part Time business 26% 19%
Province: Eastern 34% 18%
Province: Luapula 15% 10%
Province: Northern 11% 7%
Province: Southern 24% 9%
Setting: rural 95% 60%
The reason for becoming a business owner: I was fired/retrenched from
a previous job 9% 3%
The reason for becoming a business owner: to supplement other
income 64% 57%
Title deeds for premises: no 93% 66%
Type of business clustered: agricultural business 91% 4%
For each data point, the data tends to become more divergent moving down the BFM segments
from 4, or up the BFM segments from 5. These schisms suggest less of a continuum from BFM 1 to
8, but rather a need to divide the segments into two respective sub-clusters. The BFMs from 1 to 4
are characterised by strongly agriculture, rural, older, and male. The direct comparison between the
two groups shows clearly that BFM 4 is rural, while BFM 5 is urban. BFM 4 is male and older,
whereas BFM 5 is younger and female. BFM 4 also is less educated than BFM 5.
4.2 The continuum from BFM 1 to BFM 4
The BFM model attempts to depict firms along a continuum from those with little or no access to
facilities to those that have a great deal more access. The bi-polar structure of the Zambian socio-
economic landscape manifests in the rural population and agricultural activities dominating over
urban populations and more diversified small firm activities in BFM 1 to 4, whereas the opposite is
seen in BFMs 5 to 8.
The BFM is a continuum, but one with a serious schism, which reflects the Zambian business
landscape rather than a statistical aberration. In fact, the story the BFM tells is consistent with key
themes coming out of the other papers that formed part of this project. The landscape paper tells
us 70% of all MSMEs are agricultural, while large businesses are much more diversified; Access to
finance tells us that urban MSMEs have much better access to financial services than their rural
cousins; Productivity tells us that farmers with electricity are more productive than those without.
Firms in BFM 1 to 4 tend to be more rural than those in BFM 5 and above; but it cannot be assumed
that all firms in the BFM 1 to 4 groups are homogeneous. Some important differences emerge when
studying the continuum of businesses from BFM 1 to BFM 4.
The majority of businesses in BFM 1 to 4 describe their business activities as “growing something
and selling it”; and there is a skew towards BFM 1 rather than 4, indicating that as firms move up the
continuum from 1 to 4, activities they participate in change, and arguably become more
sophisticated.
There is a distinct skew towards businesses in BFM 1 being in agricultural production and having the
business premises as a farm. The land in BFM 1 tends to be owned by the businesses rather more so
than in BFM 4.
• Other interesting observations about firms along the continuum from 1 to 4 are:Businesses
in BFM 1 tend to have business partners more so than in BFM 4. Although not specifically
probed in the questionnaire, this may reflect a tendency towards more involvement of the
community and/or family members in the least robust of rural enterprises4.
• Some businesses in BFM 4 have a bank account and tend to have more up-to-date financial
statements, as compared to those in BFM 1 – giving some hope that rural and micro do not
equal unbanked and unsophisticated.
• Businesses in BFM 4 also tend to obtain and pay for expert advice outside of their
businesses, demonstrably more so than those in BFM 1.
• Males are more likely to own the businesses in BFM 4 than those in BFM 1 – a phenomenon
worthy of more analysis, since we see in BFMs 5 to 8 a disproportionate representation of
women. This may suggest some sort of gender segregation of slightly more viable
agricultural and rural enterprises trending towards higher proportions of male ownership,
while women seem to have gained disproportionate gains in more urban retail oriented
enterprises.
• The availability of land for expanding the business is a more serious obstacle to doing
business in BFM 4 than in BFM 1, which again suggests a shift from community-based
survivalist activities towards the lower end of the scale, versus slightly more business-
oriented agricultural enterprises at the higher end of the scale.
• Businesses in BFM 4 are far more likely to have access to a post box address than those in
BFM 1.
• BFM 4 businesses tend to perceive the macroeconomic environment as more of an obstacle
than those in BFM 1, due most likely to the greater exposure to the issues around the macro
environment than in BFM 1. That is not to say that the macro environment does not impact
BFM 1. It simply indicates more of an awareness of the issues in the higher BFMs.
• Similarly, business licensing and permits are perceived to be a greater obstacle in BFM 4
than in BFM1. Again this is what is perceived.
• The same goes for telecommunications. BFM 4 firms perceive it to be an obstacle more so
than BFM 1. This is probably because BFM 1 firms have more limited access to
telecommunications, whereas BFM 4 firms, perceiving greater opportunities that could be
exploited through better telecommunications, are frustrated by lack of access to or
inconsistency of the service.
Financial literacy is another important differentiator along the continuum. This demonstrates how
improving the understanding of financial terms could assist in moving firms up the continuum, along
with providing them with a greater degree of sophistication in doing business.
Words heard but not understood by BFM 1 compared to BFM 4 are:
4 Nearly 30% of MSMEs reported having ‘part-time unpaid employees’ – the largest single category of the four
possible choices and the labour category that would most befit these kinds of tiny, intermittent, farm-based
enterprises.
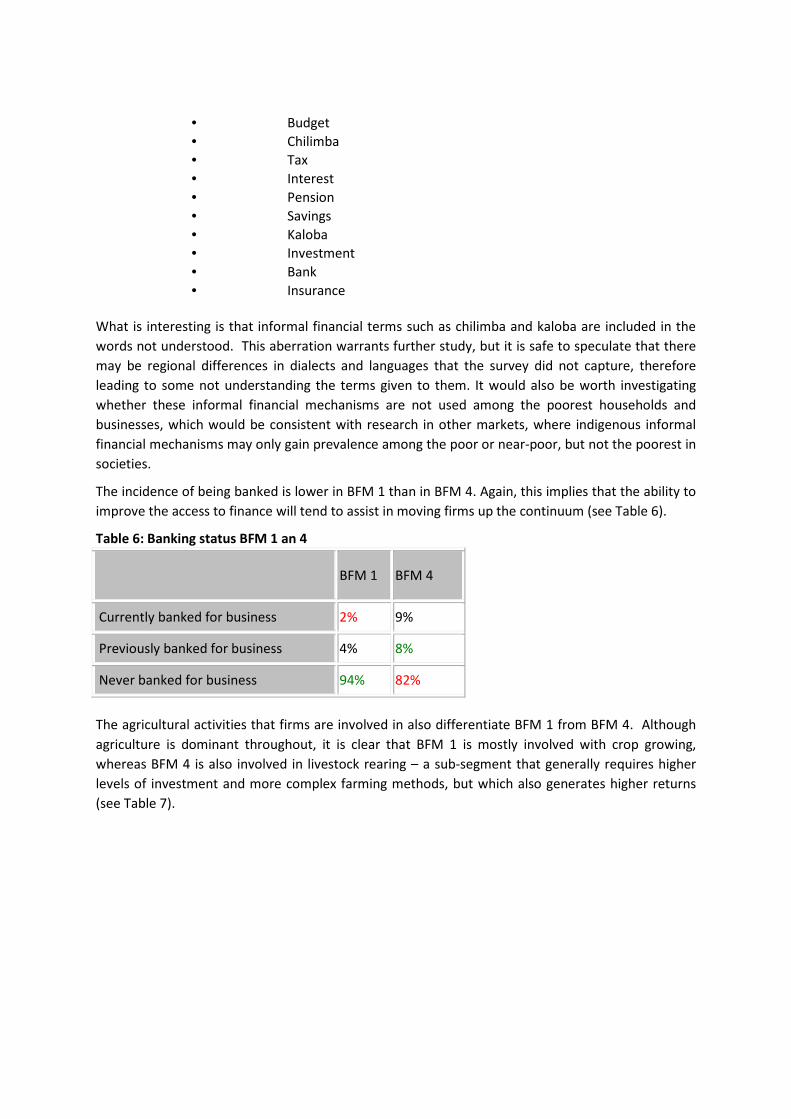
• Budget
• Chilimba
• Tax
• Interest
• Pension
• Savings
• Kaloba
• Investment
• Bank
• Insurance
What is interesting is that informal financial terms such as chilimba and kaloba are included in the
words not understood. This aberration warrants further study, but it is safe to speculate that there
may be regional differences in dialects and languages that the survey did not capture, therefore
leading to some not understanding the terms given to them. It would also be worth investigating
whether these informal financial mechanisms are not used among the poorest households and
businesses, which would be consistent with research in other markets, where indigenous informal
financial mechanisms may only gain prevalence among the poor or near-poor, but not the poorest in
societies.
The incidence of being banked is lower in BFM 1 than in BFM 4. Again, this implies that the ability to
improve the access to finance will tend to assist in moving firms up the continuum (see Table 6).
Table 6: Banking status BFM 1 an 4
BFM 1 BFM 4
Currently banked for business
2% 9%
Previously banked for business
4% 8%
Never banked for business
94% 82%
The agricultural activities that firms are involved in also differentiate BFM 1 from BFM 4. Although
agriculture is dominant throughout, it is clear that BFM 1 is mostly involved with crop growing,
whereas BFM 4 is also involved in livestock rearing – a sub-segment that generally requires higher
levels of investment and more complex farming methods, but which also generates higher returns
(see Table 7).
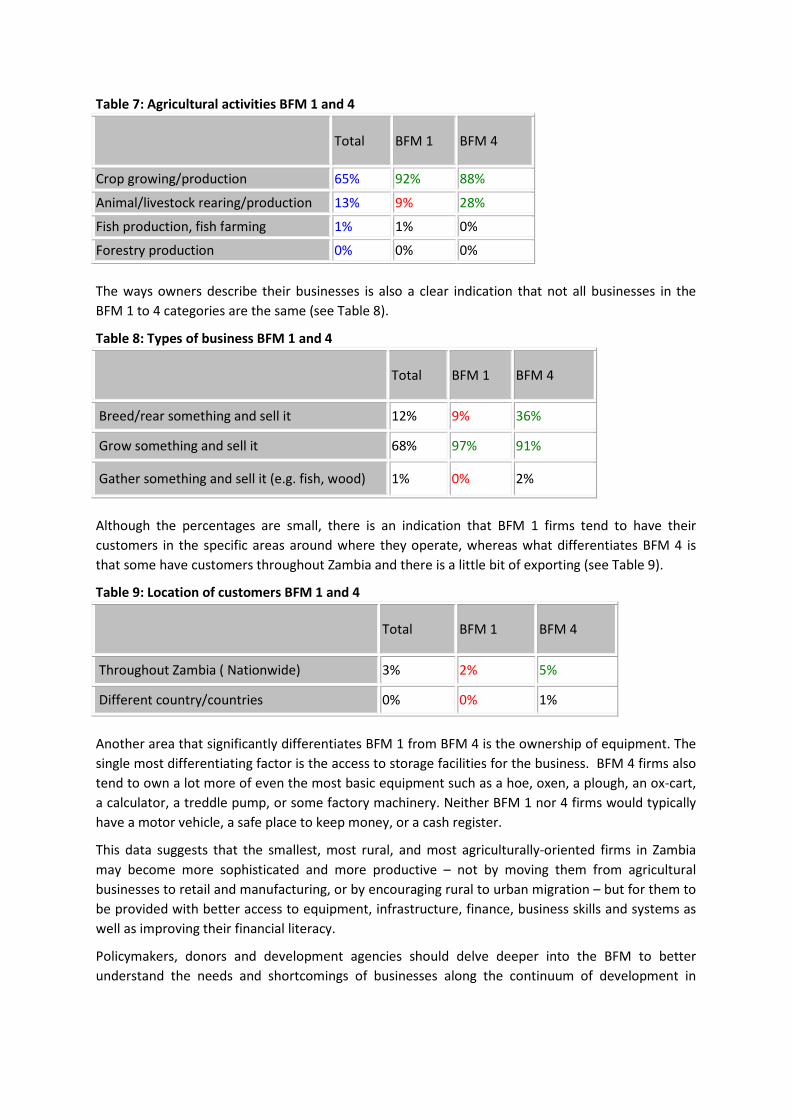
Table 7: Agricultural activities BFM 1 and 4
Total BFM 1 BFM 4
Crop growing/production 65% 92% 88%
Animal/livestock rearing/production 13% 9% 28%
Fish production, fish farming 1% 1% 0%
Forestry production 0% 0% 0%
The ways owners describe their businesses is also a clear indication that not all businesses in the
BFM 1 to 4 categories are the same (see Table 8).
Table 8: Types of business BFM 1 and 4
Total BFM 1 BFM 4
Breed/rear something and sell it
12% 9% 36%
Grow something and sell it
68% 97% 91%
Gather something and sell it (e.g. fish, wood)
1% 0% 2%
Although the percentages are small, there is an indication that BFM 1 firms tend to have their
customers in the specific areas around where they operate, whereas what differentiates BFM 4 is
that some have customers throughout Zambia and there is a little bit of exporting (see Table 9).
Table 9: Location of customers BFM 1 and 4
Total BFM 1 BFM 4
Throughout Zambia ( Nationwide)
3% 2% 5%
Different country/countries
0% 0% 1%
Another area that significantly differentiates BFM 1 from BFM 4 is the ownership of equipment. The
single most differentiating factor is the access to storage facilities for the business. BFM 4 firms also
tend to own a lot more of even the most basic equipment such as a hoe, oxen, a plough, an ox-cart,
a calculator, a treddle pump, or some factory machinery. Neither BFM 1 nor 4 firms would typically
have a motor vehicle, a safe place to keep money, or a cash register.
This data suggests that the smallest, most rural, and most agriculturally-oriented firms in Zambia
may become more sophisticated and more productive – not by moving them from agricultural
businesses to retail and manufacturing, or by encouraging rural to urban migration – but for them to
be provided with better access to equipment, infrastructure, finance, business skills and systems as
well as improving their financial literacy.
Policymakers, donors and development agencies should delve deeper into the BFM to better
understand the needs and shortcomings of businesses along the continuum of development in
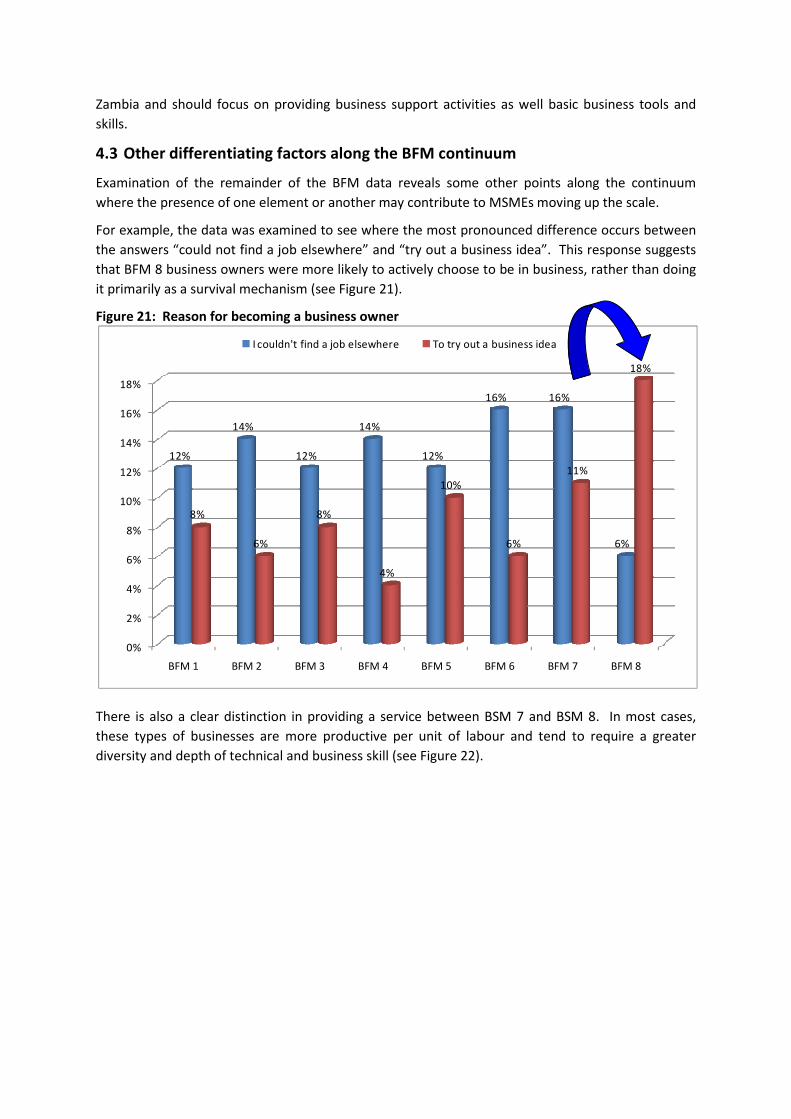
Zambia and should focus on providing business support activities as well basic business tools and
skills.
4.3 Other differentiating factors along the BFM continuum
Examination of the remainder of the BFM data reveals some other points along the continuum
where the presence of one element or another may contribute to MSMEs moving up the scale.
For example, the data was examined to see where the most pronounced difference occurs between
the answers “could not find a job elsewhere” and “try out a business idea”. This response suggests
that BFM 8 business owners were more likely to actively choose to be in business, rather than doing
it primarily as a survival mechanism (see Figure 21).
Figure 21: Reason for becoming a business owner
There is also a clear distinction in providing a service between BSM 7 and BSM 8. In most cases,
these types of businesses are more productive per unit of labour and tend to require a greater
diversity and depth of technical and business skill (see Figure 22).
0%
2%
4%
6%
8%
10%
12%
14%
16%
18%
BFM 1 BFM 2 BFM 3 BFM 4 BFM 5 BFM 6 BFM 7 BFM 8
12%
14%
12%
14%
12%
16% 16%
6%
8%
6%
8%
4%
10%
6%
11%
18%
I couldn't find a job elsewhere To try out a business idea
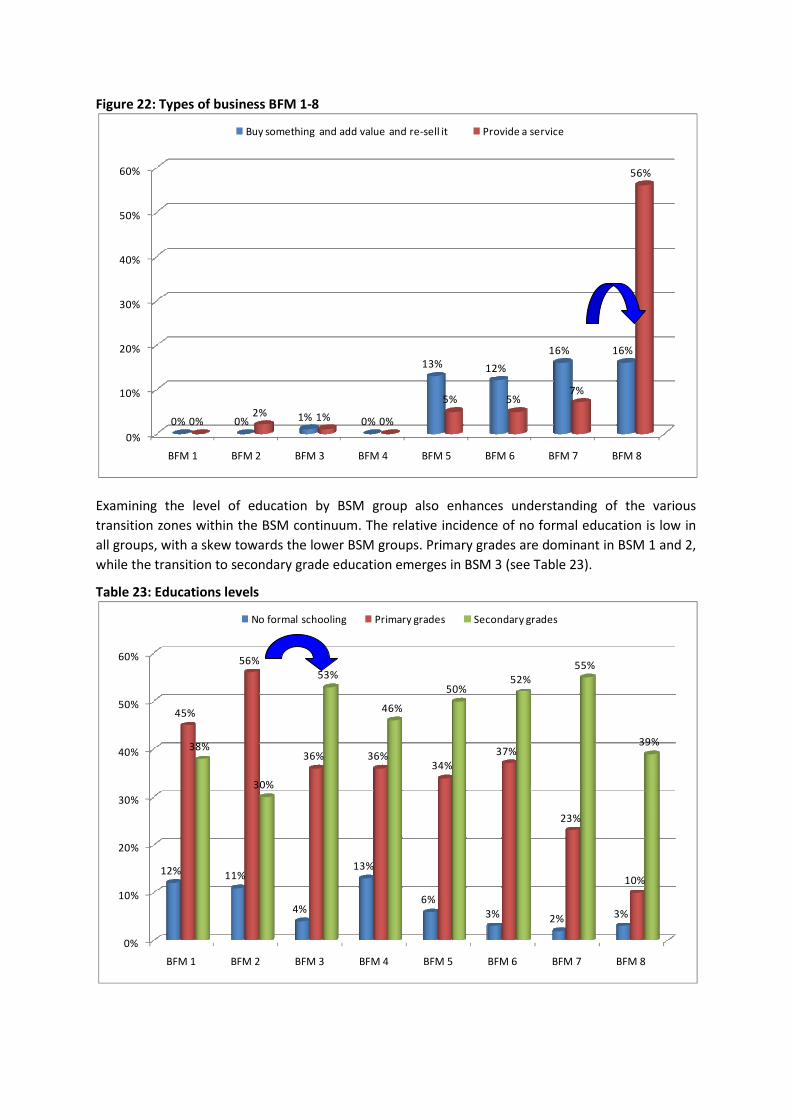
Figure 22: Types of business BFM 1-8
Examining the level of education by BSM group also enhances understanding of the various
transition zones within the BSM continuum. The relative incidence of no formal education is low in
all groups, with a skew towards the lower BSM groups. Primary grades are dominant in BSM 1 and 2,
while the transition to secondary grade education emerges in BSM 3 (see Table 23).
Table 23: Educations levels
0%
10%
20%
30%
40%
50%
60%
BFM 1 BFM 2 BFM 3 BFM 4 BFM 5 BFM 6 BFM 7 BFM 8
0% 0% 1% 0%
13% 12%
16% 16%
0%2% 1% 0%
5% 5%7%
56%
Buy something and add value and re-sell it Provide a service
0%
10%
20%
30%
40%
50%
60%
BFM 1 BFM 2 BFM 3 BFM 4 BFM 5 BFM 6 BFM 7 BFM 8
12% 11%
4%
13%
6%
3% 2% 3%
45%
56%
36% 36%34%
37%
23%
10%
38%
30%
53%
46%
50%52%
55%
39%
No formal schooling Primary grades Secondary grades
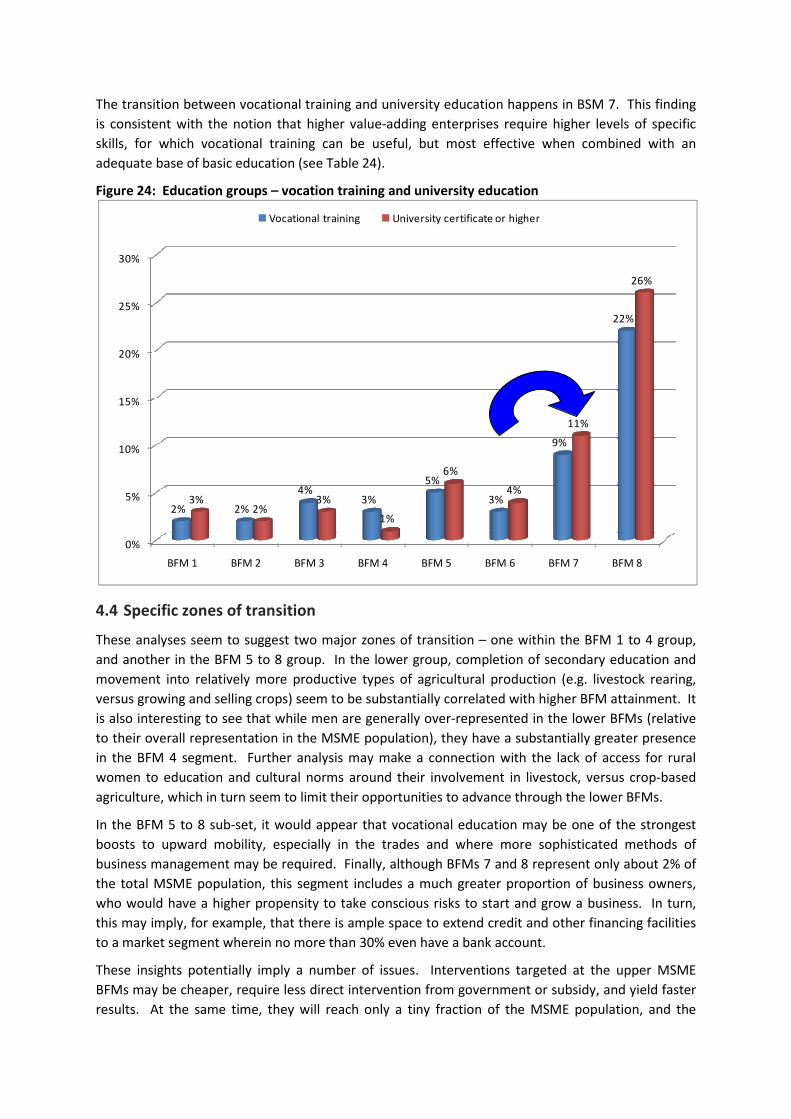
The transition between vocational training and university education happens in BSM 7. This finding
is consistent with the notion that higher value-adding enterprises require higher levels of specific
skills, for which vocational training can be useful, but most effective when combined with an
adequate base of basic education (see Table 24).
Figure 24: Education groups – vocation training and university education
4.4 Specific zones of transition
These analyses seem to suggest two major zones of transition – one within the BFM 1 to 4 group,
and another in the BFM 5 to 8 group. In the lower group, completion of secondary education and
movement into relatively more productive types of agricultural production (e.g. livestock rearing,
versus growing and selling crops) seem to be substantially correlated with higher BFM attainment. It
is also interesting to see that while men are generally over-represented in the lower BFMs (relative
to their overall representation in the MSME population), they have a substantially greater presence
in the BFM 4 segment. Further analysis may make a connection with the lack of access for rural
women to education and cultural norms around their involvement in livestock, versus crop-based
agriculture, which in turn seem to limit their opportunities to advance through the lower BFMs.
In the BFM 5 to 8 sub-set, it would appear that vocational education may be one of the strongest
boosts to upward mobility, especially in the trades and where more sophisticated methods of
business management may be required. Finally, although BFMs 7 and 8 represent only about 2% of
the total MSME population, this segment includes a much greater proportion of business owners,
who would have a higher propensity to take conscious risks to start and grow a business. In turn,
this may imply, for example, that there is ample space to extend credit and other financing facilities
to a market segment wherein no more than 30% even have a bank account.
These insights potentially imply a number of issues. Interventions targeted at the upper MSME
BFMs may be cheaper, require less direct intervention from government or subsidy, and yield faster
results. At the same time, they will reach only a tiny fraction of the MSME population, and the
0%
5%
10%
15%
20%
25%
30%
BFM 1 BFM 2 BFM 3 BFM 4 BFM 5 BFM 6 BFM 7 BFM 8
2% 2%
4%3%
5%
3%
9%
22%
3%2%
3%
1%
6%
4%
11%
26%
Vocational training University certificate or higher
potential employment generation benefits are somewhat unknown. At the other end of the
spectrum, the data implies the potential to reach great numbers of MSMEs among BFMs 1 through
4; but their very low levels of development and mainly rural setting will make reaching them much
more costly. At the same time, systemic approaches, such as general improvement in basic
education and ensuring that girls, in particular, benefit from basic educational efforts, combined
with improvements to basic infrastructure, especially roads and electricity, could yield meaningful
benefits for many MSMEs. However, in many cases it would probably be difficult to directly
attribute improvements in such systemic elements to changes in MSME performance.
5 Conclusions
The BFM offers public, private and donor stakeholders a targeted and nuanced approach to
delivering policy, support and services to the full range of MSMEs and large enterprises in Zambia.
In particular, the methodology should allow easier and more vigorous identification of those MSMEs
that show the greatest promise of growth and competitiveness in the short to medium term.
Similarly, the BFM has revealed differentiated areas where large enterprises themselves perceive the
greatest obstacles to their own improved prosperity.
The zone of transition analysis is a tale of two sub-sets. In the lower BFMs 1 to 4, comprising 77% of
all MSMEs in Zambia, the data shows that getting into secondary education and trading in higher
value adding agricultural enterprises can improve the lot of an MSME. It is also important to note
that some MSMEs in BFM 4, while tiny in number, have had or do have bank accounts, which
suggests that nuanced views of rural and agricultural markets can lead to improved service
extension.
BFM 5 enterprises, estimated at about 13% of businesses nationwide, represent the ‘sweet spot’ of
high potential in terms of the volume and quality of output, at reasonably low cost. This segment
suffers from generally low service penetration rates (e.g. for banking), but operates mostly in urban
areas, has a good basic educational background, and trades in a diversity of sectors. BFM 5 is the
first of the groups where an urban setting differentiates. The provincial skews are to Copperbelt and
Lusaka. In BFM 5 there is a much greater proportion of wholesaling, real estate, leasing and business
services, as well as manufacturing, running small shops, hotels and catering, finance, information
communication technology, and construction.
The dominant gender group is female in BFM 5. The majority in this segment claims to have ‘never
married’. The dominant ages are from 18 to 44 years, indicating an opportunity to focus on the
critical youth segment. And, the majority are Zambian citizens who hold a passport and a driver’s
license, which may offer inroads towards increased formal business registration and compliance.
In terms of perceived business obstacles, this group rates the general societal environment, business
infrastructure, and finance matters equally high, while putting markedly less emphasis on the legal
and regulatory environment. Although markedly more urban than their lower BFM counterparts,
60% of BFM 5 businesses are still in rural areas, confirming that this segmentation methodology
does not exclude rural enterprises, but instead encourages a national spread, albeit with the
probable rural component focussing on the fringe towns of Lusaka and Copperbelt provinces and
their neighbouring locales, as well as potentially along the line of rail.
About 80% of BFM 5s do not have or do not use electricity in their businesses. Further mapping
between access to and usage of energy and the predominant sectors in this segment may identify
targeted areas where electrification may yield above average returns to business productivity.
Eighty-eight percent of the BFM 5 segment does not have a bank account. Among their peers along
the MSME BFM continuum, they are ranked third, behind BFMs 6 and 7, in terms of the perceived
severity of this constraint. Several characteristics of this segment would indicate that many would
fall in the more easily achieved market enablement zone5, in respect of financial service access, and
therefore could be reached more easily and quickly than lower segments. For example, education
levels are generally good, with more than 50% having a secondary or more education, which, in turn,
would minimise the need to offer multi-lingual services. Many more of them are located in urban or
peri-urban areas, which should lower the physical access barriers that so many rural enterprises
face. Only about a third of BFM 5s have a cellphone, but slightly better positioning and pricing may
tip the value proposition for these businesses, which tend to predominate in the wholesale and
retail sectors, where not only quick, cheap, and effective communication can provide a competitive
edge, but also where fast and safe money transfer may be a priority.
Of course, the 13% of all MSMEs found in BFM 5 cannot comprise the entirety of outreach to the
MSME sector. Seventy-seven percent of the MSME market lies in the lower BFMs, and they need a
wide range of policy, product, and service improvements to enhance their prospects for survival, not
to mention growth and competitiveness. Nonetheless, interventions in these lower segments will
likely cost more and take longer to show any results. Many of the problems plaguing business
performance in the lower echelons extend beyond the commercial realm – including low levels of
education, or poor access to basic infrastructure. Such obstacles will require systemic, cross-sectoral,
and cross-ministerial cooperation and solutions, and thus will command greater depth and breadth
of resource commitments.
Enterprises in the much smaller BFM 6, 7, and 8 segments comprise a robust, but still largely
untapped market. For example, about 79% of enterprises in these segments have no bank account.
Their general profile – relatively more urbanised, better educated, into value-adding businesses –
should make them excellent candidates for quick and relatively light and less expensive
interventions that could leverage substantial outcomes, both for the enterprises themselves, as well
as for those providing new services to them.
The BFM tool may prove useful among larger businesses, too, in helping to optimise their
performance. The stratification of their perceived obstacles to doing business uncovered the most
useful insights. BFM 9s saw tax administration and cost of finance as the most serious barriers. BFM
10 enterprises most highly ranked an inadequately educated workforce and customs and trade
regulations. BFM 11 businesses saw crime, theft, disorder and corruption as the most severe
problems. And BFM 12 entities ranked the macroeconomic environment and tax rates as their two
most important challenges.
These highly differentiated issues help to set a clear agenda for action. Coupled with the
descriptions of each of these four upper BFMs, key stakeholders and support agencies may target
specific audiences, perhaps through widely used business associations and public forums that large
enterprises claim to use and value. Such dialogue should focus on these priority issues, which, in
turn should lead to the most efficient and effective delivery of policy or commercial change in the
short to medium term.
5 The market enablement zone includes those businesses that are within reach of the market, given the
parameters of an existing product, but do not currently have the product. This zone can be further sub-
segmented into those enterprises that actively choose not to have a product, and therefore lie beyond the
natural limits of the market, and those that have not yet purchased the product but are candidates for doing
so.

Many of the most important large business challenges, like taxes, customs and trade regulations,
and the macroeconomic environment, would require government leadership and direct
involvement. Yet others, such as a better educated workforce, the cost of finance, and even crime,
theft and disorder, may open opportunities for private sector leadership, in a cooperative stance
with government. For example, the data seems to show substantial improvements in business
performance, between those having a vocational qualification and those without one. Such insights
may open the market for private training institutions, operating under clearly defined and
transparently enforced national standards.
6 Annex 1: Variables used in developing the small
business BFM
Variable Sector
Question What sector does the business mainly operate in?
Possible responses
• Agricultural production, including aquaculture (fish farming), forest
production
• Wild fishing
• Mining and excavation
• Manufacturing, including processing of agricultural, fishery and
forest
• Electricity, gas and water
• Construction
• Wholesale and/or retail trade including agricultural, fishery and
forest
• Car, motorcycle and household goods repair
• Hotels, catering, food and beverages
• Transportation and storage
• Information communication technology
• Finance
• Real estate, leasing and business services
• Health services
• Other
Variable Add value
Question What does the business do?
Possible responses
• Buy something and re-sell it
• Buy something and add value and re-sell it (e.g. cooking, drying,
sewing, packaging, repairing)
• Grow something and sell it
• Breed/rear something and sell it
• Make something and sell it
• Gather something and sell it (e.g. fish, wood)
• Provide a service
• Other
Variable Premises type
Question On what basis does the business occupy the premises/land?
Possible responses
• I/my partner/the business owns the premises/land
• A family member/s owns the premises/land
• Premises/land are rented
• Premises/land are just used or occupied
Variable Tenure
Question Where does the business mainly operate from?
Possible responses
• Home (e.g. room, garage, kantemba within household premises)
• Farm
• Formal business premises (e.g. office, business complex,
factory/plant, shop, industrial estate, formal market)
• Informal premises (e.g. informal market-place,
street/footpath/open space, vehicle, container, no fixed location)
• Other
Variable Equipment
Question Thinking about the business, which of the following items and assets (in
working order
Possible responses
• Motor vehicle for company use
• Fax machine
• Photocopier
• Cash register/till
• Calculator
• Storage space for business
• Safe place for keeping cash/vault
• Credit card machine
• Factory machinery
• Tractor
• Hammer mill
• Treddle pump
• Oxen
• Ox-cart
• Plough
• Hoe
• None of these
Variable Shareholders
Question Can you tell me which of the following people or organisations are
shareholders of the business?
Possible responses
• You
• Your family
• Private domestic (local) individuals, companies or organisations
• Private foreign individuals, companies or organisations
• Government/state
• Other
Variable Financials
Question Do you keep up to date financial accounts for the business?
Possible responses
• Yes
• No
• No response
Variable Audit
Question Are these financial records audited every year?
Possible responses
• Yes
• No
• No response
Variable Export
Question Does the business export its products/services?
Possible responses
• Yes
• No
• No response
Variable Credit
Question Does the business currently provide its customers with goods or services on
credit?
Possible responses
• Yes
• No
• No response
Variable Taxes
Question Which of these, if any, does the business pay?
Possible responses
• Income tax
• Land and building tax
• Turnover tax
• VAT (Value Added Tax)
• PAYE (Pay As You Earn)
• Pension ( e.g. NAPSA)
• Customs.
• Other government taxes/levies
• Unofficial levies by government officials
Variable Banked
Question Interviewer classification of respondent as “banked” or “not banked”.
Possible responses
• Yes
• No
• No response
Variable Loans
Question Where did you get the money to set up or take over the business?
Possible responses
• Loan from bank
• Loan from microfinance institution (MFI)
• Loan from a building society
• Loan from other financial institution
• Loan from government
• Loan from donor / NGO
• Other
Variable Insured
Question Does the business currently have any insurance product / policy?
Possible responses
• Yes
• No
• No response
Variable PACRO
Question Is the business registered with the Patents and Company Registrar (PACRO), or
other government institution responsible for commercial registration?
Possible responses
• Yes
• No
• No response
Variable Agriculture sector
Question What agricultural processing activities is the business involved in?
Possible responses
• Crop growing/production
• Animal/livestock rearing/production
• Fish production, fish farming
• Forestry production
• Other
Variable Tax identification number
Question Does the business have a tax identification number (TPIN) from the Zambia
Revenue Authority?
Possible responses
• Yes
• No
• No response
Variable Agricultural processing
Question What agricultural processing activities is the business involved in?
• Milling
• Drying
• Burning (e.g. charcoal)
• Skinning
• Butchering
• Cooking/food processing
• Bottling/packaging
• Logging
• Oil extracting/distilling
• Refining
• Other
Variable Business measurement
Question Is the performance of the business monitored/measured in any way?
Possible responses
• Yes
• No
• No response
Variable Computers
Question Does the business own or have access to a computer/s for the business?
Possible responses
• Yes
• No
• No response
Variable Illness
Question Is absenteeism due to illness a significant obstacle to the current operations of
the business?
Possible responses
• Yes
• No
• No response
Variable Family
Question Of the total workforce, how many family members of the owner are currently
employed in the business?
Possible responses
This variable was split to indicate if any (or no) other family was employed by
the business.
7 Annex 2 – Detailed descriptions of BFMs 1 to 8
BFM 1 (32% of all MSMEs)
The BFM 1 group, the largest of all eight MSME BFM segments and comprising 32% of all MSMEs,
tends to be rural in the Western, Eastern and to a lesser extent Central and Luapula provinces, and
located on a plot.
They are typically involved in agricultural production, wild fishing, manufacturing and selling
household cleaning products, making table cloths and other items.
They tend to be male in the 40 year and above age groups. Their means of identification tends to be
some written documentation from the Chief or they have no form of identification. To a lesser
extent they have National Registration Cards (NRC). Some of this group are not Zambian citizens.
In terms of marital status, this group has married people as well as widowed and separated
individuals.
BFM 2 (8% of all MSMEs)
BFM 2, making up 8% of the MSME population, also tends to be rural and living in the Luapula,
Northern and Eastern provinces. They are involved in agricultural production, construction and
manufacturing and selling household cleaning products. They tend to be male, who are never
married, widowed or separated. The majority are in the 30 to 49 year old categories.
They tend to be Zambian citizens who have a NRC.
BFM 3 (21% of all MSMEs)
BFM 3, the second largest single MSME BFM segment at 21% of the sample, is also a predominantly
rural group in the Northern, Western and North Western, Central and to lesser extent Southern
provinces. This group tends to be male and is predominantly married. They tend to be in the
younger age group of 18 to 39 years old. They are Zambian citizens who have a NRC or can produce
written documentation from the Chief.
The business sectors they are involved in tend to be agricultural production, mining and excavation,
electricity, manufacturing and selling household cleaning products, retailing vegetables at the
market, brewing local beer.
BFM 4 (11% of all MSMEs)
This is the final BFM group where rural settings dominate. However, the individuals are still
predominantly involved in agricultural production. The dominant provinces are Southern, Eastern
and Luapula. Married males aged 30 years and older dominate. A driver licence is a differentiating
factor as well as being a Zambian citizen.
BFM 5 (13% of all MSMEs)
BFM 5 is the first of the groups where urban setting differentiates. The provincial skews are to
Copperbelt and Lusaka. A range of businesses differentiate this group from previous BFM groups,
namely wholesaling, real estate, leasing and business services, as well as manufacturing, running
small shops, hotels and catering, finance, information communication technology and construction.

The dominant gender group is female. There is no particular marital status that differentiates this
group, although the majority is ‘never married’. The dominant ages are from 18 to 44 years.
The majority are Zambian citizens who hold a passport and a driver’s license.
BFM 6 (8% of all MSMEs)
This BFM group is also dominated by females, the majority of whom claim to be ‘never married’,
widowed, separated or divorced. They are living in urban areas and in the provinces of Lusaka,
Southern, Copperbelt and to a lesser extent Luapula. Age groups are similar to those in BFM 5; in
fact there are quite a few similarities in the predominately urban BFM groups.
In terms of the business sectors, wholesale trade is the biggest discriminator followed by hotels,
catering, food and beverages. Transport and storage businesses and construction and manufacturing
are also important. After these, a long list of other business sectors follows, indicating the diversity
of the group. Most claim to be Zambian citizens who have a passport.
BFM 7 (7% of all MSMEs)
BFM 7 are another urban group in the provinces of Lusaka, Copperbelt, Southern and Northwest.
They are predominantly urban and female. Although they come from all age groups under 50, the
dominant group is found in the 25 to 29 year age group. They are ‘never married’ or divorced.
Wholesale trade is dominant in this group along with salons, raising chickens and the hardware
trade. Other businesses include sewing, buying and selling kerosene, retailing vegetables at the
market, selling water, running a studio plaiting hair, selling wigs and cosmetics, and selling new
clothes.
BFM 8 (1% of all MSMEs)
BFM 8 is typically urban in the Lusaka and Central provinces. The business sectors tend to be hotels,
catering, food and beverages, manufacturing, construction, car motorcycle and household goods
repair, transportation and storage, information communication technology, finance, health services
and a host of ‘other’ fields.
There is a skew towards female rather than male in this group. In terms of marital status, they tend
to be divorced, separated, widowed or living together/cohabiting. They are more likely to be 25 to
49 years of age.
They are more likely than other groups to have a driver’s license and a passport. There are more
non-Zambians in this group.
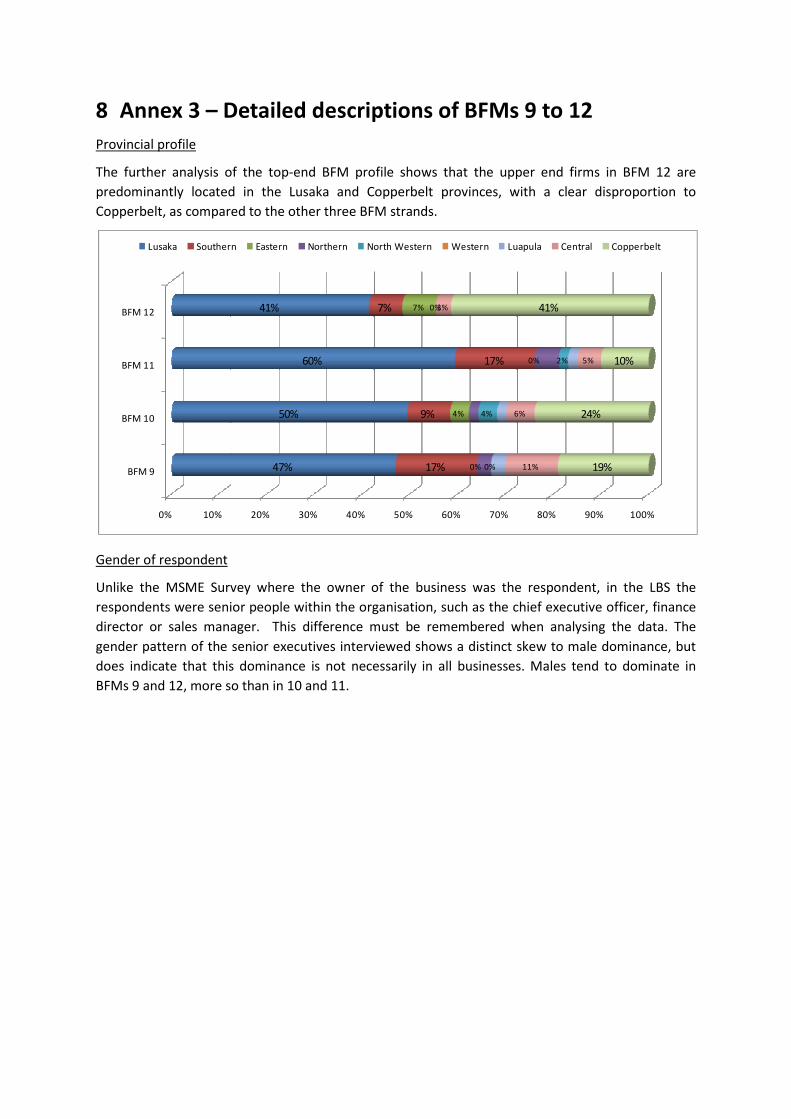
8 Annex 3 – Detailed descriptions of BFMs 9 to 12
Provincial profile
The further analysis of the top-end BFM profile shows that the upper end firms in BFM 12 are
predominantly located in the Lusaka and Copperbelt provinces, with a clear disproportion to
Copperbelt, as compared to the other three BFM strands.
Gender of respondent
Unlike the MSME Survey where the owner of the business was the respondent, in the LBS the
respondents were senior people within the organisation, such as the chief executive officer, finance
director or sales manager. This difference must be remembered when analysing the data. The
gender pattern of the senior executives interviewed shows a distinct skew to male dominance, but
does indicate that this dominance is not necessarily in all businesses. Males tend to dominate in
BFMs 9 and 12, more so than in 10 and 11.
0% 10% 20% 30% 40% 50% 60% 70% 80% 90% 100%
BFM 9
BFM 10
BFM 11
BFM 12
47%
50%
60%
41%
17%
9%
17%
7%
0%
4%
0%
7%
0%
4%
2%
0%
11%
6%
5%
3%
19%
24%
10%
41%
Lusaka Southern Eastern Northern North Western Western Luapula Central Copperbelt
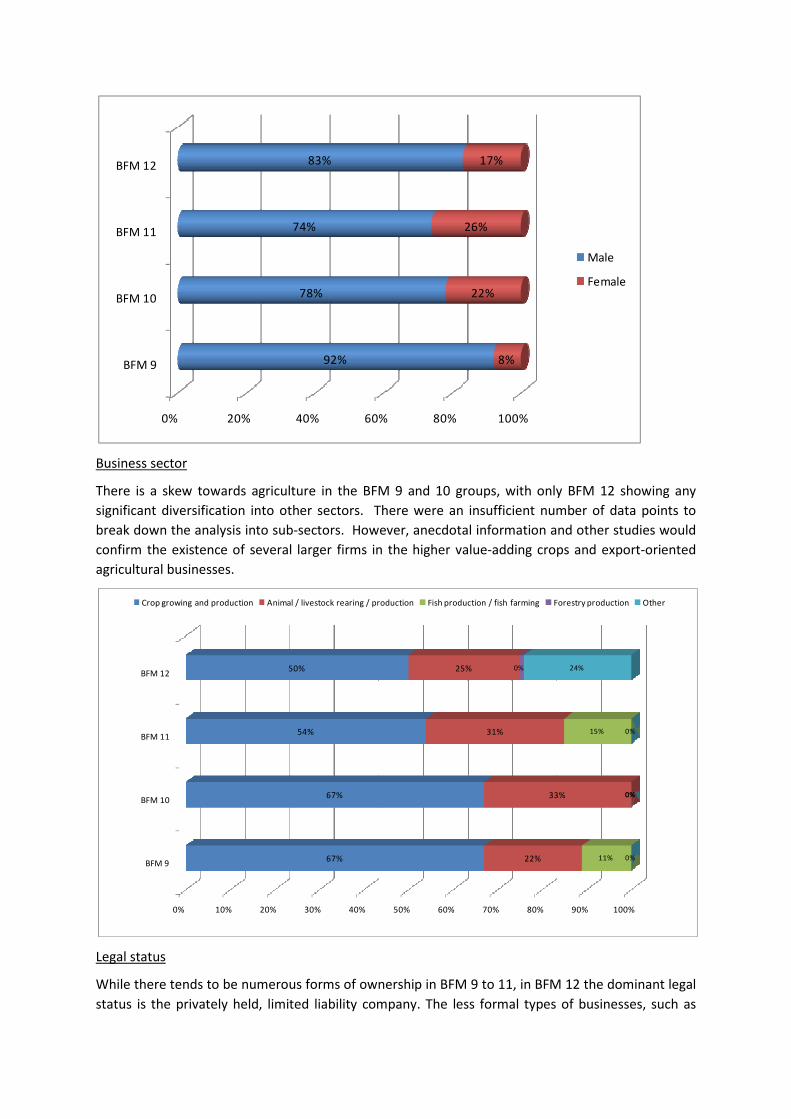
Business sector
There is a skew towards agriculture in the BFM 9 and 10 groups, with only BFM 12 showing any
significant diversification into other sectors. There were an insufficient number of data points to
break down the analysis into sub-sectors. However, anecdotal information and other studies would
confirm the existence of several larger firms in the higher value-adding crops and export-oriented
agricultural businesses.
Legal status
While there tends to be numerous forms of ownership in BFM 9 to 11, in BFM 12 the dominant legal
status is the privately held, limited liability company. The less formal types of businesses, such as
0% 20% 40% 60% 80% 100%
BFM 9
BFM 10
BFM 11
BFM 12
92%
78%
74%
83%
8%
22%
26%
17%
Male
Female
0% 10% 20% 30% 40% 50% 60% 70% 80% 90% 100%
BFM 9
BFM 10
BFM 11
BFM 12
67%
67%
54%
50%
22%
33%
31%
25%
11%
0%
15%
0%
0%
0%
0%
24%
Crop growing and production Animal / livestock rearing / production Fish production / fish farming Forestry production Other
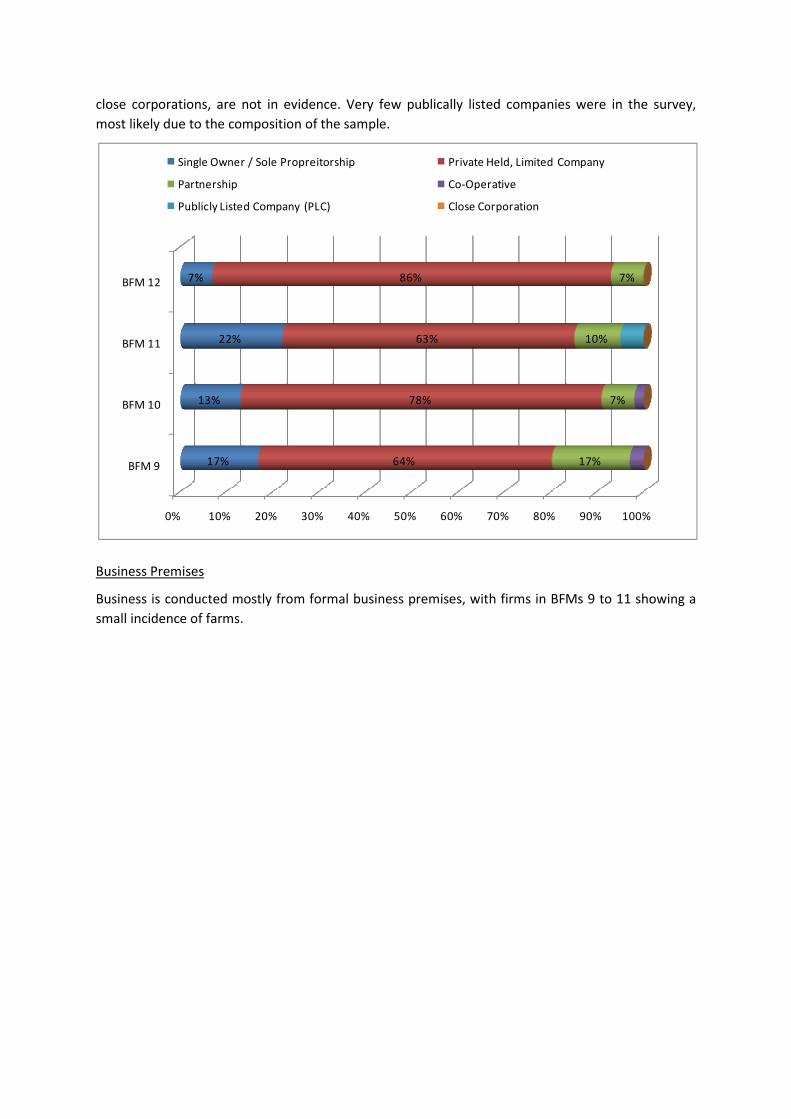
close corporations, are not in evidence. Very few publically listed companies were in the survey,
most likely due to the composition of the sample.
Business Premises
Business is conducted mostly from formal business premises, with firms in BFMs 9 to 11 showing a
small incidence of farms.
0% 10% 20% 30% 40% 50% 60% 70% 80% 90% 100%
BFM 9
BFM 10
BFM 11
BFM 12
17%
13%
22%
7%
64%
78%
63%
86%
17%
7%
10%
7%
Single Owner / Sole Propreitorship Private Held, Limited Company
Partnership Co-Operative
Publicly Listed Company (PLC) Close Corporation
Ownership of premises
Most of the premises are owned with a slight skew in rental properties in BFM 10.
0% 10% 20% 30% 40% 50% 60% 70% 80% 90% 100%
BFM 9
BFM 10
BFM 11
BFM 12
14%
9%
7%
3%
86%
91%
93%
97%
Farm Formal Premises
0% 20% 40% 60% 80% 100%
BFM 9
BFM 10
BFM 11
BFM 12
78%
65%
74%
79%
22%
35%
26%
21%
Owned Rented
Main source of energy
The main source of energy is the national grid for the majority of large businesses, with a skew
towards generators in BFM 9.
Internet usage
Based on those who claim to have access to the internet, the usage patterns do not vary widely
within the BFM groups.
86% 88% 90% 92% 94% 96% 98% 100%
BFM 9
BFM 10
BFM 11
BFM 12
92%
98%
98%
100%
6%
2%
2%
0%
3%
0%
0%
0%
Electricity - Public grid Electricity - Generator Solar Energy
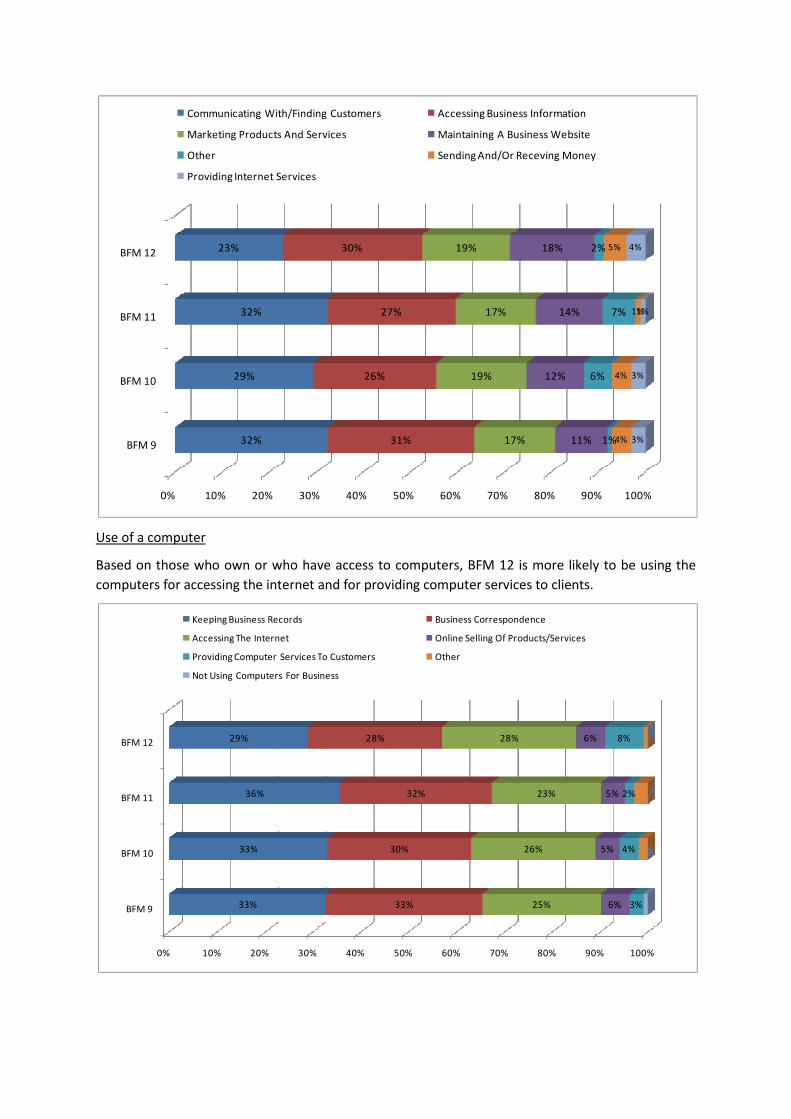
Use of a computer
Based on those who own or who have access to computers, BFM 12 is more likely to be using the
computers for accessing the internet and for providing computer services to clients.
0% 10% 20% 30% 40% 50% 60% 70% 80% 90% 100%
BFM 9
BFM 10
BFM 11
BFM 12
32%
29%
32%
23%
31%
26%
27%
30%
17%
19%
17%
19%
11%
12%
14%
18%
1%
6%
7%
2%
4%
4%
1%
5%
3%
3%
1%
4%
Communicating With/Finding Customers Accessing Business Information
Marketing Products And Services Maintaining A Business Website
Other Sending And/Or Receving Money
Providing Internet Services
0% 10% 20% 30% 40% 50% 60% 70% 80% 90% 100%
BFM 9
BFM 10
BFM 11
BFM 12
33%
33%
36%
29%
33%
30%
32%
28%
25%
26%
23%
28%
6%
5%
5%
6%
3%
4%
2%
8%
Keeping Business Records Business Correspondence
Accessing The Internet Online Selling Of Products/Services
Providing Computer Services To Customers Other
Not Using Computers For Business
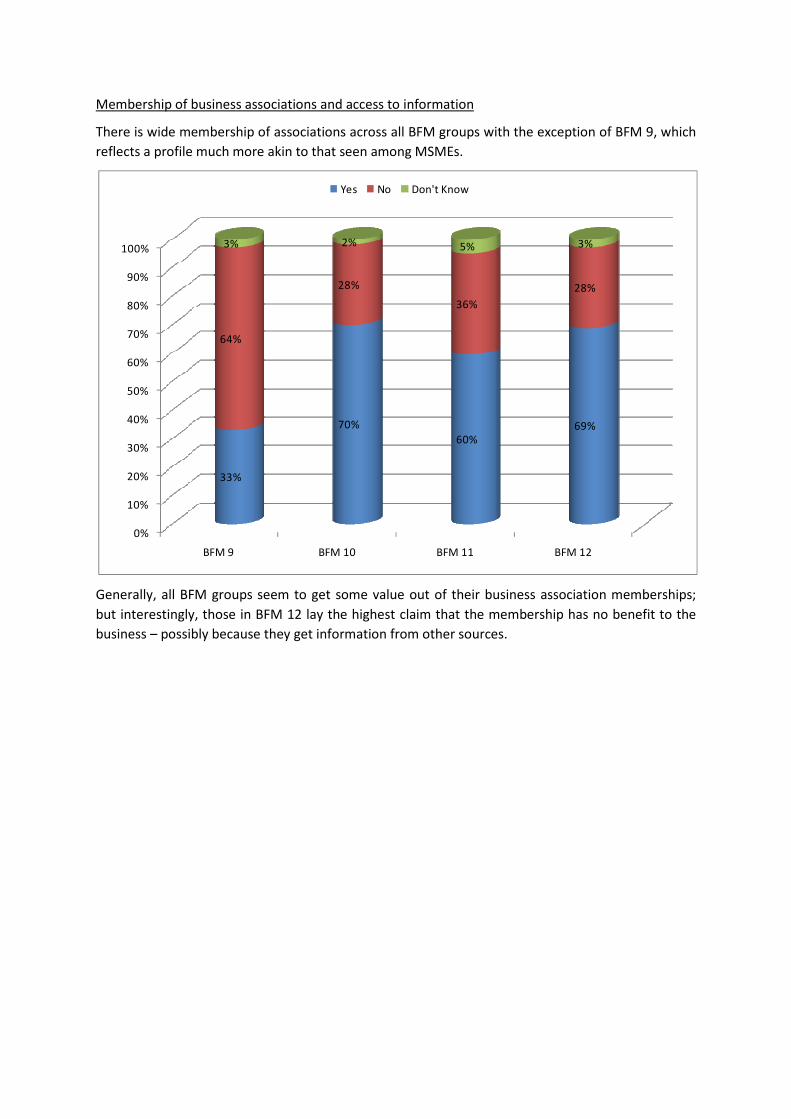
Membership of business associations and access to information
There is wide membership of associations across all BFM groups with the exception of BFM 9, which
reflects a profile much more akin to that seen among MSMEs.
Generally, all BFM groups seem to get some value out of their business association memberships;
but interestingly, those in BFM 12 lay the highest claim that the membership has no benefit to the
business – possibly because they get information from other sources.
0%
10%
20%
30%
40%
50%
60%
70%
80%
90%
100%
BFM 9 BFM 10 BFM 11 BFM 12
33%
70%
60%
69%
64%
28%
36%
28%
3% 2% 5% 3%
Yes No Don't Know
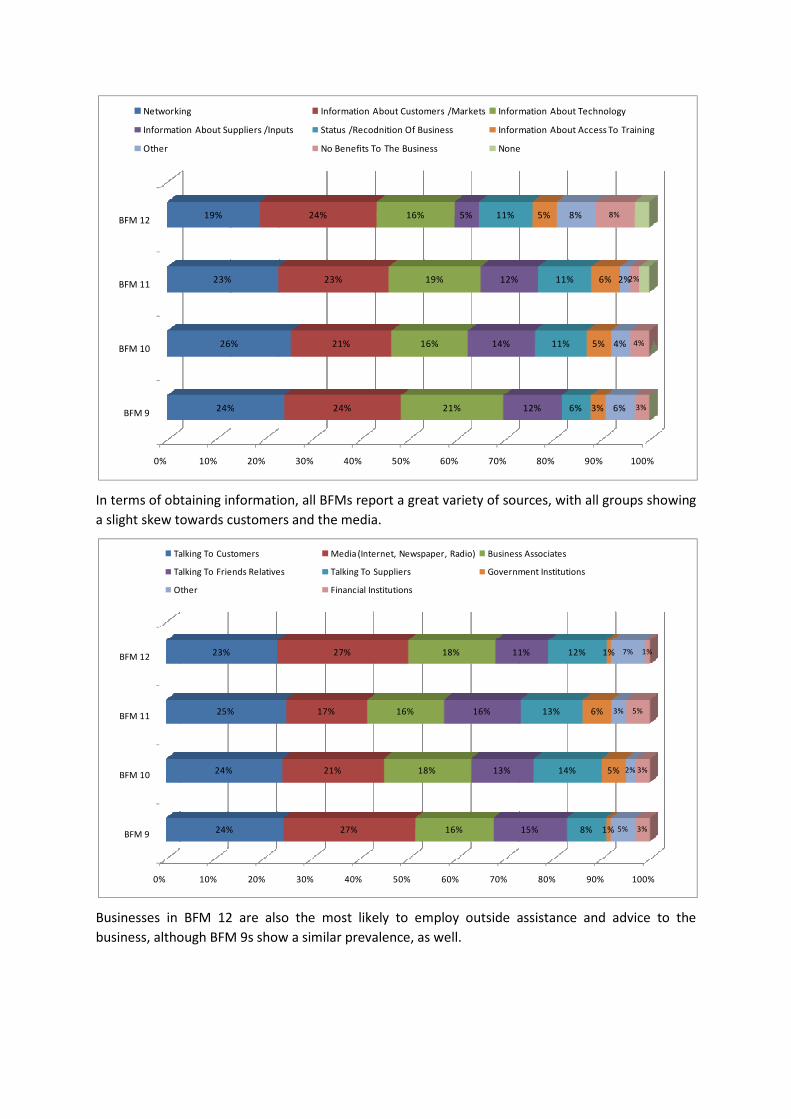
In terms of obtaining information, all BFMs report a great variety of sources, with all groups showing
a slight skew towards customers and the media.
Businesses in BFM 12 are also the most likely to employ outside assistance and advice to the
business, although BFM 9s show a similar prevalence, as well.
0% 10% 20% 30% 40% 50% 60% 70% 80% 90% 100%
BFM 9
BFM 10
BFM 11
BFM 12
24%
26%
23%
19%
24%
21%
23%
24%
21%
16%
19%
16%
12%
14%
12%
5%
6%
11%
11%
11%
3%
5%
6%
5%
6%
4%
2%
8%
3%
4%
2%
8%
Networking Information About Customers /Markets Information About Technology
Information About Suppliers /Inputs Status /Recodnition Of Business Information About Access To Training
Other No Benefits To The Business None
0% 10% 20% 30% 40% 50% 60% 70% 80% 90% 100%
BFM 9
BFM 10
BFM 11
BFM 12
24%
24%
25%
23%
27%
21%
17%
27%
16%
18%
16%
18%
15%
13%
16%
11%
8%
14%
13%
12%
1%
5%
6%
1%
5%
2%
3%
7%
3%
3%
5%
1%
Talking To Customers Media (Internet, Newspaper, Radio) Business Associates
Talking To Friends Relatives Talking To Suppliers Government Institutions
Other Financial Institutions
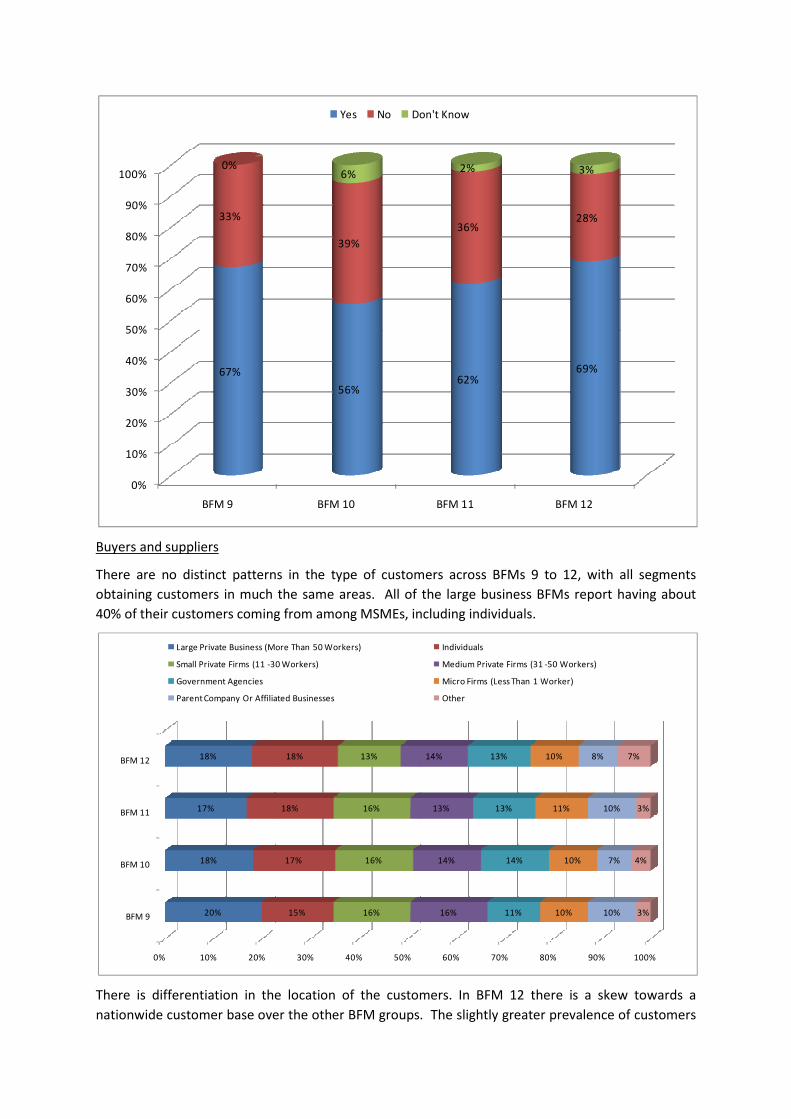
Buyers and suppliers
There are no distinct patterns in the type of customers across BFMs 9 to 12, with all segments
obtaining customers in much the same areas. All of the large business BFMs report having about
40% of their customers coming from among MSMEs, including individuals.
There is differentiation in the location of the customers. In BFM 12 there is a skew towards a
nationwide customer base over the other BFM groups. The slightly greater prevalence of customers
0%
10%
20%
30%
40%
50%
60%
70%
80%
90%
100%
BFM 9 BFM 10 BFM 11 BFM 12
67%
56%62%
69%
33%
39%
36%28%
0%6%
2% 3%
Yes No Don't Know
0% 10% 20% 30% 40% 50% 60% 70% 80% 90% 100%
BFM 9
BFM 10
BFM 11
BFM 12
20%
18%
17%
18%
15%
17%
18%
18%
16%
16%
16%
13%
16%
14%
13%
14%
11%
14%
13%
13%
10%
10%
11%
10%
10%
7%
10%
8%
3%
4%
3%
7%
Large Private Business (More Than 50 Workers) Individuals
Small Private Firms (11 -30 Workers) Medium Private Firms (31 -50 Workers)
Government Agencies Micro Firms (Less Than 1 Worker)
Parent Company Or Affiliated Businesses Other
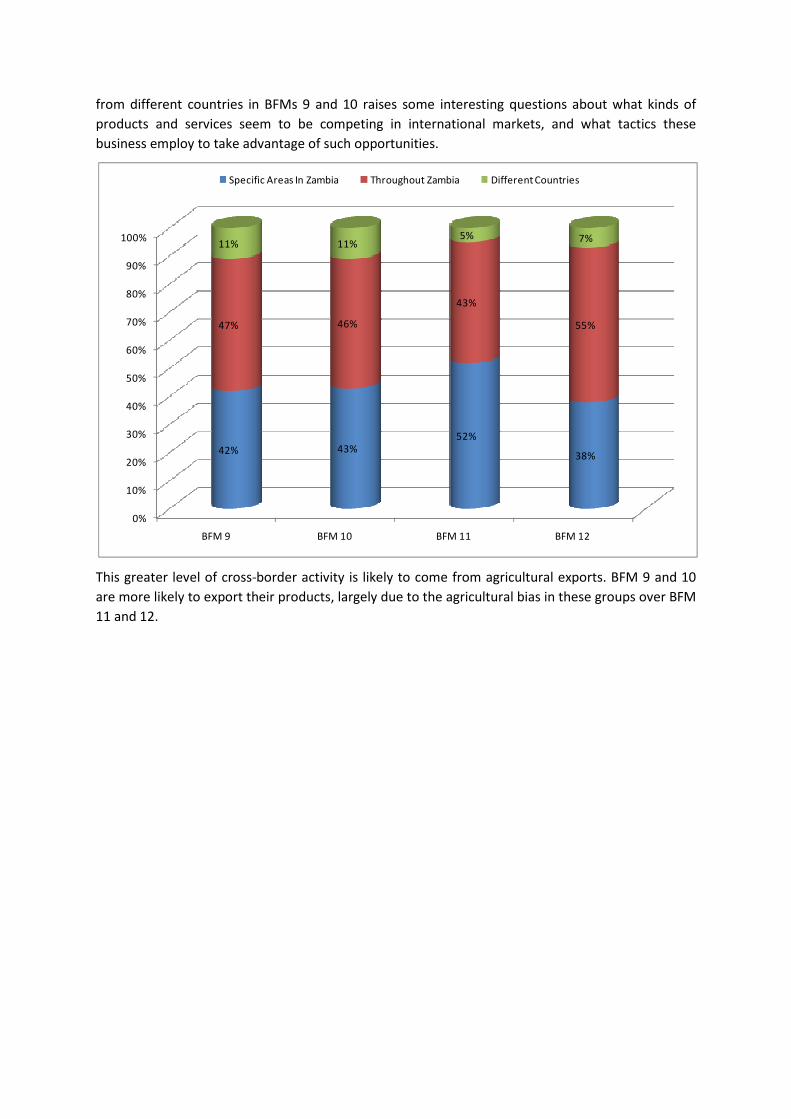
from different countries in BFMs 9 and 10 raises some interesting questions about what kinds of
products and services seem to be competing in international markets, and what tactics these
business employ to take advantage of such opportunities.
This greater level of cross-border activity is likely to come from agricultural exports. BFM 9 and 10
are more likely to export their products, largely due to the agricultural bias in these groups over BFM
11 and 12.
0%
10%
20%
30%
40%
50%
60%
70%
80%
90%
100%
BFM 9 BFM 10 BFM 11 BFM 12
42% 43%
52%
38%
47% 46%
43%
55%
11% 11%5% 7%
Specific Areas In Zambia Throughout Zambia Different Countries
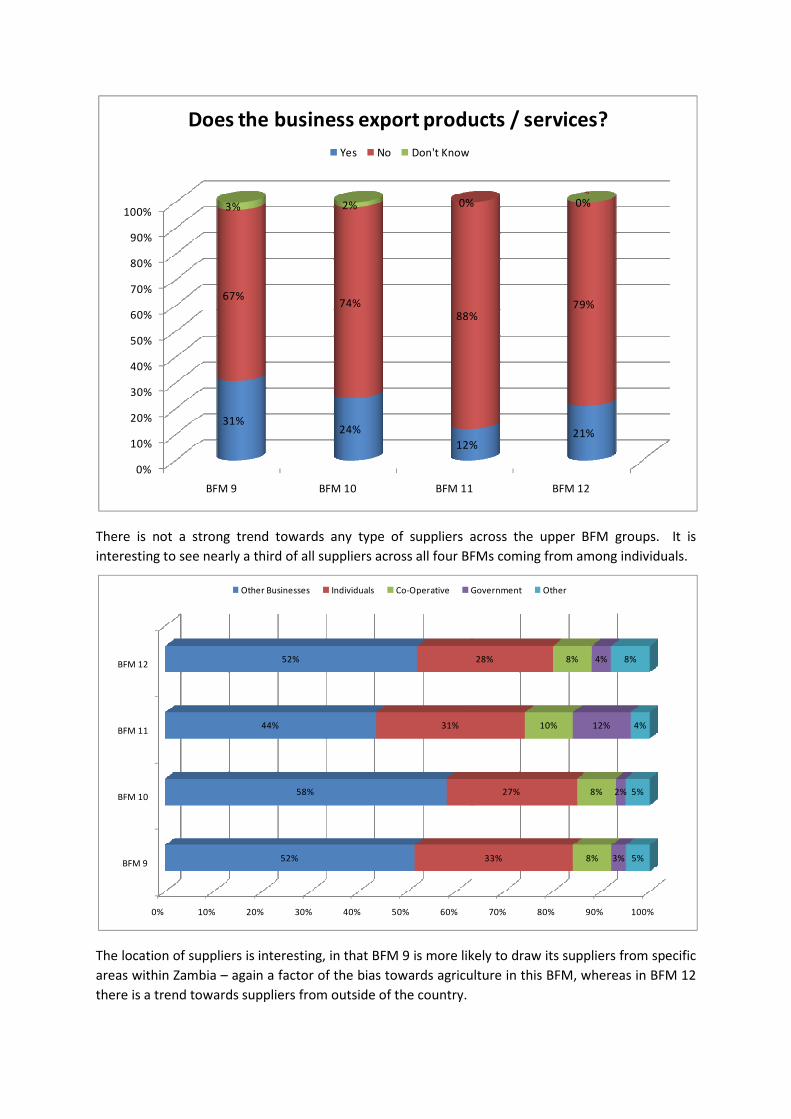
There is not a strong trend towards any type of suppliers across the upper BFM groups. It is
interesting to see nearly a third of all suppliers across all four BFMs coming from among individuals.
The location of suppliers is interesting, in that BFM 9 is more likely to draw its suppliers from specific
areas within Zambia – again a factor of the bias towards agriculture in this BFM, whereas in BFM 12
there is a trend towards suppliers from outside of the country.
0%
10%
20%
30%
40%
50%
60%
70%
80%
90%
100%
BFM 9 BFM 10 BFM 11 BFM 12
31%24%
12%21%
67%74%
88%79%
3% 2% 0% 0%
Does the business export products / services?
Yes No Don't Know
0% 10% 20% 30% 40% 50% 60% 70% 80% 90% 100%
BFM 9
BFM 10
BFM 11
BFM 12
52%
58%
44%
52%
33%
27%
31%
28%
8%
8%
10%
8%
3%
2%
12%
4%
5%
5%
4%
8%
Other Businesses Individuals Co-Operative Government Other
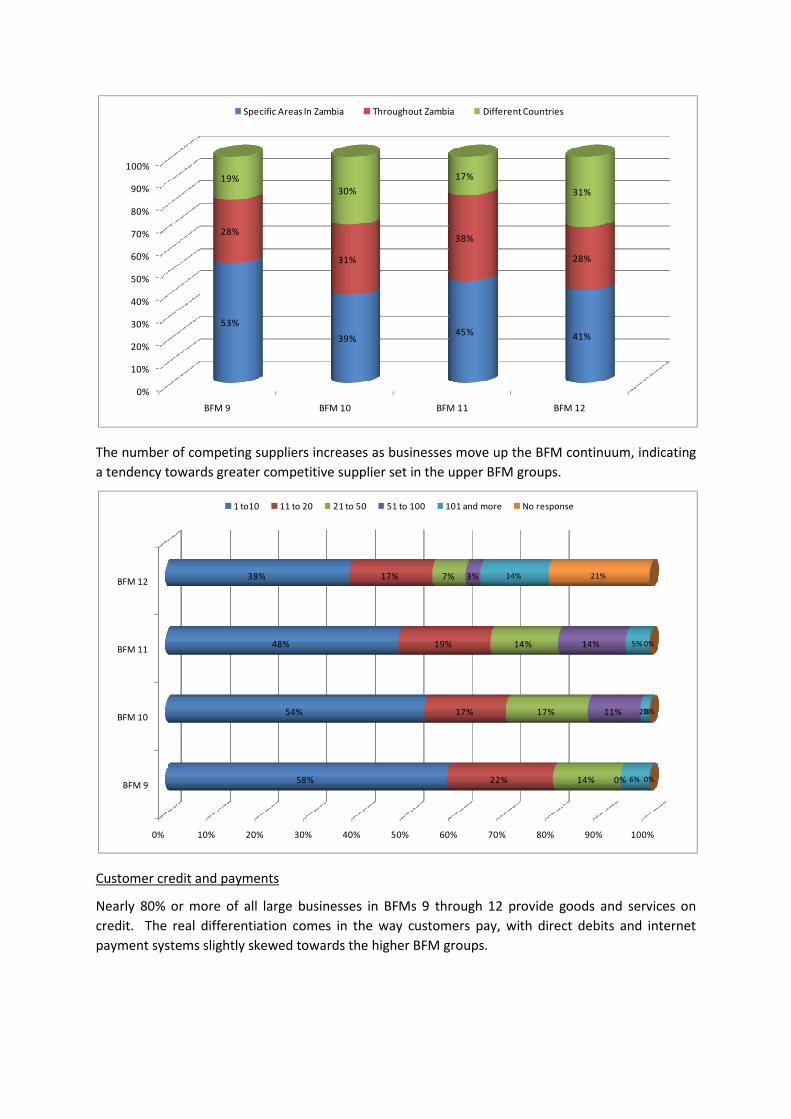
The number of competing suppliers increases as businesses move up the BFM continuum, indicating
a tendency towards greater competitive supplier set in the upper BFM groups.
Customer credit and payments
Nearly 80% or more of all large businesses in BFMs 9 through 12 provide goods and services on
credit. The real differentiation comes in the way customers pay, with direct debits and internet
payment systems slightly skewed towards the higher BFM groups.
0%
10%
20%
30%
40%
50%
60%
70%
80%
90%
100%
BFM 9 BFM 10 BFM 11 BFM 12
53%
39%45% 41%
28%
31%
38%
28%
19%
30%
17%
31%
Specific Areas In Zambia Throughout Zambia Different Countries
0% 10% 20% 30% 40% 50% 60% 70% 80% 90% 100%
BFM 9
BFM 10
BFM 11
BFM 12
58%
54%
48%
38%
22%
17%
19%
17%
14%
17%
14%
7%
0%
11%
14%
3%
6%
2%
5%
14%
0%
0%
0%
21%
1 to10 11 to 20 21 to 50 51 to 100 101 and more No response
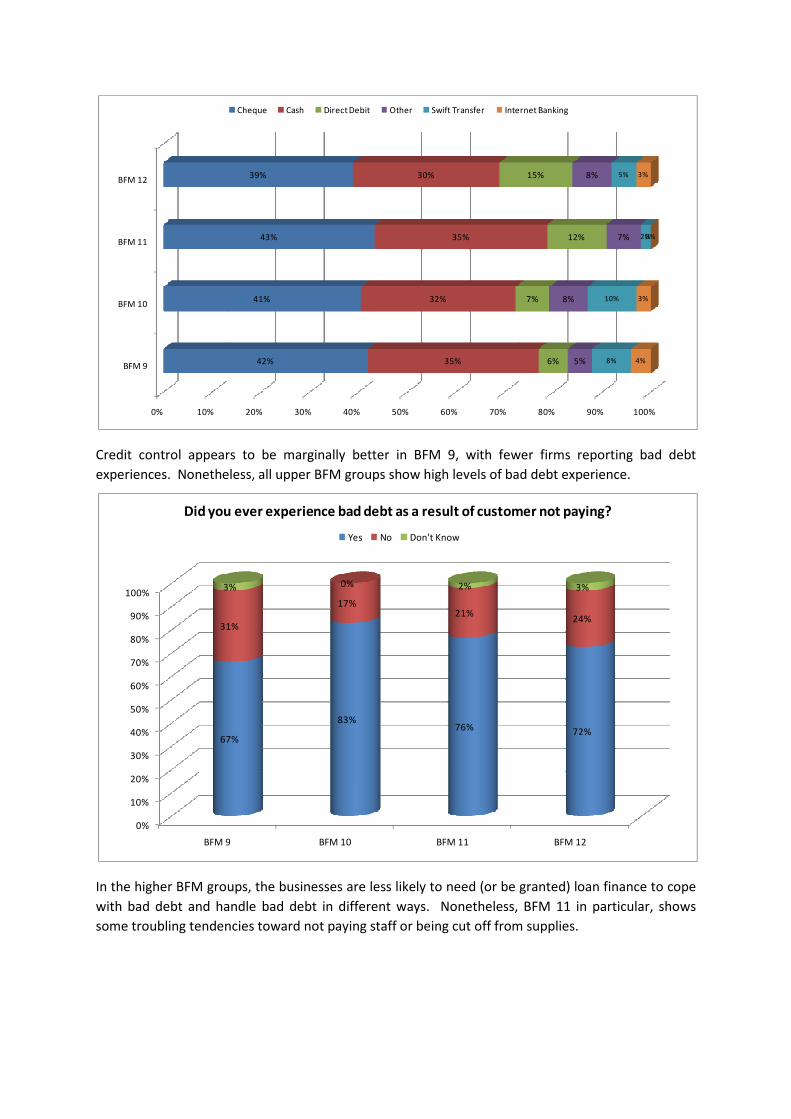
Credit control appears to be marginally better in BFM 9, with fewer firms reporting bad debt
experiences. Nonetheless, all upper BFM groups show high levels of bad debt experience.
In the higher BFM groups, the businesses are less likely to need (or be granted) loan finance to cope
with bad debt and handle bad debt in different ways. Nonetheless, BFM 11 in particular, shows
some troubling tendencies toward not paying staff or being cut off from supplies.
0% 10% 20% 30% 40% 50% 60% 70% 80% 90% 100%
BFM 9
BFM 10
BFM 11
BFM 12
42%
41%
43%
39%
35%
32%
35%
30%
6%
7%
12%
15%
5%
8%
7%
8%
8%
10%
2%
5%
4%
3%
0%
3%
Cheque Cash Direct Debit Other Swift Transfer Internet Banking
0%
10%
20%
30%
40%
50%
60%
70%
80%
90%
100%
BFM 9 BFM 10 BFM 11 BFM 12
67%
83%76% 72%
31%
17%21%
24%
3% 0% 2% 3%
Did you ever experience bad debt as a result of customer not paying?
Yes No Don't Know
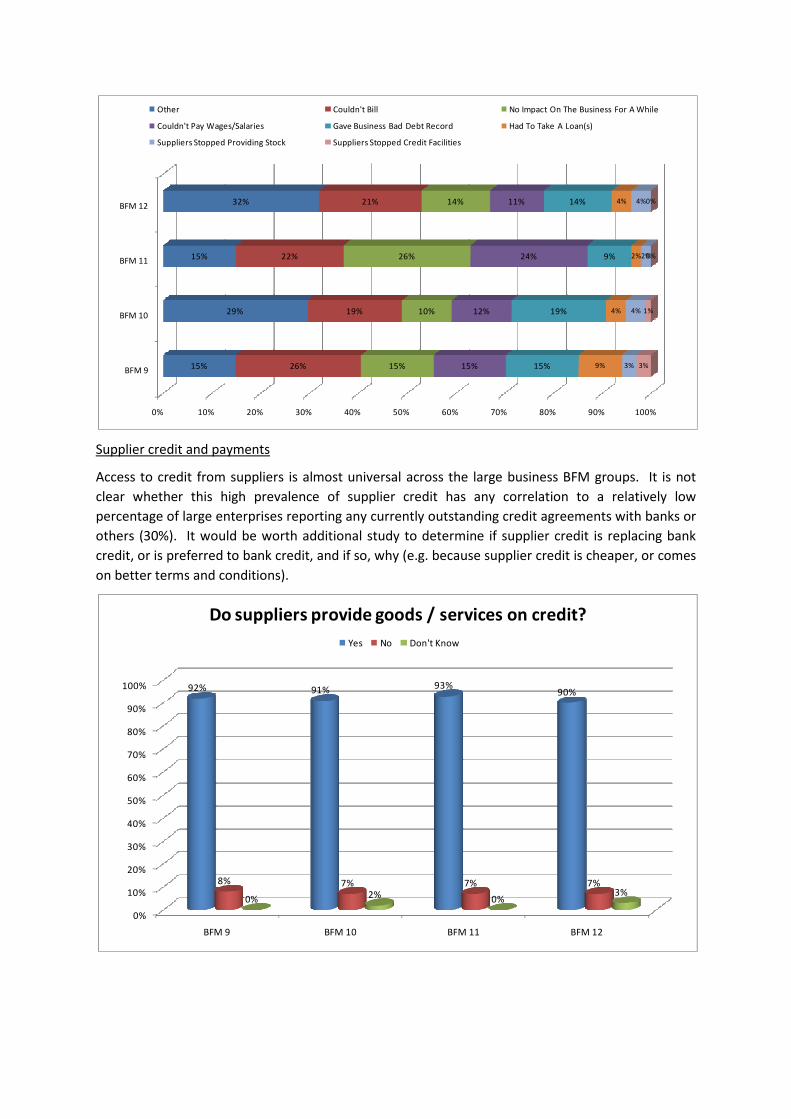
Supplier credit and payments
Access to credit from suppliers is almost universal across the large business BFM groups. It is not
clear whether this high prevalence of supplier credit has any correlation to a relatively low
percentage of large enterprises reporting any currently outstanding credit agreements with banks or
others (30%). It would be worth additional study to determine if supplier credit is replacing bank
credit, or is preferred to bank credit, and if so, why (e.g. because supplier credit is cheaper, or comes
on better terms and conditions).
0% 10% 20% 30% 40% 50% 60% 70% 80% 90% 100%
BFM 9
BFM 10
BFM 11
BFM 12
15%
29%
15%
32%
26%
19%
22%
21%
15%
10%
26%
14%
15%
12%
24%
11%
15%
19%
9%
14%
9%
4%
2%
4%
3%
4%
2%
4%
3%
1%
0%
0%
Other Couldn't Bill No Impact On The Business For A While
Couldn't Pay Wages/Salaries Gave Business Bad Debt Record Had To Take A Loan(s)
Suppliers Stopped Providing Stock Suppliers Stopped Credit Facilities
0%
10%
20%
30%
40%
50%
60%
70%
80%
90%
100%
BFM 9 BFM 10 BFM 11 BFM 12
92% 91%93%
90%
8% 7% 7% 7%
0%2%
0%3%
Do suppliers provide goods / services on credit?
Yes No Don't Know
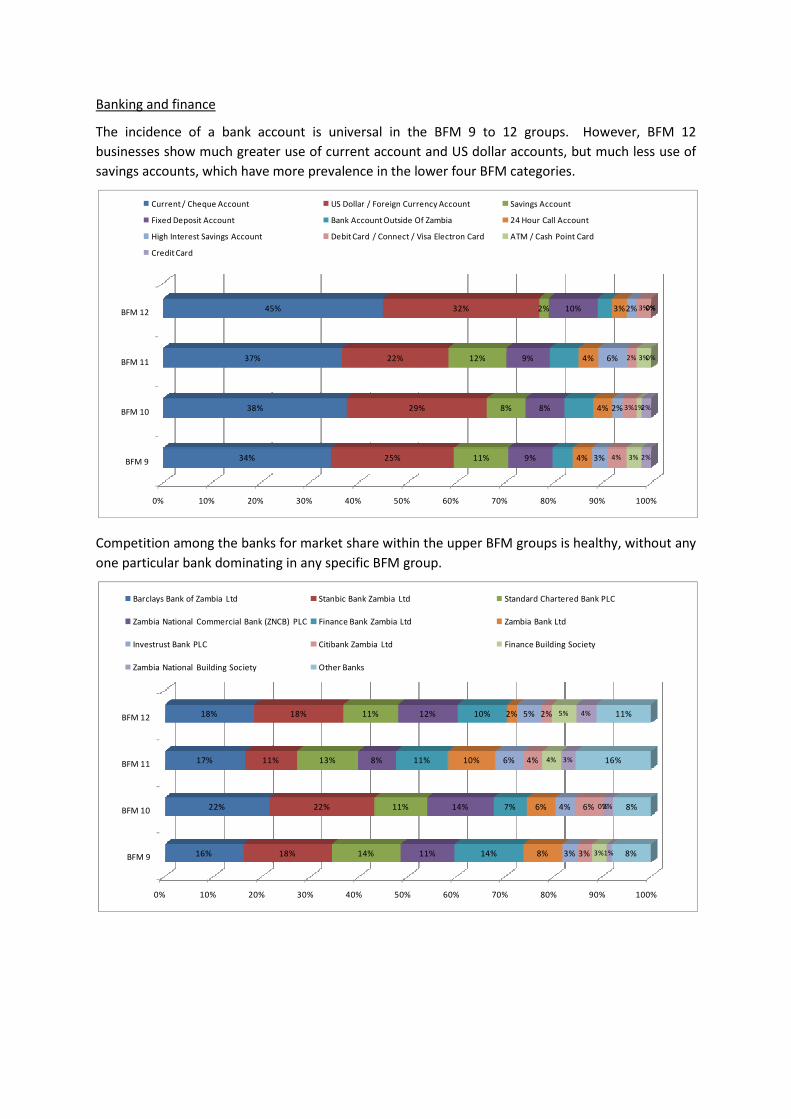
Banking and finance
The incidence of a bank account is universal in the BFM 9 to 12 groups. However, BFM 12
businesses show much greater use of current account and US dollar accounts, but much less use of
savings accounts, which have more prevalence in the lower four BFM categories.
Competition among the banks for market share within the upper BFM groups is healthy, without any
one particular bank dominating in any specific BFM group.
0% 10% 20% 30% 40% 50% 60% 70% 80% 90% 100%
BFM 9
BFM 10
BFM 11
BFM 12
34%
38%
37%
45%
25%
29%
22%
32%
11%
8%
12%
2%
9%
8%
9%
10%
4%
4%
4%
3%
3%
2%
6%
2%
4%
3%
2%
3%
3%
1%
3%
0%
2%
2%
0%
0%
Current / Cheque Account US Dollar / Foreign Currency Account Savings Account
Fixed Deposit Account Bank Account Outside Of Zambia 24 Hour Call Account
High Interest Savings Account Debit Card / Connect / Visa Electron Card ATM / Cash Point Card
Credit Card
0% 10% 20% 30% 40% 50% 60% 70% 80% 90% 100%
BFM 9
BFM 10
BFM 11
BFM 12
16%
22%
17%
18%
18%
22%
11%
18%
14%
11%
13%
11%
11%
14%
8%
12%
14%
7%
11%
10%
8%
6%
10%
2%
3%
4%
6%
5%
3%
6%
4%
2%
3%
0%
4%
5%
1%
2%
3%
4%
8%
8%
16%
11%
Barclays Bank of Zambia Ltd Stanbic Bank Zambia Ltd Standard Chartered Bank PLC
Zambia National Commercial Bank (ZNCB) PLC Finance Bank Zambia Ltd Zambia Bank Ltd
Investrust Bank PLC Citibank Zambia Ltd Finance Building Society
Zambia National Building Society Other Banks
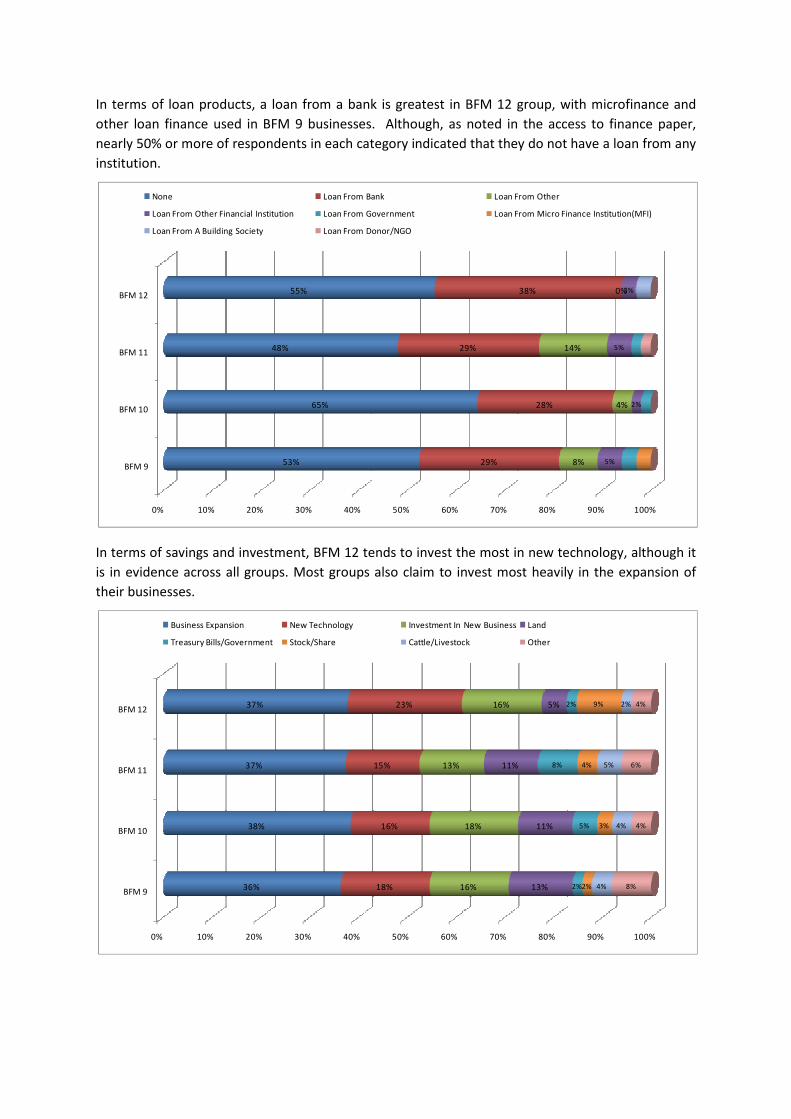
In terms of loan products, a loan from a bank is greatest in BFM 12 group, with microfinance and
other loan finance used in BFM 9 businesses. Although, as noted in the access to finance paper,
nearly 50% or more of respondents in each category indicated that they do not have a loan from any
institution.
In terms of savings and investment, BFM 12 tends to invest the most in new technology, although it
is in evidence across all groups. Most groups also claim to invest most heavily in the expansion of
their businesses.
0% 10% 20% 30% 40% 50% 60% 70% 80% 90% 100%
BFM 9
BFM 10
BFM 11
BFM 12
53%
65%
48%
55%
29%
28%
29%
38%
8%
4%
14%
0%
5%
2%
5%
3%
None Loan From Bank Loan From Other
Loan From Other Financial Institution Loan From Government Loan From Micro Finance Institution(MFI)
Loan From A Building Society Loan From Donor/NGO
0% 10% 20% 30% 40% 50% 60% 70% 80% 90% 100%
BFM 9
BFM 10
BFM 11
BFM 12
36%
38%
37%
37%
18%
16%
15%
23%
16%
18%
13%
16%
13%
11%
11%
5%
2%
5%
8%
2%
2%
3%
4%
9%
4%
4%
5%
2%
8%
4%
6%
4%
Business Expansion New Technology Investment In New Business Land
Treasury Bills/Government Stock/Share Cattle/Livestock Other
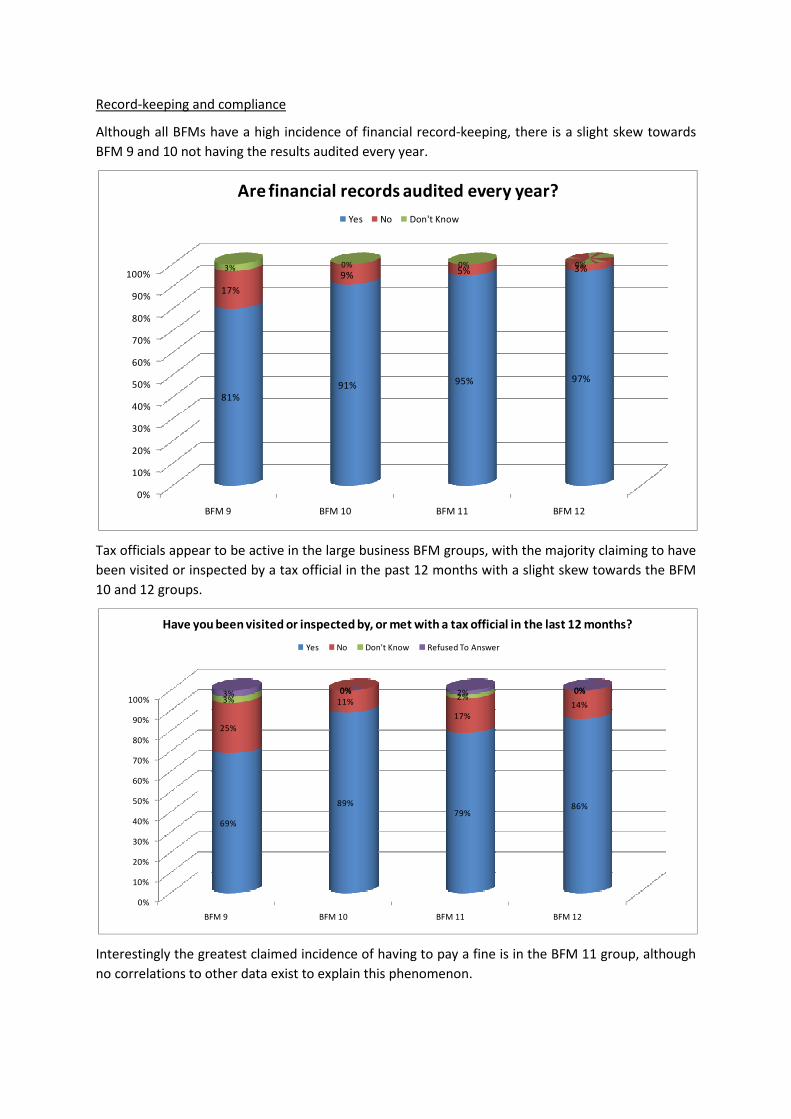
Record-keeping and compliance
Although all BFMs have a high incidence of financial record-keeping, there is a slight skew towards
BFM 9 and 10 not having the results audited every year.
Tax officials appear to be active in the large business BFM groups, with the majority claiming to have
been visited or inspected by a tax official in the past 12 months with a slight skew towards the BFM
10 and 12 groups.
Interestingly the greatest claimed incidence of having to pay a fine is in the BFM 11 group, although
no correlations to other data exist to explain this phenomenon.
0%
10%
20%
30%
40%
50%
60%
70%
80%
90%
100%
BFM 9 BFM 10 BFM 11 BFM 12
81%
91% 95% 97%
17%
9% 5% 3%3% 0% 0% 0%
Are financial records audited every year?
Yes No Don't Know
0%
10%
20%
30%
40%
50%
60%
70%
80%
90%
100%
BFM 9 BFM 10 BFM 11 BFM 12
69%
89%79%
86%
25%
11%
17%
14%3%
0%2%
0%3% 0% 2% 0%
Have you been visited or inspected by, or met with a tax official in the last 12 months?
Yes No Don't Know Refused To Answer
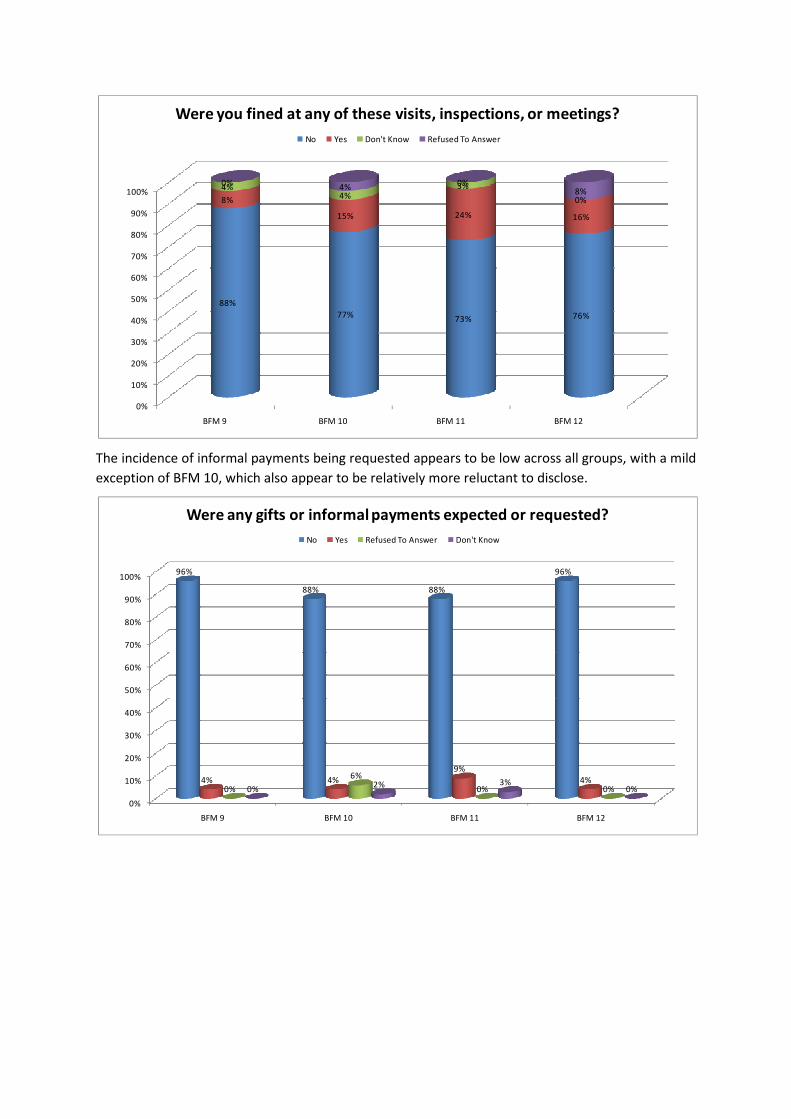
The incidence of informal payments being requested appears to be low across all groups, with a mild
exception of BFM 10, which also appear to be relatively more reluctant to disclose.
0%
10%
20%
30%
40%
50%
60%
70%
80%
90%
100%
BFM 9 BFM 10 BFM 11 BFM 12
88%
77%73% 76%
8%
15% 24% 16%
4%4%
3%
0%
0%4%
0%8%
Were you fined at any of these visits, inspections, or meetings?
No Yes Don't Know Refused To Answer
0%
10%
20%
30%
40%
50%
60%
70%
80%
90%
100%
BFM 9 BFM 10 BFM 11 BFM 12
96%
88% 88%
96%
4% 4%
9%
4%0%
6%
0% 0%0%2% 3%
0%
Were any gifts or informal payments expected or requested?
No Yes Refused To Answer Don't Know