Embed Size (px)
Citation preview
Seismic Evaluation of a 1930 Steel Bridge with Lightly Reinforced Concrete Piers R. Tinawi & M. Leclerc École Polytechnique de Montréal, Canada D. Mitchell McGill University, Canada A. Massad Hydro-Québec, Canada SUMMARY: The seismic evaluation of a 1930 steel truss bridge having two unequal spans (23.7m and 79.3m), in a moderate seismic zone in Quebec, is performed. The bridge is supported by two lightly reinforced concrete piers. The third support consists of an abutment with two pinned tie-rods anchored to the rock. The concrete deck is supported by cross beams between the main trusses as well as stringers. Seismic loads in the longitudinal direction of the bridge cause bending about the weak axis of the piers. Two spectra, corresponding to the S6-06 bridge code and the 2010 NBC of Canada, are used. When the base of the piers is assumed fixed, the seismic loads cause overturning of the central pier. Spring supports simulating near-pinned conditions, at the base of the central pier, represent a more realistic condition reducing seismic loads on the piers and thus avoiding the need for retrofit measures. Keywords: steel bridge, seismic response, concrete piers 1. INTRODUCTION The Rapide-Blanc steel truss bridge in Quebec, Canada was in built in 1930 and is made up of two independent trusses segments as shown in Fig. 1. The first segment is continuous over three supports but has unequal spans (23.7m and 79.3m) while the second segment is simply supported. Only the first segment is of interest. Fig. 2 shows an overall view of the truss bridge which consists of riveted built-up sections. The deck of the bridge is a 170 mm thick concrete slab supported by transverse beams, between the lower chords of the main trusses, and stringers as shown in Fig. 3. The bridge has horizontal bracings between the top and bottom chords.
Figure 1. Rapide-Blanc bridge: Continuous segment with 3 supports and one segment simply supported
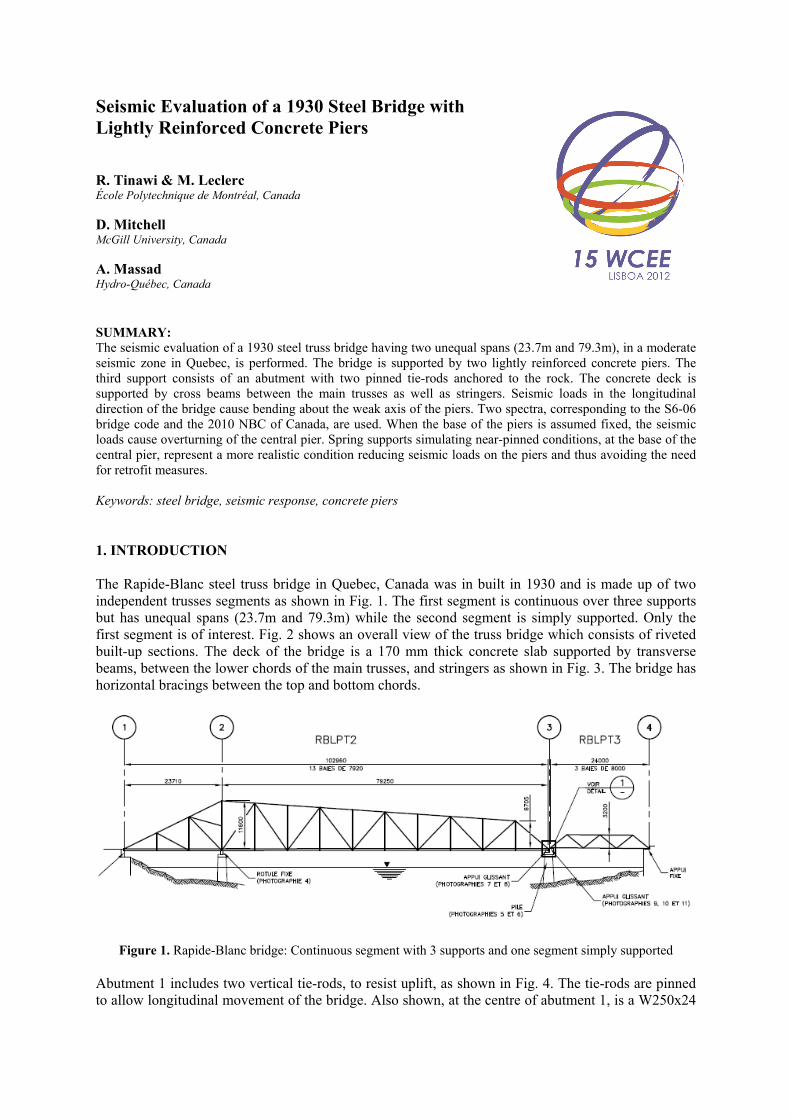
Abutment 1 includes two vertical tie-rods, to resist uplift, as shown in Fig. 4. The tie-rods are pinned to allow longitudinal movement of the bridge. Also shown, at the centre of abutment 1, is a W250x24
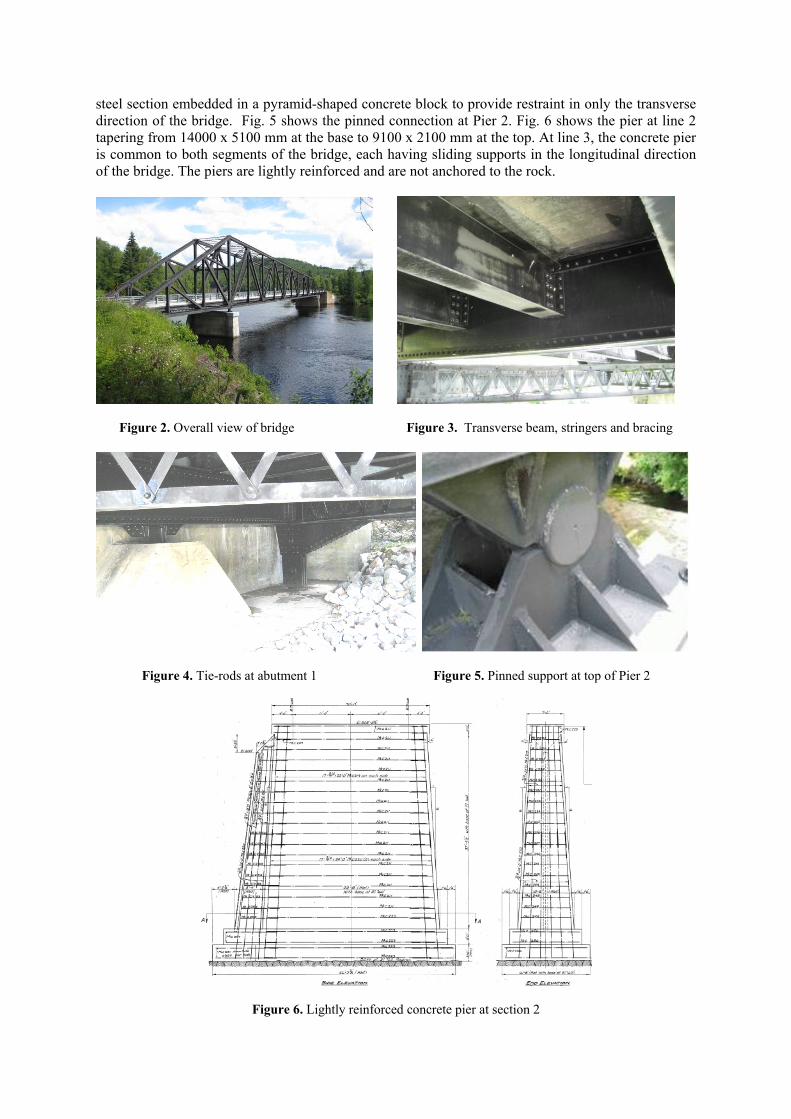
steel section embedded in a pyramid-shaped concrete block to provide restraint in only the transverse direction of the bridge. Fig. 5 shows the pinned connection at Pier 2. Fig. 6 shows the pier at line 2 tapering from 14000 x 5100 mm at the base to 9100 x 2100 mm at the top. At line 3, the concrete pier is common to both segments of the bridge, each having sliding supports in the longitudinal direction of the bridge. The piers are lightly reinforced and are not anchored to the rock.
Figure 2. Overall view of bridge Figure 3. Transverse beam, stringers and bracing
Figure 4. Tie-rods at abutment 1 Figure 5. Pinned support at top of Pier 2
Figure 6. Lightly reinforced concrete pier at section 2
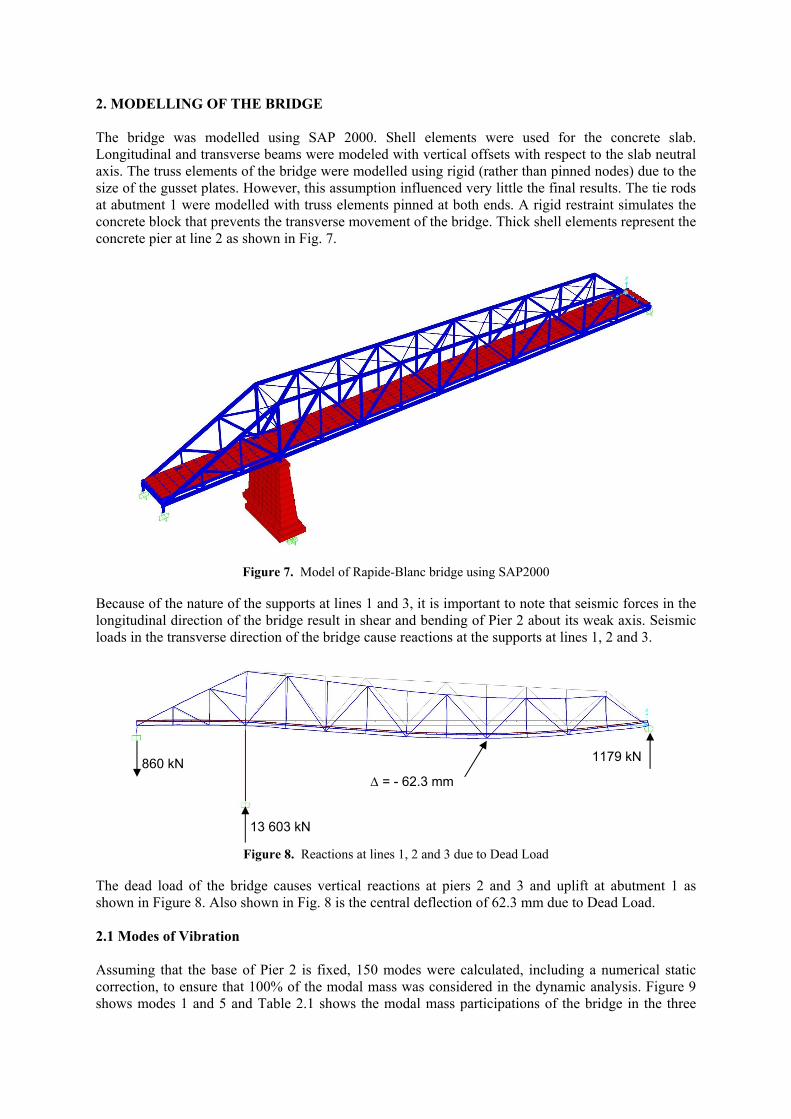
2. MODELLING OF THE BRIDGE The bridge was modelled using SAP 2000. Shell elements were used for the concrete slab. Longitudinal and transverse beams were modeled with vertical offsets with respect to the slab neutral axis. The truss elements of the bridge were modelled using rigid (rather than pinned nodes) due to the size of the gusset plates. However, this assumption influenced very little the final results. The tie rods at abutment 1 were modelled with truss elements pinned at both ends. A rigid restraint simulates the concrete block that prevents the transverse movement of the bridge. Thick shell elements represent the concrete pier at line 2 as shown in Fig. 7.
Figure 7. Model of Rapide-Blanc bridge using SAP2000
Because of the nature of the supports at lines 1 and 3, it is important to note that seismic forces in the longitudinal direction of the bridge result in shear and bending of Pier 2 about its weak axis. Seismic loads in the transverse direction of the bridge cause reactions at the supports at lines 1, 2 and 3.
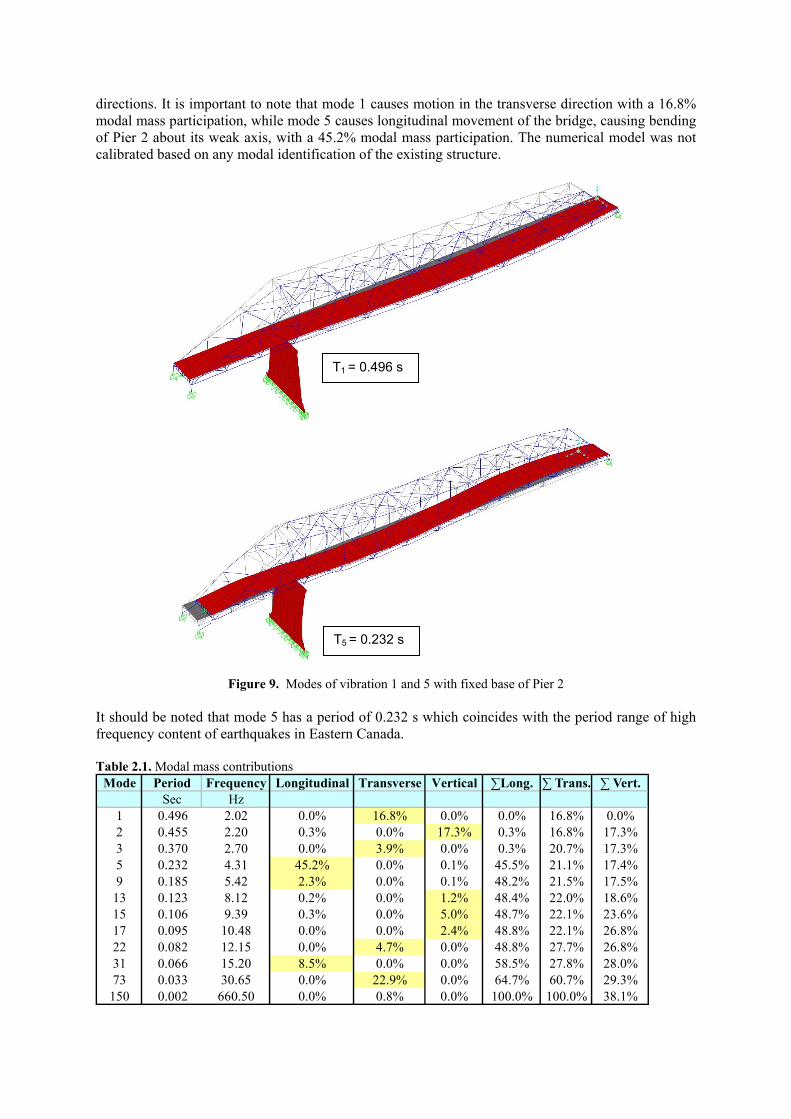
Figure 8. Reactions at lines 1, 2 and 3 due to Dead Load
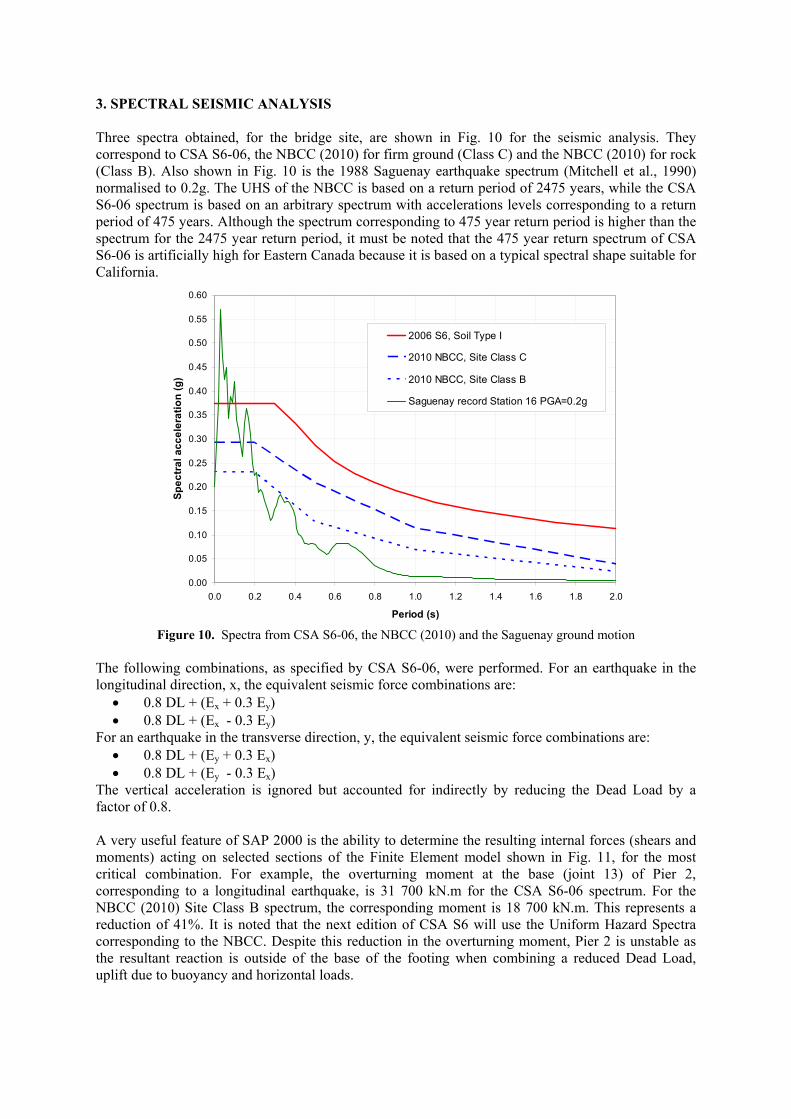
The dead load of the bridge causes vertical reactions at piers 2 and 3 and uplift at abutment 1 as shown in Figure 8. Also shown in Fig. 8 is the central deflection of 62.3 mm due to Dead Load. 2.1 Modes of Vibration Assuming that the base of Pier 2 is fixed, 150 modes were calculated, including a numerical static correction, to ensure that 100% of the modal mass was considered in the dynamic analysis. Figure 9 shows modes 1 and 5 and Table 2.1 shows the modal mass participations of the bridge in the three
13 603 kN
1179 kN 860 kN = - 62.3 mm
directions. It is important to note that mode 1 causes motion in the transverse direction with a 16.8% modal mass participation, while mode 5 causes longitudinal movement of the bridge, causing bending of Pier 2 about its weak axis, with a 45.2% modal mass participation. The numerical model was not calibrated based on any modal identification of the existing structure.
Figure 9. Modes of vibration 1 and 5 with fixed base of Pier 2
It should be noted that mode 5 has a period of 0.232 s which coincides with the period range of high frequency content of earthquakes in Eastern Canada.
Table 2.1. Modal mass contributions
Mode Period Frequency Longitudinal Transverse Vertical ∑Long. ∑ Trans. ∑ Vert.Sec Hz
1 0.496 2.02 0.0% 16.8% 0.0% 0.0% 16.8% 0.0%2 0.455 2.20 0.3% 0.0% 17.3% 0.3% 16.8% 17.3%3 0.370 2.70 0.0% 3.9% 0.0% 0.3% 20.7% 17.3%5 0.232 4.31 45.2% 0.0% 0.1% 45.5% 21.1% 17.4%9 0.185 5.42 2.3% 0.0% 0.1% 48.2% 21.5% 17.5%
13 0.123 8.12 0.2% 0.0% 1.2% 48.4% 22.0% 18.6%15 0.106 9.39 0.3% 0.0% 5.0% 48.7% 22.1% 23.6%17 0.095 10.48 0.0% 0.0% 2.4% 48.8% 22.1% 26.8%22 0.082 12.15 0.0% 4.7% 0.0% 48.8% 27.7% 26.8%31 0.066 15.20 8.5% 0.0% 0.0% 58.5% 27.8% 28.0%73 0.033 30.65 0.0% 22.9% 0.0% 64.7% 60.7% 29.3%
150 0.002 660.50 0.0% 0.8% 0.0% 100.0% 100.0% 38.1%
T1 = 0.496 s
T5 = 0.232 s
3. SPECTRAL SEISMIC ANALYSIS Three spectra obtained, for the bridge site, are shown in Fig. 10 for the seismic analysis. They correspond to CSA S6-06, the NBCC (2010) for firm ground (Class C) and the NBCC (2010) for rock (Class B). Also shown in Fig. 10 is the 1988 Saguenay earthquake spectrum (Mitchell et al., 1990) normalised to 0.2g. The UHS of the NBCC is based on a return period of 2475 years, while the CSA S6-06 spectrum is based on an arbitrary spectrum with accelerations levels corresponding to a return period of 475 years. Although the spectrum corresponding to 475 year return period is higher than the spectrum for the 2475 year return period, it must be noted that the 475 year return spectrum of CSA S6-06 is artificially high for Eastern Canada because it is based on a typical spectral shape suitable for California.
0.00
0.05
0.10
0.15
0.20
0.25
0.30
0.35
0.40
0.45
0.50
0.55
0.60
0.0 0.2 0.4 0.6 0.8 1.0 1.2 1.4 1.6 1.8 2.0
Period (s)
Sp
ec
tra
l a
cc
ele
rati
on
(g
)
2006 S6, Soil Type I
2010 NBCC, Site Class C
2010 NBCC, Site Class B
Saguenay record Station 16 PGA=0.2g
Figure 10. Spectra from CSA S6-06, the NBCC (2010) and the Saguenay ground motion
The following combinations, as specified by CSA S6-06, were performed. For an earthquake in the longitudinal direction, x, the equivalent seismic force combinations are:
0.8 DL + (Ex + 0.3 Ey) 0.8 DL + (Ex - 0.3 Ey)
For an earthquake in the transverse direction, y, the equivalent seismic force combinations are: 0.8 DL + (Ey + 0.3 Ex) 0.8 DL + (Ey - 0.3 Ex)
The vertical acceleration is ignored but accounted for indirectly by reducing the Dead Load by a factor of 0.8.
A very useful feature of SAP 2000 is the ability to determine the resulting internal forces (shears and moments) acting on selected sections of the Finite Element model shown in Fig. 11, for the most critical combination. For example, the overturning moment at the base (joint 13) of Pier 2, corresponding to a longitudinal earthquake, is 31 700 kN.m for the CSA S6-06 spectrum. For the NBCC (2010) Site Class B spectrum, the corresponding moment is 18 700 kN.m. This represents a reduction of 41%. It is noted that the next edition of CSA S6 will use the Uniform Hazard Spectra corresponding to the NBCC. Despite this reduction in the overturning moment, Pier 2 is unstable as the resultant reaction is outside of the base of the footing when combining a reduced Dead Load, uplift due to buoyancy and horizontal loads.
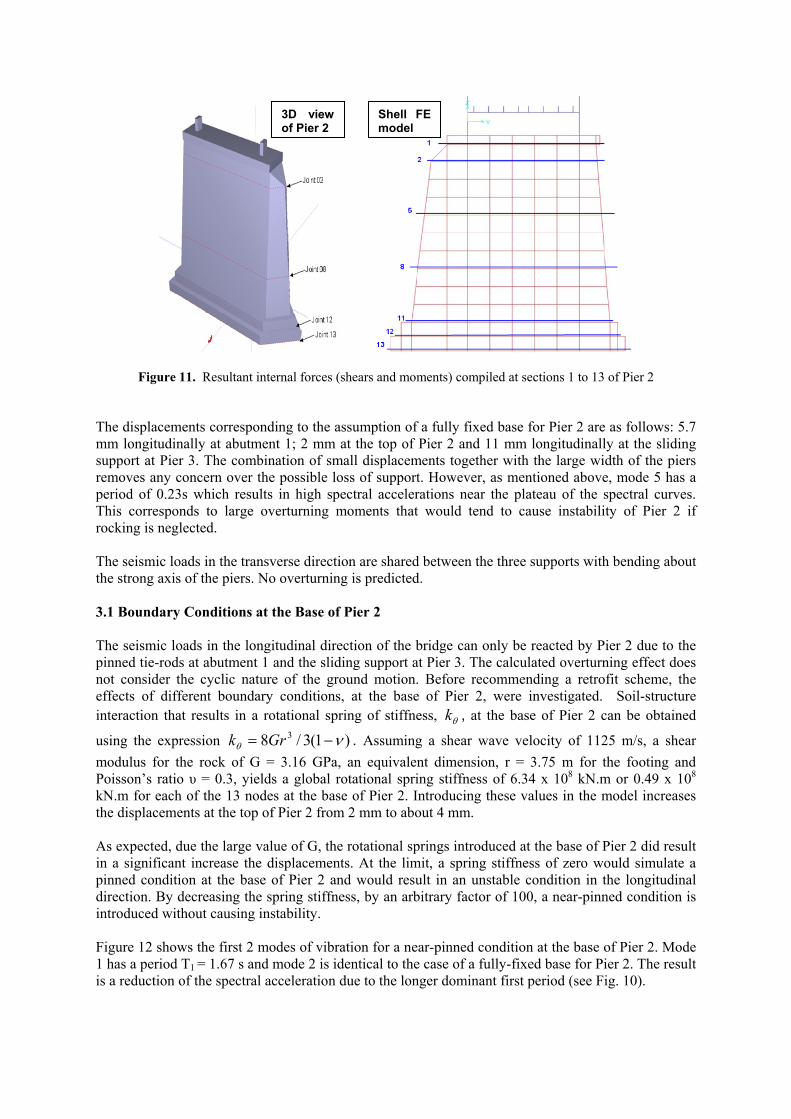
Figure 11. Resultant internal forces (shears and moments) compiled at sections 1 to 13 of Pier 2
The displacements corresponding to the assumption of a fully fixed base for Pier 2 are as follows: 5.7 mm longitudinally at abutment 1; 2 mm at the top of Pier 2 and 11 mm longitudinally at the sliding support at Pier 3. The combination of small displacements together with the large width of the piers removes any concern over the possible loss of support. However, as mentioned above, mode 5 has a period of 0.23s which results in high spectral accelerations near the plateau of the spectral curves. This corresponds to large overturning moments that would tend to cause instability of Pier 2 if rocking is neglected. The seismic loads in the transverse direction are shared between the three supports with bending about the strong axis of the piers. No overturning is predicted.
3.1 Boundary Conditions at the Base of Pier 2 The seismic loads in the longitudinal direction of the bridge can only be reacted by Pier 2 due to the pinned tie-rods at abutment 1 and the sliding support at Pier 3. The calculated overturning effect does not consider the cyclic nature of the ground motion. Before recommending a retrofit scheme, the effects of different boundary conditions, at the base of Pier 2, were investigated. Soil-structure interaction that results in a rotational spring of stiffness, k , at the base of Pier 2 can be obtained
using the expression )1(3/8 3 Grk . Assuming a shear wave velocity of 1125 m/s, a shear
modulus for the rock of G = 3.16 GPa, an equivalent dimension, r = 3.75 m for the footing and Poisson’s ratio υ = 0.3, yields a global rotational spring stiffness of 6.34 x 10⁸ kN.m or 0.49 x 10⁸ kN.m for each of the 13 nodes at the base of Pier 2. Introducing these values in the model increases the displacements at the top of Pier 2 from 2 mm to about 4 mm. As expected, due the large value of G, the rotational springs introduced at the base of Pier 2 did result in a significant increase the displacements. At the limit, a spring stiffness of zero would simulate a pinned condition at the base of Pier 2 and would result in an unstable condition in the longitudinal direction. By decreasing the spring stiffness, by an arbitrary factor of 100, a near-pinned condition is introduced without causing instability. Figure 12 shows the first 2 modes of vibration for a near-pinned condition at the base of Pier 2. Mode 1 has a period T1 = 1.67 s and mode 2 is identical to the case of a fully-fixed base for Pier 2. The result is a reduction of the spectral acceleration due to the longer dominant first period (see Fig. 10).
3D view of Pier 2
Shell FEmodel
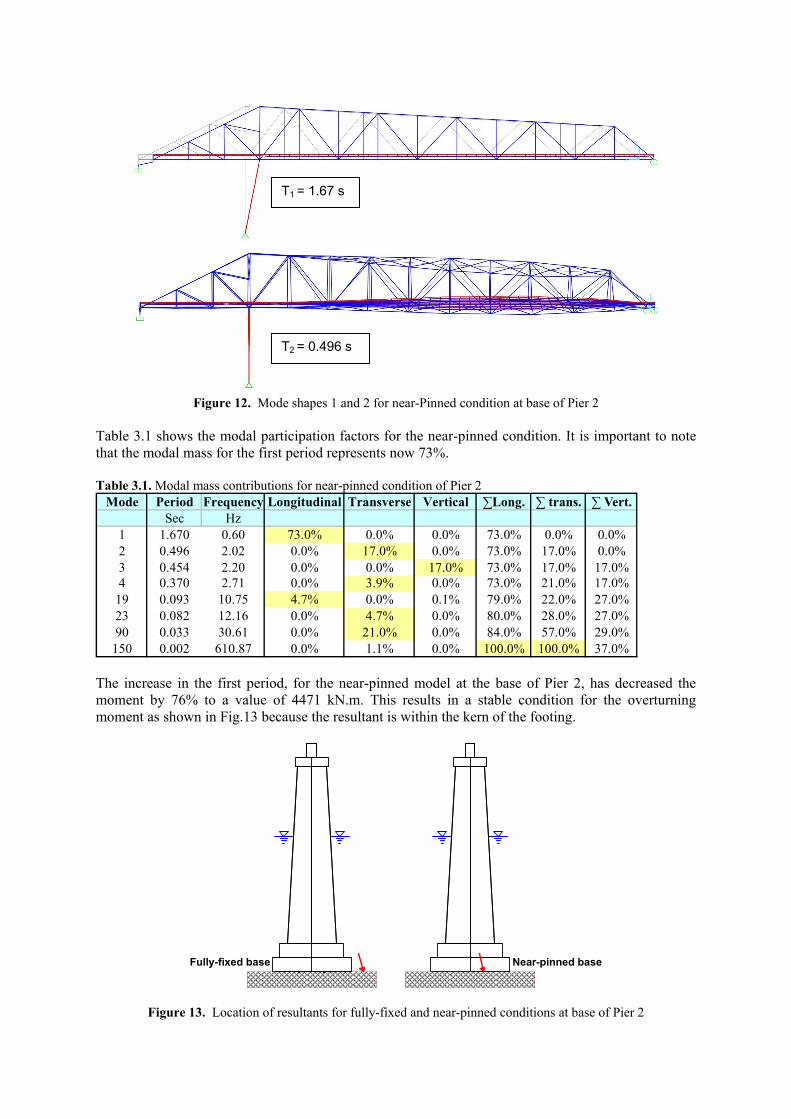
Figure 12. Mode shapes 1 and 2 for near-Pinned condition at base of Pier 2
Table 3.1 shows the modal participation factors for the near-pinned condition. It is important to note that the modal mass for the first period represents now 73%. Table 3.1. Modal mass contributions for near-pinned condition of Pier 2
Mode Period Frequency Longitudinal Transverse Vertical ∑Long. ∑ trans. ∑ Vert.Sec Hz
1 1.670 0.60 73.0% 0.0% 0.0% 73.0% 0.0% 0.0%2 0.496 2.02 0.0% 17.0% 0.0% 73.0% 17.0% 0.0%3 0.454 2.20 0.0% 0.0% 17.0% 73.0% 17.0% 17.0%4 0.370 2.71 0.0% 3.9% 0.0% 73.0% 21.0% 17.0%
19 0.093 10.75 4.7% 0.0% 0.1% 79.0% 22.0% 27.0%23 0.082 12.16 0.0% 4.7% 0.0% 80.0% 28.0% 27.0%90 0.033 30.61 0.0% 21.0% 0.0% 84.0% 57.0% 29.0%
150 0.002 610.87 0.0% 1.1% 0.0% 100.0% 100.0% 37.0%
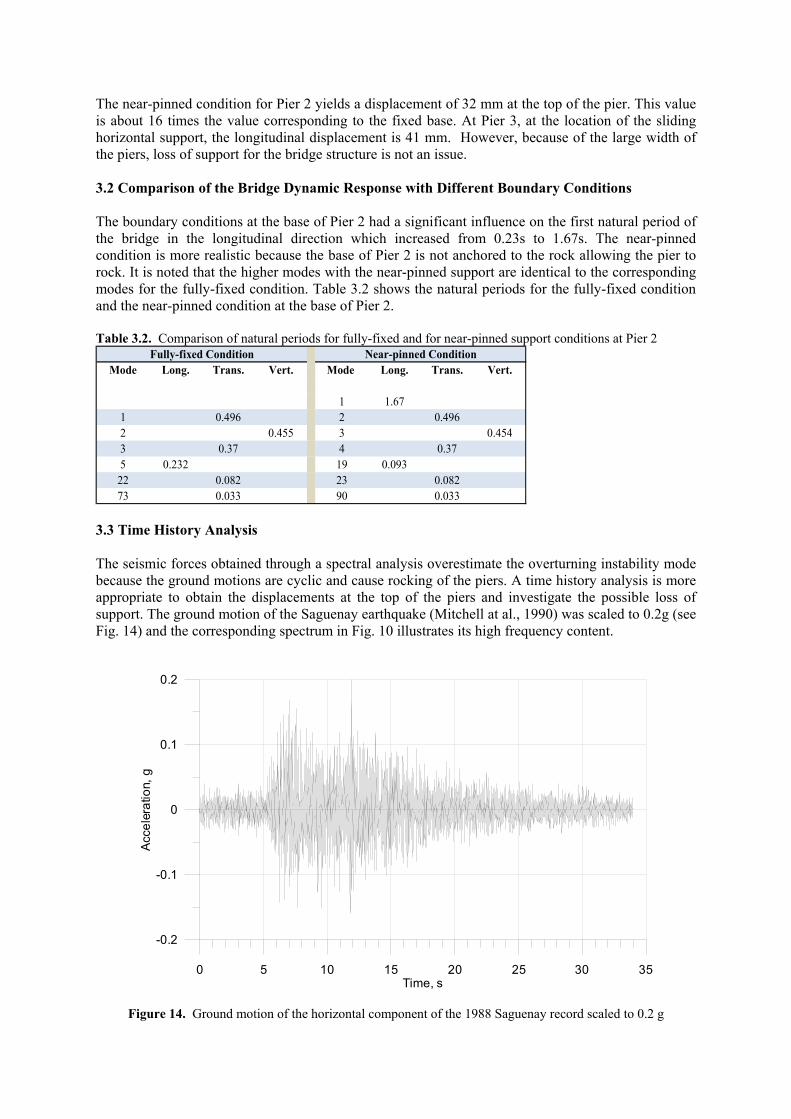
The increase in the first period, for the near-pinned model at the base of Pier 2, has decreased the moment by 76% to a value of 4471 kN.m. This results in a stable condition for the overturning moment as shown in Fig.13 because the resultant is within the kern of the footing.
Fully-fixed base Near-pinned base
Figure 13. Location of resultants for fully-fixed and near-pinned conditions at base of Pier 2
T1 = 1.67 s
T2 = 0.496 s
The near-pinned condition for Pier 2 yields a displacement of 32 mm at the top of the pier. This value is about 16 times the value corresponding to the fixed base. At Pier 3, at the location of the sliding horizontal support, the longitudinal displacement is 41 mm. However, because of the large width of the piers, loss of support for the bridge structure is not an issue. 3.2 Comparison of the Bridge Dynamic Response with Different Boundary Conditions The boundary conditions at the base of Pier 2 had a significant influence on the first natural period of the bridge in the longitudinal direction which increased from 0.23s to 1.67s. The near-pinned condition is more realistic because the base of Pier 2 is not anchored to the rock allowing the pier to rock. It is noted that the higher modes with the near-pinned support are identical to the corresponding modes for the fully-fixed condition. Table 3.2 shows the natural periods for the fully-fixed condition and the near-pinned condition at the base of Pier 2. Table 3.2. Comparison of natural periods for fully-fixed and for near-pinned support conditions at Pier 2
Mode Long. Trans. Vert. Mode Long. Trans. Vert.
1 1.671 0.496 2 0.4962 0.455 3 0.4543 0.37 4 0.375 0.232 19 0.09322 0.082 23 0.08273 0.033 90 0.033
Fully-fixed Condition Near-pinned Condition
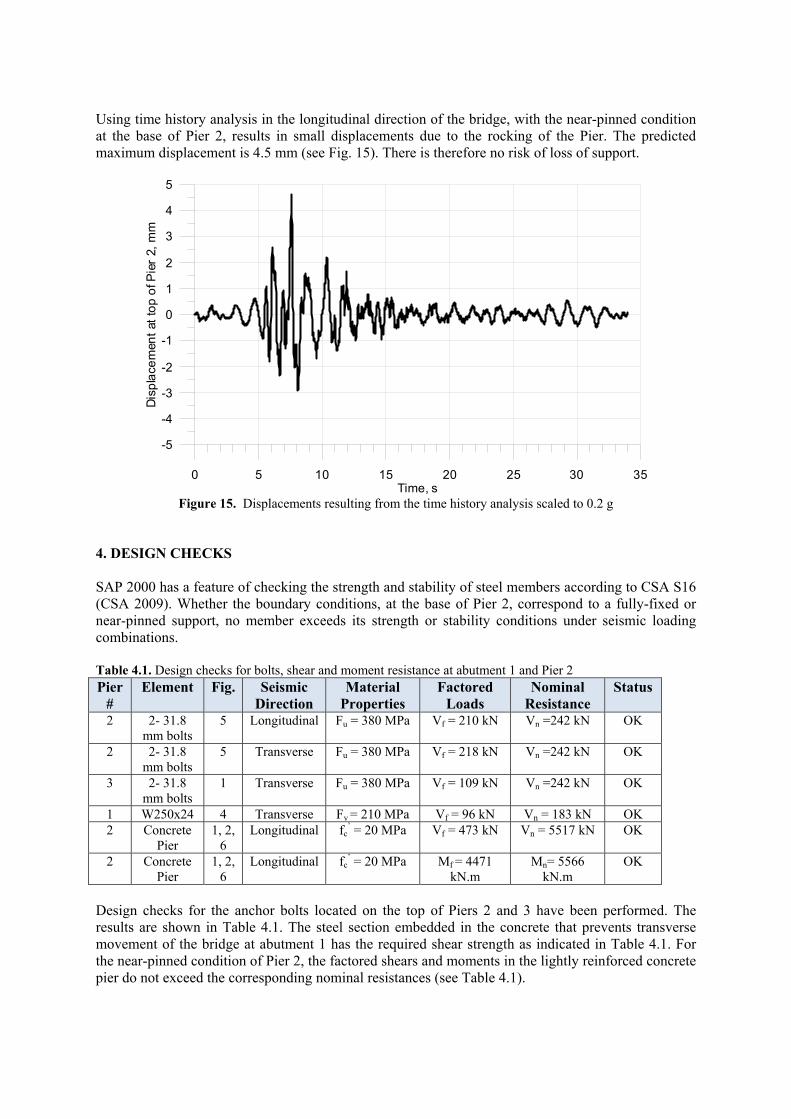
3.3 Time History Analysis The seismic forces obtained through a spectral analysis overestimate the overturning instability mode because the ground motions are cyclic and cause rocking of the piers. A time history analysis is more appropriate to obtain the displacements at the top of the piers and investigate the possible loss of support. The ground motion of the Saguenay earthquake (Mitchell at al., 1990) was scaled to 0.2g (see Fig. 14) and the corresponding spectrum in Fig. 10 illustrates its high frequency content.
0 5 10 15 20 25 30 35Time, s
-0.2
-0.1
0
0.1
0.2
Acc
ele
ratio
n,g
Figure 14. Ground motion of the horizontal component of the 1988 Saguenay record scaled to 0.2 g
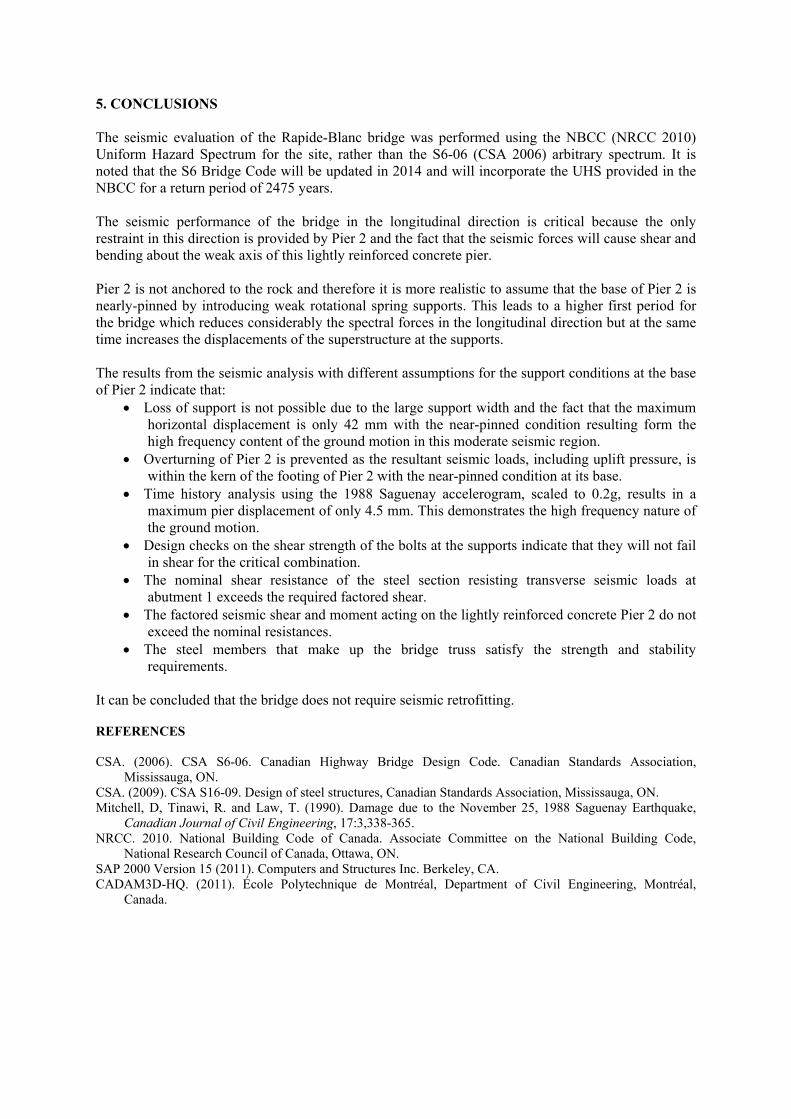
Using time history analysis in the longitudinal direction of the bridge, with the near-pinned condition at the base of Pier 2, results in small displacements due to the rocking of the Pier. The predicted maximum displacement is 4.5 mm (see Fig. 15). There is therefore no risk of loss of support.
0 5 10 15 20 25 30 35Time, s
-5
-4
-3
-2
-1
0
1
2
3
4
5
Dis
pla
cem
ent
atto
po
fPie
r2,
mm
Figure 15. Displacements resulting from the time history analysis scaled to 0.2 g
4. DESIGN CHECKS SAP 2000 has a feature of checking the strength and stability of steel members according to CSA S16 (CSA 2009). Whether the boundary conditions, at the base of Pier 2, correspond to a fully-fixed or near-pinned support, no member exceeds its strength or stability conditions under seismic loading combinations. Table 4.1. Design checks for bolts, shear and moment resistance at abutment 1 and Pier 2 Pier
# Element Fig. Seismic
Direction Material
Properties Factored
Loads Nominal
Resistance Status
2 2- 31.8 mm bolts
5 Longitudinal Fu = 380 MPa Vf = 210 kN Vn =242 kN OK
2 2- 31.8 mm bolts
5 Transverse Fu = 380 MPa Vf = 218 kN Vn =242 kN OK
3 2- 31.8 mm bolts
1 Transverse Fu = 380 MPa Vf = 109 kN Vn =242 kN OK
1 W250x24 4 Transverse Fy = 210 MPa Vf = 96 kN Vn = 183 kN OK 2 Concrete
Pier 1, 2,
6 Longitudinal fc
’ = 20 MPa Vf = 473 kN Vn = 5517 kN OK
2 Concrete Pier
1, 2, 6
Longitudinal fc’ = 20 MPa Mf = 4471
kN.m Mn= 5566
kN.m OK
Design checks for the anchor bolts located on the top of Piers 2 and 3 have been performed. The results are shown in Table 4.1. The steel section embedded in the concrete that prevents transverse movement of the bridge at abutment 1 has the required shear strength as indicated in Table 4.1. For the near-pinned condition of Pier 2, the factored shears and moments in the lightly reinforced concrete pier do not exceed the corresponding nominal resistances (see Table 4.1).
5. CONCLUSIONS The seismic evaluation of the Rapide-Blanc bridge was performed using the NBCC (NRCC 2010) Uniform Hazard Spectrum for the site, rather than the S6-06 (CSA 2006) arbitrary spectrum. It is noted that the S6 Bridge Code will be updated in 2014 and will incorporate the UHS provided in the NBCC for a return period of 2475 years. The seismic performance of the bridge in the longitudinal direction is critical because the only restraint in this direction is provided by Pier 2 and the fact that the seismic forces will cause shear and bending about the weak axis of this lightly reinforced concrete pier. Pier 2 is not anchored to the rock and therefore it is more realistic to assume that the base of Pier 2 is nearly-pinned by introducing weak rotational spring supports. This leads to a higher first period for the bridge which reduces considerably the spectral forces in the longitudinal direction but at the same time increases the displacements of the superstructure at the supports. The results from the seismic analysis with different assumptions for the support conditions at the base of Pier 2 indicate that:
Loss of support is not possible due to the large support width and the fact that the maximum horizontal displacement is only 42 mm with the near-pinned condition resulting form the high frequency content of the ground motion in this moderate seismic region.
Overturning of Pier 2 is prevented as the resultant seismic loads, including uplift pressure, is within the kern of the footing of Pier 2 with the near-pinned condition at its base.
Time history analysis using the 1988 Saguenay accelerogram, scaled to 0.2g, results in a maximum pier displacement of only 4.5 mm. This demonstrates the high frequency nature of the ground motion.
Design checks on the shear strength of the bolts at the supports indicate that they will not fail in shear for the critical combination.
The nominal shear resistance of the steel section resisting transverse seismic loads at abutment 1 exceeds the required factored shear.
The factored seismic shear and moment acting on the lightly reinforced concrete Pier 2 do not exceed the nominal resistances.
The steel members that make up the bridge truss satisfy the strength and stability requirements.
It can be concluded that the bridge does not require seismic retrofitting. REFERENCES CSA. (2006). CSA S6-06. Canadian Highway Bridge Design Code. Canadian Standards Association,
Mississauga, ON. CSA. (2009). CSA S16-09. Design of steel structures, Canadian Standards Association, Mississauga, ON. Mitchell, D, Tinawi, R. and Law, T. (1990). Damage due to the November 25, 1988 Saguenay Earthquake,
Canadian Journal of Civil Engineering, 17:3,338-365. NRCC. 2010. National Building Code of Canada. Associate Committee on the National Building Code,
National Research Council of Canada, Ottawa, ON. SAP 2000 Version 15 (2011). Computers and Structures Inc. Berkeley, CA. CADAM3D-HQ. (2011). École Polytechnique de Montréal, Department of Civil Engineering, Montréal,
Canada.