Embed Size (px)
Citation preview
ISSN 1069�3513, Izvestiya, Physics of the Solid Earth, 2014, Vol. 50, No. 3, pp. 403–414. © Pleiades Publishing, Ltd., 2014.Original Russian Text © A.I. Seredkina, V.I. Melnikova, 2014, published in Fizika Zemli, 2014, No. 3, pp. 103–114.
403
INTRODUCTION
As is known, the seismic moment tensor (SMT)contains quite complete information about the seismicsource (its energy and mechanism), which can beretrieved from the measurements of seismic signalswhose wavelengths significantly exceed the source size(Kostrov, 1975; Arefiev, 2003). In turn, the SMT datayielded by these studies are not only vital for analyzingthe structural positions of the sources of rare strongearthquakes but also for solving the problems ofreconstructing the stress�strain state of the Earth’sinterior from seismological data. Eventually, the SMTdata help to improve the quality of seismic hazardassessment in the seismically active regions.
In the territory of Pribaikalye, which annuallyexperiences more than 10000 seismic events at variousenergy scales, strong earthquakes (М ≥ 5.5) make upabout 1% of the total number of the events. Typically,the SMT data for such events are promptly publishedby a few seismological centers (GCMT, NEIC, andUSGS). Some publications provide the SMT dataobtained in special studies (Doser, 1991a; 1991b;Delouis et al., 2002; Emmerson et al., 2006; Barth andWenzel, 2010; Radziminovich et al., 2012). However,this important characteristic of the seismic source isonly determined for a few percent of the earthquakesof a given region, since routine processing of mostearthquakes is limited to determining their mecha�nisms from the P�wave first�motion data recorded byshort�period seismic instruments.
In this paper, we expand the dataset of the sourceparameters of regional seismic events by the new SMTdata for intermediate�magnitude earthquakes andconsider the practical applications of the obtainedresults.
DATA AND METHOD
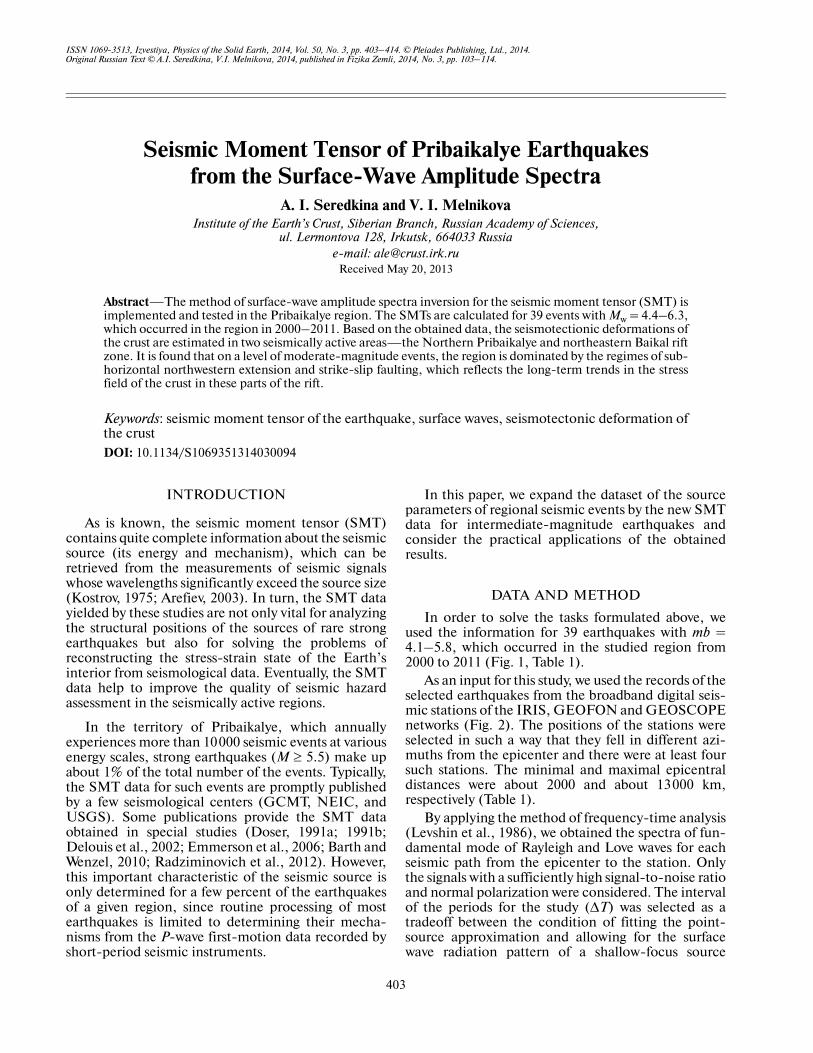
In order to solve the tasks formulated above, weused the information for 39 earthquakes with mb =4.1–5.8, which occurred in the studied region from2000 to 2011 (Fig. 1, Table 1).
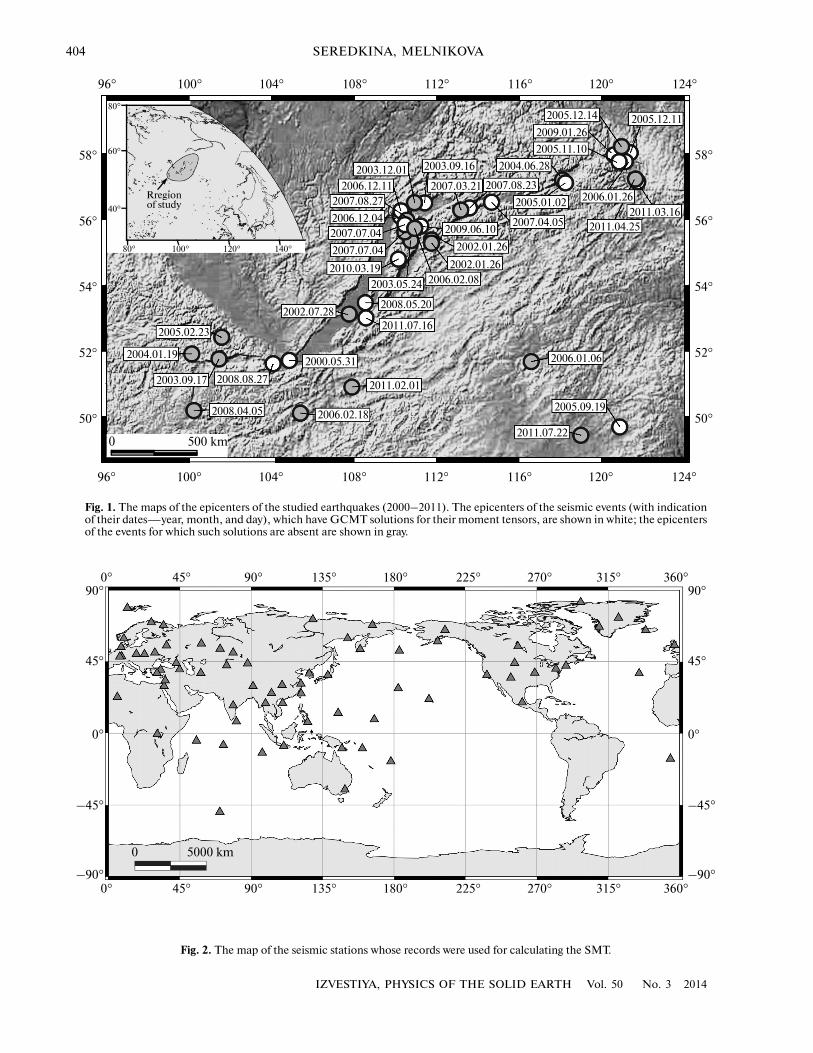
As an input for this study, we used the records of theselected earthquakes from the broadband digital seis�mic stations of the IRIS, GEOFON and GEOSCOPEnetworks (Fig. 2). The positions of the stations wereselected in such a way that they fell in different azi�muths from the epicenter and there were at least foursuch stations. The minimal and maximal epicentraldistances were about 2000 and about 13000 km,respectively (Table 1).
By applying the method of frequency�time analysis(Levshin et al., 1986), we obtained the spectra of fun�damental mode of Rayleigh and Love waves for eachseismic path from the epicenter to the station. Onlythe signals with a sufficiently high signal�to�noise ratioand normal polarization were considered. The intervalof the periods for the study (ΔT) was selected as atradeoff between the condition of fitting the point�source approximation and allowing for the surfacewave radiation pattern of a shallow�focus source
Seismic Moment Tensor of Pribaikalye Earthquakes from the Surface�Wave Amplitude Spectra
A. I. Seredkina and V. I. MelnikovaInstitute of the Earth’s Crust, Siberian Branch, Russian Academy of Sciences,
ul. Lermontova 128, Irkutsk, 664033 Russiae�mail: [email protected]
Received May 20, 2013
Abstract—The method of surface�wave amplitude spectra inversion for the seismic moment tensor (SMT) isimplemented and tested in the Pribaikalye region. The SMTs are calculated for 39 events with Mw = 4.4–6.3,which occurred in the region in 2000–2011. Based on the obtained data, the seismotectionic deformations ofthe crust are estimated in two seismically active areas—the Northern Pribaikalye and northeastern Baikal riftzone. It is found that on a level of moderate�magnitude events, the region is dominated by the regimes of sub�horizontal northwestern extension and strike�slip faulting, which reflects the long�term trends in the stressfield of the crust in these parts of the rift.
Keywords: seismic moment tensor of the earthquake, surface waves, seismotectonic deformation ofthe crustDOI: 10.1134/S1069351314030094
404
IZVESTIYA, PHYSICS OF THE SOLID EARTH Vol. 50 No. 3 2014
SEREDKINA, MELNIKOVA
96° 100° 104° 108° 112° 116° 120° 124°
58°
56°
54°
52°
50°
0 500 km
80°
60°
40°
100° 120° 140°
96° 100° 104° 108° 112° 116° 120° 124°
58°
56°
54°
52°
50°
80°
Rregionof study
2003.05.24 2006.02.082002.01.26
2009.06.10
2003.12.01
2006.12.112007.08.27
2006.12.042007.07.04
2010.03.19
2002.01.262007.07.04
2008.05.20
2011.07.162002.07.28
2000.05.31
2011.02.01
2006.02.182008.04.05
2008.08.272003.09.17
2004.01.19
2005.02.23
2003.09.16
2007.03.21
2004.06.28
2007.08.23
2005.12.14
2009.01.26
2005.11.10
2005.12.11
2005.01.02
2007.04.05
2006.01.262011.03.16
2011.04.25
2006.01.06
2005.09.19
2011.07.22
Fig. 1. The maps of the epicenters of the studied earthquakes (2000–2011). The epicenters of the seismic events (with indicationof their dates—year, month, and day), which have GCMT solutions for their moment tensors, are shown in white; the epicentersof the events for which such solutions are absent are shown in gray.
0° 45° 90° 135° 180° 225° 270° 315° 360°
0° 45° 90° 135° 180° 225° 270° 315° 360°–90°
–45°
0°
45°
90°
–90°
–45°
0°
45°
90°
0 5000 km
Fig. 2. The map of the seismic stations whose records were used for calculating the SMT.
IZVESTIYA, PHYSICS OF THE SOLID EARTH Vol. 50 No. 3 2014
SEISMIC MOMENT TENSOR OF PRIBAIKALYE EARTHQUAKES 405
Table 1. The parameters of the initial data
No. Date t0, Time, h min s
EpicenterKp mb Δmin, km Δmax, km ΔT, s N
ϕ°, N λ°, E
1 2 3 4 5 6 7 8 9 10 11
1 May 31, 2000 16:28:08.7 51.71 104.84 13.4 5.1 2670 5523 30–75 4
2 Jan. 26, 2002 04:57:08.9 55.03 111.68 13.0 4.7 2027 5252 30–60 12
3 Jan. 26, 2002 05:06:03.2 55.04 111.69 12.5 4.6 3259 5086 30–55 6
4 July 28, 2002 20:28:33.4 52.99 107.71 13.1 4.6 2991 9731 30–55 12
5 May 24, 2003 21:49:29.6 55.01 110.68 13.0 4.4 2434 4775 30–60 12
6 Sept. 16, 2003 11:24:54.4 56.05 111.34 14.3 5.2 2960 9378 30–70 14
7 Sept. 17, 2003 02:59:56.0 51.75 101.46 13.7 4.5 2594 10038 30–65 9
8 Dec. 1, 2003 20:55:46.6 56.06 111.31 12.8 4.7 2157 9319 30–55 11
9 Jan. 19, 2004 23:50:53.8 51.89 100.15 13.0 4.5 2522 5304 30–55 12
10 June 28, 2004 14:22:46.5 56.68 117.97 13.5 4.6 2608 5261 30–55 7
11 Jan. 2, 2005 00:24:38.7 56.66 118.01 13.8 5.2 2605 5439 30–80 12
12 Feb. 23, 2005 19:55:11.2 52.35 101.59 13.6 4.8 2292 9928 30–50 7
13 Sept. 19, 2005 03:27:54:9 49.88 120.72 13.5 4.8 2044 8671 30–70 12
14 Nov. 10, 2005 19:29:54.3 57.37 120.77 15.7 5.8 3951 9287 45–80 19
15 Dec. 11, 2005 15:54:13.4 57.43 120.90 14.8 5.6 2262 8885 40–70 11
16 Dec. 14, 2005 23:12:13.3 57.46 120.88 12.7 4.1 2657 5588 30–60 8
17 Jan. 6, 2006 01:56:37.7 51.68 116.47 13.3 4.5 2446 6600 30–70 8
18 Jan. 26, 2006 16:57:15.2 57.40 120.90 13.1 4.8 2651 7000 30–60 11
19 Feb. 8, 2006 15:31:18.4 55.35 110.87 12.8 4.6 2095 7454 30–60 8
20 Feb. 18, 2006 01:52:17.3 50.26 105.37 13.0 4.2 2789 9402 30–55 9
21 Dec. 4, 2006 09:14:04.6 55.67 110.19 13.6 5.1 2163 9704 30–85 17
22 Dec. 11, 2006 09:08:46.3 55.69 110.18 13.1 4.8 2434 5133 30–80 11
23 Mar. 21, 2007 14:55:43.1 55.87 113.42 12.3 4.3 2248 3523 30–55 10
24 Apr. 5, 2007 13:22:53.7 56.07 114.56 13.4 4.9 2338 4631 30–55 11
25 July 4, 2007 01:23:23.9 55.45 110.39 14.2 5.2 4833 9454 30–65 15
26 July 4, 2007 02:18:05.0 55.39 110.37 12.7 4.7 2380 5159 30–65 9
27 Aug. 23, 2007 04:49:19.4 55.91 113.50 13.3 4.8 2371 5267 30–70 10
28 Aug. 27, 2007 10:09:30.5 55.49 110.46 12.7 4.7 2003 5158 30–65 10
29 Apr. 5, 2008 18:56:01.4 50.33 100.25 12.8 4.5 2357 5436 30–55 10
30 May 20, 2008 20:42:43.4 53.30 108.49 14.3 5.1 2560 9594 30–70 15
31 Aug. 27, 2008 01:35:31.4 51.62 104.06 15.9 5.7 2423 12759 70–110 17
32 Jan. 26, 2009 21:30:37.4 57.40 120.78 14.2 5.2 2428 7003 30–90 15
33 June 10, 2009 18:51:59.1 55.41 111.16 13.2 4.9 2115 5412 30–60 11
34 Mar. 19, 2010 09:30:41.4 54.50 110.08 13.6 5.4 2115 9450 30–60 14
35 Feb. 1, 2011 12:53:41.3 50.98 107.85 13.2 4.9 2304 4628 30–55 10
36 Mar. 16, 2011 17:12:36.2 56.63 121.59 14.2 4.9 2163 8908 30–65 13
37 Apr. 25, 2011 22:13:49.1 56.64 121.55 12.8 4.6 2165 5673 30–55 9
38 July 16, 2011 18:38:52.1 52.88 108.52 14.5 5.5 2318 5736 30–55 16
39 July 22, 2011 14:52:55.4 49.65 118.85 13.5 4.9 2292 5347 30–60 10
Columns: 2, date; 3, origin time (hour, minute, second GMT); 4, 5, coordinates of the epicenter; 6 energy class (after T.G. Rautian; thedata are indicated in accordance with BYKL (Baikal department of Geophysical Survey, Siberian Branch of the Russian Academy ofSciences)); 7, body wave magnitude (according to ISC); 8, 9, the minimal and maximal epicentral distances, respectively; 10, periodrange; 11, the number of the stations used for the analysis (see text).
406
IZVESTIYA, PHYSICS OF THE SOLID EARTH Vol. 50 No. 3 2014
SEREDKINA, MELNIKOVA
(Bukchin, 2006; Bukchin, Clevede, and Mostinskiy,2010). For the entire set of events, the period rangedfrom 30 to 110 s (Table 1).
The values of SMT (with a double�couple sourceapproximation) and hypocentral depths were calcu�lated from the obtained surface�wave amplitude spec�tra with the program developed at the Institute ofEarthquake Prediction Theory and MathematicalGeophysics (Bukchin, 1989).
Consider the low�frequency part of the spectra ofthe jth component of the ground displacement for oneof the Love or Rayleigh modes If the frequencyis sufficiently low 1, where Δt is the sourceduration) and the source area is far smaller than thestudied wavelengths, then, we may use instantaneouspoint�source approximation, and the following rela�tionship is valid:
where indices j, k = 1, 2, 3 correspond to the Cartesianaxes, is the spectra of the Green functionfor a given model of the medium and a given wave type(Levshin, 1985; Bukchin, 1989), Mkl are SMT compo�nents, x is the point of recording, and y is the radius�vector of the source.
This method has several specific features. First, thesource is modeled as a rupture on a flat fault segment,caused by the accumulation of the tectonic stresses.This source can be approximated by the double�cou�ple of the forces with moments that are opposite insign. In this case, the SMT components in the isotro�pic medium are described by the following formulas(Kostrov, 1975):
Mkl = M0(nkbl + nlbk),
where M0 is the scalar seismic moment (Aki, 1966),and nk and bl are unit vectors in the directions of thedisplacement and normal to the fault area.
We use the approximation of weak lateral heteroge�neity (Woodhouse, 1974; Babich, Chikachev, andYanovskaya, 1976). In this case, Green’s function ofthe surface waves is determined by the structure of themedium in the vicinities of the source and observationstation, and the surface waves themselves travel alongthe arc of the great circle that connects the epicenterof the earthquake and the station.
In this formulation, only the amplitude spectra isanalyzed, due to which the considered problembecomes nonlinear. On the other hand, the assump�tions of the method make it possible to avoid the errorsassociated with determining the mean phase velocityon the path, which is typically known with a signifi�cant uncertainty.
Finally, the epicentral coordinates and the time ofthe equivalent instantaneous source are assumed to beknown. With these constraints, the errors of these
.( , )ju ωx( tωΔ �
,1( , ) ( , , )j kl jkl
u M Gi
⎡ ⎤∂ω = ω⎢ ⎥ω ∂⎣ ⎦x x y
y
( ), ,jkG ωx y
parameters barely affect the amplitude spectra of thedisplacements (Bukchin, 1989).
Thus, the seismic source can be described in termsof the depth of the dipole, the seismic moment, andthe focal mechanism, which is characterized by thepositions of the fault planes or orientations of the prin�cipal stress axes. During the inversion, four of thelisted parameters are determined by sweeping in thefour�dimensional parametric space, and the seismicmoment is calculated by minimizing the residualsbetween the observed and calculated surface�waveamplitude spectra using the least�square fitting proce�dure.
It is known that the focal mechanism of the earth�quake cannot be unambiguously determined from theamplitude spectra of surface waves only (Mendiguren,1977). In this case, there exist four equivalent solu�tions, which differ by the orientation of the verticalaxis and slip direction. In order to find the uniquesolution, we additionally used the first�motion polari�ties of body waves. For each combination of sourceparameters, we calculated the radiation patterns of thebody waves and compared them with the polarities ofthe observed phases. Before the inversion, the polaritysmoothing procedure was applied (Lasserre et al.,2001).
The quality of the obtained results was evaluated bythe normalized joint residual function ε, which char�acterizes the deviation of the synthetic spectra of thesurface waves from the observed one and shows theratio between the body�wave first�motion polaritiesthat are inconsistent with the calculated radiation pat�tern and the total number of the polarities (Lasserre etal., 2001).
The moment magnitudes Mw were calculated fromthe seismic moment M0 (dyn cm), which is obtained inthe inversion (Hanks and Kanamori, 1979):
Mw = 2/3logM0 – 10.7.
The crustal structure beneath seismic stations andin the vicinity of the earthquake source was approxi�mated by the 3SMAC model (Nataf and Ricard, 1996)and by the 3SMAC or CRUST 2.0 models (Bassin,Laske, and Masters, 2000), whichever provided thelower normalized residual. For describing the uppermantle and the attenuation of surface waves, we usedthe PREM model (Dziewonski and Anderson, 1981).
THE RESULTS OF SMT CALCULATIONS
Since the described method of SMT calculationshas not been previously applied to the Baikal regionand has not been verified on seismic events with Mw <5.2 (Lasserre et al., 2001), it appears reasonable to testit. For doing this, we selected 19 events of the entire setof the earthquakes, for which the SMT solutions fromthe world’s seismological centers were available. Forthe comparison of the calculated parameters of seis�mic sources, we involved all the available information,
IZVESTIYA, PHYSICS OF THE SOLID EARTH Vol. 50 No. 3 2014
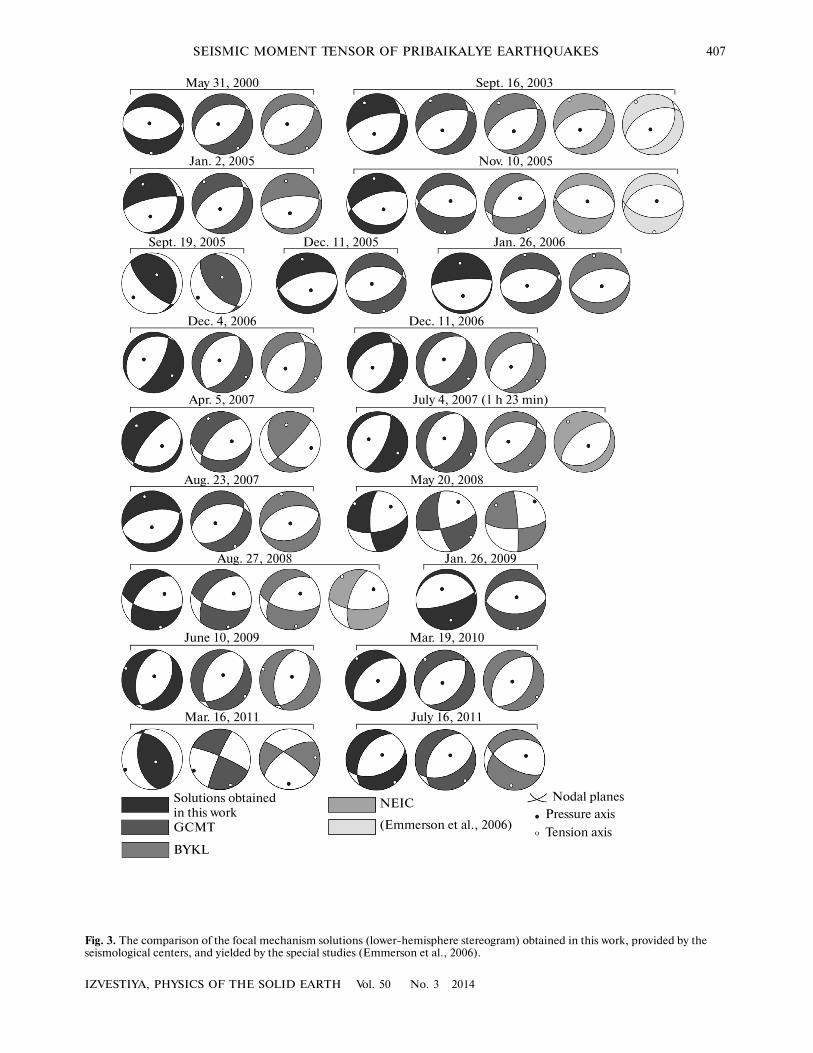
SEISMIC MOMENT TENSOR OF PRIBAIKALYE EARTHQUAKES 407
May 31, 2000 Sept. 16, 2003
Jan. 2, 2005 Nov. 10, 2005
Sept. 19, 2005 Dec. 11, 2005 Jan. 26, 2006
Dec. 4, 2006 Dec. 11, 2006
Apr. 5, 2007 July 4, 2007 (1 h 23 min)
Aug. 23, 2007 May 20, 2008
Aug. 27, 2008 Jan. 26, 2009
June 10, 2009 Mar. 19, 2010
Mar. 16, 2011 July 16, 2011
Solutions obtainedin this workGCMT
BYKL
NEIC
(Emmerson et al., 2006)
Nodal planesPressure axis
Tension axis
Fig. 3. The comparison of the focal mechanism solutions (lower�hemisphere stereogram) obtained in this work, provided by theseismological centers, and yielded by the special studies (Emmerson et al., 2006).
408
IZVESTIYA, PHYSICS OF THE SOLID EARTH Vol. 50 No. 3 2014
SEREDKINA, MELNIKOVA
including the GCMT and NEIC catalogs, first�motion focal mechanism solutions based on the datafrom the regional and remote seismic stations (BYKLdata), and the data published in the literature(Emmerson et al., 2006) (Fig. 3, Table 2).
Figure 3 and Table 2 show that, generally, most ofthe focal mechanisms, as well as the estimates of scalarseismic moments and moment magnitudes quite wellagree, although with a few exceptions. For example,for the earthquake of May 31, 2000 the fault plane azi�muths corresponding to different solutions differ byabout 40°. On one hand, these discrepancies couldprobably be due to the errors of the GCMT solutions.On the other hand, they could have been caused byinsufficient azimuthal coverage due to the smallamount of the initial data used in the present study(Dufumier and Cara, 1995).
Inconsistency of the solutions for the earthquake ofJanuary 26, 2006 whose GCMT components aredetermined with the low errors, is probably associatedwith the inadequacy of the double�couple approxima�tion for the real source. This is also indicated by thedisagreement of the solutions obtained from the sur�face�wave amplitude spectra only and with the use ofthe first�motion body�wave polarities at regional sta�tions. Although this hypothesis is not supported by thedeterminations presented in the GCMT catalog (theparameter characterizing the deviations of the sourcefrom the double�couple model (Dziewonski and
Woodhouse, 1983) is 0.013); this, however, cannot betreated as a direct clue for determining the character offaulting in the source (Aptekman and Tatevosyan,2007). These estimates require additional geologicaland geophysical information.
In our opinion, the inconsistency of the solutionsfor the earthquakes of January 26, 2009 and March 16,2011 is most likely to be associated with the uncertain�ties of GCMT, where the errors in some SMT compo�nents are of the same order of magnitude as the corre�sponding values themselves. The striking difference inthe focal mechanisms of the second event (2011)determined from the first�motion polarities of theseismic waves and provided by the waveform simula�tions can probably be associated with different types offaulting at the initial and final stage of evolution of therupture.
As far as the hypocentral depths are concerned, thedifference in their estimates by different methods mayexceed 15 km, which suggests that the inversion deter�mines this parameter least reliably.
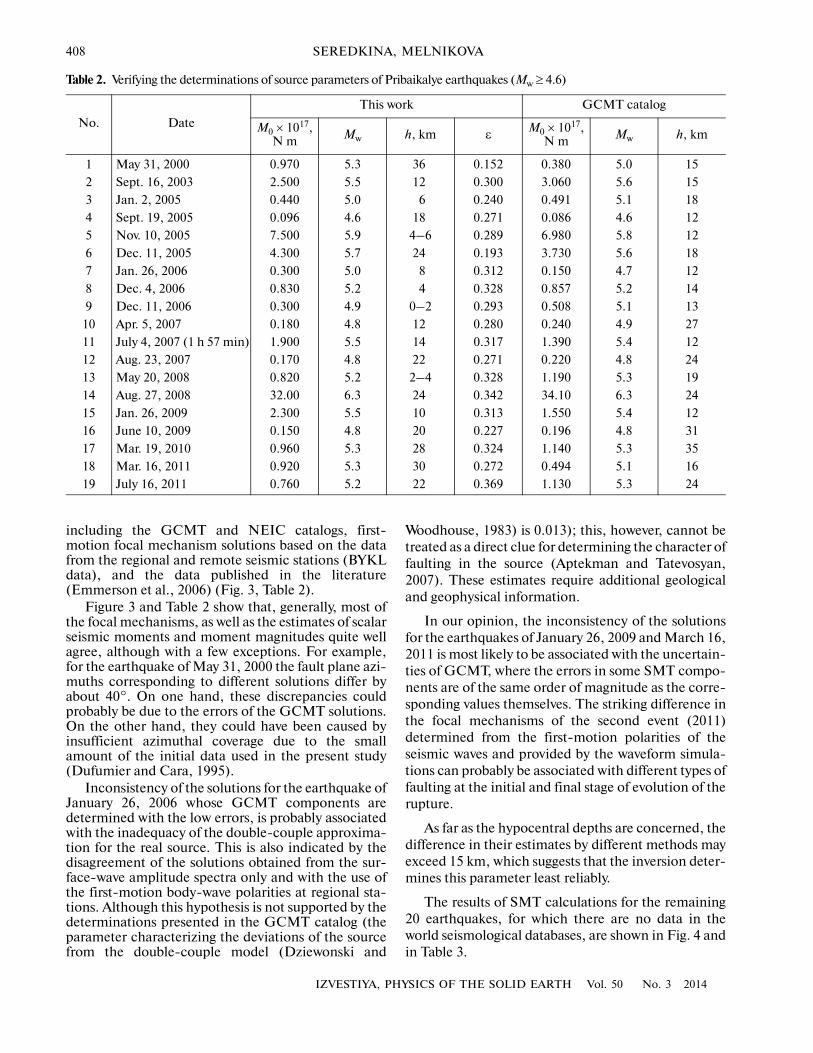
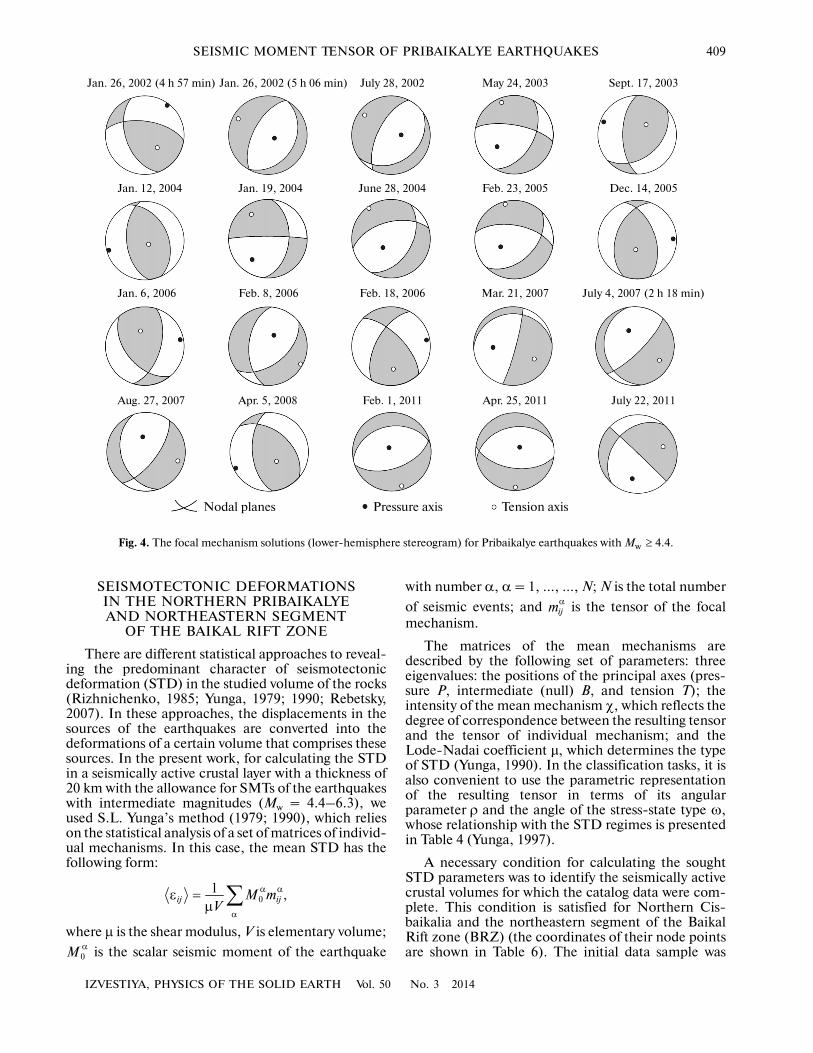
The results of SMT calculations for the remaining20 earthquakes, for which there are no data in theworld seismological databases, are shown in Fig. 4 andin Table 3.
Table 2. Verifying the determinations of source parameters of Pribaikalye earthquakes (Mw ≥ 4.6)
No. Date
This work GCMT catalog
M0 × 1017, N m Mw h, km ε
M0 × 1017, N m Mw h, km
1 May 31, 2000 0.970 5.3 36 0.152 0.380 5.0 15
2 Sept. 16, 2003 2.500 5.5 12 0.300 3.060 5.6 15
3 Jan. 2, 2005 0.440 5.0 6 0.240 0.491 5.1 18
4 Sept. 19, 2005 0.096 4.6 18 0.271 0.086 4.6 12
5 Nov. 10, 2005 7.500 5.9 4–6 0.289 6.980 5.8 12
6 Dec. 11, 2005 4.300 5.7 24 0.193 3.730 5.6 18
7 Jan. 26, 2006 0.300 5.0 8 0.312 0.150 4.7 12
8 Dec. 4, 2006 0.830 5.2 4 0.328 0.857 5.2 14
9 Dec. 11, 2006 0.300 4.9 0–2 0.293 0.508 5.1 13
10 Apr. 5, 2007 0.180 4.8 12 0.280 0.240 4.9 27
11 July 4, 2007 (1 h 57 min) 1.900 5.5 14 0.317 1.390 5.4 12
12 Aug. 23, 2007 0.170 4.8 22 0.271 0.220 4.8 24
13 May 20, 2008 0.820 5.2 2–4 0.328 1.190 5.3 19
14 Aug. 27, 2008 32.00 6.3 24 0.342 34.10 6.3 24
15 Jan. 26, 2009 2.300 5.5 10 0.313 1.550 5.4 12
16 June 10, 2009 0.150 4.8 20 0.227 0.196 4.8 31
17 Mar. 19, 2010 0.960 5.3 28 0.324 1.140 5.3 35
18 Mar. 16, 2011 0.920 5.3 30 0.272 0.494 5.1 16
19 July 16, 2011 0.760 5.2 22 0.369 1.130 5.3 24
IZVESTIYA, PHYSICS OF THE SOLID EARTH Vol. 50 No. 3 2014
SEISMIC MOMENT TENSOR OF PRIBAIKALYE EARTHQUAKES 409
Nodal planes Pressure axis Tension axis
Jan. 26, 2002 (4 h 57 min) Jan. 26, 2002 (5 h 06 min) July 28, 2002 May 24, 2003 Sept. 17, 2003
Jan. 12, 2004 Jan. 19, 2004 June 28, 2004 Feb. 23, 2005 Dec. 14, 2005
Jan. 6, 2006 Feb. 8, 2006 Feb. 18, 2006 Mar. 21, 2007 July 4, 2007 (2 h 18 min)
Aug. 27, 2007 Apr. 5, 2008 Feb. 1, 2011 Apr. 25, 2011 July 22, 2011
Fig. 4. The focal mechanism solutions (lower�hemisphere stereogram) for Pribaikalye earthquakes with Mw ≥ 4.4.
SEISMOTECTONIC DEFORMATIONS IN THE NORTHERN PRIBAIKALYE AND NORTHEASTERN SEGMENT
OF THE BAIKAL RIFT ZONE
There are different statistical approaches to reveal�ing the predominant character of seismotectonicdeformation (STD) in the studied volume of the rocks(Rizhnichenko, 1985; Yunga, 1979; 1990; Rebetsky,2007). In these approaches, the displacements in thesources of the earthquakes are converted into thedeformations of a certain volume that comprises thesesources. In the present work, for calculating the STDin a seismically active crustal layer with a thickness of20 km with the allowance for SMTs of the earthquakeswith intermediate magnitudes (Mw = 4.4–6.3), weused S.L. Yunga’s method (1979; 1990), which relieson the statistical analysis of a set of matrices of individ�ual mechanisms. In this case, the mean STD has thefollowing form:
where µ is the shear modulus, V is elementary volume;
is the scalar seismic moment of the earthquake
01 ,ij ijM mV
α α
α
ε =μ∑
0M α
with number α, α = 1, …, …, N; N is the total number
of seismic events; and is the tensor of the focalmechanism.
The matrices of the mean mechanisms aredescribed by the following set of parameters: threeeigenvalues: the positions of the principal axes (pres�sure P, intermediate (null) B, and tension T); theintensity of the mean mechanism χ, which reflects thedegree of correspondence between the resulting tensorand the tensor of individual mechanism; and theLode�Nadai coefficient μ, which determines the typeof STD (Yunga, 1990). In the classification tasks, it isalso convenient to use the parametric representationof the resulting tensor in terms of its angularparameter ρ and the angle of the stress�state type ω,whose relationship with the STD regimes is presentedin Table 4 (Yunga, 1997).
A necessary condition for calculating the soughtSTD parameters was to identify the seismically activecrustal volumes for which the catalog data were com�plete. This condition is satisfied for Northern Cis�baikalia and the northeastern segment of the BaikalRift zone (BRZ) (the coordinates of their node pointsare shown in Table 6). The initial data sample was
ijmα
410
IZVESTIYA, PHYSICS OF THE SOLID EARTH Vol. 50 No. 3 2014
SEREDKINA, MELNIKOVA
expanded by SMT solutions for 10 seismic events pre�sented in the GCMT catalog (Table 5). Thus, the anal�ysis covered 29 earthquakes that occurred in the stud�ied territory in 1987 to 2011. The averaging of the ini�tial data was conducted by the nodal point method(Sycheva, Bogomolov, and Yunga, 2009) with theweighting function determined for the global�averagedata (Yunga, 1999).
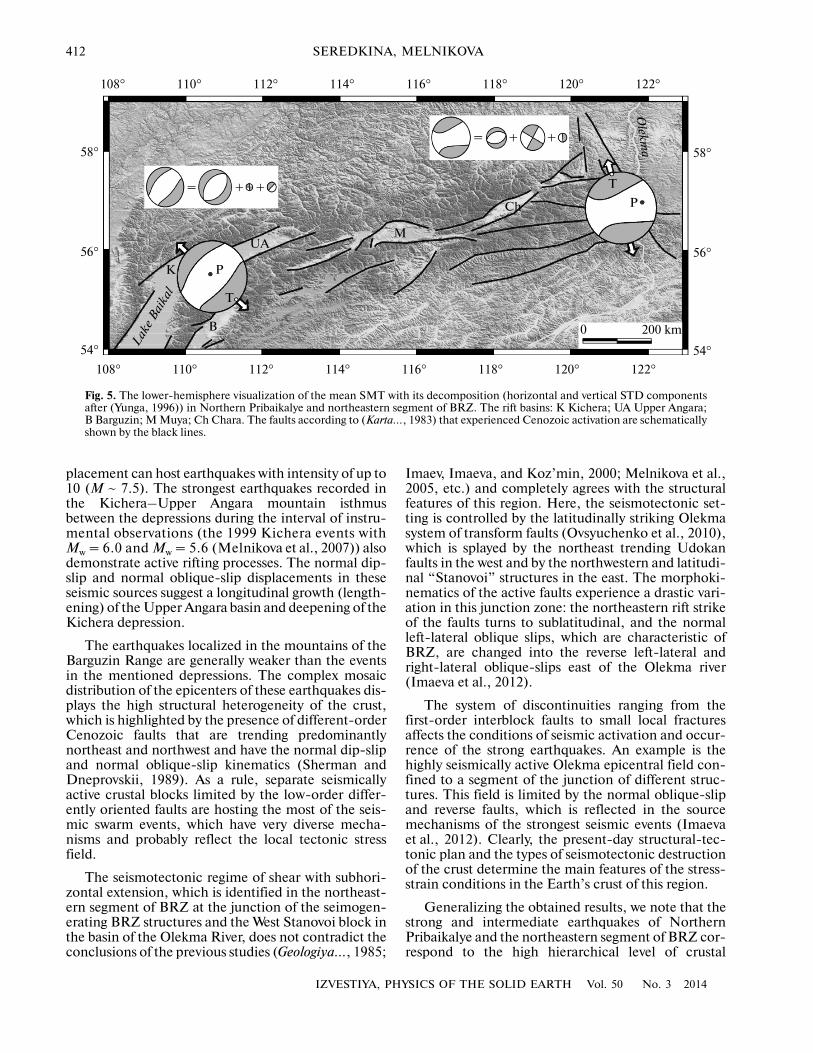
From the calculations of STD shown in Fig. 5 andTable 6, it follows that the region of Northern Prib�aikalye is dominated by the northwestern subhorizon�
tal extension. Within the northeastern segment ofBRZ, where the almost horizontal tension axis is sub�meridional and the inclined axis of pressure is sublati�tudinal, a combination of the conditions of extensionand strike�slip (transtension) is observed.
DISCUSSION OF THE RESULTS
Application and testing of the novel technique ofSMT calculations from the surface�wave amplitudespectra with a double�couple source model for the
Table 3. The source parameters of the Pribaikalye earthquakes (Mw ≥ 4.4)
No. Date M0 × 1017, N m Mw h, km ε
1 Jan. 26, 2002 (4 h 57 min) 0.098 4.6 28 0.328
2 Jan. 26, 2002 (5 h 06 min) 0.120 4.7 20 0.182
3 July 28, 2002 0.120 4.7 6–8 0.303
4 May 24, 2003 0.083 4.6 16 0.288
5 Sept. 17, 2003 0.250 4.9 20 0.320
6 Dec. 1, 2003 0.090 4.6 24 0.235
7 Jan. 19, 2004 0.150 4.7 4–6 0.295
8 June 28, 2004 0.110 4.7 2 0.294
9 Feb. 23, 2005 0.120 4.7 24 0.266
10 Dec. 14, 2005 0.064 4.5 28–30 0.330
11 Jan. 6, 2006 0.059 4.5 10 0.258
12 Feb. 8, 2006 0.071 4.5 4 0.325
13 Feb. 18, 2006 0.093 4.6 20 0.325
14 Mar. 21, 2007 0.094 4.6 4 0.222
15 July 4, 2007 (2 h 18 min) 0.120 4.7 14 0.290
16 Aug. 27, 2007 0.052 4.4 4 0.302
17 Apr. 5, 2008 0.056 4.4 12 0.306
18 Feb. 1, 2011 0.120 4.7 26 0.219
19 Apr. 25, 2011 0.050 4.4 26 0.330
20 July 22, 2011 0.070 4.5 4–6 0.282
Table 4. Classification of STD regimes by the parameters ω and ρ (Yunga, 1997)
No. STD regime ω° ρ°
1 Bilateral compression 0 0
2 Compression 30 0
3 Transpression (transition from shear to compression) 60 0
4 Shear 90 0
5 Transtension (transition from shear to extension) 120 0
6 Extension 150 0
7 Bilateral extension 180 0
8 Transitional from vertical deformation to compression 30 45
9 Oblique slip 90 45
10 Transitional from vertical deformation to extension 150 45
11 Vertical fault 0 90
IZVESTIYA, PHYSICS OF THE SOLID EARTH Vol. 50 No. 3 2014
SEISMIC MOMENT TENSOR OF PRIBAIKALYE EARTHQUAKES 411
Pribaikalye earthquakes shows that the obtainedresults agree with the data provided by the world’s seis�mological centers and with the focal mechanism solu�tions determined from the body�wave first�motionpolarities at regional stations. Therefore, this methodcan improve the quality of the focal mechanism esti�mates in the cases when the solutions provided byother methods are ambiguous; besides, it promotes thesignificant expansion of the data on the source param�eters of the regional earthquakes of intermediate mag�nitudes.
The experimental SMT estimates obtained in thisstudy provide certain possibilities for monitoring thestress�strain field on the corresponding level and pro�mote revealing the spatial and temporal variations ofthese fields. By analyzing the mean SMT parameters,it is also possible to study the implications of the faulttectonics for the present�day stress�strain state of theEarth’s crust in the seismically active regions.
In the region of Northern Pribaikalye, where theSTD calculations revealed the predominance of thesubhorizontal extensional strains oriented across thestrike of the main regional structures, the Earth’s crustis broken into a number of blocks by the large faultzones, which determines the key feature of the geolog�ical structure of this region. The internal structure ofthe blocks is complicated by numerous faults of thesecond, third, and higher orders (regional and localfeatures). Most of these faults have a northeasternstrike (45°–60°), and a few are striking northwest(310°–320°); part of the latter are classified as con�cealed faults and others are expressed only fragmen�tarily (Geologiya…, 1983).
Different morphostructures of the region have dif�ferent seismic potential. According to the seismogeo�logical studies (Khromovskikh et al., 1978; Smekalin,Chipizubov, and Imaev, 2010), the large rift faults witha predominantly normal dip�slip mechanism of dis�
Table 5. The parameters of the earthquakes used in the calculations of STD according to the GCMT catalog
No. Date t0, Time, h min s
Epicenter
Mw h, km
Principal stress axes
ϕ°, N λ°, EP T
AZM° PL° AZM° PL°
1 2 3 4 5 6 7 8 9 10 11
1 July 7, 1987 17:07:25.8 56.67 121.59 5.2 16 351 72 170 18
2 Apr. 20, 1989 23:00:01.4 57.03 121.23 6.3 48 229 17 329 30
3 Apr. 29, 1989 06:25:43.9 57.13 121.80 5.4 46 45 14 137 10
4 Mar. 21, 1999 16:16:06.4 55.82 110.52 5.9 15 158 71 310 17
5 Mar. 21, 1999 16:17:05.3 56.11 110.56 5.9 15 20 87 137 2
6 May 30, 1999 15:56:48.8 56.03 110.04 5.2 15 40 69 134 1
7 May 31, 1999 19:34:52.7 55.99 110.00 5.0 15 332 69 180 19
8 Sept. 8, 1999 02:38:43.9 57.48 120.68 5.1 20 93 36 194 14
9 Dec. 21, 1999 11:00:50.9 56.02 110.63 5.4 15 62 57 330 1
10 Nov. 20, 2006 00:07:27.8 57.40 120.38 4.7 20 66 60 161 3
Columns: 2–5 as in Table 1; 6 the moment magnitude; 7 the depth of the hypocenter; 8–11 parameters of the pressure (P) and tension (T)axes: [AZM] azimuth; [PL] plunge angle.
Table 6. The parameters of STD
Node point
N χ µ ω° ρ°
Principal stress axes
ϕ°, N λ°, EP T
AZM° PL° AZM° PL°
1 2 3 4 5 6 7 8 9 10 11
55.60 110.90 17 0.65 –0.27 140.91 13.67 322 83 133 7
57.00 121.25 12 0.50 –0.54 116.90 12.37 75 38 344 1
Columns: 1, 2 the coordinates of the node points; 3 the number of the earthquakes used in the STD calculations; 4 the intensity of themean mechanism; 5 the Lode�Nadai coefficient; 6 the angle of the type of the stress state; 7 the angle of the intensity; 8–11 the param�eters of the principal stress axes for the mean mechanism.
412
IZVESTIYA, PHYSICS OF THE SOLID EARTH Vol. 50 No. 3 2014
SEREDKINA, MELNIKOVA
placement can host earthquakes with intensity of up to10 (М ~ 7.5). The strongest earthquakes recorded inthe Kichera–Upper Angara mountain isthmusbetween the depressions during the interval of instru�mental observations (the 1999 Kichera events withMw = 6.0 and Mw = 5.6 (Melnikova et al., 2007)) alsodemonstrate active rifting processes. The normal dip�slip and normal oblique�slip displacements in theseseismic sources suggest a longitudinal growth (length�ening) of the Upper Angara basin and deepening of theKichera depression.
The earthquakes localized in the mountains of theBarguzin Range are generally weaker than the eventsin the mentioned depressions. The complex mosaicdistribution of the epicenters of these earthquakes dis�plays the high structural heterogeneity of the crust,which is highlighted by the presence of different�orderCenozoic faults that are trending predominantlynortheast and northwest and have the normal dip�slipand normal oblique�slip kinematics (Sherman andDneprovskii, 1989). As a rule, separate seismicallyactive crustal blocks limited by the low�order differ�ently oriented faults are hosting the most of the seis�mic swarm events, which have very diverse mecha�nisms and probably reflect the local tectonic stressfield.
The seismotectonic regime of shear with subhori�zontal extension, which is identified in the northeast�ern segment of BRZ at the junction of the seimogen�erating BRZ structures and the West Stanovoi block inthe basin of the Olekma River, does not contradict theconclusions of the previous studies (Geologiya…, 1985;
Imaev, Imaeva, and Koz’min, 2000; Melnikova et al.,2005, etc.) and completely agrees with the structuralfeatures of this region. Here, the seismotectonic set�ting is controlled by the latitudinally striking Olekmasystem of transform faults (Ovsyuchenko et al., 2010),which is splayed by the northeast trending Udokanfaults in the west and by the northwestern and latitudi�nal “Stanovoi” structures in the east. The morphoki�nematics of the active faults experience a drastic vari�ation in this junction zone: the northeastern rift strikeof the faults turns to sublatitudinal, and the normalleft�lateral oblique slips, which are characteristic ofBRZ, are changed into the reverse left�lateral andright�lateral oblique�slips east of the Olekma river(Imaeva et al., 2012).
The system of discontinuities ranging from thefirst�order interblock faults to small local fracturesaffects the conditions of seismic activation and occur�rence of the strong earthquakes. An example is thehighly seismically active Olekma epicentral field con�fined to a segment of the junction of different struc�tures. This field is limited by the normal oblique�slipand reverse faults, which is reflected in the sourcemechanisms of the strongest seismic events (Imaevaet al., 2012). Clearly, the present�day structural�tec�tonic plan and the types of seismotectonic destructionof the crust determine the main features of the stress�strain conditions in the Earth’s crust of this region.
Generalizing the obtained results, we note that thestrong and intermediate earthquakes of NorthernPribaikalye and the northeastern segment of BRZ cor�respond to the high hierarchical level of crustal
108° 110° 112° 114° 116° 118° 120° 122°
58°
56°
54°
108° 110° 112° 114° 116° 118° 120° 122°
58°
56°
54°
+
=
К Р
Т
B
UAМ
Ch
Lak
e Ba
ikal
Olekm
a
+
+ +
=Р
Т
0 200 km
Fig. 5. The lower�hemisphere visualization of the mean SMT with its decomposition (horizontal and vertical STD componentsafter (Yunga, 1996)) in Northern Pribaikalye and northeastern segment of BRZ. The rift basins: K Kichera; UA Upper Angara;B Barguzin; M Muya; Ch Chara. The faults according to (Karta…, 1983) that experienced Cenozoic activation are schematicallyshown by the black lines.
IZVESTIYA, PHYSICS OF THE SOLID EARTH Vol. 50 No. 3 2014
SEISMIC MOMENT TENSOR OF PRIBAIKALYE EARTHQUAKES 413
destruction. In the first case, they reflect rifting activ�ity, and in the second case, interaction of the riftextension and “Stanovoi” compression, which is dis�played in the transtension regime of deformation.These facts do not contradict the conclusion of (Sher�man and Dneprovskii, 1989) that regional tectonicstress fields are closely related with the general struc�tural discontinuities, and their action is commensu�rate with the time of tectonic evolution of largeregions.
CONCLUSIONS
It is established that the method for SMT calcula�tion from the amplitude spectra of surface waves isapplicable to the intermediate�magnitude earthquakesof Pribaikalye region and is suitable for obtaining reli�able estimates of the sought parameters. Using thismethod, we obtained SMT for 39 regional seismicevents with Mw = 4.4–6.3 that occurred in 2000–2011.
The seismotectonic deformations of the Earth’scrust of the Northern Pribaikalye and northeasternsegment of BRZ calculated from SMT of the interme�diate�magnitude earthquakes show that this level ofrock destruction reflects the long�term characteristicsof the stress�strain field of BRZ, i.e., predominance ofthe subhorizontal northwestern extension in the cen�tral segment and combination of shear and extensionin the northeastern segment.
In conclusion, we note that the obtained resultsimprove the reliability of the detailed studies of thestress�strain conditions of the Earth’s crust and pro�mote constructing the most feasible models of the geo�dynamical setting for the Baikal region.
ACKNOWLEDGMENTS
We are grateful to Dr. B.G. Bukchin (Institute ofEarthquake Prediction Theory and MathematicalGeophysics) for his consulting and help. The work wassupported by the Russian Foundation for BasicResearch (grant no. 14�05�31173).
REFERENCES
Aki, K., Generation and propagation of G waves from theNiigata earthquake of June 16, 1964. Part 1: A statisticalanalysis, Bull. Earthquake Res. Inst., Univ. Tokyo, 1966,vol. 44, no. 1, pp. 23–72.Aptekman, Zh.Ya. and Tatevosyan, R.E., On the possibilityof detecting complex sources of earthquakes from data ofthe Centroid Moment Tensor Catalog, Izv., Phys. SolidEarth, 2007, vol. 43, no. 5, pp. 341–353.Arefiev, S.S., Epitsentral’nye seismologicheskie issledovaniya(Epicentral Seismological Studies), Moscow: Aka�demkniga, 2003.Babich, V.M., Chikhachev, B.A., and Yanovskaya, T.B.,Surface waves in a vertically heterogeneous elastic half�space with weak horizontal heterogeneity, Izv. Akad. NaukSSSR, Ser. Fiz., 1976, no. 4, pp. 24–31.
Barth, A. and Wenzel, F., New constraints on the intraplatestress field of the Amurian plate deduced from light earth�quake focal mechanisms, Tectonophysics, 2010, vol. 482,pp. 160–169.Bassin, C., Laske, G., and Masters, G., The current limitsof resolution for surface wave tomography in North Amer�ica, EOS Trans., Am. Geophys. Union, 2000, vol. 81, F897.Bukchin, B.G., On determining the source parameters ofan earthquake from the records of surface waves in themedium with ill�defined parameters, Izv. Akad. NaukSSSR, Ser. Fiz., 1989, no. 9, pp. 34–41.Bukchin, B.G., Specific features of surface wave radiationby a shallow source, Izv., Phys. Solid Earth, 2006, vol. 42,no. 8, pp. 712–717.Bukchin, B., Clevede, E., and Mostinskiy, A., Uncertaintyof moment tensor determination from surface wave analysisfor shallow earthquakes, J. Seismol., 2010, vol. 14, no. 3,pp. 601–614.Delouis, B., Deverchere, J., Melnikova, V., Radzimino�vitch, N., Loncke, L., Laroque, C., Ritz, J.�F., andSan’kov, V., A reappraisal of the 1950 (Mw 6.9) Mondyearthquake, Siberia, and its relationship to the strain pat�tern at the southwestern end of the Baikal Rift zone, TerraNova, 2002, vol. 14, no. 6, pp. 491–500.Doser, D.I., Faulting within the western Baikal rift as char�acterized by earthquake studies, Tectonophysics, 1991a,vol. 196, pp. 87–107.Doser, D.I., Faulting within the eastern Baikal rift as char�acterized by earthquake studies, Tectonophysics, 1991b,vol. 196, pp. 109–139.Dufumier, H. and Cara, M., On the limits of linear momenttensor inversion of surface wave spectra, Pure Appl. Geophys,1995, vol. 145, no. 2, pp. 235–257.Dziewonski, A.M. and Anderson, D.L., Preliminary refer�ence Earth model, Phys. Earth Planet. Inter., 1981, vol. 25,pp. 297–356.Dziewonski, A.M. and Woodhouse, J.H., An experiment insystematic study of global seismicity: centroid�momenttensor solutions for 201 moderate and large earthquakes of1981, J. Geophys. Res., 1983, vol. 88, no. B4, pp. 3247–3271.Emmerson, B., Jackson, J., McKenzie, D., andPriestley, K., Seismicity, structure and rheology of the litho�sphere in the Lake Baikal region, Geophys. J. Int., 2006,vol. 167, pp. 1233–1272.Geologiya i seismichnost’ zony BAM. Strukturno�vesh�chestvennye kompleksy i tektonika (Geology and Seismicityof the Region of Baikal�Amur Mainline: Structural�Mate�rial Complexes and Tectonics), Zamaraev, S.M.,Grabkin, O.V., Mazukabzov, A.M., Lashchenov, V.A., andMel’nikov, A.I., Novosibirsk: Nauka, 1983.Geologiya i seismichnost’ zony BAM. Seismichnost’ (Geologyand Seismicity of the Region of Baikal�Amur Mainline:Seismicity), Golenetskii, S.I., Kochetkov, V.M., Solo�nenko, A.V., et al., Novosibirsk: Nauka, 1985.Hanks, T. and Kanamori, H., A moment magnitude scale,J. Geophys. Res., 1979, vol. 84, no. B5, pp. 2348–2350.Imaev, V.S., Imaeva, L.P., and Koz’min, B.M., Seismotek�tonika Yakutii (Seismotectonics of Yakutia), Moscow:Geos, 2000.Imaeva, L.P., Mel’nikova, V.I., Imaev, V.S.,Koz’min, B.M., Mel’nikov, A.I., and Grib, N.N., Evoly�
414
IZVESTIYA, PHYSICS OF THE SOLID EARTH Vol. 50 No. 3 2014
SEREDKINA, MELNIKOVA
utsiya seismotektonicheskikh protsessov severo�vostochnogoflanga Baikal’skoi riftovoi zony (Evolution of Seismotecton�ical Processes in the Northeastern Margin of the Baikel RiftZone), Irkutsk: IZK SO RAN, 2012.Karta neotektoniki regiona Baikalo�Amurskoi magistrali.M�b 1 : 3000 000 (The 1 : 3000000 Neotectonical Map ofthe Baikal�Amur Mainline Region), Logachev, N.A, Ed.,Irkutsk: IZK SO AN SSSR, 1983.Khromovskikh, V.S., Solonenko, V.P., Chipizubov, A.V.,and Zhilkin, V.M., Seismotectonic characteristic of north�ern Cisbaikalia revisited, in Seismichnost’ i glubinnoe stroe�nie Pribaikal’ya (Seismicity and Deep Structure of Cis�baikalia), Novosibirsk: Nauka, SO RAN, 1978.Kostrov, B.V., Mekhanika ochaga tektonicheskogo zem�letryaseniya (The Mechanics of the Source for TectonicEarthquakes), Moscow: Nauka, 1975.Lasserre, C., Bukchin, B., Bernard, P., Tapponier, P.,Gaudemer, Y., Mostinsky, A., and Dailu, R., Sourceparameters and tectonic origin of the 1996 June 1 Tianzhu(Mw = 5.2) and 1995 July 21 Yongen (Mw = 5.6) earthquakesnear the Haiyuan fault (Gansu, China), Geophys. J. Int.,2001, vol. 144, no. 1, pp. 206–220.Levshin, A., Effects of lateral inhomogenity on surface waveamplitude measurements, Ann. Geophys., 1985, vol. 3,pp. 511–518.Levshin, A.L., Yanovskaya, T.B., Lander, A.V.,Bukchin, B.G., Barmin, M.P., Ratnikova, L.I., andIts, E.N., Poverkhnostnye seismicheskie volny v gorizon�tal’no�neodnorodnoi Zemle (Surface Seismic Waves in Hor�izontally Heterogeneous Earth), Moscow: Nauka, 1986.Melnikova, V.I., Radziminovich, N.A., Gileva, N.A.,Chipizubov, A.V., and Dobrynina, A.A., Activation of rift�ing processes in the Northern Cis�Baikal Region: A casestudy of the Kichera earthquake sequence of 1999, Izv.,Phys. Solid Earth, 2007, vol. 43, no. 11, pp. 905–921.Melnikova, V.I., Radziminovich, N.A., Imaev, V.S., andKoz’min, B.M., Seismotectonic deformations of theStanovoi sector of the Baikal rift zone according to seismo�logical data, Materialy Vserossiiskoi nauchno�prakticheskoikonferentsii, posvyashchennoi 30�letiyu g. Neryungri, 24–27 okt. 2005 (Proc. All�Russian Scientific and ResearchConference on the 30th Anniversary of Neryungry, October24–27, 2005), Neryungri, 2005, pp. 13–18.Mendiguren, J.A., Inversion of surface wave data in sourcemechanism studies, J. Geophys. Res, 1977, vol. 82, no. 5, pp.889–894.Nataf, H.�C. and Ricard, Y., 3SMAC: On a priori tomo�graphic model of the upper mantle based on geophysical
modeling, Phys. Earth Planet. Inter., 1996, vol. 95, pp. 101–122.Ovsyuchenko, A.N., Trofimenko, S.V., Marakhanov, A.V.,et al., Seismotectonics of the transitional region from theBaikal Rift Zone to orogenic rise of the Stanovoi Range,Geotektonics, 2010, vol. 44, no. 1, pp. 25–44.Radziminovich, Ya.B., Mel’nikova, V.I., Seredkina, A.I.,Gileva, N.A., Radziminovich, N.A., and Papkova, A.A.,The Balei earthquake of 6 January 2006 (Mw = 4.5): A rarecase of seismic activity in eastern Transbaikalia, Rus. Geol.Geophys., 2012, vol. 53, no. 10, pp. 1100–1110.Rebetsky, Yu.L., Tektonicheskie napryazheniya i prochnost'prirodnykh massivov (Tectonic Stresses and the Strength ofRock Massifs), Moscow: Akademkniga, 2007.Riznichenko, Yu.V., Problemy seismologii (Problems ofSeismology), Moscow: Nauka, 1985.Sherman, S.I. and Dneprovskii, Yu.I., Polya napryazheniizemnoi kory i geologo�strukturnye metody ikh izucheniya(Stress Fields in the Earth’s Crust and Geological–Struc�tural Methods for Their Study), Novosibirsk: Nauka, 1989.Smekalin, O.P., Chipizubov, A.V., and Imaev, V.S., Pale�oearthquakes in the Baikal region: Methods and results oftiming, Geotektonics, 2010, vol. 44, no. 2, pp. 158–175.Sycheva, N.A., Bogomolov, L.M., and Yunga, S.L., Geoin�formatics in the statistical approach to the calculation ofseismotectonic deformations, Geoinformatika, 2009, no. 1,pp. 33–43.Woodhouse, J.H., Surface waves in the laterally varyingstructure, Geophys. J. R. Astron. Soc, 1974, vol. 90, no. 12,pp. 713–728.Yunga, S.L., On the deformation mechanism of seismicallyactive domain of the Earth’s crust, Izv. Akad. Nauk SSSR,Fiz. Zemli, 1979, no. 10, pp. 4–23.Yunga, S.L., Metody i rezul’taty issledovaniya seismotek�tonicheskikh deformatsii (Methods and Results of Studyingthe Seismotectonic Deformations), Moscow: Nauka, 1990.Yunga, S.L., Seismotectonic deformation of the NorthernEurasian fold belts in the neotectonic phase, Izv., Phys.Solid Earth, 1996, vol. 32, no. 12, pp. 37–58.Yunga, S.L., Classification of seismic moment tensors onthe basis of their isometric mapping on a sphere, Dokl.Earth Sci., 1997, vol. 352, no. 1, pp. 108–110.Yunga, S.L., Comparative analysis of seismotectonic defor�mations in the geodynamically active regions, in Geofizikana rubezhe vekov (Geophysics at the Turn of the Century),Moscow: OIFZ RAN, 1999, pp. 253–264.
Translated by M. Nazarenko


![GMT ex08 : Geoware · Seismology CMT_catalog.d: Harvard Centroid Moment Tensor earthquakes, 1976-2003 (to 09/31) [Harvard]. bigquake.tsv: Pacheco & Sykes catalog of large earthquakes](https://img.pdfslide.net/doc/110x75/61077903dbab95225e1f0f71/gmt-ex08-seismology-cmtcatalogd-harvard-centroid-moment-tensor-earthquakes.jpg)