Embed Size (px)
Citation preview

Journal of Volcanology and Geothermal Research, 43 (1990) 311-320 Elsevier Science Publishers B.V., Amsterdam
311
Seismic monitoring of the Chipilapa geothermal area (El Salvador)
H. F A B R I O L , A. B E A U C E a n d D. L E M A S N E
Bureau de Recherches G~ologiques et Mini~res (BRGM), Institut Mixte de Recherches G~othermiques (IMRG), Avenue de Concyr - BP 6009 - 45060 Orleans Cedex 02, France
(Received September 21, 1989; revised and accepted March 21, 1990)
Abstract
Fabriol, H., Beauce, A. and Le Masne, D., 1990. Seismic monitoring of the Chipilapa geothermal area (El Salvador). J. Volcanol. Geotherm. Res., 43: 311-320.
Microearthquake monitoring of the Chipilapa geothermal area (El Salvador) was carried out between 26 August, 1988 and 7 November, 1988 in order to determine the background level of the seismicity before any exploitation of the field. More than 500 local events were recorded, as well as 500 regional ones related to the subduction of the Cocos plate under the Caribbean plate. The local microseismicity is rather continuous, with small swarms every 10-15 days. Duration magnitudes do not exceed 2.3, and the b parameter has a value of 1.02, slightly higher than the normal value for tectonic events. The seismicity is mainly located at the southern edge of the recording network, outside the geothermal area. Six clusters of hypocenters were defined:
One very shallow which overlaps the southeastern boundary of the network and could be related to the geothermal field itself.
Four clusters are sited beneath faults or volcanic centers visible at the surface, and consequently could be associated with the recharge of the geothermal field.
The sixth cluster is located at the north of the area and is irrelevant to the Chipilapa zone.
Introduction
The Chip i lapa geo the rma l field is s i ted nea r the A h u a c h a p a n geo the rma l field, 80 k m west of San Salvador , capi ta l of E1 Salvador , and 15 k m eas t of the G u a t e m a l a border (Fig. 1). Exploi ta- t ion of A h u a c h a p a n s ta r t ed in the ear ly seven- ties, 32 wells have been dri l led and a power p lan t produces more t h a n 60 MW, which is 25% to 35% of the na t iona l electr ic consumption.
The Chip i lapa project covers a 2 5 - k i n 2 a rea located 3 k m east of the A h u a c h a p a n produc t ion area , the hea t source be ing probably the same for
bo th reservoirs . The explora t ion phase is con- c luded and the f irs t exp lora tory well, C H - 7 , r eached the rese rvo i r s t a r t i ng at 6 5 0 - m depth, wi th t e m p e r a t u r e s g rea te r t h a n 190°C at the bo t tom of the dri l lhole (1500 m).
The geo the rma l a reas lie in the n o r t h e r n foothil ls of the volcanic coastal r ange of Ple is tocene age, which ex tend f rom the G u a t e m a l a border at the west to the Gul f of Fonseca at the east. The volcanic ac t iv i ty is r e l a t ed to the subduct ion of the Cocos P la te b e n e a t h the Car ibbean plate , and it is locally charac te r ized by m a n y young volcanoes (e.g.

312 H. F A B R I O I , E T AI.
• ' ' " ' ' / 1
SEA
EL. SA,VADOR " ~ ~ f /
- oc4 -~ , t . ? " oo.,
(,e]C
~eO0 I
90=00 ' B9 "30 " ~9 "00 r
[ ~ ~ANTAA NA
SAN
Chipilopo and Ahuochopon geothermol oreo
gg" )0" gg'00 ~7" ~0 'f
I s
HONDURAS ,
g.4~~/c44,, i ; /
! J I I ~ ~3. - ,"~.~, , J , . , Golfo
~ACIFIC [ OCEAN
Fig. 1. Location map of E1 Salvador and Chipilapa geothermal area.

SEISMIC MONITORING OF THE CHIPILAPA GEOTHERMAL AREA 3 1 3
Cerro Laguna Verde, 1699 m a.s.l., Cerro Las Ninfas, 1774 m a.s.1.) and by impressive fumarolic areas and solfatara (Fig. 2). North of the volcanic range lies the main E - W structure of the Central Graben. The geothermal reser- voirs belong to the volcanic unit although spatially linked to the E - W faulting of the Graben.
Our study of the local microseismicity started in August 1988 with a 2-month effective monitoring period that had two objectives:
(1) A better definition of the reservoir and its recharge and the associated structures.
(2) Evaluation of the main characteristics of the local seismic activity to define the initial state of the seismicity before any geothermal
316 -I
315-.I
3,41
iii 1 307~
3o6d
305~
CENTRAL ~RABEN 0 TURIN
Ahuachopon geothermot fietd ~ 1 nc, ' /
Los Angeles /
Cerro.l,....-- ~' j / ] LI berro i gun° iVerde Cuyaneusul / "
~ ~ ~ C e r r o '~!st/ III / Los NinfQs • Hydrothermal manifestation
• Seismological recording site / Fault
Crater or caidera margin / ~ - L i m i t of the geothermal area
0 I 2Kin
3044 t
410 411 412 413 4;4 4;5 416 417 ;8 419 420 421
Fig. 2. Tectonic map of the Chipilapa area with seismological recording sites.
314 H FABIi i IK. E T A ! ,
production. For the 1988 survey, the network of
seismometers was designed to cover the suppos- ed production area with instruments sensitive enough to detect any event of low magnitude. A monitoring of microseismicity in the Ahuacha- pan area took place between December 1969 and August 1970 (Ward and Jacob, 1971). The number of regional (T s - Tp > 8s) events record- ed at that t ime was rather high (350) and the number of local ( T s - T p > 8s) events lower (150). Regional and local event rates observed during the 1988 survey were higher.
This paper deals with a qualitative description of the seismicity in a preliminary state and with a first interpretation of the spatial distribution of the hypocenters according to geology.
The n e t w o r k and the main character i s t i cs o f the survey
The array is shown in Figure 2 as well as the major faults of the Ahuachapan-Chipilapa area.
The network includes 6 vertical geophones and 3 three-component sites, all linked by wires to the central station (Finca Los Angeles), where the data are digitized at 200 Hz and preliminary event detection and location of events are carried out in real time. The system is permanently on watch and triggers the data storage from the 15 channels, as soon as a seismic event is detected on three presetected stations. For each detected event, the computer picks the arrival times of P- wave (6 out of the 9 vertical geophones) and S- wave onsets (horizontal geophones) and com~ putes the hypocenter coordinates. The resulting epicenter and the seismograms used for detec- tion are automatically plotted on the console.
Back in the BRGM laboratory the data were carefully analysed and events classified into three classes:
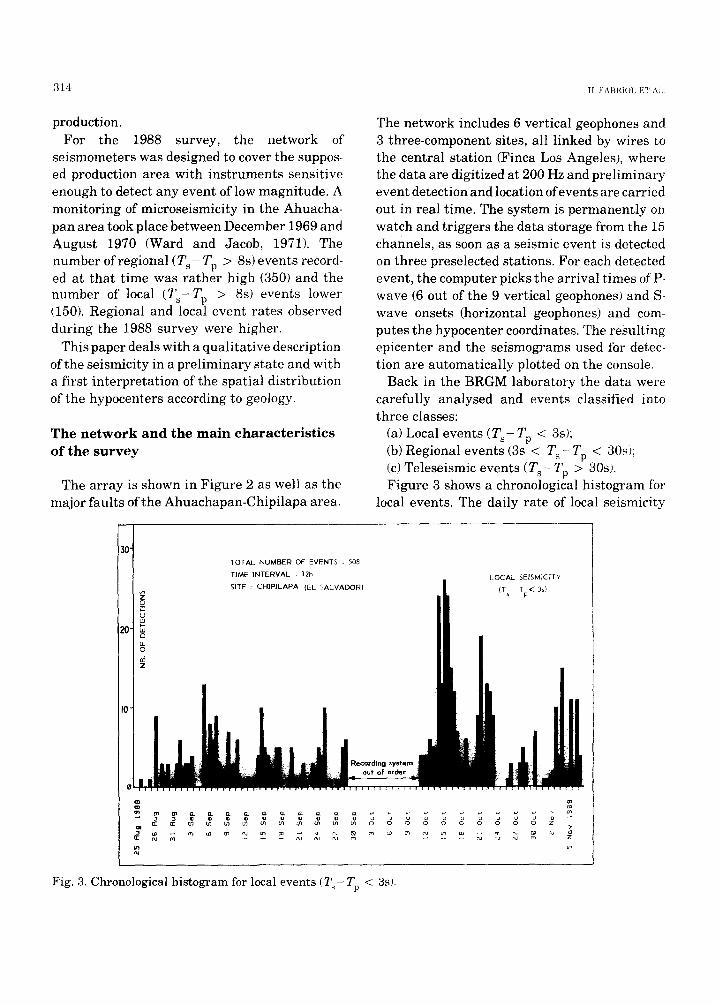
(a) Local events (T s - Tp < 3s); (b) Regional events (3s < Ts-- Tp < 30si; (c) Teleseismic events (Ts- Tp > 30s). Figure 3 shows a chronological histogram fbr
local events. The daily rate of local seismicity
301 T O T A L N U M B E R O F E V E N T S = 5 0 8
T I M E I N T E R V A L | 2 h I O C A L S E I S M | C I I Y
I SITE :: C.IP,,APA IEL ~ALVAOORI ~ /T Tp< 3~t
I L
I0
' Recording system i :::
c~ ~ ~ ~ r~ ~ ~ . . . . . ru ru r~ Z
Fig. 3. Chronological histogram for local events (T-Tp < 3s).
SEISMIC MONITORING OF THE CHIPILAPA GEOTHERMAL AREA 3J-5
ranges from 5 to 10 microearthquakes per day, with small crises every 1 0 - 1 5 days, correspon- ding to swarms of events clustered in space and time. This is ra ther different from the results of the 1969-1970 survey, probably because of the lower sensitivity of the earlier network.
The regional seismicity was very high, in par- t icular between 13 and 19 October, a period dur- ing which 6 deep ear thquakes were reported by the United States Department of Interior (1988), near the Guatemala coast. Another major regional crisis was recorded between 3 and 5 November with two offshore ear thquakes of magnitude 5.4 and 5.1, strongly felt in Chipilapa.
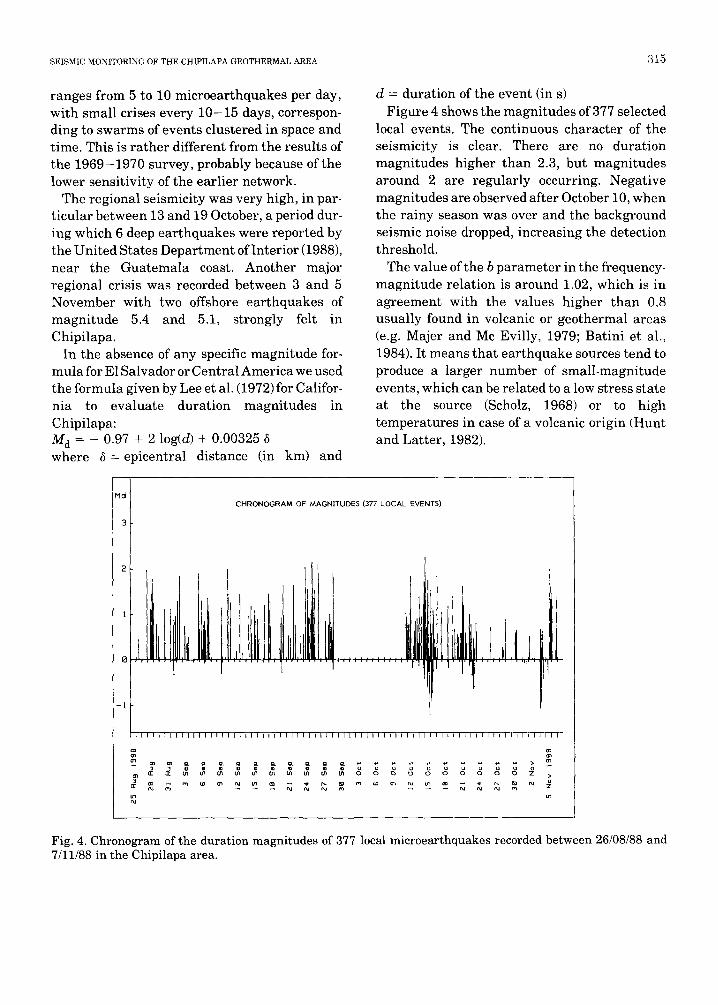
In the absence of any specific magnitude for- mula for E1 Salvador or Central America we used the formula given by Lee et al. (1972)for Califor- nia to evaluate duration magnitudes in Chipilapa: M d = - 0.97 + 2 log(d) + 0.00325 5 where 5 = epicentral distance (in km) and
Md
3
- I
L
d = duration of the event (in s) Figure 4 shows the magnitudes of 377 selected
local events. The continuous character of the seismicity is clear. There are no duration magnitudes higher than 2.3, but magnitudes around 2 are regularly occurring. Negative magnitudes are observed after October 10, when the rainy season was over and the background seismic noise dropped, increasing the detection threshold.
The value of the b parameter in the frequency- magnitude relation is around 1.02, which is in agreement with the values higher than 0.8 usually found in volcanic or geothermal areas (e.g. Majer and Mc Evilly, 1979; Batini et al., 1984). It means that ear thquake sources tend to produce a larger number of small-magnitude events, which can be related to a low stress state at the source (Scholz, 1968) or to high temperatures in case of a volcanic origin (Hunt and Latter, 1982).
C H R O N O G R A M OF MAGNITUDES (377 L O C A L EVENTS)
!ll L L L L I L i I I I I l l I t I I L L i L [ [ 1 i l L L ~ l l l l l l l l I L L L l i l f ) l ' l l I L l i l l
~ a- a. O. Q. O. O. O. O. O.
L ~ I t i t I I I I I I I I I
g o o o m
m
Fig. 4. Chronogram of the duration magnitudes of 377 local microearthquakes recorded between 26/08/88 and 7/11/88 in the Chipilapa area.

3 1 6 H. FT\~RIOL ~,:T AL
Hypocenters dis tr ibut ion in the Chipi lapa area
The hypocenters of 125 microearthquakes with clear P- and S-wave onsets were determined with the computer program HYPO71 (Lee and Lahr, 1975). A 5-layer model was defined, using
three calibration dynamite shots in shallow holes and the known geology and geophysics (Table 1). The common value of 1.732 was used for Vp/V s ratio, since there was no information on the S-wave velocities. Figure 5 shows the loca- tion map of the epicenters together with two ver- tical projections of hypocenters on N - S and
409 42~
IKm
l lKm
ID 121
÷
: . ~ : b \ \ . ' \ i
" i . . . . . . . . ; . . . . . . . . . . . . . . . . . . . . . . . t
423
+
Z
Z !
; 2 "
304L . . . . . . . . . .
Depth In [Kin)
÷
/ \ {
Seismological network
Seismic event
3d group of seismic events
Limit of the geothermal area
Fig. 5. Map and section views of the hypocenter locations of 125 selected events.

SEISMIC MONITORING OF THE CHIPILAPA GEOTHERMAL AREA
TABLE 1
P-wave velocity model used by HYPO71 for the deter- ruination of hypocenters
Layer no. Thickness P-wave velocity (km) (km/s)
1 0.2 2 2 0.8 3.7 3 1.5 4.2 4 7.5 5 5 - 6
TABLE 2
Mean residual errors calculated by HYPO71 for each station, from 125 selected events
Station Res.P(ms) Num-P Res.S(ms) Num-S
3 2.5 121 -7 .2 93 4 3.2 95 -14.1 20 7 13.4 119 7.2 91 8 20.3 78 1.2 5
11 -20.0 121 -16.7 96 12 0.0 90 30.1 7 13 2.1 86 20.3 3 14 5.9 106 -30.5 3 15 -4 .4 100 -0 .4 10
Res.P (Res.S): Mean residual error in P-wave (S-wave) arrival times for a given station. Num-P (Num-S): Number of events used to evaluate the mean P-residual (S-residual) for this station.
E - W planes . The se i smic i ty is m a i n l y distr ib- u ted sou th of the ne twork , u n d e r the volcanoes a t dep ths less t h a n 6 km. Six spa t i a l c lus te rs were def ined and can be seen in F i g u r e 6. The m e a n
locat ion e r ro r s e s t i m a t e d by H Y P O 7 1 for 125 even t s a re as follows:
- hor izon ta l error : 0.32 kin; - ve r t i ca l error : 1.18 km; - RMS er ro r in a r r i v a l t imes: 28.7 ms.
317
Tab le 2 p r e sen t s the m e a n r e s idua l e r ro rs for each s ta t ion. I t can be seen t h a t P-wave res idua l
e r ro r s a re r a t h e r low for all s t a t ions except 8 and 11. S t a t i on 8 is the mos t d i s t an t f rom mos t of the
even t s and s ta t ion 11 m u s t be considered as anomalous , which had been obse rved d u r i n g the ca l ib ra t ion shots. For S-wave res iduals , s t a t ions 3,7 and 11 can only be considered, since S ar-
r i va l s a re accu ra t e ly p icked on the 3-component s e i s m o m e t e r s only. He re a g a i n s t a t ion 11 is anomalous , compa red wi th s ta t ions 3 and 7. To tes t the va l id i ty of the locat ion of the hypocen te r s , we r a n HYPO71 for the s ame 125 m i c r o e a r t h q u a k e s a l r eady selected wi thou t sta-
t ion 11. The gene ra l t r ends a re p rese rved , bu t the even t s of each group a re less c lus te red and the posi t ions of the d i f ferent groups are ap- p rec iab ly moved in space (be tween 0.5 and 1.5
k m in the hor izonta l p l ane and be tween 0.5 and 3 k m in the ver t i ca l plane). The more i m p o r t a n t
shif t occurs for group 5, which is m o v e d 3 k m downwards .
R e l a t i o n s b e t w e e n se i smic i ty , t e c t o n i c s a n d g e o t h e r m a l act iv i ty
The 6 groups of even t s of F i g u r e 6 can be inter- p re t ed as follows, based on the s t ruc tu r a l f rame- work of the a r e a (CEL, 1988):
(a) Group I bas ica l ly inc ludes 16 even t s occurr- ing du r ing two smal l s w a r m s and is s u r r o u n d e d by mos t of the even t s t h a t canno t be c lus te red in
a specific group. The volcanic axis of Cer ro Las Ninfas , Hoyo Cua jus te and Cer ro L a g u n a Verde a p p e a r s to be a n ac t ive zone, w i th even t s occurr- ing du r ing s w a r m s or all over the survey. This volcanic a r ea is k n o w n to be the r echa rge zone of the A h u a c h a p a n g e o t h e r m a l field and of the C h i p i l a p a field too. However , we canno t conf i rm a r e l a t i on b e t w e e n the m i c r o e a r t h q u a k e s of
g roup 1 and g e o t h e r m a l ac t iv i ty , since the fo rmer a re a t 2.5 to 3.5 k m depth. The diffuse ac- t iv i ty , a t sha l lower dep ths and a round group 1, is p robab ly l inked to the f r ac tu re s t h r o u g h which the g e o t h e r m a l f luid percola tes .

316-
315"
314 3
313 -1
312 -
311
310
309- •
!308 I
307-
3 0 6 - .
CENTRAL GRABEN
\ \
@B
Ahuochopon geofherrnal field / .,.." .
\\_
~. Cerro Los Ninfes
: ip°; °
~ R I N
Cu
' 1 - -
4'11 4'12 413 414 4'15 4~6 417 ~8 4;9 420 421 [ . . . . . . . . . . . . . . . . . . .
Depth of the 6 groups of seismic events
} ) Shallow (0 < Z < 1.5 kin)
Intermediate (1.5 < Z < 4.5 km)
Deep (4.5 < Z < 9 km)
• Hydrothermal manifestation
• Seismological recording site
/ Fault
{~" Crater or caldera margin
/ L i m i t of the geothermal area /
Fig. 6. Interpretation map of microearthquake groups in relation with the structural framework.
(b) Group 2 is the shallowest and closest to the network and the Chipilapa geothermal area. It corresponds to 2 small neighbouring swarms that occurred in less than 24 hours with magnitudes ranging from I to 2.2. The vicinity of the very active fumaroles of Cerro Cuyanausul and the fact tha t parallel faults, running along
N - S and N W - S E directions, intersect the group 2 area, indicate tha t this activity may be related ei ther to the flashing of geothermal fluid near the surface or to a tectonic movement. In the first case the relation with the geothermal reservoir would be straightforward.

SEISMIC MONITORING OF THE CHIPILAPA GEOTHERMAL AREA 319
(c) Group 3 is roughly aligned along a N W - S E vertical plane, between 3.5 and 5 km depth. The 13 low-magnitude earthquakes (0.3-1.4) were observed over the two months of monitoring, which is characteristic for the continuous seismic activity located SW of Cerro Cuyanausul.
(d) Group 4 consists of seven events clustered in space and time. Their epicenters coincide with the intersection of two faults, NNE and SSW respectively, visible east of the network.
(e) Group 5 lies close to Cerro Cuyanausul , and concerns a small swarm whose first four events have magnitudes higher than 2. It seems to define an E - W plane steeply dipping towards the north, which may be related with the pro- longation of a W N W - E S E fault shown on the tectonic map, close to Hoyo de Cuajuste.
(f) Group 6 is the only one outside the volcanic area, lying far north of the network and the geothermal area. Depths are larger than for the other groups (7-9 kin) and, without more infor- marion about the deep structures in the graben, this group cannot be interpreted more precisely.
Conclusion
A first monitoring of the geothermal area of Chipilapa has shown important microseismic ac- tivity, mainly located outside the supposed geothermal reservoir, beneath the volcanic structures south of the area. The depths of the hypocenters do not exceed 6 km for the microear- thquakes located in the south, and 9 km for the group 6, which may be related to deeper struc- tures in the Central Graben to the north.
The relation between seismicity and the geothermal reservoir is not straightforward, ex- cept for group 2, which is quite shallow and close to station 11. The seismicity is possibly linked to the faults tha t control the recharge of the reser- voir, i.e. the descent of meteoric waters down to
the heat source and the ascent of geothermal fluids up to the reservoir.
A longer period of monitoring with a larger network will be necessary to get better informa- tion, in particular for focal mechanisms deter- mination. One of the objectives would be to con- strain the relations between seismicity and tec- tonics and/or volcanism, as well as between seismicity and the geothermal reservoir. At pre- sent, one fact stands out, which is the lack of seismicity in the supposed geothermal area. It will be important to continue the monitoring during production and reinjection tests: if some seismicity occurs at that time, it should be carefully analysed to determine whether it is in- duced by exploitation or not.
Acknowledgements
This work was carried out by BRGM as subcon- tractor for the Compagnie Fran~aise de G~other- mie under Contract CEL-1684 with the Comi- sion Ejecutiva Hidroelectrica del Rio Lempa.
References
Batini, F,, Console, R. and Luongo, G., 1984. Seismological study of Larderello-Travale geother- mal area. Seminar on utilization of geothermal energy for electric power production and space heating. Florence (Italy).
CEL, Comision Ejecutiva Hidroelectrica del Rio Lem- pa, 1988. Proyecto desarollo acelerado del campo geotermico de Chipilapa, Estudios geocientificos, Informe de evaluacion de la informacion existente. 58 pp. 88 CFG 19.
Hunt, T.M. and Latter, J.H., 1982. A survey of seismic activity near Wairakei geothermal field, New Zealand. J. Volcanol. Geotherm. Res., 14: 319- 334.
Lee, W.H.K. and Lahr, J.C., 1975. HYPO 71 (revised): a computer program for determining hypocenter, magnitude and first motion pattern of local earth- quake. U.S. Geol, Surv., Open File Rep., pp. 75-311.
Lee, W.H.K., Bennelt, R.E. and Meagher, K.L., 1972. A method for estimating magnitude of local earth- quakes from signal duration. U.S. Geol. Surv., Open File Rep., 37 pp.

320 tl FAP;RI[)I, ET A i
Majer, E.L. and Mc Evilly, T.V., 1979. Seismological investigation at The Geysers geothermal field. Geophysics, 44: 246-269.
Schoh, C.H., 1968. The frequency-magnitude relation of microfracturing in rock and its relation to earth- quakes. Bull. Seismol. Soc. Am., 58: 399-415.
U.S. Department of Interior, Geological Survey, 1988. Preliminary Determination of epicenters. 35-88 to 45-88 (Sept 29 to Dec 1, 1988).
Ward, F.L. and Jacob, K.H., 1971. Microearthquakes in the Ahuachapan geothermal field, E1 Salvador~ Centro America. Science, 173: 328-330.