Embed Size (px)
Citation preview

1
Selecting Projects where Six-Sigma can add value
قيمة مضافةSix-Sigmaاختيار أنسب المشروعات التي تحقق فيها
شریف عبد المجيد مازن/ دآتور
نائب مدیر مرآز الدراسات وتطویر نظم الحاسبات والمعلومات
جامعة القاهرة–آلية الحاسبات والمعلومات
2004مایو
2
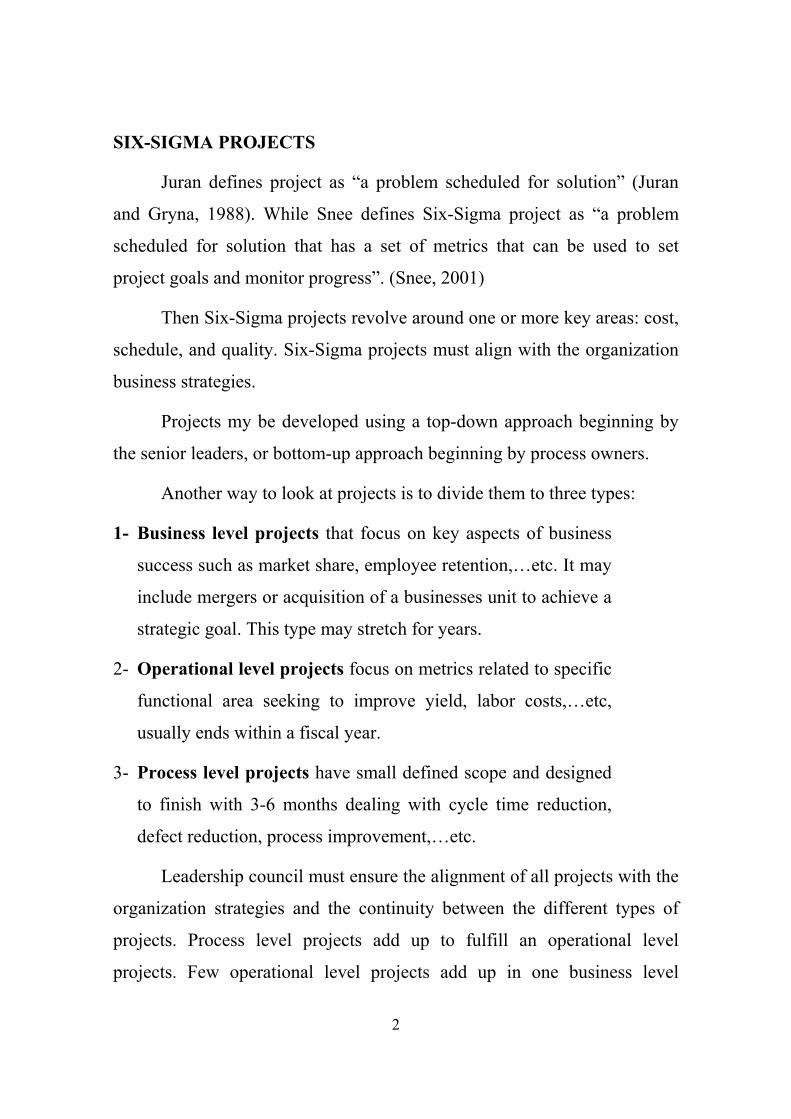
SIX-SIGMA PROJECTS
Juran defines project as “a problem scheduled for solution” (Juran
and Gryna, 1988). While Snee defines Six-Sigma project as “a problem
scheduled for solution that has a set of metrics that can be used to set
project goals and monitor progress”. (Snee, 2001)
Then Six-Sigma projects revolve around one or more key areas: cost,
schedule, and quality. Six-Sigma projects must align with the organization
business strategies.
Projects my be developed using a top-down approach beginning by
the senior leaders, or bottom-up approach beginning by process owners.
Another way to look at projects is to divide them to three types:
1- Business level projects that focus on key aspects of business
success such as market share, employee retention,…etc. It may
include mergers or acquisition of a businesses unit to achieve a
strategic goal. This type may stretch for years.
2- Operational level projects focus on metrics related to specific
functional area seeking to improve yield, labor costs,…etc,
usually ends within a fiscal year.
3- Process level projects have small defined scope and designed
to finish with 3-6 months dealing with cycle time reduction,
defect reduction, process improvement,…etc.
Leadership council must ensure the alignment of all projects with the
organization strategies and the continuity between the different types of
projects. Process level projects add up to fulfill an operational level
projects. Few operational level projects add up in one business level
3
projects. This smooth integration is not so smooth in practice, caution
selection of projects are always critical.
After the approval of leadership council and the Master Black Belt,
each project must be authorized and funded by a sponsor working closely
with Black Belt to define scope, objective and deliverables of the project
using the “Project Charter”.
The Project Charter is a tool that facilitates the consensus upon the
elements of the charter among team members, and keep the team always
forced.
SOURCE OF PROJECTS
Top-down projects always align with business strategy and
customers needs. General needs must be broken to several Black Belt
projects with a limited duration.
The main sources for top-down projects include:
1. Key customer requirements
2. Key cost of quality opportunities such as scrap reports, rework
costs, schedule slippages …etc.
Regarding bottom-up projects, a sponsor is needed to overcome the
cons of this type.
Pros.
1. Dealing with a known problem ensures team members
commitment
2. Six Sigma provides ideal opportunity for team members to
demonstrate their skills to the co-workers, which is a motivating
factor
4
3. Process level projects provide an immediate return
Cons.
1. May lack focus or do not contribute to the bottom line such as
TQM projects
2. Projects may overlap or conflict with business goals
Jack Welch (previous GM of General Electric) insisted that best
projects are those solving a customer’s problem. Keeping the organization
customer focused helps to fully understand customer needs and
requirements and look to any change or designated improvement in terms
of customer value enhancement. Maintaining this focus enables
organization to respond to ever changing market conditions and gain a
competitive edge.
Six-Sigma Project Types
All Six-Sigma projects are not created equal. Effectively managing a
Six-Sigma deployment heavily depends on how well management,
stakeholders and Champions understand the types of projects they are
selecting and how well they ensure the projects are moving along at a
reasonable pace. It is essential to understand different types of projects
have varying levels of complexity. Though project characterization is a
topic itself, I would still like to define some major project categories here.
- Training projects
These projects should take as long as it takes to complete training.
This should be a fairly logical piece of information, but it may also be the
source of the six month myth. Black Belt (BB) training generally runs five
to six months. No one should be surprised if these projects take that long to
5
complete. Once BBs are out of training, the speed of the project treadmill
varies. Occasionally, BBs will complete a training project in less time than
the designated training period. If this happens regularly, the Champions
should review the project selection process for adequacy.
- Optimization projects
Projects that have adequate levels of control and adequate
technology are called optimization projects. They should move along
quickly. There is little difference between short- and long-term capability
with these types of projects, and they have good process potential.
However, such conditions do not occur serendipitously. The process
experts know which variables are dependent and which are independent,
and these projects typically focus on adjustments to known variable
relationships.
- Control projects
These are similar to optimization projects, but there’s a larger
difference between their short- and long-term capability. This difference
indicates variation is creeping into the process over time. BBs can complete
these projects in a short period because they involve identifying the sources
of variation and implementing controls.
- Technology shift projects
These are projects in which there is little shift between short- and
long-term capability, but the technology used in the process is simply
inadequate for the job. They can be completed in a wide range of
timeframes. If the shift is to a known technology, the project can move
quickly. If an unknown technology is involved, it will take longer. The
worst condition that may be encountered with this type of project is a
6
technology shift with inadequate control. Such projects are long-term and
typically require containment of process defects through improved control
and improved capability with appropriate technology. When processes are
implemented with so little consciousness, it is highly probable the process
owner does not know the leverage variables.
- Design projects
These projects take a long time to come to fruition because we have
culturally allowed design activities to meander lackadaisically until they hit
some sort of production deadline. Nothing in the Six Sigma methodology
will alter this behavior unless the design cycle time becomes the project.
John Lupienski, quality director at Motorola Automotive, says, “When
culture and strategy clash, culture invariably wins out.”1 Industries with
very short development times, such as the computer industry, are the only
exception.
COMPREHENDING A PIPELINE
Believing you can manage a Six-Sigma project pipeline without
recognizing the differences between projects is as delusional as thinking all
projects take six months to complete. Companies involved in Six-Sigma
frequently turn to elaborate, and often expensive, software to manage their
Six-Sigma programs.
Unfortunately, the Six-Sigma initiative needs to be led, not managed.
Software also acts as a crutch for managers who are not involved but wish
to appear so. Such management software packages are typically no
different than any other form of automation. If you automate a bad process,
it is still a bad process.
7
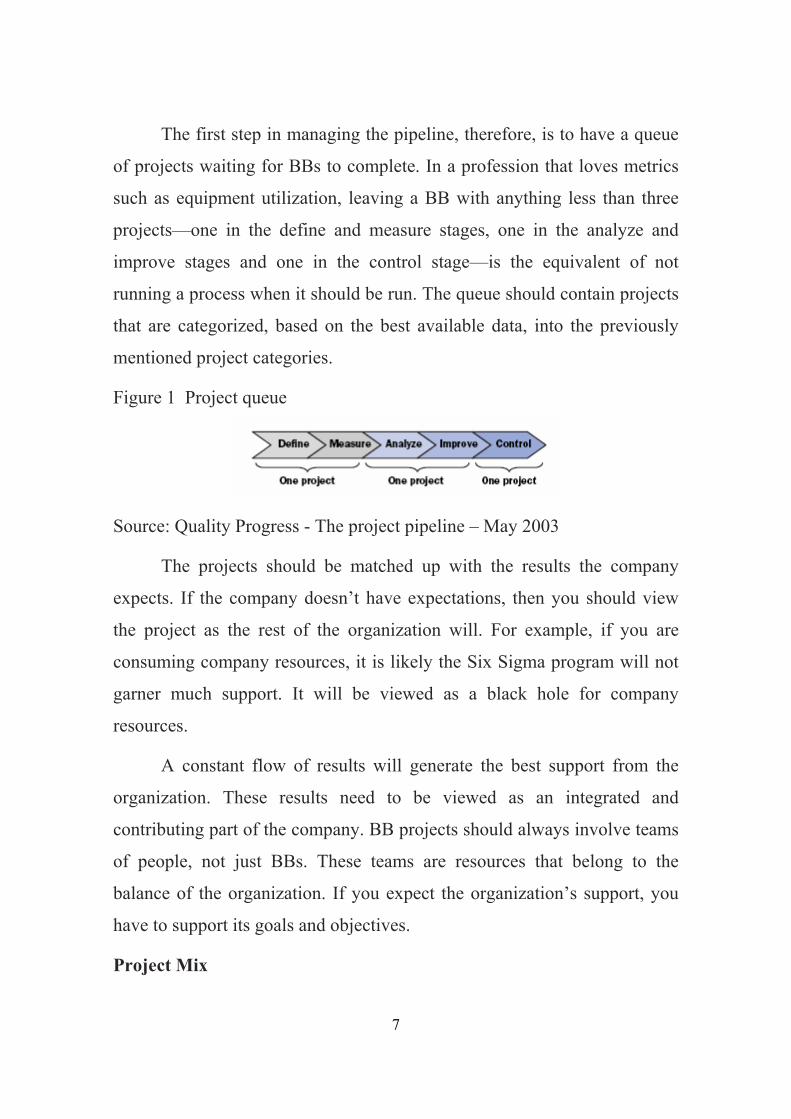
The first step in managing the pipeline, therefore, is to have a queue
of projects waiting for BBs to complete. In a profession that loves metrics
such as equipment utilization, leaving a BB with anything less than three
projects—one in the define and measure stages, one in the analyze and
improve stages and one in the control stage—is the equivalent of not
running a process when it should be run. The queue should contain projects
that are categorized, based on the best available data, into the previously
mentioned project categories.
Figure 1 Project queue
Source: Quality Progress - The project pipeline – May 2003
The projects should be matched up with the results the company
expects. If the company doesn’t have expectations, then you should view
the project as the rest of the organization will. For example, if you are
consuming company resources, it is likely the Six Sigma program will not
garner much support. It will be viewed as a black hole for company
resources.
A constant flow of results will generate the best support from the
organization. These results need to be viewed as an integrated and
contributing part of the company. BB projects should always involve teams
of people, not just BBs. These teams are resources that belong to the
balance of the organization. If you expect the organization’s support, you
have to support its goals and objectives.
Project Mix
8
As projects are assigned to various BBs, Champions should analyze
the mix of projects. If the pipeline is full of control type projects, a lot of
projects will be finishing up quickly. This is not an ideal situation because
a lot of fast projects could throw the organization into chaos as it tries to
digest all that change.
Volume overload could cause some completed projects not to be
implemented, negatively affecting the overall health of the Six-Sigma
program.
In addition, loading the company down with a lot of technology
projects can cause everything to be completed either all at once or not at
all. You should aim to have a balanced program that contains a mix of all
types of projects.
As you develop and define projects, you should collect data on how
long the projects actually take to complete and then categorize the projects.
Just as BBs use data to analyze and deliver results, Champions,
stakeholders and Six-Sigma managers should develop their own data to
determine the mix they are putting into the pipeline. Data by category and
by phase should be available to the leadership team so the team members
can make decisions on assignments and evaluate whether the projects are
progressing at a normal pace.
Data Analysis by Classification
The data collected can be statistically analyzed. It can be stratified at
various levels for a micro analysis or combined to present a larger overall
picture of the Six-Sigma program. This analysis does not require a highly
sophisticated piece of software; you can easily analyze the data with a pivot
table and an Excel spreadsheet.
9
As a project progresses through the five typical phases—define,
measure, analyze, improve and control— you can measure in days how
much time each phase took. Tighter resolution would not make sense. After
several projects have been run, each phase will have its own mean,
standard deviation and variance.
These statistics will help you evaluate whether a project is
progressing normally. Recognizing more than the average length of time
allows you to understand how long a project will likely take. Using the
statistics from each phase and summing the means, you can calculate an
overall average length of time for that type of project.
Summing the variances and taking the square root of the variance
allows you to calculate a standard deviation for the overall classification.
With a mean and standard deviation, you can establish a basic probability
for how long a project should take to complete.
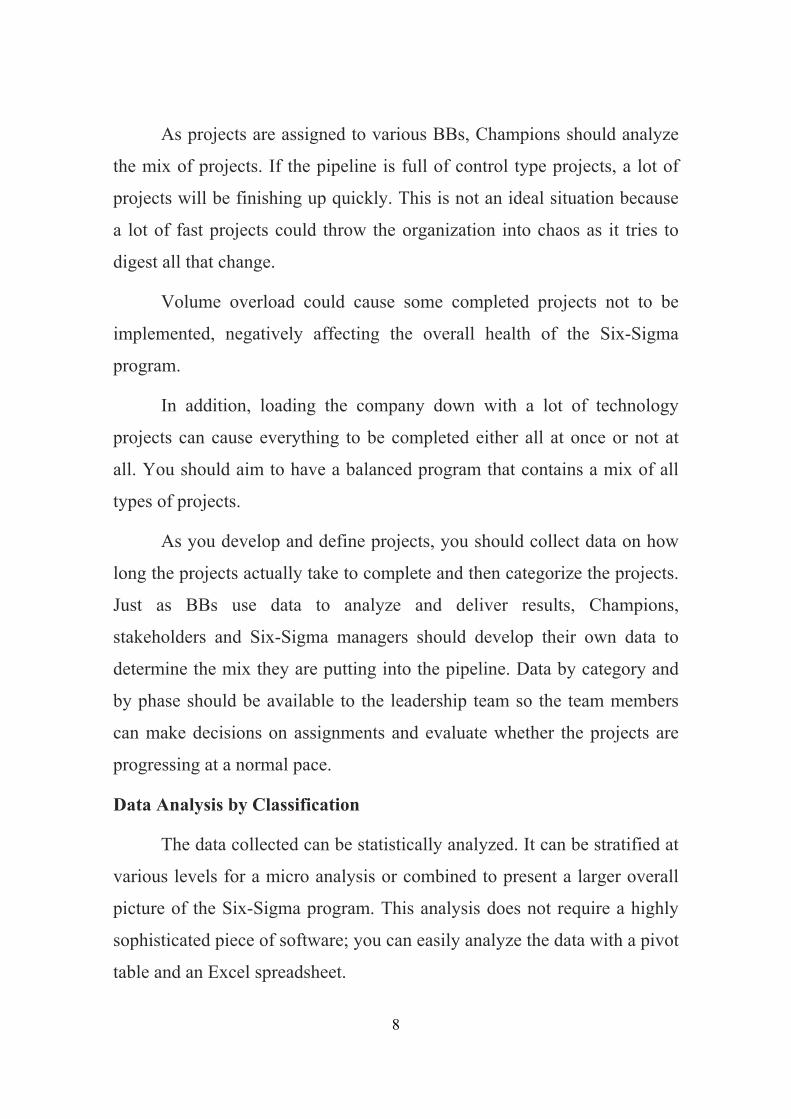
If we were to collect data for all the projects in a deployment for a
year, for example, the summary statistics could be collated in a table. This
would allow us to analyze the project data. If we were managing a
relatively mature product, we might be looking at a majority of
optimization projects that can be completed on an average of 13 days with
a distribution of three to 23 days. As the leader of the Six-Sigma program, I
would then need to have a larger queue of projects waiting because I am
expecting quick results. If I follow the proposed project loading, then I
would expect the BB to complete the define and measure phases in one to
nine days (an average of three days with a standard deviation of 1.7 days).
Table - Statistics Summary
10
Source: Quality Progress - The project pipeline – May 2003
I would need to be prepared to launch a second project in the one- to
nine-day time frame as the first project moves on to the analyze and
improve phases. I would expect the project to move through those phases in
a 2 to 14-day period (an average of 8 days with a standard deviation of 2
days). As you can see from the data, it would be easy to end up with two
projects in the analysis and improving phases simultaneously due to the
differences in the widths of the distributions.
You would not have the BBs launch another define and measure
project until one of the analysis and improving projects moved to the
control phase. If I go to the other extreme of the technology shift/control
type projects, the data tells us the project will take an average of 66 days.
The distribution of completion times will be between 52 and 80 days. This
is a huge difference from optimization projects. We will need fewer
projects in the pipeline to keep the BB’s time effectively utilized. The
projects will be consuming more resources because they involve more time
and activity so the payback should be higher.
A more effective scenario might be to assign a BB a project that will
run longer term and fill in the balance of his or her workload with shorter
11
term control and optimization projects. In the long run, it could keep the
BB more energized than allowing him or her to get bogged down in several
slow moving projects.
The data will also allow you to understand your BBs’ capabilities.
Frequently they are given a goal to complete five projects per year. If a BB
were to be assigned five optimization projects and each project ran to the
high end of the distribution, the BB would be assigned about 115 days of
work for the year. That is a sub-optimized process.
Five technology shift/control projects, on the other hand, would end
in frustration because those five projects would take an average of 330 days
to complete. This option is also unacceptable.
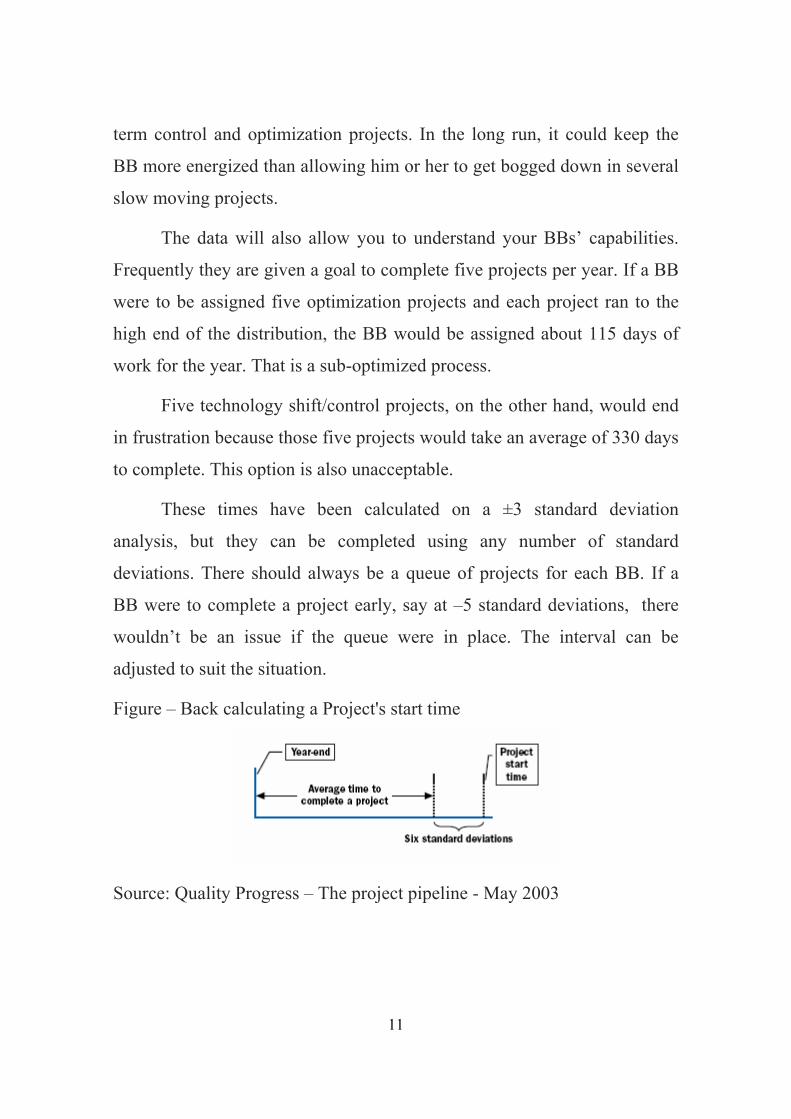
These times have been calculated on a ±3 standard deviation
analysis, but they can be completed using any number of standard
deviations. There should always be a queue of projects for each BB. If a
BB were to complete a project early, say at –5 standard deviations, there
wouldn’t be an issue if the queue were in place. The interval can be
adjusted to suit the situation.
Figure – Back calculating a Project's start time
Source: Quality Progress – The project pipeline - May 2003
12
Other Uses of Pipeline Data
As project data becomes more accurate, it becomes more useful in
terms of planning. When you generate the Annual Operating Plan (AOP), it
can help determine the probability of completing various projects
scheduled for the coming year. If you use the time data and classifications,
a more accurate picture based on start times of when a project will be
completed emerges.
This data is useful in establishing staffing requirements as well. If
headcount will be used in several long-term projects, it could cause
shortages in BB availability for the shorter projects. The data may also be
useful in determining the project mix for the various BBs.
As improvement targets are established in terms of dollars saved, the
database can be augmented with financial data. This will give you access to
the added dimension of dollar savings over a particular period. If the targets
require dollars saved by year-end, for example, the start times may be back
calculated from the savings requirements (assuming savings do not begin
until the project is completed). If the end date is known, using the mean
and standard deviation will allow you to understand not only when it
should begin but also the probability of whether it will end when
scheduled.
Data Analysis by Black Belts
The Champion can use the database during project reviews. Project
data can be analyzed to evaluate whether a project is progressing normally.
If you evaluate the project’s current time using the mean and standard
deviation, you can calculate a z value. This value will reflect the
13
probability the project is progressing as normal. The question then
becomes: Is the project taking too much or too little time?
However, you need to be cautious when using this type of analysis.
If the manager’s intent is to force all projects into a particular distribution,
then the projects should be in a different area. The data is useful to leaders
as a management tool. They flag events that are different from what occurs
in a normal project. A leader, as opposed to a manager, can use the data to
formulate questions during a review, including:
- This project seems to be running long term. Is there some type of
roadblock I can help you with?
- This project was completed very quickly. Was it really a Six Sigma
project? Should we evaluate how we are selecting Six Sigma projects?
- The improve phase of this project is running a little long. Should this
project have been classified as a technology shift project rather than a
control project?
The database can also be evaluated from the standpoint of the
individual BB’s overall performance. All BBs can have their various types
of project data calculated and compared to the database. This type of
analysis can be used to identify BBs who have a particular talent for certain
types of projects. Rather than forcing BBs into areas in which they may not
excel in an effort to round them out, apply a “break all the rules” mentality
and use the BBs where they perform best. If, in the project selection phase,
a project that requires a technology shift and a control shift is identified,
identified, the data can be used to pair up BBs with the skills needed to
accomplish these tasks.
14
Control your program results BBs are schooled to solve problems
with data and find leverage in decision making through the use of statistics.
This same discipline can be used to lead the Six Sigma program.
Leadership should understand program results are the “y” in the basic
problem solving equation, y = (f)x. Projects are the independent variables
otherwise known as x’s. We control the program results by quantifying and
analyzing the x’s or projects.
Applying basic analysis techniques can also serve as flags for
leadership so they can realize when a project requires intervention. It can
also help a company with project assignments and AOP analysis.
The data collection and analysis discussed here are presented in the
context of a Six Sigma pipeline, but these tools will work in other
applications as well. They are directly applicable to sales pipelines and
situations in which the same types of steps are used repeatedly, such as in
new product launches.
STEPS TO PROJECT SELECTION
Six-Sigma initiatives encounter many paths of resistance, including
project selection and the maintenance of a continuous flow of value added
projects. Follow these three steps to establish a sound method of selecting
projects:
1. Identify a project selection steering committee.
2. Institute a project selection matrix.
3. Schedule fixed customer and project evaluation meetings.
15
1. Project Steering Committee
Think of the steering committee as the initiative’s backbone that
sends signals to the rest of the body. It should be made up of the decision
makers and drivers of the organization and should include the entire
executive board or a portion of it. Executive involvement shows there is
top-down management support for the initiative, and all facets of the
business and the voice of the customer are represented.
An executive board typically consists of the CEO, CFO, legal
counsel and heads of manufacturing, marketing and sales, R&D, IT and
HR. With all the areas of the business included in the decision/steering
process, the roadblocks can be easily broken down once all members of the
board agree to the initiative. Top management’s overt demonstration that it
is the main driver of the initiative will grow support on appearance alone
and will help the executives enable the teams and practitioners to overcome
roadblocks and seemingly insurmountable resistance.
An additional benefit was that the executive board members gained
the potential to increase two-way communication in the organization and
promote recognition of team accomplishments. This visual perception is a
nice benefit of the executive board’s involvement in driving the initiative,
but the true value added advantage occurs with the removal of obstacles
and the increased communication in the organization I have seen members
of the executive board be reluctant to the point of apathy on a Six Sigma
initiative, but once a few small successes in other areas start to grow into
big accomplishments, the reluctant executives begin to take notice of the
tangible benefits.
16
People in areas such as finance, marketing and HR believe Six
Sigma is for manufacturing and R&D and only they need to support the
initiative. But successful projects will help the reluctant groups see how Six
Sigma can be applied in their areas.
The executive board indirectly represents the voices of both internal
and external customers. For a business to be successful, its managers must
listen to the voice of each type of customer and prioritize the importance of
the different voices. The different areas of the business are represented on
the executive board and, therefore, allow the honest voices of all the
internal and external customers to be heard. The voice of the customer,
whether internal or external, will drive project selection and create a steady
supply of projects.
External customer voices include feedback on warranty issues,
delivery promise times, order completeness, parts in specification and
defect free products; internal customer voices include feedback on incorrect
orders, replenishment, testing accuracy and defect free products. The
negative voices are signs the business may not be running as efficiently as
it can and will give direction to what may minimize or eliminate customer
issues.
2. Project Selection Matrix
The project selection matrix should be completed by using
information gathered from customers about their experience, and should be
driven by the steering committee. The matrix is a simple but concise way to
assess worth of a project based on the voice of the customer. It consists of
customer issues, projects and a ranking metric. To begin a project selection
matrix, the steering committee must make sure some basic data is gathered.
17
Usually before the first steering committee meeting, a homework task
should be assigned by the committee chair (ideally the CEO). The day
before the meeting, each committee member should compile a list of all
projects and all internal and external customer issues or deficiencies.
The initial matrix may be big due to the input from multiple
departments and many outstanding issues, so the data should be set up on a
spreadsheet. At this point, the committee should not fill in the ranks
because it hasn’t come up with a ranking method.
The committee should then set up the ranking system on a scale of 0
to 10. The first rank order system will be the one used n the customer
importance area . Establish the criteria so the lowest number represents
issues that are less bothersome for the customer, and the highest number
represents issues critical in maintaining customer satisfaction. The next
ranking system will involve establishing and defining the relationship of
projects to customer issues.
18
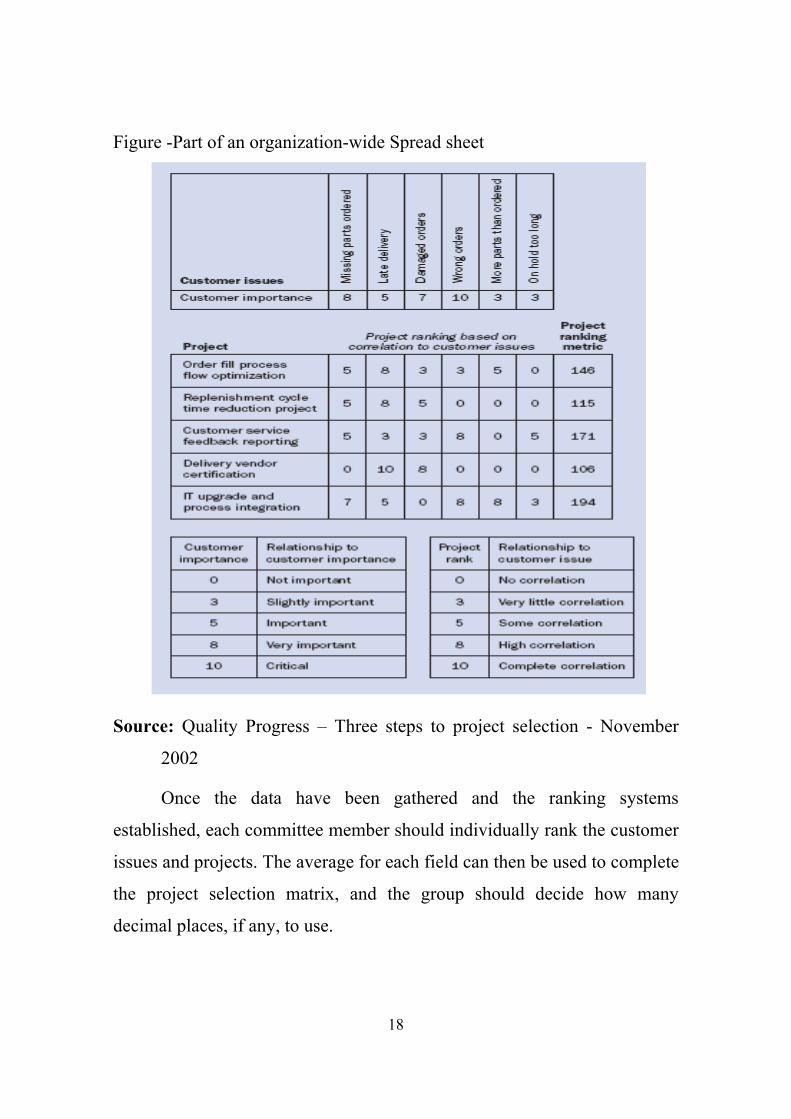
Figure -Part of an organization-wide Spread sheet
Source: Quality Progress – Three steps to project selection - November
2002
Once the data have been gathered and the ranking systems
established, each committee member should individually rank the customer
issues and projects. The average for each field can then be used to complete
the project selection matrix, and the group should decide how many
decimal places, if any, to use.
19
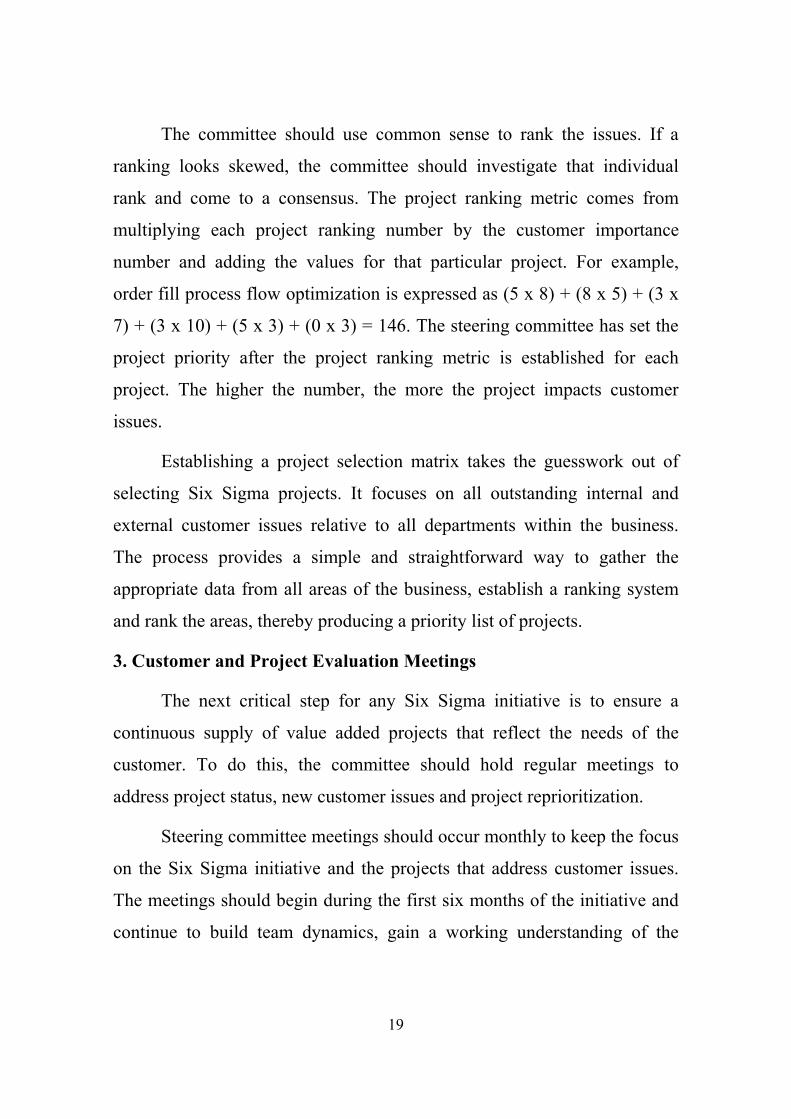
The committee should use common sense to rank the issues. If a
ranking looks skewed, the committee should investigate that individual
rank and come to a consensus. The project ranking metric comes from
multiplying each project ranking number by the customer importance
number and adding the values for that particular project. For example,
order fill process flow optimization is expressed as (5 x 8) + (8 x 5) + (3 x
7) + (3 x 10) + (5 x 3) + (0 x 3) = 146. The steering committee has set the
project priority after the project ranking metric is established for each
project. The higher the number, the more the project impacts customer
issues.
Establishing a project selection matrix takes the guesswork out of
selecting Six Sigma projects. It focuses on all outstanding internal and
external customer issues relative to all departments within the business.
The process provides a simple and straightforward way to gather the
appropriate data from all areas of the business, establish a ranking system
and rank the areas, thereby producing a priority list of projects.
3. Customer and Project Evaluation Meetings
The next critical step for any Six Sigma initiative is to ensure a
continuous supply of value added projects that reflect the needs of the
customer. To do this, the committee should hold regular meetings to
address project status, new customer issues and project reprioritization.
Steering committee meetings should occur monthly to keep the focus
on the Six Sigma initiative and the projects that address customer issues.
The meetings should begin during the first six months of the initiative and
continue to build team dynamics, gain a working understanding of the
20
project selection matrix process and emphasize to the organization the
committee’s dedication to Six Sigma.
Once the initial six month period is over, the committee will need to
assess the best meeting time intervals. Due to the length of most Six Sigma
projects— three to five months—meeting on a quarterly basis is an
efficient way to assess customer needs, project status and new projects.
Three things should be addressed after the committee begins
meeting:
1. The ongoing status of active projects.
2. New customer issues.
3. The establishment of a new project priority list.
The status report of all active projects should include successes,
roadblocks, project improvements and project savings. This format shows
the merits of a particular project and puts the responsibility for removing
the roadblocks on the committee. Remember, this is an executive update so
the status report should take only two to five minutes, unless there are
questions or inquiries proposed by the committee.
After each project leader has presented the status of his or her team’s
project, the committee should bring up any new customer issues that have
arisen since the last meeting. All new customer issues should be added to
the matrix and each member of the committee should rank the customer
issue and the relationship to the projects listed.
In the example in the next Figure, the head of marketing and sales
said her sales force was receiving feedback from the field about excessive
multiple billing.
21
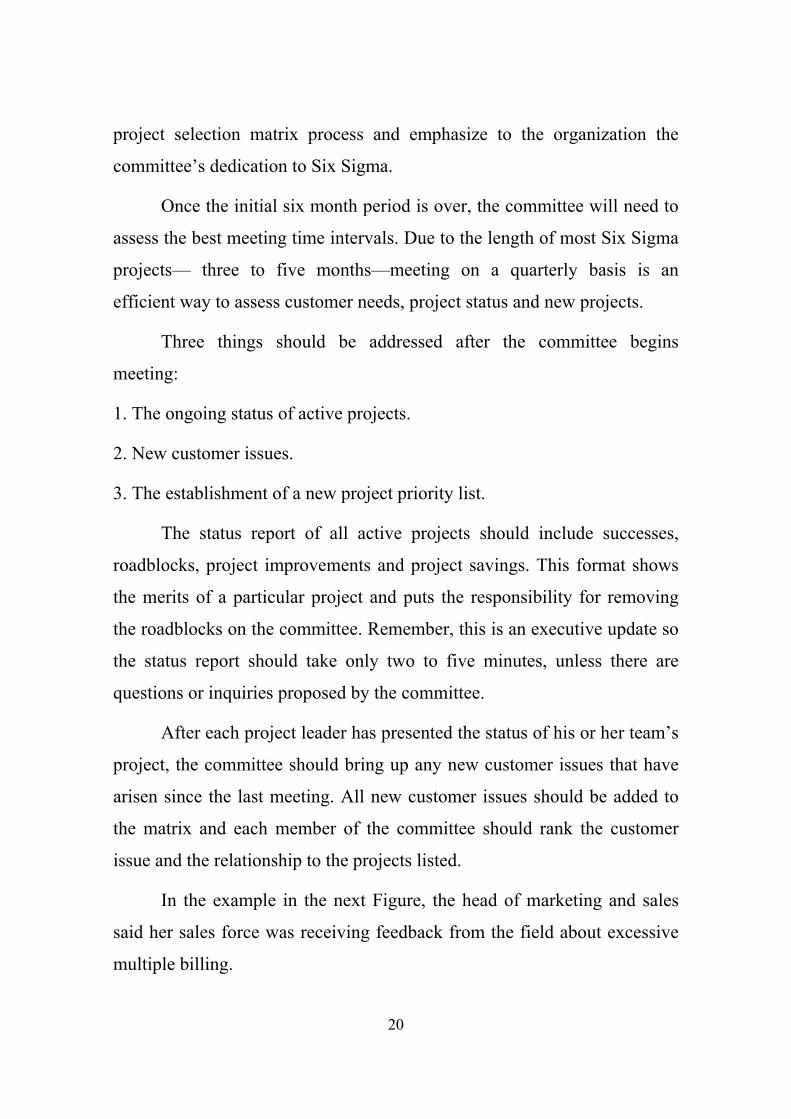
The steering committee did not have a project that had a strong
influence on the issue, so it decided to add one to optimize workflow and
reduce errors in the accounts receivable department. The CFO became the
project Champion and selected the appropriate team to tackle the issue.
Figure - Updated Project Selection Matrix
Source: Quality Progress – Three steps to project selection -November
2002

22
Whenever the committee adds new customer issues and rankings, it
may end up reprioritizing all the projects, or it may need to select a new
project to meet the needs of the new customer issue. When the committee
is reassessing the matrix, it should remove the issues solved with project
completions or other outside influences from the matrix. Just because a
project is on the matrix does not mean it has to be active. The purpose of
the matrix is to provide a systematic way to allocate money and resources
to address crucial customer issues and needs.
In the end, the steering committee will drive project selection by
influencing different projects related to customer issues. The pain and
anguish of project selection is removed by listening to the customer and
having the steering committee made up of the executive board to drive the
projects and remove barriers.
The fact the committee will meet on a regularly scheduled basis,
review the status of all active projects, incorporate all new customer issues
and reevaluate the project selection matrix allows the business to have a
steady supply of value added projects feeding customer needs.
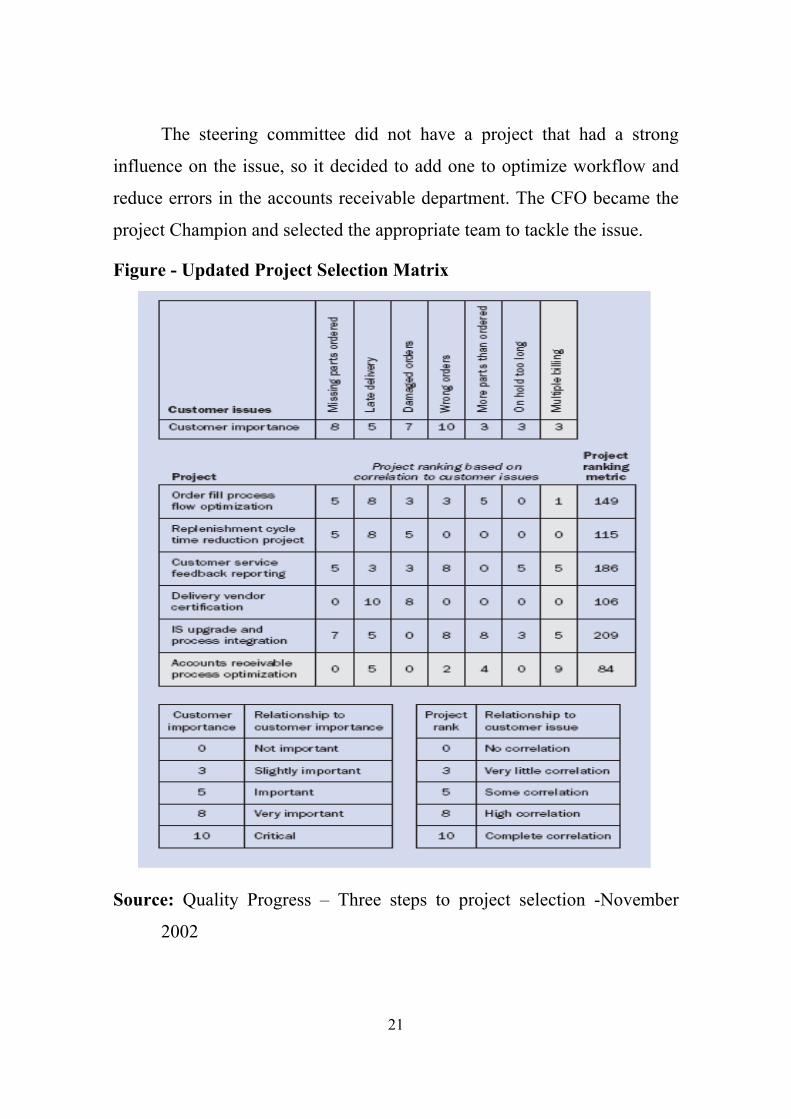
Another way Selection based on cost-benefit analysis
Six Sigma projects should be selected based on cost-benefit analysis
such as Pareto Priority Index (PPI):
PPI = Dollar savings * Probability of success
Implementation cost * Completion time
23
This index is very simple to calculate, but it ignores intangible (non
financial) benefits.
Source: Quality Progress – How to scope DMAIC projects - January 2003
CRITERIA FOR PROJECT SELECTION
The best selection criteria is based on selecting the project that best
meet your current needs, capabilities and objectives.
- Impact on business criteria:
This criteria relates to various impacts on business such as: impact
on payable customers, impact on business strategy, impact on core
competencies, financial impact, does the problem follow a trend, is it
urgent or does this project block other projects or improvement initiatives.
- Feasibility criteria
Refers to the means of deploying the project such as: required
resources, availability of expertise and knowledge required, the complexity
of developing /implementing the solution, time frame, key groups support,
and the likelihood of success.
24
- Impact on organization criteria
Projects can add to the organization in terms of incremental upgrade
to the knowledge gained, and help remove the barrier between department
facilitating cross-functional processes.
LESSONS LEARNED
1. Make sure that the time is right.
2. The enthusiastic commitment of top management is essential.
3. Develop an infrastructure.
4. Commit top people.
5. Invest in relevant hands-on training.
6. Select initial projects to build credibility rapidly.
7. Make it all pervasive, and involve everybody.
8. Emphasize Design for Six Sigma (DFSS).
9. Don’t forget design for reliability.
10. Focus on the entire system.
11. Emphasize customer critical to quality characteristics.
12. Include commercial quality improvement.
13. Recognize all savings.
14. Customize to meet business needs.
15. Consider the variability as well as the mean.
16. Plan to get the right data.
17. Beware of dogmatism.
18. Avoid nonessential bureaucracy.
19. Keep the toolbox vital.
20. Expect Six Sigma to become a more silent partner