Embed Size (px)
DESCRIPTION
Psychology
Citation preview
Self-Discipline Gives Girls the Edge: Gender in Self-Discipline, Grades,and Achievement Test Scores
Angela Lee Duckworth and Martin E. P. SeligmanUniversity of Pennsylvania
Throughout elementary, middle, and high school, girls earn higher grades than boys in all major subjects.Girls, however, do not outperform boys on achievement or IQ tests. To date, explanations for theunderprediction of girls’ GPAs by standardized tests have focused on gender differences favoring boyson such tests. The authors’ investigation suggests an additional explanation: Girls are more self-disciplined, and this advantage is more relevant to report card grades than to achievement or aptitudetests. Eighth-grade girls at an urban magnet school were more self-disciplined than their male counter-parts according to delay of gratification measures and self-report, teacher, and parent ratings. Whereasgirls earned higher grades in all courses, they did only marginally better on an achievement test and worseon an IQ test. Mediation analyses suggested girls earned higher GPAs at least in part because they weremore self-disciplined.
Keywords: gender differences, self-control, self-discipline, academic achievement, standardized tests
Why do girls get better grades than boys? Throughout elemen-tary, middle, and high school, girls earn higher grades than boys inall major subjects, including math and science (American Associ-ation of University Women Educational Foundation [AAUWEF],1998; N. S. Cole, 1997; Pomerantz, Altermatt, & Saxon, 2002),and girls graduate from high school with higher overall GPAs thantheir male counterparts (Perkins, Kleiner, Roey, & Brown, 2004).In most colleges and in most subjects, women continue to outper-form men (Clark & Grandy, 1984; Kimball, 1989; Mau & Lynn,2001; Willingham & Cole, 1997). However, girls do not havehigher IQs, and they score lower on some (but not all) standardizedtests, including the SAT, ACT, and AP exams (AAUWEF, 1998).Women typically earn higher grades than predicted by their per-formance on ability or achievement tests, and men earn lower thanexpected grades; these phenomena have been termed underpredic-tion and overprediction, respectively. Underprediction has beenextensively investigated among undergraduates (e.g., Hunter,Schmidt, & Rauschenberger, 1984; Jensen, 1980; Linn, 1973;Stricker, Rock, & Burton, 1993) but not in younger populations.
Several studies have shown that the underprediction of collegegrades based on SAT or ACT scores is small in size but consistent.
For instance, in a sample of 41 colleges and universities, Clark andGrandy (1984) found that a common regression equation predict-ing freshman GPA on a standard 4.0 scale from SAT scores andhigh school GPA or class rank underpredicted the performance offemale students by 0.05 points and overpredicted the performanceof male students by 0.04 points. Similarly, at a large state univer-sity, Stricker et al. (1993) found that SAT scores underpredictedthe first-semester GPA of female students by 0.10 and overpre-dicted the first-semester GPA of male students by 0.11.
Although a full explanation of underprediction must addressboth the female advantage in grades and the male advantage onstandardized tests, historically, more attention has been given tothe male advantage. For instance, Steele and colleagues havesuggested that because men are expected to outperform women onstandardized tests, women experience stereotype threat, or addedpressure that interferes with test performance (e.g., Steele, 1997;Spencer, Steele, & Quinn, 1999). Loewen, Rosser, and Katzman(1988) have argued that SAT math questions refer to situationsmore familiar to boys (e.g., sports teams and male recreationalactivities). Willingham and Cole (1997) have pointed out that boystend to excel on multiple-choice questions, the most prevalentformat for standardized tests, whereas girls outperform boys onfree-response (e.g., essay) assessments. This explanation is con-sistent with the finding that girls surpass boys on tests of grammarand spelling (Feingold, 1988). Finally, it is possible that femalestudents are confident answering questions about familiar materialbut discouraged by the novel problems presented on standardizedtests (Kimball, 1989). Indeed, the gender gap favoring boys in-creases with the complexity of the standardized test (AAUWEF,1998).
The above explanations do not address why female studentsbring home better report cards, however. Elliott and Strenta (1988)and Young (1991) have suggested that underprediction may resultfrom female college students’ choosing easier courses with morelenient grading systems. However, Leonard and Jiang (1999)
Angela Lee Duckworth and Martin E. P. Seligman, Department ofPsychology, University of Pennsylvania.
This work was supported by National Institute of Mental Health GrantsMH 52270 and MH 63430, the John Templeton Foundation, and U.S.Department of Education Grant R215S020045.
John Sabini passed away on July 15, 2005. We gratefully acknowledgehis contributions to our research and to our field. We thank DianneChambless, Michelle Goldwin, Sara Jaffee, Edgar Knizhnik, and LawrenceStricker for their helpful comments.
Correspondence concerning this article should be addressed to AngelaLee Duckworth, Department of Psychology, University of Pennsylvania,3701 Market Street, Suite 200, Philadelphia, PA 19104. E-mail:[email protected]
Journal of Educational Psychology Copyright 2006 by the American Psychological Association2006, Vol. 98, No. 1, 198–208 0022-0663/06/$12.00 DOI: 10.1037/0022-0663.98.1.198
198
found that underprediction of female grades at the University ofCalifornia at Berkeley by SAT scores persisted even when theycorrected for gender differences in fields of study and for sampleselection bias. Similarly, Stricker and colleagues (1993) found thatadjusting GPA for course-by-course differences in grading stan-dards did not affect underprediction at a large state university.Relevantly, Stricker et al. found that adding self-report variablestapping academic preparation and studiousness—behaviors relatedto self-discipline, which we examine in detail in this investiga-tion—significantly reduced the amount of over- and underpredic-tion. Further, the preference for easier courses does not explainwhy girls earn higher grades than boys as early as elementaryschool, where most students take identical courses.
This article examines whether underprediction might be ex-plained, at least in part, by gender differences in self-discipline. Toexplore this possibility, one must have a clear definition of self-discipline and a reliable method of measuring it. Many authorshave pointed out that the construct of self-control is often looselydefined and that definitions and measurement approaches varywidely (e.g., Evenden, 1999; Gerbing, Ahadi, & Patton, 1987;Parker & Bagby, 1997; Zaparniuk & Taylor, 1997). Block (1996)and Gwin (1997) have noted that the self-control literature isparticularly afflicted with both the jangle (Kelley, 1927) and jingle(Thorndike, 1904) fallacies. In the former case, different terms areused to describe common underlying conceptions (e.g., self-control and self-regulation). In the latter, common terms refer todifferent underlying conceptions (e.g., self-control, defined as theability to delay gratification, vs. self-control, defined as riskaversion).
We use the terms self-discipline and self-control interchange-ably, defining both as the ability to suppress prepotent responses inthe service of a higher goal and further specifying that such achoice is not automatic but rather requires conscious effort. Ex-amples of self-discipline include deliberately modulating one’sanger rather than having a temper tantrum, reading test instructionsbefore proceeding to the questions, paying attention to a teacherrather than daydreaming, saving money so that it can accumulateinterest in the bank, choosing homework over TV, and persistingon long-term assignments despite boredom and frustration.
Not surprisingly, the trait of doing what one intends to do whena more pleasurable alternative beckons has been shown to predictacademic performance (Hogan & Weiss, 1974; Tangney,Baumeister, & Boone, 2004; Wolfe & Johnson, 1995). We reasonthat the extent to which self-discipline predicts academic perfor-mance depends on how one measures performance. Our logic is asfollows: The reliable variance of any academic performance as-sessment comprises both common factor variance, correspondingto skills and knowledge, and unique variance, corresponding to theparticularities of each assessment method. So, it is true that reportcard grades, achievement tests, and aptitude tests all evaluate skillsand knowledge, but it is also true that there is significant methodvariance unique to each assessment modality.
In particular, these methods differ in the degree to which self-discipline affects performance. Report card grades typically reflectthe ability to study for exams, complete homework assignmentsand long-term projects on time, and prepare for class discussions.Thus, grades depend heavily on the ability to sustain effort andconcentration despite boredom, fatigue, and innumerable distrac-tions over the course of an academic year. In contrast, achievement
tests require sustained effort for only a few hours in a testingsituation specifically designed to minimize distractions. Finally,paper-and-pencil IQ tests such as the one used in this study requiresustained effort for less than 1 hr. We imagine, therefore, thatself-discipline should help a student most on report card grades,somewhat on achievement tests, and minimally on brief aptitudetests.
Are girls more self-disciplined than boys? In a series of meta-analyses of 33 delay of gratification studies, Silverman (2003)found a small but reliable advantage favoring women and girls(r � .06). It is important to note that the female advantage wasalmost twice as large when continuous (r � .10) rather thandichotomous (r � .02) measures were used. Silverman cautioned,“This difference may go undetected when measurement instru-ments lack precision and when sample sizes are small” (pp. 456–457). Consistent with Silverman’s conclusions, Walsh (1967)found a dichotomous measure failed to detect a gender differencein self-discipline that, among the same participants, was evidentwhen a more precise, continuous measure was used. Specifically,when left alone in a room, 6- to 8-year-old girls were as likely assame-aged boys to touch forbidden toys; however, a significantgender difference favoring girls was evident in the number ofminutes that elapsed before succumbing to temptation.
In a series of meta-analyses of gender differences in personality,Feingold (1994) cautioned that “different measures of the sametrait do not assess exactly the same latent dimension” (p. 447).This caution is particularly relevant for the construct of self-control, for which there is yet no consensual definition. For ex-ample, Feingold found that males scored higher than females (ds �.17 to .22, comparable with r � .10 found by Silverman, 2003) onimpulsiveness on both the NEO Personality Inventory (Costa &McCrae, 1989, 1992) and the Personality Research Form (Jackson,1974), but he found no gender differences (d � .03, comparablewith r � .015) on the Gordon Personality Inventory Cautiousnesssubscale (Gordon, 1978). Thus, to detect a gender difference inself-control, if indeed it exists, one needs a defensible definition ofthe construct of self-control, measures that operationalize the con-struct in a consistent way, and a strategy for assessment thatmaximizes reliability.
In the current investigation, we increased the validity of ourself-discipline measure by creating a composite self-disciplinescore from parent, teacher, and self-report questionnaires anddelay of gratification measures. Given the range of behaviors thatrequire self-discipline and the limitations of any single measure-ment tool, we agree with Lucas and Baird (2006) that a compre-hensive, multimethod battery of assessments is more reliable andmeaningful than any component measure alone. Another distinc-tive aspect of our research design was our research sample. Unlikeother studies of underprediction in college populations, we con-ducted our investigation with eighth graders at a school where allstudents take identical courses except math, which is offered at anadvanced and basic level. Thus, we could rule out the possibilitythat girls earned higher grades than boys simply because theychose easier courses. Because this academically competitiveschool recruits students likely to attend 4-year colleges, the sampleis comparable, except in age, with those used in prior studies ofunderprediction. Finally, by replicating our study with a secondcohort of eighth graders recruited the following year from the sameschool, we were able to confirm the findings of our first study. In
199GENDER IN DISCIPLINE AND ACHIEVEMENT
summary, our design addressed whether underprediction extendsto college-bound adolescents, whether the effect is maintainedacross subjects and regardless of course difficulty, and whetherunderprediction can be explained by a female advantage in traitself-discipline.
Specifically, Study 1 tested the following hypotheses:
Hypothesis 1: Adolescent girls earn higher grades in AlgebraI, Algebra II, English, and social studies than boys.
Hypothesis 2: The female advantage in report card grades ishigher than the female advantage in achievement test scores.
Hypothesis 3: Achievement test scores underpredict the reportcard grades of girls.
Hypothesis 4: Girls are more self-disciplined than boys.
Hypothesis 5: Self-discipline predicts report card grades bet-ter than it predicts achievement test scores.
Hypothesis 6: Self-discipline mediates the relationship be-tween gender and report card grades, even when controllingfor achievement test scores.
In Study 2, we replicated Study 1, improving our compositemeasure by adding a behavioral measure of delay of gratificationand, in addition, administering an IQ test to determine whether therelationships in Hypotheses 2, 3, and 5 were even more dramaticfor aptitude than for achievement test scores.
Study 1
Method
Participants
The participants were eighth-grade students from a socioeconomicallyand ethnically diverse magnet public school in a city in the northeast.Fifth-grade students are admitted to this middle school on the basis of priorgrades and standardized test scores.
About 70% of the school’s 198 eighth-grade students (n � 140) electedto participate in a longitudinal study of character strengths and academicachievement in children. Signed child assent and parent consent forms,which assured participants of the confidentiality of their data, were re-ceived for all participants. In mid-November 2002, when self-discipline
measures were administered, the mean age of participants was 13.4 years(SD � 0.4). Fifty-five percent of participants were Caucasian, 32.1% wereBlack, 8.6% were Asian, 3.6% were Latino, and 0.7% were AmericanIndian. Fifty-six percent of participants were female. Thirteen percent ofparticipants were from low-income families, as indicated by participationin the federal lunch program. About 16% (n � 13) of girls and 23% (n �14) of boys were enrolled in Algebra II; about 84% (n � 66) of girls and77% (n � 47) of boys were enrolled in Algebra I.
Procedure
In Fall 2002, we collected self-report, parent, and teacher questionnairesin addition to delay of gratification data. We received completed question-naires for 96%, 100%, and 96% of students, teachers, and parents, respec-tively. In Spring 2003, we recorded report card grades, school attendance,and standardized achievement test scores from school records.
Measures
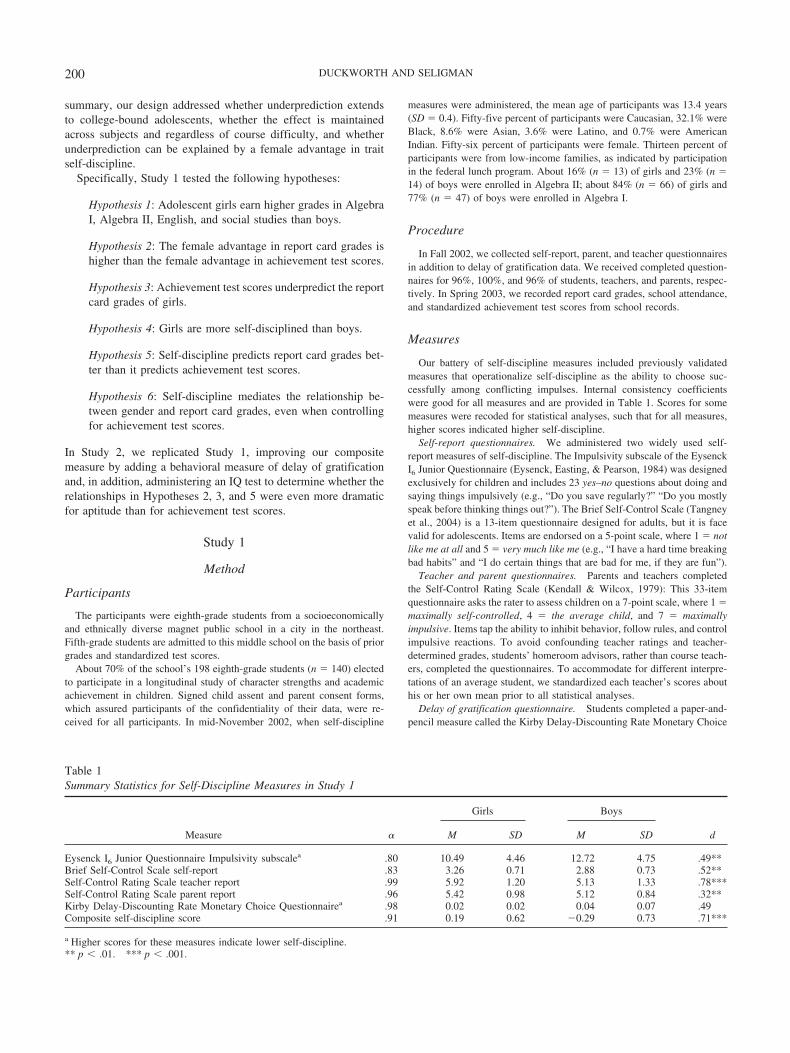
Our battery of self-discipline measures included previously validatedmeasures that operationalize self-discipline as the ability to choose suc-cessfully among conflicting impulses. Internal consistency coefficientswere good for all measures and are provided in Table 1. Scores for somemeasures were recoded for statistical analyses, such that for all measures,higher scores indicated higher self-discipline.
Self-report questionnaires. We administered two widely used self-report measures of self-discipline. The Impulsivity subscale of the EysenckI6 Junior Questionnaire (Eysenck, Easting, & Pearson, 1984) was designedexclusively for children and includes 23 yes–no questions about doing andsaying things impulsively (e.g., “Do you save regularly?” “Do you mostlyspeak before thinking things out?”). The Brief Self-Control Scale (Tangneyet al., 2004) is a 13-item questionnaire designed for adults, but it is facevalid for adolescents. Items are endorsed on a 5-point scale, where 1 � notlike me at all and 5 � very much like me (e.g., “I have a hard time breakingbad habits” and “I do certain things that are bad for me, if they are fun”).
Teacher and parent questionnaires. Parents and teachers completedthe Self-Control Rating Scale (Kendall & Wilcox, 1979): This 33-itemquestionnaire asks the rater to assess children on a 7-point scale, where 1 �maximally self-controlled, 4 � the average child, and 7 � maximallyimpulsive. Items tap the ability to inhibit behavior, follow rules, and controlimpulsive reactions. To avoid confounding teacher ratings and teacher-determined grades, students’ homeroom advisors, rather than course teach-ers, completed the questionnaires. To accommodate for different interpre-tations of an average student, we standardized each teacher’s scores abouthis or her own mean prior to all statistical analyses.
Delay of gratification questionnaire. Students completed a paper-and-pencil measure called the Kirby Delay-Discounting Rate Monetary Choice
Table 1Summary Statistics for Self-Discipline Measures in Study 1
Measure �
Girls Boys
dM SD M SD
Eysenck I6 Junior Questionnaire Impulsivity subscalea .80 10.49 4.46 12.72 4.75 .49**Brief Self-Control Scale self-report .83 3.26 0.71 2.88 0.73 .52**Self-Control Rating Scale teacher report .99 5.92 1.20 5.13 1.33 .78***Self-Control Rating Scale parent report .96 5.42 0.98 5.12 0.84 .32**Kirby Delay-Discounting Rate Monetary Choice Questionnairea .98 0.02 0.02 0.04 0.07 .49Composite self-discipline score .91 0.19 0.62 �0.29 0.73 .71***
a Higher scores for these measures indicate lower self-discipline.** p � .01. *** p � .001.
200 DUCKWORTH AND SELIGMAN
Questionnaire (Kirby, Petry, & Bickel, 1999). This questionnaire contains27 questions posing hypothetical choices between smaller, immediaterewards and larger, delayed rewards (e.g., “Would you prefer $55 today or$75 in 61 days?”). From these responses, we calculated a discounting rate(k), a parameter that reflects the degree to which future rewards arediminished in value as a function of the delay that must be endured toreceive them. Specifically, the diminished subjective value of the delayedreward is expressed by the following equation,
V �A
1 � kd
where V is the subjective value of the delayed reward, A is the subjectivevalue of the immediate reward, k is the discount rate, and d is the delay.Internal consistency was calculated as the proportion of responses thatwere consistent with calculated k values. To normalize the distribution ofscores, we used a natural log transformation of k for all statistical analyses.
Report card grades, school attendance, and standardized achievementtest scores. From school records, we recorded math course level (AlgebraI or Algebra II) and final report card grades for English, math, and socialstudies classes. For comparison with previously published studies, weconverted GPAs from a 100-point scale to a standard 4.0 scale (i.e., Grades97 to 100 � 4.3; Grades 93 to 96.99 � 4.0; Grades 90 to 92.99 � 3.7, etc.).We also recorded year-end attendance and Spring 2003 TerraNova SecondEdition California Achievement Test (CTB/McGraw-Hill, 2001) normalcurve equivalent scores in reading, language arts, and math. The TerraNovaSecond Edition California Achievement Test is a widely used standardizedachievement test that includes selected-response and constructed-responseitems; scores are referenced against a nationwide normative sample ofstudents.
Results
Gender Differences in Report Card Grades andAchievement Test Scores
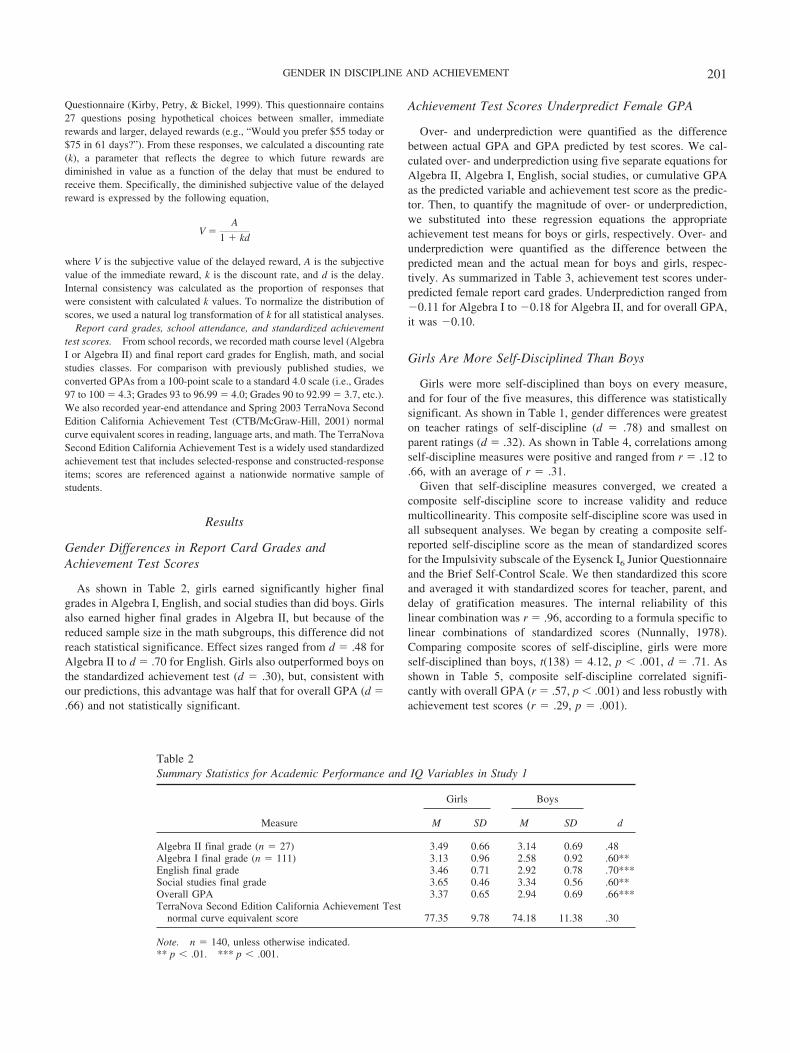
As shown in Table 2, girls earned significantly higher finalgrades in Algebra I, English, and social studies than did boys. Girlsalso earned higher final grades in Algebra II, but because of thereduced sample size in the math subgroups, this difference did notreach statistical significance. Effect sizes ranged from d � .48 forAlgebra II to d � .70 for English. Girls also outperformed boys onthe standardized achievement test (d � .30), but, consistent withour predictions, this advantage was half that for overall GPA (d �.66) and not statistically significant.
Achievement Test Scores Underpredict Female GPA
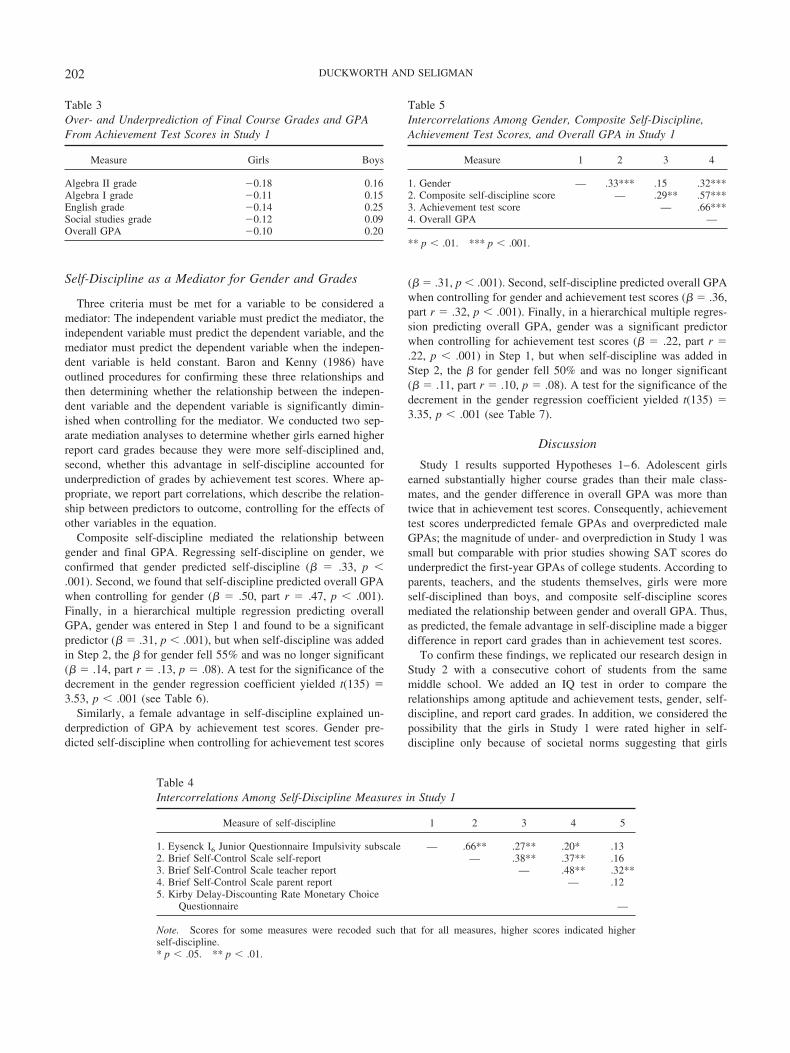
Over- and underprediction were quantified as the differencebetween actual GPA and GPA predicted by test scores. We cal-culated over- and underprediction using five separate equations forAlgebra II, Algebra I, English, social studies, or cumulative GPAas the predicted variable and achievement test score as the predic-tor. Then, to quantify the magnitude of over- or underprediction,we substituted into these regression equations the appropriateachievement test means for boys or girls, respectively. Over- andunderprediction were quantified as the difference between thepredicted mean and the actual mean for boys and girls, respec-tively. As summarized in Table 3, achievement test scores under-predicted female report card grades. Underprediction ranged from�0.11 for Algebra I to �0.18 for Algebra II, and for overall GPA,it was �0.10.
Girls Are More Self-Disciplined Than Boys
Girls were more self-disciplined than boys on every measure,and for four of the five measures, this difference was statisticallysignificant. As shown in Table 1, gender differences were greateston teacher ratings of self-discipline (d � .78) and smallest onparent ratings (d � .32). As shown in Table 4, correlations amongself-discipline measures were positive and ranged from r � .12 to.66, with an average of r � .31.
Given that self-discipline measures converged, we created acomposite self-discipline score to increase validity and reducemulticollinearity. This composite self-discipline score was used inall subsequent analyses. We began by creating a composite self-reported self-discipline score as the mean of standardized scoresfor the Impulsivity subscale of the Eysenck I6 Junior Questionnaireand the Brief Self-Control Scale. We then standardized this scoreand averaged it with standardized scores for teacher, parent, anddelay of gratification measures. The internal reliability of thislinear combination was r � .96, according to a formula specific tolinear combinations of standardized scores (Nunnally, 1978).Comparing composite scores of self-discipline, girls were moreself-disciplined than boys, t(138) � 4.12, p � .001, d � .71. Asshown in Table 5, composite self-discipline correlated signifi-cantly with overall GPA (r � .57, p � .001) and less robustly withachievement test scores (r � .29, p � .001).
Table 2Summary Statistics for Academic Performance and IQ Variables in Study 1
Measure
Girls Boys
dM SD M SD
Algebra II final grade (n � 27) 3.49 0.66 3.14 0.69 .48Algebra I final grade (n � 111) 3.13 0.96 2.58 0.92 .60**English final grade 3.46 0.71 2.92 0.78 .70***Social studies final grade 3.65 0.46 3.34 0.56 .60**Overall GPA 3.37 0.65 2.94 0.69 .66***TerraNova Second Edition California Achievement Test
normal curve equivalent score 77.35 9.78 74.18 11.38 .30
Note. n � 140, unless otherwise indicated.** p � .01. *** p � .001.
201GENDER IN DISCIPLINE AND ACHIEVEMENT
Self-Discipline as a Mediator for Gender and Grades
Three criteria must be met for a variable to be considered amediator: The independent variable must predict the mediator, theindependent variable must predict the dependent variable, and themediator must predict the dependent variable when the indepen-dent variable is held constant. Baron and Kenny (1986) haveoutlined procedures for confirming these three relationships andthen determining whether the relationship between the indepen-dent variable and the dependent variable is significantly dimin-ished when controlling for the mediator. We conducted two sep-arate mediation analyses to determine whether girls earned higherreport card grades because they were more self-disciplined and,second, whether this advantage in self-discipline accounted forunderprediction of grades by achievement test scores. Where ap-propriate, we report part correlations, which describe the relation-ship between predictors to outcome, controlling for the effects ofother variables in the equation.
Composite self-discipline mediated the relationship betweengender and final GPA. Regressing self-discipline on gender, weconfirmed that gender predicted self-discipline (� � .33, p �.001). Second, we found that self-discipline predicted overall GPAwhen controlling for gender (� � .50, part r � .47, p � .001).Finally, in a hierarchical multiple regression predicting overallGPA, gender was entered in Step 1 and found to be a significantpredictor (� � .31, p � .001), but when self-discipline was addedin Step 2, the � for gender fell 55% and was no longer significant(� � .14, part r � .13, p � .08). A test for the significance of thedecrement in the gender regression coefficient yielded t(135) �3.53, p � .001 (see Table 6).
Similarly, a female advantage in self-discipline explained un-derprediction of GPA by achievement test scores. Gender pre-dicted self-discipline when controlling for achievement test scores
(� � .31, p � .001). Second, self-discipline predicted overall GPAwhen controlling for gender and achievement test scores (� � .36,part r � .32, p � .001). Finally, in a hierarchical multiple regres-sion predicting overall GPA, gender was a significant predictorwhen controlling for achievement test scores (� � .22, part r �.22, p � .001) in Step 1, but when self-discipline was added inStep 2, the � for gender fell 50% and was no longer significant(� � .11, part r � .10, p � .08). A test for the significance of thedecrement in the gender regression coefficient yielded t(135) �3.35, p � .001 (see Table 7).
Discussion
Study 1 results supported Hypotheses 1–6. Adolescent girlsearned substantially higher course grades than their male class-mates, and the gender difference in overall GPA was more thantwice that in achievement test scores. Consequently, achievementtest scores underpredicted female GPAs and overpredicted maleGPAs; the magnitude of under- and overprediction in Study 1 wassmall but comparable with prior studies showing SAT scores dounderpredict the first-year GPAs of college students. According toparents, teachers, and the students themselves, girls were moreself-disciplined than boys, and composite self-discipline scoresmediated the relationship between gender and overall GPA. Thus,as predicted, the female advantage in self-discipline made a biggerdifference in report card grades than in achievement test scores.
To confirm these findings, we replicated our research design inStudy 2 with a consecutive cohort of students from the samemiddle school. We added an IQ test in order to compare therelationships among aptitude and achievement tests, gender, self-discipline, and report card grades. In addition, we considered thepossibility that the girls in Study 1 were rated higher in self-discipline only because of societal norms suggesting that girls
Table 3Over- and Underprediction of Final Course Grades and GPAFrom Achievement Test Scores in Study 1
Measure Girls Boys
Algebra II grade �0.18 0.16Algebra I grade �0.11 0.15English grade �0.14 0.25Social studies grade �0.12 0.09Overall GPA �0.10 0.20
Table 4Intercorrelations Among Self-Discipline Measures in Study 1
Measure of self-discipline 1 2 3 4 5
1. Eysenck I6 Junior Questionnaire Impulsivity subscale — .66** .27** .20* .132. Brief Self-Control Scale self-report — .38** .37** .163. Brief Self-Control Scale teacher report — .48** .32**4. Brief Self-Control Scale parent report — .125. Kirby Delay-Discounting Rate Monetary Choice
Questionnaire —
Note. Scores for some measures were recoded such that for all measures, higher scores indicated higherself-discipline.* p � .05. ** p � .01.
Table 5Intercorrelations Among Gender, Composite Self-Discipline,Achievement Test Scores, and Overall GPA in Study 1
Measure 1 2 3 4
1. Gender — .33*** .15 .32***2. Composite self-discipline score — .29** .57***3. Achievement test score — .66***4. Overall GPA —
** p � .01. *** p � .001.
202 DUCKWORTH AND SELIGMAN
ought to be more disciplined. That is, we admitted the possibil-ity—however unlikely—that parents, teachers, and the studentsthemselves all systematically overrated the ability of girls (orunderrated the ability of boys) to break bad habits, resist tempta-tion, concentrate, work effectively toward long-term goals, and soon. Thus, as an objective measure of self-discipline, we included abehavioral delay of gratification task of our own design in whichparticipants chose to receive either $1 immediately or $2 a weeklater as a gift for their participation in our study.
Study 2
Method
Participants
Participants in Study 2 were eighth-grade students from the same schoolas in Study 1, recruited 1 academic year after Study 1. About 83% ofstudents (n � 164) elected to participate. In mid-October 2003, whenself-discipline measures were administered, the mean age of participantswas 13.8 years (SD � 0.5). Fifty-two percent of participants were Cauca-sian, 31.1% were Black, 12.2% were Asian, 4.3% were Latino, and 0.6%were American Indian. Fifty-four percent of participants were female, and21% of participants were from low-income families. About 17% (n � 15)of girls and 21% (n � 16) of boys were enrolled in Algebra II; about 83%(n � 74) of girls and 79% (n � 59) of boys were enrolled in Algebra I.
Procedure
In Fall 2003, we collected self-report, parent, and teacher questionnaires;delay of gratification data; and IQ scores. Completed questionnaires werereceived for 96%, 98%, and 93% of students, teachers, and parents,respectively. IQ scores were recorded for 98% of participants. In Spring2004, we recorded academic performance variables from school records.Simultaneously, we administered the delay of gratification task for thesecond time and a brief survey of study and lifestyle habits, which wasreturned by 98% of participants.
Measures
We used the same measures as in Study 1, with four exceptions: Wechanged the parent and teacher questionnaires and added both a behavioraldelay of gratification task and a group-administered IQ test. Internalconsistency statistics are provided in Table 8.
Teacher and parent questionnaires. Because several teachers and par-ents in Study 1 had complained that the format of the Self-Control RatingScale questionnaire confused them, we omitted it from Study 2. Instead, weasked teachers and parents to complete a version of the Brief Self-Control
Scale written in the third person, with the student as target (e.g., “Thisstudent/child has a hard time breaking bad habits”).
Delay of gratification task. Recognizing that one’s stated intention towait for future rewards may differ from what one would do given an actualchoice between immediate and delayed gratification, we designed the delaychoice task. As a gift of appreciation for completing self-report question-naires, we gave each participant an envelope that held a $1 bill. We thenasked participants either to take the dollar at that moment or to return it tous in exchange for $2 dollars exactly 1 week later, coding the choice to takethe dollar immediately as 0 and the choice to wait as 1. Seven-monthtest–retest stability (r � .41) was good, considering the length of the retestinterval.
IQ. As a measure of intelligence, we used the Otis–Lennon SchoolAbility Test—Seventh Edition (Harcourt Brace Educational Measurement,1997) Level G. This 40-min group-administered, paper-and-pencil testmeasures verbal, quantitative, and figural reasoning skills. The schoolability index for this test is a standard score normalized according to thestudent’s age in months, with a mean of 100 and a standard deviation of 16.Normal curve equivalent scores were derived from percentile ranks for usein all statistical analyses.
Results
Gender Differences in Report Card Grades, AchievementTest Scores, and Measured IQ
As shown in Table 8, girls earned significantly higher finalgrades in Algebra II, English, and social studies than did boys.Girls also earned higher final grades in Algebra I, though thisdifference failed to reach statistical significance. The effect sizesfor the female advantage in course grades ranged from .25 forAlgebra I to .80 for Algebra II and was .54 for overall GPA. Girlsalso outperformed boys on the standardized achievement test, but,in contrast, the difference was small (d � .15) and did not reachstatistical significance. Surprisingly, boys earned significantlyhigher IQ scores than did girls, t(158) � 3.03, p � .003, d � .48.
Achievement Test and IQ Scores Each UnderpredictFemale GPA
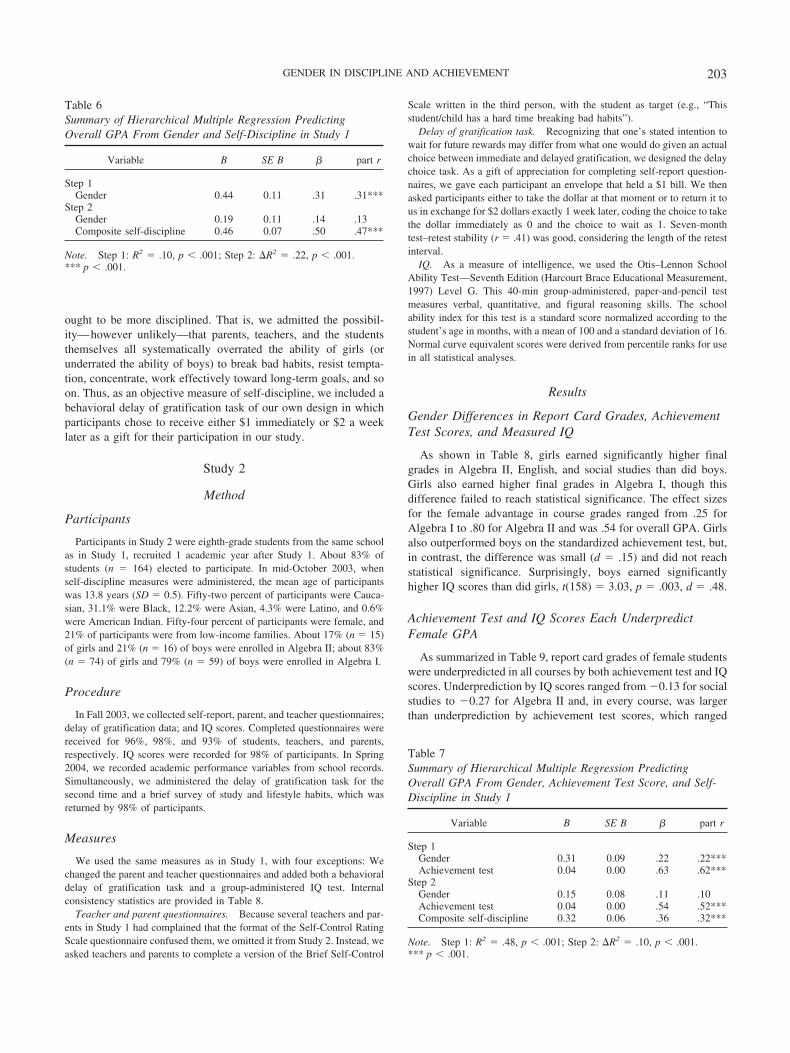
As summarized in Table 9, report card grades of female studentswere underpredicted in all courses by both achievement test and IQscores. Underprediction by IQ scores ranged from �0.13 for socialstudies to �0.27 for Algebra II and, in every course, was largerthan underprediction by achievement test scores, which ranged
Table 7Summary of Hierarchical Multiple Regression PredictingOverall GPA From Gender, Achievement Test Score, and Self-Discipline in Study 1
Variable B SE B � part r
Step 1Gender 0.31 0.09 .22 .22***Achievement test 0.04 0.00 .63 .62***
Step 2Gender 0.15 0.08 .11 .10Achievement test 0.04 0.00 .54 .52***Composite self-discipline 0.32 0.06 .36 .32***
Note. Step 1: R2 � .48, p � .001; Step 2: �R2 � .10, p � .001.*** p � .001.
Table 6Summary of Hierarchical Multiple Regression PredictingOverall GPA From Gender and Self-Discipline in Study 1
Variable B SE B � part r
Step 1Gender 0.44 0.11 .31 .31***
Step 2Gender 0.19 0.11 .14 .13Composite self-discipline 0.46 0.07 .50 .47***
Note. Step 1: R2 � .10, p � .001; Step 2: �R2 � .22, p � .001.*** p � .001.
203GENDER IN DISCIPLINE AND ACHIEVEMENT
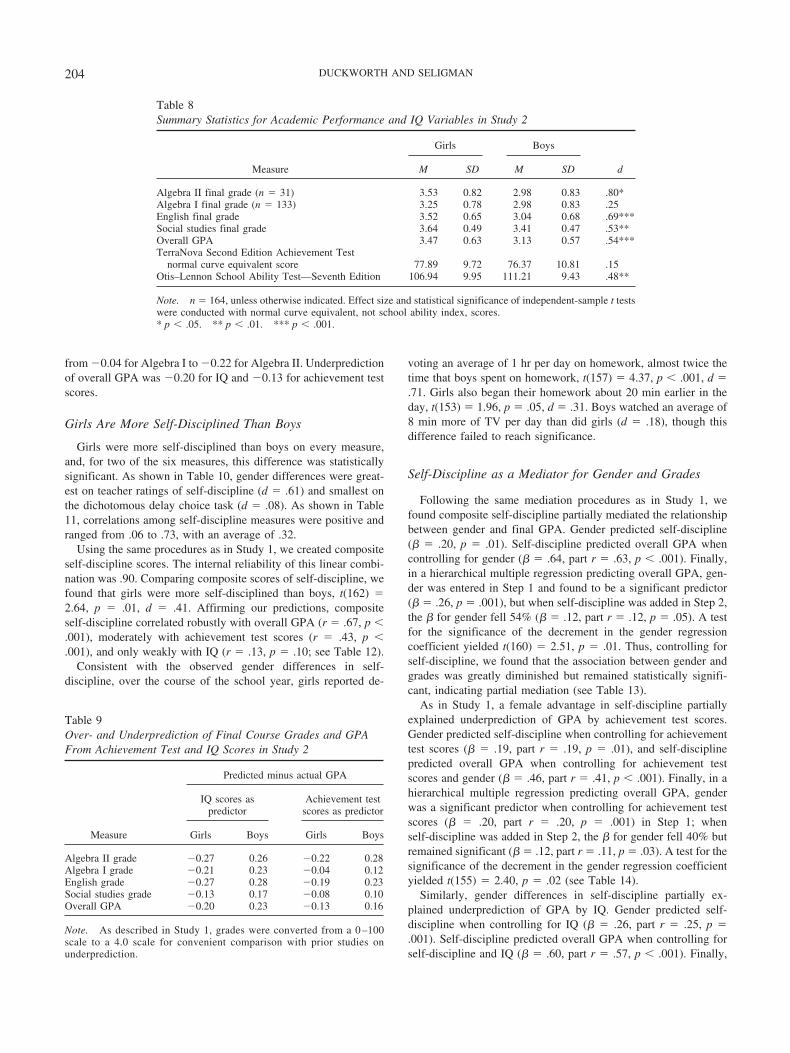
from �0.04 for Algebra I to �0.22 for Algebra II. Underpredictionof overall GPA was �0.20 for IQ and �0.13 for achievement testscores.
Girls Are More Self-Disciplined Than Boys
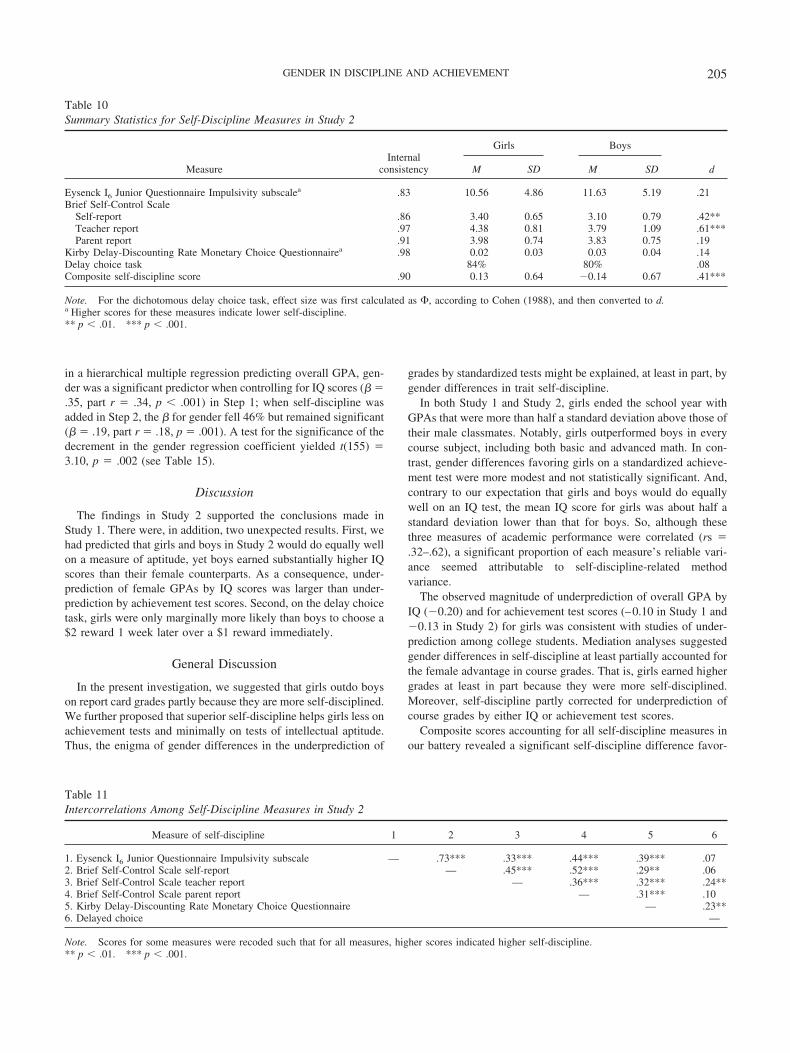
Girls were more self-disciplined than boys on every measure,and, for two of the six measures, this difference was statisticallysignificant. As shown in Table 10, gender differences were great-est on teacher ratings of self-discipline (d � .61) and smallest onthe dichotomous delay choice task (d � .08). As shown in Table11, correlations among self-discipline measures were positive andranged from .06 to .73, with an average of .32.
Using the same procedures as in Study 1, we created compositeself-discipline scores. The internal reliability of this linear combi-nation was .90. Comparing composite scores of self-discipline, wefound that girls were more self-disciplined than boys, t(162) �2.64, p � .01, d � .41. Affirming our predictions, compositeself-discipline correlated robustly with overall GPA (r � .67, p �.001), moderately with achievement test scores (r � .43, p �.001), and only weakly with IQ (r � .13, p � .10; see Table 12).
Consistent with the observed gender differences in self-discipline, over the course of the school year, girls reported de-
voting an average of 1 hr per day on homework, almost twice thetime that boys spent on homework, t(157) � 4.37, p � .001, d �.71. Girls also began their homework about 20 min earlier in theday, t(153) � 1.96, p � .05, d � .31. Boys watched an average of8 min more of TV per day than did girls (d � .18), though thisdifference failed to reach significance.
Self-Discipline as a Mediator for Gender and Grades
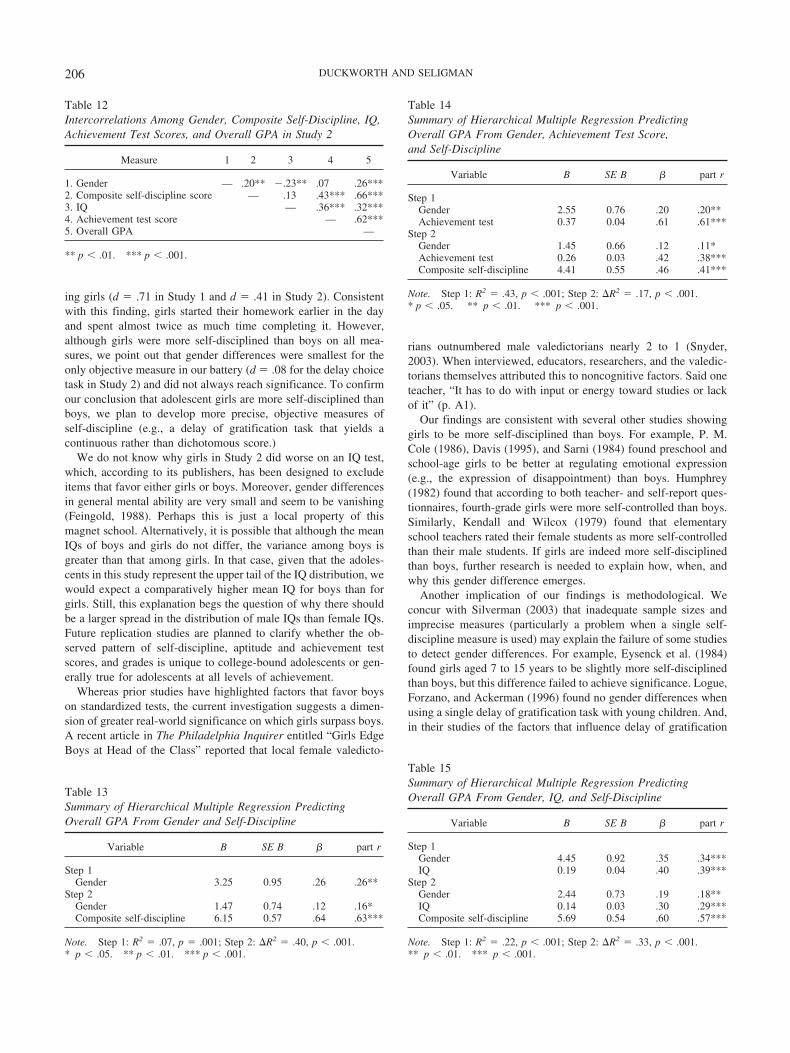
Following the same mediation procedures as in Study 1, wefound composite self-discipline partially mediated the relationshipbetween gender and final GPA. Gender predicted self-discipline(� � .20, p � .01). Self-discipline predicted overall GPA whencontrolling for gender (� � .64, part r � .63, p � .001). Finally,in a hierarchical multiple regression predicting overall GPA, gen-der was entered in Step 1 and found to be a significant predictor(� � .26, p � .001), but when self-discipline was added in Step 2,the � for gender fell 54% (� � .12, part r � .12, p � .05). A testfor the significance of the decrement in the gender regressioncoefficient yielded t(160) � 2.51, p � .01. Thus, controlling forself-discipline, we found that the association between gender andgrades was greatly diminished but remained statistically signifi-cant, indicating partial mediation (see Table 13).
As in Study 1, a female advantage in self-discipline partiallyexplained underprediction of GPA by achievement test scores.Gender predicted self-discipline when controlling for achievementtest scores (� � .19, part r � .19, p � .01), and self-disciplinepredicted overall GPA when controlling for achievement testscores and gender (� � .46, part r � .41, p � .001). Finally, in ahierarchical multiple regression predicting overall GPA, genderwas a significant predictor when controlling for achievement testscores (� � .20, part r � .20, p � .001) in Step 1; whenself-discipline was added in Step 2, the � for gender fell 40% butremained significant (� � .12, part r � .11, p � .03). A test for thesignificance of the decrement in the gender regression coefficientyielded t(155) � 2.40, p � .02 (see Table 14).
Similarly, gender differences in self-discipline partially ex-plained underprediction of GPA by IQ. Gender predicted self-discipline when controlling for IQ (� � .26, part r � .25, p �.001). Self-discipline predicted overall GPA when controlling forself-discipline and IQ (� � .60, part r � .57, p � .001). Finally,
Table 8Summary Statistics for Academic Performance and IQ Variables in Study 2
Measure
Girls Boys
dM SD M SD
Algebra II final grade (n � 31) 3.53 0.82 2.98 0.83 .80*Algebra I final grade (n � 133) 3.25 0.78 2.98 0.83 .25English final grade 3.52 0.65 3.04 0.68 .69***Social studies final grade 3.64 0.49 3.41 0.47 .53**Overall GPA 3.47 0.63 3.13 0.57 .54***TerraNova Second Edition Achievement Test
normal curve equivalent score 77.89 9.72 76.37 10.81 .15Otis–Lennon School Ability Test—Seventh Edition 106.94 9.95 111.21 9.43 .48**
Note. n � 164, unless otherwise indicated. Effect size and statistical significance of independent-sample t testswere conducted with normal curve equivalent, not school ability index, scores.* p � .05. ** p � .01. *** p � .001.
Table 9Over- and Underprediction of Final Course Grades and GPAFrom Achievement Test and IQ Scores in Study 2
Measure
Predicted minus actual GPA
IQ scores aspredictor
Achievement testscores as predictor
Girls Boys Girls Boys
Algebra II grade �0.27 0.26 �0.22 0.28Algebra I grade �0.21 0.23 �0.04 0.12English grade �0.27 0.28 �0.19 0.23Social studies grade �0.13 0.17 �0.08 0.10Overall GPA �0.20 0.23 �0.13 0.16
Note. As described in Study 1, grades were converted from a 0 –100scale to a 4.0 scale for convenient comparison with prior studies onunderprediction.
204 DUCKWORTH AND SELIGMAN
in a hierarchical multiple regression predicting overall GPA, gen-der was a significant predictor when controlling for IQ scores (� �.35, part r � .34, p � .001) in Step 1; when self-discipline wasadded in Step 2, the � for gender fell 46% but remained significant(� � .19, part r � .18, p � .001). A test for the significance of thedecrement in the gender regression coefficient yielded t(155) �3.10, p � .002 (see Table 15).
Discussion
The findings in Study 2 supported the conclusions made inStudy 1. There were, in addition, two unexpected results. First, wehad predicted that girls and boys in Study 2 would do equally wellon a measure of aptitude, yet boys earned substantially higher IQscores than their female counterparts. As a consequence, under-prediction of female GPAs by IQ scores was larger than under-prediction by achievement test scores. Second, on the delay choicetask, girls were only marginally more likely than boys to choose a$2 reward 1 week later over a $1 reward immediately.
General Discussion
In the present investigation, we suggested that girls outdo boyson report card grades partly because they are more self-disciplined.We further proposed that superior self-discipline helps girls less onachievement tests and minimally on tests of intellectual aptitude.Thus, the enigma of gender differences in the underprediction of
grades by standardized tests might be explained, at least in part, bygender differences in trait self-discipline.
In both Study 1 and Study 2, girls ended the school year withGPAs that were more than half a standard deviation above those oftheir male classmates. Notably, girls outperformed boys in everycourse subject, including both basic and advanced math. In con-trast, gender differences favoring girls on a standardized achieve-ment test were more modest and not statistically significant. And,contrary to our expectation that girls and boys would do equallywell on an IQ test, the mean IQ score for girls was about half astandard deviation lower than that for boys. So, although thesethree measures of academic performance were correlated (rs �.32–.62), a significant proportion of each measure’s reliable vari-ance seemed attributable to self-discipline-related methodvariance.
The observed magnitude of underprediction of overall GPA byIQ (�0.20) and for achievement test scores (–0.10 in Study 1 and�0.13 in Study 2) for girls was consistent with studies of under-prediction among college students. Mediation analyses suggestedgender differences in self-discipline at least partially accounted forthe female advantage in course grades. That is, girls earned highergrades at least in part because they were more self-disciplined.Moreover, self-discipline partly corrected for underprediction ofcourse grades by either IQ or achievement test scores.
Composite scores accounting for all self-discipline measures inour battery revealed a significant self-discipline difference favor-
Table 10Summary Statistics for Self-Discipline Measures in Study 2
MeasureInternal
consistency
Girls Boys
dM SD M SD
Eysenck I6 Junior Questionnaire Impulsivity subscalea .83 10.56 4.86 11.63 5.19 .21Brief Self-Control Scale
Self-report .86 3.40 0.65 3.10 0.79 .42**Teacher report .97 4.38 0.81 3.79 1.09 .61***Parent report .91 3.98 0.74 3.83 0.75 .19
Kirby Delay-Discounting Rate Monetary Choice Questionnairea .98 0.02 0.03 0.03 0.04 .14Delay choice task 84% 80% .08Composite self-discipline score .90 0.13 0.64 �0.14 0.67 .41***
Note. For the dichotomous delay choice task, effect size was first calculated as �, according to Cohen (1988), and then converted to d.a Higher scores for these measures indicate lower self-discipline.** p � .01. *** p � .001.
Table 11Intercorrelations Among Self-Discipline Measures in Study 2
Measure of self-discipline 1 2 3 4 5 6
1. Eysenck I6 Junior Questionnaire Impulsivity subscale — .73*** .33*** .44*** .39*** .072. Brief Self-Control Scale self-report — .45*** .52*** .29** .063. Brief Self-Control Scale teacher report — .36*** .32*** .24**4. Brief Self-Control Scale parent report — .31*** .105. Kirby Delay-Discounting Rate Monetary Choice Questionnaire — .23**6. Delayed choice —
Note. Scores for some measures were recoded such that for all measures, higher scores indicated higher self-discipline.** p � .01. *** p � .001.
205GENDER IN DISCIPLINE AND ACHIEVEMENT
ing girls (d � .71 in Study 1 and d � .41 in Study 2). Consistentwith this finding, girls started their homework earlier in the dayand spent almost twice as much time completing it. However,although girls were more self-disciplined than boys on all mea-sures, we point out that gender differences were smallest for theonly objective measure in our battery (d � .08 for the delay choicetask in Study 2) and did not always reach significance. To confirmour conclusion that adolescent girls are more self-disciplined thanboys, we plan to develop more precise, objective measures ofself-discipline (e.g., a delay of gratification task that yields acontinuous rather than dichotomous score.)
We do not know why girls in Study 2 did worse on an IQ test,which, according to its publishers, has been designed to excludeitems that favor either girls or boys. Moreover, gender differencesin general mental ability are very small and seem to be vanishing(Feingold, 1988). Perhaps this is just a local property of thismagnet school. Alternatively, it is possible that although the meanIQs of boys and girls do not differ, the variance among boys isgreater than that among girls. In that case, given that the adoles-cents in this study represent the upper tail of the IQ distribution, wewould expect a comparatively higher mean IQ for boys than forgirls. Still, this explanation begs the question of why there shouldbe a larger spread in the distribution of male IQs than female IQs.Future replication studies are planned to clarify whether the ob-served pattern of self-discipline, aptitude and achievement testscores, and grades is unique to college-bound adolescents or gen-erally true for adolescents at all levels of achievement.
Whereas prior studies have highlighted factors that favor boyson standardized tests, the current investigation suggests a dimen-sion of greater real-world significance on which girls surpass boys.A recent article in The Philadelphia Inquirer entitled “Girls EdgeBoys at Head of the Class” reported that local female valedicto-
rians outnumbered male valedictorians nearly 2 to 1 (Snyder,2003). When interviewed, educators, researchers, and the valedic-torians themselves attributed this to noncognitive factors. Said oneteacher, “It has to do with input or energy toward studies or lackof it” (p. A1).
Our findings are consistent with several other studies showinggirls to be more self-disciplined than boys. For example, P. M.Cole (1986), Davis (1995), and Sarni (1984) found preschool andschool-age girls to be better at regulating emotional expression(e.g., the expression of disappointment) than boys. Humphrey(1982) found that according to both teacher- and self-report ques-tionnaires, fourth-grade girls were more self-controlled than boys.Similarly, Kendall and Wilcox (1979) found that elementaryschool teachers rated their female students as more self-controlledthan their male students. If girls are indeed more self-disciplinedthan boys, further research is needed to explain how, when, andwhy this gender difference emerges.
Another implication of our findings is methodological. Weconcur with Silverman (2003) that inadequate sample sizes andimprecise measures (particularly a problem when a single self-discipline measure is used) may explain the failure of some studiesto detect gender differences. For example, Eysenck et al. (1984)found girls aged 7 to 15 years to be slightly more self-disciplinedthan boys, but this difference failed to achieve significance. Logue,Forzano, and Ackerman (1996) found no gender differences whenusing a single delay of gratification task with young children. And,in their studies of the factors that influence delay of gratification
Table 12Intercorrelations Among Gender, Composite Self-Discipline, IQ,Achievement Test Scores, and Overall GPA in Study 2
Measure 1 2 3 4 5
1. Gender — .20** �.23** .07 .26***2. Composite self-discipline score — .13 .43*** .66***3. IQ — .36*** .32***4. Achievement test score — .62***5. Overall GPA —
** p � .01. *** p � .001.
Table 13Summary of Hierarchical Multiple Regression PredictingOverall GPA From Gender and Self-Discipline
Variable B SE B � part r
Step 1Gender 3.25 0.95 .26 .26**
Step 2Gender 1.47 0.74 .12 .16*Composite self-discipline 6.15 0.57 .64 .63***
Note. Step 1: R2 � .07, p � .001; Step 2: �R2 � .40, p � .001.* p � .05. ** p � .01. *** p � .001.
Table 14Summary of Hierarchical Multiple Regression PredictingOverall GPA From Gender, Achievement Test Score,and Self-Discipline
Variable B SE B � part r
Step 1Gender 2.55 0.76 .20 .20**Achievement test 0.37 0.04 .61 .61***
Step 2Gender 1.45 0.66 .12 .11*Achievement test 0.26 0.03 .42 .38***Composite self-discipline 4.41 0.55 .46 .41***
Note. Step 1: R2 � .43, p � .001; Step 2: �R2 � .17, p � .001.* p � .05. ** p � .01. *** p � .001.
Table 15Summary of Hierarchical Multiple Regression PredictingOverall GPA From Gender, IQ, and Self-Discipline
Variable B SE B � part r
Step 1Gender 4.45 0.92 .35 .34***IQ 0.19 0.04 .40 .39***
Step 2Gender 2.44 0.73 .19 .18**IQ 0.14 0.03 .30 .29***Composite self-discipline 5.69 0.54 .60 .57***
Note. Step 1: R2 � .22, p � .001; Step 2: �R2 � .33, p � .001.** p � .01. *** p � .001.
206 DUCKWORTH AND SELIGMAN
behavior in preschool children, most of which involved relativelysmall samples, Mischel and colleagues never reported gender as asignificant predictor variable (e.g., Mischel, Shoda, & Peake,1988).
It is not clear whether gender differences in self-disciplinepersist into adulthood. Some studies of adults have reported nogender differences in self-discipline (e.g., Feingold, 1994; Tang-ney et al., 2004), but others have found women to be slightly betterat delaying gratification than men (e.g., Kirby & Marakovic, 1996;Silverman, 2003). Certainly, the most obvious gender differencesin self-discipline among adults relate to the domains in whichself-discipline problems emerge. For example, more women thanmen suffer from binge eating, whereas more men than women arealcohol or drug abusers (Nolen-Hoeksema & Corte, 2004).Baumeister and Vohs (2004) have pointed out that in adulthood,this pattern may arise from gender differences in impulse strengthrather than in trait self-discipline.
If female students earn higher grades than male students at everygrade level through college, why do more men than women earnmedical, law, and other first-professional degrees (Freeman,2004)? And why do men earn higher salaries than women inequivalent occupations (Freeman, 2004)? In a review of genderdifferences in professional achievement, Reis (1991) concludedthat relative to gifted men, gifted women have lower aspirations,fewer mentors, more pressure to assume family responsibilities,and lower self-esteem. There is also experimental evidence sug-gesting that women are not as motivated as men in competitive,winner-take-all environments (Gneezy, Niederle, & Rustichini,2003). Thus, the fact that men enjoy greater professional successthan women does not necessarily imply that gender differences inself-discipline diminish or reverse with age. Indeed, it seems atleast as plausible that women are more self-disciplined than men,but that beyond college, other psychological, social, and culturalfactors swamp the self-discipline edge.
References
American Association of University Women Educational Foundation.(1998). Gender gaps: Where schools still fail our children. Washington,DC: Author.
Baron, R. M., & Kenny, D. A. (1986). The moderator–mediator variabledistinction in social psychological research: Conceptual, strategic, andstatistical considerations. Journal of Personality and Social Psychology,51, 1173–1182.
Baumeister, R. F., & Vohs, K. D. (2004). Self-regulation. In C. Peterson &M. E. P. Seligman (Eds.), Character strengths and virtues: A handbookand classification (pp. 499–516). New York: Oxford University Press.
Block, J. (1996). Some jangly remarks on Baumeister and Heatherton.Psychological Inquiry, 7, 28–32.
Clark, M. J., & Grandy, J. (1984). Sex differences in the academic perfor-mance of Scholastic Aptitude Test takers (College Board Rep. No. 84–8;Educational Testing Science Research Rep. No. 84–43). New York:College Entrance Examination Board.
Cohen, J. (1988). Statistical power analysis for the behavioral sciences.Hillsdale, NJ: Erlbaum.
Cole, N. S. (1997). The ETS gender study: How males and females performin educational settings. Princeton, NJ: Educational Testing Service.
Cole, P. M. (1986). Children’s spontaneous control of facial expression.Child Development, 57, 1309–1321.
Costa, P. T., Jr., & McCrae, R. R. (1989). NEO PI/FFI manual supplement.Odessa, FL: Psychological Assessment Resources.
Costa, P. T., Jr., & McCrae, R. R. (1992). NEO PI-R: Professional manual.Odessa, FL: Psychological Assessment Resources.
CTB/McGraw-Hill. (2001). TerraNova, the Second Edition: TechnicalQuality. Monterey, CA: Author.
Davis, T. L. (1995). Gender differences in masking negative emotions:Ability or motivation? Developmental Psychology, 31, 660–667.
Elliott, R., & Strenta, A. C. (1988). Effects of improving the reliability ofthe GPA on prediction generally and on comparative predictions forgender and race particularly. Journal of Educational Measurement, 25,333–347.
Evenden, J. L. (1999). Varieties of impulsivity. Psychopharmacology, 146,348–361.
Eysenck, S. B., Easting, G., & Pearson, P. (1984). Age norms for impul-siveness, venturesomeness and empathy in children. Personality & In-dividual Differences, 5, 315–321.
Feingold, A. (1988). Cognitive gender differences are disappearing. Amer-ican Psychologist, 43, 95–103.
Feingold, A. (1994). Gender differences in personality: A meta-analysis.Psychological Bulletin, 116, 429–456.
Freeman, C. E. (2004). Trends in educational equity of girls & women:2004. Washington, DC: U.S. Government Printing Office.
Gerbing, D. W., Ahadi, S. A., & Patton, J. H. (1987). Toward a concep-tualization of impulsivity: Components across the behavioral and self-report domains. Multivariate Behavioral Research, 22, 357–379.
Gneezy, U., Niederle, M., & Rustichini, A. (2003). Performance in com-petitive environments: Gender differences. Quarterly Journal of Eco-nomics, 118, 1049–1073.
Gordon, L. V. (1978). Manual for the Gordon Personal Profile. New York:Psychological Corporation.
Gwin, R. D. (1997). Relation among neuropsychology and personalitymeasures of impulsivity. Unpublished doctoral dissertation, PacificGraduate School of Psychology.
Harcourt Brace Educational Measurement. (1997). Otis–Lennon SchoolAbility Test—Seventh edition technical manual. San Antonio, TX:Author.
Hogan, R., & Weiss, D. S. (1974). Personality correlates of superioracademic achievement. Journal of Counseling Psychology, 21, 144–149.
Humphrey, L. L. (1982). Children’s and teachers’ perspectives on chil-dren’s self-control: The development of two rating scales. Journal ofConsulting and Clinical Psychology, 50, 624–633.
Hunter, J. E., Schmidt, F. L., & Rauschenberger, J. (1984). Methodologi-cal, statistical, and ethical issues in the study of bias in psychologicaltests. In C. R. Reynolds & R. T. Brown (Eds.), Perspectives on bias inmental testing (pp. 41–99). New York: Plenum Press.
Jackson, D. N. (1974). Personality Research Form manual. Port Huron,MI: Research Psychologists Press.
Jensen, A. R. (1980). Bias in mental testing. New York: Free Press.Kelley, T. L. (1927). Interpretation of educational measurements. Yonkers,
NY: World Book.Kendall, P. C., & Wilcox, L. E. (1979). Self-control in children: Develop-
ment of a rating scale. Journal of Consulting and Clinical Psychology,47, 1020–1029.
Kimball, M. M. (1989). A new perspective on women’s math achievement.Psychological Bulletin, 105, 198–214.
Kirby, K. N., & Marakovic, N. N. (1996). Delay-discounting probabilisticrewards: Rates decrease as amounts increase. Psychonomic Bulletin &Review, 3, 100–104.
Kirby, K. N., Petry, N. M., & Bickel, W. K. (1999). Heroin addicts havehigher discount rates for delayed rewards than non-drug-using controls.Journal of Experimental Psychology: General, 128, 78–87.
Leonard, D. K., & Jiang, J. (1999). Gender bias and the college predictionsof the SATs: A cry of despair. Research in Higher Education, 40,375–407.
207GENDER IN DISCIPLINE AND ACHIEVEMENT
Linn, R. L. (1973). Fair test use in selection. Review of EducationalResearch, 43, 139–161.
Loewen, J. W., Rosser, P., & Katzman, J. (1988). Gender bias in SATitems. New Orleans, LO: American Educational Research Association.
Logue, A., Forzano, L., & Ackerman, K. (1996). Self-control in children:Age, preference for reinforcer amount and delay, and language ability.Learning and Motivation, 27, 260–277.
Lucas, R. E., & Baird, B. M. (2006). Global self assessment. In M. Eid& E. Diener (Eds.), Handbook of psychological measurement: Amultimethod perspective (pp. 29 – 42). Washington, DC: AmericanPsychological Association.
Mau, W., & Lynn, R. (2001). Gender differences on the Scholastic Apti-tude Test, the American College Test and college grades. EducationalPsychology, 21, 133–136.
Mischel, W., Shoda, Y., & Peake, P. K. (1988). The nature of adolescentcompetencies predicted by preschool delay of gratification. Journal ofPersonality and Social Psychology, 54, 687–696.
Nolen-Hoeksema, S., & Corte, C. (2004). Gender and self-regulation. InR. F. Baumeister & K. D. Vohs (Eds.), Handbook of self-regulation:Research, theory, and applications (pp. 411–421). New York: GuilfordPress.
Nunnally, J. (1978). Psychometric theory. New York: McGraw-Hill.Parker, J. D. A., & Bagby, R. M. (1997). The measurement of impulsivity.
In C. D. Webster & M. A. Jackson (Eds.), Impulsivity: A foundation forthe understanding of psychopathy and violence (pp. 142–157). NewYork: Guilford Press.
Perkins, R., Kleiner, B., Roey, S., & Brown, J. (2004). The High SchoolTranscript Study: A decade of change in curricula and achievement,1990–2000 (Report No. NCES 2004455). Washington, DC: U.S. De-partment of Education, National Center for Education Statistics.
Pomerantz, E. M., Altermatt, E. R., & Saxon, J. L. (2002). Making thegrade but feeling distressed: Gender differences in academic perfor-mance and internal distress. Journal of Educational Psychology, 94,396–404.
Reis, S. M. (1991). The need for clarification in research designed toexamine gender differences in achievement and accomplishment.Roeper Review, 13, 193–198.
Sarni, C. (1984). An observational study of children’s attempts to monitortheir expressive behavior. Child Development, 55, 1504–1513.
Silverman, I. W. (2003). Gender differences in delay of gratification: Ameta-analysis. Sex Roles, 49, 451–463.
Snyder, S. (2003, July 14). Girls edge boys at head of the class. Philadel-phia Inquirer, p. A1.
Spencer, S. J., Steele, C. M., & Quinn, D. M. (1999). Stereotype threat andwomen’s math performance. Journal of Experimental Social Psychol-ogy, 35, 4–28.
Steele, C. M. (1997). A threat in the air: How stereotypes shape intellectualidentify and performance. American Psychologist, 52, 613–629.
Stricker, L. J., Rock, D. A., & Burton, N. W. (1993). Sex differences inpredictions of college grades from Scholastic Aptitude Test scores.Journal of Educational Psychology, 85, 710–718.
Tangney, J. P., Baumeister, R. F., & Boone, A. L. (2004). High self-controlpredicts good adjustment, less pathology, better grades, and interper-sonal success. Journal of Personality, 72, 271–322.
Thorndike, E. L. (1904). An introduction to the theory of mental and socialmeasurements. New York: Teachers College, Columbia University.
Walsh, R. P. (1967). Sex, age, and temptation. Psychological Reports, 21,625–629.
Willingham, W., & Cole, N. (1997). Gender and fair assessment. Mahwah,NJ: Erlbaum.
Wolfe, R. N., & Johnson, S. D. (1995). Personality as a predictor of collegeperformance. Educational and Psychological Measurement, 55, 177–185.
Young, J. W. (1991). Gender bias in predicting college academic perfor-mance: A new approach using item response theory. Journal of Educa-tional Measurement, 28, 37–47.
Zaparniuk, J., & Taylor, S. (1997). Impulsivity in children and adolescents.In C. D. Webster & M. A. Jackson (Eds.), Impulsivity: Theory, assess-ment, and treatment (pp. 158–179). New York: Guilford Press.
Received January 11, 2005Revision received August 10, 2005
Accepted August 10, 2005 �
208 DUCKWORTH AND SELIGMAN