Embed Size (px)
Citation preview
Sensitivity of U.S. Surface Ozone Sensitivity of U.S. Surface Ozone toto
Isoprene Emissions & Chemistry:Isoprene Emissions & Chemistry:
An Application of the 1°x1An Application of the 1°x1°° North American NestedNorth American Nested
GEOS-CHEM ModelGEOS-CHEM Model(v. 5-07-08) Arlene Fiore, Larry Horowitz, Drew Purves,
Hiram Levy II, Mathew Evans, Yuxuan Wang, Qinbin Li and Bob Yantosca
GEOS-CHEM MeetingApril 5, 2005
Fiore et al., J. Geophys. Res., in press
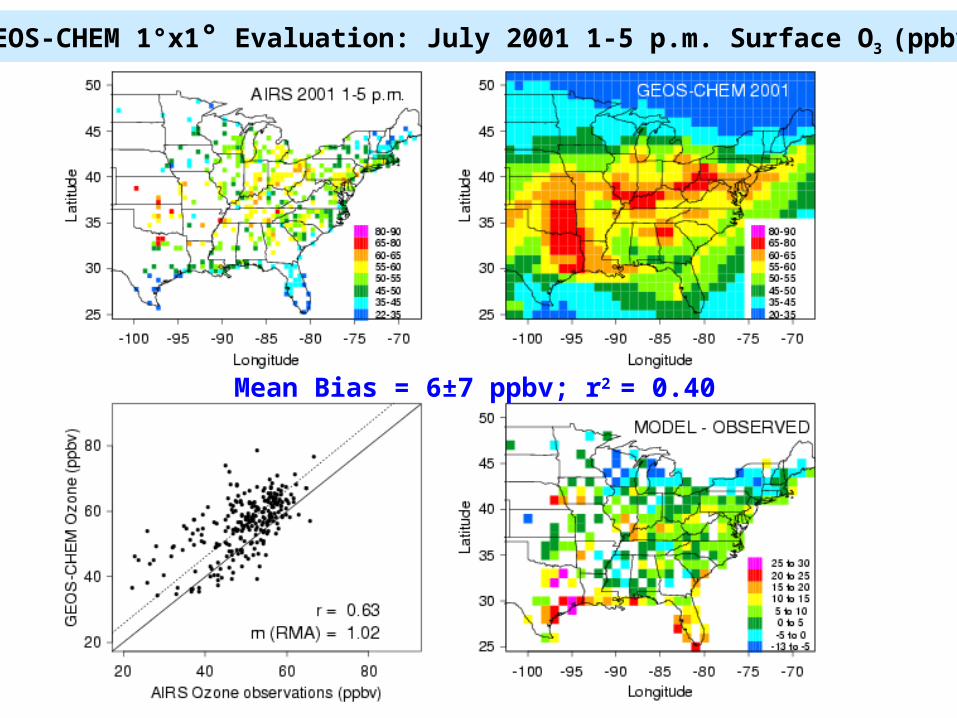
GEOS-CHEM 1°x1° Evaluation: July 2001 1-5 p.m. Surface O3 (ppbv)
Mean Bias = 6±7 ppbv; r2 = 0.40
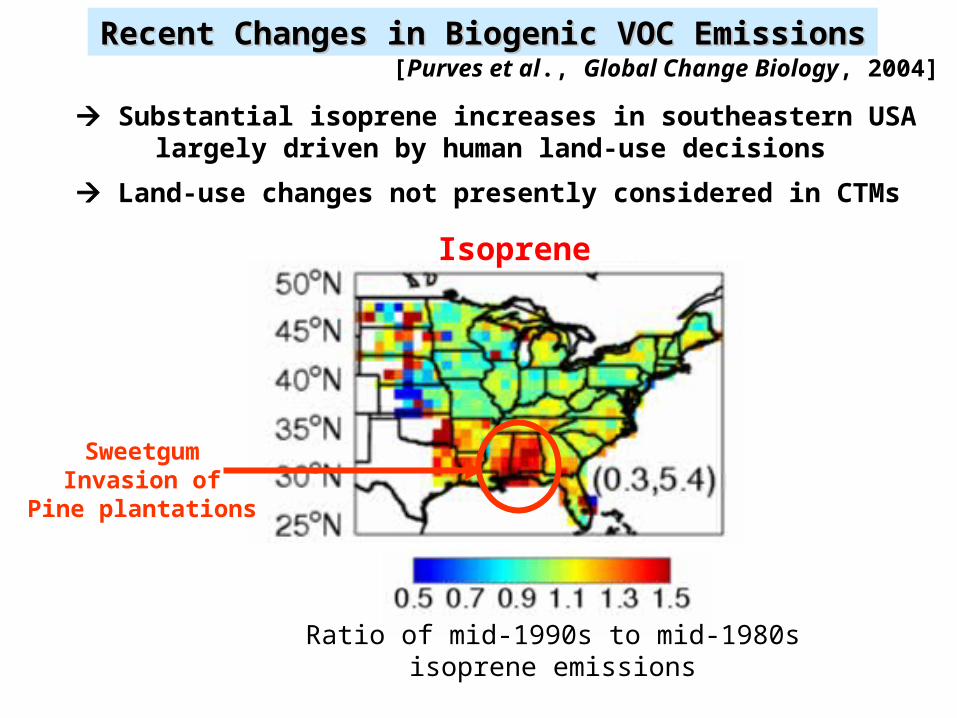
Recent Changes in Biogenic VOC Recent Changes in Biogenic VOC EmissionsEmissions
Isoprene
[Purves et al., Global Change Biology, 2004]
SweetgumInvasion of
Pine plantations
Substantial isoprene increases in southeastern USA largely driven by human land-use decisions
Land-use changes not presently considered in CTMs
Ratio of mid-1990s to mid-1980sisoprene emissions
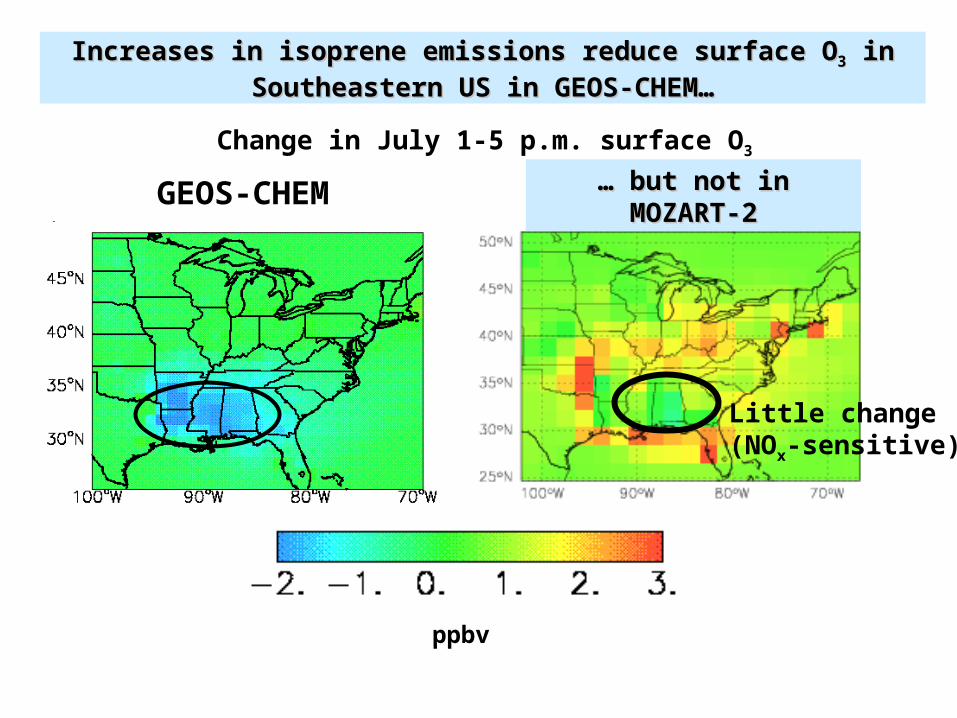
MOZART-2 … … but not in but not in MOZART-2MOZART-2
Change in July 1-5 p.m. surface O3
Increases in isoprene emissions reduce surface OIncreases in isoprene emissions reduce surface O33 in in Southeastern US in GEOS-CHEM…Southeastern US in GEOS-CHEM…
ppbv
GEOS-CHEM
Little change(NOx-sensitive)
Isoprene nitrates
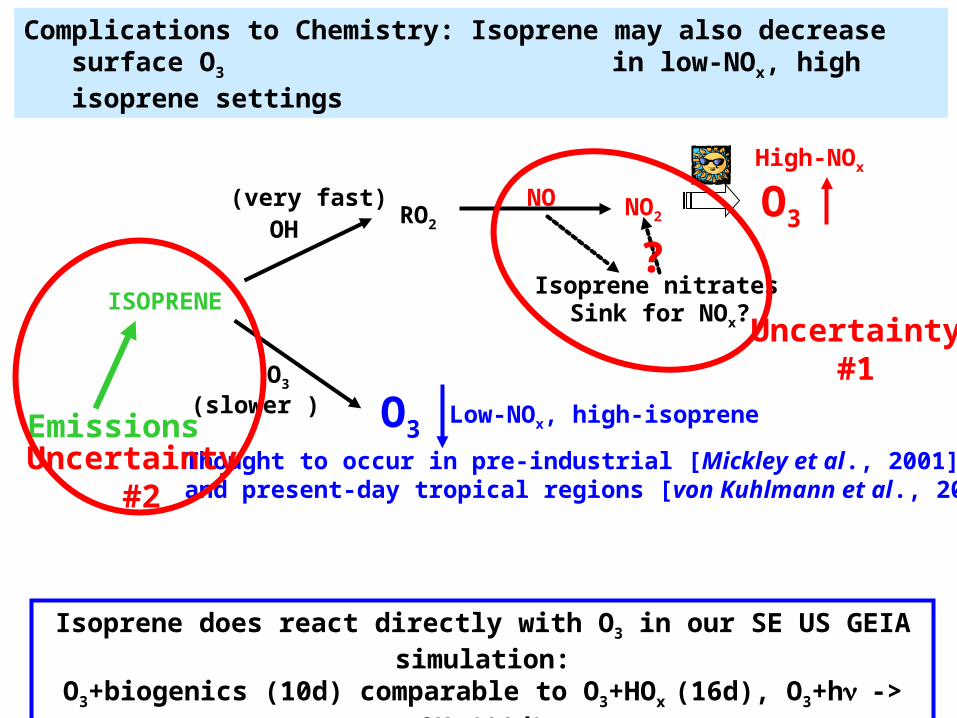
Complications to Chemistry: Isoprene may also decrease surface O3 in low-NOx, high isoprene settings
O3 (slower ) Low-NOx, high-isopreneO3
Thought to occur in pre-industrial [Mickley et al., 2001];and present-day tropical regions [von Kuhlmann et al., 2004]
O3OH RO2
NO (very fast) NO2
High-NOx
ISOPRENE
Isoprene does react directly with O3 in our SE US GEIA simulation:O3+biogenics (10d) comparable to O3+HOx (16d), O3+h-> OH (11d)
Uncertainty#1
EmissionsUncertainty
#2
?Sink for NOx?
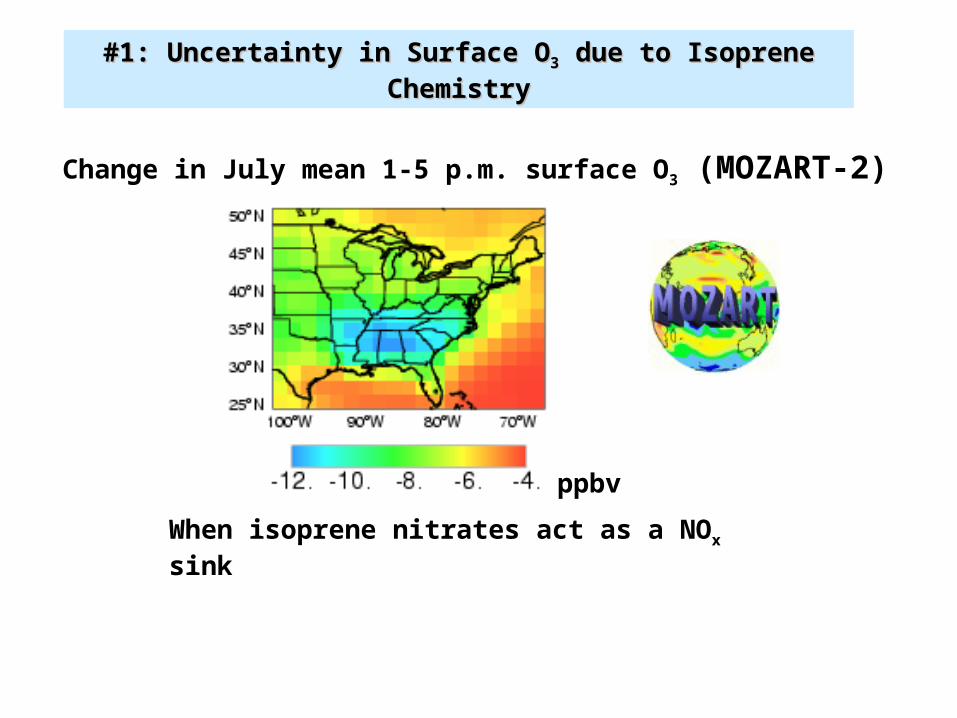
#1: Uncertainty in Surface O#1: Uncertainty in Surface O33 due to Isoprene Chemistry due to Isoprene Chemistry
Change in July mean 1-5 p.m. surface O3 (MOZART-2)
When isoprene nitrates act as a NOx sink
ppbv
GEIA
GEIA: global inventory
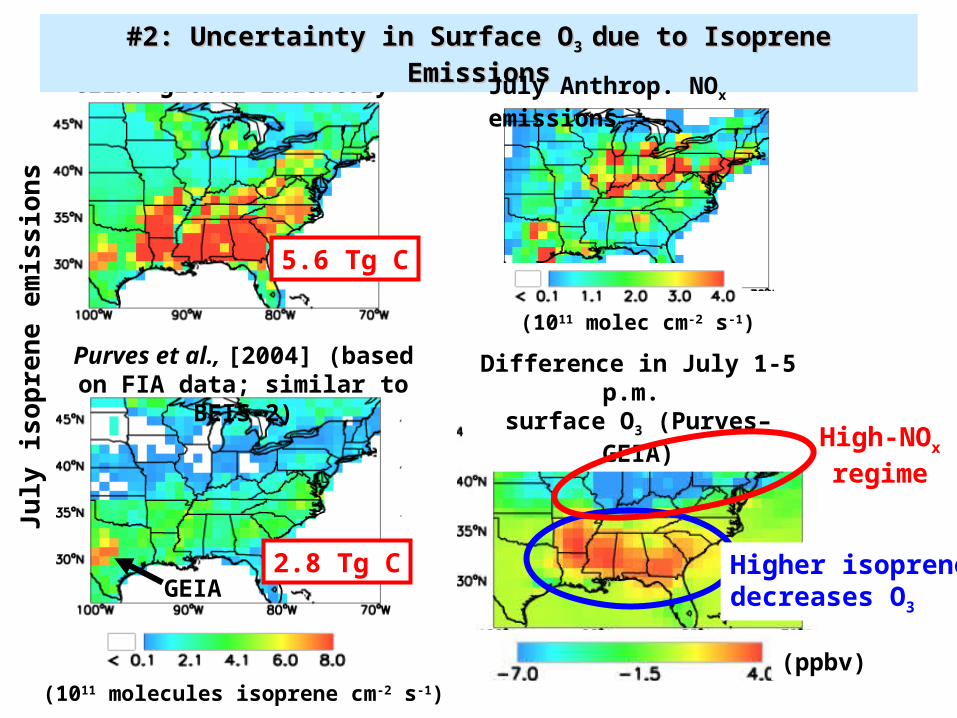
Purves et al., [2004] (based on FIA data; similar to BEIS-2)
(1011 molecules isoprene cm-2 s-1)
#2: Uncertainty in Surface O#2: Uncertainty in Surface O3 3 due to Isoprene Emissionsdue to Isoprene Emissions
5.6 Tg C
2.8 Tg C
(ppbv)
Difference in July 1-5 p.m. surface O3 (Purves–GEIA)
July Anthrop. NOx emissions
(1011 molec cm-2 s-1)
Higher isoprenedecreases O3
High-NOx
regime
Ju
ly is
op
ren
e e
mis
sio
ns
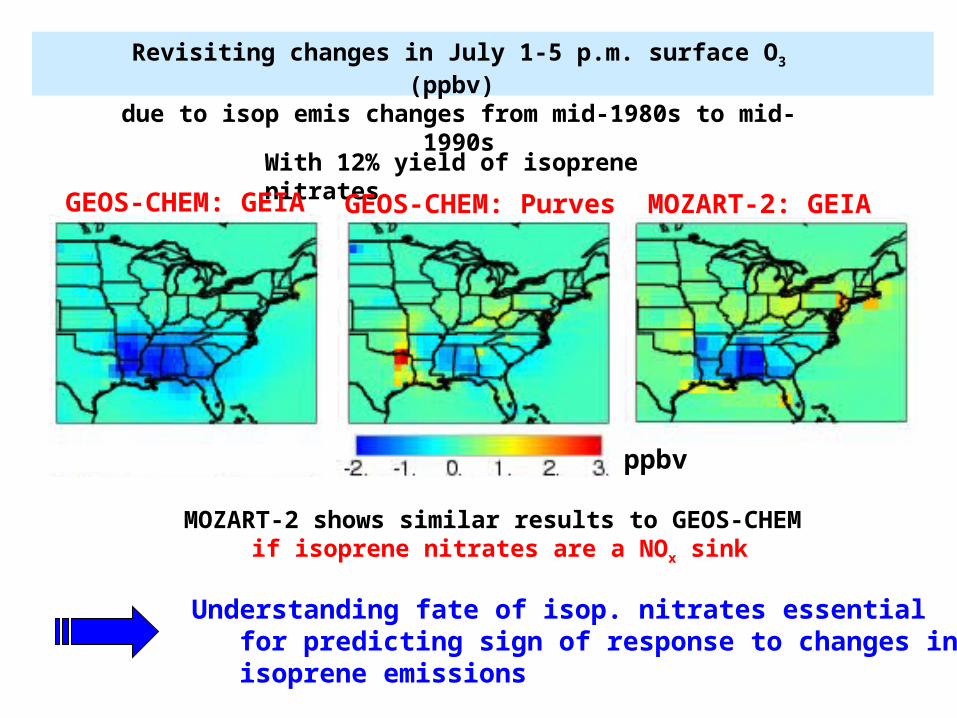
Understanding fate of isop. nitrates essential for predicting sign of response to changes in isoprene emissions
With 12% yield of isoprene nitrates
GEOS-CHEM: GEIA
GEOS-CHEM: Purves
MOZART-2: GEIA
ppbv
MOZART-2 shows similar results to GEOS-CHEM if isoprene nitrates are a NOx sink
Revisiting changes in July 1-5 p.m. surface O3 (ppbv) due to isop emis changes from mid-1980s to mid-1990s
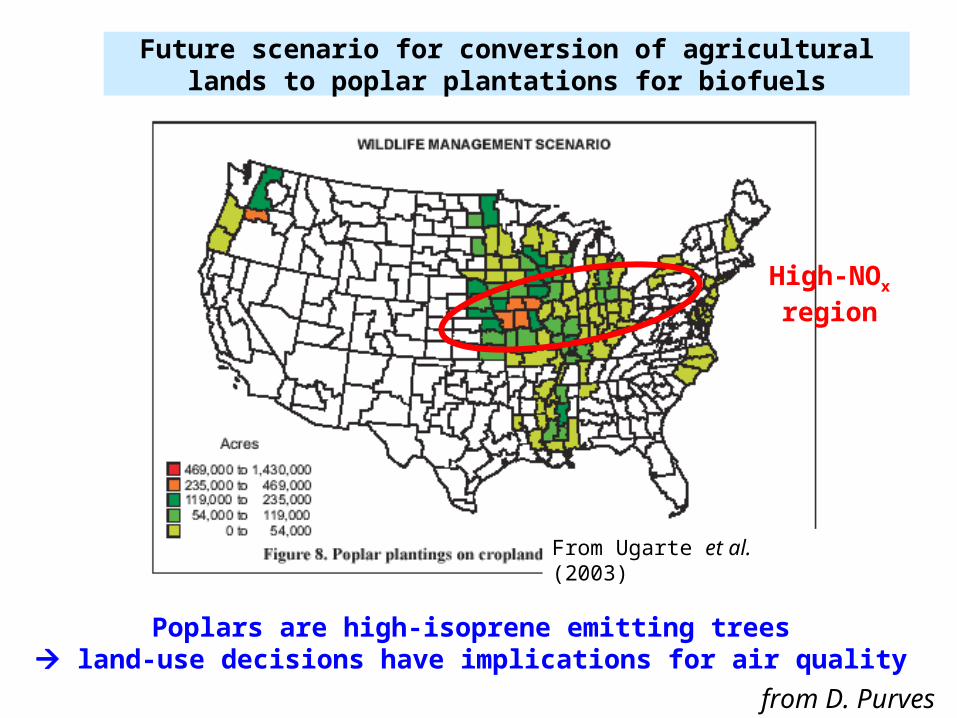
From Ugarte et al. (2003)
Future scenario for conversion of agricultural lands to poplar plantations for biofuels
from D. Purves
Poplars are high-isoprene emitting trees land-use decisions have implications for air quality
High-NOx
region
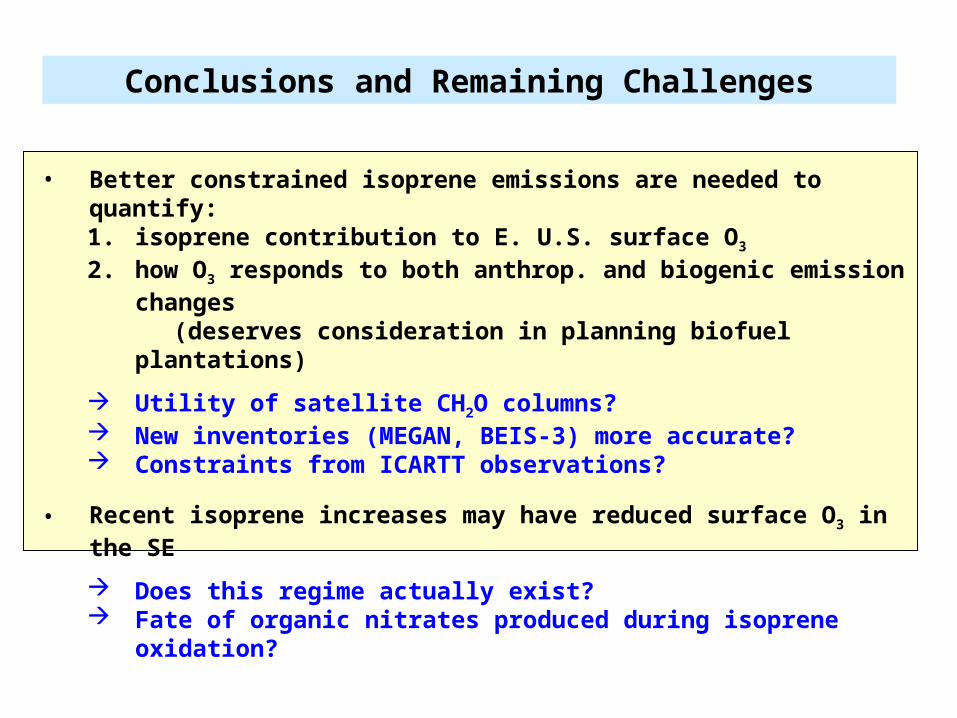
• Better constrained isoprene emissions are needed to quantify:1. isoprene contribution to E. U.S. surface O3 2. how O3 responds to both anthrop. and biogenic emission changes (deserves consideration in planning biofuel plantations)
Utility of satellite CH2O columns? New inventories (MEGAN, BEIS-3) more accurate? Constraints from ICARTT observations?
• Recent isoprene increases may have reduced surface O3 in the SE
Does this regime actually exist? Fate of organic nitrates produced during isoprene oxidation?
Conclusions and Remaining Challenges
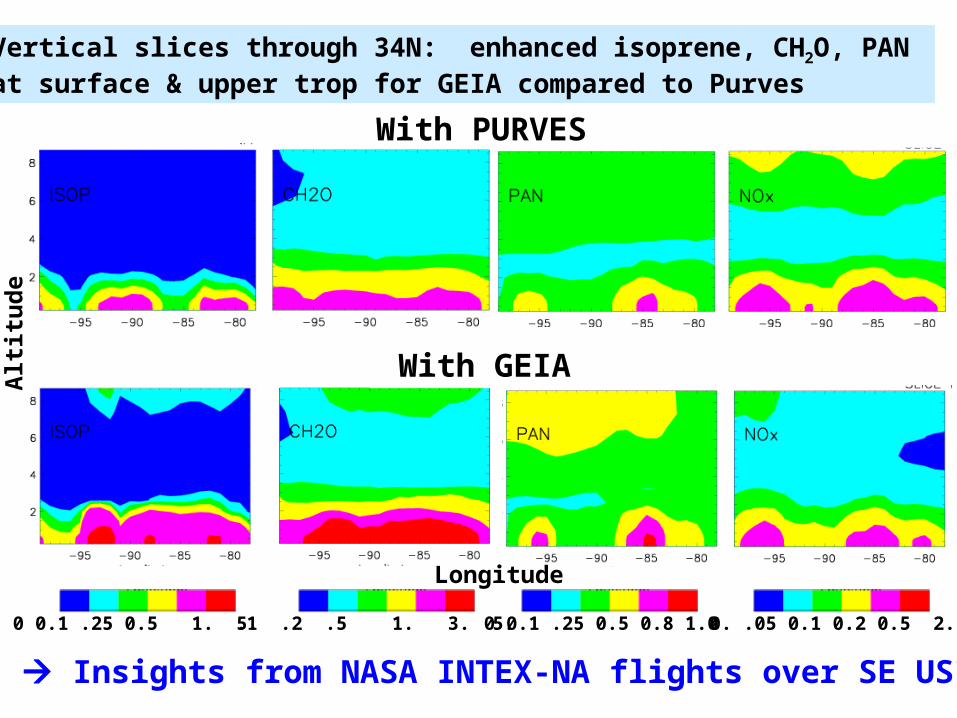
With PURVES
Vertical slices through 34N: enhanced isoprene, CH2O, PAN at surface & upper trop for GEIA compared to Purves
With GEIA
Insights from NASA INTEX-NA flights over SE US?
0 0.1 .25 0.5 1. 5. .1 .2 .5 1. 3. 5. 0 0.1 .25 0.5 0.8 1.0 0. .05 0.1 0.2 0.5 2.
Longitude
Alt
itu
de

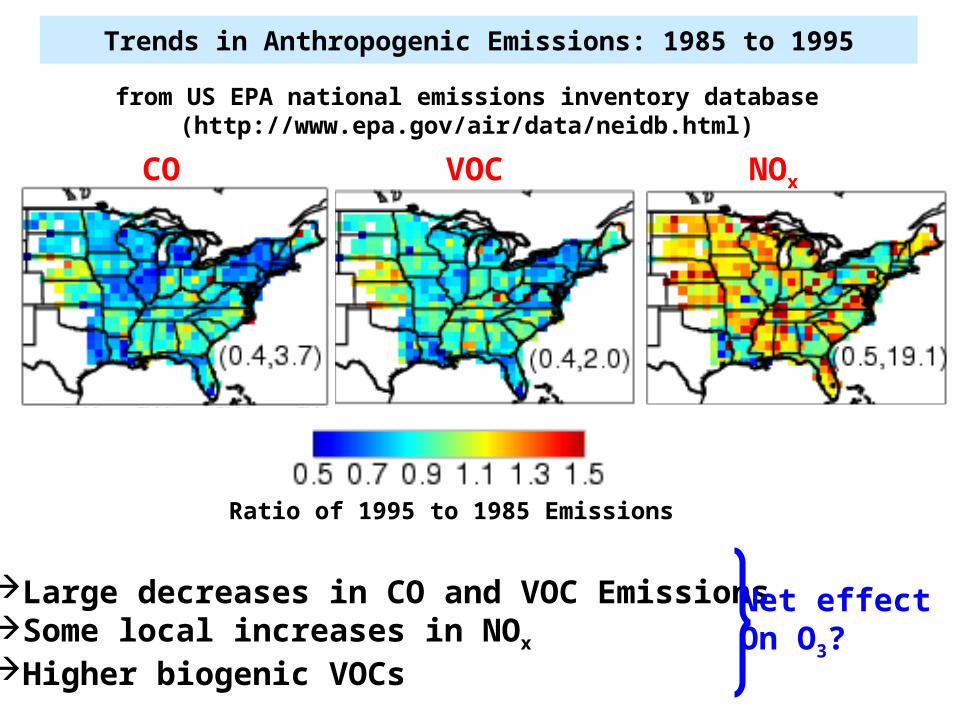
Trends in Anthropogenic Emissions: 1985 to 1995
CO
Large decreases in CO and VOC EmissionsSome local increases in NOx
Higher biogenic VOCs
Net effectOn O3?
from US EPA national emissions inventory database(http://www.epa.gov/air/data/neidb.html)
VOC NOx
Ratio of 1995 to 1985 Emissions
Wit
h G
EIA
Is
op
ren
e E
mis
Wit
h P
urv
es e
t al
.Is
op
ren
e E
mis
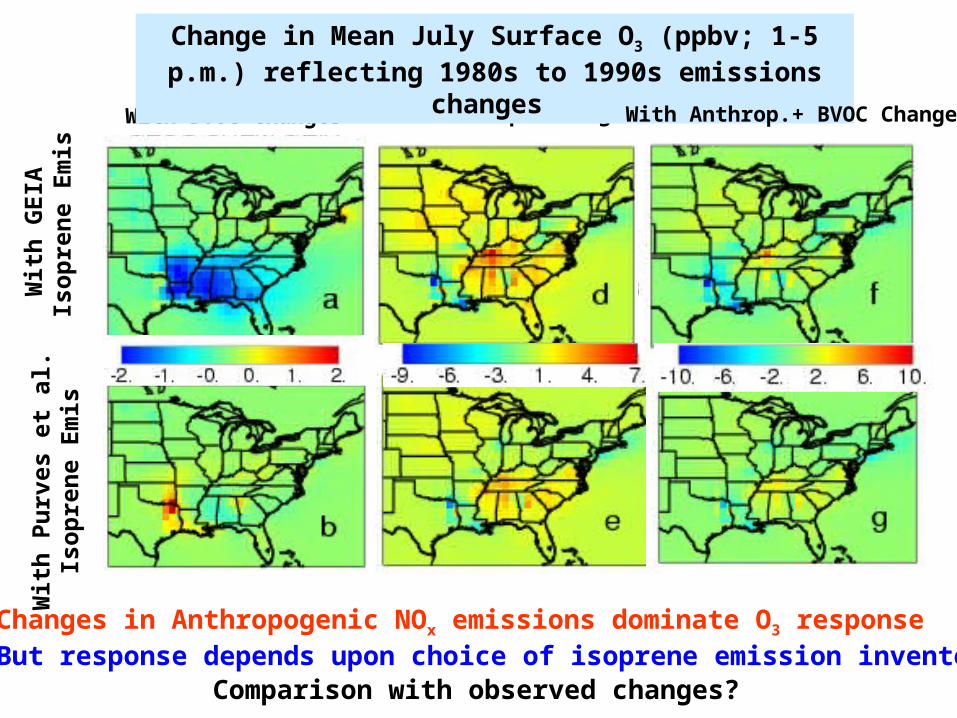
With BVOC Changes With Anthrop. Changes
Change in Mean July Surface O3 (ppbv; 1-5 p.m.) reflecting 1980s to 1990s emissions
changes With Anthrop.+ BVOC Changes
Changes in Anthropogenic NOx emissions dominate O3 responseBut response depends upon choice of isoprene emission inventory
Comparison with observed changes?
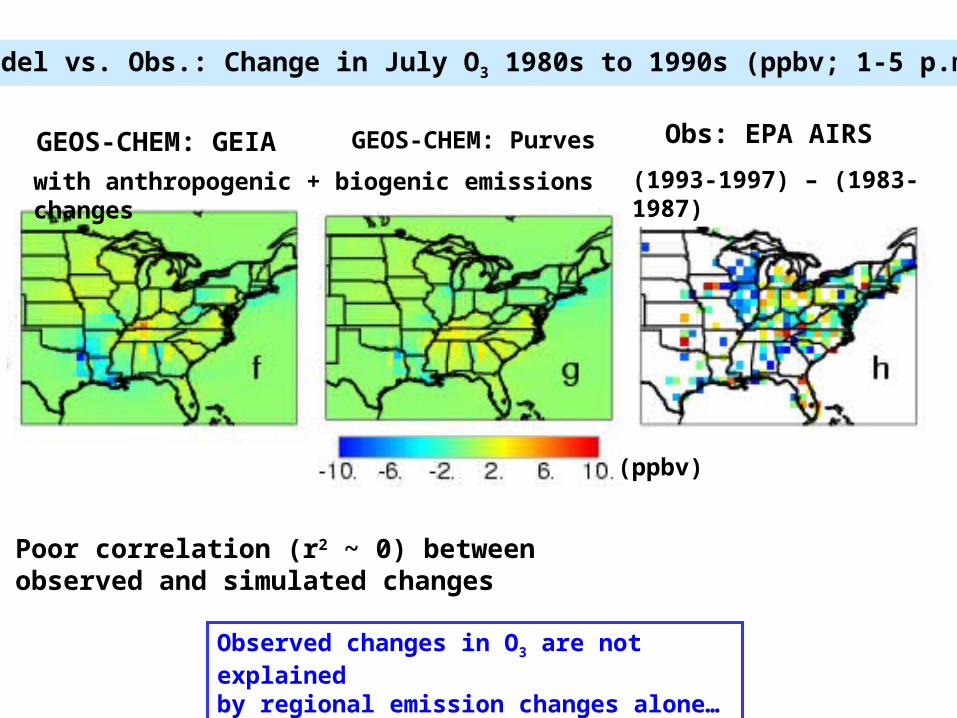
Model vs. Obs.: Change in July O3 1980s to 1990s (ppbv; 1-5 p.m.)
(1993-1997) – (1983-1987)
Obs: EPA AIRSGEOS-CHEM: GEIA GEOS-CHEM: Purves
Observed changes in O3 are not explained by regional emission changes alone…
Poor correlation (r2 ~ 0) betweenobserved and simulated changes
with anthropogenic + biogenic emissions changes
(ppbv)
°
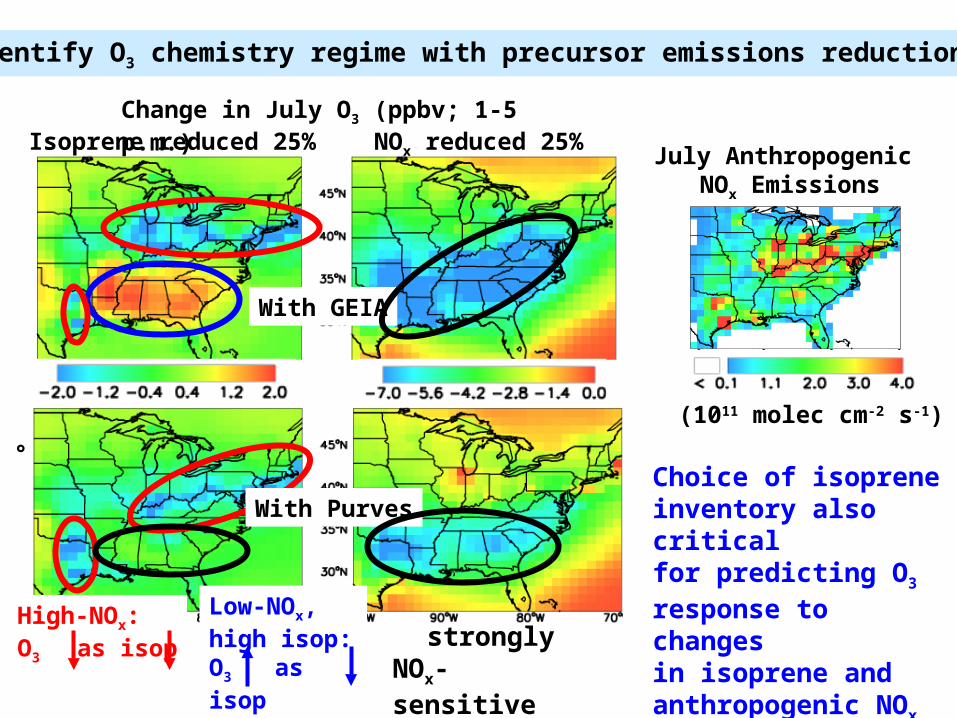
High-NOx:O3 as isop
Change in July O3 (ppbv; 1-5 p.m.)Isoprene reduced 25% NOx reduced 25%
Low-NOx, high isop:O3 as isop
With GEIA
With Purves
Identify O3 chemistry regime with precursor emissions reductions
July Anthropogenic NOx Emissions
(1011 molec cm-2 s-1)
Choice of isoprene inventory also criticalfor predicting O3 response to changes in isoprene and anthropogenic NOx emissions
stronglyNOx-sensitive
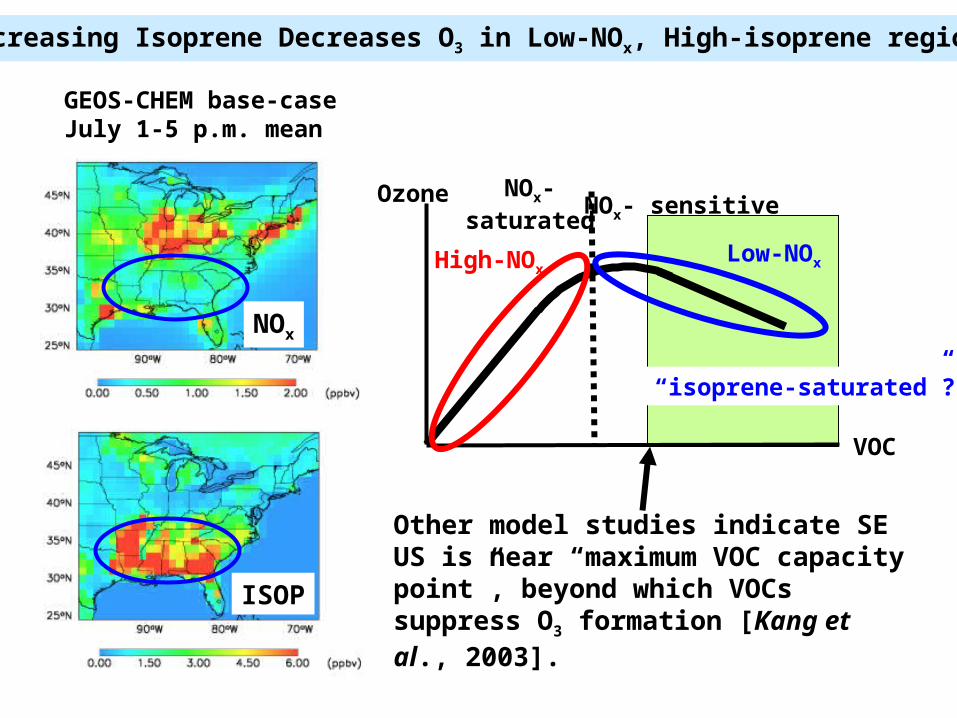
Increasing Isoprene Decreases O3 in Low-NOx, High-isoprene regions
GEOS-CHEM base-caseJuly 1-5 p.m. mean
NOx
ISOP
Other model studies indicate SE US is near “maximum VOC capacity point”, beyond which VOCs suppress O3 formation [Kang et al., 2003].
VOC
Ozone NOx-saturated
NOx- sensitive
High-NOxLow-NOx
“isoprene-saturated”??