Embed Size (px)
Citation preview
Sensitized luminescence of the Eu3�/La3�/cinnamic acid mixed complex:comparison to the Eu3�/Gd3�/cinnamic acid mixed complex
JaÂnos ErostyaÂk*, Andrea BuzaÂdy, IstvaÂn HornyaÂk, LaÂszlo KozmaJanus Pannonius University, Department of Experimental Physics, IfjuÂsaÂg u. 6, PeÂcs H-7624, Hungary
Received 22 June 1998; received in revised form 23 October 1998; accepted 12 November 1998
Abstract
The photoluminescence properties of europium and lanthanum mixed complexes with cinnamic acid are described. The maximum
emission intensity is found to be at about 80% Eu3�/20% La3� content at room temperature. The roles of intramolecular and intermolecular
energy transfer processes are discussed. Comparison to photoluminescence properties of Eu3�/Gd3�/cinnamic acid mixed complexes is
given. A slight photochemical degradation of the samples is found, the degree of which depends on the Eu3�/La3� ratio. # 1999 Elsevier
Science S.A. All rights reserved.
Keywords: Intramolecular and intermolecular energy transfer; Sensitized luminescence of Eu3�; Time-resolved luminescence; Photochemical degradation
1. Introduction
Although the sensitized emission of lanthanide chelates
was ®rst observed in 1942 [1], they are still in the front of
investigation and development. They are widely used in
different ®elds, especially as luminescent labels in ¯uor-
oimmunoassays [2±8]. Their application base on the energy
transfer from the light absorbing ligands towards the central
lanthanide ion [9±12].
In a previous work [13] we presented the interesting
luminescence features of mixed complexes of europium
and gadolinium with cinnamic acid (Eu/Gd/CA). It was
concluded that the luminescence properties of the samples
studied in powder form are determined by both intra-, and
intermolecular energy transfer processes (IntraMET and
InterMET). In this highly luminescent material the so-called
co-luminescent effect can be found, which means that the
®nal emitter Eu3� ions are pumped not only from cinnamic
acids (CAs) bonded to these ions, but from CAs bonded to
Gd3� ions, too.
In this paper the luminescence properties of mixed com-
plexes of Eu3�/(CA)3 and La3�/(CA)3 ± (let Eu/La/CA stand
for them) ± are reported. The results shown below are very
similar to those which were found in the case of Eu/Gd/CA.
A comparison between the two systems is also presented and
the signi®cant differences are discussed.
2. Experimental
The CA was ®rst neutralized by NaOH, then the aqueous
solution of Eu(NO3)3�6H2O and La(NO3)3�6H2O were
added into CA solution. The mole ratio of lanthanides
and CA was 1 : 3. A white precipitate was obtained, which
was ®ltered and washed by double distilled water, then dried
in vacuum at 808C. A series of mixed complexes was
prepared in which the Eu3� content was gradually decreased
and the La3� content was increased. The materials were used
in powder form for the measurements. Their chemical
formulas are listed in Table 1.
The luminescence measurements (emission and excita-
tion spectra, decay curves) were carried out by a PERKIN-
ELMER LS50B luminescence spectrometer at room tem-
perature using the solid sample holder. The spectrometer has
a Xe ¯ash lamp as excitation source. The time resolution of
the instrument is 10 ms. The spectra were measured in
phosphorescence mode with an integrating gate of 5 ms
which is long enough to integrate all the signals after the
excitations. To determine the decay times the decay curves
were measured in 10 ms steps, which gives an excellent
resolution in the case of sub-ms decays. The I0 initial
intensities (see 3.3) were measured in ¯uorescence mode
with an integrating gate of 10 ms.
Journal of Photochemistry and Photobiology A: Chemistry 121 (1999) 43±48
*Corresponding author. Tel.: +36-72-327622/4399; fax: +36-72-501528;
e-mail: [email protected]
1010-6030/99/$ ± see front matter # 1999 Elsevier Science S.A. All rights reserved.
P I I : S 1 0 1 0 - 6 0 3 0 ( 9 8 ) 0 0 4 4 3 - 2
3. Results and discussion
3.1. Excitation and emission spectra
The excitation (Fig. 1) and emission spectra (Fig. 2) of
Eu/La/CA are very similar to the corresponding spectra of
Eu/Gd/CA [13]. The excitation bands of the ligand and the
Eu3� can be well identi®ed (Fig. 1).
The ligand bands are centred at 240 and 335 nm. The
slope over 370 nm is typical for powder samples and is
believed to originate mainly from the non-monomer forms
of the complexes. The La3� ions do not take part in the
energy transfer processes. The Eu3� ions can be excited to
their 5D0;5 D1;
5 D2;5 D3 and5L6 levels. The emission was
measured at 616 nm, which means that all of the excited
states mentioned before relax ± at least partly ± through the5D0 level. In some Eu3� complexes a ligand-to-metal charge
transfer state (CT) can be assumed, which can give a very
effective relaxation way from the levels above 5D2 [11]
especially at room temperature. The presence of 7Fi±5Dj
(i � 0, 1; j � 1, 2, 3) and 7Fi±5L6 transitions in the excitation
spectra (Fig. 1) means that there is not any effective
non-radiative relaxation way ± e.g. ligand-to-metal CT state
from the excited states above 5D2 level towards the ground
state.
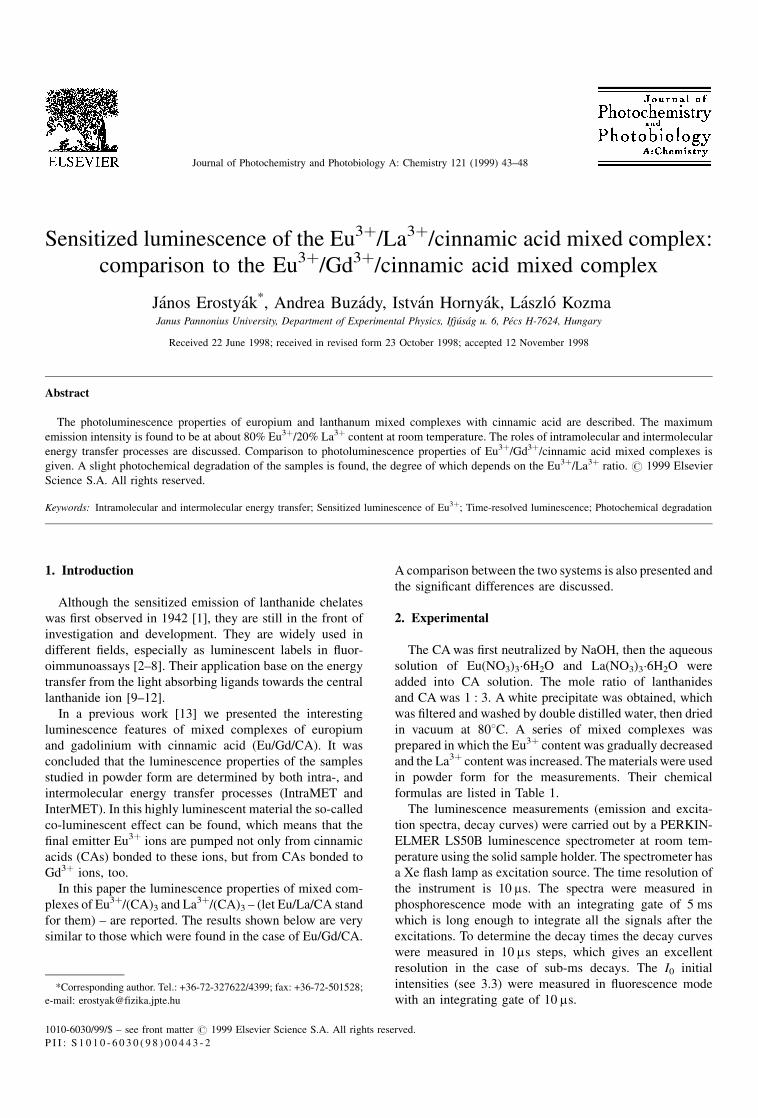
The emission spectra (Fig. 2) consist of two bands of
Eu3� (5D0±7F1 and 5D0±7F2 transitions). Let us note that the5D0±7F0 transition (580 nm), which is always present in
solution, has an intensity being under the detection limit.
Moreover, the ligand has a broad, very weak emission band
around 400 nm.
The shape and relative intensity of Eu3� emission bands
does not depend on the excitation wavelength. From the
higher excited states of Eu3� there are not any luminescence
emission, these states relax either to the lowest lying excited
state (5D0) or to the ground state (7F0) only by non-radiative
transitions. (In solution the luminescence from a higher
excited state can in some cases be observed [14±16].)
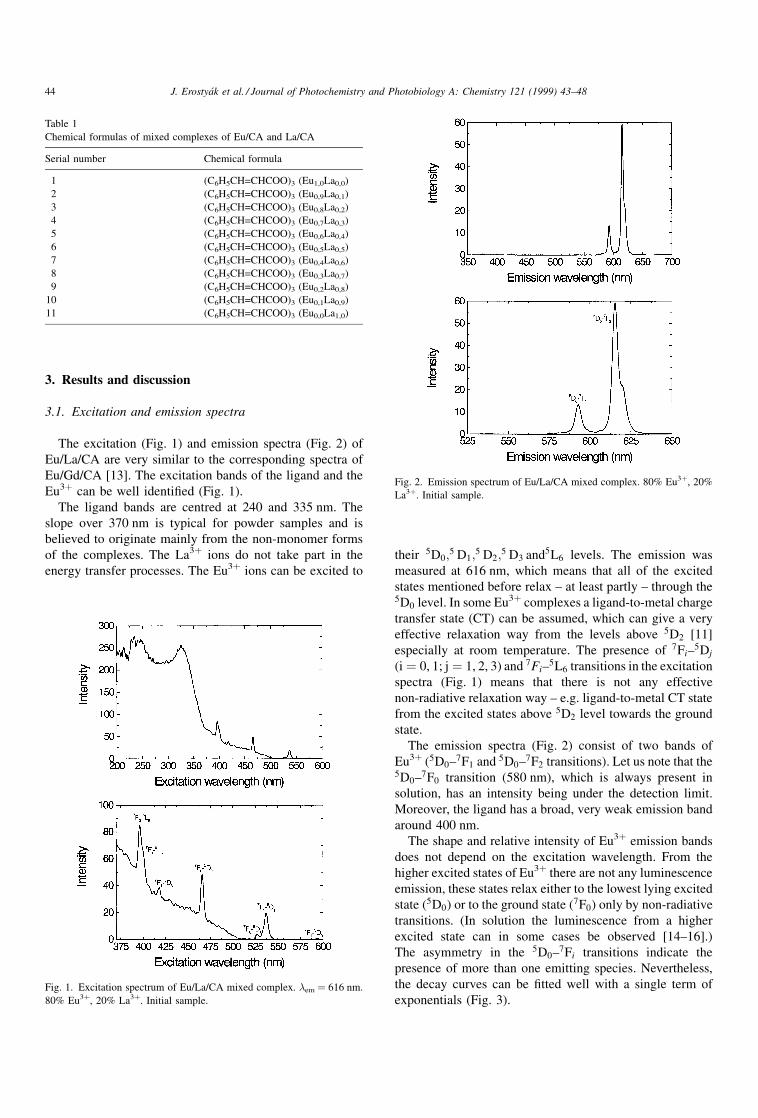
The asymmetry in the 5D0±7Fi transitions indicate the
presence of more than one emitting species. Nevertheless,
the decay curves can be ®tted well with a single term of
exponentials (Fig. 3).
Table 1
Chemical formulas of mixed complexes of Eu/CA and La/CA
Serial number Chemical formula
1 (C6H5CH=CHCOO)3 (Eu1,0La0,0)
2 (C6H5CH=CHCOO)3 (Eu0,9La0,1)
3 (C6H5CH=CHCOO)3 (Eu0,8La0,2)
4 (C6H5CH=CHCOO)3 (Eu0,7La0,3)
5 (C6H5CH=CHCOO)3 (Eu0,6La0,4)
6 (C6H5CH=CHCOO)3 (Eu0,5La0,5)
7 (C6H5CH=CHCOO)3 (Eu0,4La0,6)
8 (C6H5CH=CHCOO)3 (Eu0,3La0,7)
9 (C6H5CH=CHCOO)3 (Eu0,2La0,8)
10 (C6H5CH=CHCOO)3 (Eu0,1La0,9)
11 (C6H5CH=CHCOO)3 (Eu0,0La1,0)
Fig. 1. Excitation spectrum of Eu/La/CA mixed complex. �em � 616 nm.
80% Eu3�, 20% La3�. Initial sample.
Fig. 2. Emission spectrum of Eu/La/CA mixed complex. 80% Eu3�, 20%
La3�. Initial sample.
44 J. ErostyaÂk et al. / Journal of Photochemistry and Photobiology A: Chemistry 121 (1999) 43±48
3.2. Photochemical degradation
Irradiating the samples by UV light having wavelength of
shorter than 330 nm the emission intensity (measured at
616 nm) decreases in time. It means that a photochemical
degradation occurs in the irradiated samples. The wave-
length of irradiating light was 240 nm and the time of
irradiation was 1800 s. (It was a pulsed irradiation by ¯ashes
of 10 ms using 50 Hz repetition rate!) In the following, the
samples not treated with irradiation mentioned before will
be referred to as `initial'.
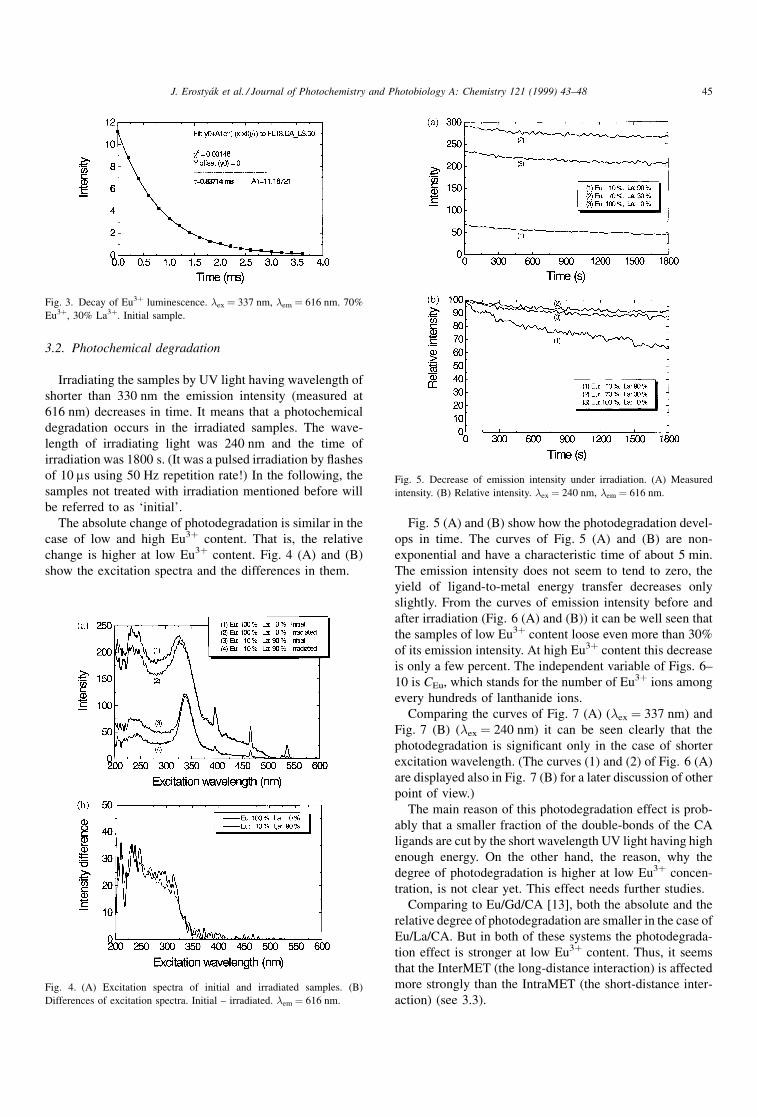
The absolute change of photodegradation is similar in the
case of low and high Eu3� content. That is, the relative
change is higher at low Eu3� content. Fig. 4 (A) and (B)
show the excitation spectra and the differences in them.
Fig. 5 (A) and (B) show how the photodegradation devel-
ops in time. The curves of Fig. 5 (A) and (B) are non-
exponential and have a characteristic time of about 5 min.
The emission intensity does not seem to tend to zero, the
yield of ligand-to-metal energy transfer decreases only
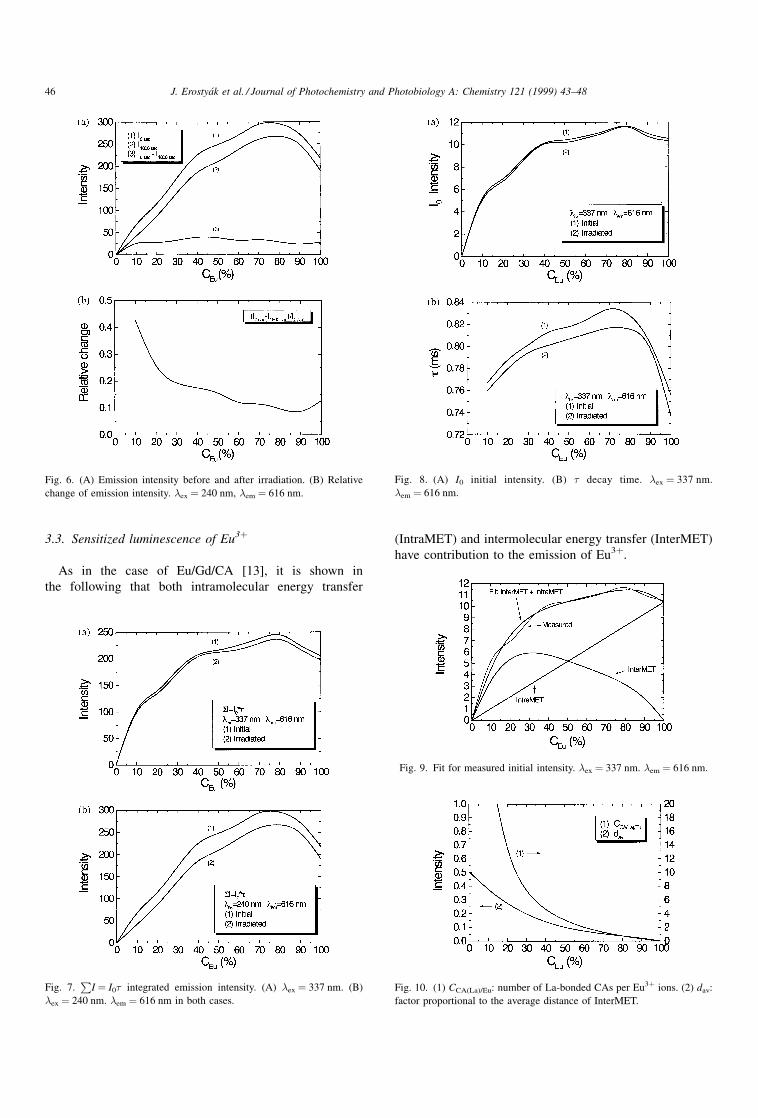
slightly. From the curves of emission intensity before and
after irradiation (Fig. 6 (A) and (B)) it can be well seen that
the samples of low Eu3� content loose even more than 30%
of its emission intensity. At high Eu3� content this decrease
is only a few percent. The independent variable of Figs. 6±
10 is CEu, which stands for the number of Eu3� ions among
every hundreds of lanthanide ions.
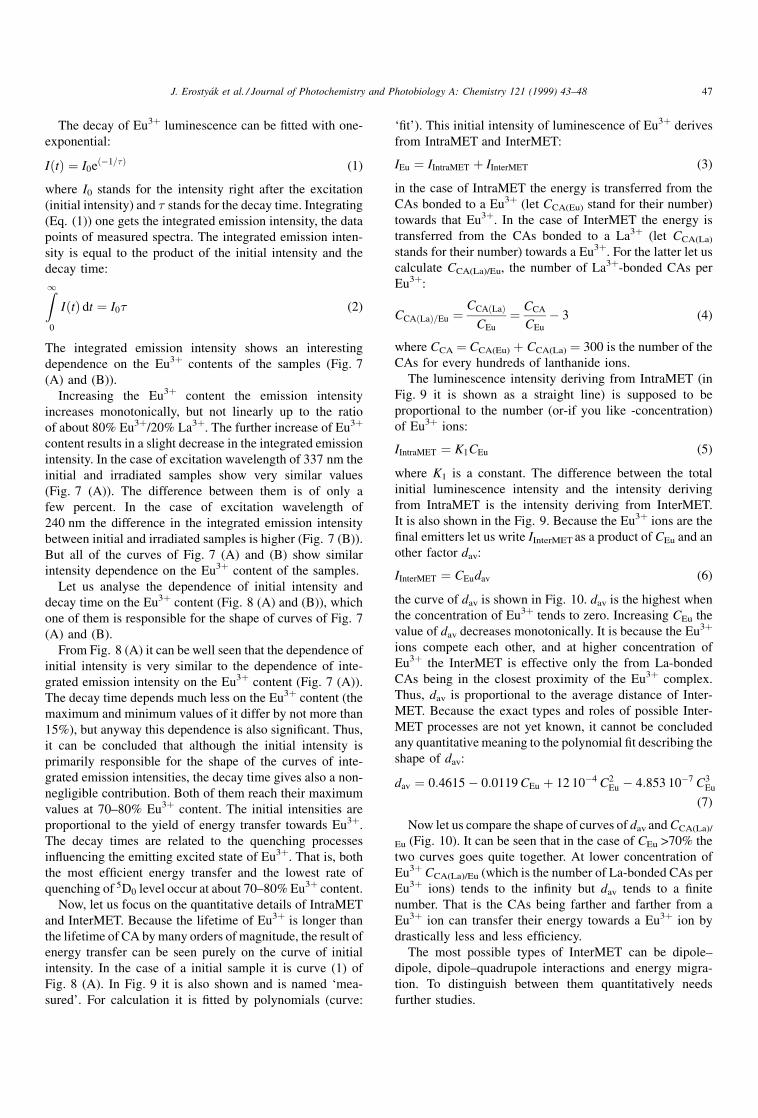
Comparing the curves of Fig. 7 (A) (�ex � 337 nm) and
Fig. 7 (B) (�ex � 240 nm) it can be seen clearly that the
photodegradation is signi®cant only in the case of shorter
excitation wavelength. (The curves (1) and (2) of Fig. 6 (A)
are displayed also in Fig. 7 (B) for a later discussion of other
point of view.)
The main reason of this photodegradation effect is prob-
ably that a smaller fraction of the double-bonds of the CA
ligands are cut by the short wavelength UV light having high
enough energy. On the other hand, the reason, why the
degree of photodegradation is higher at low Eu3� concen-
tration, is not clear yet. This effect needs further studies.
Comparing to Eu/Gd/CA [13], both the absolute and the
relative degree of photodegradation are smaller in the case of
Eu/La/CA. But in both of these systems the photodegrada-
tion effect is stronger at low Eu3� content. Thus, it seems
that the InterMET (the long-distance interaction) is affected
more strongly than the IntraMET (the short-distance inter-
action) (see 3.3).
Fig. 3. Decay of Eu3� luminescence. �ex � 337 nm, �em � 616 nm. 70%
Eu3�, 30% La3�. Initial sample.
Fig. 4. (A) Excitation spectra of initial and irradiated samples. (B)
Differences of excitation spectra. Initial ± irradiated. �em � 616 nm.
Fig. 5. Decrease of emission intensity under irradiation. (A) Measured
intensity. (B) Relative intensity. �ex � 240 nm, �em � 616 nm.
J. ErostyaÂk et al. / Journal of Photochemistry and Photobiology A: Chemistry 121 (1999) 43±48 45
3.3. Sensitized luminescence of Eu3�
As in the case of Eu/Gd/CA [13], it is shown in
the following that both intramolecular energy transfer
(IntraMET) and intermolecular energy transfer (InterMET)
have contribution to the emission of Eu3�.
Fig. 6. (A) Emission intensity before and after irradiation. (B) Relative
change of emission intensity. �ex � 240 nm, �em � 616 nm.
Fig. 7.P
I � I0� integrated emission intensity. (A) �ex � 337 nm. (B)
�ex � 240 nm. �em � 616 nm in both cases.
Fig. 8. (A) I0 initial intensity. (B) � decay time. �ex � 337 nm.
�em � 616 nm.
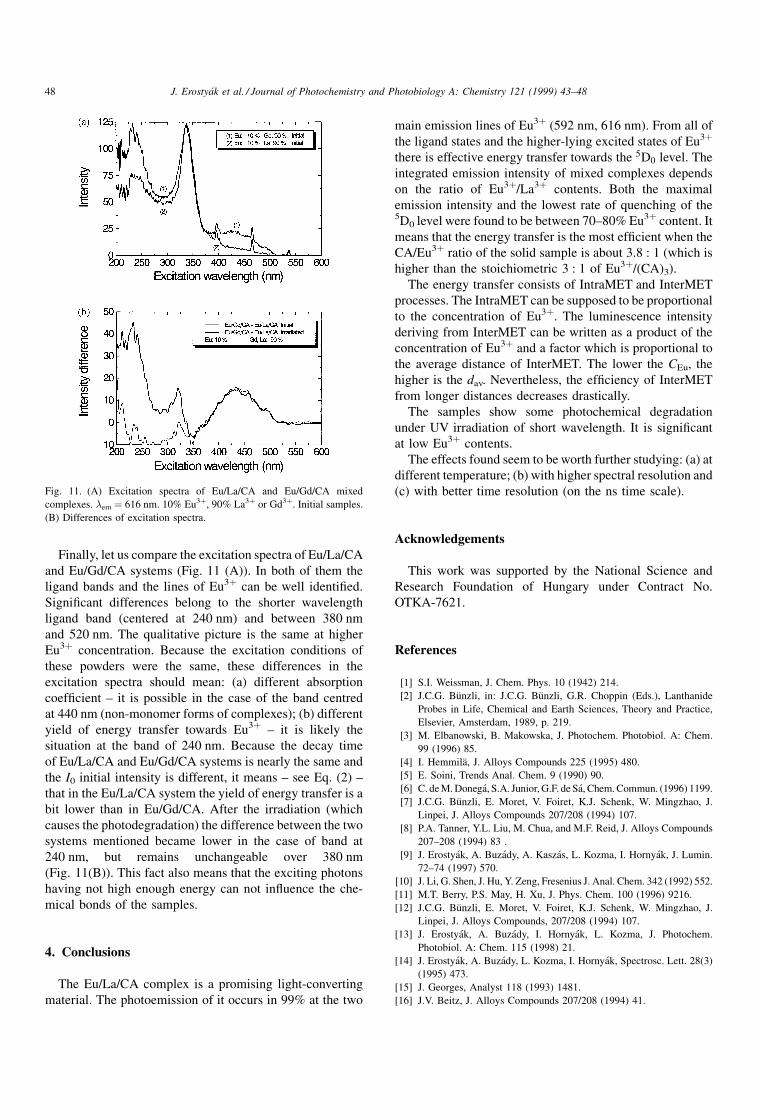
Fig. 9. Fit for measured initial intensity. �ex � 337 nm. �em � 616 nm.
Fig. 10. (1) CCA(La)/Eu: number of La-bonded CAs per Eu3� ions. (2) dav:
factor proportional to the average distance of InterMET.
46 J. ErostyaÂk et al. / Journal of Photochemistry and Photobiology A: Chemistry 121 (1999) 43±48
The decay of Eu3� luminescence can be ®tted with one-
exponential:
I�t� � I0e�ÿ1=�� (1)
where I0 stands for the intensity right after the excitation
(initial intensity) and � stands for the decay time. Integrating
(Eq. (1)) one gets the integrated emission intensity, the data
points of measured spectra. The integrated emission inten-
sity is equal to the product of the initial intensity and the
decay time:Z10
I�t� dt � I0� (2)
The integrated emission intensity shows an interesting
dependence on the Eu3� contents of the samples (Fig. 7
(A) and (B)).
Increasing the Eu3� content the emission intensity
increases monotonically, but not linearly up to the ratio
of about 80% Eu3�/20% La3�. The further increase of Eu3�
content results in a slight decrease in the integrated emission
intensity. In the case of excitation wavelength of 337 nm the
initial and irradiated samples show very similar values
(Fig. 7 (A)). The difference between them is of only a
few percent. In the case of excitation wavelength of
240 nm the difference in the integrated emission intensity
between initial and irradiated samples is higher (Fig. 7 (B)).
But all of the curves of Fig. 7 (A) and (B) show similar
intensity dependence on the Eu3� content of the samples.
Let us analyse the dependence of initial intensity and
decay time on the Eu3� content (Fig. 8 (A) and (B)), which
one of them is responsible for the shape of curves of Fig. 7
(A) and (B).
From Fig. 8 (A) it can be well seen that the dependence of
initial intensity is very similar to the dependence of inte-
grated emission intensity on the Eu3� content (Fig. 7 (A)).
The decay time depends much less on the Eu3� content (the
maximum and minimum values of it differ by not more than
15%), but anyway this dependence is also signi®cant. Thus,
it can be concluded that although the initial intensity is
primarily responsible for the shape of the curves of inte-
grated emission intensities, the decay time gives also a non-
negligible contribution. Both of them reach their maximum
values at 70±80% Eu3� content. The initial intensities are
proportional to the yield of energy transfer towards Eu3�.
The decay times are related to the quenching processes
in¯uencing the emitting excited state of Eu3�. That is, both
the most ef®cient energy transfer and the lowest rate of
quenching of 5D0 level occur at about 70±80% Eu3� content.
Now, let us focus on the quantitative details of IntraMET
and InterMET. Because the lifetime of Eu3� is longer than
the lifetime of CA by many orders of magnitude, the result of
energy transfer can be seen purely on the curve of initial
intensity. In the case of a initial sample it is curve (1) of
Fig. 8 (A). In Fig. 9 it is also shown and is named `mea-
sured'. For calculation it is ®tted by polynomials (curve:
`®t'). This initial intensity of luminescence of Eu3� derives
from IntraMET and InterMET:
IEu � IIntraMET � IInterMET (3)
in the case of IntraMET the energy is transferred from the
CAs bonded to a Eu3� (let CCA(Eu) stand for their number)
towards that Eu3�. In the case of InterMET the energy is
transferred from the CAs bonded to a La3� (let CCA(La)
stands for their number) towards a Eu3�. For the latter let us
calculate CCA(La)/Eu, the number of La3�-bonded CAs per
Eu3�:
CCA�La�=Eu �CCA�La�
CEu
� CCA
CEu
ÿ 3 (4)
where CCA � CCA(Eu) � CCA(La) � 300 is the number of the
CAs for every hundreds of lanthanide ions.
The luminescence intensity deriving from IntraMET (in
Fig. 9 it is shown as a straight line) is supposed to be
proportional to the number (or-if you like -concentration)
of Eu3� ions:
IIntraMET � K1CEu (5)
where K1 is a constant. The difference between the total
initial luminescence intensity and the intensity deriving
from IntraMET is the intensity deriving from InterMET.
It is also shown in the Fig. 9. Because the Eu3� ions are the
®nal emitters let us write IInterMET as a product of CEu and an
other factor dav:
IInterMET � CEudav (6)
the curve of dav is shown in Fig. 10. dav is the highest when
the concentration of Eu3� tends to zero. Increasing CEu the
value of dav decreases monotonically. It is because the Eu3�
ions compete each other, and at higher concentration of
Eu3� the InterMET is effective only the from La-bonded
CAs being in the closest proximity of the Eu3� complex.
Thus, dav is proportional to the average distance of Inter-
MET. Because the exact types and roles of possible Inter-
MET processes are not yet known, it cannot be concluded
any quantitative meaning to the polynomial ®t describing the
shape of dav:
dav � 0:4615ÿ 0:0119 CEu � 12 10ÿ4 C2Eu ÿ 4:853 10ÿ7 C3
Eu
(7)
Now let us compare the shape of curves of dav and CCA(La)/
Eu (Fig. 10). It can be seen that in the case of CEu >70% the
two curves goes quite together. At lower concentration of
Eu3� CCA(La)/Eu (which is the number of La-bonded CAs per
Eu3� ions) tends to the in®nity but dav tends to a ®nite
number. That is the CAs being farther and farther from a
Eu3� ion can transfer their energy towards a Eu3� ion by
drastically less and less ef®ciency.
The most possible types of InterMET can be dipole±
dipole, dipole±quadrupole interactions and energy migra-
tion. To distinguish between them quantitatively needs
further studies.
J. ErostyaÂk et al. / Journal of Photochemistry and Photobiology A: Chemistry 121 (1999) 43±48 47
Finally, let us compare the excitation spectra of Eu/La/CA
and Eu/Gd/CA systems (Fig. 11 (A)). In both of them the
ligand bands and the lines of Eu3� can be well identi®ed.
Signi®cant differences belong to the shorter wavelength
ligand band (centered at 240 nm) and between 380 nm
and 520 nm. The qualitative picture is the same at higher
Eu3� concentration. Because the excitation conditions of
these powders were the same, these differences in the
excitation spectra should mean: (a) different absorption
coef®cient ± it is possible in the case of the band centred
at 440 nm (non-monomer forms of complexes); (b) different
yield of energy transfer towards Eu3� ± it is likely the
situation at the band of 240 nm. Because the decay time
of Eu/La/CA and Eu/Gd/CA systems is nearly the same and
the I0 initial intensity is different, it means ± see Eq. (2) ±
that in the Eu/La/CA system the yield of energy transfer is a
bit lower than in Eu/Gd/CA. After the irradiation (which
causes the photodegradation) the difference between the two
systems mentioned became lower in the case of band at
240 nm, but remains unchangeable over 380 nm
(Fig. 11(B)). This fact also means that the exciting photons
having not high enough energy can not in¯uence the che-
mical bonds of the samples.
4. Conclusions
The Eu/La/CA complex is a promising light-converting
material. The photoemission of it occurs in 99% at the two
main emission lines of Eu3� (592 nm, 616 nm). From all of
the ligand states and the higher-lying excited states of Eu3�
there is effective energy transfer towards the 5D0 level. The
integrated emission intensity of mixed complexes depends
on the ratio of Eu3�/La3� contents. Both the maximal
emission intensity and the lowest rate of quenching of the5D0 level were found to be between 70±80% Eu3� content. It
means that the energy transfer is the most ef®cient when the
CA/Eu3� ratio of the solid sample is about 3.8 : 1 (which is
higher than the stoichiometric 3 : 1 of Eu3�/(CA)3).
The energy transfer consists of IntraMET and InterMET
processes. The IntraMET can be supposed to be proportional
to the concentration of Eu3�. The luminescence intensity
deriving from InterMET can be written as a product of the
concentration of Eu3� and a factor which is proportional to
the average distance of InterMET. The lower the CEu, the
higher is the dav. Nevertheless, the ef®ciency of InterMET
from longer distances decreases drastically.
The samples show some photochemical degradation
under UV irradiation of short wavelength. It is signi®cant
at low Eu3� contents.
The effects found seem to be worth further studying: (a) at
different temperature; (b) with higher spectral resolution and
(c) with better time resolution (on the ns time scale).
Acknowledgements
This work was supported by the National Science and
Research Foundation of Hungary under Contract No.
OTKA-7621.
References
[1] S.I. Weissman, J. Chem. Phys. 10 (1942) 214.
[2] J.C.G. BuÈnzli, in: J.C.G. BuÈnzli, G.R. Choppin (Eds.), Lanthanide
Probes in Life, Chemical and Earth Sciences, Theory and Practice,
Elsevier, Amsterdam, 1989, p. 219.
[3] M. Elbanowski, B. Makowska, J. Photochem. Photobiol. A: Chem.
99 (1996) 85.
[4] I. HemmilaÈ, J. Alloys Compounds 225 (1995) 480.
[5] E. Soini, Trends Anal. Chem. 9 (1990) 90.
[6] C. de M. DonegaÂ, S.A. Junior, G.F. de SaÂ, Chem. Commun. (1996) 1199.
[7] J.C.G. BuÈnzli, E. Moret, V. Foiret, K.J. Schenk, W. Mingzhao, J.
Linpei, J. Alloys Compounds 207/208 (1994) 107.
[8] P.A. Tanner, Y.L. Liu, M. Chua, and M.F. Reid, J. Alloys Compounds
207±208 (1994) 83 .
[9] J. ErostyaÂk, A. BuzaÂdy, A. KaszaÂs, L. Kozma, I. HornyaÂk, J. Lumin.
72±74 (1997) 570.
[10] J. Li, G. Shen, J. Hu, Y. Zeng, Fresenius J. Anal. Chem. 342 (1992) 552.
[11] M.T. Berry, P.S. May, H. Xu, J. Phys. Chem. 100 (1996) 9216.
[12] J.C.G. BuÈnzli, E. Moret, V. Foiret, K.J. Schenk, W. Mingzhao, J.
Linpei, J. Alloys Compounds, 207/208 (1994) 107.
[13] J. ErostyaÂk, A. BuzaÂdy, I. HornyaÂk, L. Kozma, J. Photochem.
Photobiol. A: Chem. 115 (1998) 21.
[14] J. ErostyaÂk, A. BuzaÂdy, L. Kozma, I. HornyaÂk, Spectrosc. Lett. 28(3)
(1995) 473.
[15] J. Georges, Analyst 118 (1993) 1481.
[16] J.V. Beitz, J. Alloys Compounds 207/208 (1994) 41.
Fig. 11. (A) Excitation spectra of Eu/La/CA and Eu/Gd/CA mixed
complexes. �em � 616 nm. 10% Eu3�, 90% La3� or Gd3�. Initial samples.
(B) Differences of excitation spectra.
48 J. ErostyaÂk et al. / Journal of Photochemistry and Photobiology A: Chemistry 121 (1999) 43±48


![New cinnamic N-benzylpiperidine and cinnamic Ndigital.csic.es/bitstream/10261/133225/7/New...impairment, but they do not stop neuronal degeneration or repair brain damage [2]. Nowadays](https://img.pdfslide.net/doc/110x75/5fe4de2c411490725a638bf1/new-cinnamic-n-benzylpiperidine-and-cinnamic-impairment-but-they-do-not-stop.jpg)


![NEXTRON - ELCO...NEXTRON 8 – 9 G-EU3 Low NOx Klasse 3 (< 80 mg/kWh) N8.5800 G-EU3 N8.7100 G-EU3 N9.8700 G-EU3 N9.10400 G-EU3 Betriebsbereich [kW] 640 – 5800 700 – 7100 850 –](https://img.pdfslide.net/doc/110x75/606bd70881981864b80b52bf/nextron-elco-nextron-8-a-9-g-eu3-low-nox-klasse-3-80-mgkwh-n85800.jpg)