Embed Size (px)
Citation preview
Sensory Discrimination, Working Memory and Intelligence
1
Sensory Discrimination, Working Memory and Intelligence in 9- and 11-Year Old
Children
Annik E. Voelke* - [email protected]
Stefan J. Troche - [email protected]
Thomas H. Rammsayer - [email protected]
Felicitas L. Wagner - [email protected]
Claudia M. Roebers – [email protected]
University of Bern, Switzerland
* Corresponding author (A. Voelke) at: Department of Psychology, University of Bern,
Muesmattstrasse 45, 3000 Bern 9, Switzerland.
Phone Nr. +41 31 631 47 25
Fax Nr. +41 31 631 82 12
E-mail address: [email protected]
Acknowledgements
This research was supported by a research grant from the Swiss National Science Foundation
to the senior authors (Grant No. 100014_137755/1 (PIs: Roebers, Troche, & Rammsayer)).
We wish to thank the schools, teachers and children who gave us their time and took part in
the study and the undergraduate students and research assistants for their help with data
collection. We would also like to thank the anonymous reviewers for their helpful comments
and suggestions.
Sensory Discrimination, Working Memory and Intelligence
2
Abstract
More than a century ago, Galton and Spearman suggested that there was a functional
relationship between sensory discrimination ability and intelligence. Studies have since been
able to confirm a close relationship between general discrimination ability (GDA) and IQ.
The aim of the present study was to assess whether this strong relationship between GDA and
IQ could be due to WM demands of GDA tasks. A sample of 140 children (70 9-year-olds
and 70 11-year-olds) was studied. Results showed that there was a significant overlap
between WM, GDA and fluid intelligence. Furthermore, results also revealed that WM could
not explain the relationship between GDA and fluid intelligence as such, but that it acted as a
bottleneck of information processing, limiting the influence of GDA on the prediction of fluid
intelligence. Specifically, GDA’s influence on the prediction of intelligence was only visible
when WM capacity was above a certain level.
Sensory Discrimination, Working Memory and Intelligence
3
Introduction
More than a century ago, on the eve of the development of the first intelligence test,
Galton and Spearman suggested that there was a functional relationship between sensory
discrimination ability and intelligence (Galton, 1883; Spearman, 1904). These ideas were,
however, disregarded for almost a century, until they re-attracted research interest in recent
years (Deary, 1994, 2012). Studies have since by and large confirmed a close relationship
between general discrimination ability (GDA) – a collection of sensory discrimination ability
in different tasks and different modalities – and IQ (e.g., Deary, Bell, Bell, Campbell, &
Fazal, 2004; Troche & Rammsayer, 2009). These recent and Spearman’s earlier findings are
intriguing on two accounts. Firstly and looking at them from a practical perspective, if GDA
could in fact be considered a good predictor of intelligence, this would provide researchers
(and practitioners) with a simple, culture-fair indicator of mental abilities. Secondly, and from
a theoretical perspective, high to very high correlations found between the two constructs are
striking when one considers how differently they are measured. While GDA is measured
using very simple tasks (e.g., comparing the pitch of two tones; Troche & Rammsayer, 2009),
intelligence is measured using tasks requiring complex, sequenced and hierarchical
information processing and problem solving skills (see e.g., Hunt, 2011).
It could be argued that due to the nature of the tasks used to assess sensory discrimination
- comparing two very similar stimuli that are presented one after another - it is very likely that
an individual’s working memory (WM) capacity plays a crucial role for the association
between GDA and IQ. WM is needed in many (simple) tasks where information has to be
stored and processed simultaneously (Cowan & Alloway, 2009) – which is what is required
for solving sensory discrimination tasks. Moreover, WM has repeatedly been found to be
strongly associated with intelligence in adults (e.g., Conway, Cowan, Bunting, Therriault, &
Minkoff, 2002; Engle, Tuholski, Laughlin, & Conway, 1999) and has also been shown to be
central to intelligence in childhood (Cowan & Alloway, 2009). In other words, a possible
Sensory Discrimination, Working Memory and Intelligence
4
theoretical explanation for the strong relationship between GDA and intelligence is that there
is a significant overlap among GDA, IQ, and WM.
The aim of the present study was to assess whether the previously found correlations
between GDA and intelligence could be replicated, and if so, whether GDA would be able to
independently contribute to the prediction of intelligence after WM had been taken into
account.
Sensory Discrimination and its Relationship to Intelligence
Sensory discrimination ability is the ability to detect small differences between stimuli of
the same modality (Deary, 1994). It first garnered interest in research on intelligence more
than a century ago, when Galton argued that “the only information that reaches us concerning
outward events appears to pass through the avenue of our senses; the more perceptive the
senses are of differences, the larger is the field upon which our judgment and intelligence can
act” (Galton, 1883, p.19). Spearman following up on this idea, showed that there is a strong
relationship between an unspecific general discrimination ability – derived from a battery of
tasks assessing sensory discrimination in different modalities – and psychometric intelligence
in children (Spearman, 1904). In fact, he found very high correlations between general
sensory discrimination and general intelligence (r = .96 and r = 1.04; in his formulas,
correlation coefficients greater than 1 were possible).
In the more than 100 years since then, the picture has not changed much. Recent studies
assessing the association between GDA and intelligence have confirmed a close relationship,
revealing high to very high correlations between the two constructs. In their study with adults,
Troche and Rammsayer (2009) for example, found high correlations (r = .64) between GDA
and intelligence, which they assessed using six subtests of reasoning from the Berlin model of
intelligence structure (BIS; Jäger, Süß, & Beauducel, 1997). The tests used in the study
included two tests with numerical content (continuing numerical series, estimating solutions
Sensory Discrimination, Working Memory and Intelligence
5
of mathematical tasks), two tests with verbal content (recognizing semantic relations, marking
one of four words that does not fit semantically) and two tests with figural content
(recognizing figural analogies, completing a progressing string of figures). Similarly, Deary
and colleagues (2004) found correlations of r = .68 (for participants aged between 13 and 62
years) and r = .92 (in a sample with a mean age of 12 years and 2 months) between general
discrimination and general intelligence. In the study with the older sample, intelligence was
assessed with 13 subtests of the Johnson O’Connor Research Foundation test battery (see e.g.,
Daniel, 1982) which included tests of spatial ability, numerical ability, memory, convergent
thinking, divergent thinking, vocabulary and perceptual speed. In the younger sample,
intelligence was assessed with the Mill Hill Vocabulary Test (Raven, Raven, & Court, 1982),
the Cattell Culture Fair Intelligence Test (Cattell & Cattell, 1973) and an extended Digit
Symbol Test from the Wechsler Adult Intelligence Scale-Revised (WAIS-R; Wechsler, 1981).
In addition, Meyer and colleagues (Meyer, Hagmann-von Arx, Lemola, & Grob, 2010) found
that general discrimination and general intelligence correlated with r = .78 in children aged
between 5 and 10 years. When the sample was split into smaller age bands, the correlations
remained high in all age groups. Intelligence was measured using six tests from the
Intelligence and Development Scales (IDS; Grob, Meyer, & Hagmann-von Arx, 2009). The
IDS have their roots in a reconception of the Kramer Intelligence Test and were developed as
a measure of general intelligence that could also provide a profile of six development
domains, including cognition, language, mathematics and social-emotional competence. The
six subtests used in the study were: phonological memory, visuo-spatial memory, auditory
memory (retelling a previously heard story), conceptual reasoning, figural reasoning and
selective attention. All 6 subtests belong to the profile of cognition (Grob et al., 2009; Meyer
et al., 2010).
Sensory Discrimination, Working Memory and Intelligence
6
The above studies clearly show that GDA is related to intelligence. However, due to the
very heterogeneous types of tests used to assess intelligence in the studies, it is difficult to
draw any firm conclusion as to which aspects of intelligence contribute to this relationship.
WM and its Relationship to Intelligence
WM has been described as an essential cognitive function needed in many everyday life-
situations. It plays a central role for language development (e.g., Archibald & Gathercole,
2006) and many higher order cognitive processes such as reading, mathematics, reasoning and
problem solving (e.g., Cowan & Alloway, 2009; Swanson, 2011).
Most researchers would agree that WM is a limited-capacity system responsible for
maintenance of information over short periods of time, and for the simultaneous manipulation
and processing of information (e.g., Cowan & Alloway, 2009). However, there is still some
disagreement as to the exact internal structure of WM. This can clearly be seen when
comparing some of the most prominent models of WM. In his model, Baddeley (1986, 2000,
2007) for example, describes WM as being made up of multiple specialized components, that
is, a central executive responsible for the control and processing of information and subsidiary
slave systems (the phonological loop, the visuo-spatial sketchpad and the episodic buffer)
responsible for the temporary storage of information. Cowan (e.g., 1999) on the other hand,
describes WM in his model as being made up of a central executive that directs attention and
controls voluntary processing as well as three memory components including long-term
memory (LTM), activated parts of LTM and a subset of activated memory in the focus of
attention and awareness where information is stored. Slightly different again, Engle and
colleagues describe WM as consisting of a store in the form of LTM traces active above
threshold, processes for achieving and maintaining this activation and controlled attention
(Engle, Kane, & Tuholski, 1999). Despite the obvious differences between WM in the three
models, there are also many similarities. All three models contain a component responsible
Sensory Discrimination, Working Memory and Intelligence
7
for controlling attention and processing information and components responsible for storing
information over brief periods of time. Emphasizing the commonalities even more, the
storage components (the slave systems in the Baddeley model, activated memory in the focus
of attention in the Cowan model and LTM traces active above threshold in the Engle et al.
model) are often referred to as STM (see e.g., Engle, Kane et al., 1999; Engle, Tuholski et al.,
1999; Henry, 2012).
In recent studies, WM has been found to be strongly related to intelligence in both adults
(for an overview see e.g., Ackerman, Beier, & Boyle, 2005) and children (e.g., Belacchi,
Carretti, & Cornoldi, 2010; Engel de Abreu, Conway, & Gathercole, 2010; Röthlisberger,
Neuenschwander, Michel, & Roebers, 2010; Swanson, 2011¸ Tillman, Bohlin, Sørensen, &
Lundervold, 2009). Studies have been able to show that the relationship between WM and
intelligence holds true for both fluid intelligence (e.g., Ackerman et al., 2005; Belacchi et al.,
2010; Engel de Abreu et al., 2010; Röthlisberger et al., 2010; Swanson, 2011; Tillman et al.,
2009) and crystallized intelligence (e.g., Ackerman et al., 2005; Swanson, 2011; Tillman et
al., 2009). Some researchers have even suggested that WM is the information-processing
process that best predicts measures of intelligence (Kyllonen & Christal, 1990; Oberauer,
Schulze, Wilhelm, & Süß, 2005).
As mentioned in the introduction, it is possible that the WM demands of GDA tasks
contribute to the association between GDA and IQ. If tasks measuring GDA were reliant on a
person’s WM, this could explain the high correlations between GDA and intelligence.
The Present Study
The purpose of the present study was to explore how GDA and WM are related to
intelligence in children and whether GDA is able to contribute to the prediction of intelligence
independently of WM. To be able to interpret the results in terms of developmental
progression or individual difference, two age groups – a younger age group (9-year-olds) and
Sensory Discrimination, Working Memory and Intelligence
8
an older age group (11-year-olds) – were chosen for the study. It is well known that WM
develops from early childhood at least through adolescence (Best & Miller, 2010) and that test
scores on intelligence tests increase with age, at least through to adolescence (Ferrer, O'Hare,
& Bunge, 2009). Although documentations of age-related changes in GDA are extremely rare,
it is likely that GDA also improves with age.
It is possible that the constructs do not develop at the exact same rate, and therefore lead
to different contributions of both WM and GDA to intelligence at different ages. In other
words, WM could have a stronger (or weaker) influence on intelligence than GDA in the
younger compared to the older age group and GDA could have a stronger (or weaker)
influence on the prediction of intelligence than WM in the older compared to the younger age
group. Alternatively, the predictive power (or the relative impact) of WM and GDA to explain
individual differences in intelligence may differ as a function of WM capacity. As Deary
(2012) has recently outlined, more sophisticated skills in one basic information process may
lead to stronger reliance on these processes, possibly attenuating the impact of other
information processes. By including two different age groups this question could be addressed
more systematically in the present study.
Sensory discrimination ability and working memory were each assessed with tasks using
different modalities such as verbal, visuo-spatial, auditory or visual material. To be able to
contribute to the untangling of the inconsistent results described above, and because studies of
the relationship between WM and intelligence often focus on fluid intelligence, a test of fluid
intelligence was used as a measure of intelligence in the present study. Fluid intelligence
consists of the ability to solve new and unusual problems as well as the ability to reason in
new situations (Hunt, 2011). It can be assessed with tests that are non-verbal and relatively
culture-free (Willis, Dumont, & Kaufman, 2011).
Sensory Discrimination, Working Memory and Intelligence
9
Method
Participants
The sample consisted of 140 children (71 boys) ranging in age from 8.6 to 12.0 years.
They were recruited through public schools in Switzerland. The sample was divided into a
younger age group (N= 70) with a mean age of 9 years 2 months (SD = 4 months; range: 8
years 7 months to 9 years 8 months) and an older age group (N = 70) with a mean age of 11
years 4 months (SD = 4 months; range: 10 years 7 months to 12 years 0 months). The study
was approved by the local ethics committee, and informed consent was obtained from all
parents.
Tasks
Working Memory Tasks
Listening Recall (LR): Participants completed a translated and adapted version of the
listening recall task from the Working Memory Test Battery for Children (WMTB-C;
Pickering & Gathercole, 2001). In this task, participants heard a series of sentences. They
were asked to judge whether each sentence made sense or not (e.g., “lions have four legs”,
“pineapples play football”) and to simultaneously remember the last word of each sentence.
At the end of each trial they were required to recall the last word from each sentence in the
order that they were presented. There were 6 trials for each span length. The length of the first
sequence was one sentence. When 50% of the trials were answered incorrectly the task was
terminated, otherwise the length of the sequence was increased by one sentence. The total
number of correctly answered trials (correct recall of the last word of each sentence) was used
as the dependent variable.
Letter-Number Sequencing (LNS): Participants completed the letter-number-sequencing
task from the German version of the Wechsler Intelligence Scale for Children (Petermann &
Sensory Discrimination, Working Memory and Intelligence
10
Petermann, 2008). In this task, children heard a mixed series of letters and digits. They were
required to repeat these, with the digits in numerical order first and the letters in alphabetical
order second. Each sequence consisted of three trials. The starting trials consisted of one letter
and one digit. If a child answered all three trials incorrectly, the task was ended; otherwise
trial length was increased by one letter or digit. The total number of correctly answered trials
(correctly recalled letter-number series) was used as measure of performance.
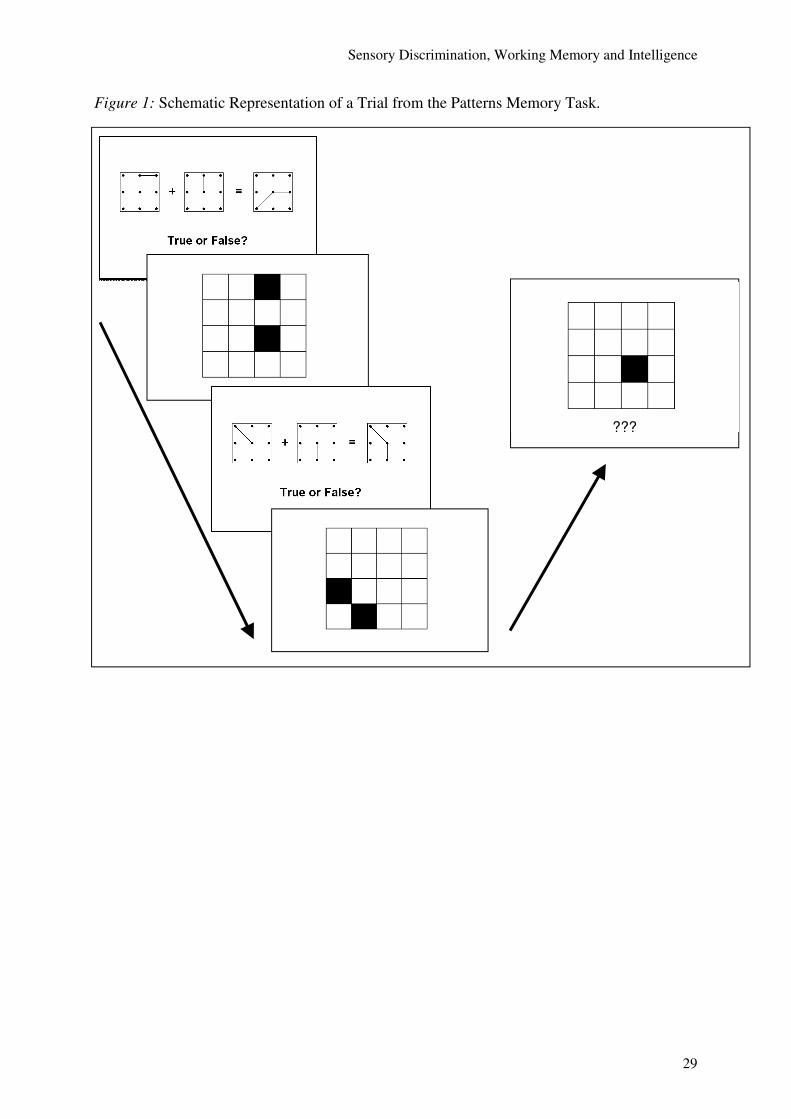
Patterns Memory (PM): This task is an adapted version of the computerized patterns
memory task devised by Ang and Lee (2010). It consists of a processing and a storage sub-
task. For the processing part of the task, children were asked to verify a matrix equation made
up of dots connected by lines. For the storage component, children had to remember the
locations of two blackened squares in a 4x4 grid (see Figure 1). They were told to remember
the grid and squares as a pattern. Each sequence consisted of matrix-equation-grid pairs in
which a matrix-equation was presented followed by a grid with blackened squares. The
children had 8s to verify the matrix equation (i.e. true or false) using external response
buttons. The grid with two blackened squares was shown for 3s immediately after the children
responded. After the last matrix-equation-grid pair of a sequence was shown, a screen with
the recall cue (i.e. one of the patterns of the sequence, but with only one blackened square)
appeared. The children then had to point to the location of the missing square on screen.
Answers were recorded by the researcher. There was no time limit to respond. Each trial
consisted of 6 matrix-equation-grid pairs. The length of the first trials consisted of two matrix
equations with the corresponding grids. When 50% of the trials were answered incorrectly,
the task was ended. Otherwise, the length of the sequence was increased by one matrix-
equation grid pair. The total number of correctly answered trials (correctly recalled patterns)
was used as the dependent measure.
Sensory Discrimination, Working Memory and Intelligence
11
Sensory Discrimination Tasks
Sensory discrimination ability was assessed with three tasks, an auditory and a visual
duration and a pitch discrimination task. To quantify the individual discrimination
performance, an adaptive psychophysical procedure, the weighted up-down method
(Kaernbach, 1991), was applied. ‘Adaptive’ means that the differences in stimulus magnitude
between the constant standard stimulus and the variable comparison stimulus are varied from
trial to trial depending on the participant’s previous response. A correct response results in a
decrease of the difference between the standard and the comparison stimulus, making the task
more difficult; whereas an incorrect response results in an increase of the difference between
the standard and the comparison stimulus, making the task easier. A detailed description of
this procedure is given by Rammsayer and Brandler (2007). As an indicator of discrimination
performance, the difference limen (DL), which is represented by half the interquartile range of
the difference threshold [(75% threshold value – 25% threshold value)/2] was determined for
each discrimination task as suggested by Luce and Galanter (1963). It is important to note,
that with the DL as a measure of sensory sensitivity, the better the performance, the smaller
the DL value.
All tasks consisted of 64 trials, and each trail consisted of one standard and one
comparison stimulus. The answers were logged by trained research assistants. After each
response, visual feedback (a green ‘+’ for correct responses or a red ‘-’ for incorrect
responses) was displayed. The instructions emphasized accuracy not speed.
Duration Discrimination Tasks: For the visual duration discrimination (vDD) task, stimuli
were filled visual intervals generated by a red light emitting diode positioned at eye level of
the participant. The intensity of the LED is clearly above threshold, but not dazzling. For the
auditory duration discrimination (aDD) task, stimuli are white-noise bursts presented
binaurally through headphones (Razor Orca) at an average intensity of 67dB. The stimuli in
both tasks were a constant 100-ms standard interval and variable comparison intervals. The
Sensory Discrimination, Working Memory and Intelligence
12
duration of the comparison interval varied according to the weighted up-down method. On
each trial participants had to decide which of the two intervals was longer.
Pitch Discrimination (pD): In this task, the stimuli consisted of 500-ms sine waves that
were presented through headphones (see above). The pitch of the constant standard tone was
440 Hz and the duration of the comparison interval varied according to the weighted up-down
method. On each trial participants had to decide which of the two tones was of higher pitch.
Assessment of Fluid Intelligence
To measure fluid intelligence, the short version of the CFT 20-R (Weiss, 2006; reliability:
.92) was used. The CFT 20-R is an adapted and revised version of Cattell’s Culture Fair
Intelligence Test. It consists of four subtests: series completion, classification (odd elements),
matrix completion and topological reasoning (dot task). It is a timed paper-pencil test and can
be administered either in a group setting or in an individual setting. The dependent measure
used for this task was the aggregated score of the total number of correctly answered items in
each of the four subtests.
Procedure
Children were tested three times over the course of 3 days to two weeks during school
hours. In one of these sessions the CFT 20-R was administered in a small group setting (five
to ten children). Testing of both sensory discrimination and working memory was split into
two sessions due to the length of time it took to administer all the tasks. The order of tasks
was randomized across and in between sessions, with working memory tasks and sensory
discrimination tasks appearing in each of these two sessions.
Sensory Discrimination, Working Memory and Intelligence
13
Results
Preliminary Analyses
The means and standard deviations for all the variables assessed in the study are presented
separately for the two age groups in Table 1. Significant differences between the two age
groups, with the 11-year-olds always performing better than the 9-year-olds, were found for
all of the variables except the LNS task (see Table 1). As a consequence and because we
aimed to explore age-dependent patterns of interrelations between the included variables, the
following correlation and regression analyses were conducted separately for both age groups.
To assess whether the working memory tasks and the sensory discrimination tasks could
be compiled into composite scores, a principal component analysis with oblique rotation
(oblimin) was conducted across the two age groups [KMO = .71, Bartlett’s test of sphericity
χ² (15) = 102.35, p <.001]. It showed that the six tasks loaded onto two factors (each with an
Eigenvalue greater than 1), with the three sensory discrimination tasks loading onto one factor
and the three working memory tasks loading onto the second factor (see Table 2). Together
the two factors explained 54.9% of the total variance. Taking these results into account, z-
scores of the sensory discrimination variables (aDD, vDD, pD) were added to form a
composite score for GDA and z-scores of the working memory tasks (LR, LNS, PM) were
added to form a composite score for WM.
Relationship between GDA, WM and Intelligence
All Pearson’s correlations between the composite scores for WM and GDA and fluid
intelligence were significant in both age groups. Correlations between WM and fluid
intelligence were .51, p < .001, for the younger age group, and .38, p = .001, for the older age
group. Correlations between GDA and fluid intelligence were .28, p = .021, and .24, p = .048
for the younger and older age group, respectively. Correlations between WM and GDA were
.25, p = .036, for the younger age group, and .30, p = .011, for the older age group.
Sensory Discrimination, Working Memory and Intelligence
14
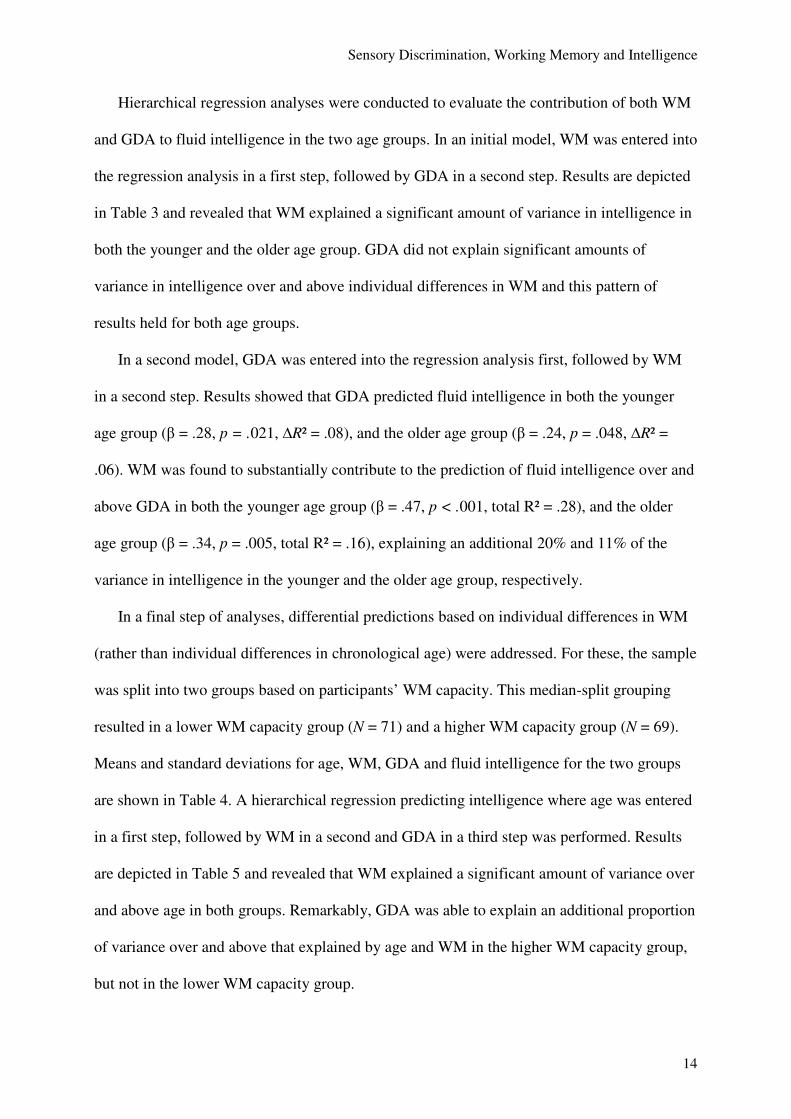
Hierarchical regression analyses were conducted to evaluate the contribution of both WM
and GDA to fluid intelligence in the two age groups. In an initial model, WM was entered into
the regression analysis in a first step, followed by GDA in a second step. Results are depicted
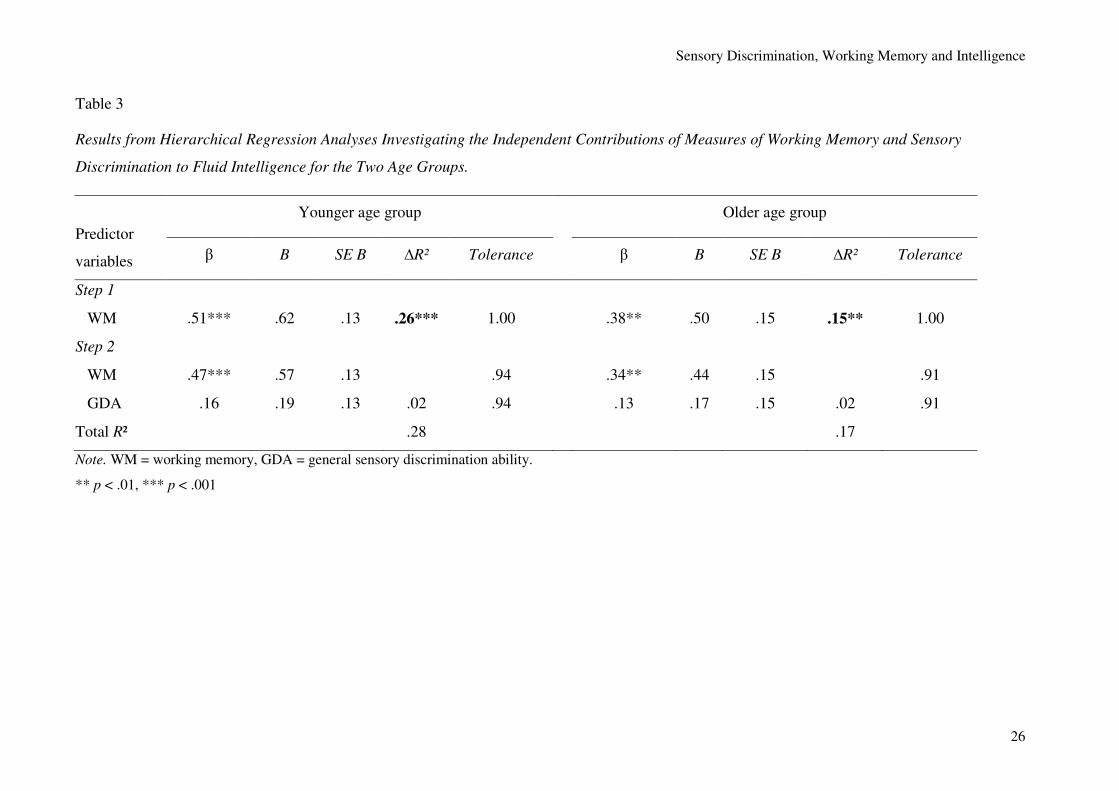
in Table 3 and revealed that WM explained a significant amount of variance in intelligence in
both the younger and the older age group. GDA did not explain significant amounts of
variance in intelligence over and above individual differences in WM and this pattern of
results held for both age groups.
In a second model, GDA was entered into the regression analysis first, followed by WM
in a second step. Results showed that GDA predicted fluid intelligence in both the younger
age group (β = .28, p = .021, ∆R² = .08), and the older age group (β = .24, p = .048, ∆R² =
.06). WM was found to substantially contribute to the prediction of fluid intelligence over and
above GDA in both the younger age group (β = .47, p < .001, total R² = .28), and the older
age group (β = .34, p = .005, total R² = .16), explaining an additional 20% and 11% of the
variance in intelligence in the younger and the older age group, respectively.
In a final step of analyses, differential predictions based on individual differences in WM
(rather than individual differences in chronological age) were addressed. For these, the sample
was split into two groups based on participants’ WM capacity. This median-split grouping
resulted in a lower WM capacity group (N = 71) and a higher WM capacity group (N = 69).
Means and standard deviations for age, WM, GDA and fluid intelligence for the two groups
are shown in Table 4. A hierarchical regression predicting intelligence where age was entered
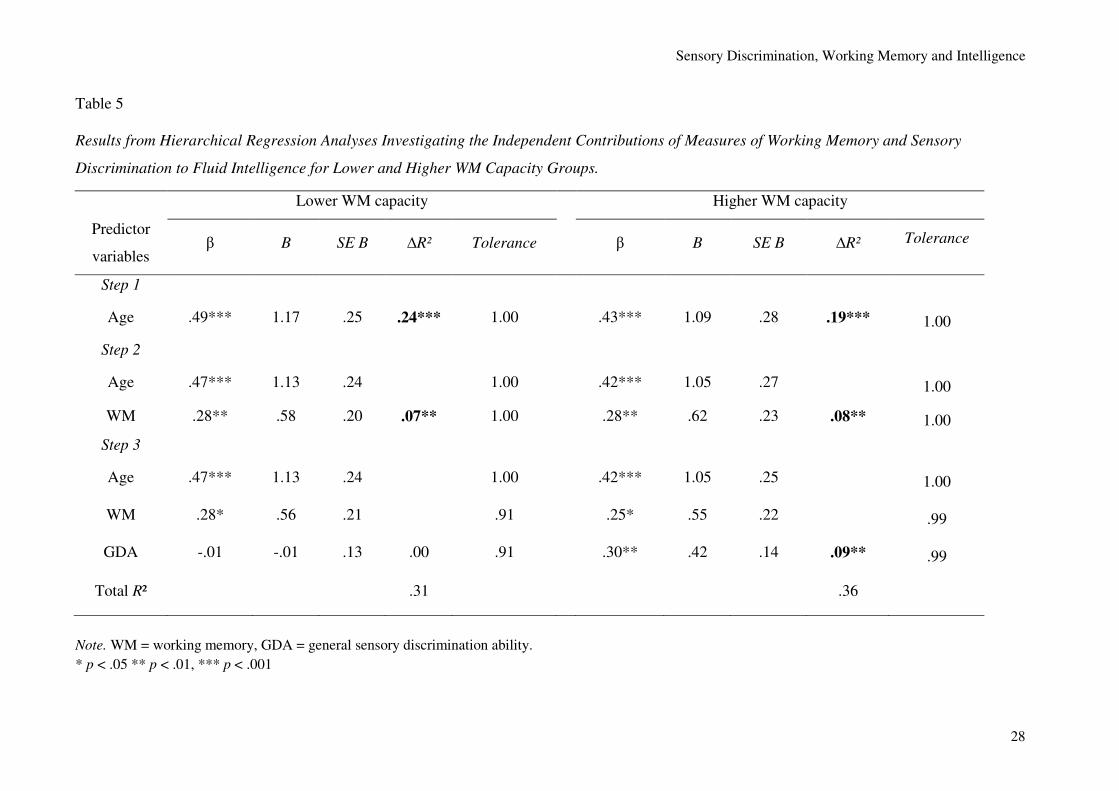
in a first step, followed by WM in a second and GDA in a third step was performed. Results
are depicted in Table 5 and revealed that WM explained a significant amount of variance over
and above age in both groups. Remarkably, GDA was able to explain an additional proportion
of variance over and above that explained by age and WM in the higher WM capacity group,
but not in the lower WM capacity group.
Sensory Discrimination, Working Memory and Intelligence
15
Discussion
The main aim of the present study was to examine whether previously found links
between GDA and intelligence could be explained in terms of WM, as correctly responding to
GDA tasks may also rely on working memory resources. Specifically, we assumed that tasks
measuring GDA make use of a person’s WM and as WM has been shown to be strongly
related to intelligence (e.g., Conway et al., 2002; Engel de Abreu et al., 2010; Swanson,
2011); this could explain the strong relationship between GDA and intelligence. Another
major aim of the present study was to address the question of differential predictive power of
GDA for individual differences in intelligence. That is, by including two age groups that
differed in terms of their level of performance in WM and GDA both within and across age
groups, age- and WM-capacity dependent analysis could be performed. The findings indicated
that WM was a better predictor of fluid intelligence in both age groups and both WM capacity
groups (high and low) compared to GDA. Furthermore, GDA did not predict fluid intelligence
over and above WM in neither age group nor in the lower WM capacity group. GDA did,
however, predict fluid intelligence over and above WM in the higher WM capacity group.
These results suggest that GDA is related to fluid intelligence, but that its influence on the
prediction of intelligence becomes only statistically reliable once WM capacity is above a
certain level.
As to developmental progression in the tasks included, the analyses performed revealed
that performance on the fluid intelligence test increased substantially with age. The older
children also performed significantly better than the younger children in two out of the three
WM tasks, namely letter-number-sequencing and patterns memory. Moreover, as predicted,
sensory discrimination ability improved significantly between the younger and the older age
group in all three tasks. As the absolute difference in chronological age between these two age
groups was not very large (2 years), the documentation of reliable performance differences in
Sensory Discrimination, Working Memory and Intelligence
16
the included tasks speaks for their reliability and sensitivity, an important prerequisite for the
performed correlation and regression analyses.
With respect to the associations between GDA, WM, and intelligence, analyses revealed
that WM as well as GDA were significantly correlated with fluid intelligence. This pattern of
interrelations held in both age groups. This finding corresponds to previously reported results
from studies with adults and children (e.g., Ackerman et al., 2005; Deary et al., 2004; Engel
de Abreu et al., 2010; Meyer et al., 2010). However, while previous studies found high to
very high correlations between GDA and intelligence (Deary et al., 2004; Meyer et al., 2010;
Spearman, 1904), the present analyses revealed only moderate correlations between the two
constructs in both age groups. Correlations further showed that WM and GDA were
moderately inter-related in both age groups. Together, these results suggest that there is a
significant amount of overlap between GDA, WM and fluid intelligence, that is, individuals
who score high on intelligence tend to also score high on tasks of WM and GDA.
In order to assess the unique contribution of WM and GDA to fluid intelligence in the two
age groups, regression analyses were performed. The results revealed that GDA and WM
explained significant amounts of variance in fluid intelligence on their own. When the other
predictor was taken into account however, only WM was able to explain significant amounts
of variance in intelligence over and above GDA. In contrast, the contribution of GDA to the
prediction of fluid intelligence over and above WM was negligible in both 9-year-olds and
11-year-olds. These results suggest that there is a significant and unique contribution of WM
to fluid intelligence in children. It is possible, that the tasks used to measure GDA rely heavily
on WM, therefore increasing the relative importance of WM. Sensory discrimination tasks in
general require the participant to choose between two stimuli that are presented one after the
other. To be able to solve the task, the participant has to be able to keep the first stimuli active
while seeing or hearing the next stimuli, which is exactly what is required in WM tasks.
Sensory Discrimination, Working Memory and Intelligence
17
Results from studies assessing brain regions that are activated during sensory
discrimination tasks reinforce this interpretation that both sensory abilities and WM abilities
are used to solve sensory discrimination tasks (Livesey, Wall, & Smith, 2007; Nenadic et al.,
2003). These studies show that some brain regions are only activated during specific tasks
(e.g., the right putamen in duration discrimination tasks; Nenadic et al., 2003). Other regions,
such as the right dorsolateral prefrontal cortex (DLPFC), which has previously been linked to
WM (e.g., MacDonald, Cohen, Stenger, & Carter, 2000), are activated in various sensory
discrimination tasks including duration, color and pitch discrimination (Livesey et al., 2007;
Nenadic et al., 2003). Together, the results of these studies indicate that when solving sensory
discrimination tasks, participants draw upon both sensory discrimination abilities as well as
WM abilities.
In light of these results and the fact that WM is usually conceptualized as consisting of
different components, some of which are responsible for processing of information and some
others being responsible for storing information (e.g., see Baddeley, 2007; Cowan, 1999;
Cowan & Alloway, 2009; Engle, Kane et al., 1999), it would be interesting to see whether
sensory discrimination tasks involve both storage and processing or whether only one of the
two components is used when these tasks are solved. On the task level, sensory discrimination
ability (e.g., comparing the pitch of two tones) seem to correspond closer to simple span tasks
used to assess storage aspects of WM (STM) than complex span tasks used to assess both
storage and processing (see e.g., Engel de Abreu et al., 2010). It is plausible that solving
sensory discrimination tasks only employs storage but not processing aspects of WM.
However, to be able to assess whether this is in fact the case, both aspects of WM would have
to be assessed separately in the same study, for example, by including both simple and
complex span tasks.
It is also possible that individuals try and rely more on WM when task difficulty increases.
In other words, when task difficulty is increased and participants become uncertain as to
Sensory Discrimination, Working Memory and Intelligence
18
which answer is the correct one (e.g., which tone is higher), they may rely more on WM to
compare the two stimuli and to make a decision. If this was the case, individuals with better
WM would succeed at solving the task more often than individuals with lower WM, again
boosting the relative importance of WM. This interpretation was supported by the third
regression analysis in the present study where the unique contribution of WM and GDA to
fluid intelligence was assessed in lower and higher WM capacity groups, respectively.
Children of both age groups were divided into a higher and a lower WM ability group
according to their performance on the WM tasks. The results indicated that WM explained a
significant amount of variance in fluid intelligence in both the lower and the higher WM
capacity group. GDA, however, did not explain any significant variance in fluid intelligence
over and above WM in the lower WM capacity group but was able to explain significant
amounts of variance over and above WM in the higher WM capacity group. This differential
pattern of prediction suggests that when WM capacity is low, GDA cannot predict fluid
intelligence over and above WM. GDA can, however, predict fluid intelligence over and
above WM when WM capacity is at a sufficiently high level. This interpretation can again be
supported with results from studies looking at brain activation during task execution. Several
studies have found that increased task difficulty (e.g., in auditory perception tasks;
Lewandowska, Piatkowska-Janko, Bogorodzki, Wolak, & Szelag, 2010), resulted in greater
activation of areas that have typically been related to WM processes, including the DLPFC
(Lewandowska et al., 2010; Paus, Koski, Caramanos, & Westbury, 1998; Tregallas, Davalos,
& Rojas, 2006).
The present study provides new evidence of the importance of WM in regards to the GDA
– intelligence relationship in children. One limitation of the study is that WM was assessed
using only complex span tasks. This meant that the relationship between the constructs could
only be assessed in terms of WM as a whole, but not in terms of the subcomponents of WM
(i.e., storage and processing). In a further study, WM should be assessed using both complex
Sensory Discrimination, Working Memory and Intelligence
19
span tasks as well as tasks assessing only STM or storage aspects, to be able to make this
differentiation. Additionally, it would also be interesting to see whether the present results
also apply to other measures of intelligence (e.g., crystallized intelligence) or whether they are
specific to the relationship between GDA and fluid intelligence. Furthermore, the differences
in WM between the two age groups were not pronounced, and it was thus unlikely that the
prediction patterns would vary substantially between the two age groups. Further studies
using more age groups that target age- and WM-dependent predictions of intelligence using
GDA are needed to help elucidate whether the present interpretations can be further
supported.
Conclusion
The present study shows that there is substantial overlap between WM, GDA and fluid
intelligence. The results indicate that GDA is indeed related to intelligence in children, but its
influence on the prediction of fluid intelligence is dependent on WM capacity. WM seems to
act as a bottleneck of information processing that limits the influence of GDA on the
prediction of intelligence. The predictive power of GDA therefore, does not seem to stem
from developmental progression, but rather appears to be due to individual differences in
WM. Together, our results suggest that WM, despite not being able to fully explain the
relationship between GDA and intelligence, certainly has a strong influence on it in children
aged 9 and 11 years old.
Sensory Discrimination, Working Memory and Intelligence
20
References
Ackerman, P. L., Beier, M. E., & Boyle, M. O. (2005). Working memory and intelligence:
The same or different constructs? Psychological Bulletin, 131(1), 30-60. doi:
10.1037/0033-2909.131.1.30
Ang, S. Y., & Lee, K. (2010). Exploring developmental differences in visual short-term
memory and working memory. Developmental Psychology, 46(1), 279-285. doi:
10.1037/a0017554
Archibald, L. M. D., & Gathercole, S. E. (2006). Short-term and working memory in specific
language impairment. International Journal of Language & Communication
Disorders, 41(6), 675-693. doi: 10.1080/13682820500442602
Baddeley, A. D. (1986). Working memory (Psychology Series: No. 11). Oxford: Clarendon
Press.
Baddeley, A. D. (2000). The episodic buffer: A new component of working memory? Trends
in Cognitive Sciences, 4, 417-423. doi: 10.1016/S1364-6613%2800%2901538-2
Baddeley, A. D. (2007). Working memory, thought, and action. Oxford: Oxford University
Press.
Belacchi, C., Carretti, B., & Cornoldi, C. (2010). The role of working memory and updating
in Coloured Raven Matrices performance in typically developing children. European
Journal of Cognitive Psychology, 22(7), 1010-1020. doi:
10.1080/09541440903184617
Best, J. R., & Miller, P. H. (2010). A developmental perspective on executive function. Child
Development, 81(6), 1641-1660. doi: 10.1111/j.1467-8624.2010.01499.x
Cattell, R. B., & Cattell, A. K. S. (1973). Handbook for the Culture Fair Intelligence Test
scale 2 forms A and B. Champaign, IL: Institute of Personality and Ability Testing.
Conway, A. R. A., Cowan, N., Bunting, M. F., Therriault, D. J., & Minkoff, S. R. B. (2002).
A latent variable analysis of working memory capacity, short-term memory capacity,
processing speed, and general fluid intelligence. Intelligence, 30(2), 163-183. doi:
10.1016/S0160-2896(01)00096-4
Cowan, N. (1999). An embedded-processes model of working memory. In A. Miyake & P.
Shah (Eds.), Models of working memory: Mechanisms of active maintenance and
executive control (pp. 62-101). Cambridge: Cambridge University Press.
Cowan, N., & Alloway, T. (2009). Development of working memory in childhood. In M. L.
Courage & N. Cowan (Eds.), The development of memory in infancy and childhood
(pp. 303-342). Hove, East Sussex, UK: Psychology Press.
Daniel, M. H. (1982). A factorial study of reasoning tests. (Technical Report 1982-6). Boston:
Johnson O’Connor Research Foundaton.
Sensory Discrimination, Working Memory and Intelligence
21
Deary, I. J. (1994). Sensory discrimination and intelligence: Postmortem or resurrection? The
American Journal of Psychology, 107(1), 95-115. doi: 10.2307/1423292
Deary, I. J. (2012). Intelligence. Annual Review of Psychology, 63, 453-482. doi:
10.1146/annurev-psych-120710-100353
Deary, I. J., Bell, P. J., Bell, A. J., Campbell, M. L., & Fazal, N. D. (2004). Sensory
discrimination and intelligence: Testing Spearman's other hypothesis. The American
Journal of Psychology, 117(1), 1-19. doi: 10.2307/1423593
Engel de Abreu, P. M. J., Conway, A. R. A., & Gathercole, S. E. (2010). Working memory
and fluid intelligence in young children. Intelligence, 38(6), 552-561. doi:
10.1016/j.intell.2010.07.003
Engle, R. W., Kane, M. J., & Tuholski, S. W. (1999). Individual differences in working
memory capacity and what they tell us about controlled attention, general fluid
intelligence, and functions of the prefrontal cortex. In A. Miyake & P. Shah (Eds.),
Models of working memory: Mechanisms of active maintenance and executive control
(pp. 102-134). Cambridge: Cambridge University Press.
Engle, R. W., Tuholski, S. W., Laughlin, J. E., & Conway, A. R. A. (1999). Working
memory, short-term memory, and general fluid intelligence: A latent-variable
approach. Journal of Experimental Psychology: General, 128(3), 309-331. doi:
10.1037/0096-3445.128.3.309
Ferrer, E., O'Hare, E. D., & Bunge, S. A. (2009). Fluid reasoning and the developing brain.
Frontiers in Neuroscience, 3(1), 46-51. doi: 10.3389/neuro.01.003.2009
Galton, F. (1883). Inquiries into human faculty and its development. London: Macmillan.
Grob, A., Meyer, C. S., & Hagmann-von Arx, P. (2009). Intelligence and Development Scales
(IDS). Intelligenz- und Entwicklungsskalen für Kinder von 5-10 Jahren. Bern, CH:
Huber.
Henry, L. (2012). The development of working memory in children. London: Sage.
Hunt, E. (2011). Human intelligence. Cambridge: Cambridge University Press.
Jäger, A. O., Süß, H.-G., & Beauducel, A. (1997). Berliner Intelligenzstruktur test form 4.
Göttingen, D: Hogrefe.
Kaernbach, C. (1991). Simple adaptive testing with the weighted up-down method.
Perception & Psychophysics, 49(3), 227-229. doi: 10.3758/BF03214307
Kyllonen, P. C., & Christal, R. E. (1990). Reasoning ability is (little more than) working
memory capacity?! Intelligence, 14, 389-433. doi: 10.1016/S0160-2896(05)80012-1
Lewandowska, M., Piatkowska-Janko, E., Bogorodzki, P., Wolak, T., & Szelag, E. (2010).
Changes in fMRI BOLD response to increasing and decreasing task difficulty during
auditory perception of temporal order. Neurobiology of Learning and Memory, 94(3),
382-391. doi: 10.1016/j.nlm.2010.08.005
Sensory Discrimination, Working Memory and Intelligence
22
Livesey, A. C., Wall, M. B., & Smith, A. T. (2007). Time percpetion: Manipulation of task
difficulty dissociates clock functions from other cognitive demands.
Neuropsychologia, 45, 321-331. doi: 10.1016/j.neuropsychologia.2006.06.033
Luce, R. D., & Galanter, E. (Eds.). (1963). Discrimination (Vol. 1). New York: Wiley.
MacDonald, A. W., Cohen, J. D., Stenger, V. A., & Carter, C. S. (2000). Dissociating the role
of the dorsolateral prefrontal and anterior cingulate cortex in cognitive control.
Science, 288, 1835-1838. doi: 10.1126/science.288.5472.1835
Meyer, C. S., Hagmann-von Arx, P., Lemola, S., & Grob, A. (2010). Correspondence
between the general ability to discriminate sensory stimuli and general intelligence.
Journal of Individual Differences, 31(1), 46-56. doi: 10.1027/1614-0001/a000006
Nenadic, I., Gaser, C., Volz, H.-P., Rammsayer, T., Häger, F., & Sauer, H. (2003). Processing
of temporal information and the basal ganglia: new evidence from fMRI.
Experimental Brain Research, 2003, 238-246. doi: 10.1007/s00221-002-1188-4
Oberauer, K., Schulze, R., Wilhelm, O., & Süß, H.-M. (2005). Working memory and
intelligence - their correlation and their relation: Comment on Ackerman, Beier, and
Boyle (2005). Psychological Bulletin, 131(1), 61-65. doi: 10.1037/0033-
2909.131.1.61
Paus, T., Koski, L., Caramanos, Z., & Westbury, C. (1998). Regional differences in the
effects of task difficulty and motor ourput on blood flow response in the human
anterior cingulate cortex: a review of 107 PET activation studies. NeuroReport, 9(9),
R37-R47. doi: 10.1097/00001756-199806220-00001
Petermann, F., & Petermann, U. (2008). Hamburg-Wechsler-Intelligenztest für Kinder IV
(HAWIK-IV). Bern, CH: Huber.
Pickering, S. J., & Gathercole, S. E. (2001). Working memory test battery for children
(WMTB-C). London: Psychological Corporation.
Rammsayer, T. H., & Brandler, S. (2007). Performance on temporal information processing
as an index of general intelligence. Intelligence, 35(2), 123-139. doi:
10.1016/j.intell.2006.04.007
Raven, J. C., Raven, J., & Court, J. H. (1982). Mill Hill Vocabulary Test. London: Lewis.
Röthlisberger, M., Neuenschwander, R., Michel, E., & Roebers, C. M. (2010). Exekutive
Funktionen: Zugrundeliegende kognitive Prozesse und deren Korrelate bei Kindern im
späten Vorschulalter. Zeitschrift für Entwicklungspsychologie und Pädagogische
Psychologie, 42(2), 99-110. doi: 10.1026/0049-8637/a000010
Spearman, C. (1904). "General intelligence", objectively determined and measured. American
Journal of Psychology, 15(2), 201-293. doi: 10.2307/1412107
Sensory Discrimination, Working Memory and Intelligence
23
Swanson, H. L. (2011). Intellectual growth in children as a function of domain specific and
domain general working memory subgroups. Intelligence, 39(6), 481-492. doi:
10.1016/j.intell.2011.10.001
Tillman, C. M., Bohlin, G., Sørensen, L., & Lundervold, A. J. (2009). Intelligence and
specific cognitive abilities in children Journal of Individual Differences, 30(4), 209-
219. doi: 10.1027/1614-0001.30.4.209
Tregallas, J. R., Davalos, D. B., & Rojas, D. C. (2006). Effect of task difficulty on the
functional anatomy of temporal processing. NeuroImage, 32, 307-315. doi:
10.1016/j.neuroimage.2006.02.036
Troche, S. J., & Rammsayer, T. H. (2009). Temporal and non-temporal sensory
discrimination and their predictions of capacity- and speed-related aspects of
psychometric intelligence. Personality and Individual Differences, 47(1), 52-57. doi:
10.1016/j.paid.2009.02.001
Wechsler, D. (1981). Manual of the Wechsler Adult Intelligence Scale – Revised. New York:
Psychological Cooperation.
Weiss, R. H. (2006). CFT 20-R. Grundintelligenztest Skala 2. Göttingen, D: Hogrefe Verlag.
Willis, J. O., Dumont, R., & Kaufman, A. S. (2011). Factor-analytical models of intelligence.
In R. J. Sternberg & S. B. Kaufman (Eds.), The Cambridge handbook of intelligence
(pp. 39-57). Cambridge: Cambridge University Press.
Sensory Discrimination, Working Memory and Intelligence
24
Table 1
Mean and Standard Deviations for all Variables assessed by Age Group
Note. Age group 1 = younger age group; age group 2 = older age group. CFT 20-R = Culture Fair
Intelligence Test; aDD = auditory duration discrimination task; pD = pitch discrimination task; vDD=
visual duration discrimination task; LR = listening recall; LNS = letter-number-sequencing; PM =
patterns memory.
Variable Age
group Range M (SD) t(138) p
Age (in years)
1 8.56– 9.70 9.16 (.29)
-40.772 .000
2 10.62 – 12.00 11.34 (.34)
CFT 20-R
1 12 – 38 27.49 (6.03)
-5.814 .000
2 18 – 48 33.57 (6.34)
aDD
1 8.70 – 62.30 25.35 (13.06)
4.662 .000
2 7.15 – 45.10 17.12 (6.87)
pD
1 32.00 – 132.48 75.74 (22.93)
2.142 .034
2 15.90 – 130.05 67.00 (25.29)
vDD
1 18.75 – 96.88 45.13 (15.05)
2.912 .004
2 13.00 – 82.50 37.76 (14.90)
LR
1 6 – 20 14.53 (2.80)
-1.492 .138
2 7 – 24 15.29 (3.19)
LNS
1 3 – 21 16.13 (3.00)
-3.313 .001
2 10 – 23 17.67 (2.48)
PM
1 1 – 12 5.54 (3.20)
-2.468 .015
2 1 – 17 6.96 (3.57)
Sensory Discrimination, Working Memory and Intelligence
25
Table 2
Factor Loadings for Principal Component Analysis of
Working Memory and Sensory Discrimination Tasks
Note. Factor loadings > .40 are in boldface. aDD = auditory
duration discrimination; pD = pitch discrimination; vDD =
visual duration discrimination; LR = listening recall; LNS =
letter-number sequencing; PM = patterns memory
Tasks
Rotated factor loadings
Sensory
discrimination
Working
memory
aDD .820 -.129
pD .611 .240
vDD .731 -.008
LR .020 .798
LNS .272 .640
PM -.123 .658
Sensory Discrimination, Working Memory and Intelligence
26
Table 3
Results from Hierarchical Regression Analyses Investigating the Independent Contributions of Measures of Working Memory and Sensory
Discrimination to Fluid Intelligence for the Two Age Groups.
Note. WM = working memory, GDA = general sensory discrimination ability.
** p < .01, *** p < .001
Predictor
variables
Younger age group Older age group
β B SE B ∆R² Tolerance β B SE B ∆R² Tolerance
Step 1
WM .51*** .62 .13 .26*** 1.00 .38** .50 .15 .15** 1.00
Step 2
WM .47*** .57 .13 .94 .34** .44 .15 .91
GDA .16 .19 .13 .02 .94 .13 .17 .15 .02 .91
Total R² .28 .17
Sensory Discrimination, Working Memory and Intelligence
27
Table 4
Mean and Standard Deviations for Age, WM, GDA and Fluid Intelligence
for the High WM Capacity and Low WM Capacity Group
Variable
Lower WM capacity Higher WM capacity
M SD M SD
Age 10.40 1.17 10.09 1.09
WM -1.55 1.40 1.74 1.24
GDA -.33 2.23 .45 1.93
Intelligence 28.7 6.80 32.41 6.50
Note. WM = working memory, GDA = general sensory discrimination ability.
Sensory Discrimination, Working Memory and Intelligence
28
Table 5
Results from Hierarchical Regression Analyses Investigating the Independent Contributions of Measures of Working Memory and Sensory
Discrimination to Fluid Intelligence for Lower and Higher WM Capacity Groups.
Note. WM = working memory, GDA = general sensory discrimination ability.
* p < .05 ** p < .01, *** p < .001
Lower WM capacity Higher WM capacity
Predictor
variables β B SE B ∆R² Tolerance β B SE B ∆R² Tolerance
Step 1
Age .49*** 1.17 .25 .24*** 1.00 .43*** 1.09 .28 .19*** 1.00
Step 2
Age .47*** 1.13 .24 1.00 .42*** 1.05 .27 1.00
WM .28** .58 .20 .07** 1.00 .28** .62 .23 .08** 1.00
Step 3
Age .47*** 1.13 .24 1.00 .42*** 1.05 .25 1.00
WM .28* .56 .21 .91 .25* .55 .22 .99
GDA -.01 -.01 .13 .00 .91 .30** .42 .14 .09** .99
Total R² .31 .36
Sensory Discrimination, Working Memory and Intelligence
29
Figure 1: Schematic Representation of a Trial from the Patterns Memory Task.
???