Embed Size (px)
Citation preview
Seo
ul N
at
io
na
l U
niv
er
sit
y
Ch
em
ic
al Pr
oc
ess M
od
elin
g &
Sim
ulatio
n
Process Modeling Using Aspen Plus(User Interface & Basic Inputs)
TA : Ikhyun KimInstructor : En Sup Yoon
Spring Semester, 2012
Seoul National University
Chemical Process Modeling & Simulation (2/39)
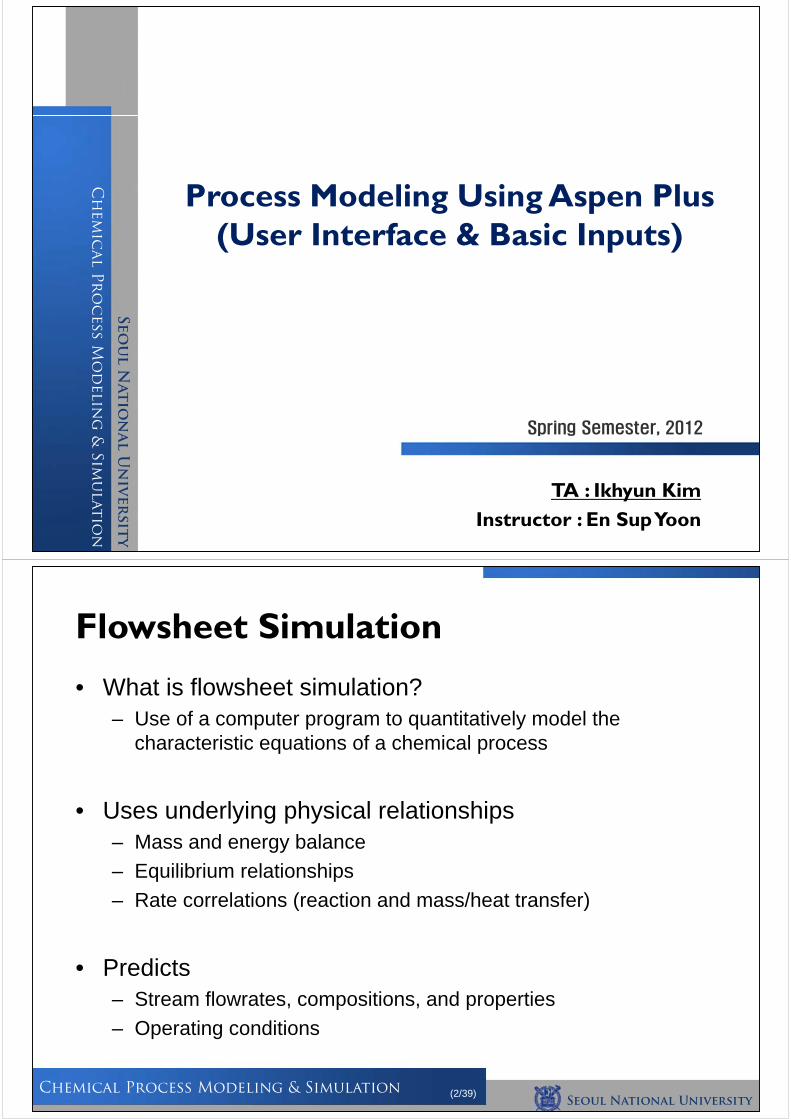
• What is flowsheet simulation?– Use of a computer program to quantitatively model the
characteristic equations of a chemical process
• Uses underlying physical relationships– Mass and energy balance
– Equilibrium relationships
– Rate correlations (reaction and mass/heat transfer)
• Predicts– Stream flowrates, compositions, and properties
– Operating conditions
Flowsheet Simulation
Seoul National University
Chemical Process Modeling & Simulation (3/39)
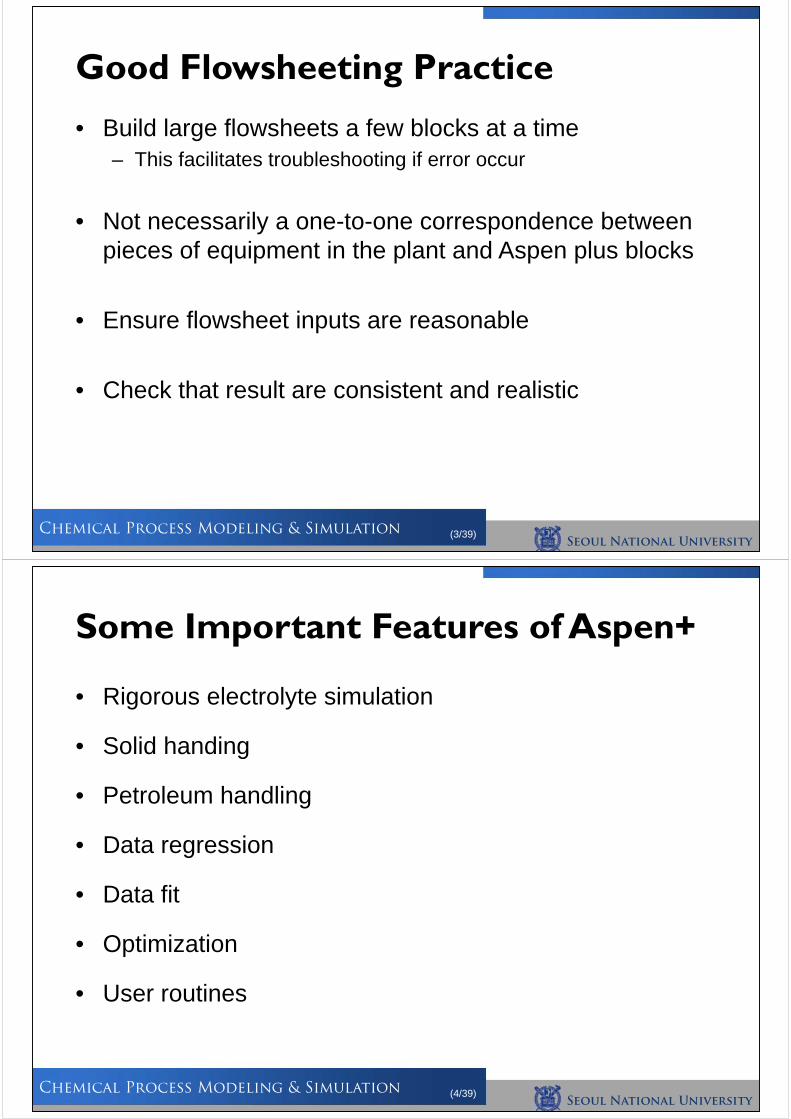
• Build large flowsheets a few blocks at a time– This facilitates troubleshooting if error occur
• Not necessarily a one-to-one correspondence between pieces of equipment in the plant and Aspen plus blocks
• Ensure flowsheet inputs are reasonable
• Check that result are consistent and realistic
Good Flowsheeting Practice
Seoul National University
Chemical Process Modeling & Simulation (4/39)
• Rigorous electrolyte simulation
• Solid handing
• Petroleum handling
• Data regression
• Data fit
• Optimization
• User routines
Some Important Features of Aspen+
Seoul National University
Chemical Process Modeling & Simulation (5/39)
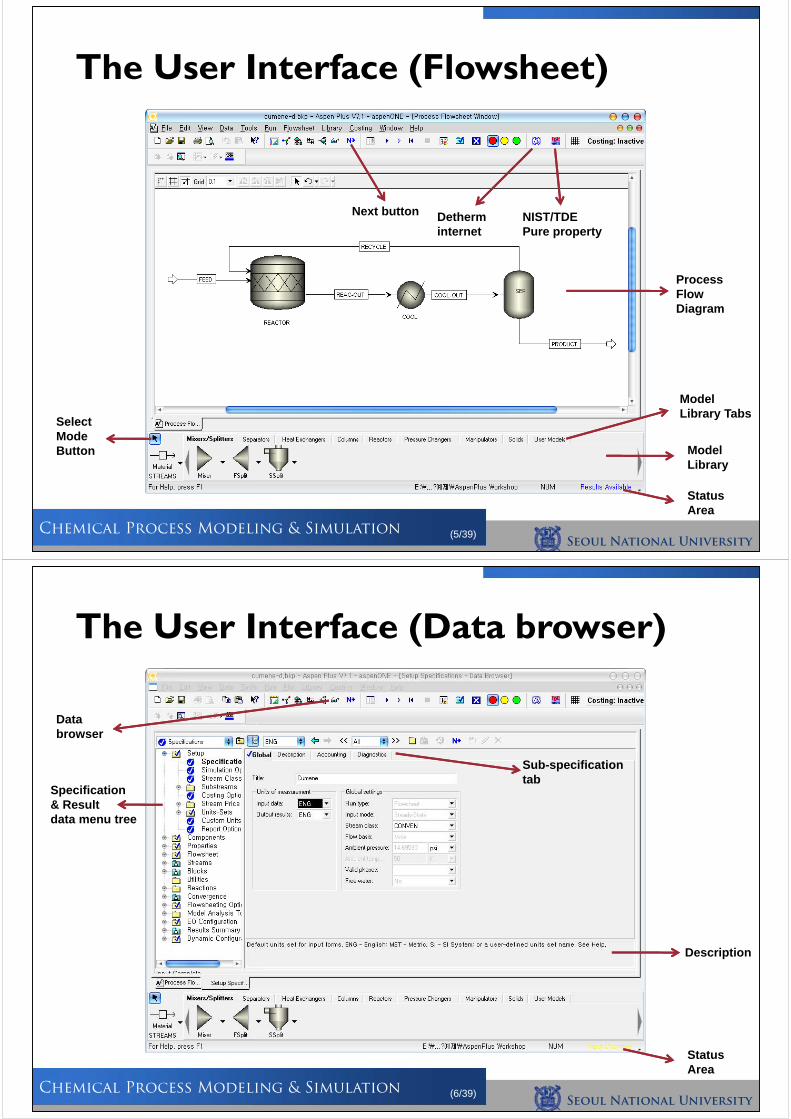
The User Interface (Flowsheet)
Next button Detherminternet
NIST/TDEPure property
ProcessFlow Diagram
SelectModeButton
ModelLibrary Tabs
ModelLibrary
StatusArea
Seoul National University
Chemical Process Modeling & Simulation (6/39)
The User Interface (Data browser)
Data browser
Specification& Resultdata menu tree
Sub-specificationtab
StatusArea
Description
Seoul National University
Chemical Process Modeling & Simulation (7/39)
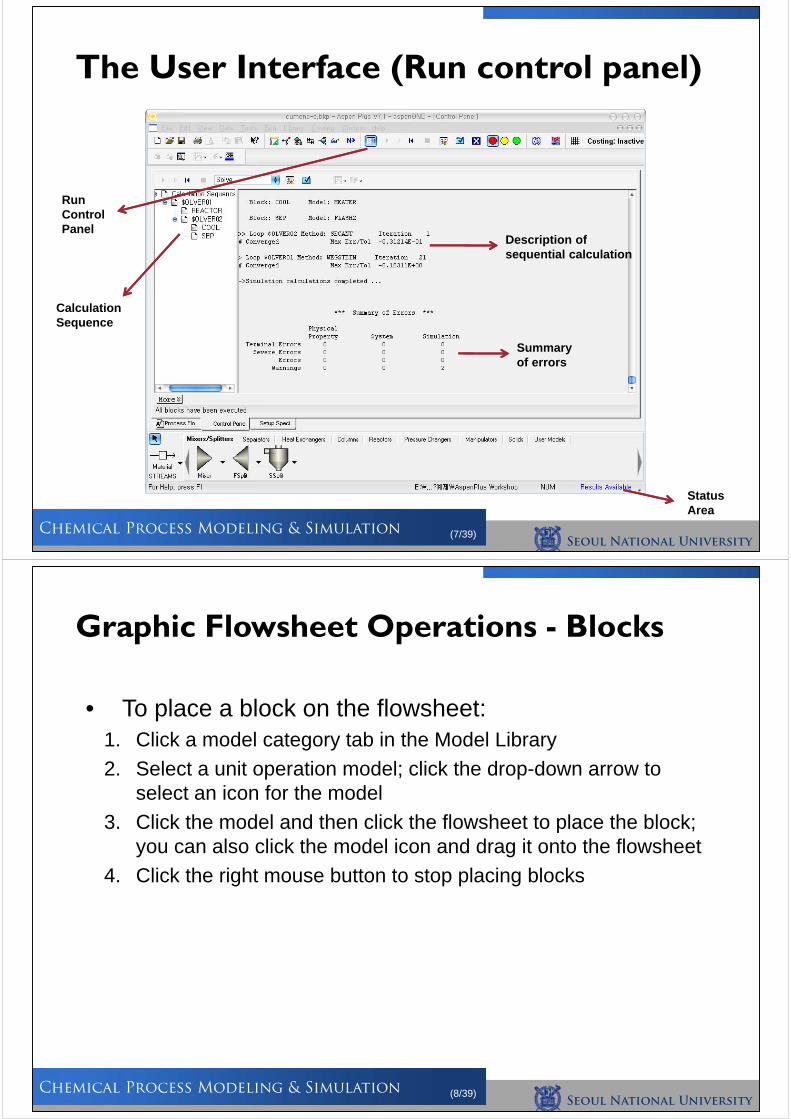
The User Interface (Run control panel)
RunControlPanel
Summary of errors
Calculation Sequence
Description of sequential calculation
StatusArea
Seoul National University
Chemical Process Modeling & Simulation (8/39)
Graphic Flowsheet Operations - Blocks
• To place a block on the flowsheet:1. Click a model category tab in the Model Library
2. Select a unit operation model; click the drop-down arrow to select an icon for the model
3. Click the model and then click the flowsheet to place the block; you can also click the model icon and drag it onto the flowsheet
4. Click the right mouse button to stop placing blocks
Seoul National University
Chemical Process Modeling & Simulation (9/39)
Graphic Flowsheet Operations - Streams
• To place a stream on the flowsheet:1. Click the STREAMS icon in the Model Library
2. If you want to select a different stream type (Material, Heat or Work), click the down arrow next to the icon and choose a different type
3. Click a highlighted port to make the connection
4. Repeat step 3 to connect the other end of the stream
5. To place one end of the stream as either a process flowsheet feed or product, click a blank part of the Process Flowsheet
6. Click the right mouse button to stop creating streams
Seoul National University
Chemical Process Modeling & Simulation (10/39)
Automatic Naming of Streams and Blocks
• Stream and block names can be assigned automatically by Aspen Plus or entered by the user when the object is created
• To modify the naming options: 1. Select Options from the Tools menu
2. Click the Flowsheet tab
3. Check or uncheck the naming options desired
• Stream and block names can be displayed or hidden1. Select object, right-click, and choose Hide from the menu
Seoul National University
Chemical Process Modeling & Simulation (11/39)
Modifying Blocks and Streams
• To display Input and Results forms in the Data Browser:
1. Double-click the object of interest, or
Select the block or stream, right-click, and select Input… from the menu
• To change the appearance of a block or stream:1. Select object by clicking it with the left mouse button
2. Click the right mouse button while the pointer is over the selected object icon to bring up the menu for that object
3. Choose appropriate menu item
Seoul National University
Chemical Process Modeling & Simulation (12/39)
Breaking and Splicing Streams
• To break a stream on the Process Flowsheet:1. Select the stream on the flowsheet and right mouse click
2. Select “Break Stream” for the stream menu
3. If results exist, you will be asked if you want to reconcile the stream
4. Enter the name of the new product stream created
• To splice two streams:1. Select the two streams to be spliced (using the Shift or Ctrl key)
2. Right mouse click on one of the streams, select “Splice Streams”
3. Combined stream will have the name of the former feed stream
Seoul National University
Chemical Process Modeling & Simulation (13/39)
Inserting Blocks
• To insert a block on the Process Flowsheet:1. Select the stream where you want to insert the block
2. Right-click and select “Insert Block”
3. If results exist, you will be asked if you want to reconcile the stream
4. Select the new block ID and type
5. The old stream is connected to the first inlet and outlet port for the new block
6. Additional streams may need to be added to complete flowsheet connectivity depending on the model
Seoul National University
Chemical Process Modeling & Simulation (14/39)
Using the Mouse Buttons
• Left-click Selects a block, stream, object ID, or annotation
• Right-click Brings up menu for the selected stream, block, or flowsheet
Cancels placement of streams or blocks on the flowsheet
• Double-left-click Opens the Data Browser to the stream or block Input form, or Results form for intermediate streams
Edits text
Seoul National University
Chemical Process Modeling & Simulation (15/39)
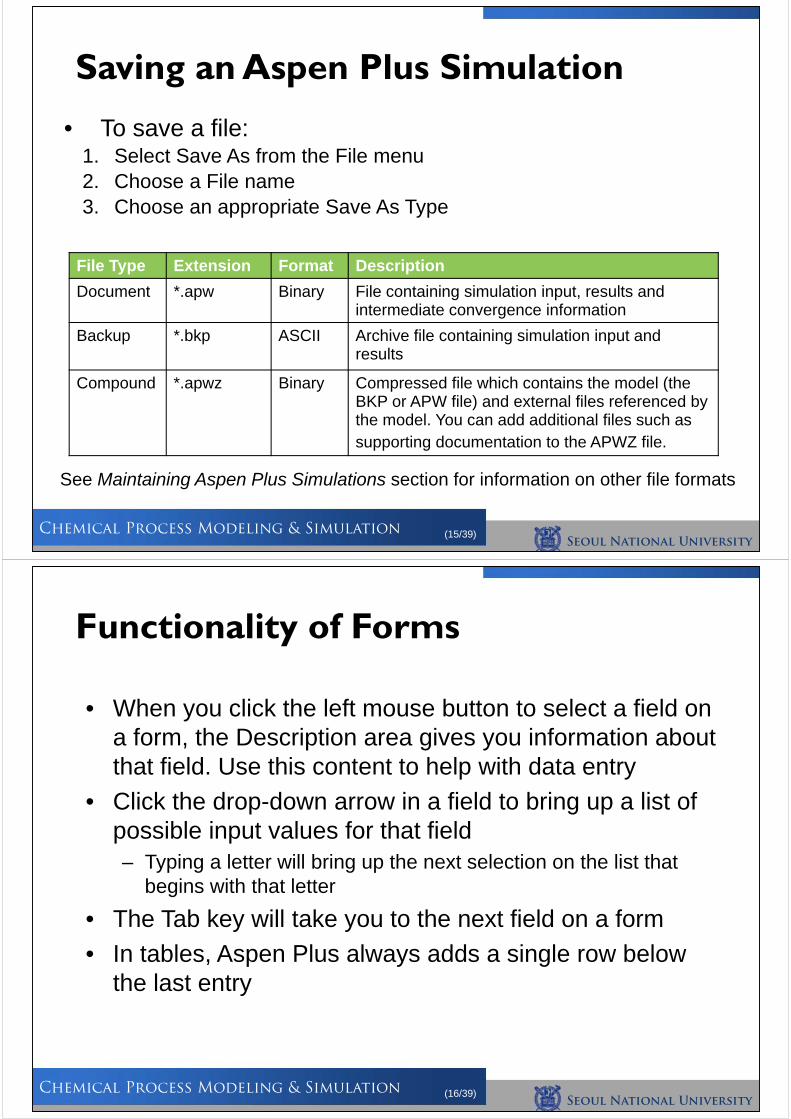
Saving an Aspen Plus Simulation
• To save a file:1. Select Save As from the File menu2. Choose a File name3. Choose an appropriate Save As Type
File Type Extension Format Description
Document *.apw Binary File containing simulation input, results and intermediate convergence information
Backup *.bkp ASCII Archive file containing simulation input and results
Compound *.apwz Binary Compressed file which contains the model (the BKP or APW file) and external files referenced by the model. You can add additional files such as supporting documentation to the APWZ file.
See Maintaining Aspen Plus Simulations section for information on other file formats
Seoul National University
Chemical Process Modeling & Simulation (16/39)
Functionality of Forms
• When you click the left mouse button to select a field on a form, the Description area gives you information about that field. Use this content to help with data entry
• Click the drop-down arrow in a field to bring up a list of possible input values for that field– Typing a letter will bring up the next selection on the list that
begins with that letter
• The Tab key will take you to the next field on a form
• In tables, Aspen Plus always adds a single row below the last entry
Seoul National University
Chemical Process Modeling & Simulation (17/39)
Help
• Help Topics– Select Help Topics from the Help menu to launch online help:
• Contents: Browse through the documentation, including User Guides and Reference Manuals
• Index: Search for help on a specific topic using the index entries• Search: Search for a help on a topic that includes any word or
words
• “What’s This?” Help– Click the “What’s This?” toolbar button and then click any area
to get help for that item
• F1 Help– With the cursor in the desired field, press the <F1> function key
to bring up help for field and/or sheet
Seoul National University
Chemical Process Modeling & Simulation (18/39)
• The minimum required inputs to run a simulation are:– Setup
– Components
– Properties
– Streams
– Blocks
• Enter data on the input forms in the above order by clicking the Next Button
• Or, these input folders can be located quickly using the Data menu or the Data Browser toolbar buttons
Basic Input
Seoul National University
Chemical Process Modeling & Simulation (19/39)
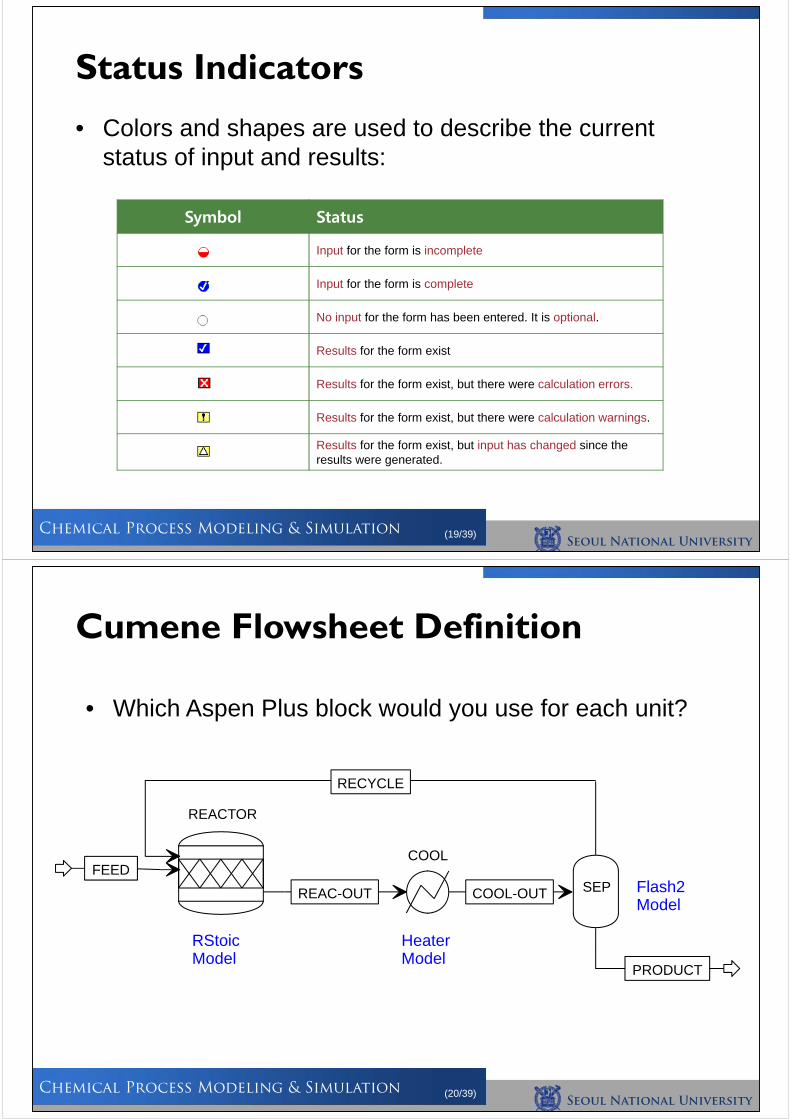
• Colors and shapes are used to describe the current status of input and results:
Status Indicators
Symbol Status
Input for the form is incomplete
Input for the form is complete
No input for the form has been entered. It is optional.
Results for the form exist
Results for the form exist, but there were calculation errors.
Results for the form exist, but there were calculation warnings.
Results for the form exist, but input has changed since the results were generated.
Seoul National University
Chemical Process Modeling & Simulation (20/39)
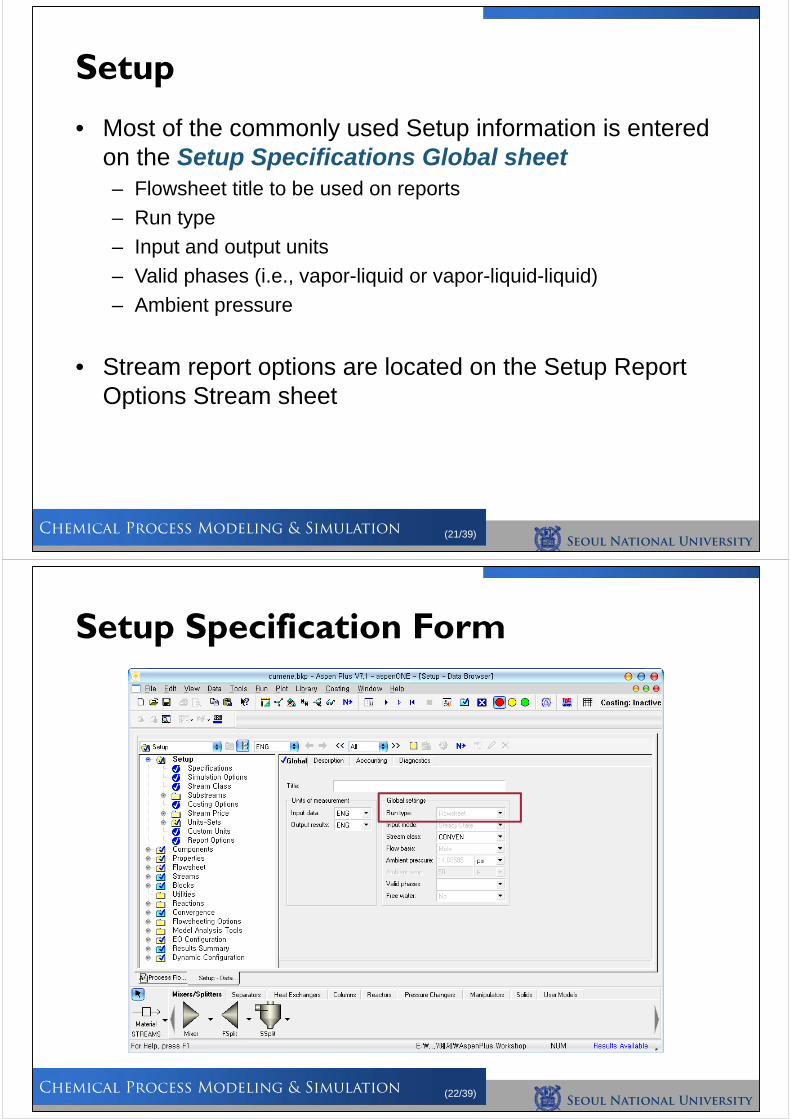
Cumene Flowsheet Definition
RStoicModel
HeaterModel
REACTOR
FEED
RECYCLE
REAC-OUT
COOL
COOL-OUT Flash2Model
SEP
PRODUCT
• Which Aspen Plus block would you use for each unit?
Seoul National University
Chemical Process Modeling & Simulation (21/39)
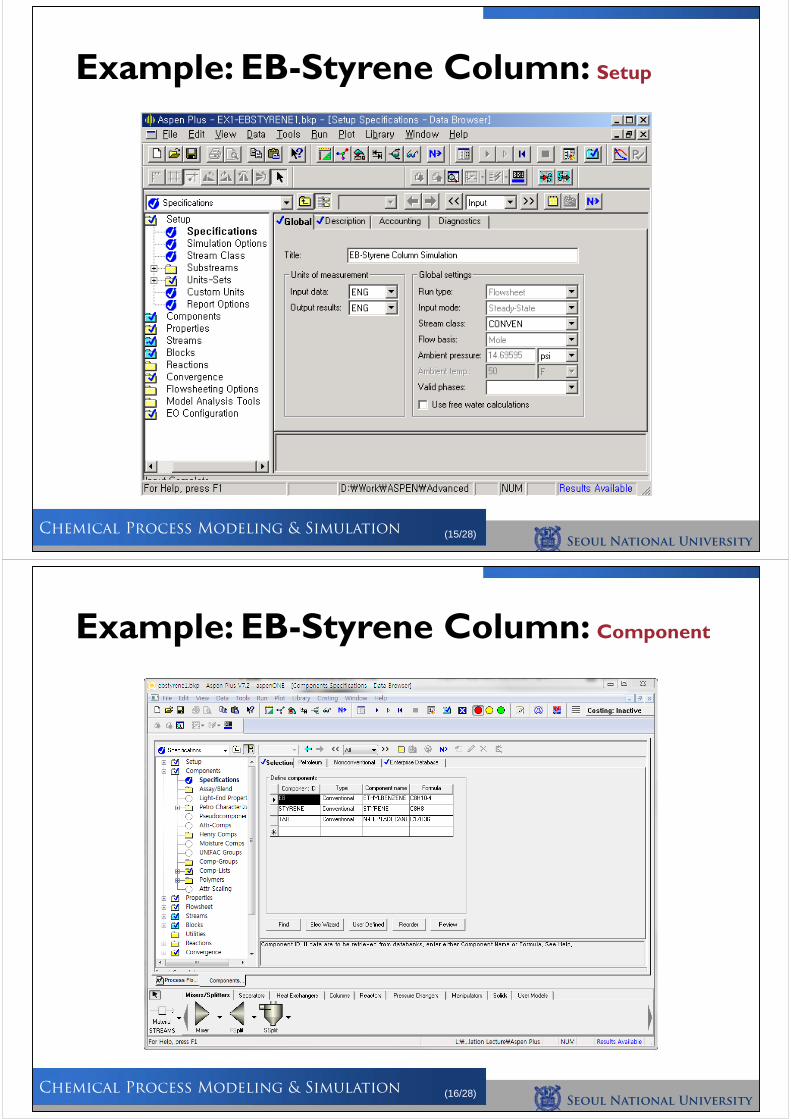
• Most of the commonly used Setup information is entered on the Setup Specifications Global sheet– Flowsheet title to be used on reports
– Run type
– Input and output units
– Valid phases (i.e., vapor-liquid or vapor-liquid-liquid)
– Ambient pressure
• Stream report options are located on the Setup Report Options Stream sheet
Setup
Seoul National University
Chemical Process Modeling & Simulation (22/39)
Setup Specification Form
Seoul National University
Chemical Process Modeling & Simulation (23/39)
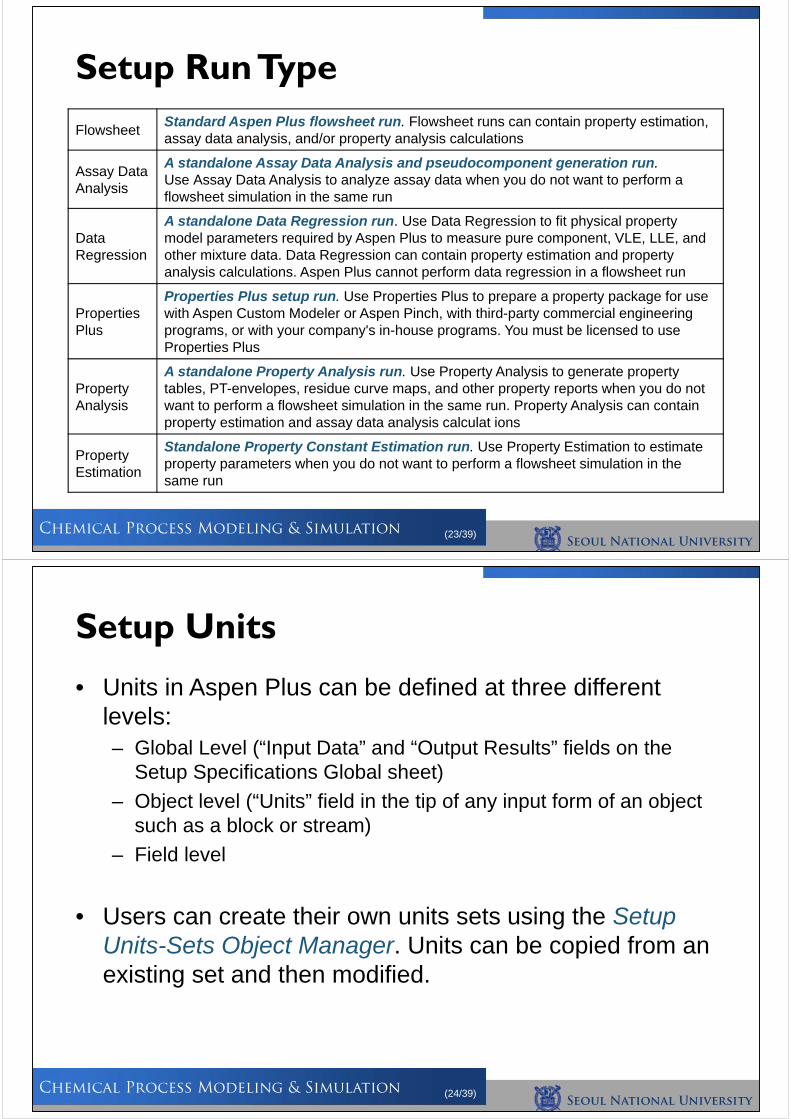
FlowsheetStandard Aspen Plus flowsheet run. Flowsheet runs can contain property estimation, assay data analysis, and/or property analysis calculations
Assay DataAnalysis
A standalone Assay Data Analysis and pseudocomponent generation run. Use Assay Data Analysis to analyze assay data when you do not want to perform a flowsheet simulation in the same run
Data Regression
A standalone Data Regression run. Use Data Regression to fit physical property model parameters required by Aspen Plus to measure pure component, VLE, LLE, and other mixture data. Data Regression can contain property estimation and property analysis calculations. Aspen Plus cannot perform data regression in a flowsheet run
PropertiesPlus
Properties Plus setup run. Use Properties Plus to prepare a property package for use with Aspen Custom Modeler or Aspen Pinch, with third-party commercial engineering programs, or with your company's in-house programs. You must be licensed to use Properties Plus
Property Analysis
A standalone Property Analysis run. Use Property Analysis to generate property tables, PT-envelopes, residue curve maps, and other property reports when you do not want to perform a flowsheet simulation in the same run. Property Analysis can contain property estimation and assay data analysis calculat ions
Property Estimation
Standalone Property Constant Estimation run. Use Property Estimation to estimate property parameters when you do not want to perform a flowsheet simulation in the same run
Setup Run Type
Seoul National University
Chemical Process Modeling & Simulation (24/39)
• Units in Aspen Plus can be defined at three different levels:– Global Level (“Input Data” and “Output Results” fields on the
Setup Specifications Global sheet)
– Object level (“Units” field in the tip of any input form of an object such as a block or stream)
– Field level
• Users can create their own units sets using the Setup Units-Sets Object Manager. Units can be copied from an existing set and then modified.
Setup Units
Seoul National University
Chemical Process Modeling & Simulation (25/39)
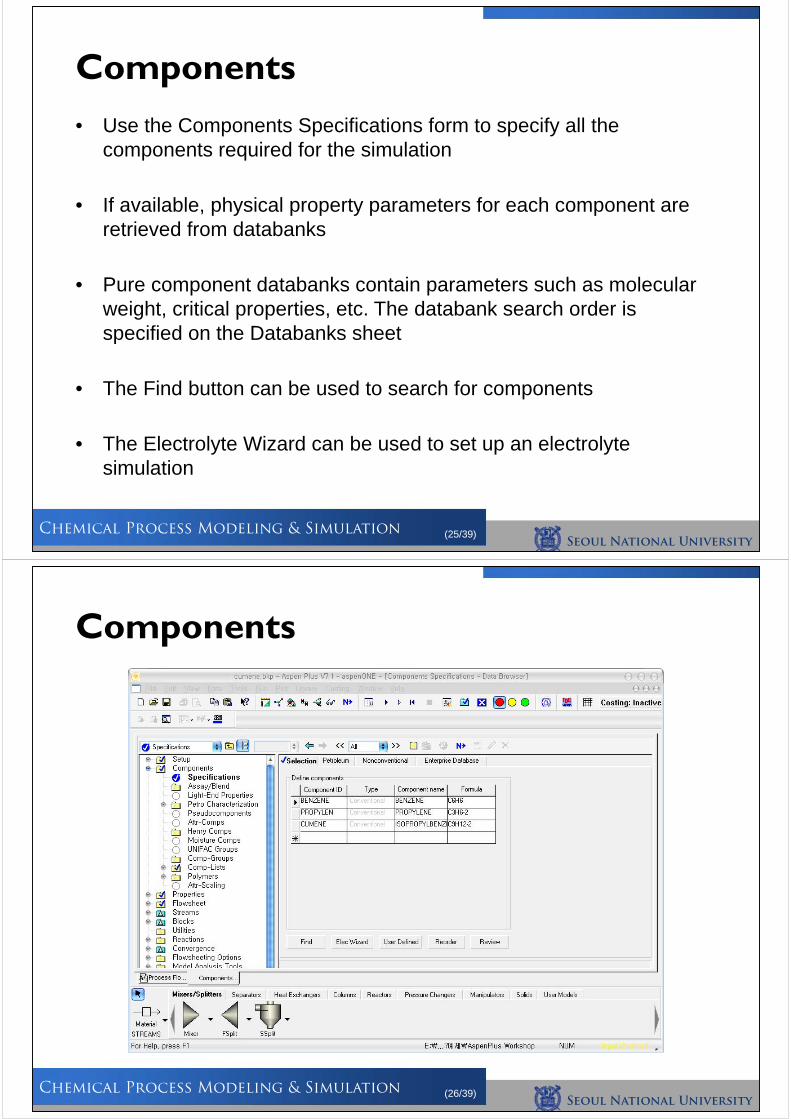
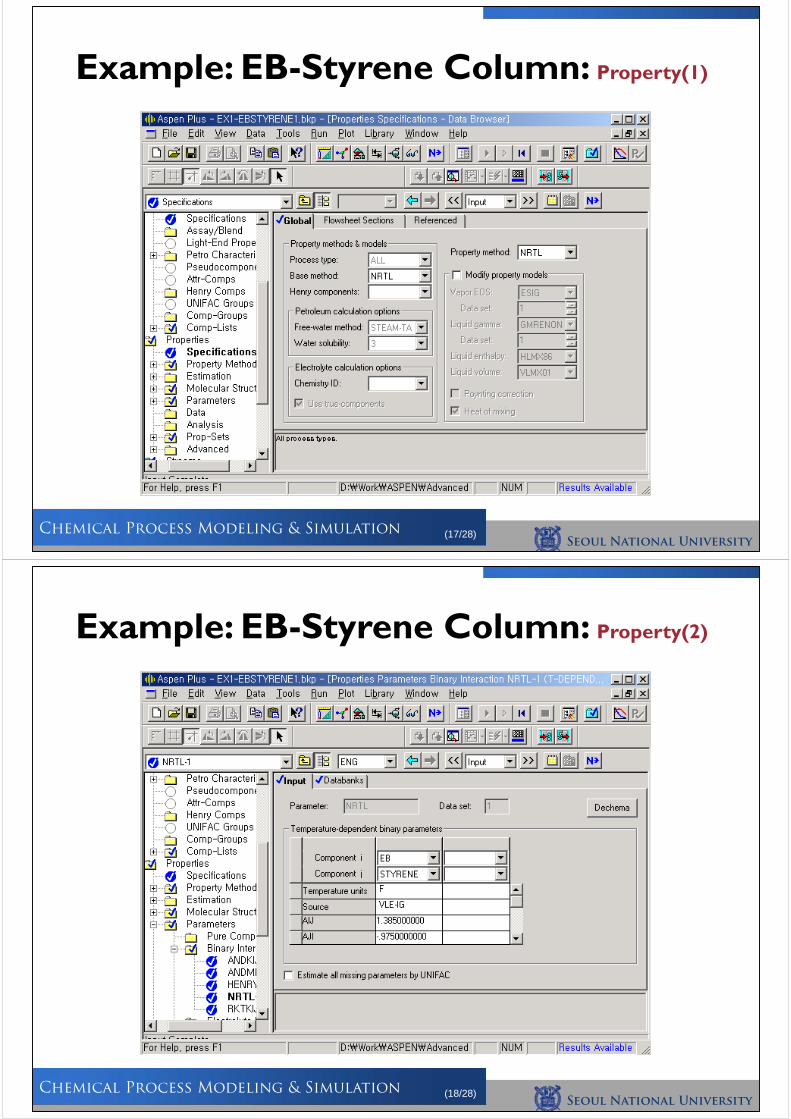
• Use the Components Specifications form to specify all the components required for the simulation
• If available, physical property parameters for each component are retrieved from databanks
• Pure component databanks contain parameters such as molecular weight, critical properties, etc. The databank search order is specified on the Databanks sheet
• The Find button can be used to search for components
• The Electrolyte Wizard can be used to set up an electrolyte simulation
Components
Seoul National University
Chemical Process Modeling & Simulation (26/39)
Components
Seoul National University
Chemical Process Modeling & Simulation (27/39)
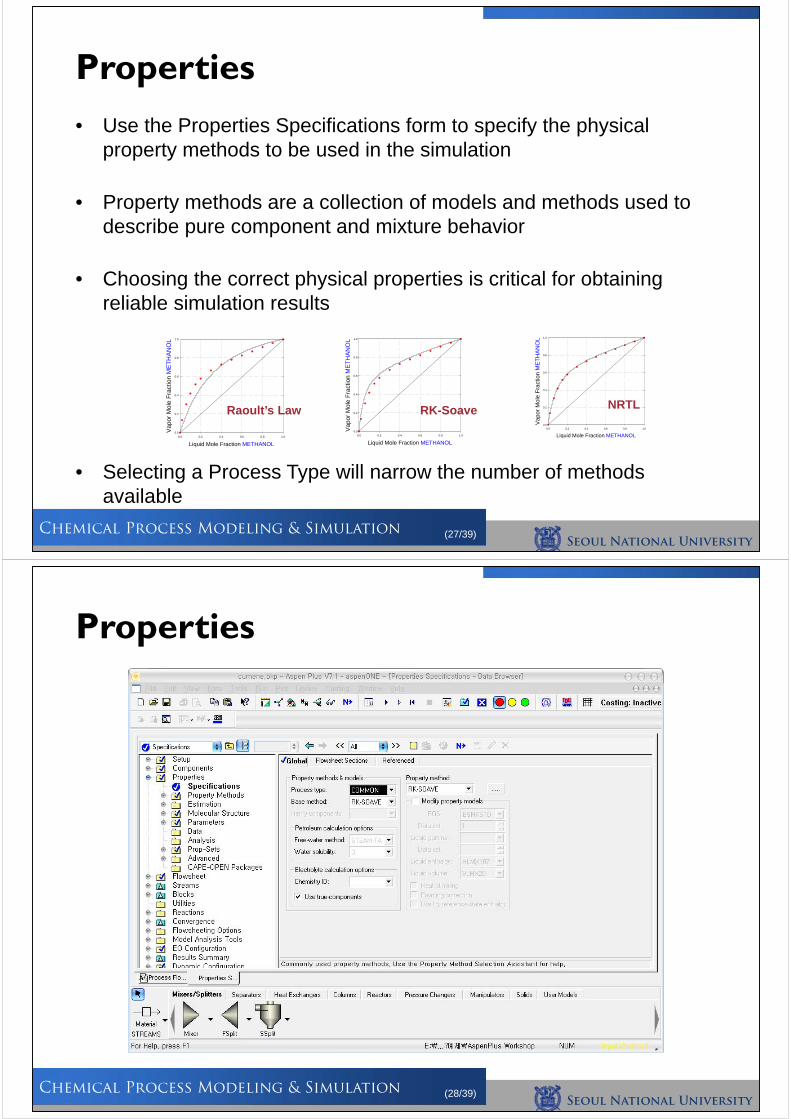
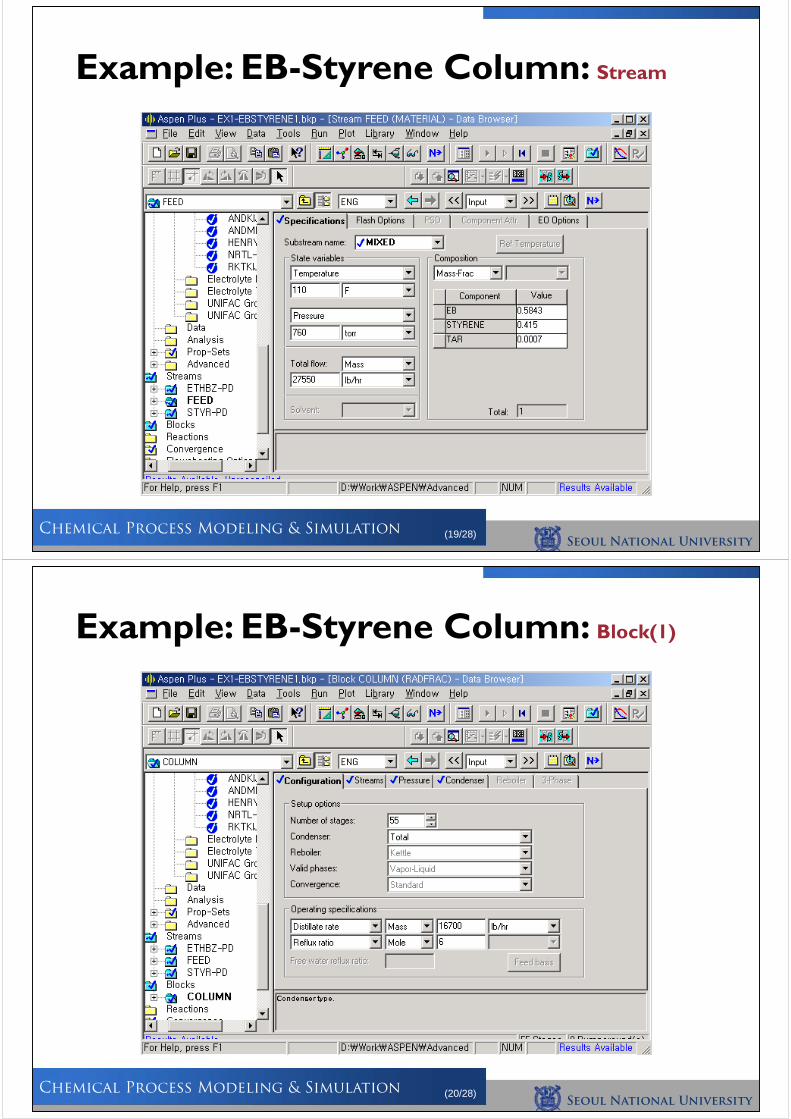
• Use the Properties Specifications form to specify the physical property methods to be used in the simulation
• Property methods are a collection of models and methods used to describe pure component and mixture behavior
• Choosing the correct physical properties is critical for obtaining reliable simulation results
• Selecting a Process Type will narrow the number of methods available
Properties
Liquid Mole Fraction METHANOL
0.0 0.2 0.4 0.6 0.8 1.0
Va
por
Mo
le F
ract
ion
ME
TH
AN
OL
0.0
0.2
0.4
0.6
0.8
1.0
Liquid Mole Fraction METHANOL
0.0 0.2 0.4 0.6 0.8 1.0
Vap
or M
ole
Fra
ctio
n M
ET
HA
NO
L
0.0
0.2
0.4
0.6
0.8
1.0
Liquid Mole Fraction METHANOL
0.0 0.2 0.4 0.6 0.8 1.0
Vap
or
Mol
e F
ract
ion
ME
TH
AN
OL
0.0
0.2
0.4
0.6
0.8
1.0
Raoult’s Law RK-Soave NRTL
Seoul National University
Chemical Process Modeling & Simulation (28/39)
Properties
Seoul National University
Chemical Process Modeling & Simulation (29/39)
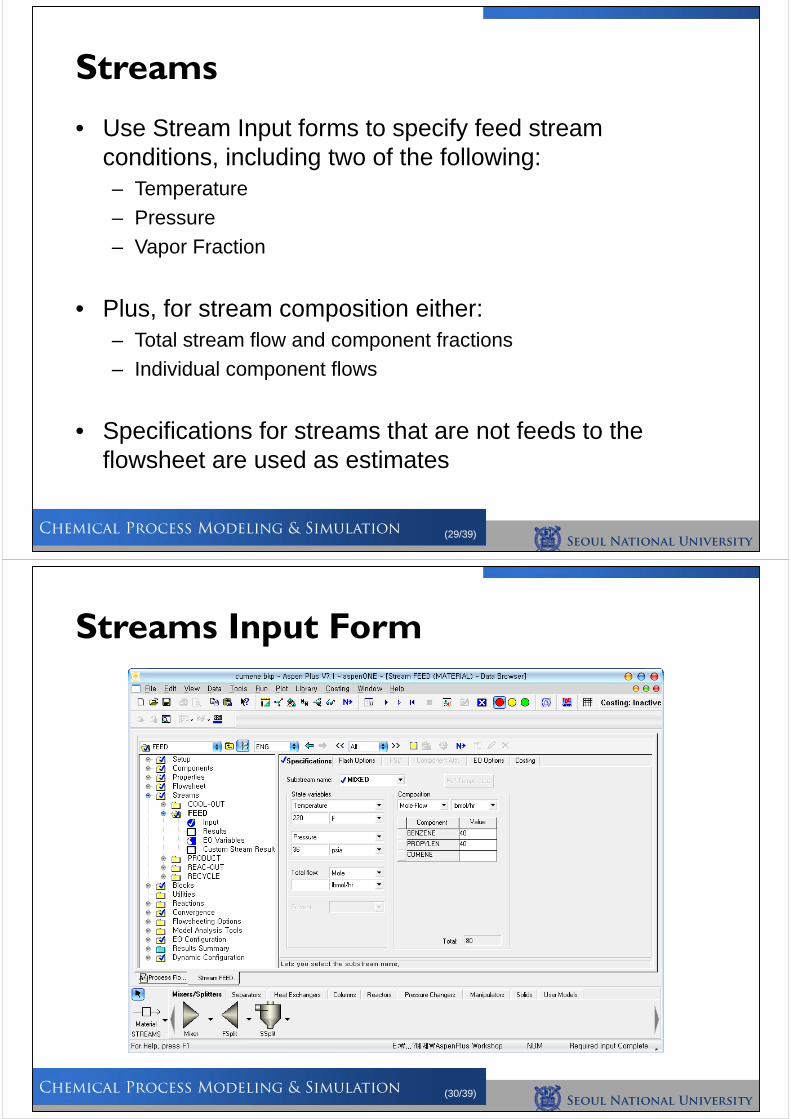
• Use Stream Input forms to specify feed stream conditions, including two of the following:– Temperature
– Pressure
– Vapor Fraction
• Plus, for stream composition either:– Total stream flow and component fractions
– Individual component flows
• Specifications for streams that are not feeds to the flowsheet are used as estimates
Streams
Seoul National University
Chemical Process Modeling & Simulation (30/39)
Streams Input Form
Seoul National University
Chemical Process Modeling & Simulation (31/39)
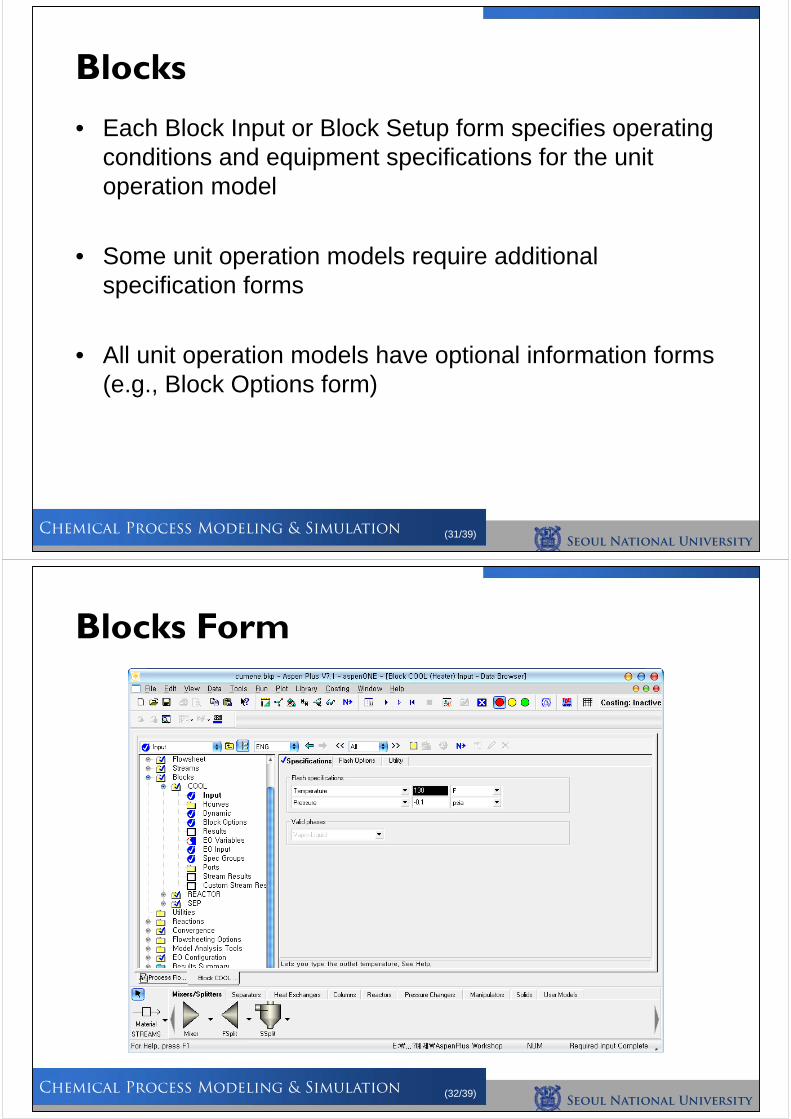
• Each Block Input or Block Setup form specifies operating conditions and equipment specifications for the unit operation model
• Some unit operation models require additional specification forms
• All unit operation models have optional information forms (e.g., Block Options form)
Blocks
Seoul National University
Chemical Process Modeling & Simulation (32/39)
Blocks Form
Seoul National University
Chemical Process Modeling & Simulation (33/39)
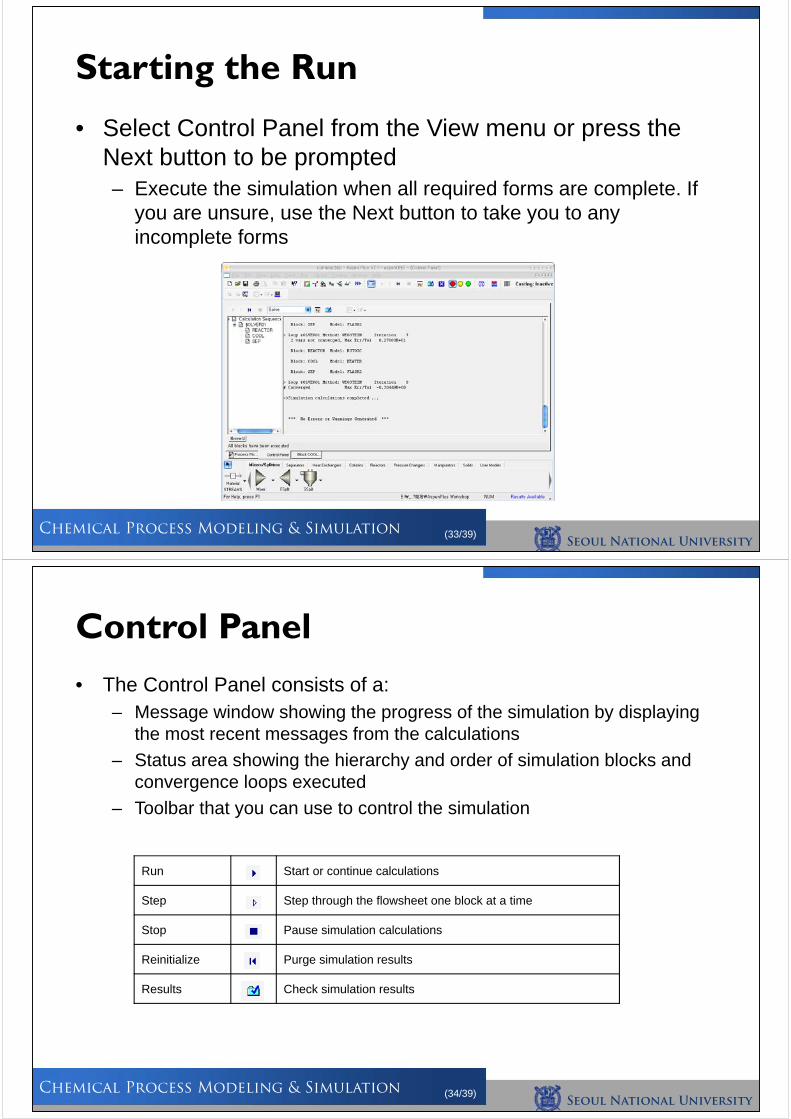
• Select Control Panel from the View menu or press the Next button to be prompted– Execute the simulation when all required forms are complete. If
you are unsure, use the Next button to take you to any incomplete forms
Starting the Run
Seoul National University
Chemical Process Modeling & Simulation (34/39)
• The Control Panel consists of a:– Message window showing the progress of the simulation by displaying
the most recent messages from the calculations
– Status area showing the hierarchy and order of simulation blocks and convergence loops executed
– Toolbar that you can use to control the simulation
Control Panel
Run Start or continue calculations
Step Step through the flowsheet one block at a time
Stop Pause simulation calculations
Reinitialize Purge simulation results
Results Check simulation results
Seoul National University
Chemical Process Modeling & Simulation (35/39)
• History file or Control Panel Messages– Contains any generated errors or warnings (Select History or Control
Panel on the View menu to display the History file or the Control Panel)
• Stream Results– Contains stream conditions and compositions (For all streams, click
Results Summary/Streams; for individual streams, click the stream name in the Streams folder, then select the Results form)
• Block Results– Contains calculated block operating conditions (In the Blocks folder,
click the block, then select the Result form)
Reviewing Results
Seoul National University
Chemical Process Modeling & Simulation (36/39)
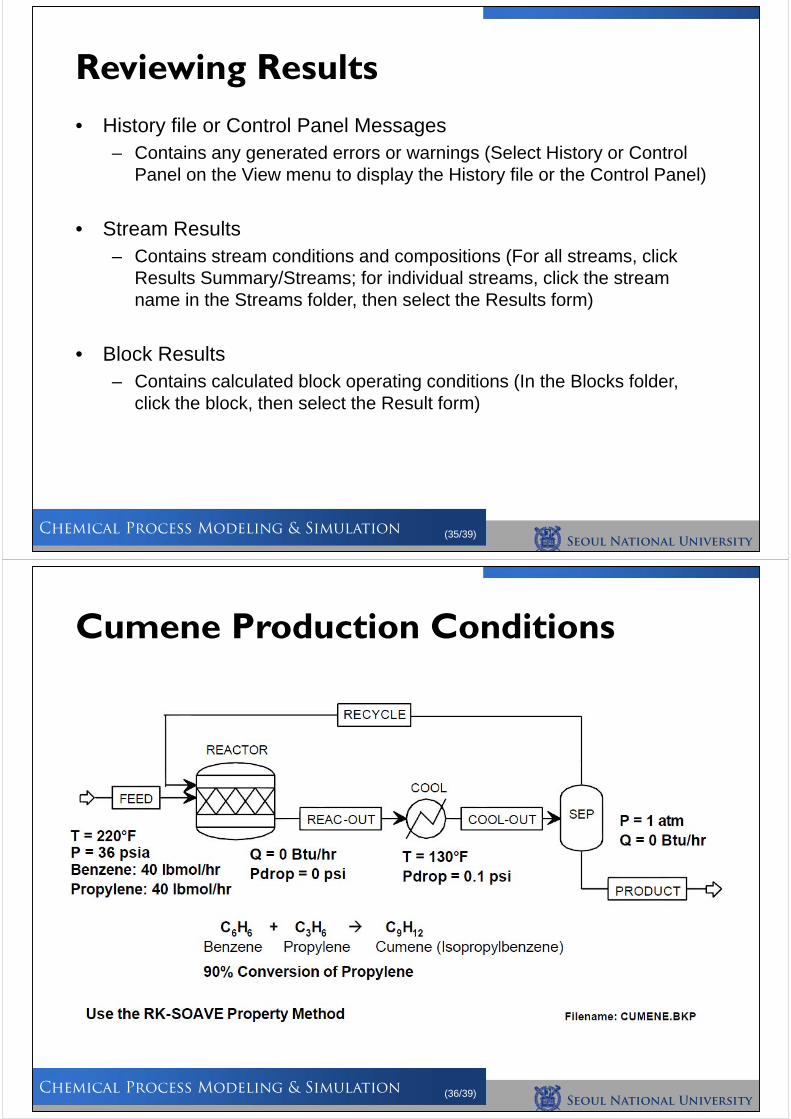
Cumene Production Conditions
Seoul National University
Chemical Process Modeling & Simulation (37/39)
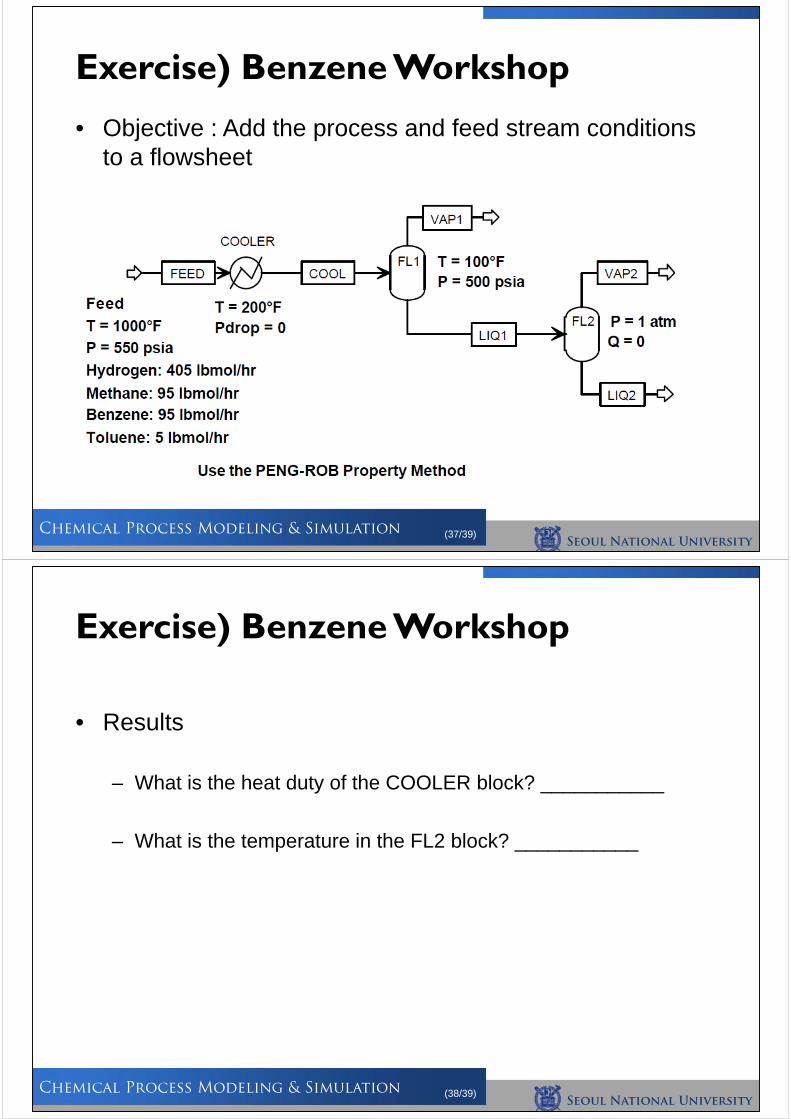
• Objective : Add the process and feed stream conditions to a flowsheet
Exercise) Benzene Workshop
Seoul National University
Chemical Process Modeling & Simulation (38/39)
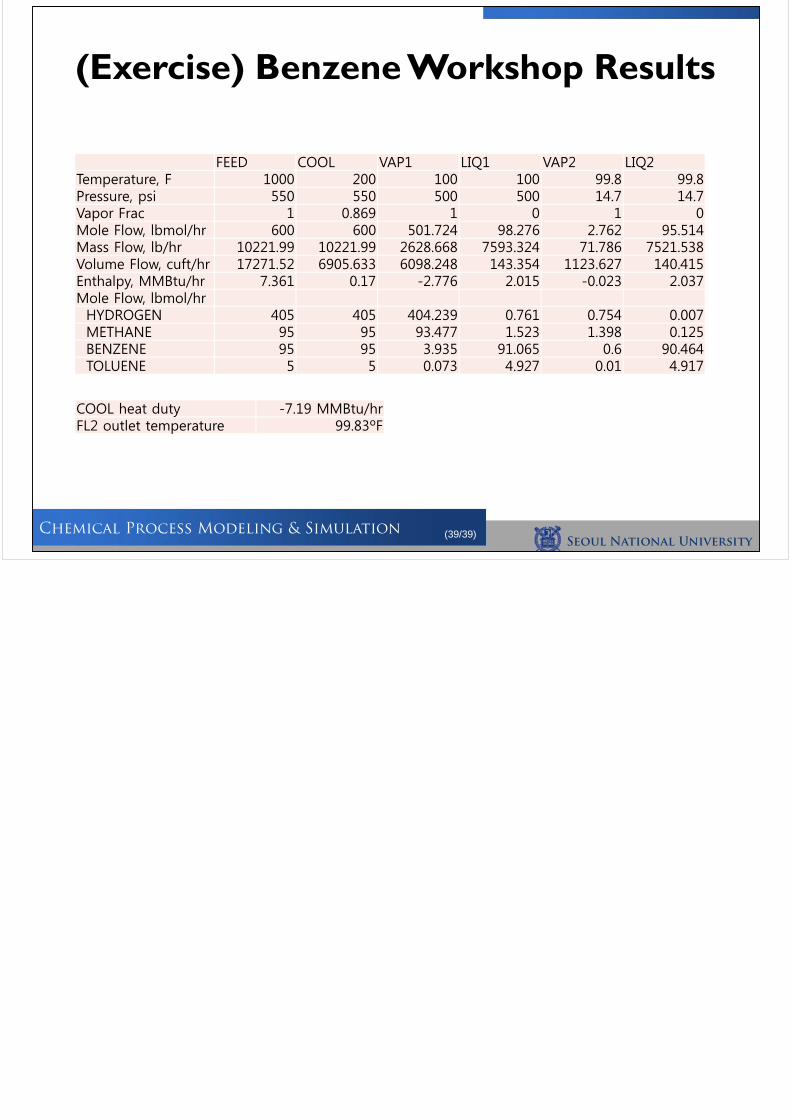
• Results
– What is the heat duty of the COOLER block? ___________
– What is the temperature in the FL2 block? ___________
Exercise) Benzene Workshop
Seoul National University
Chemical Process Modeling & Simulation (39/39)
(Exercise) Benzene Workshop Results
FEED COOL VAP1 LIQ1 VAP2 LIQ2Temperature, F 1000 200 100 100 99.8 99.8Pressure, psi 550 550 500 500 14.7 14.7Vapor Frac 1 0.869 1 0 1 0Mole Flow, lbmol/hr 600 600 501.724 98.276 2.762 95.514Mass Flow, lb/hr 10221.99 10221.99 2628.668 7593.324 71.786 7521.538Volume Flow, cuft/hr 17271.52 6905.633 6098.248 143.354 1123.627 140.415Enthalpy, MMBtu/hr 7.361 0.17 -2.776 2.015 -0.023 2.037Mole Flow, lbmol/hrHYDROGEN 405 405 404.239 0.761 0.754 0.007METHANE 95 95 93.477 1.523 1.398 0.125BENZENE 95 95 3.935 91.065 0.6 90.464TOLUENE 5 5 0.073 4.927 0.01 4.917
COOL heat duty -7.19 MMBtu/hrFL2 outlet temperature 99.83ºF
Seo
ul N
at
io
na
l U
niv
er
sit
y
Ch
em
ic
al Pr
oc
ess M
od
elin
g &
Sim
ulatio
n
Process Modeling Using Aspen Plus(RadFrac Models)
TA : Ikhyun KimInstructor : En Sup Yoon
Spring Semester, 2012
Seoul National University
Chemical Process Modeling & Simulation (2/28)
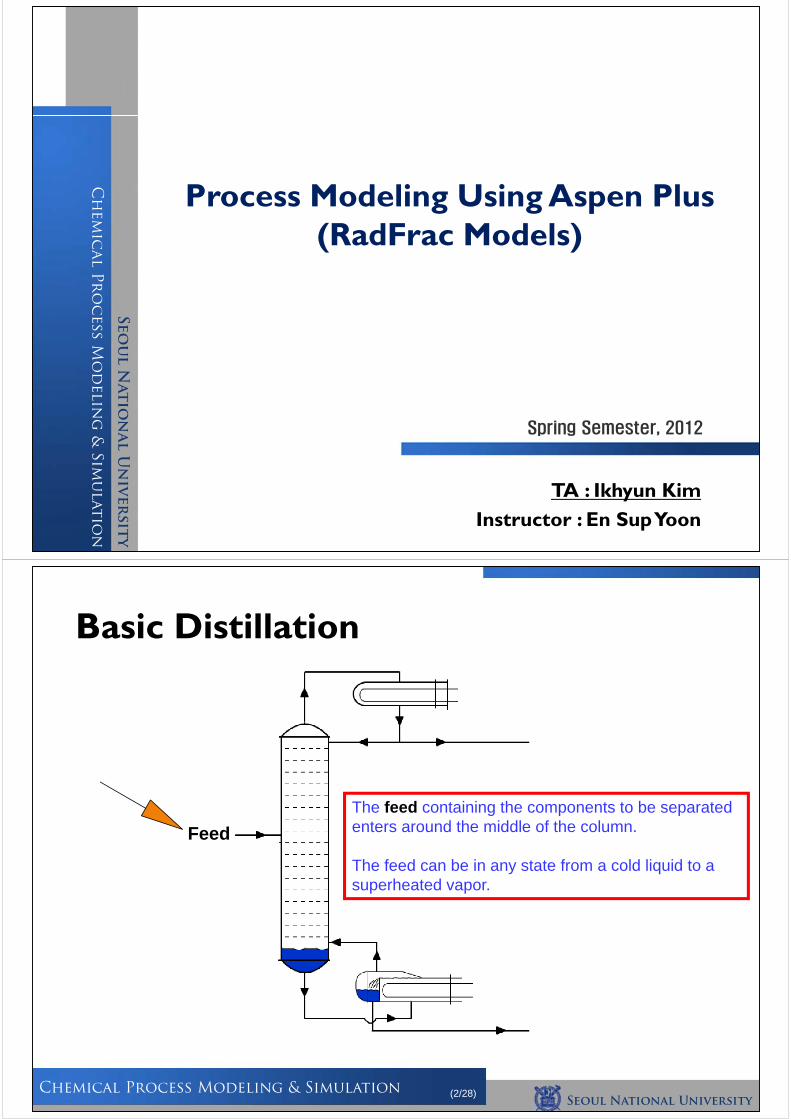
Basic Distillation
The feed containing the components to be separatedenters around the middle of the column.
The feed can be in any state from a cold liquid to asuperheated vapor.
Feed
Seoul National University
Chemical Process Modeling & Simulation (3/28)
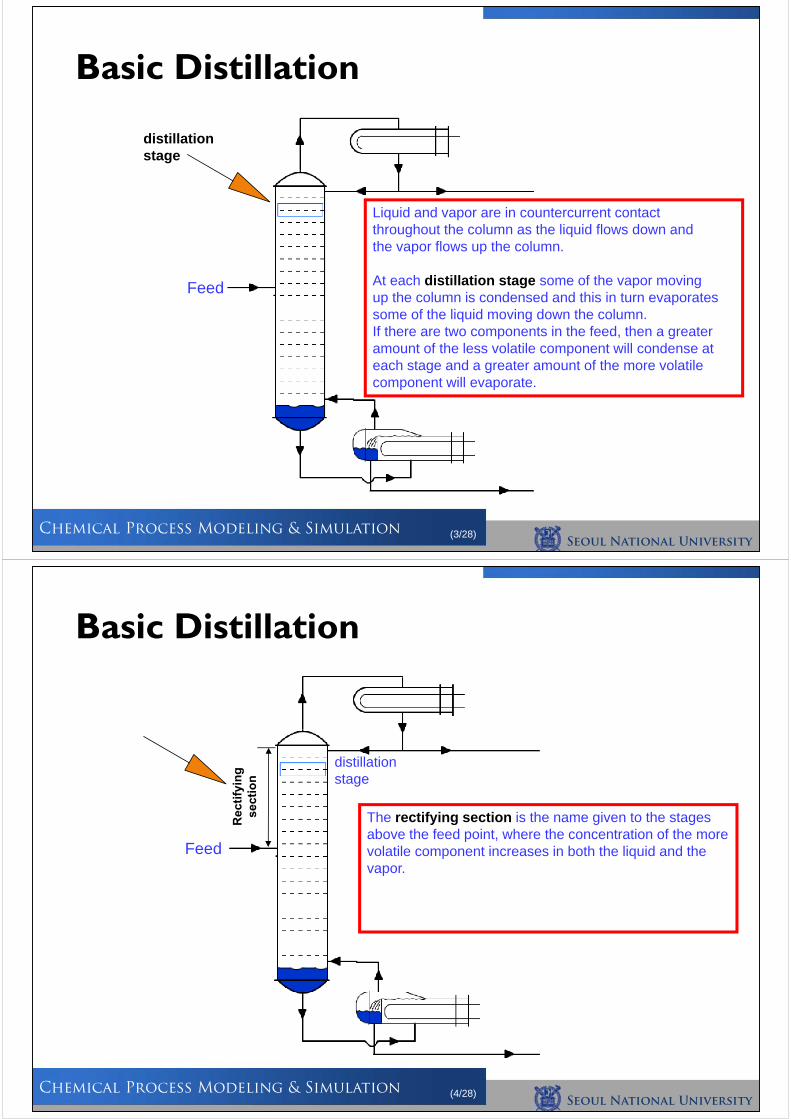
Basic Distillation
Liquid and vapor are in countercurrent contactthroughout the column as the liquid flows down and the vapor flows up the column.
At each distillation stage some of the vapor movingup the column is condensed and this in turn evaporatessome of the liquid moving down the column.If there are two components in the feed, then a greateramount of the less volatile component will condense at each stage and a greater amount of the more volatile component will evaporate.
Feed
distillationstage
Seoul National University
Chemical Process Modeling & Simulation (4/28)
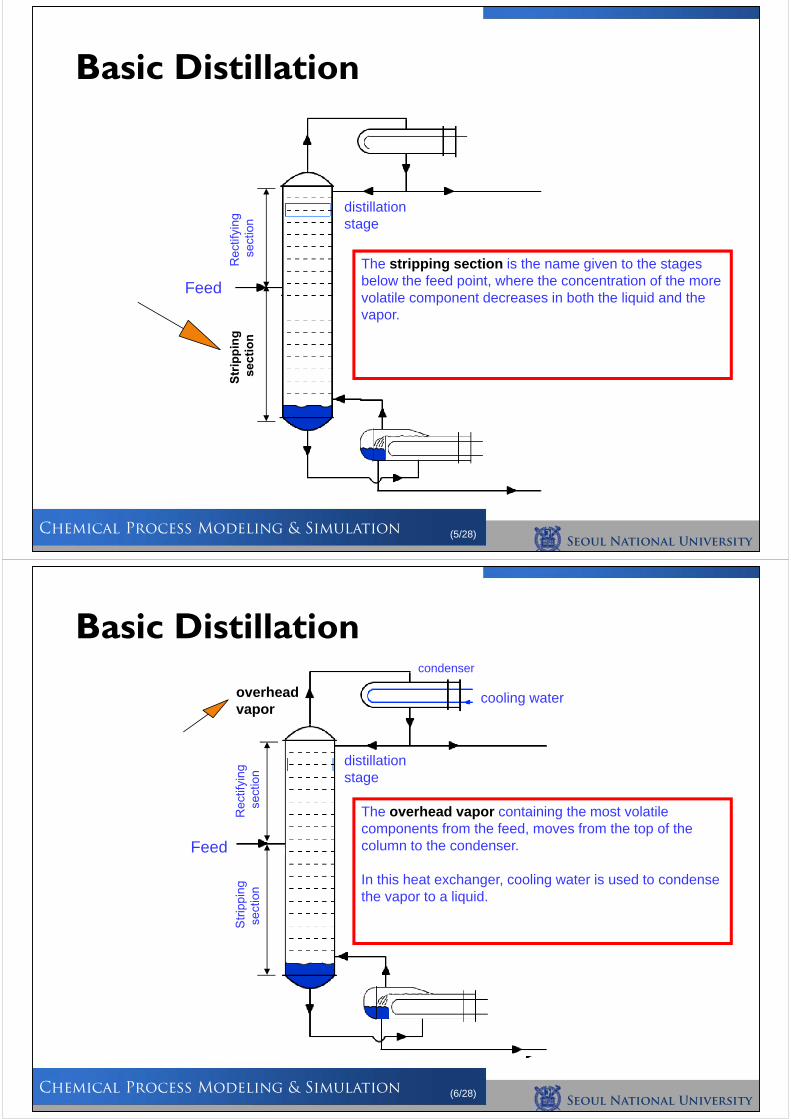
Basic Distillation
The rectifying section is the name given to the stages above the feed point, where the concentration of the more volatile component increases in both the liquid and the vapor.
Feed
distillationstage
Seoul National University
Chemical Process Modeling & Simulation (5/28)
Basic Distillation
The stripping section is the name given to the stages below the feed point, where the concentration of the more volatile component decreases in both the liquid and the vapor.
Feed
distillationstage
Seoul National University
Chemical Process Modeling & Simulation (6/28)
Basic Distillation
The overhead vapor containing the most volatile components from the feed, moves from the top of the column to the condenser.
In this heat exchanger, cooling water is used to condense the vapor to a liquid.
Feed
distillationstage
condenser
cooling wateroverheadvapor
Seoul National University
Chemical Process Modeling & Simulation (7/28)
Basic Distillation
Feed
distillationstage
condenser
cooling wateroverheadvapor
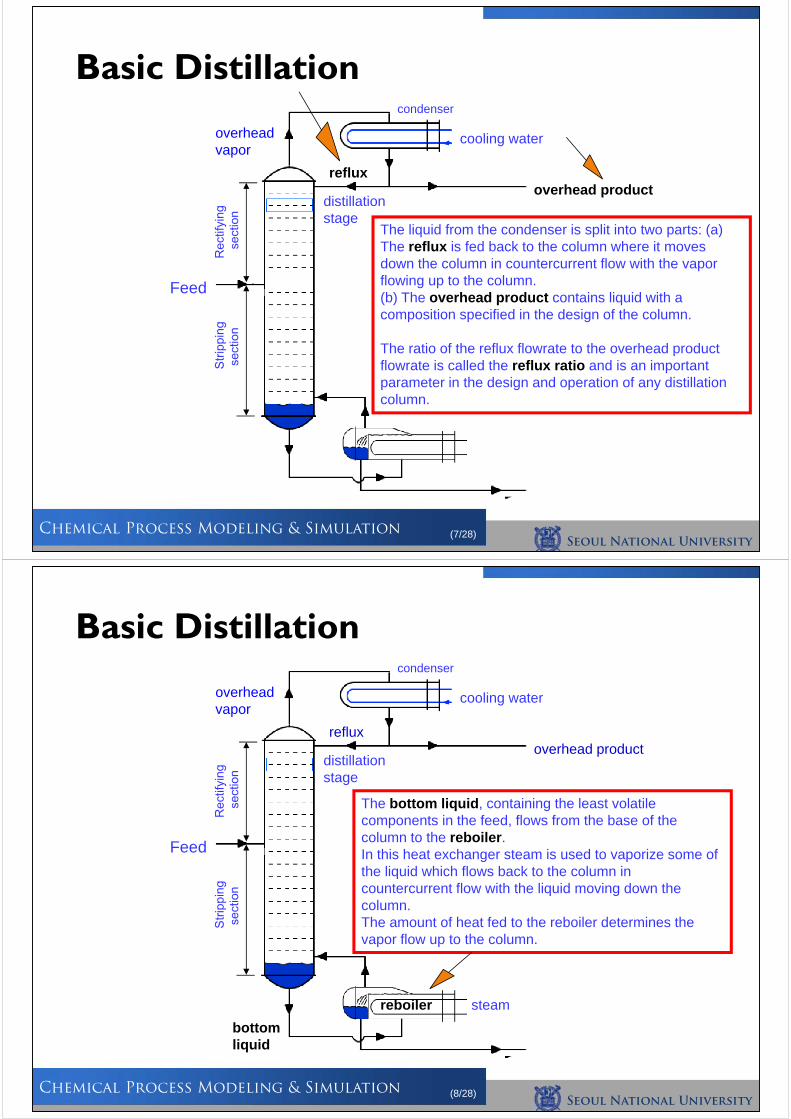
The liquid from the condenser is split into two parts: (a) The reflux is fed back to the column where it moves down the column in countercurrent flow with the vapor flowing up to the column.(b) The overhead product contains liquid with a composition specified in the design of the column.
The ratio of the reflux flowrate to the overhead product flowrate is called the reflux ratio and is an important parameter in the design and operation of any distillation column.
refluxoverhead product
Seoul National University
Chemical Process Modeling & Simulation (8/28)
Basic Distillation
Feed
distillationstage
condenser
cooling wateroverheadvapor
refluxoverhead product
The bottom liquid, containing the least volatile components in the feed, flows from the base of the column to the reboiler.In this heat exchanger steam is used to vaporize some of the liquid which flows back to the column in countercurrent flow with the liquid moving down the column.The amount of heat fed to the reboiler determines the vapor flow up to the column.
reboiler steam
bottomliquid
Seoul National University
Chemical Process Modeling & Simulation (9/28)
Basic Distillation
Feed
distillationstage
condenser
cooling wateroverheadvapor
refluxoverhead product
reboiler steam
bottomliquid
The bottom product, has a specified composition, fixed during the design of the column and is the second product stream from a distillation column.
This is the end of the section naming the parts of a distillation column.
bottoms product
Seoul National University
Chemical Process Modeling & Simulation (10/28)
• Vapor-Liquid or Vapor-Liquid-Liquid phase simulation of:– Ordinary distillation
– Absorption, reboiled absorption
– Stripping, reboiled stripping
– Azeotropic distillation
– Reactive distillation
• Configuration options– Any number of feeds
– Any number of side draws
– Total liquid draw off and pumparounds
– Any number of heaters
– Any number of decanters
RadFrac: Rigorous Multistage Separation
Seoul National University
Chemical Process Modeling & Simulation (11/28)
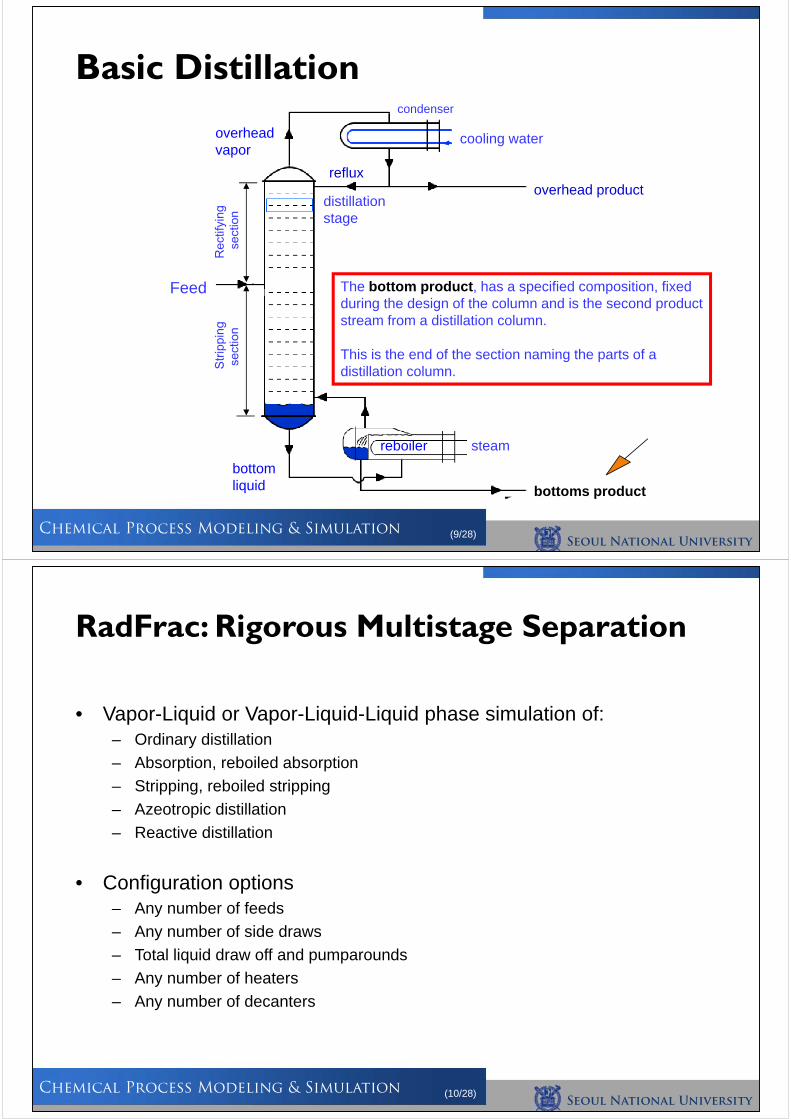
RadFrac Flowsheet ConnectivityVapor Distillate
Top-Stage or 1 Condenser Heat Duty Heat (optional)
Liquid DistillateWater Distillate (optional)
Feeds
Reflux
Products (optional)Heat (optional)
Pumparound
DecantersHeat (optional)
ProductHeat (optional)
ReturnBoil-up
Bottom Stage or NstageReboiler Heat Duty Heat (optional)
Bottoms
Seoul National University
Chemical Process Modeling & Simulation (12/28)
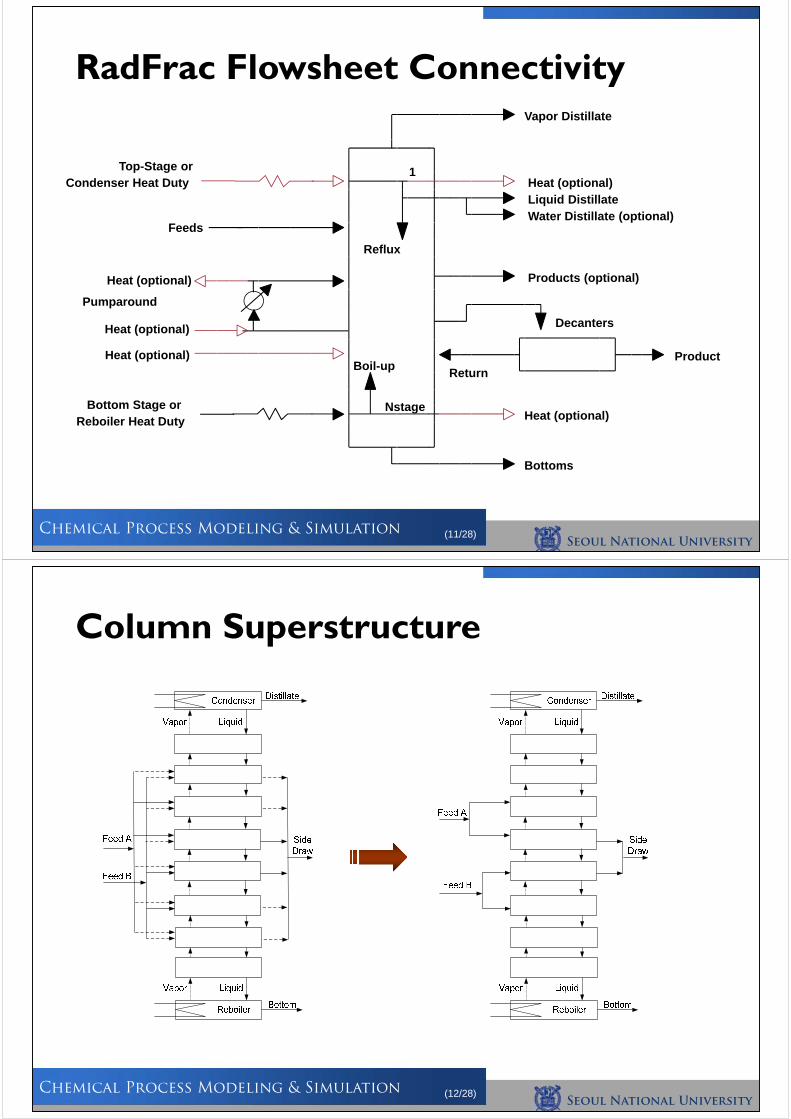
Column Superstructure
Seoul National University
Chemical Process Modeling & Simulation (13/28)
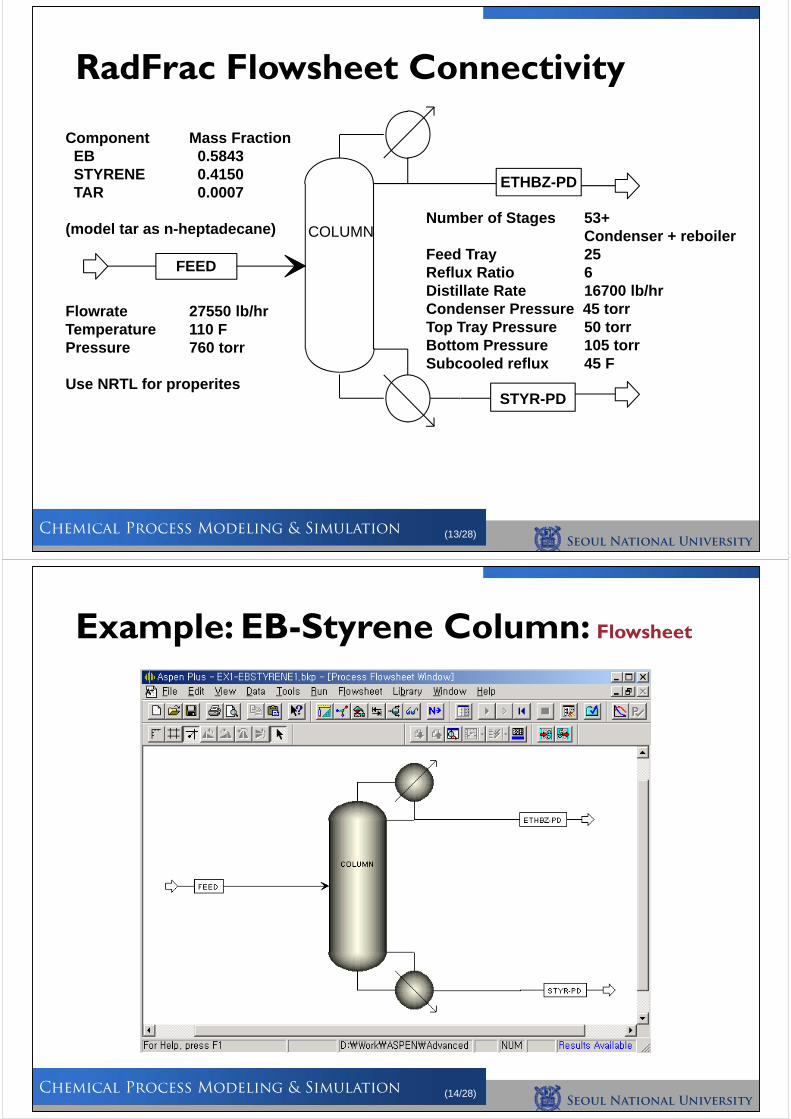
RadFrac Flowsheet Connectivity
Component Mass FractionEB 0.5843STYRENE 0.4150TAR 0.0007
(model tar as n-heptadecane) COLUMN
FEED
ETHBZ-PD
STYR-PD
Flowrate 27550 lb/hrTemperature 110 FPressure 760 torr
Use NRTL for properites
Number of Stages 53+Condenser + reboiler
Feed Tray 25Reflux Ratio 6Distillate Rate 16700 lb/hrCondenser Pressure 45 torrTop Tray Pressure 50 torrBottom Pressure 105 torrSubcooled reflux 45 F
Seoul National University
Chemical Process Modeling & Simulation (14/28)
Example: EB-Styrene Column: Flowsheet
Seoul National University
Chemical Process Modeling & Simulation (15/28)
Example: EB-Styrene Column: Setup
Seoul National University
Chemical Process Modeling & Simulation (16/28)
Example: EB-Styrene Column: Component
Seoul National University
Chemical Process Modeling & Simulation (17/28)
Example: EB-Styrene Column: Property(1)
Seoul National University
Chemical Process Modeling & Simulation (18/28)
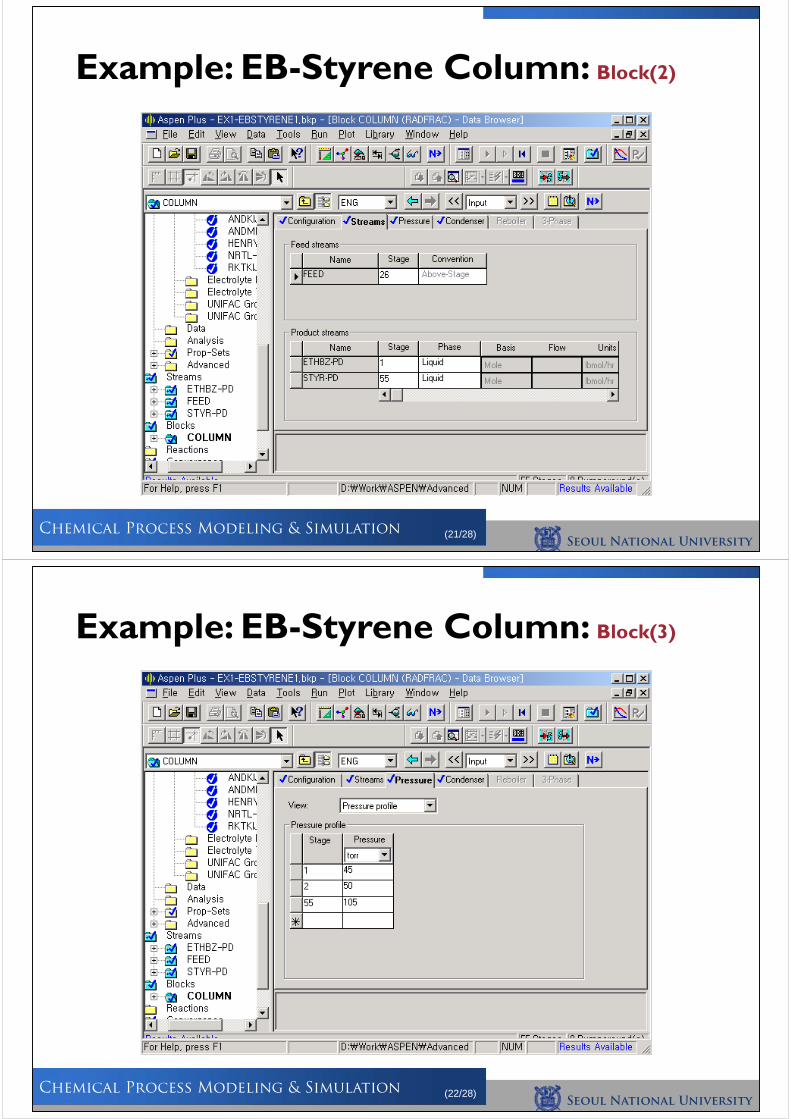
Example: EB-Styrene Column: Property(2)
Seoul National University
Chemical Process Modeling & Simulation (19/28)
Example: EB-Styrene Column: Stream
Seoul National University
Chemical Process Modeling & Simulation (20/28)
Example: EB-Styrene Column: Block(1)
Seoul National University
Chemical Process Modeling & Simulation (21/28)
Example: EB-Styrene Column: Block(2)
Seoul National University
Chemical Process Modeling & Simulation (22/28)
Example: EB-Styrene Column: Block(3)
Seoul National University
Chemical Process Modeling & Simulation (23/28)
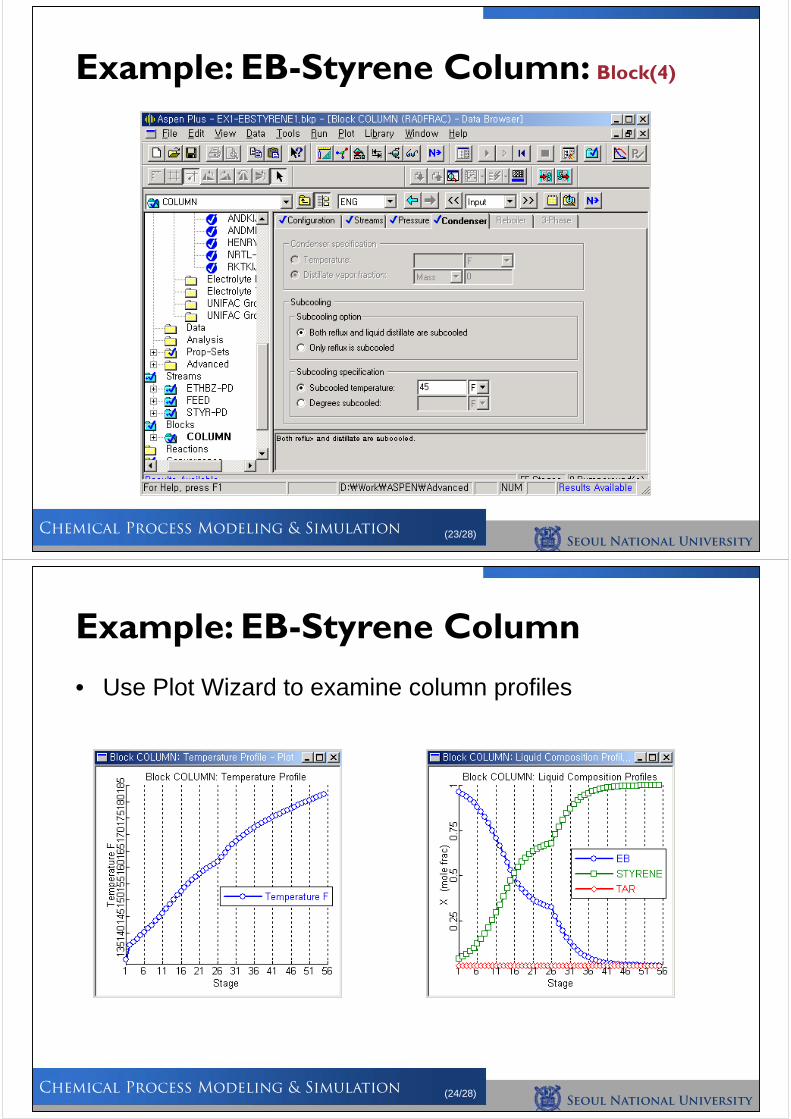
Example: EB-Styrene Column: Block(4)
Seoul National University
Chemical Process Modeling & Simulation (24/28)
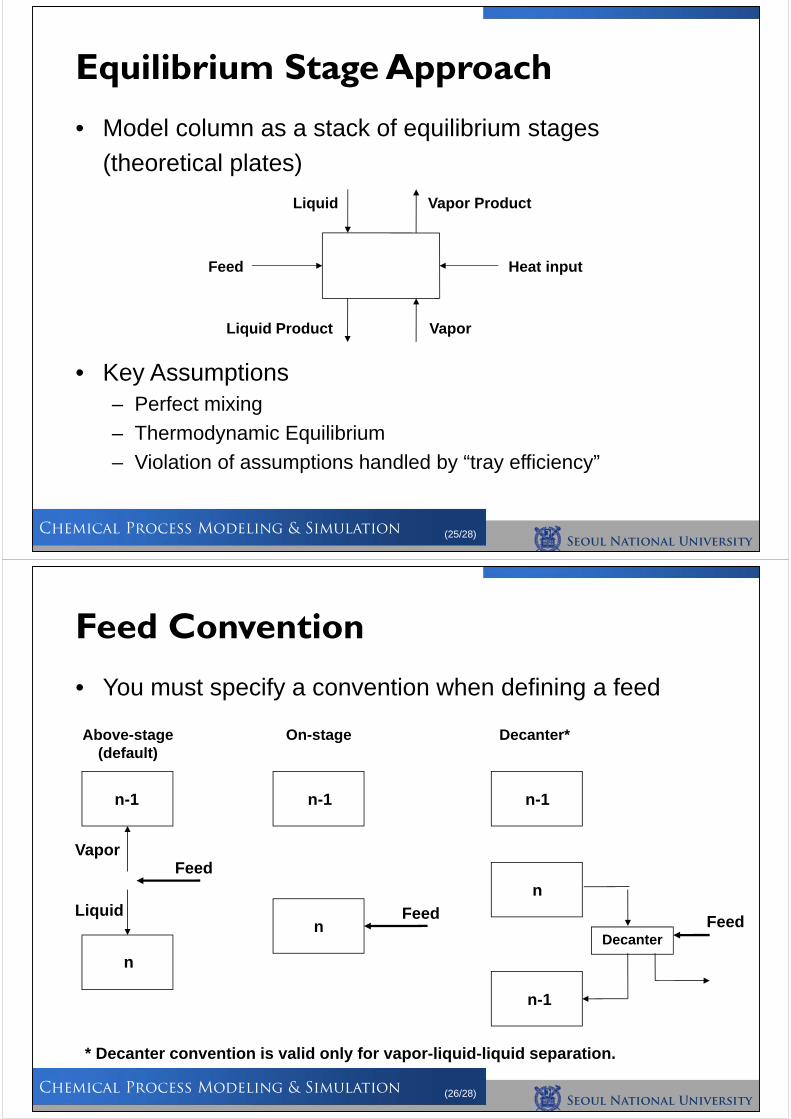
• Use Plot Wizard to examine column profiles
Example: EB-Styrene Column
Seoul National University
Chemical Process Modeling & Simulation (25/28)
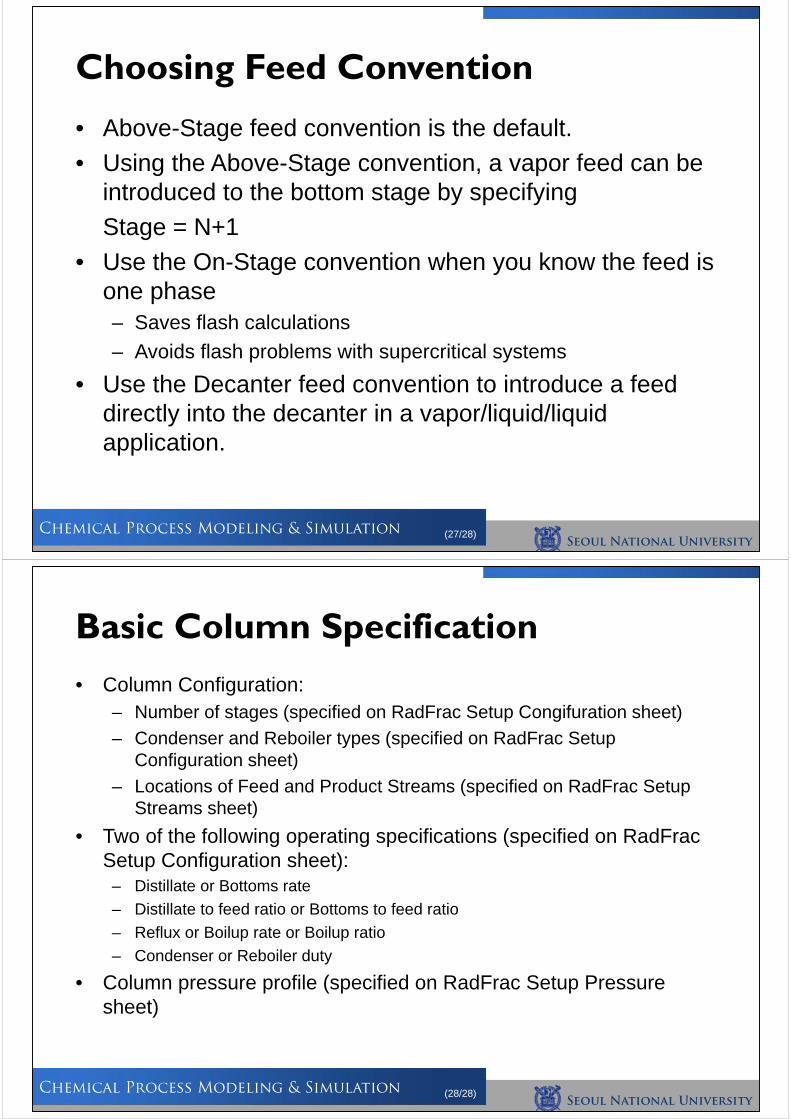
• Model column as a stack of equilibrium stages
(theoretical plates)
• Key Assumptions– Perfect mixing
– Thermodynamic Equilibrium
– Violation of assumptions handled by “tray efficiency”
Equilibrium Stage Approach
Feed
Liquid Vapor Product
VaporLiquid Product
Heat input
Seoul National University
Chemical Process Modeling & Simulation (26/28)
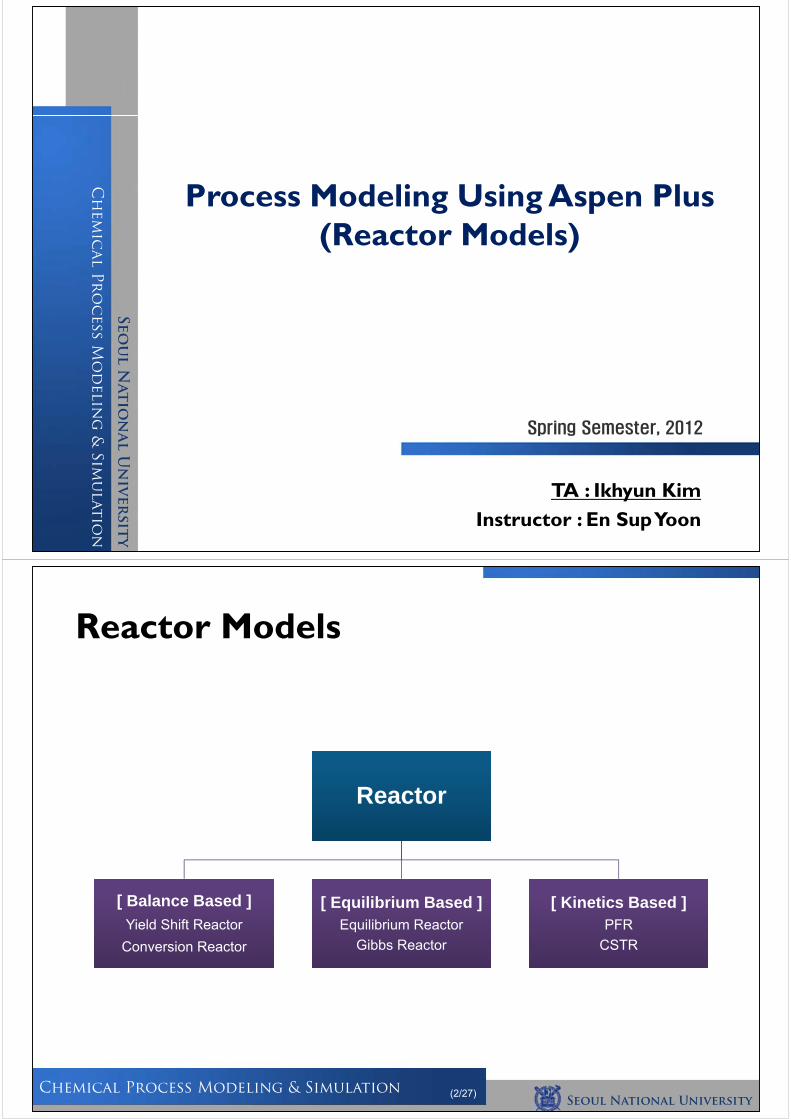
• You must specify a convention when defining a feed
Feed Convention
Decanter
Above-stage(default)
On-stage Decanter*
Vapor
Liquid
Feed
Feed Feed
n-1
n
n-1
n
n-1
n
n-1
* Decanter convention is valid only for vapor-liquid-liquid separation.
Seoul National University
Chemical Process Modeling & Simulation (27/28)
• Above-Stage feed convention is the default.
• Using the Above-Stage convention, a vapor feed can be introduced to the bottom stage by specifying
Stage = N+1
• Use the On-Stage convention when you know the feed is one phase– Saves flash calculations
– Avoids flash problems with supercritical systems
• Use the Decanter feed convention to introduce a feed directly into the decanter in a vapor/liquid/liquid application.
Choosing Feed Convention
Seoul National University
Chemical Process Modeling & Simulation (28/28)
• Column Configuration:– Number of stages (specified on RadFrac Setup Congifuration sheet)
– Condenser and Reboiler types (specified on RadFrac Setup Configuration sheet)
– Locations of Feed and Product Streams (specified on RadFrac Setup Streams sheet)
• Two of the following operating specifications (specified on RadFracSetup Configuration sheet):
– Distillate or Bottoms rate
– Distillate to feed ratio or Bottoms to feed ratio
– Reflux or Boilup rate or Boilup ratio
– Condenser or Reboiler duty
• Column pressure profile (specified on RadFrac Setup Pressure sheet)
Basic Column Specification
Seo
ul N
at
io
na
l U
niv
er
sit
y
Ch
em
ic
al Pr
oc
ess M
od
elin
g &
Sim
ulatio
n
Process Modeling Using Aspen Plus(Reactor Models)
TA : Ikhyun KimInstructor : En Sup Yoon
Spring Semester, 2012
Seoul National University
Chemical Process Modeling & Simulation (2/27)
Reactor Models
ReactorReactor
[ Balance Based ]
Yield Shift Reactor
Conversion Reactor
[ Balance Based ]
Yield Shift Reactor
Conversion Reactor
[ Equilibrium Based ]Equilibrium Reactor
Gibbs Reactor
[ Equilibrium Based ]Equilibrium Reactor
Gibbs Reactor
[ Kinetics Based ]PFR
CSTR
[ Kinetics Based ]PFR
CSTR
Seoul National University
Chemical Process Modeling & Simulation (3/27)
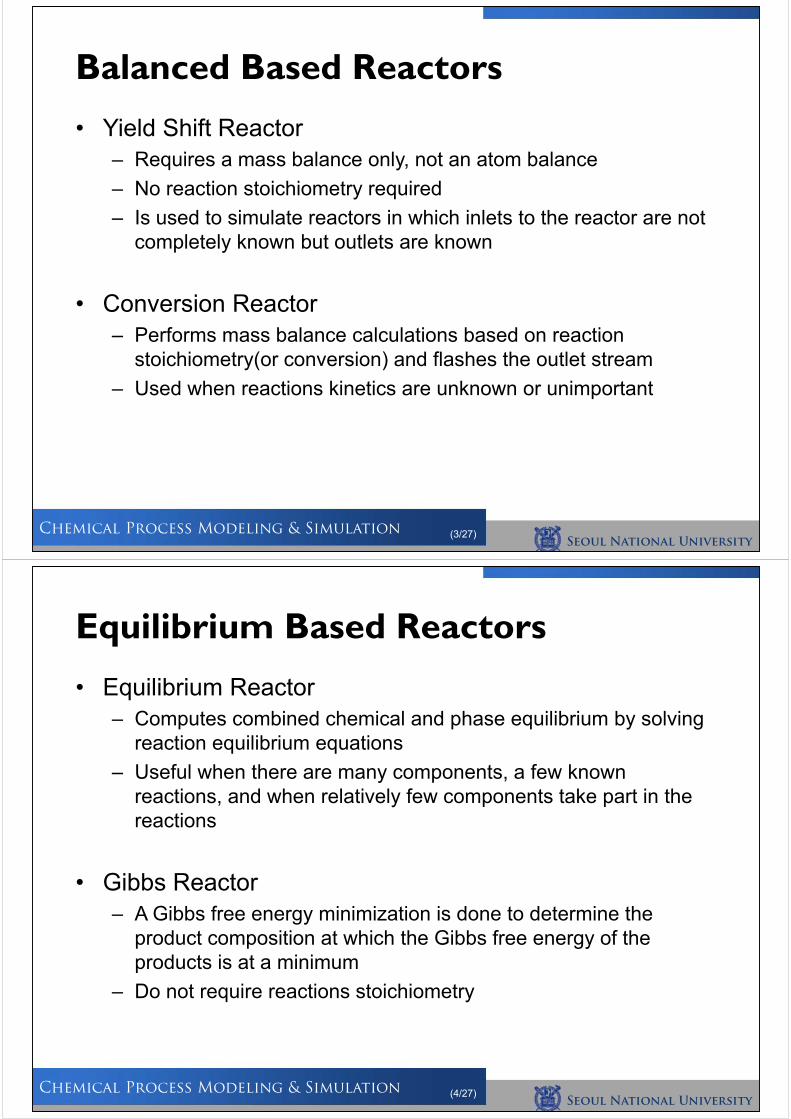
• Yield Shift Reactor– Requires a mass balance only, not an atom balance
– No reaction stoichiometry required
– Is used to simulate reactors in which inlets to the reactor are not completely known but outlets are known
• Conversion Reactor– Performs mass balance calculations based on reaction
stoichiometry(or conversion) and flashes the outlet stream
– Used when reactions kinetics are unknown or unimportant
Balanced Based Reactors
Seoul National University
Chemical Process Modeling & Simulation (4/27)
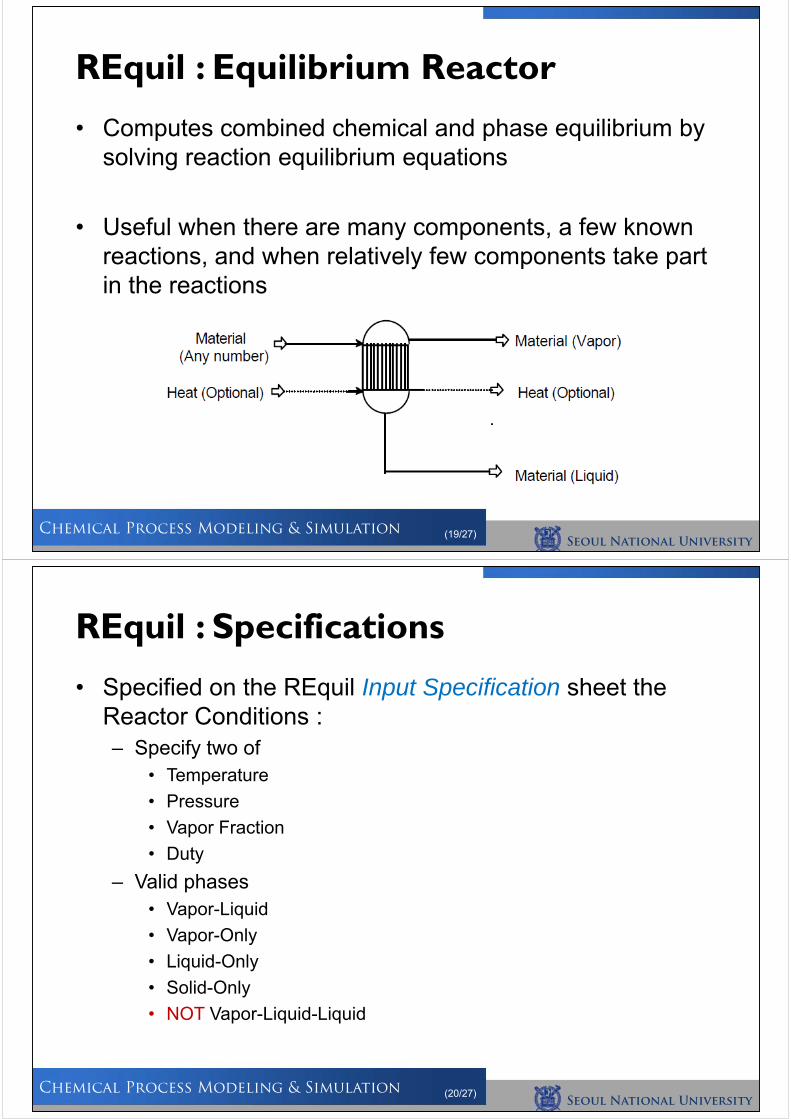
• Equilibrium Reactor– Computes combined chemical and phase equilibrium by solving
reaction equilibrium equations
– Useful when there are many components, a few known reactions, and when relatively few components take part in the reactions
• Gibbs Reactor– A Gibbs free energy minimization is done to determine the
product composition at which the Gibbs free energy of the products is at a minimum
– Do not require reactions stoichiometry
Equilibrium Based Reactors
Seoul National University
Chemical Process Modeling & Simulation (5/27)
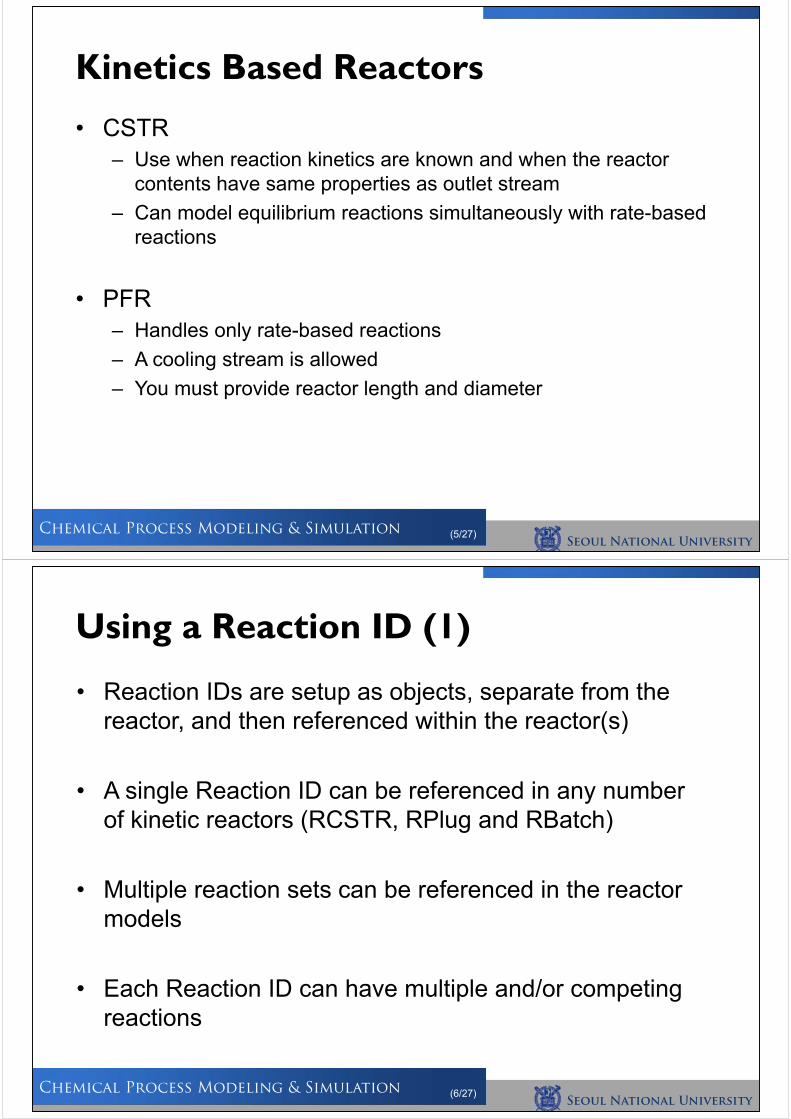
• CSTR– Use when reaction kinetics are known and when the reactor
contents have same properties as outlet stream
– Can model equilibrium reactions simultaneously with rate-based reactions
• PFR– Handles only rate-based reactions
– A cooling stream is allowed
– You must provide reactor length and diameter
Kinetics Based Reactors
Seoul National University
Chemical Process Modeling & Simulation (6/27)
Using a Reaction ID (1)
• Reaction IDs are setup as objects, separate from the reactor, and then referenced within the reactor(s)
• A single Reaction ID can be referenced in any number of kinetic reactors (RCSTR, RPlug and RBatch)
• Multiple reaction sets can be referenced in the reactor models
• Each Reaction ID can have multiple and/or competing reactions
Seoul National University
Chemical Process Modeling & Simulation (7/27)
Using a Reaction ID (2)
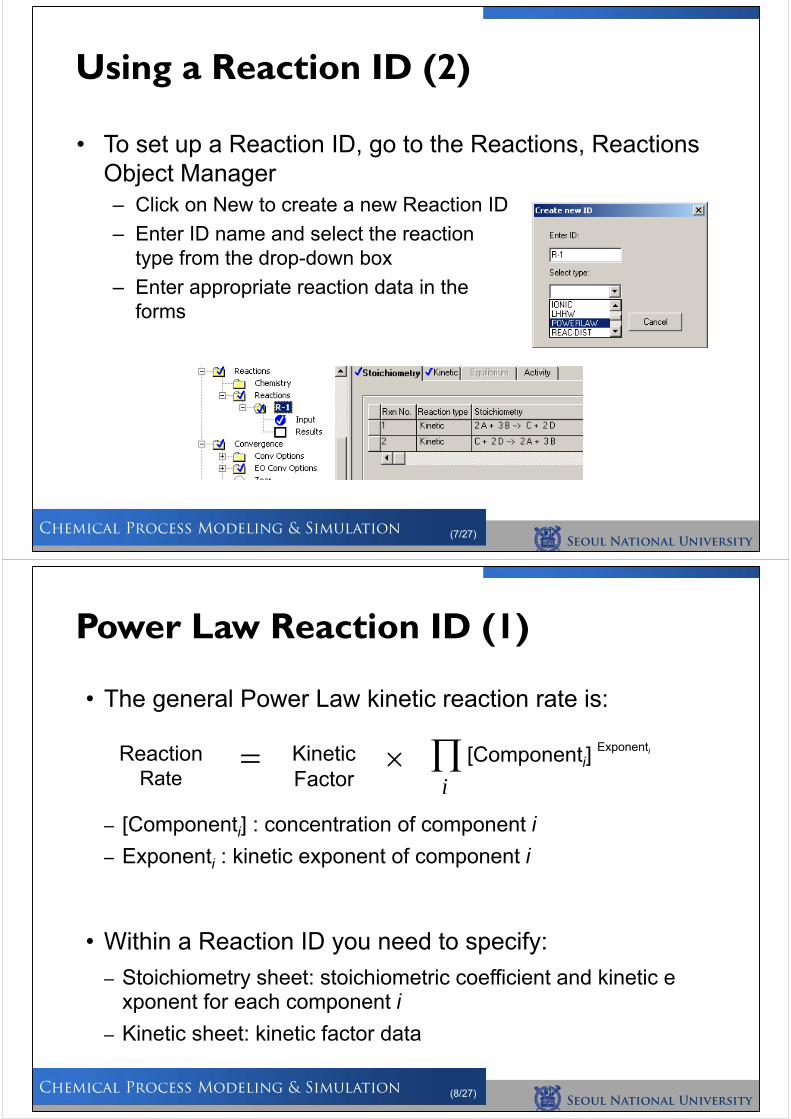
• To set up a Reaction ID, go to the Reactions, Reactions Object Manager– Click on New to create a new Reaction ID
– Enter ID name and select the reaction type from the drop-down box
– Enter appropriate reaction data in the forms
Seoul National University
Chemical Process Modeling & Simulation (8/27)
Power Law Reaction ID (1)
ReactionRate
Kinetic Factor i
[Componenti]Exponenti
• The general Power Law kinetic reaction rate is:
– [Componenti] : concentration of component i
– Exponenti : kinetic exponent of component i
• Within a Reaction ID you need to specify:
– Stoichiometry sheet: stoichiometric coefficient and kinetic exponent for each component i
– Kinetic sheet: kinetic factor data
Seoul National University
Chemical Process Modeling & Simulation (9/27)
Power Law Reaction ID (2)
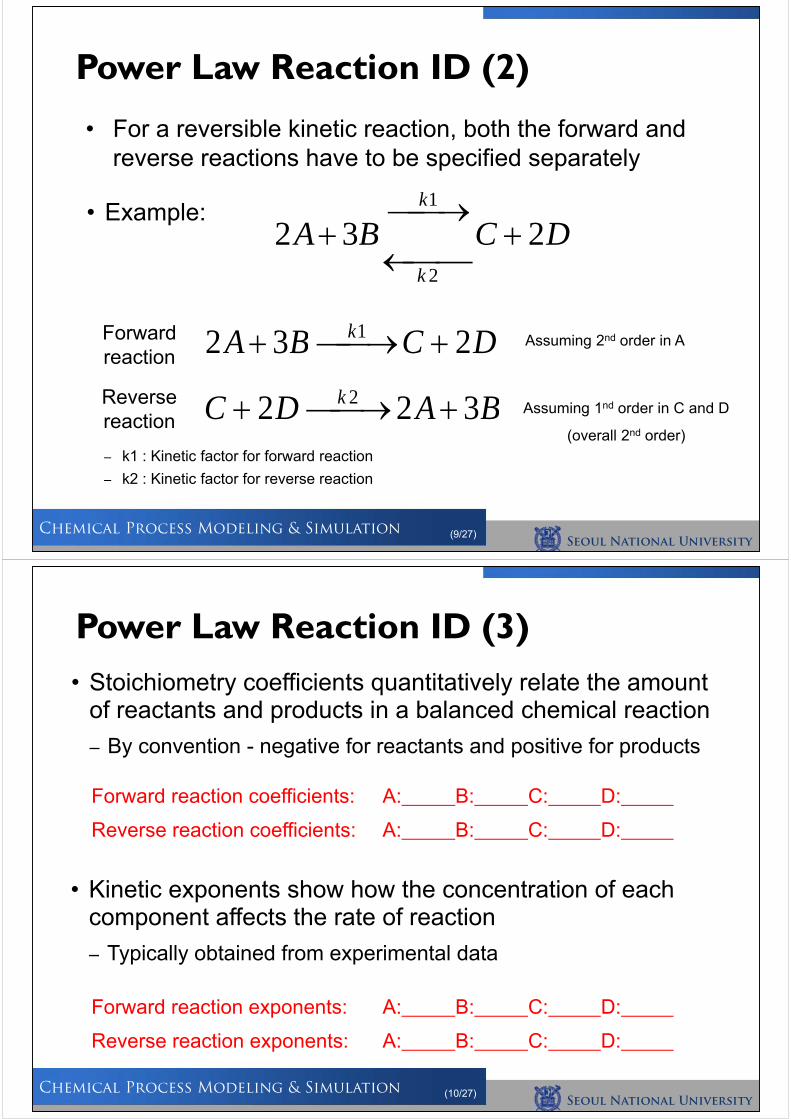
• For a reversible kinetic reaction, both the forward and reverse reactions have to be specified separately
• Example: DCBA
k
k
2322
1
DCBA k 232 1
BADC k 322 2 – k1 : Kinetic factor for forward reaction
– k2 : Kinetic factor for reverse reaction
Forward reaction
Reverse reaction
Assuming 2nd order in A
Assuming 1nd order in C and D
(overall 2nd order)
Seoul National University
Chemical Process Modeling & Simulation (10/27)
Power Law Reaction ID (3)• Stoichiometry coefficients quantitatively relate the amount
of reactants and products in a balanced chemical reaction
– By convention - negative for reactants and positive for products
Forward reaction coefficients: A: B: C: D:
Reverse reaction coefficients: A: B: C: D:
Forward reaction exponents: A: B: C: D:
Reverse reaction exponents: A: B: C: D:
• Kinetic exponents show how the concentration of each component affects the rate of reaction
– Typically obtained from experimental data
Seoul National University
Chemical Process Modeling & Simulation (11/27)
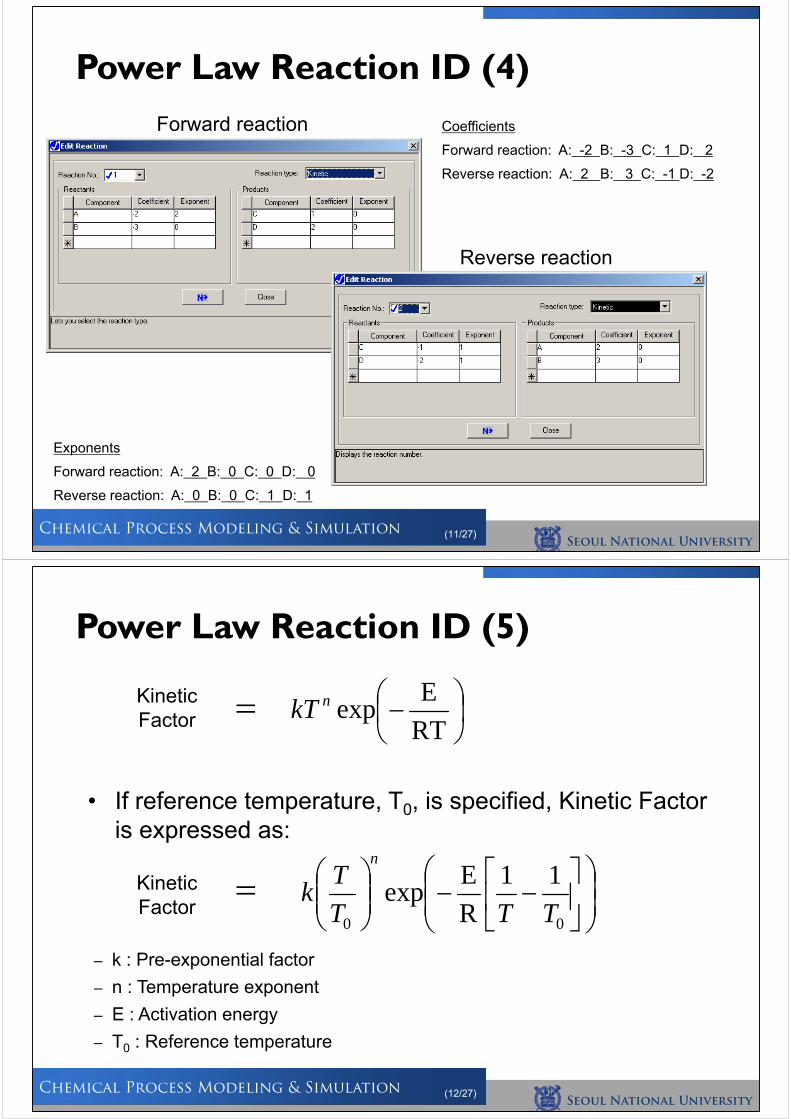
Power Law Reaction ID (4)Coefficients
Forward reaction: A: -2 B: -3 C: 1 D: 2
Reverse reaction: A: 2 B: 3 C: -1 D: -2
Exponents
Forward reaction: A: 2 B: 0 C: 0 D: 0
Reverse reaction: A: 0 B: 0 C: 1 D: 1
Forward reaction
Reverse reaction
Seoul National University
Chemical Process Modeling & Simulation (12/27)
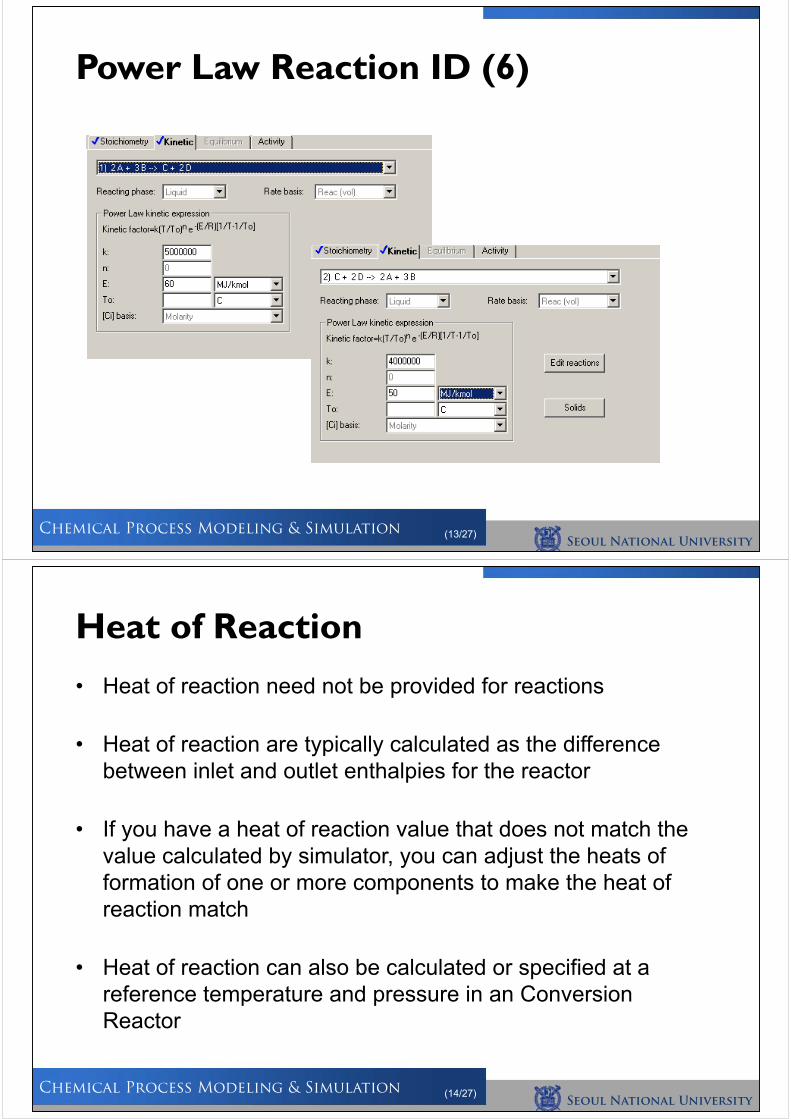
Power Law Reaction ID (5)
• If reference temperature, T0, is specified, Kinetic Factor is expressed as:
Kinetic Factor
00
11
R
Eexp
TTT
Tk
n
– k : Pre-exponential factor
– n : Temperature exponent
– E : Activation energy
– T0 : Reference temperature
Kinetic Factor
RT
EexpnkT
Seoul National University
Chemical Process Modeling & Simulation (13/27)
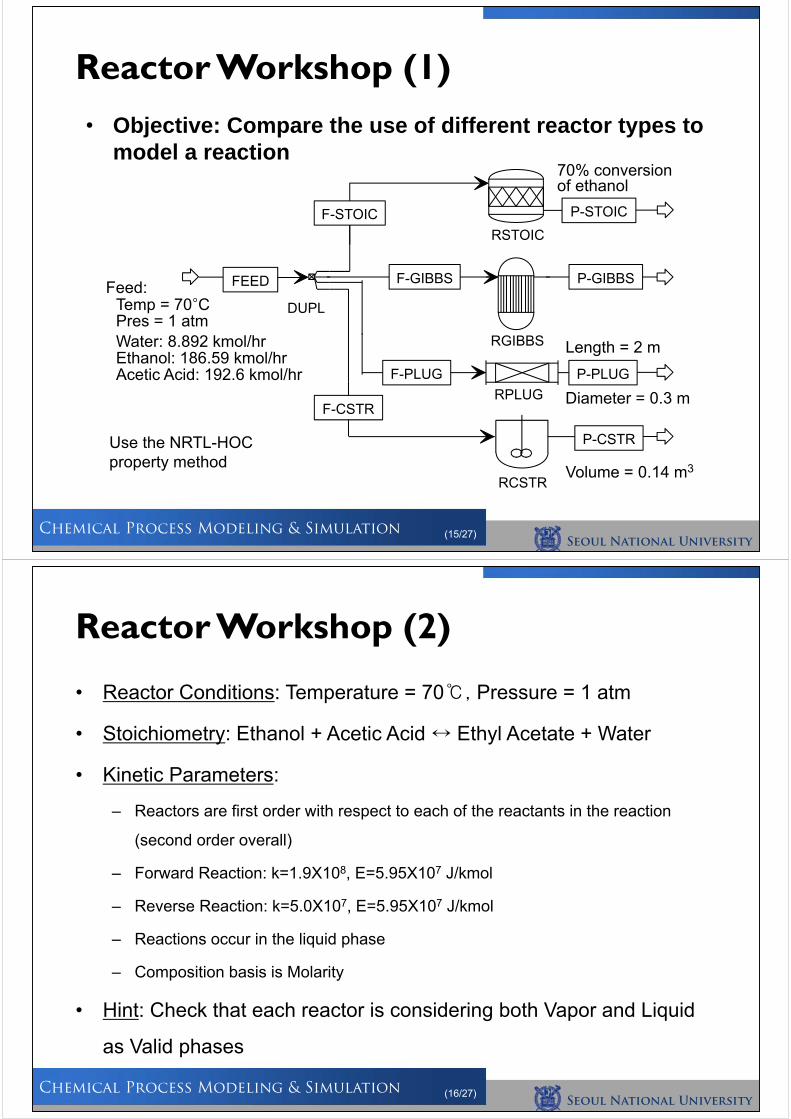
Power Law Reaction ID (6)
Seoul National University
Chemical Process Modeling & Simulation (14/27)
• Heat of reaction need not be provided for reactions
• Heat of reaction are typically calculated as the difference between inlet and outlet enthalpies for the reactor
• If you have a heat of reaction value that does not match the value calculated by simulator, you can adjust the heats of formation of one or more components to make the heat of reaction match
• Heat of reaction can also be calculated or specified at a reference temperature and pressure in an Conversion Reactor
Heat of Reaction
Seoul National University
Chemical Process Modeling & Simulation (15/27)
Reactor Workshop (1)
• Objective: Compare the use of different reactor types to model a reaction
Use the NRTL-HOC property method
Temp = 70°CPres = 1 atm
Feed:
Water: 8.892 kmol/hrEthanol: 186.59 kmol/hrAcetic Acid: 192.6 kmol/hr
Length = 2 m
Diameter = 0.3 m
Volume = 0.14 m3
70% conversion of ethanol
RSTOIC
F-STOIC P-STOIC
RGIBBS
F-GIBBS P-GIBBS
RPLUG
F-PLUG P-PLUG
DUPL
FEED
F-CSTR
RCSTR
P-CSTR
Seoul National University
Chemical Process Modeling & Simulation (16/27)
• Reactor Conditions: Temperature = 70℃, Pressure = 1 atm
• Stoichiometry: Ethanol + Acetic Acid ↔ Ethyl Acetate + Water
• Kinetic Parameters:
– Reactors are first order with respect to each of the reactants in the reaction
(second order overall)
– Forward Reaction: k=1.9X10⁸, E=5.95X10⁷ J/kmol
– Reverse Reaction: k=5.0X10⁷, E=5.95X10⁷ J/kmol
– Reactions occur in the liquid phase
– Composition basis is Molarity
• Hint: Check that each reactor is considering both Vapor and Liquid
as Valid phases
Reactor Workshop (2)
Seoul National University
Chemical Process Modeling & Simulation (17/27)
Reactor Workshop (3)
• Results
RStoic RGibbs RPlug RCSTRAmount of Ethyl Acetate produced (kmol/hr)Mass fraction Ethyl Acetate in product streamHeat duty (kcal/hr)
Seoul National University
Chemical Process Modeling & Simulation (18/27)
• Equilibrium Reactors– REquil
– RGibbs
• Do not take reaction kinetics into account
• Solve similar problems, but problem specifications are different
• Individual reactions can be at a restricted equilibrium using a temperature approach to equilibrium or molar extent of reaction
Equilibrium Based Reactors
Seoul National University
Chemical Process Modeling & Simulation (19/27)
• Computes combined chemical and phase equilibrium by solving reaction equilibrium equations
• Useful when there are many components, a few known reactions, and when relatively few components take part in the reactions
REquil : Equilibrium Reactor
Seoul National University
Chemical Process Modeling & Simulation (20/27)
• Specified on the REquil Input Specification sheet the Reactor Conditions :– Specify two of
• Temperature
• Pressure
• Vapor Fraction
• Duty
– Valid phases• Vapor-Liquid
• Vapor-Only
• Liquid-Only
• Solid-Only
• NOT Vapor-Liquid-Liquid
REquil : Specifications
Seoul National University
Chemical Process Modeling & Simulation (21/27)
• Calculates equilibrium constants from Gibbs energy
• Can restrict equilibrium by specifying one of– Molar extent of the reaction
– A temperature approach to chemical equilibrium
• Temperature approach is the number of degrees above the reactor temperature at which chemical equilibrium is determined,
Tequil = TR + ∆T
• By default REquil assumes that reactions will reach equilibrium. (Temperature approach = 0)
REquili : Equilibrium
Seoul National University
Chemical Process Modeling & Simulation (22/27)
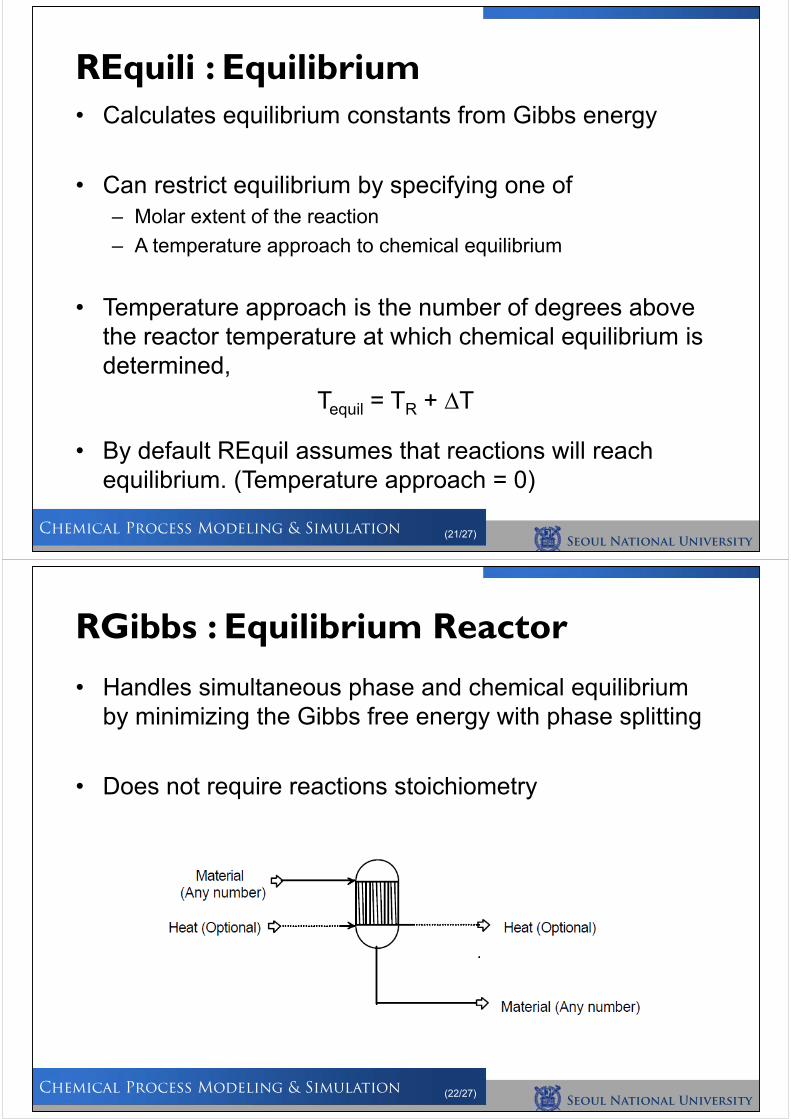
• Handles simultaneous phase and chemical equilibrium by minimizing the Gibbs free energy with phase splitting
• Does not require reactions stoichiometry
RGibbs : Equilibrium Reactor
Seoul National University
Chemical Process Modeling & Simulation (23/27)
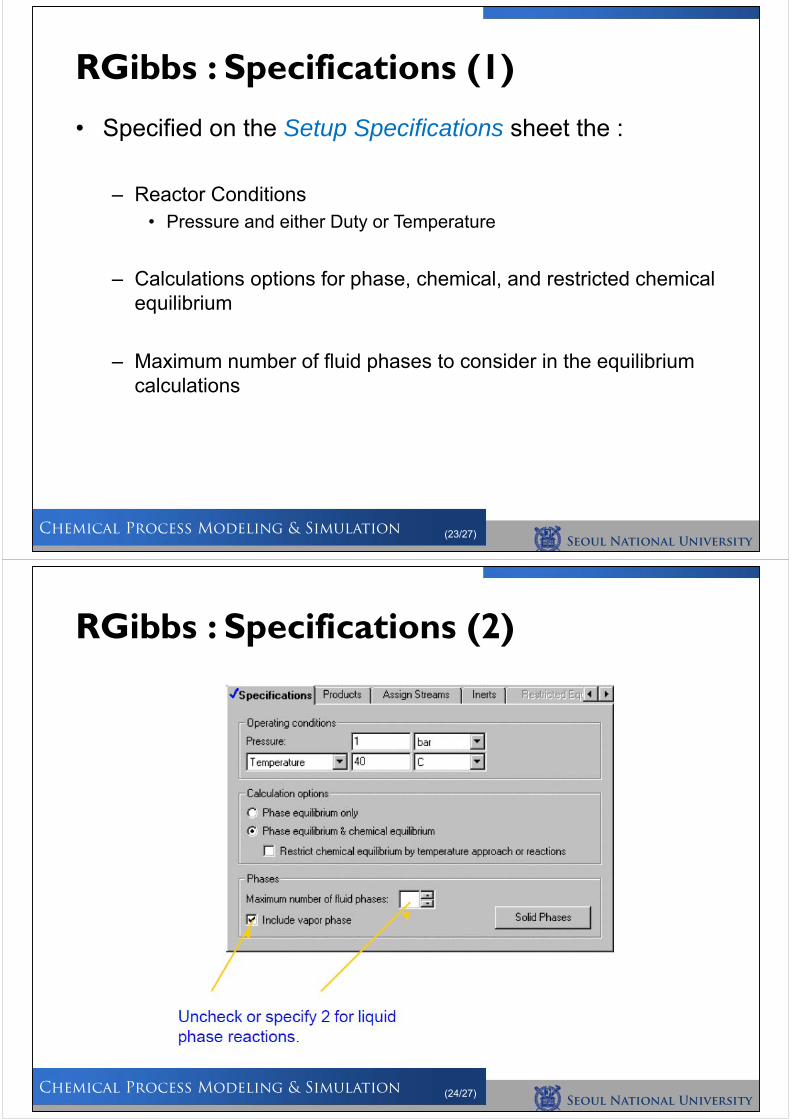
• Specified on the Setup Specifications sheet the :
– Reactor Conditions• Pressure and either Duty or Temperature
– Calculations options for phase, chemical, and restricted chemical equilibrium
– Maximum number of fluid phases to consider in the equilibrium calculations
RGibbs : Specifications (1)
Seoul National University
Chemical Process Modeling & Simulation (24/27)
RGibbs : Specifications (2)
Seoul National University
Chemical Process Modeling & Simulation (25/27)
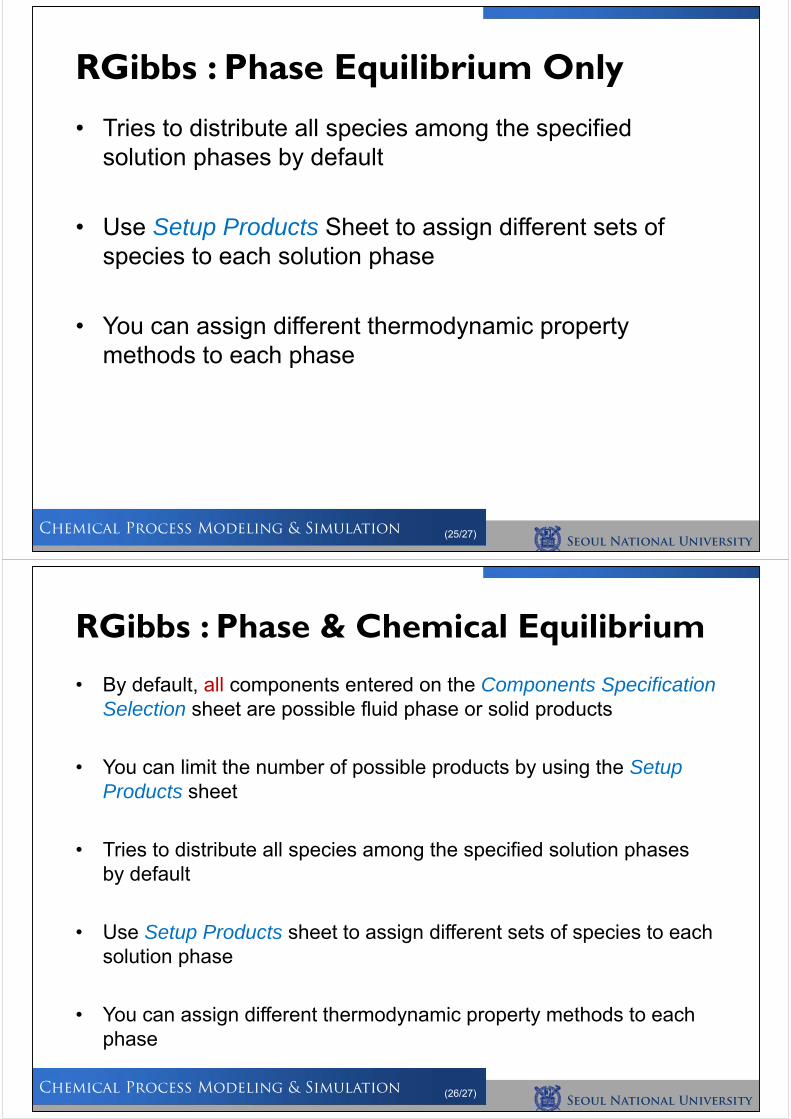
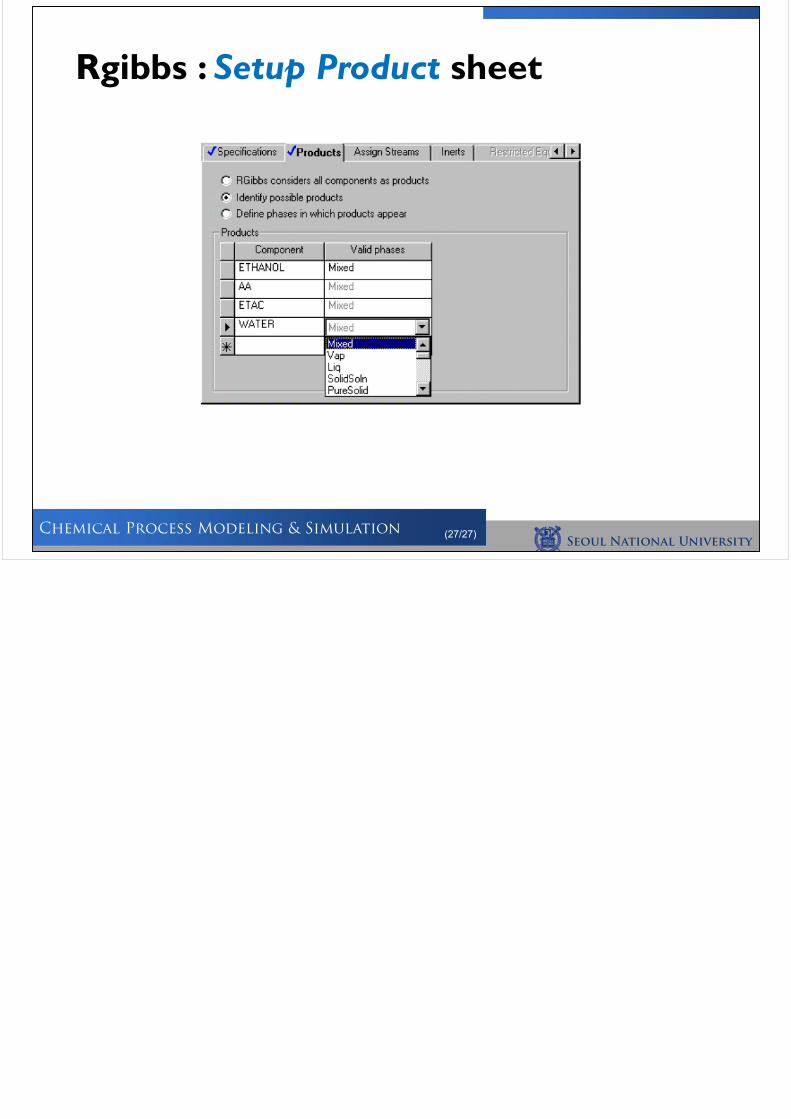
• Tries to distribute all species among the specified solution phases by default
• Use Setup Products Sheet to assign different sets of species to each solution phase
• You can assign different thermodynamic property methods to each phase
RGibbs : Phase Equilibrium Only
Seoul National University
Chemical Process Modeling & Simulation (26/27)
• By default, all components entered on the Components Specification Selection sheet are possible fluid phase or solid products
• You can limit the number of possible products by using the Setup Products sheet
• Tries to distribute all species among the specified solution phases by default
• Use Setup Products sheet to assign different sets of species to each solution phase
• You can assign different thermodynamic property methods to each phase
RGibbs : Phase & Chemical Equilibrium
Seoul National University
Chemical Process Modeling & Simulation (27/27)
Rgibbs : Setup Product sheet
Seo
ul N
at
io
na
l U
niv
er
sit
y
Ch
em
ic
al Pr
oc
ess M
od
elin
g &
Sim
ulatio
n
Process Modeling Using Aspen Plus(Logical Operation Tools)
TA : Ikhyun KimInstructor : En Sup Yoon
Spring Semester, 2012
Seoul National University
Chemical Process Modeling & Simulation (2/41)
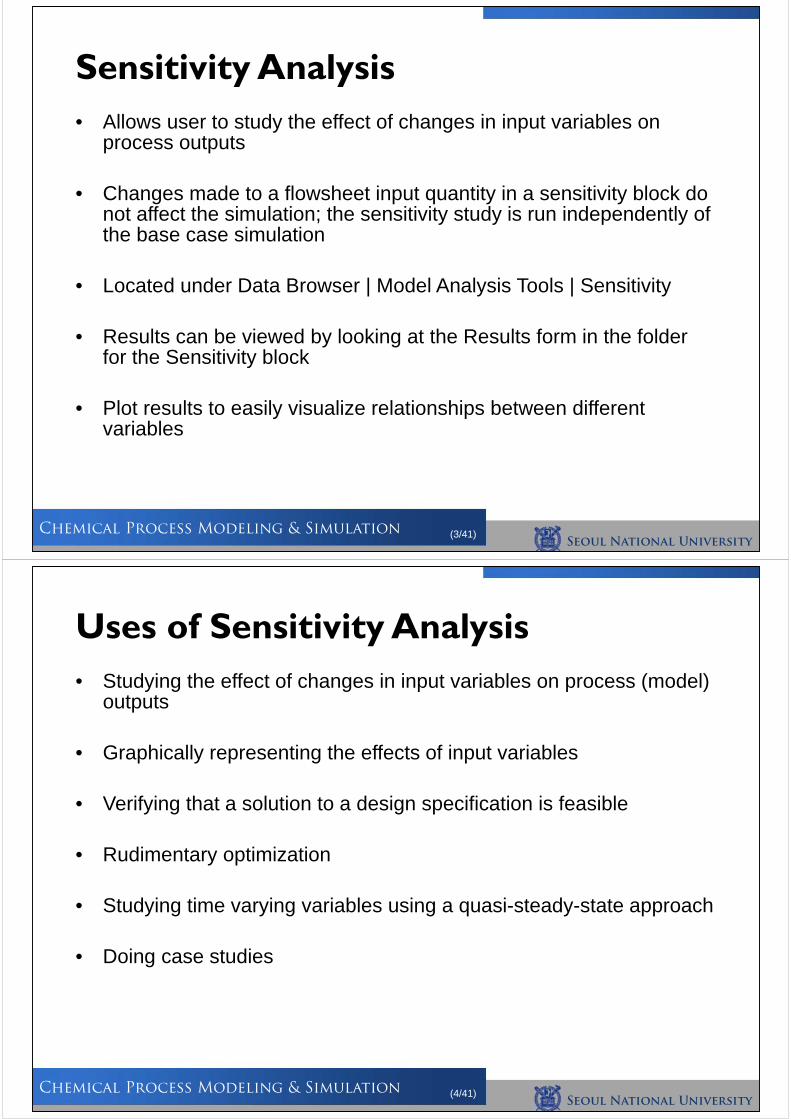
• Use a sensitivity analysis to study relationships between process variables
• Introduce the use of design specifications to meet process design requirements
• Introduce usage of Microsoft Excel and Fortran Calculator blocks
Lesson Objectives
Seoul National University
Chemical Process Modeling & Simulation (3/41)
• Allows user to study the effect of changes in input variables on process outputs
• Changes made to a flowsheet input quantity in a sensitivity block do not affect the simulation; the sensitivity study is run independently of the base case simulation
• Located under Data Browser | Model Analysis Tools | Sensitivity
• Results can be viewed by looking at the Results form in the folder for the Sensitivity block
• Plot results to easily visualize relationships between different variables
Sensitivity Analysis
Seoul National University
Chemical Process Modeling & Simulation (4/41)
• Studying the effect of changes in input variables on process (model) outputs
• Graphically representing the effects of input variables
• Verifying that a solution to a design specification is feasible
• Rudimentary optimization
• Studying time varying variables using a quasi-steady-state approach
• Doing case studies
Uses of Sensitivity Analysis
Seoul National University
Chemical Process Modeling & Simulation (5/41)
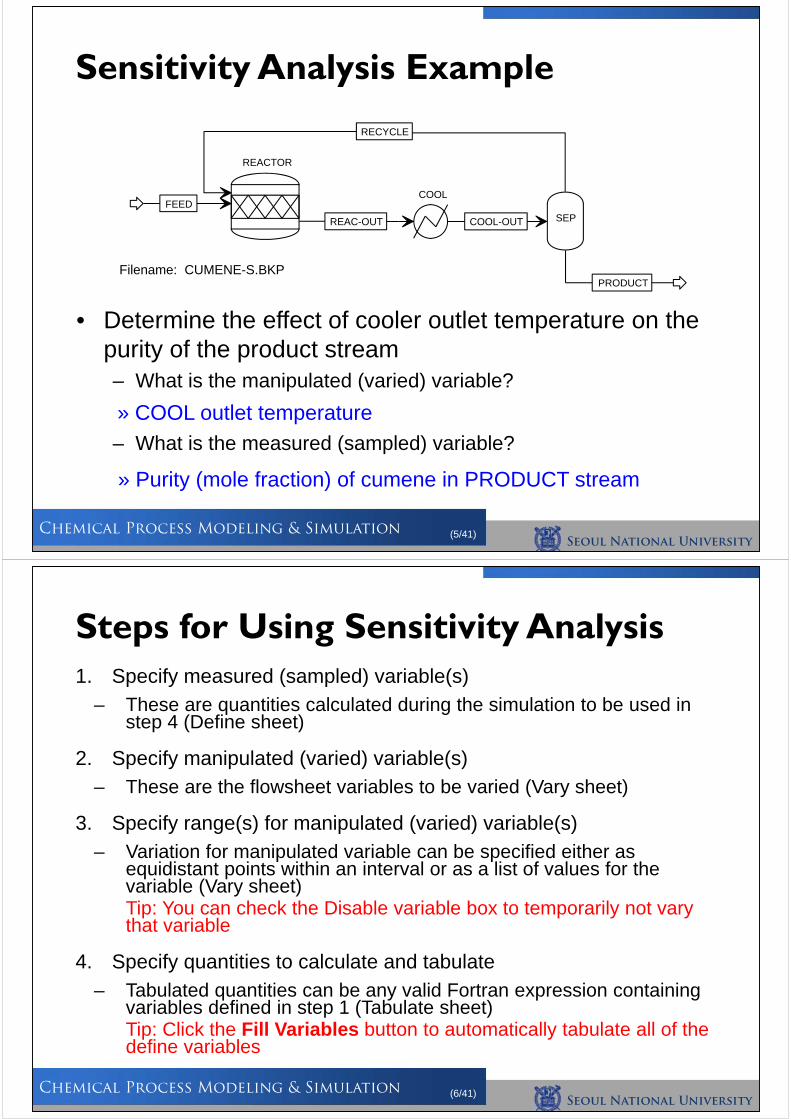
Sensitivity Analysis Example
• Determine the effect of cooler outlet temperature on the purity of the product stream– What is the manipulated (varied) variable?
– What is the measured (sampled) variable?
Filename: CUMENE-S.BKP
» COOL outlet temperature
» Purity (mole fraction) of cumene in PRODUCT stream
REACTOR
FEED
RECYCLE
REAC-OUT
COOL
COOL-OUT SEP
PRODUCT
Seoul National University
Chemical Process Modeling & Simulation (6/41)
1. Specify measured (sampled) variable(s)
– These are quantities calculated during the simulation to be used in step 4 (Define sheet)
2. Specify manipulated (varied) variable(s)
– These are the flowsheet variables to be varied (Vary sheet)
3. Specify range(s) for manipulated (varied) variable(s)
– Variation for manipulated variable can be specified either as equidistant points within an interval or as a list of values for the variable (Vary sheet)Tip: You can check the Disable variable box to temporarily not vary that variable
4. Specify quantities to calculate and tabulate
– Tabulated quantities can be any valid Fortran expression containing variables defined in step 1 (Tabulate sheet)Tip: Click the Fill Variables button to automatically tabulate all of the define variables
Steps for Using Sensitivity Analysis
Seoul National University
Chemical Process Modeling & Simulation (7/41)
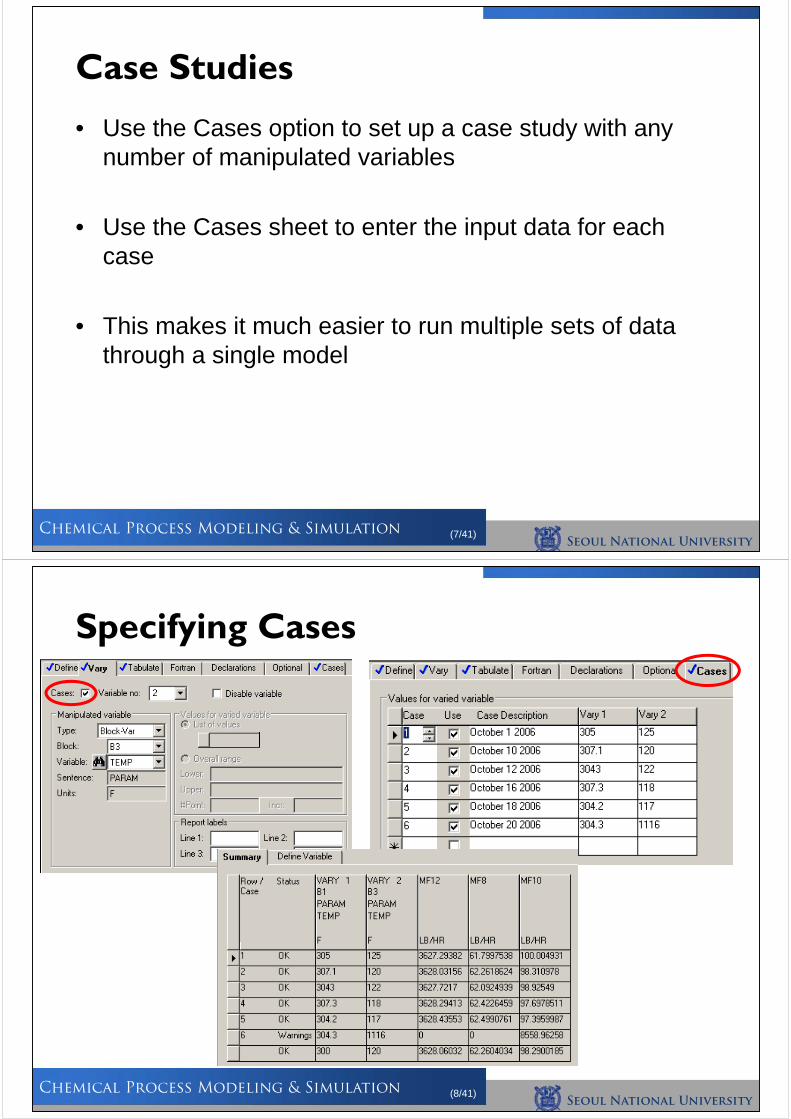
• Use the Cases option to set up a case study with any number of manipulated variables
• Use the Cases sheet to enter the input data for each case
• This makes it much easier to run multiple sets of data through a single model
Case Studies
Seoul National University
Chemical Process Modeling & Simulation (8/41)
Specifying Cases
Seoul National University
Chemical Process Modeling & Simulation (9/41)
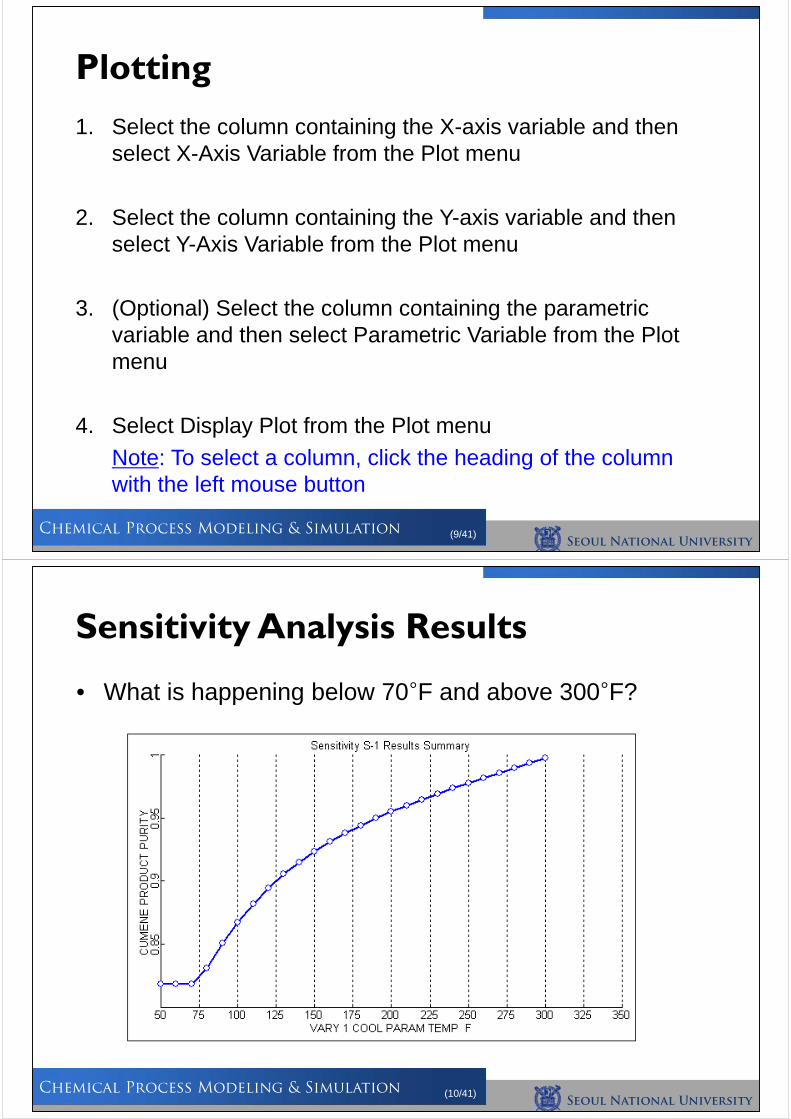
1. Select the column containing the X-axis variable and then select X-Axis Variable from the Plot menu
2. Select the column containing the Y-axis variable and then select Y-Axis Variable from the Plot menu
3. (Optional) Select the column containing the parametric variable and then select Parametric Variable from the Plot menu
4. Select Display Plot from the Plot menu
Note: To select a column, click the heading of the column with the left mouse button
Plotting
Seoul National University
Chemical Process Modeling & Simulation (10/41)
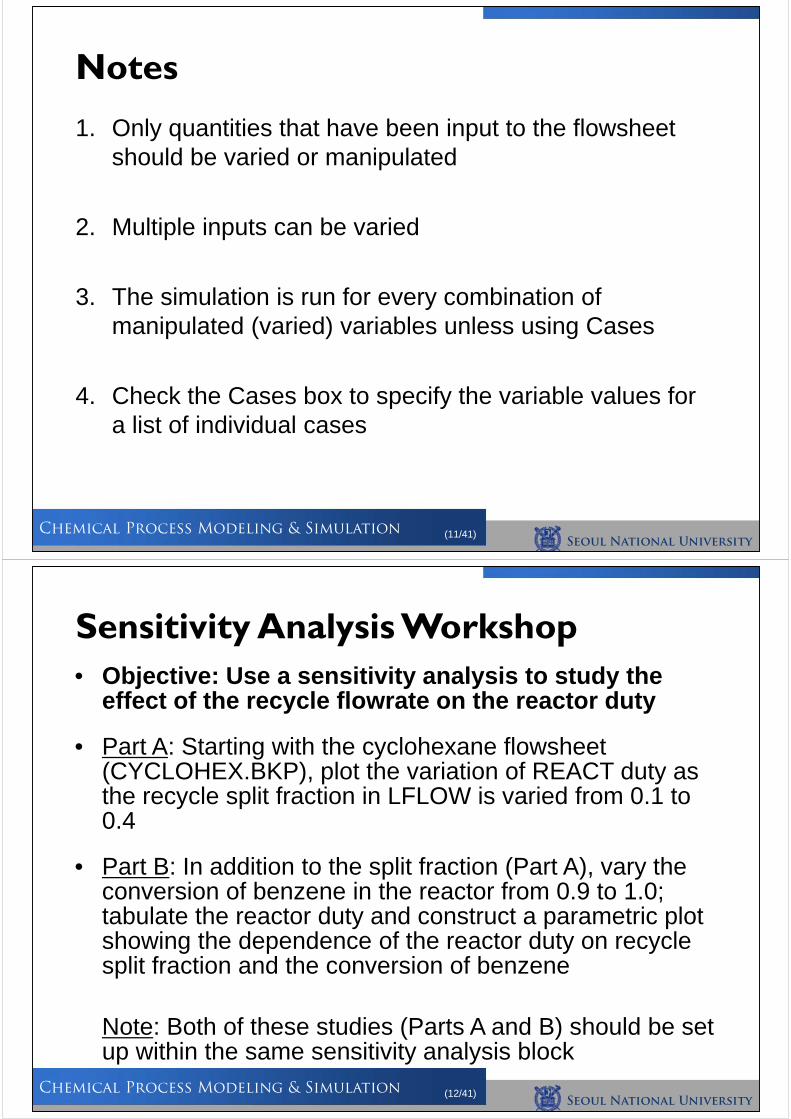
Sensitivity Analysis Results
• What is happening below 70°F and above 300°F?
Seoul National University
Chemical Process Modeling & Simulation (11/41)
1. Only quantities that have been input to the flowsheetshould be varied or manipulated
2. Multiple inputs can be varied
3. The simulation is run for every combination of manipulated (varied) variables unless using Cases
4. Check the Cases box to specify the variable values for a list of individual cases
Notes
Seoul National University
Chemical Process Modeling & Simulation (12/41)
• Objective: Use a sensitivity analysis to study the effect of the recycle flowrate on the reactor duty
• Part A: Starting with the cyclohexane flowsheet(CYCLOHEX.BKP), plot the variation of REACT duty as the recycle split fraction in LFLOW is varied from 0.1 to 0.4
• Part B: In addition to the split fraction (Part A), vary the conversion of benzene in the reactor from 0.9 to 1.0; tabulate the reactor duty and construct a parametric plot showing the dependence of the reactor duty on recycle split fraction and the conversion of benzene
Note: Both of these studies (Parts A and B) should be set up within the same sensitivity analysis block
Sensitivity Analysis Workshop
Seoul National University
Chemical Process Modeling & Simulation (13/41)
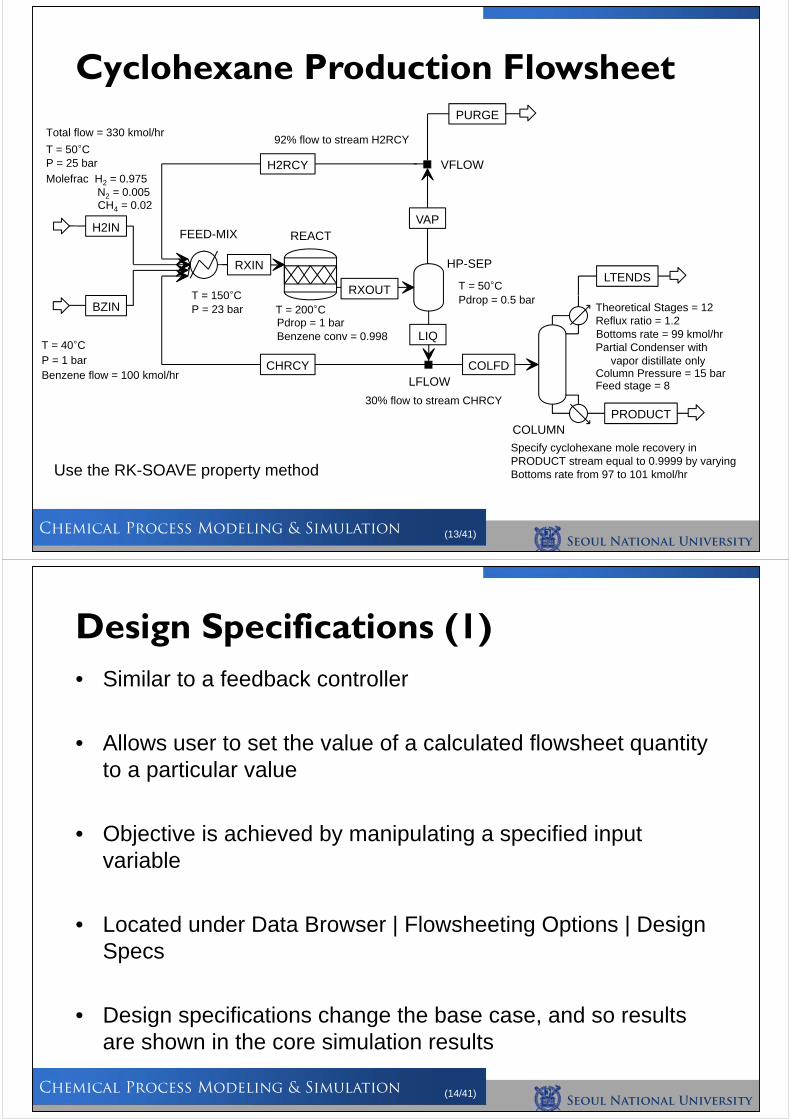
Cyclohexane Production Flowsheet
Use the RK-SOAVE property method
P = 25 barT = 50°C
Molefrac H2 = 0.975N2 = 0.005CH4 = 0.02
Total flow = 330 kmol/hr
T = 40°CP = 1 barBenzene flow = 100 kmol/hr
T = 150°CP = 23 bar T = 200°C
Pdrop = 1 barBenzene conv = 0.998
T = 50°CPdrop = 0.5 bar
92% flow to stream H2RCY
30% flow to stream CHRCY
Specify cyclohexane mole recovery in PRODUCT stream equal to 0.9999 by varying Bottoms rate from 97 to 101 kmol/hr
REACTFEED-MIXH2IN
BZIN
H2RCY
CHRCY
RXIN
RXOUT
HP-SEP
VAP
Bottoms rate = 99 kmol/hr
Theoretical Stages = 12Reflux ratio = 1.2
Partial Condenser with vapor distillate only
Column Pressure = 15 barFeed stage = 8
COLUMN
COLFD
LTENDS
PRODUCT
VFLOW
PURGE
LFLOW
LIQ
Seoul National University
Chemical Process Modeling & Simulation (14/41)
• Similar to a feedback controller
• Allows user to set the value of a calculated flowsheet quantity to a particular value
• Objective is achieved by manipulating a specified input variable
• Located under Data Browser | Flowsheeting Options | Design Specs
• Design specifications change the base case, and so results are shown in the core simulation results
Design Specifications (1)
Seoul National University
Chemical Process Modeling & Simulation (15/41)
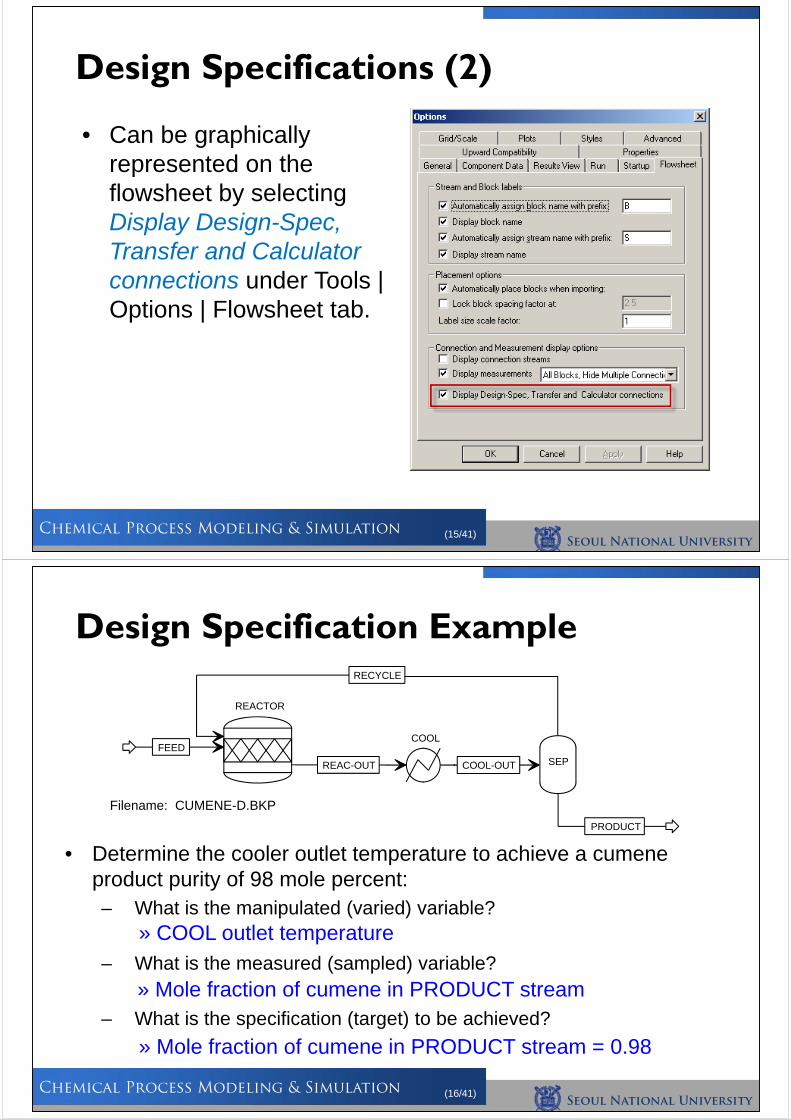
Design Specifications (2)
• Can be graphically represented on the flowsheet by selecting Display Design-Spec, Transfer and Calculator connections under Tools | Options | Flowsheet tab.
Seoul National University
Chemical Process Modeling & Simulation (16/41)
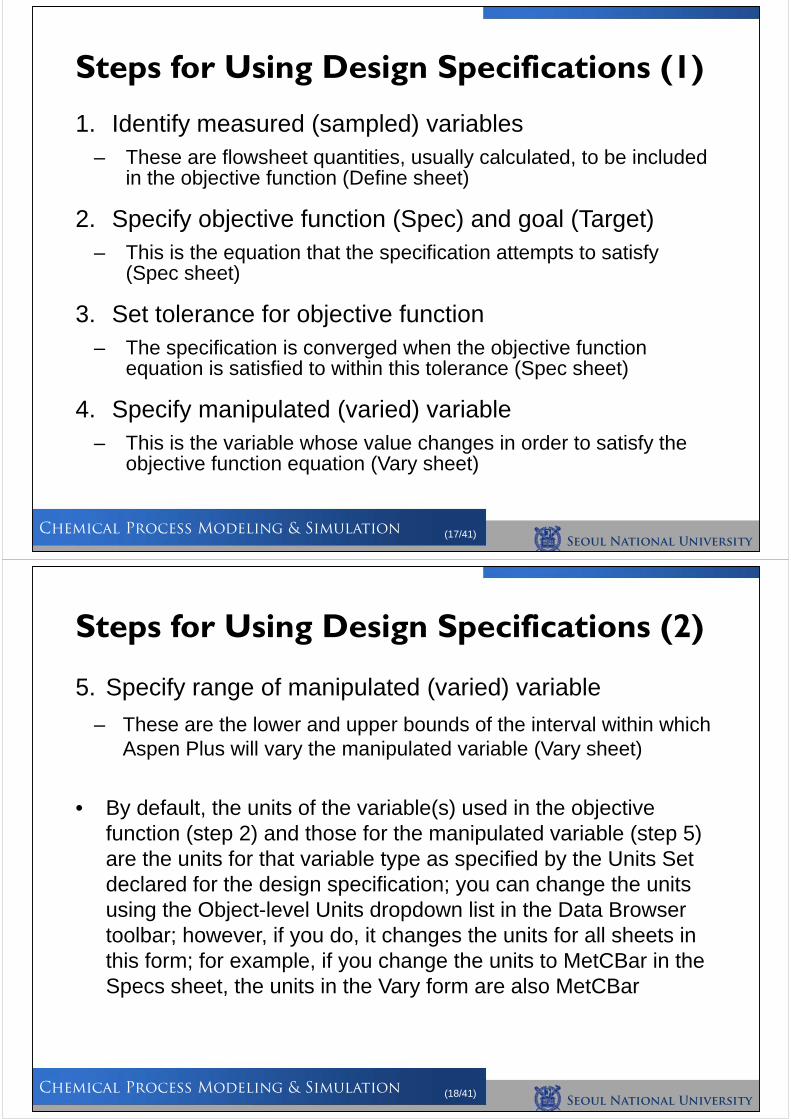
Design Specification Example
• Determine the cooler outlet temperature to achieve a cumene product purity of 98 mole percent:– What is the manipulated (varied) variable?
– What is the measured (sampled) variable?
– What is the specification (target) to be achieved?
Filename: CUMENE-D.BKP
» COOL outlet temperature
» Mole fraction of cumene in PRODUCT stream
» Mole fraction of cumene in PRODUCT stream = 0.98
REACTOR
FEED
RECYCLE
REAC-OUT
COOL
COOL-OUT SEP
PRODUCT
Seoul National University
Chemical Process Modeling & Simulation (17/41)
1. Identify measured (sampled) variables– These are flowsheet quantities, usually calculated, to be included
in the objective function (Define sheet)
2. Specify objective function (Spec) and goal (Target)– This is the equation that the specification attempts to satisfy
(Spec sheet)
3. Set tolerance for objective function– The specification is converged when the objective function
equation is satisfied to within this tolerance (Spec sheet)
4. Specify manipulated (varied) variable– This is the variable whose value changes in order to satisfy the
objective function equation (Vary sheet)
Steps for Using Design Specifications (1)
Seoul National University
Chemical Process Modeling & Simulation (18/41)
5. Specify range of manipulated (varied) variable
– These are the lower and upper bounds of the interval within which Aspen Plus will vary the manipulated variable (Vary sheet)
• By default, the units of the variable(s) used in the objective function (step 2) and those for the manipulated variable (step 5) are the units for that variable type as specified by the Units Set declared for the design specification; you can change the units using the Object-level Units dropdown list in the Data Browser toolbar; however, if you do, it changes the units for all sheets in this form; for example, if you change the units to MetCBar in the Specs sheet, the units in the Vary form are also MetCBar
Steps for Using Design Specifications (2)
Seoul National University
Chemical Process Modeling & Simulation (19/41)
1. Only quantities that have been input to the flowsheet should be manipulated
2. The calculations performed by a design specification are iterative; providing a good estimate for the manipulated variable will help the design specification converge in fewer iterations; this is especially important for large flowsheetswith several interrelated design specifications
3. The results of a design specification can be found under Results Summary | Convergence or Convergence | Convergence and by choosing the Results form in the appropriate solver block; alternatively, the final values of the manipulated and/or sampled variables can be viewed directly on the appropriate Stream or Block Results forms
Notes (1)
Seoul National University
Chemical Process Modeling & Simulation (20/41)
4. If a design-spec does not converge:i. Check to see that the manipulated variable is not at its lower or
upper bound
ii. Verify that a solution exists within the bounds specified for the manipulated variable, perhaps by performing a sensitivity analysis
iii. Ensure that the manipulated variable does indeed affect the value of the sampled variables
iv. Provide a better estimate for the value of the manipulated variable
v. Narrow the bounds of the manipulated variable or loosening the tolerance on the objective function to help convergence
vi. Make sure that the objective function does not have a flat region within the range of the manipulated variable
vii. Change the characteristics of the convergence block associated with the design-spec (step size, number iterations, algorithm, etc.)
Notes (2)
Seoul National University
Chemical Process Modeling & Simulation (21/41)
Design Specification Workshop
• Objective: Use a design specification in the cyclohexane flowsheet to fix the heat load on the reactor by varying the recycle flowrate– The cyclohexane production flowsheet (CYCLOHEX.BKP) is a
model of an existing plant; the cooling system around the reactor can handle a maximum operating load of 4.7 Gcal/hr; determine the amount of cyclohexane recycle necessary to keep the cooling load on the reactor to this amount: ________ kmol/hr
Note: The heat convention used in Aspen Plus is that heat input to a block is positive, and heat removed from a block is negative
Seoul National University
Chemical Process Modeling & Simulation (22/41)
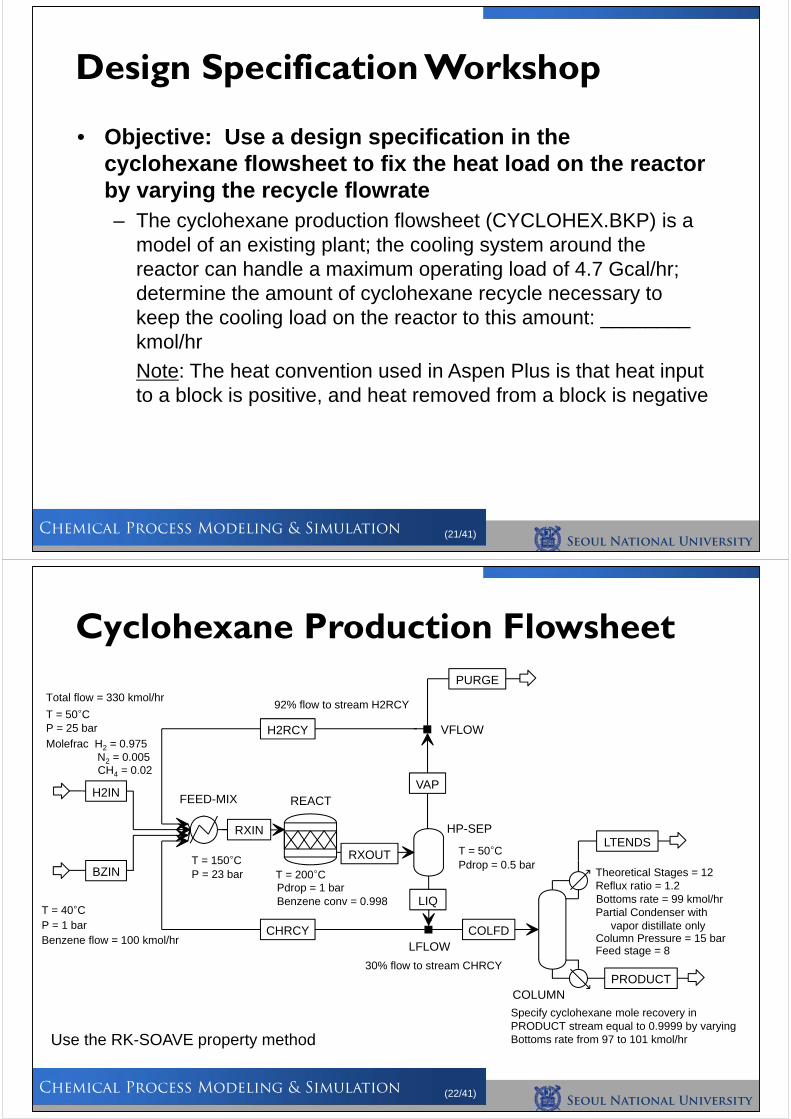
Cyclohexane Production Flowsheet
Use the RK-SOAVE property method
P = 25 barT = 50°C
Molefrac H2 = 0.975N2 = 0.005CH4 = 0.02
Total flow = 330 kmol/hr
T = 40°CP = 1 barBenzene flow = 100 kmol/hr
T = 150°CP = 23 bar T = 200°C
Pdrop = 1 barBenzene conv = 0.998
T = 50°CPdrop = 0.5 bar
92% flow to stream H2RCY
30% flow to stream CHRCY
Specify cyclohexane mole recovery in PRODUCT stream equal to 0.9999 by varying Bottoms rate from 97 to 101 kmol/hr
REACTFEED-MIXH2IN
BZIN
H2RCY
CHRCY
RXIN
RXOUT
HP-SEP
VAP
Bottoms rate = 99 kmol/hr
Theoretical Stages = 12Reflux ratio = 1.2
Partial Condenser with vapor distillate only
Column Pressure = 15 barFeed stage = 8
COLUMN
COLFD
LTENDS
PRODUCT
VFLOW
PURGE
LFLOW
LIQ
Seoul National University
Chemical Process Modeling & Simulation (23/41)
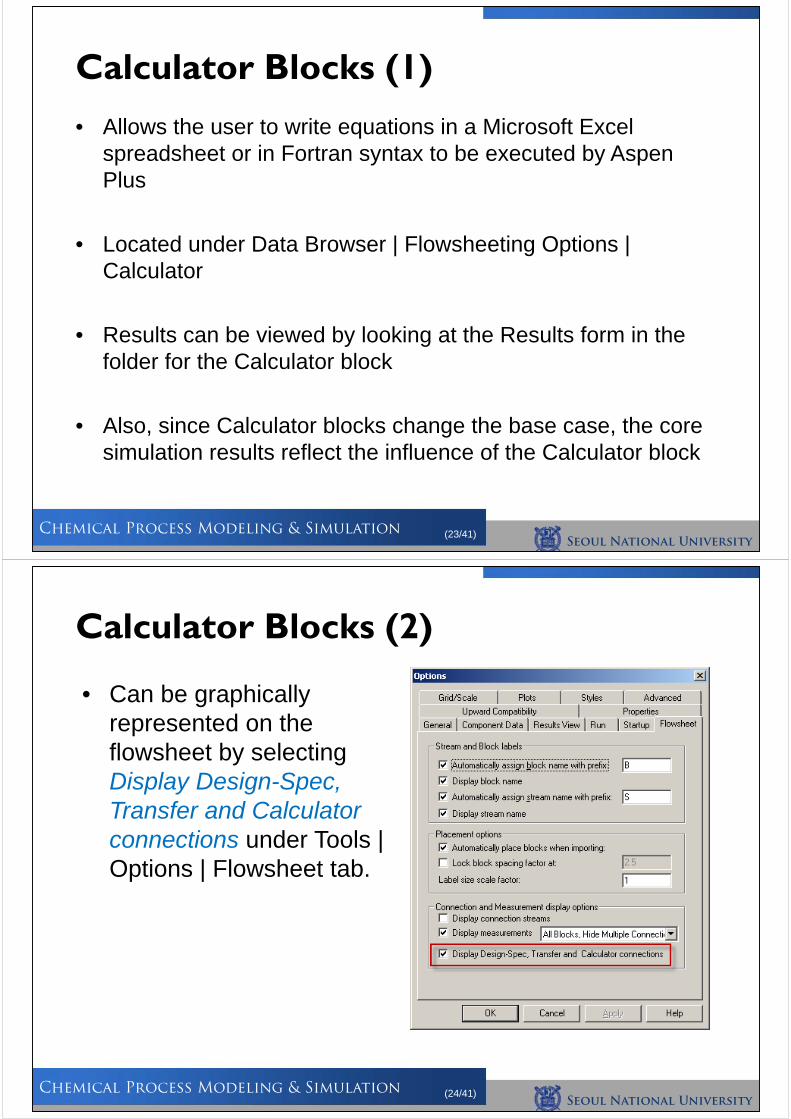
• Allows the user to write equations in a Microsoft Excel spreadsheet or in Fortran syntax to be executed by Aspen Plus
• Located under Data Browser | Flowsheeting Options | Calculator
• Results can be viewed by looking at the Results form in the folder for the Calculator block
• Also, since Calculator blocks change the base case, the core simulation results reflect the influence of the Calculator block
Calculator Blocks (1)
Seoul National University
Chemical Process Modeling & Simulation (24/41)
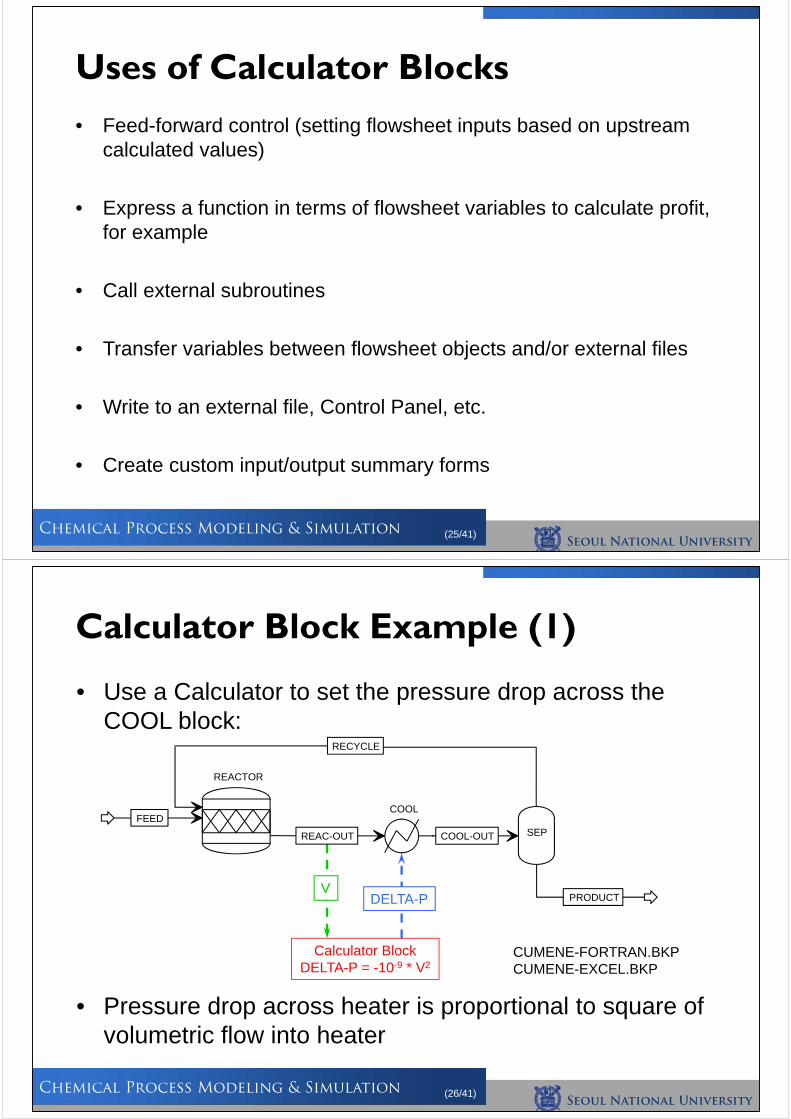
Calculator Blocks (2)
• Can be graphically represented on the flowsheet by selecting Display Design-Spec, Transfer and Calculator connections under Tools | Options | Flowsheet tab.
Seoul National University
Chemical Process Modeling & Simulation (25/41)
• Feed-forward control (setting flowsheet inputs based on upstream calculated values)
• Express a function in terms of flowsheet variables to calculate profit, for example
• Call external subroutines
• Transfer variables between flowsheet objects and/or external files
• Write to an external file, Control Panel, etc.
• Create custom input/output summary forms
Uses of Calculator Blocks
Seoul National University
Chemical Process Modeling & Simulation (26/41)
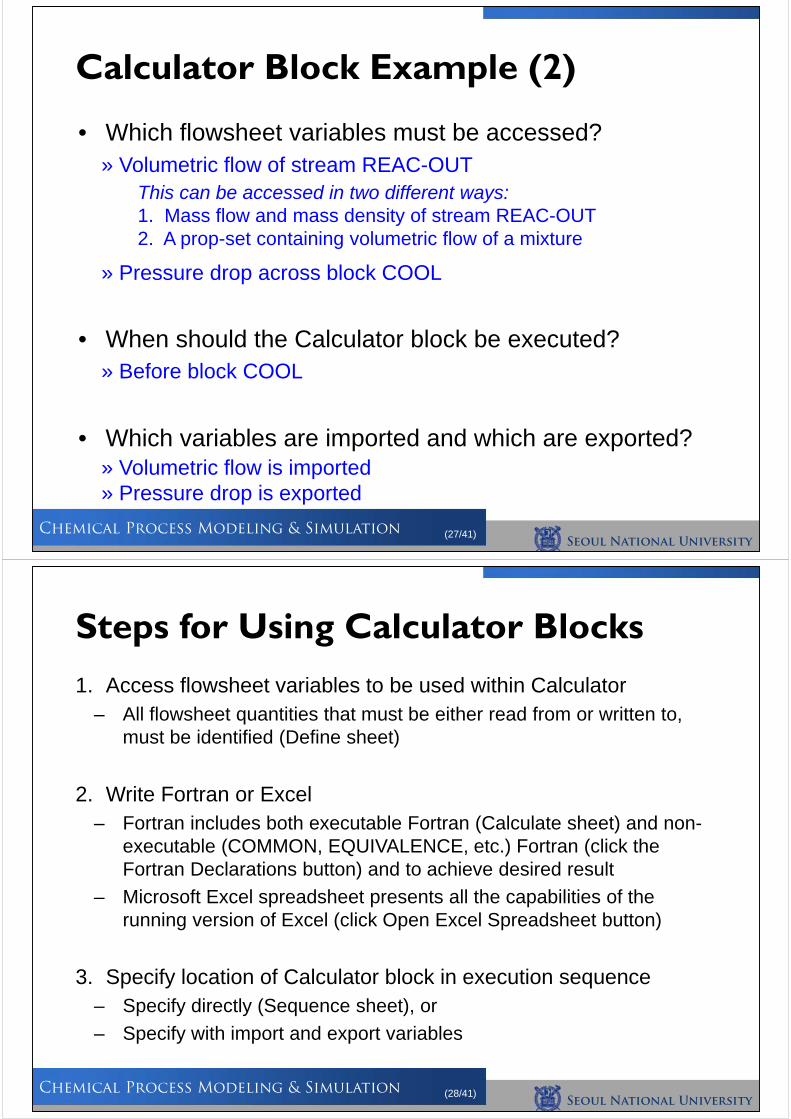
Calculator Block Example (1)
• Use a Calculator to set the pressure drop across the COOL block:
• Pressure drop across heater is proportional to square of volumetric flow into heater
Calculator BlockDELTA-P = -10-9 * V2
CUMENE-FORTRAN.BKPCUMENE-EXCEL.BKP
DELTA-P
REACTOR
FEED
RECYCLE
REAC-OUT
COOL
COOL-OUT SEP
PRODUCTV
Seoul National University
Chemical Process Modeling & Simulation (27/41)
Calculator Block Example (2)
• Which flowsheet variables must be accessed?
• When should the Calculator block be executed?
• Which variables are imported and which are exported?
» Volumetric flow of stream REAC-OUTThis can be accessed in two different ways:1. Mass flow and mass density of stream REAC-OUT2. A prop-set containing volumetric flow of a mixture
» Pressure drop across block COOL
» Before block COOL
» Volumetric flow is imported» Pressure drop is exported
Seoul National University
Chemical Process Modeling & Simulation (28/41)
1. Access flowsheet variables to be used within Calculator– All flowsheet quantities that must be either read from or written to,
must be identified (Define sheet)
2. Write Fortran or Excel– Fortran includes both executable Fortran (Calculate sheet) and non-
executable (COMMON, EQUIVALENCE, etc.) Fortran (click the Fortran Declarations button) and to achieve desired result
– Microsoft Excel spreadsheet presents all the capabilities of the running version of Excel (click Open Excel Spreadsheet button)
3. Specify location of Calculator block in execution sequence– Specify directly (Sequence sheet), or
– Specify with import and export variables
Steps for Using Calculator Blocks
Seoul National University
Chemical Process Modeling & Simulation (29/41)
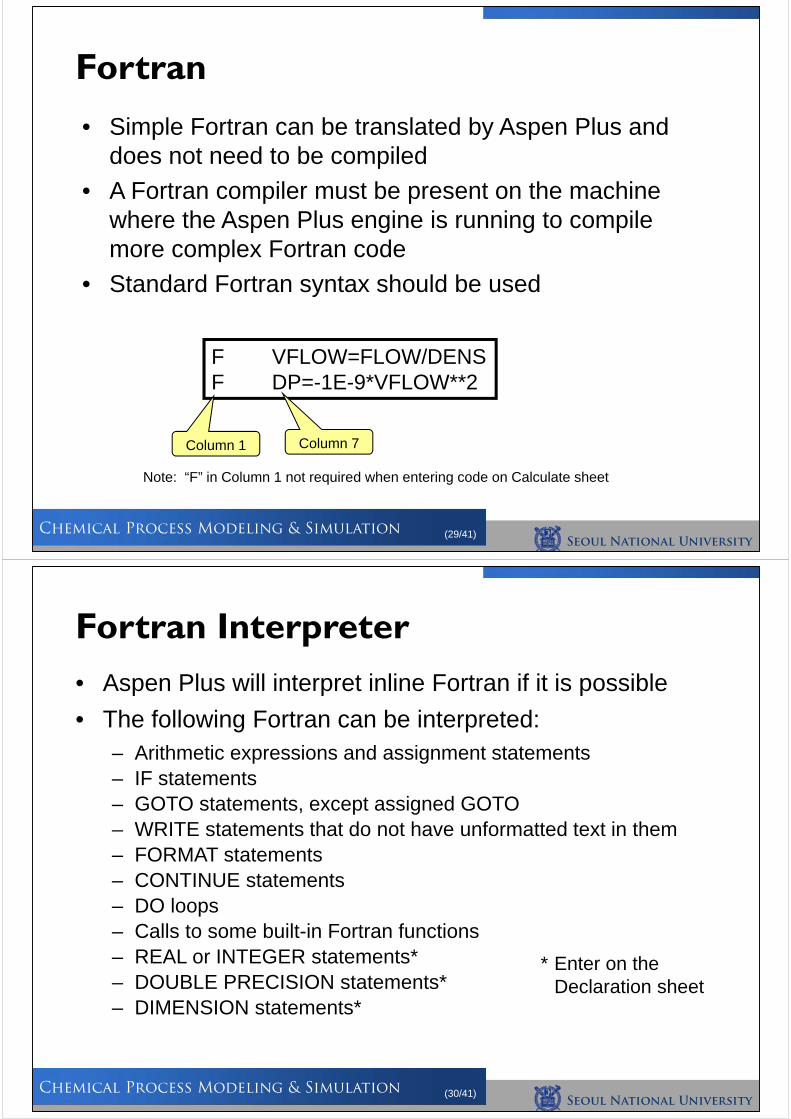
• Simple Fortran can be translated by Aspen Plus and does not need to be compiled
• A Fortran compiler must be present on the machine where the Aspen Plus engine is running to compile more complex Fortran code
• Standard Fortran syntax should be used
Fortran
F VFLOW=FLOW/DENSF DP=-1E-9*VFLOW**2
Note: “F” in Column 1 not required when entering code on Calculate sheet
Column 1 Column 7
Seoul National University
Chemical Process Modeling & Simulation (30/41)
• Aspen Plus will interpret inline Fortran if it is possible
• The following Fortran can be interpreted:– Arithmetic expressions and assignment statements– IF statements– GOTO statements, except assigned GOTO– WRITE statements that do not have unformatted text in them– FORMAT statements– CONTINUE statements– DO loops– Calls to some built-in Fortran functions– REAL or INTEGER statements*– DOUBLE PRECISION statements* – DIMENSION statements*
Fortran Interpreter
* Enter on the Declaration sheet
Seoul National University
Chemical Process Modeling & Simulation (31/41)
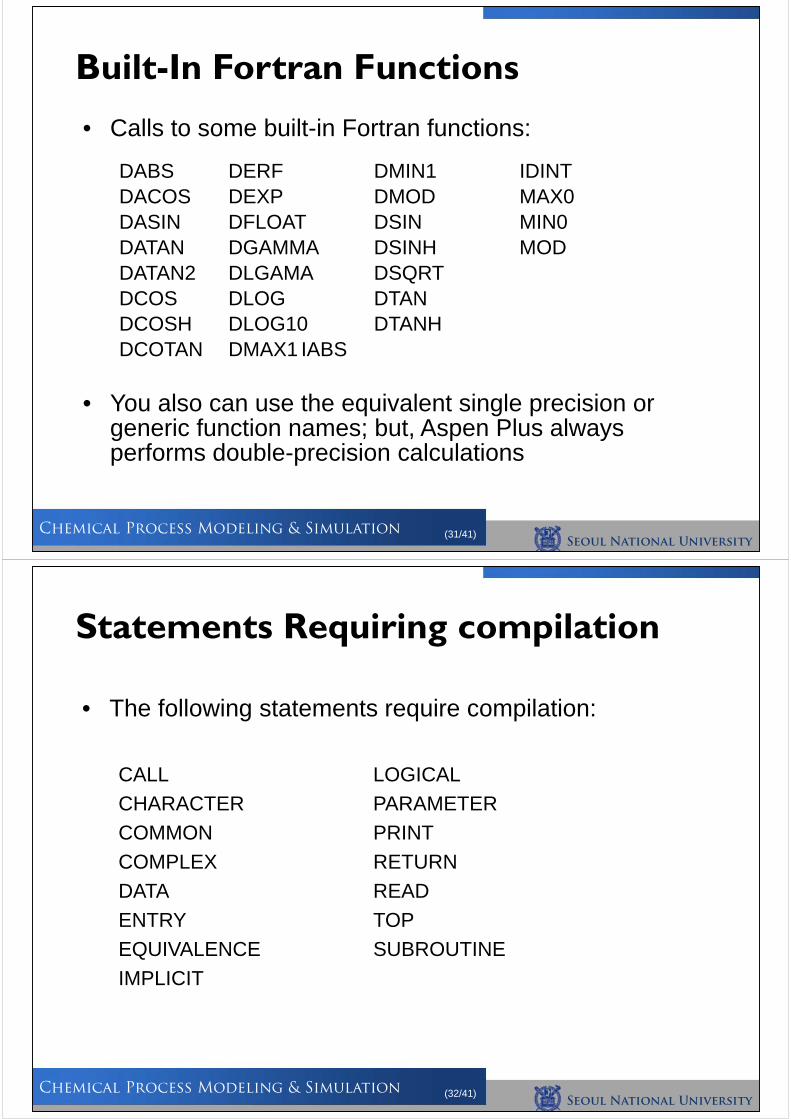
Built-In Fortran Functions
• Calls to some built-in Fortran functions:
DABS DERF DMIN1 IDINTDACOS DEXP DMOD MAX0DASIN DFLOAT DSIN MIN0DATAN DGAMMA DSINH MODDATAN2 DLGAMA DSQRTDCOS DLOG DTANDCOSH DLOG10 DTANHDCOTAN DMAX1 IABS
• You also can use the equivalent single precision or generic function names; but, Aspen Plus always performs double-precision calculations
Seoul National University
Chemical Process Modeling & Simulation (32/41)
Statements Requiring compilation
• The following statements require compilation:
CALL LOGICAL
CHARACTER PARAMETER
COMMON PRINT
COMPLEX RETURN
DATA READ
ENTRY TOP
EQUIVALENCE SUBROUTINE
IMPLICIT
Seoul National University
Chemical Process Modeling & Simulation (33/41)
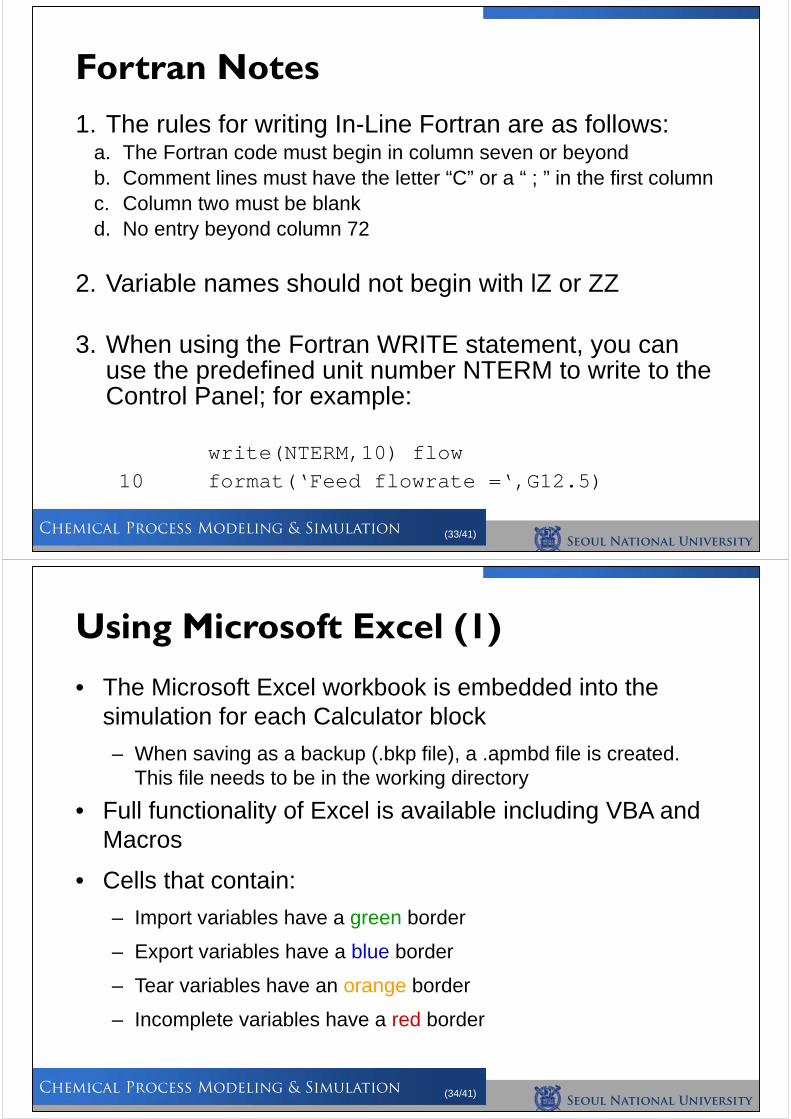
1. The rules for writing In-Line Fortran are as follows:a. The Fortran code must begin in column seven or beyondb. Comment lines must have the letter “C” or a “ ; ” in the first columnc. Column two must be blankd. No entry beyond column 72
2. Variable names should not begin with lZ or ZZ
3. When using the Fortran WRITE statement, you can use the predefined unit number NTERM to write to the Control Panel; for example:
write(NTERM,10) flow10 format(‘Feed flowrate =‘,G12.5)
Fortran Notes
Seoul National University
Chemical Process Modeling & Simulation (34/41)
• The Microsoft Excel workbook is embedded into the simulation for each Calculator block
– When saving as a backup (.bkp file), a .apmbd file is created. This file needs to be in the working directory
• Full functionality of Excel is available including VBA and Macros
• Cells that contain:
– Import variables have a green border
– Export variables have a blue border
– Tear variables have an orange border
– Incomplete variables have a red border
Using Microsoft Excel (1)
Seoul National University
Chemical Process Modeling & Simulation (35/41)
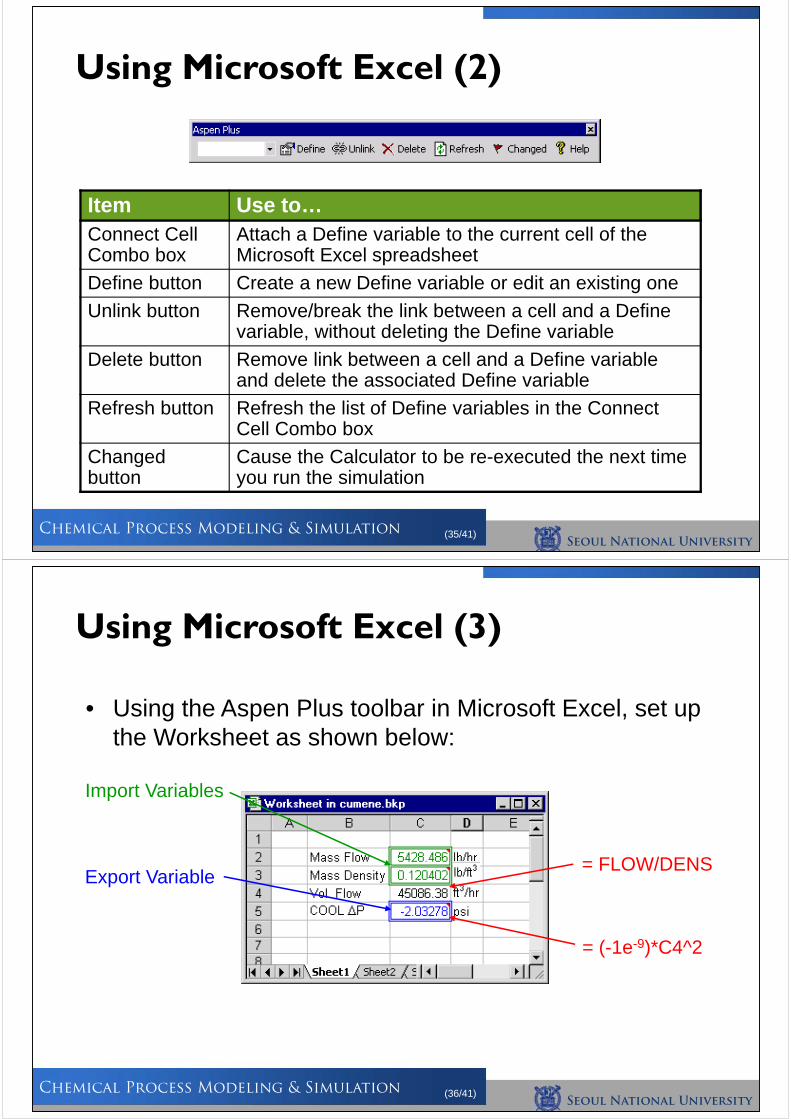
Using Microsoft Excel (2)
Item Use to…Connect Cell Combo box
Attach a Define variable to the current cell of the Microsoft Excel spreadsheet
Define button Create a new Define variable or edit an existing one
Unlink button Remove/break the link between a cell and a Define variable, without deleting the Define variable
Delete button Remove link between a cell and a Define variable and delete the associated Define variable
Refresh button Refresh the list of Define variables in the Connect Cell Combo box
Changed button
Cause the Calculator to be re-executed the next time you run the simulation
Seoul National University
Chemical Process Modeling & Simulation (36/41)
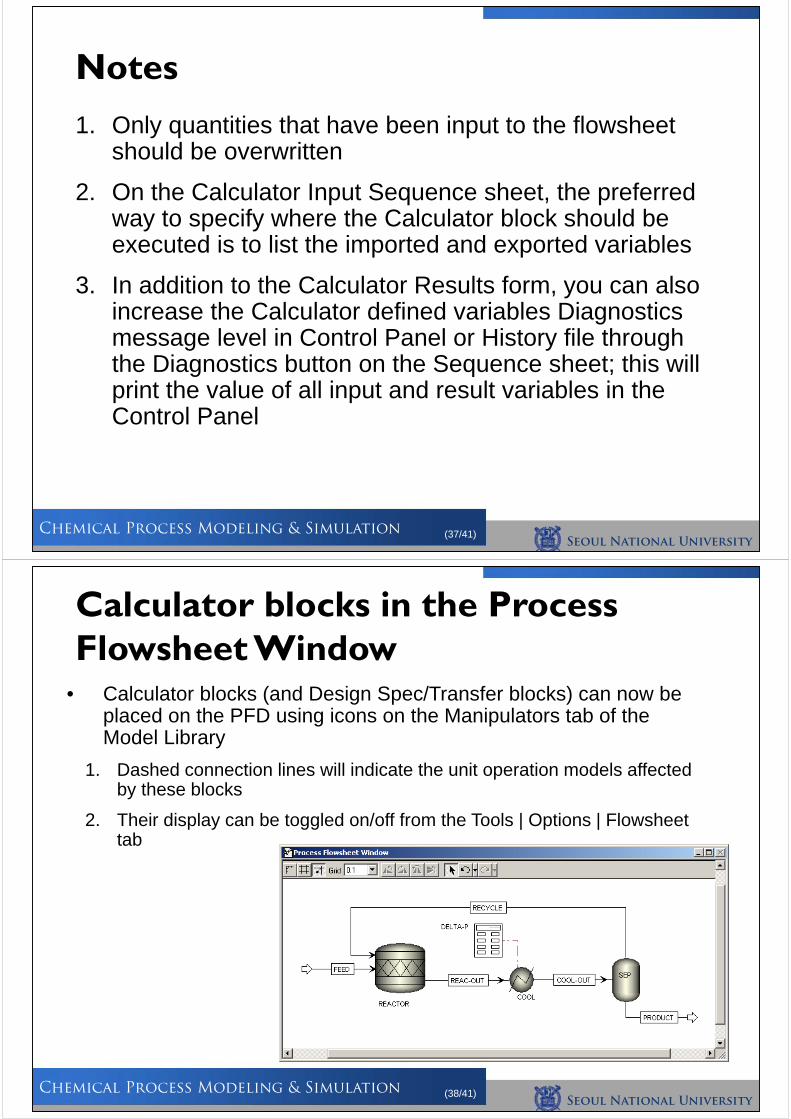
Using Microsoft Excel (3)
Import Variables
Export Variable
= (-1e-9)*C4^2
= FLOW/DENS
• Using the Aspen Plus toolbar in Microsoft Excel, set up the Worksheet as shown below:
Seoul National University
Chemical Process Modeling & Simulation (37/41)
1. Only quantities that have been input to the flowsheetshould be overwritten
2. On the Calculator Input Sequence sheet, the preferred way to specify where the Calculator block should be executed is to list the imported and exported variables
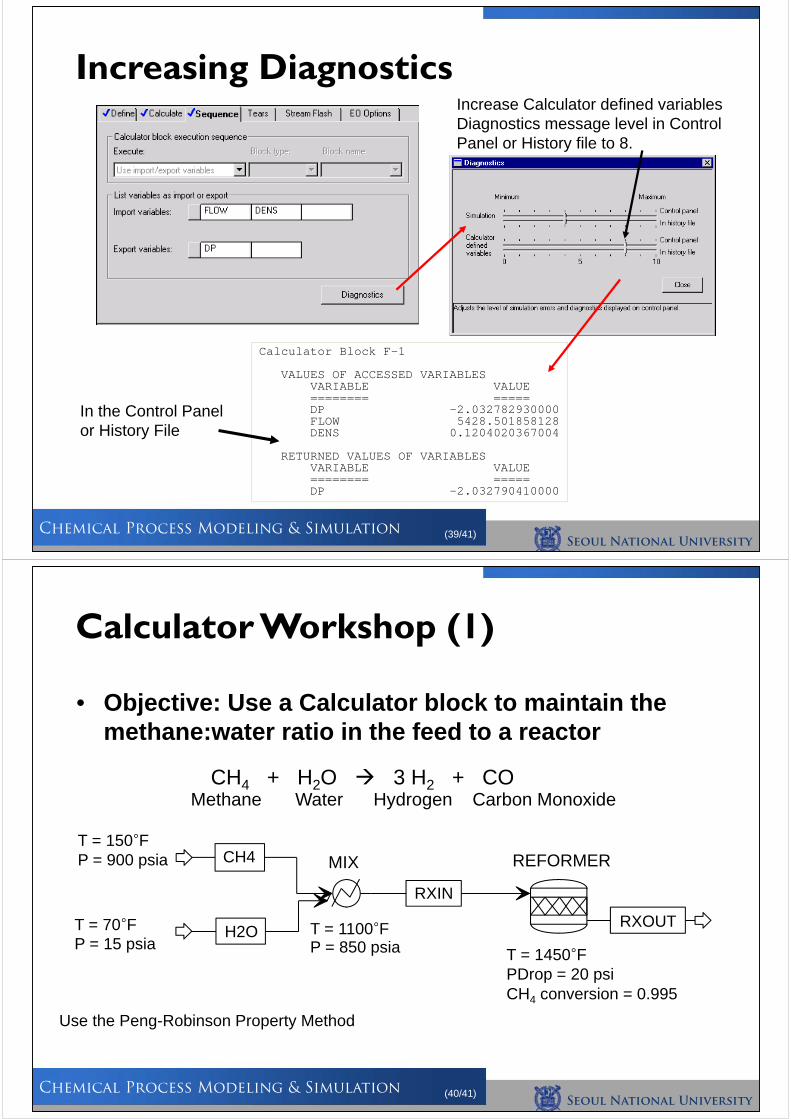
3. In addition to the Calculator Results form, you can also increase the Calculator defined variables Diagnostics message level in Control Panel or History file through the Diagnostics button on the Sequence sheet; this will print the value of all input and result variables in the Control Panel
Notes
Seoul National University
Chemical Process Modeling & Simulation (38/41)
Calculator blocks in the Process Flowsheet Window
• Calculator blocks (and Design Spec/Transfer blocks) can now be placed on the PFD using icons on the Manipulators tab of the Model Library
1. Dashed connection lines will indicate the unit operation models affected by these blocks
2. Their display can be toggled on/off from the Tools | Options | Flowsheettab
Seoul National University
Chemical Process Modeling & Simulation (39/41)
Increasing Diagnostics
Calculator Block F-1
VALUES OF ACCESSED VARIABLESVARIABLE VALUE======== =====DP -2.032782930000FLOW 5428.501858128DENS 0.1204020367004
RETURNED VALUES OF VARIABLESVARIABLE VALUE======== =====DP -2.032790410000
Increase Calculator defined variables Diagnostics message level in Control Panel or History file to 8.
In the Control Panel or History File
Seoul National University
Chemical Process Modeling & Simulation (40/41)
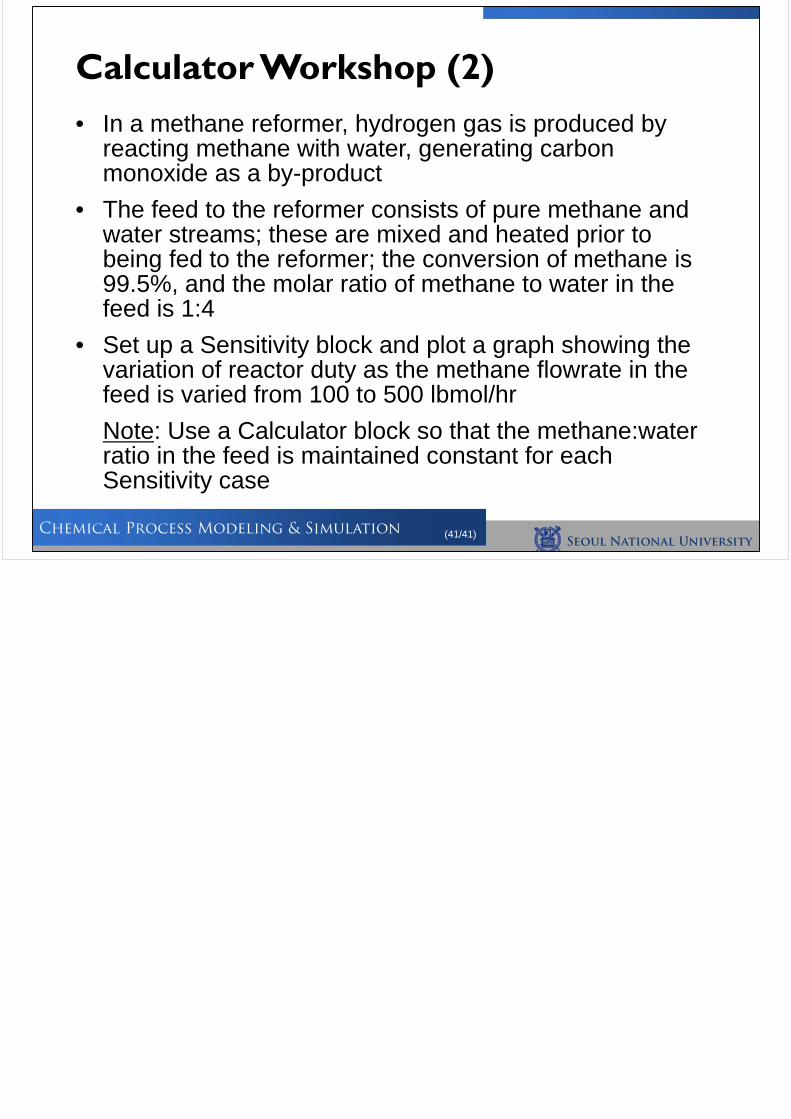
Calculator Workshop (1)
• Objective: Use a Calculator block to maintain the methane:water ratio in the feed to a reactor
CH4 + H2O 3 H2 + COMethane Water Hydrogen Carbon Monoxide
T = 150°FP = 900 psia
T = 70°FP = 15 psia
T = 1100°FP = 850 psia T = 1450°F
PDrop = 20 psiCH4 conversion = 0.995
Use the Peng-Robinson Property Method
MIXCH4
H2O
RXIN
REFORMER
RXOUT
Seoul National University
Chemical Process Modeling & Simulation (41/41)
• In a methane reformer, hydrogen gas is produced by reacting methane with water, generating carbon monoxide as a by-product
• The feed to the reformer consists of pure methane and water streams; these are mixed and heated prior to being fed to the reformer; the conversion of methane is 99.5%, and the molar ratio of methane to water in the feed is 1:4
• Set up a Sensitivity block and plot a graph showing the variation of reactor duty as the methane flowrate in the feed is varied from 100 to 500 lbmol/hr
Note: Use a Calculator block so that the methane:waterratio in the feed is maintained constant for each Sensitivity case
Calculator Workshop (2)
Seo
ul N
at
io
na
l U
niv
er
sit
y
Ch
em
ic
al Pr
oc
ess M
od
elin
g &
Sim
ulatio
n
Process Modeling Using Aspen Plus(Flowsheet Convergence)
TA : Ikhyun KimInstructor : En Sup Yoon
Spring Semester, 2012
Seoul National University
Chemical Process Modeling & Simulation (2/13)
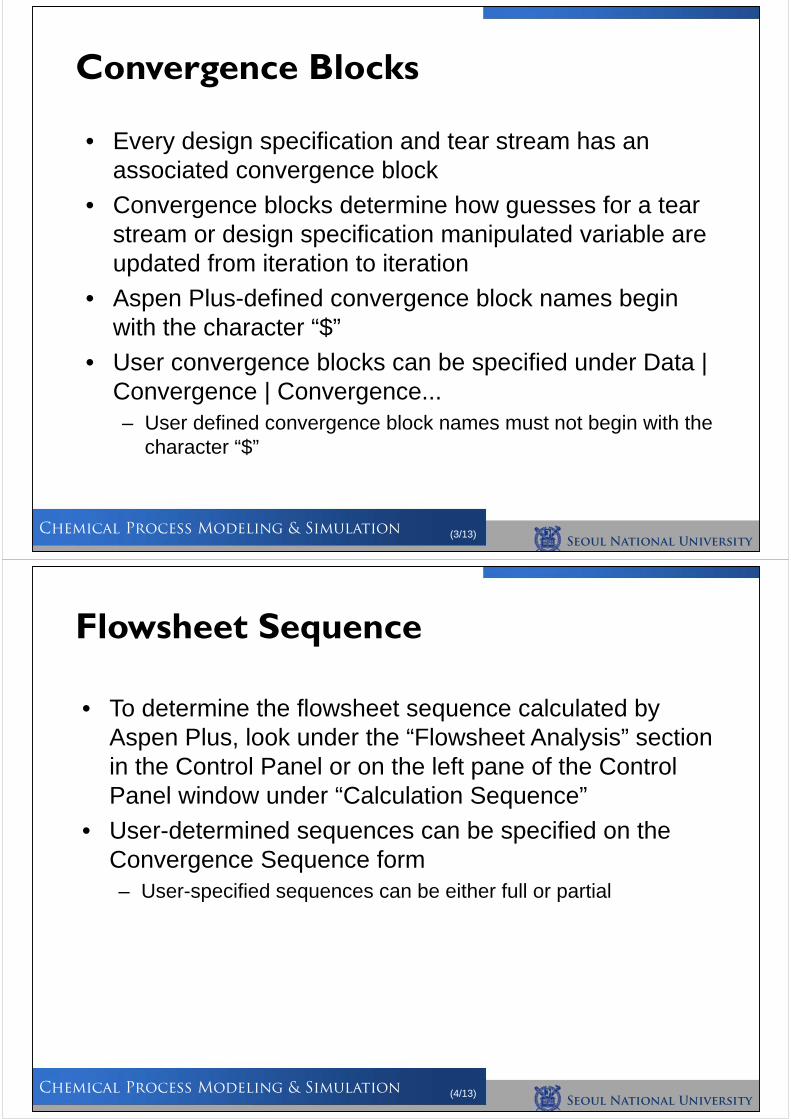
Flowsheet Convergence
• To evaluate flowsheet convergence, determine the:– Calculation sequence
– Tear stream
– Number Iterations to solution
– Pattern of err/tol value
– Convergence method used
• Everything you need to know in evaluating the convergence status is written to the Control Panel
Seoul National University
Chemical Process Modeling & Simulation (3/13)
Convergence Blocks
• Every design specification and tear stream has an associated convergence block
• Convergence blocks determine how guesses for a tear stream or design specification manipulated variable are updated from iteration to iteration
• Aspen Plus-defined convergence block names begin with the character “$”
• User convergence blocks can be specified under Data | Convergence | Convergence...– User defined convergence block names must not begin with the
character “$”
Seoul National University
Chemical Process Modeling & Simulation (4/13)
Flowsheet Sequence
• To determine the flowsheet sequence calculated by Aspen Plus, look under the “Flowsheet Analysis” section in the Control Panel or on the left pane of the Control Panel window under “Calculation Sequence”
• User-determined sequences can be specified on the Convergence Sequence form– User-specified sequences can be either full or partial
Seoul National University
Chemical Process Modeling & Simulation (5/13)
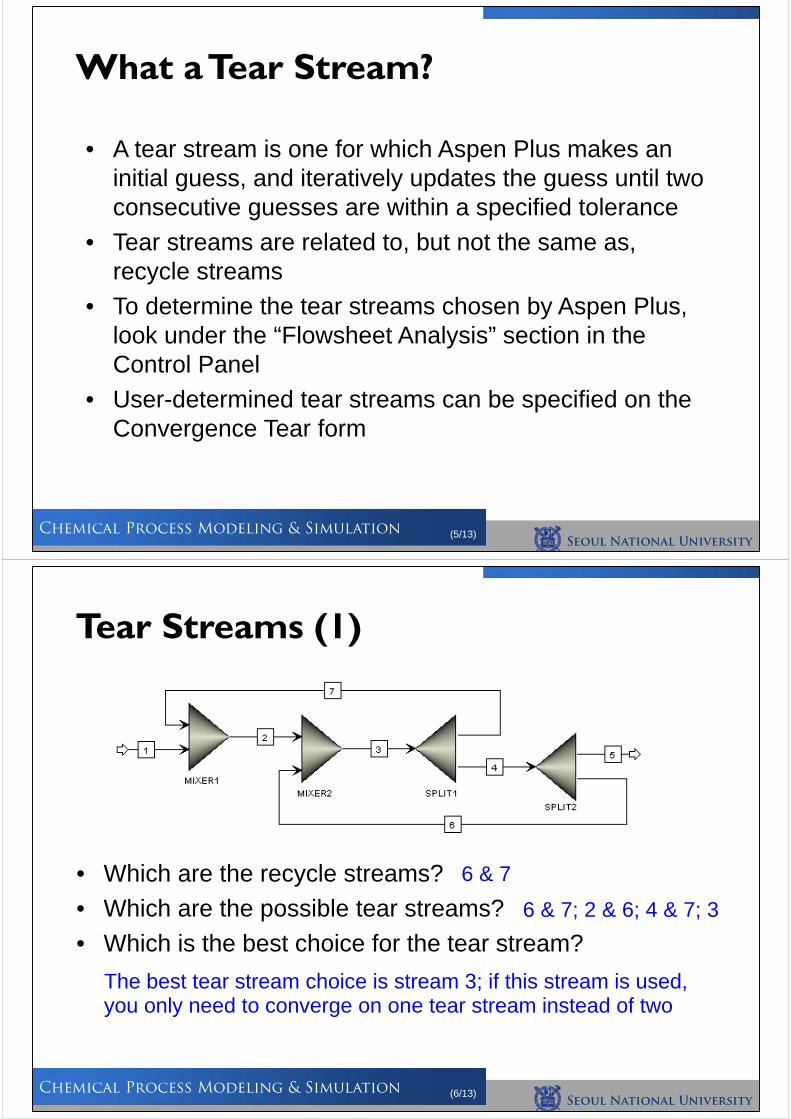
What a Tear Stream?
• A tear stream is one for which Aspen Plus makes an initial guess, and iteratively updates the guess until two consecutive guesses are within a specified tolerance
• Tear streams are related to, but not the same as, recycle streams
• To determine the tear streams chosen by Aspen Plus, look under the “Flowsheet Analysis” section in the Control Panel
• User-determined tear streams can be specified on the Convergence Tear form
Seoul National University
Chemical Process Modeling & Simulation (6/13)
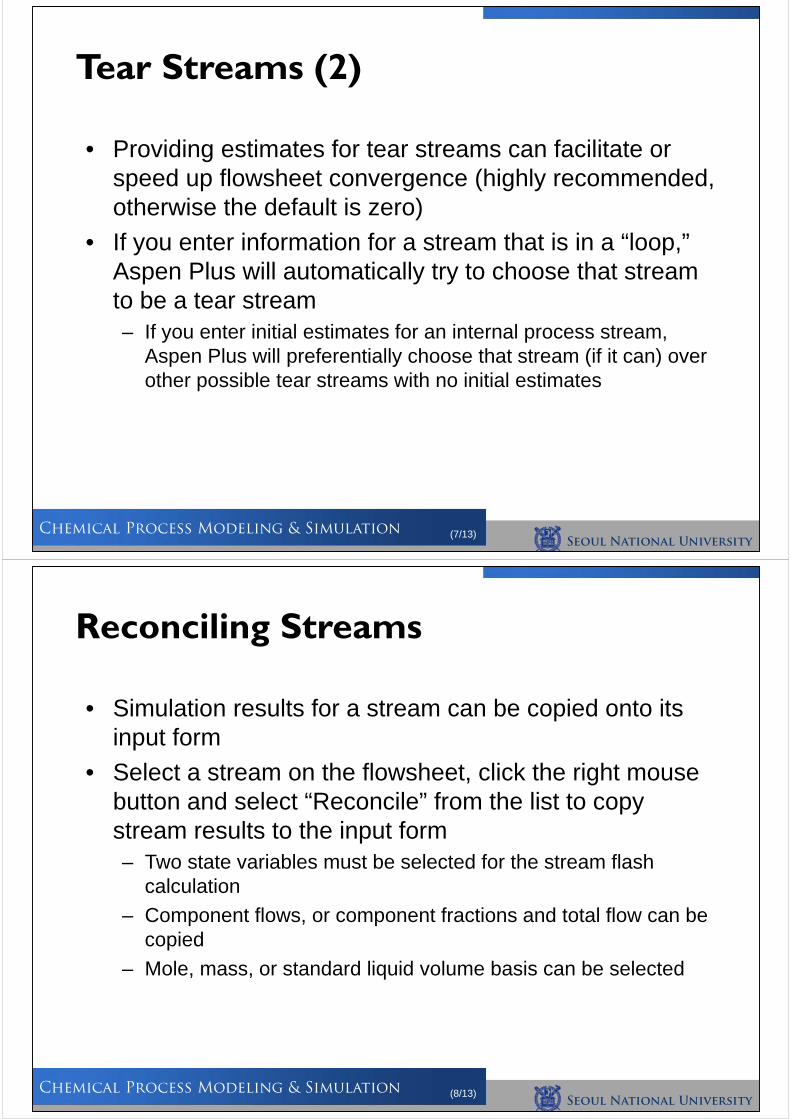
Tear Streams (1)
• Which are the recycle streams?
• Which are the possible tear streams?
• Which is the best choice for the tear stream?
6 & 7
6 & 7; 2 & 6; 4 & 7; 3
The best tear stream choice is stream 3; if this stream is used, you only need to converge on one tear stream instead of two
Seoul National University
Chemical Process Modeling & Simulation (7/13)
Tear Streams (2)
• Providing estimates for tear streams can facilitate or speed up flowsheet convergence (highly recommended, otherwise the default is zero)
• If you enter information for a stream that is in a “loop,” Aspen Plus will automatically try to choose that stream to be a tear stream– If you enter initial estimates for an internal process stream,
Aspen Plus will preferentially choose that stream (if it can) over other possible tear streams with no initial estimates
Seoul National University
Chemical Process Modeling & Simulation (8/13)
Reconciling Streams
• Simulation results for a stream can be copied onto its input form
• Select a stream on the flowsheet, click the right mouse button and select “Reconcile” from the list to copy stream results to the input form– Two state variables must be selected for the stream flash
calculation
– Component flows, or component fractions and total flow can be copied
– Mole, mass, or standard liquid volume basis can be selected
Seoul National University
Chemical Process Modeling & Simulation (9/13)
Convergence Block Algorithms
• Aspen Plus uses different convergence block algorithms for different functions:
– To converge tear streams:
• WEGSTEIN • DIRECT• BROYDEN• NEWTON
– To converge design specs and tear streams:
• BROYDEN• NEWTON
– To converge design specs:• SECANT• BROYDEN• NEWTON
– For optimization:• SQP• COMPLEX
• Make changes to global convergence options on the Convergence | Conv Options | Defaults form
Seoul National University
Chemical Process Modeling & Simulation (10/13)
Flowsheet Convergence References
• Online Help– Troubleshooting Flowsheet
Convergence
– Glossary
Seoul National University
Chemical Process Modeling & Simulation (11/13)
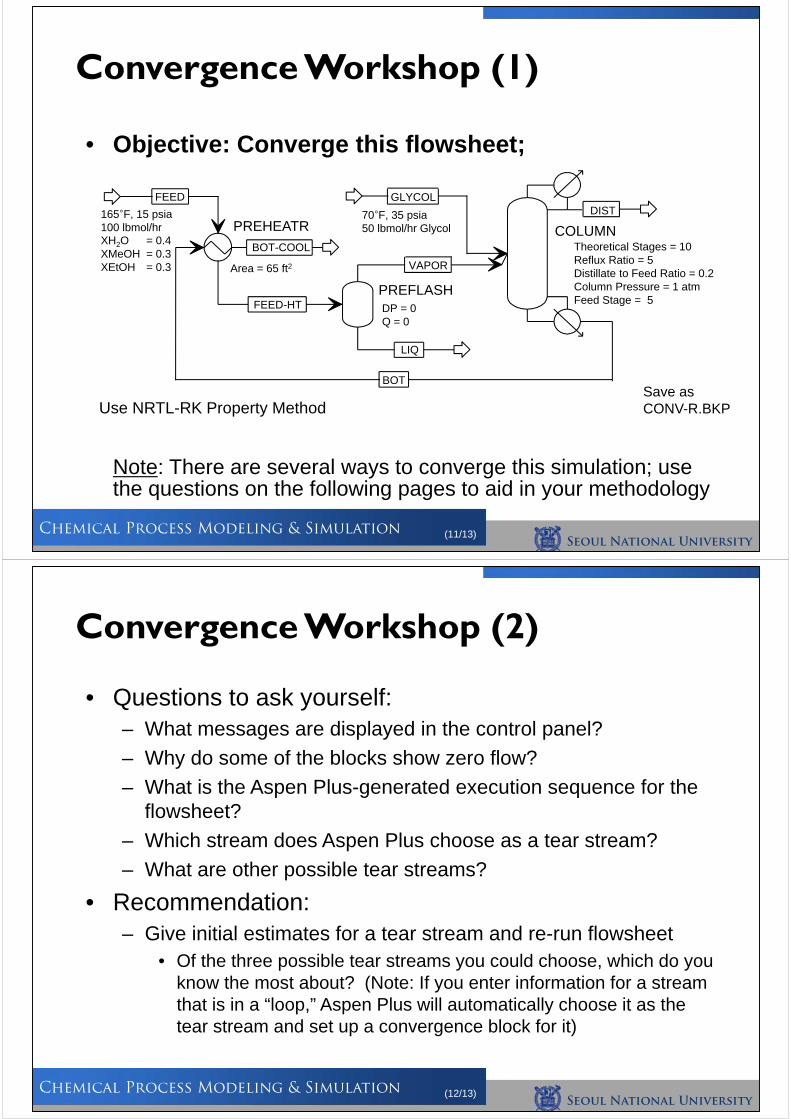
• Objective: Converge this flowsheet;
Note: There are several ways to converge this simulation; use the questions on the following pages to aid in your methodology
Convergence Workshop (1)
Use NRTL-RK Property MethodSave as CONV-R.BKP
LIQ
VAPOR
FEED-HT
FEED
BOT
DIST
BOT-COOL
GLYCOL
COLUMNPREHEATR
PREFLASH
165°F, 15 psia100 lbmol/hrXH2O = 0.4XMeOH = 0.3 XEtOH = 0.3 Area = 65 ft2
DP = 0 Q = 0
Theoretical Stages = 10Reflux Ratio = 5Distillate to Feed Ratio = 0.2 Column Pressure = 1 atmFeed Stage = 5
70°F, 35 psia50 lbmol/hr Glycol
Seoul National University
Chemical Process Modeling & Simulation (12/13)
Convergence Workshop (2)
• Questions to ask yourself:– What messages are displayed in the control panel?
– Why do some of the blocks show zero flow?
– What is the Aspen Plus-generated execution sequence for the flowsheet?
– Which stream does Aspen Plus choose as a tear stream?
– What are other possible tear streams?
• Recommendation:– Give initial estimates for a tear stream and re-run flowsheet
• Of the three possible tear streams you could choose, which do you know the most about? (Note: If you enter information for a stream that is in a “loop,” Aspen Plus will automatically choose it as the tear stream and set up a convergence block for it)
Seoul National University
Chemical Process Modeling & Simulation (13/13)
Convergence Workshop (3)
• Questions to ask yourself:– Has the flowsheet converged? If not, why not?
– Does increasing the number of convergence iterations help?
– How is the err/tol value behaving, and what is its value at the end of the run?
– What else can be tried to improve this convergence?
• Recommendations– Try making changes to the convergence algorithm, for example:
• Manually create a convergence block to converge the tear stream of your choice
• Or, change the Convergence parameters for the current method
• Or, change the default convergence method for tear streams