Embed Size (px)
Citation preview
Volume 12 Number 14 1984 Nucleic Acids Research
Separation of cbromosomal DNA molecules from yeasJ by orthogonal-field-alternation geldectrophoresis
Georges F.Carle and Maynard V.Olson
Department of Genetics, Box 8031, Washington University School of Medicine, St. Louis,MO 63110, USA
Received 14 May 1984; Accepted 29 June 1984
ABSTRACT
A simple agaroae-gel apparatus has been developed that allows theseparation of DNA molecules in the size range from 50 kb to well over 750 kb,the largest 3ize for which size standards were available. The apparatus isbased on the recent discovery that large DNA molecules are readilyfractionated on agarose gels if they are alternately subjected to twoapproximately orthogonal electric fields. The switching time, which wa3 onthe order of 20-50 sec in our experiments, can be adjusted to optinizefractionation in a given size range. The resolution of the technique issufficient to allow the fractionation of a sample of 3elf-ligated \ DNA intoa ladder of approximately 15 bands, spaced at 50 kb intervals. We haveapplied the technique to the fractionation of yeast DNA into 11 distinctbands, several of which have been shown by DNA-DNA hybridization to hybridizeuniquely to different chromosome-specific hybridization probes. In thispaper, we describe the design of the apparatus, the electrophoretic protocol,and the sample-handling procedures that we have employed.
INTRODUCTION
Our knowledge of the structural and functional organization of
chronosonal DNA has long been limited by the difficulty of fractionating
mixtures of large DNA molecules or even assaying heterogeneous DNA sajnples for
the presence of such molecules. Routine preparative and analytical techniques
for manipulating DNA are only effective for molecules of approximately 100 kb
or less, while the average amount of DNA per chromosome Is on the order of
1000 kb In lower eukaryotes such as yeast and over 100,000 kb in higher plants
and animals. Nonetheless, numerous efforts have been made to characterize
chromosome-sized DNA molecules in organisms such as yeast and Drosophlla,
primarily by electron microscopy, velocity sedimentation, and measurements of
visco-elasticity. Although these techniques have met with some success—for
example, in providing evidence that the chromosomes of lower eukaryotes
probably contain a single linear molecule of duplex DNA (1,2)—they have not
led to any detailed knowledge of the composition of the highly heterogeneous
samples of large DNA molecules that are produced by the gentle lysis of cells
© IRL Pren Limited, Oxford, England. 5647
Nucleic Acids Research
or nuclei. The single chromosoae-sized DNA molecule that has been well
characterized was isolated fro* a nutant yeast strain that harbors a ring
cnromosoie containing about half of the genetic material present on a
wild-type copy of chromosome III. Thi3 lolecule could be purified aa a 190 kb
supercoiled circle and shown to be free of protease- or RNase-3ensitlve
Junctions (3K
Gel electrophoresis has appeared to offer the best opportunity to study
heterogeneous populations of large DNA molecules, but efforts to apply this
technique to chro«osome-sized aolecules have until recently net with little
success. Using conventional agarose slab gels, combinations of low matrix
densities and low voltage gradients have allowed the separation of
bacteriophage DHA's from k (48.5 kb), T5 (125 kb), T4 (170kb), and G (-750
kb), but in the best experiments the mobility difference between T4 and G was
only about 10% (4,5). In general, large DNA molecules migrate with
size-Independent nobilities in conventional gels, presunably because they
present an effective cross-section to the gel natrix that is independent of
their lengths. Against this background, it was recently reported by Schwartz
et al. (6) that nuch Improved resolution of large DNA aolecules could be
obtained on agarose slab gels if the molecules were alternately subjected to
two approximately orthogonal electrical fields. The basic Idea behind the
method Is that 3nall molecules have a mobility advantage in such an apparatus
because they can turn corners in the gel matrix more rapidly than large
molecules.
We were encouraged by this report to experiment with a variety of gel
apparati and experimental protocols that involved alternating applications of
orthogonal fields, and we report here the development of an easily constructed
apparatus that resolves the DHA molecules present in yeast chromosomes into a
series of widely spaced bands. The sizes of the smaller of these molecules
were estimated by comparing their mobilities with tho3e of a variety of size
standards, which cover the range up to 750 kb. We also obtained excellent
resolution between still larger aolecules, but because we lacked suitable size
standards, we have not yet been able to estimate the sizes of the largest
molecules that were separated. In addition to presenting a detailed
description of our electrophoresis protocol, we demonstrate that DNA samples
that are suitable for experiments of this type can be prepared by conventional
techniques and require surprisingly little special handling.
5648
Nucleic Acids Research
MATERIALS AND METHODS
Apparatus
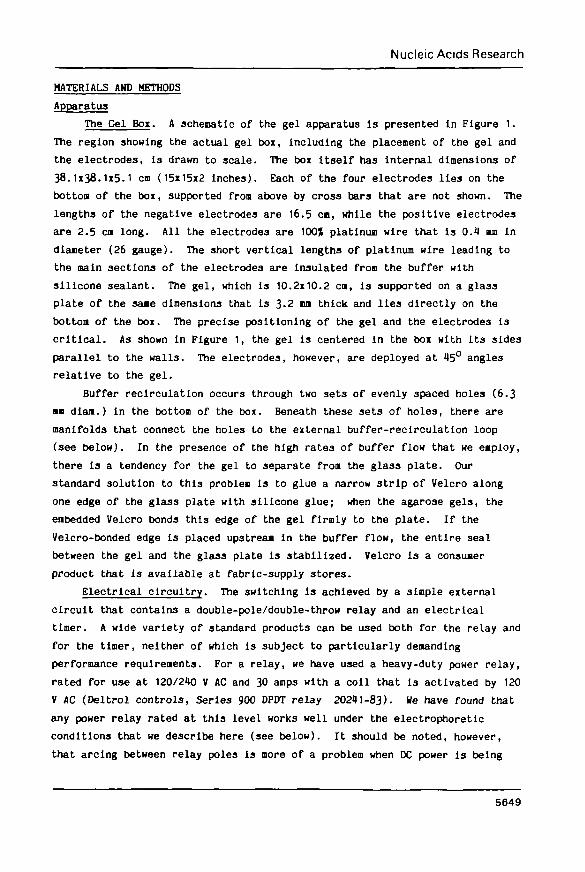
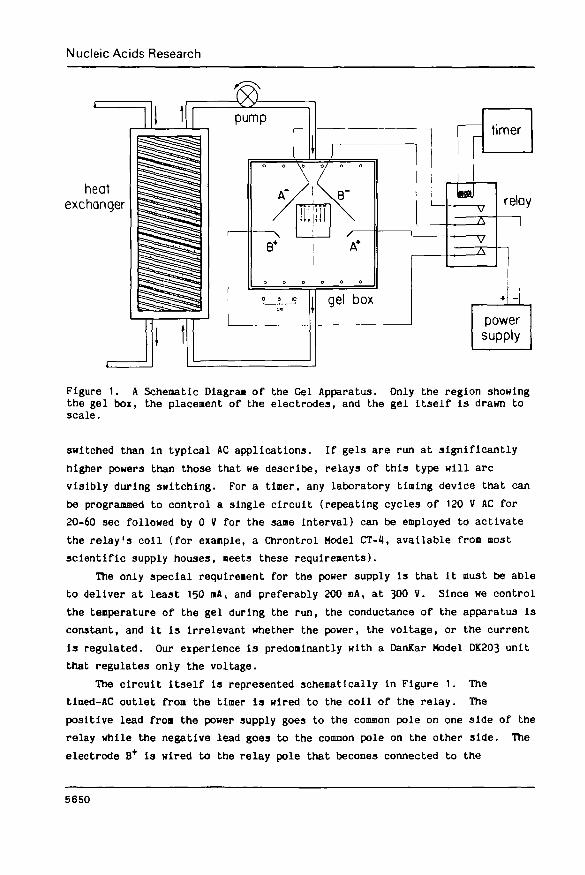
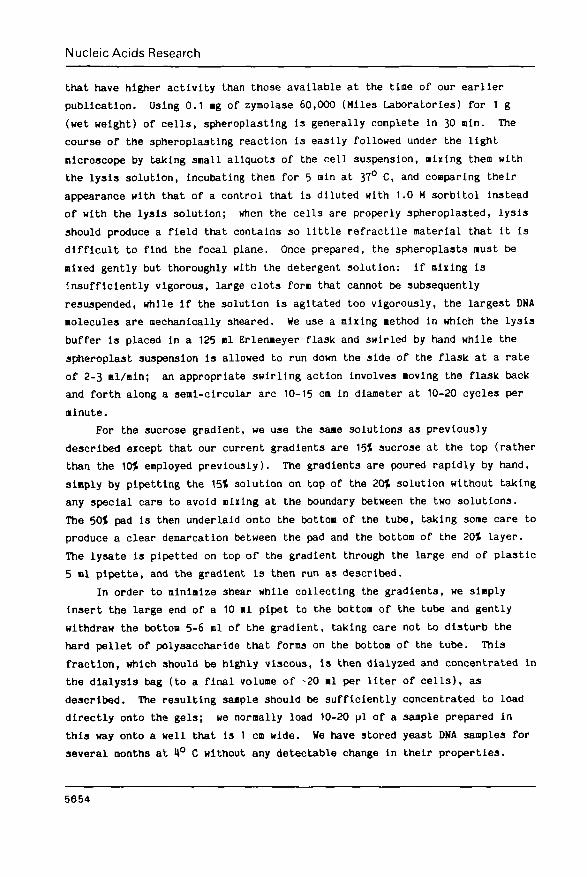
The Gel Boi. A schematic of the gel apparatus 13 presented in Figure 1.
The region showing the actual gel box, including the placement of the gel and
the electrodes, is drawn to scale. The box itself has internal dimensions of
38.1x38.1x5.1 cm (15x15x2 inches). Each of the four electrodes lies on the
botton of the box, supported from above by cross bars that are not shown. The
lengths of the negative electrodes are 16.5 en, while the positive electrodes
are 2.5 ca long. All the electrodes are 100J platlnua wire that is 0.4 am In
diameter (26 gauge). The short vertical lengths of platinum wire leading to
the main sections of the electrodes are insulated fron the buffer with
silicone sealant. The gel, which is 10.2x10.2 cm, Is supported on a glass
plate of the same dimensions that is 3-2 na thick and lies directly on the
bottom of the box. The precise positioning of the gel and the electrodes i3
critical. As shown In Figure 1, the gel is centered in the box with its sides
parallel to the walls. The electrodes, however, are deployed at 45° angles
relative to the gel.
Buffer recirculation occurs through two set3 of evenly spaced holes (6.3
am dlan.) in the bottom of the box. Beneath these sets of holes, there are
manifolds that connect the holes to the external buffer-recirculation loop
(see below). In the presence of the high rates of buffer flow that we employ,
there is a tendency for the gel to separate from the glass plate. Our
standard solution to thi3 problem Is to glue a narrow 3trip of Velcro along
one edge of the glass plate with silicone glue; when the agarose gels, the
embedded Velcro bonds thi3 edge of the gel firmly to the plate. If the
Velcro-bonded edge is placed upstream in the buffer flow, the entire seal
between the gel and the glass plate is stabilized. Velcro Is a consumer
product that is available at fabric-supply 3tores.
Electrical circuitry. The switching is achieved by a simple external
circuit that contains a double-pole/double-throw relay and an electrical
timer. A wide variety of standard products can be used both for the relay and
for the timer, neither of which is subject to particularly demanding
performance requirements. For a relay, we have used a heavy-duty power relay,
rated for use at 120/240 V AC and 30 aaps with a coil that Is activated by 120
V AC (Deltrol controls, Series 900 DPDT relay 20241-83). We have found that
any power relay rated at this level works well under the electrophoretlc
conditions that we describe here (see below). It should be noted, however,
that arcing between relay poles is more of a problem when DC power is being
5649
Nucleic Acids Research
heatexchanger
Figure 1. A Schematic Diagrai of the Gel Apparatus. Only the region showingthe gel box, the placement of the electrodes, and the gel itself is drawn toscale.
switched than In typical AC applications. If gels are run at significantly
higher powers than those that we describe, relays of this type will arc
visibly during switching. For a timer, any laboratory tining device that can
be programmed to control a single circuit (repeating cycles of 120 V AC for
20-60 sec followed by 0 V for the sane interval) can be employed to activate
the relay's coll (for exaaple, a Chrontrol Model CT-4, available fron most
scientific supply houses, Beets these requirenents).
The only special requirement for the power supply is that It oust be able
to deliver at least 150 aA, and preferably 200 nA, at 300 V. Since we control
the tenperature of the gel during the run, the conductance of the apparatus is
constant, and it is irrelevant whether the power, the voltage, or the current
is regulated. Our experience is predominantly with a DanKar Model DK203 unit
that regulates only the voltage.
The circuit itself is represented schenatically in Figure 1. The
tlned-AC outlet from the timer is wired to the coil of the relay. The
positive lead froa the power supply goes to the common pole on one side of the
relay while the negative lead goes to the common pole on the other side. The
electrode B+ is wired to the relay pole that becomes connected to the
5650
Nucleic Acids Research
positive common pole when the relay is in its relaxed configuration, while the
electrode B" is wired to the analogous negative pole. Similarly, the
electrodes A+ and A" are wired to poles that are connected to the positive
and negative common poles when the relay's coil is activated.
Buffer Reclrculatlon and Cooling. The gels are run both at relatively
high power (-60 Watts) and high current (-200 mA). Consequently, there is the
potential both for substantial temperature increases and for buffer failure
during a gel run (10-20 hr). We solve both problems at once by recirculating
the buffer through a buffer loop that contains a simple heat exchanger. The
buffer is pumped continuously at 250 ml/min using a high-capacity peristaltic
pump (Cole Parser Masterflex with a K-7553-00 drive and a K-7018-21 head using
silicone tubing in the DUMP head that has an outside dianeter of 11 on and an
inside diaaeter of 8 ma). The heat exchanger consists of two 15 m roles of
polyethylene tubing (low density with an outside diameter of 6.4 aa and an
inside diameter of 4.3 ma) that are wrapped side-by-side into 23 loops with
diaaeters of approximately 20 cm; the loops are immersed in an Insulated
tank filled with water, which serves as a passive heat-exchange medium. One
of the coils of polyethylene tubing is in series with the buffer-recirculatlon
loop, while the coolant flows through the other coil. With this arrangement
we maintain a gel teaperature of approxifflately 14° C by keeping the coolant,
which is water, at a temperature of 6° C and maintaining a flow rate of 400
ml/min. Obviously a wide variety of methods could be used to dispose of the
heat produced in the electrophoresis tank. The only non-obvious feature of
heat exchangers similar to the one described here concerns the choice of
material for the tubing: if plastic tubing is to be employed, it should be
thin-walled polyethylene tubing such as that described, since polyethylene has
much higher heat conductivity than do most other coamon polymers.
Safety Considerations. This protocol involves potentially lethal
combinations of voltage and current. We would like to call attention to the
particular hazard posed by the recirculation of electrically hot buffer
through a tubing loop that includes multiple plumbing connections. A prudent
safety precaution would be to enclose the electrophoresis box, the puap, and
all the tubing connections in an outer, water-tight box that would contain all
the buffer in the event of a failure either of the tubing in the
peristaltic-pump head or of any of the tubing connections. In addition, the
tubing within the peristaltic-pump head should be a high-quality silicone
tubing such as that described, and it should be changed regularly, to avoid
tubing failures. Finally, the outer containment box should be well vented at
the top to avoid accumulations of hydrogen gas.
5651
Nucleic Acids Research
Electrophoresls Protocol
Gel Preparation. The gels are 1.5% agarose, cast and run In 0.5xTBE
(1xTBE= 90 mH Tris base, 90 mM boric acid, 2.5 mM Na2H2EDTA, unadjusted
pH-8.2). We have employed standard grades of agarose from a variety of
manufacturers without significant variations In the results. The gels are
cast directly on the 10.2i10.2 en glass plate to a thickness of 1 mm. We have
used conb3 as thick as 1.6 on without any observable broadening of the bands.
Saaple Loading. The gels are loaded while subaerged In the running
buffer. The 1x dye mix in the loaded samples has the following composition:
5% (w/v) ficoll (Sigma, Type 400-DL), 0.02% bromphenol blue, 0.02* xylene
cyanole FF, 40 mM EDTA [pH8]. The 3aflples are gently pipetted Into a plastic
tube using a plastic pipet tip that has been cut off with a razor blade to
produce an orifice that is -1 mm in diaaeter. An appropriate quantity of the
5x dye «ix is pipetted into the tube and the solution 13 gently stirred with
the plpet tip until it is well mixed. The sanple is then loaded by gently
pipetting it into the submerged gel wells using a glass capillary that also
has an orifice -1 in In diaaeter. As In the case of conventional agarose
gels, the ratio between the sample voluae and the well volume 13 not critical:
we normally employ ratios between 0.3 and 0.8.
Electrophoresls Conditions. The apparatus and the electrophoresls
protocol were designed around the limitations of power supplies of the type
used for conventional electrophoresis experiments. Host such power supplies
will only deliver uaxiniw currents of 150 or 200 nA. We normally run the gels
at a constant voltage of 300 V. Given this voltage, the composition of the
running buffer, and the basic geoietry of the gel box, the two variables that
determine the current are the depth of buffer in the gel box and the
tenperature. Our standard protocol calls for a buffer depth of 1.5-1.7 cm and
a temperature of 14° C, under which conditions the current Is approximately
150 BA. If the gel is being run with a power supply whose maximuffl current is
150 mA, the buffer depth should be slightly reduced; this neasure has little
effect on the results as long as the gel is well subaerged. Under the
conditions described here, the voltage gradient in the center of the gel,
measured along the axis of net migration is -3 V/cm.
With respect to the running temperature, we can only say that we have
consistently obtained the best results when the gels were run relatively cold.
It is likely that comparable results are obtainable at higher temperatures,
but a number of other variables (voltage, switching time, lenth of the run)
would have to be re-optlmlzed at the chosen temperature. We are convinced
5652
Nucleic Acids Research
that reproducible results can only be obtained If the gels are run at a
constant temperature, and Hlth the cooling system that we describe it is no
more difficult to regulate the temperature at 14° than at anblent
temperatures.
Gel Staining and Photography. Any standard technique can be employed to
stain and photograph the gels. The aethod chosen, however, should have a
demonstrated ability to detect 1 ng of uncleaved \ DMA when it is run on a
single lane of a standard agarose gel. We achieve this sensitivity using a
protocol that involves staining the gels with ethldiun bromide for 10-30 min
at a concentration of 0.1 ug/ml in 0.5iTBE, de-staining for 20 nin in
0.5iTBE, and enploying an ultraviolet transilluninator with a wavelength
mailnua at 300n« (Spectronics, Model TR-302). The combination of camera,
filn, and filters that we employ has been described previously (7).
High-speed instant film (Polaroid Type 667) gives adequate results for
day-to-day use with exposures of 30 sec or less, while the photographs for
this paper were prepared using a wet-process fils (Eastnan Kodak Ho. 4155).
The protocol for using the wet-proce33 filn was exactly as described except
that in sone cases, when naxlmal sensitivity was required, a lens with f=75 nn
(rather than the usual 135 «m) was employed. This nodiflcation improves the
detection of extremely faint bands by allowing the lens to be noved closer to
the gel and, equally importantly, by concentrating the image onto a smaller
area of the film.
Southern Transfers. Any standard protocol can be used for transferring
DNA froe these gel3 to nitrocellulose as long as it includes—as most current
protocols do—a step in which the DNA is partially degraded before it Is
denatured in the gel. To reduce the average molecular weight of the DNA, we
soak the gels in 0.25 M HC1 for 20 nin at rooii temperature (8) before soaking
them in 0.5 M NaOH/1.0 H NaCl and then proceeding by standard nethods.
DNA Preparations
Yeast. Yeast DNA was prepared by a slight modification of a method that
we have previously described (9). In broad outlines, the method Involves
preparing spheroplasts with zymolase, lysing the spheroplast suspension with
N-lauroyl sarcosinate, and purifying the DNA with a preparative sucrose
gradient. Only our minor modifications of the previously published protocol
will be described here, along with a few comments on precautions that say be
important for minlnizing degradation of the larger chromosome-sized DNA
molecules.
The current implementation of the procedure employs zymolase preparations
5653
Nucleic Acids Research
that have higher activity than those available at the time of our earlier
publication. Using 0.1 ig of zymolase 60,000 (Miles Laboratories) for 1 g
(wet weight) of cell3, spheroplastlng is generally complete in 30 nin. The
course of the spheroplasting reaction 13 easily followed under the light
nicroscope by taking snail allquots of the cell suspension, nixing then with
the lysis solution, incubating them for 5 Bin at 37° C, and comparing their
appearance with that of a control that is diluted with 1.0 M sorbitol Instead
of with the lysis solution; when the cells are properly spheroplasted, Iy3is
should produce a field that contains so little refractlle material that it is
difficult to find the focal plane. Once prepared, the spheroplasts must be
mixed gently but thoroughly with the detergent solution: if nixing is
insufficiently vigorous, large clots forn that cannot be subsequently
resuspended, while If the solution is agitated too vigorously, the largest DNA
•oleculea are mechanically sheared. We use a mixing method in which the lysis
buffer is placed in a 125 nl Erlenmeyer flaak and 3wirled by hand while the
spheroplast suspension is allowed to run down the side of the flask at a rate
of 2-3 Bl/nin; an appropriate swirling action involves loving the flask back
and forth along a seal-circular arc 10-15 en in diameter at 10-20 cycles per
minute.
For the sucrose gradient, we use the same solutions as previously
described except that our current gradients are 15J sucrose at the top (rather
than the 10% enployed previously). The gradients are poured rapidly by hand,
sinply by pipetting the 15* solution on top of the 20% solution without taking
any special care to avoid nixing at the boundary between the two solutions.
The 50% pad Is then underlaid onto the botton of the tube, taking some care to
produce a clear demarcation between the pad and the bottom of the 20% layer.
The lysate is pipetted on top of the gradient through the large end of plastic
5 Bl pipette, and the gradient is then run as described.
In order to minimize shear while collecting the gradients, we simply
insert the large end of a 10 «1 pipet to the bottom of the tube and gently
withdraw the bottom 5-6 nl of the gradient, taking care not to disturb the
hard pellet of polysaccharlde that forms on the bottom of the tube. This
fraction, which should be highly viscous, Is then dialyzed and concentrated in
the dialysis bag (to a final volume of -20 «1 per liter of cells), as
described. The resulting saaple should be sufficiently concentrated to load
directly onto the gels; we normally load 10-20 ul of a sample prepared in
this way onto a well that is 1 cm wide. We have stored yeast DNA samples for
several months at 4° C without any detectable change In their properties.
5654
Nucleic Acids Research
The DNA cleaves well with mo3t restriction enzymes if BSA i3 added to the
digests at a concentration of 100 ug/nl.
All the gels shown in this paper employed DNA prepared froo the p°
haploid yeast strain AB972 (ref. 10).
Bacterlophage. All bacteriophage DHA's were stored as phage lysates,
which were generous gifts froa D. Dykhuizen (T4 and T5) and W. Fangnan (G).
Aliquots of the phage lysates containing -100 ng of phage DNA were lysed
Immediately before being loaded onto a gel, simply by Including sufficient SDS
in the flcoll-dye mix to give a final concentration of 1J in the gel sample.
The inclusion of SDS causes anomalous behavior of the loading dyes early in
the gel run, but has no detectable effect on the mobility of the DNA.
Lambda DNA Ladders. DNA fro« Acl857 (Bethesda Research Laboratories)
was self-ligated at a concentration of 50 pg/ml using 0.2 Weiss units of T4
DNA ligase (Bethesda Research Laboratories) for a 15 pi reaction, carried
out for 12 hr at 14° C In 66 mM TrisHCl [pH 7.6], 5 nM MgCl2, 5 «M DTT,
and 1 «H ATP. We loaded -400 ng of DNA, prepared in this way, onto a gel well
with a width of 1 cm.
Hybridization Probes. All three of the hybridization probes were
prepared by nick-translation of DNA fron entire lambda clones using
a-' P-dATP. The clones were from a Iaabda-yea3t pool prepared by M.Y.
Graham in the vector \HG14 using DNA from the yeast strain AB972. The
identities of the probes were a3 follows: chromosome I, \PM4237 (cloned from
the CDC19-CDC24 interval by H.Y. Steensna and D. Kaback; the original name of
XPM4237 was \C1a); chromosome V, \PM910 (cloned by G. Brodeur using a
URA3 probe); chromosome VI, XPM4235 (cloned by H. Graham using a SUP11
probe).
RESULTS
Basic Behavior of the Gels
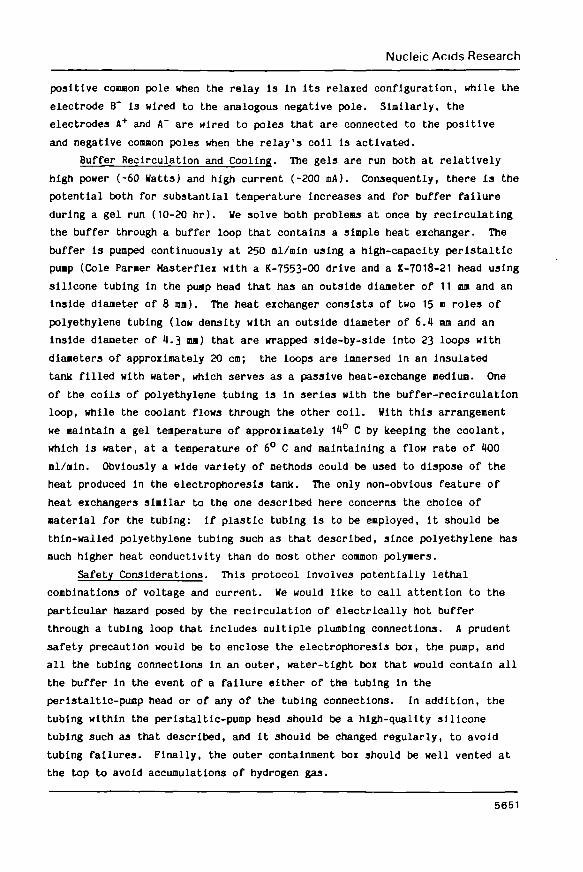
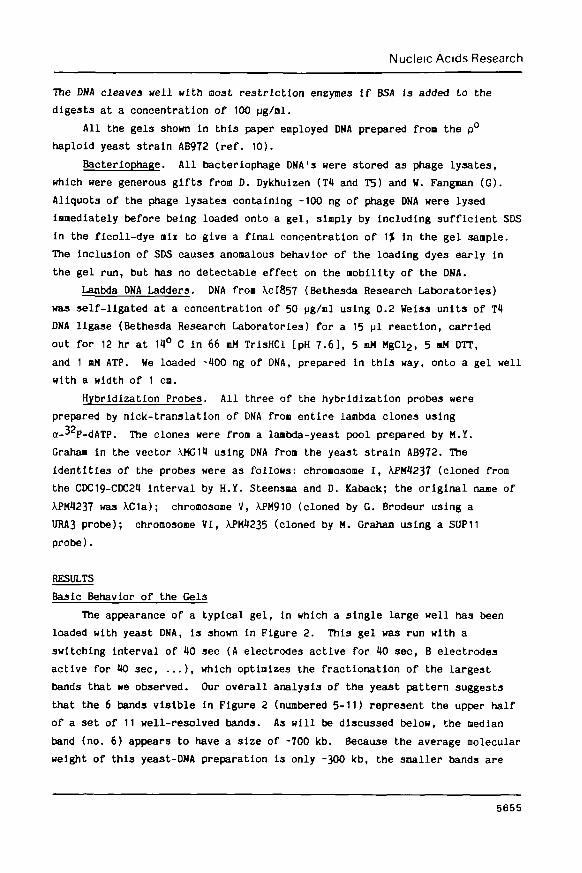
The appearance of a typical gel, In which a single large well has been
loaded with yeast DNA, Is shown in Figure 2. This gel was run with a
switching Interval of 40 sec (A electrodes active for 40 3ec, B electrodes
active for 40 sec, . . . ) , which optimizes the fractionation of the largest
bands that we observed. Our overall analysis of the yeast pattern suggests
that the 6 bands visible in Figure 2 (numbered 5-11) represent the upper half
of a 3et of 11 well-resolved bands. As will be discussed below, the median
band (no. 6) appears to have a size of -700 kb. Because the average molecular
weight of this yeast-DNA preparation Is only -300 kb, the smaller bands are
5655
Nucleic Acids Research
Figure 2. Fractionation of total yeast DNA with a switching Interval of 40sec. This gel was run for 8.6 hr, stained with ethidlun brooide, andphotographed as described in Materials and Methods. The nuaberlng system forthe yeast bands reflects our overall analysis of the yeast pattern. Bands arenumbered in order of decreasing mobility; bands 1-4 are obscured in thisphotograph by the heterogeneous smear of partially degraded DNA.
obscured by the heterogeneous snear of partially degraded nolecules.
The example in Figure 2 illustrates that the gels exhibit substantial
edge effects that cause molecules that are loaded to either 3ide of the gel's
axis of symmetry to follow a complex trajectory. Nonetheless, the bands
themselves are relatively straight over a large fraction of the gel, a
property which greatly aids in comparing the patterns on different gels and in
assaying for specific sequences by DNA-DNA hybridization. A possible
explanation for this phenomenon is that the rate of net migration parallel to
the gel's oaln axis nay 3lmply be determined by a molecule's size and the
number of tines that the field changes direction. In contrast, the detailed
trajectory followed by a molecule may be Insensitive to size, but highly
responsive to local differences in the electric-field strengths generated by
the two electrode pairs.
A second point that should be emphasized about gels such as the one shown
in Figure 2 is that the duration of the gel run has non-trivial effects on the
pattern of bands obtained. Because of the relatively complex field geometry,
molecules do not migrate at a constant rate throughout an experiment. In
particular, the angle between the field directions associated with the two
electrode pairs is changing froa -90° at the top of the gel to something
substantially higher at the bottom. Consequently, the net mobility of all
molecules decreases as they migrate down the gel since the net field along the
5656
Nucleic Acids Research
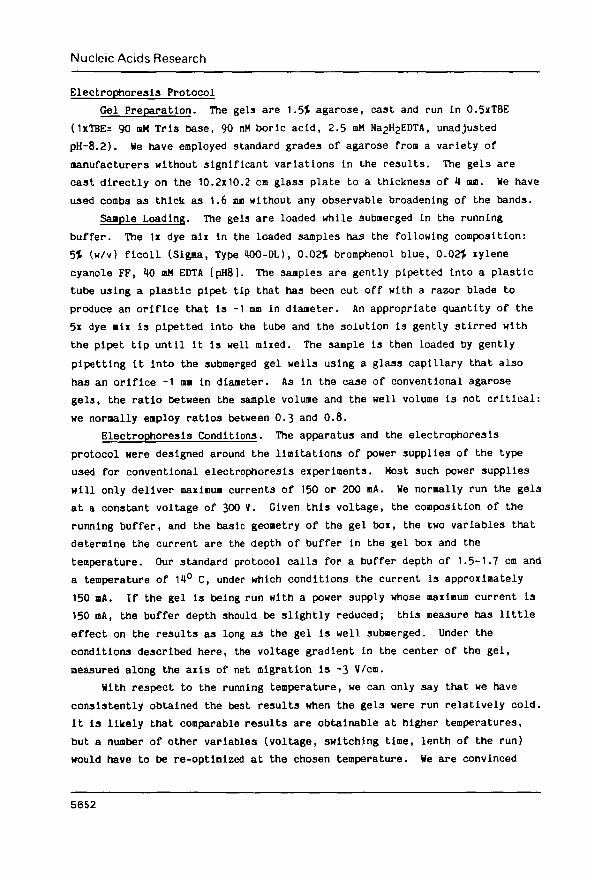
T4T5 yeast KG T4T5 yeast X*Gswitching
time
20 sec
30 sec
40 sec
5
21
O8-9
21
10
8
7
6b432
8
I5432
10-
h6 -5 -4 -
- I
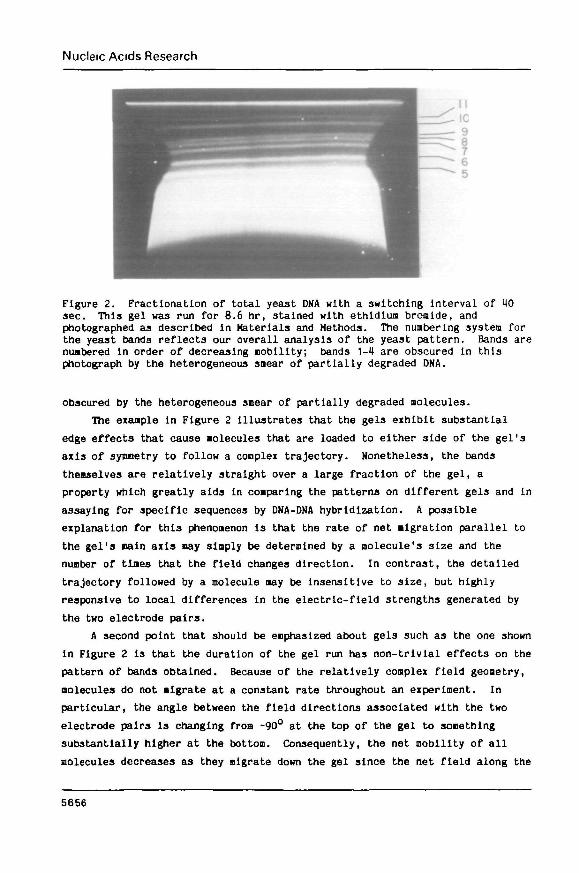
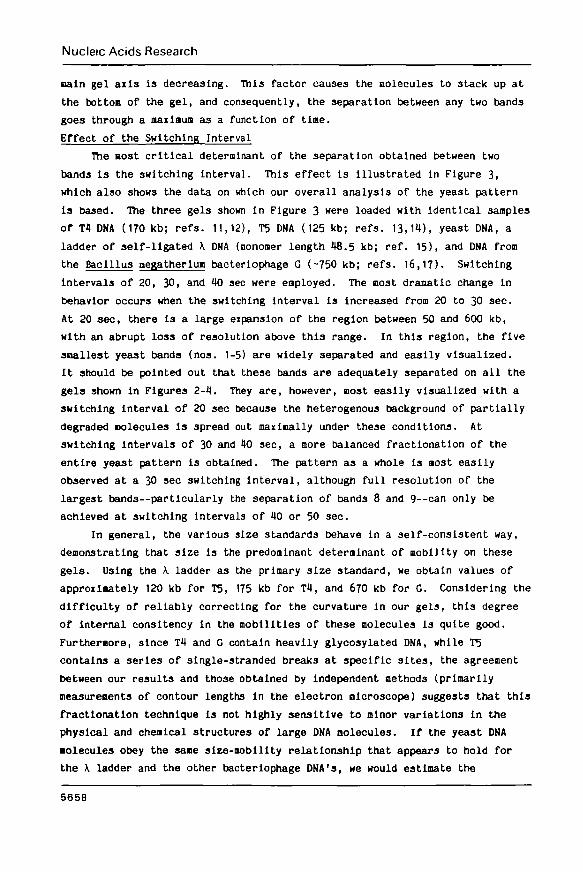
MFigure 3- The effect of variable switching Jntervals on the fractionation ofyeast and bacteriophage DNA's. The symbol \ labels lanes In whichsamples of self-ligated \ DNA were fractionated. In the schematicrepresentations of the gels, the yeast bands are numbered consistently, inorder of decreasing nobility; the labeling of the \ ladders shows ourinterpretation of the number of monomers present in a given band. Theschematic representations of all three gels are based on the analysis of atleast two photographic exposures of the gel; heavily stained regions are moreeasily analyzed using short exposures, while faint bands are most easilydetected in long exposures. The three gels were run for the following times:20 sec switching interval, 18 hr; 30 sec, 15 hr; 40 sec, 12 hr. The strongband at the bottom of the third gel is due to one of the double-stranded RNA'sof the yeast killer system.
5657
Nucleic Acids Research
Bain gel axi3 is decreasing. This factor causes the nolecules to stack up at
the botton of the gel, and consequently, the separation between any two bands
goes through a aaiinum as a function of time.
Effect of the Switching Interval
The B03t critical deterninant of the separation obtained between two
bands Is the switching interval. This effect is illustrated in Figure 3,
which also show3 the data on which our overall analysis of the yeast pattern
is based. The three gels shown in Figure 3 were loaded with identical samples
of T4 DNA (170 kb; refs. 11,12), T5 DMA (125 kb; ref3. 13,14), yeast DNA, a
ladder of self-ligated \ DMA (nonomer length 48.5 kb; ref. 15), and DNA from
the Bacillus megatherlug bacteriophage G (-750 kb; refs. 16,17). Switching
Intervals of 20, 30, and 40 sec were employed. The nost dramatic change in
behavior occurs when the switching interval is increased from 20 to 30 sec.
At 20 sec, there is a large expansion of the region between 50 and 600 kb,
with an abrupt loss of resolution above this range. In this region, the five
smallest yeast bands (nos. 1-5) are widely separated and easily visualized.
It should be pointed out that these bands are adequately separated on all the
gels shown in Figures 2-4. They are, however, nost easily visualized with a
switching interval of 20 sec because the heterogenous background of partially
degraded nolecules Is spread out maxinally under these conditions. At
switching intervals of 30 and 40 sec, a more balanced fractionatlon of the
entire yeast pattern is obtained. The pattern as a whole is most easily
observed at a 30 sec switching interval, although full resolution of the
largest bands—particularly the separation of bands 8 and 9—can only be
achieved at switching intervals of 40 or 50 sec.
In general, the various size standards behave in a self-consistent way,
demonstrating that size is the predominant determinant of nobility on these
gels. Using the k ladder as the primary size standard, we obtain values of
approximately 120 kb for T5, 175 kb for T4, and 670 kb for C. Considering the
difficulty of reliably correcting for the curvature in our gels, thl3 degree
of internal con3itency In the nobilities of these nolecules is quite good.
Furthermore, since T4 and G contain heavily glycosylated DNA, while T5
contains a series of single-stranded breaks at specific sites, the agreement
between our results and those obtained by independent methods (primarily
measurements of contour lengths in the electron nlcroscope) suggests that this
fractionation technique is not highly sensitive to minor variations in the
physical and chemical structures of large DNA molecules. If the yeast DNA
molecules obey the sane size-nobility relationship that appears to hold for
the X ladder and the other bacteriophage DNA's, we would estimate the
5658
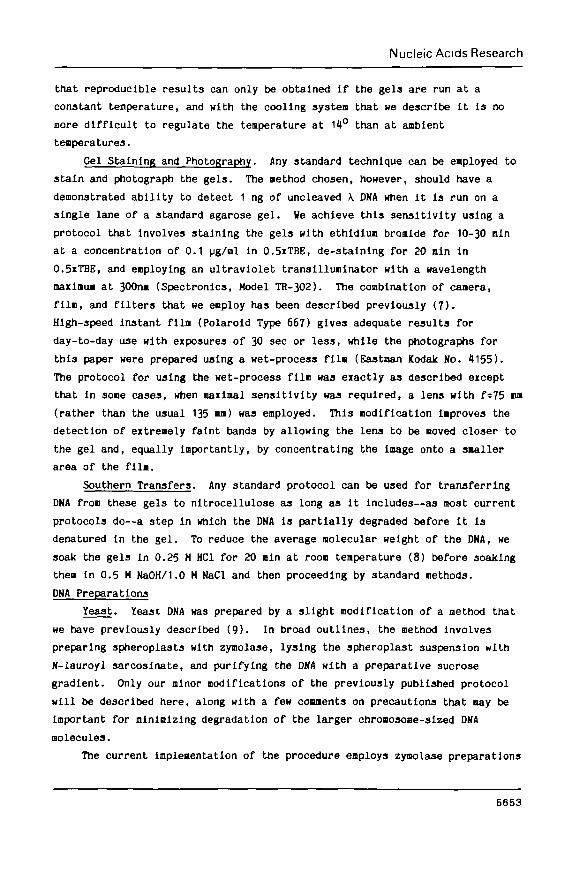
A B
10-11 v8-9-
V5 '
I V VIchromosome - specific
probes
I V VI
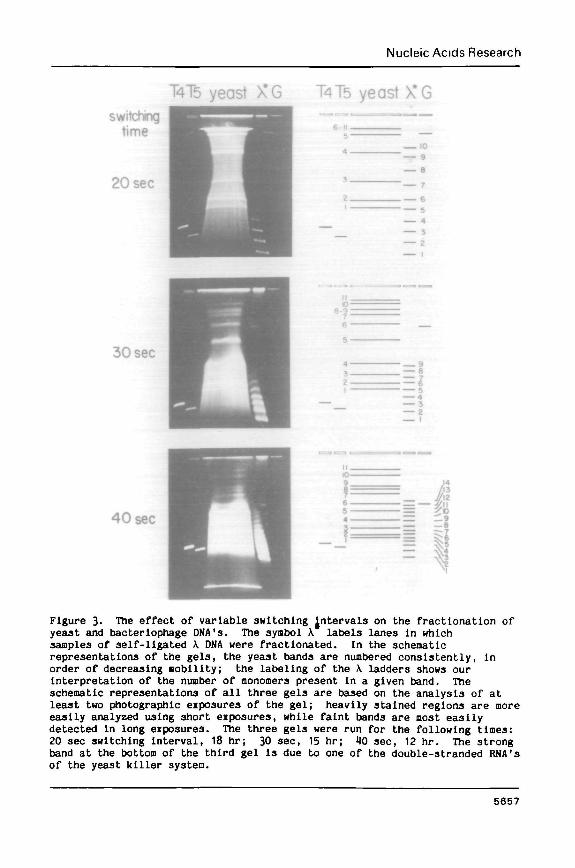
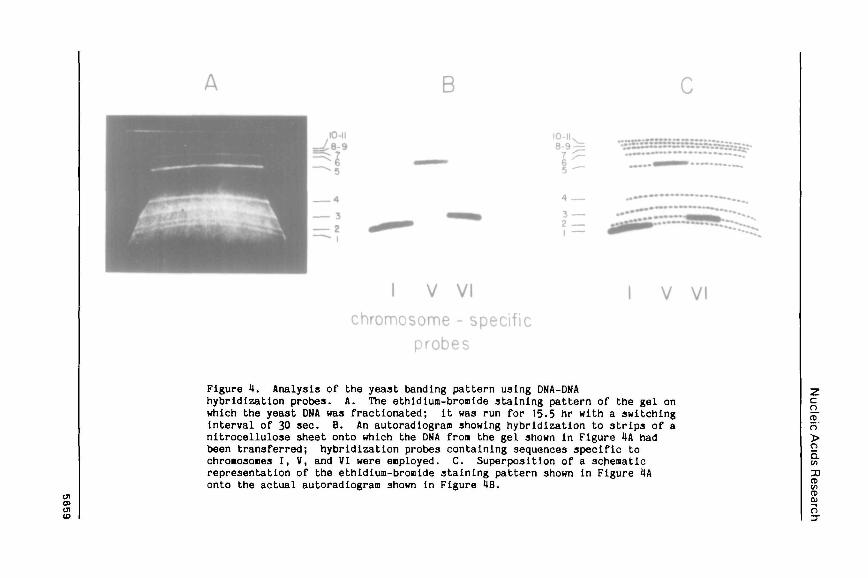
Figure 4. Analysis of the yeast banding pattern using DNA-DNAhybridization probes. A. The ethidlum-bromide staining pattern of the gel onwhich the yeast DNA was fractionated; it was run for 15.5 hr with a switchinginterval of 30 sec. B. An autoradiogram showing hybridization to strips of anitrocellulose 3heet onto which the DNA from the gel shown in Figure 4A hadbeen transferred; hybridization probes containing sequences specific tochroaosones I, V, and VI were enployed. C. Superposition of a schenaticrepresentation of the ethidium-bromlde staining pattern shown in Figure 4Aonto the actual autoradiogram shown in Figure IB.
ma>to
co_CD
o'>oa.
CD01
Nucleic Acids Research
following 3lzes for the six smallest bands: band 1, 260 kb; band 2, 290 kb;
band 3, 370 kb; band 4, 460 kb; band 5, 580 kb; band 6, 700 kb.
The slze-aobillty relationships observed for the gels shown in Figure 3
do not even qualitatively resemble those obtained for conventional
nucleic-acid and protein gels. Within the region in which the \ ladder is
well resolved, the successive bands have spaclngs that are nearly constant
rather than exponentially decreasing; consequently, the calibration curves
for these gels are essentially linear (rather than 3emi-logarithmic) through
the major region of the gel. Under some electrophoretic conditions, the
inter-band spacing in the \ ladder actually has one, or even two broad
maxima, as is evident in Figure 3- "e would emphasize, however, that the
detailed form of the calibration curve is easily manipulated experimentally,
particularly because of the stacking effect at the bottoa of the gel (see
above). As a final point about the k ladders, we note that the origins of
the faint, off-register bands in the \ ladder have not been investigated.
These bands fall alnost exactly at the positions expected for aolecules that
contain 1.5, 2.5, 3-5, ... monomers. One possibility is that our \ DNA
prepartion contains a snail proportion of 3hear-induced half-molecules (17)
that could serve as chain terainator3 in the ligation reaction.
Association of Bands with Specific Chronosomes
Three DHA-DNA hybridization probes have been used to locate sequences
corresponding to specific chronosones within the set of bands obtained fron
yeast DNA. The DNA from an entire gel, whose ethidiiu-bromide staining
pattern is shown in Figure 4A, was transferred to nitrocellulose, and the
nitrocellulose sheet was then cut into strips. The strips were separately
hybridized to chromosome-3pecific probes for chromosones I, V, and VI. As
shown in Figure 4B, each probe hybridized cleanly to a single band. Figure 4C
shows the superposition of a schematic representation of the ethidium-broaide
staining pattern from Figure 4A onto the actual autoradlograa from Figure 4B:
the chromosome I probe hybridizes to band 1, the chronosone VI probe to band
2, and the chromosome V probe to band 5. The fact that the hybridization
occurs quite cleanly in each case to a band, with very little hybridization to
the heterogeneous smear of DNA below the band, Indicates that the aolecules
corresponding to these relatively snail chroBosone3 are largely intact in our
preparations. The heterogeneous smear of DNA in the 100-500 kb range
apparently arises predominantly from the partial degradation of much larger
molecules.
5660
Nucleic Acids Research
DISCUSSION
He have shown that total yeast DNA, even when prepared and handled by
conventional methods, can be fractionated on an agarose gel Into 11
well-separated band3 by alternately applying two electric fields that are
approximately orthogonal. The size of the solecule responsible for the
smallest band in this pattern, which hybridizes specifically to a sequence
from chromosome I, i3 estimated to be 260 kb. The aiddle band in the pattern
corresponds to a lolecule with an estimated size of 700 kb, while no estimates
could be made for the upper bands since suitable size standards were not
available. Because these bands have mobilities that are in the range expected
for the chromosome-sized DNA molecules of yea3t and because several
single-copy clones of known yeast genes hybridize specifically to individual
bands, we believe that the bands arise from the Intact DNA nolecules present
in the various yea3t chromosomes.
Further work will be required to rationalize the discrepancy between our
band count of 11 and the genetically-defined chroaosoae count of 17 (ref3.
19-21) for Saccnaroeyces, but we anticipate that the major source of the
discrepancy will prove to be cases of co-migrating molecules. He cannot
however, rule out the possibility that either our Method of sample preparation
or our electrophoretic protocol has a relatively abrupt size cut-off, and that
we are not observing the DNA molecules corresponding to either the smallest
or, more likely, the largest chromosomes. He are also unable to exclude the
possibility that the yea3t-DNA molecules that we observe are associated with
proteins or other macromolecules that affect their electrophoretic mobilities.
Although the DNA preparations have been heated to 65° C In the presence of
1% detergent and sedimented through a sucrose gradient containing 0.8 M NaCl,
It cannot be assumed that their conformations are unaffected by residual
associated factors. Although this possibility would not detract from the
usefulness of the technique, it would undermine the basis of our size
estinations. The excellent resolution that we obtain between X concatemer3
of different molecular weight indicates that the fractionation technique
itself is highly effective at separating large molecules of naked DNA.
Hlth respect to the apparatus that we have described, the most critical
aspect of the design—and the one for which we can provide the least
compelling rationale—is the precise geometry of the gel in relation to the
set of electrodes. As was previously reported by Schwartz et al. (6), we also
have obtained superior results when only one member of each pair of electrodes
is coaparable in length to the gel. Considerable caution is required,
5661
Nucleic Acids Research
however, in extrapolating from a particular deployment of the electrodes to an
assuaed field geometry within the gel. A number of factors make it quite
complicated to produce a uniform electric field in each direction, and the
question of whether or not the fractionation technique actually depends on
heterogeneity in at least one of the applied fields, as has been suggested
(6), could only be resolved by more sophisticated experiments than we have
done. As an illustration of the complexity of the problem, it may be pointed
out that the simplest electrode geometry--two 3et3 of full-length
electrodes—fails to produce a unlforn field in either direction despite the
symmetry of the arrangement. There are several contributions to this effect,
the largest of which arises fro« electrochemical activity at both ends of the
electrodes that are turned off. Because the resistance of the platinum wire
is essentially zero coapared to that of the running buffer, the wires that
form the inactive electrodes provide highly efficient paths for carrying
current over nost of the physical distance that separates the two active
electrodes. Consequently, a substantial amount of the overall current is
carried by a seven-3tep pathway that involves hydrogen production at the
active negative electrode, ionic migration to the nearest end of an inactive
electrode, oxygen production at that site, electron conduction down the
inactive electrode, hydrogen production, ion migration to the active positive
electrode, and finally oxygen generation. Obviously, a variety of
discontinuous electrode configurations could be designed in order to minimize
this effect. Although we have experimented with some such designs, we have
not yet found any system that gives superior results to those produced by the
simple electrode geoaetry that we describe here.
A surprising finding in this work is the ease with which DHA saaples can
be prepared and handled that contain useful representations of very large,
intact aolecules. It is obvious from our gel photographs that, as would be
expected, there has been substantial loss of the largest molecules since ouch
of the DNA is present in a heterogeneous smear in the 100-500 kb range and the
largest bands have progressively less intensity rather than the progressively
greater intensity that would be predicted if all the molecules were present in
equiiolar aaounts. Nonetheless, it is also clear that there is a sufficient
representation of intact molecules in the largest bands to make samples of
this kind suitable for many types of experiment. The ease of analyzing the
overall pattern is facilitated by the fact that the background of partially
degraded molecules is centered rather far down the gel in a region where the
bands are intense and easily visualized. A partial explanation for the
5662
Nucleic Acids Research
relatively low background In the upper region of the gel may lie in the
longstanding observation that when a linear DNA molecule is broken by
mechanical shear, it tends to break near the middle, producing two fragaent3
that are much smaller than the parental molecule (18).
In discussing our experience with this method, we have deliberately
emphasized experimental rather than theoretical Issues. This choice stems
from our opinion that, although it is not difficult to develop a heuristic
model for the physical basis of this fractionatlon technique, the method
currently rests on wholly empirical foundations. For that reason, we can sake
no clain that our current implementation is renotely optimal. Nonetheless,
the method already works well enough to allow many previously unapproachable
problems to be attacked. Furthermore, given the large nunber of relevant,
interacting variables—voltage, temperature, field geometry, switching regime,
matrix coaposition, and sample handling procedure—we expect that knowledge of
the optimal way to carry out separations of large DNA molecules will only
expand rapidly when variations on this technique come into widespread use. To
facilitate the cro33-referencing of future literature in this area we suggest
orthogonal-field-alternation gel electrophoresi3 as a generic name for
techniques that feature alternate applications of two approximately orthogonal
fields. This name provides a self-explanatory description of the apparatus,
is not biased towards any particular theory concerning the mechanism of
fractionation, and lends itself to the manageable acronym OFAGE.
We have used the chromosome-sized DNA molecules of yeast as the test
system for developing our OFAGE protocol because it provides a convenient
source of ready-made nolecules in a size range where the technique already
performs well. Nonetheless, it would appear that there are no insuperable
obstacles to using this method to expand greatly the sizes of the DNA
molecules in higher organisms that can be directly analyzed. Particularly
when coupled to rapidly improving techniques for fragmenting immense DNA
molecules into pieces that are in the size range of yeast chromosomes (22),
the OFAGE technique offers great potential for bridging the gap between the
DNA molecules of plasnids and phages—which are the focus of current
recombinant DNA technology—and the much larger molecules that store the vast
majority of genetic information present within the cell.
ACKNOWLEDGEMENTS
We would like to acknowledge D. Dykhuizen and W. Fangaan for providing
phage Iy3ates, as well as G. Brodeur, M. Grahaa, D. Kaback, and H.Y. Steensna
5663
Nucleic Acids Research
for providing laabda clones for use as hybridizat ion probes. This research was
supported in part by a grant from the National I n s t i t u t e s of Health (GM28232).
REFERENCES1. Petes, T.D., Byers, B., and Fangoan, W.L. (1973)- Proc. Natl. Acad. Scl.
USA 70, 3072-3076.2. Kavenoff, ft. and Zlnn, B.H. (1973). Chronosona 41, 1-27.3. Strathern, J.N., Newlon, C.S., Herskowitz, I., and Hick3, J.B. (1979).
Cell 18, 309-319.4. Fangman, U.L. (1978). Nucleic Aclda Res. 5, 653-665.5. Serwer, P. (1980). Biocheaistry 19, 3001-3004.6. Schwartz, D.C., Saffran, W., Welsh, J., Haas, R., Goldenberg, M., and
Cantor, C.R. (1982). Cold Spring Harbor Symp. Quant. Biol. 47, 189-195-7. Gray, A.J., Beecher, D.E., and Olson, M.V. (1984). Nucleic Acids Res. 12,
173-491.8. Wahl, CM., Stern, M., and Stark, G.R. (1979). Proc. Natl. Acad. Scl. USA
76, 3683-3687.9. Olson, M.V., Loughney, K., and Hall, B.D. (1979). J. Mol. Biol. 132,
387-410.10. Sandneyer, S.B. and Olson, M.V. (1982). Proc. Natl. Acad. Sci. USA 79,
7674-767811. Ki«, J.-S. and Davidson, M. (1974). Virology 57, 93-111-12. O'Farrell, P.H., Kutter, E., and Nakani3hi, M. (1980). Mol. Gen. Genet.
179, 421-435.13. Bujard, H., Hendrick3on, H.E. (1973). Europ. J. Biochem. 33, 517-528.14. Von Gabain, A., Hayward, G.S., and Bujard, H. (1976). Mol. Gen. Genet.
143, 279-290.15. Sanger, F., Coulson, A.R., Hong, G.F., Hill, D.F., and Petersen, G.B.
(1982). J. Mol. Biol. 162, 729-773-16. Donelli, G., Dore, E., FronUli, C , and Grandolfo, M.E. (1975). J. Mol.
Biol. 94, 555-564.17. Krasln, F. (1979). Biopolyners 18, 2353-2356.18. Hershey, A.D. and Burgi, E. (1960). J. Mol. Biol. 2, 143-152.19. Wickner, R.B., Boutelet, F., and Hllger, F. (1983). Mol. Cell. Biol. 3,
415-420.20. Mortimer, R.K. and Schild, D. (1980). Microbiol. Rev. 44, 519-571.21. Klapholz, S. and Esposito, R.E. (1982). Mol. Cell. Biol. 2, 1399-1409.22. McClelland, M., Kes3ler, L.G., and Bittner, M. (1984). Proc. Natl. Acad.
Sci. USA 81, 983-987.
5664