Embed Size (px)
Citation preview
SEQUENCE STRATIGRAPHY, DEPOSITIONAL HISTORY, AND
HYDROCARBON POTENTIAL OF THE MANCOS SHALE,
UINTA BASIN, UTAH
by
Andrew Donald McCauley
A thesis submitted to the faculty of The University of Utah
in partial fulfillment of the requirements for the degree of
Master of Science
in
Geology
Department o f Geology and Geophysics
The University o f Utah
December 2013

Copyright © Andrew Donald McCauley 2013
All Rights Reserved

The U n i v e r s i t y o f Ut a h G r a d u a t e S c h o o l
STATEMENT OF THESIS APPROVAL
The thesis of _________________ Andrew Donald McCauley
has been approved by the following supervisory committee members:
Lauren P. Birgenheier , Chair 8/28/13Date Approved
Cari Johnson , Member 9/10/13Date Approved
Robert Ressetar , Member 8/28/13Date Approved
and by ____________________ John M. Bartley____________________ , Chair/Dean of
the Department/College/School o f _____________Geology and Geophysics____________
and by David B. Kieda, Dean of The Graduate School.

ABSTRACT
The Mancos Shale, an organic-lean marine mudstone dominated by detrital quartz
and clay, was deposited into the Upper Cretaceous Western Interior Seaway. It is a
proven source rock with potential as a target for hydrocarbon production from horizontal
drilling and hydraulic fracturing, but prospective reservoir target intervals from its 4,000
ft (1220 m) thickness must be identified and characterized. The distribution of lithofacies
throughout the Mancos has not previously been studied in detail, so this formation
remains undifferentiated and the relationship with paleodepositional up- and downdip
strata undefined. Previous core-based analysis has provided a depositional and sequence
stratigraphic framework for predicting the distribution of lithofacies in the Mancos.
However, a unified, basin-wide facies and sequence stratigraphic correlation which tests
existing outcrop and core-based models is lacking. 157 wireline logs were
chronostratigraphically correlated across the basin to build a regional subsurface map and
cross sections that highlight stacking patterns, regional facies relationships, stratal
architecture, and sequence stratigraphy within a depositional framework. A sequence
stratigraphic model is established for the Mancos Shale, which incorporates seminal
outcrop-based models from strata of central Utah, Mancos core, and stacking patterns
identified from wireline log data.
The Mancos thickens to the north and west, matching regional trends of
tectonically driven subsidence, the most significant control on accommodation. The
Mancos Shale consists of 29 4th order T-R cycles, which can be stacked to form four 3rd
order cycles and a single 2nd order cycle. Whereas the stacking patterns of 2nd and 3rd
order cycles are consistent across the basin, suggesting allocyclic control, 4th order cycles
are more variable, influenced by both allocyclic and autocyclic controls. Deposition of
the Mancos evolved from a low gradient ramp, to a deeper water basin, which was then
infilled by basin-floor fans. Two organic-rich facies associations, each corresponding to
transgressive and early highstand sequence sets, heterolithic facies of the Juana Lopez
and lowermost Blue Gate (FA1) and sediment starved shelf deposits of the Lower Blue
Gate (FA2) offer the most prospective intervals for unconventional hydrocarbon
production. Preliminary petrophysical analysis and basin modeling corroborate this
analysis.
iv
TABLE OF CONTENTS
ABSTRACT............................................................................................................................ iii
LIST OF FIGURES.............................................................................................................. vii
ACKNOWLEDGEMENTS.................................................................................................. ix
Chapter
1 TRANSGRESSIVE-REGRESSIVE CYCLES IN THE MANCOS SHALE,UINTA BASIN, U TA H ................................................................................................... 1
Abstract..................................................................................................................................... 1Introduction.............................................................................................................................. 3Geologic Background............................................................................................................. 6Dataset.....................................................................................................................................14Methods and Approach.........................................................................................................18Results.....................................................................................................................................23Discussion.............................................................................................................................. 33Conclusions............................................................................................................................ 44
2 DEPOSITIONAL SEQUENCE STRATIGRAPHY AND HYDROCARBON POTENTIAL OF THE MANCOS SHALE, UINTA BASIN, U TA H ................... 47
Abstract...................................................................................................................................47Introduction............................................................................................................................ 49Geologic Background...........................................................................................................53Dataset.....................................................................................................................................56Methods and Approach.........................................................................................................60Results.....................................................................................................................................63Discussion.............................................................................................................................. 81Conclusions.......................................................................................................................... 112
Appendices
A WELL DATABASE.................................................................................................... 116

B REVISED LOWER MANCOS STRATIGRAPHY................................................143
REFERENCES................................................................................................................... 146
vi
LIST OF FIGURES
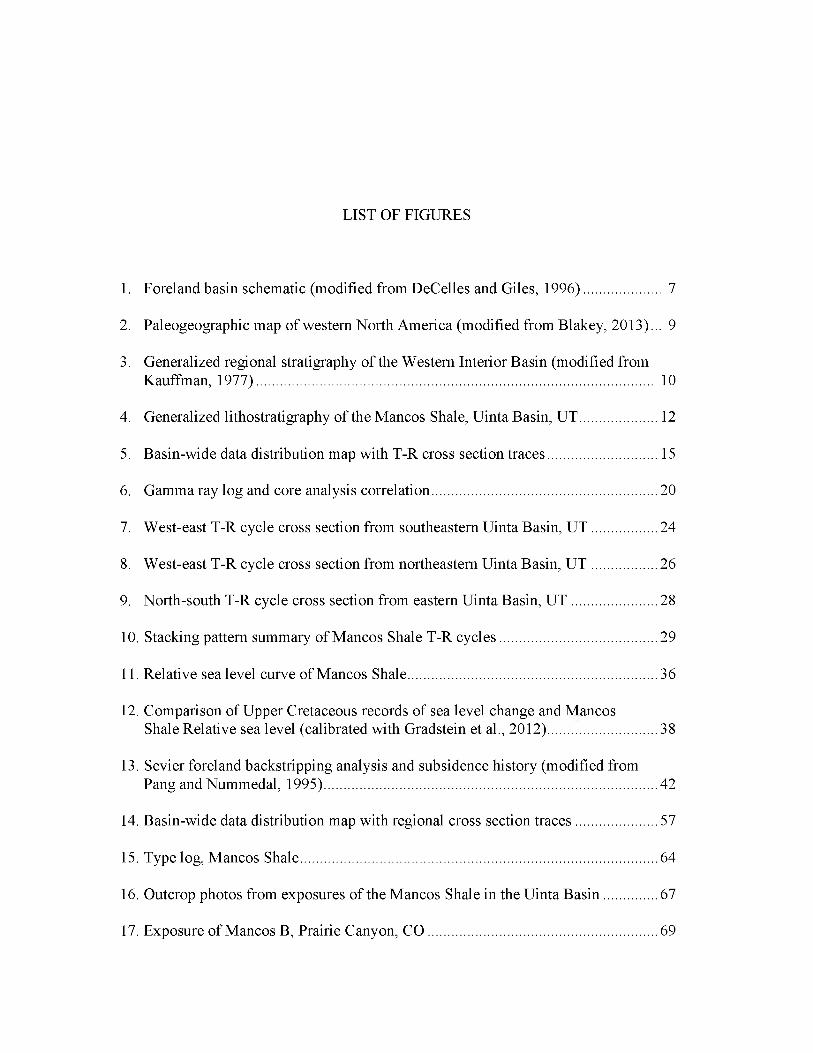
1. Foreland basin schematic (modified from DeCelles and Giles, 1996)..................... 7
2. Paleogeographic map of western North America (modified from Blakey, 2013) ... 9
3. Generalized regional stratigraphy of the Western Interior Basin (modified from Kauffman, 1977)............................................................................................................ 10
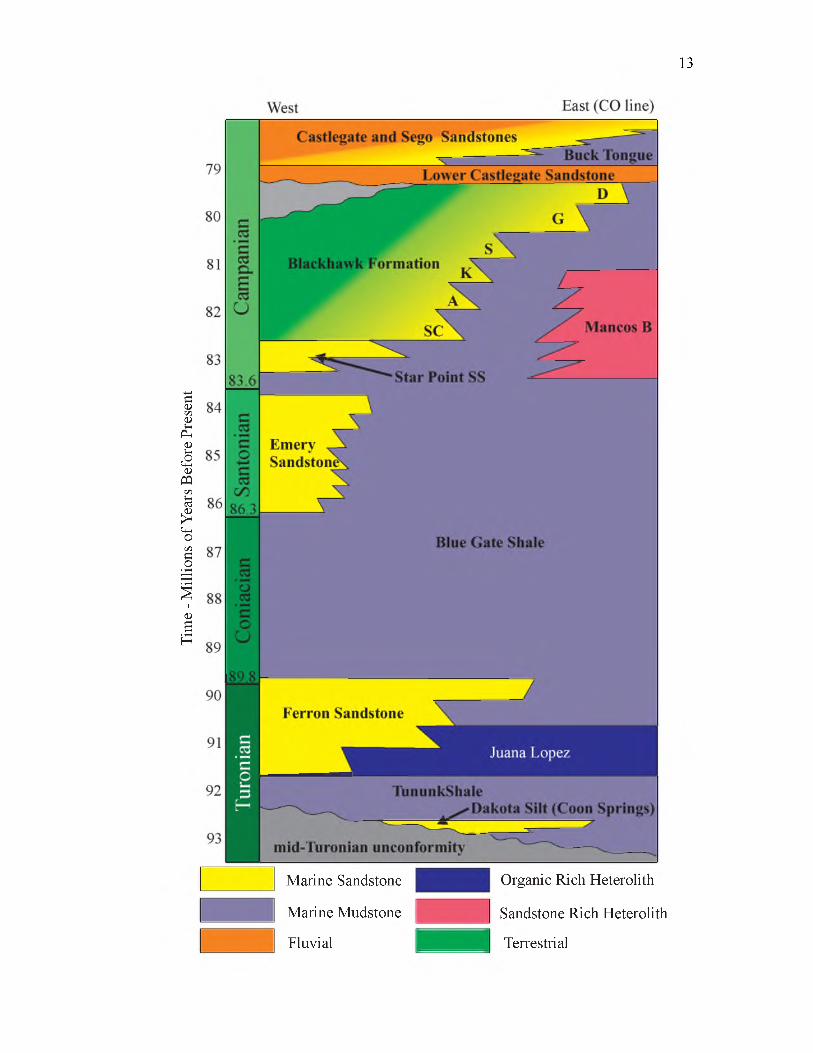
4. Generalized lithostratigraphy of the Mancos Shale, Uinta Basin, U T.....................12
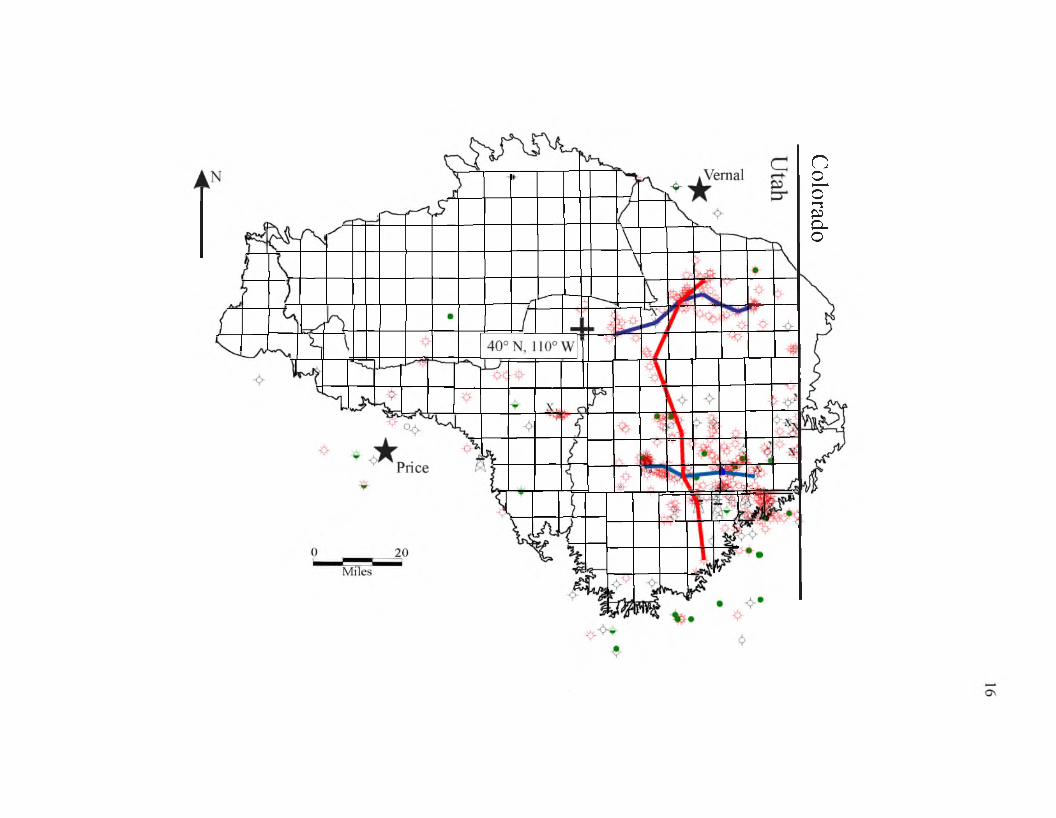
5. Basin-wide data distribution map with T-R cross section traces............................. 15
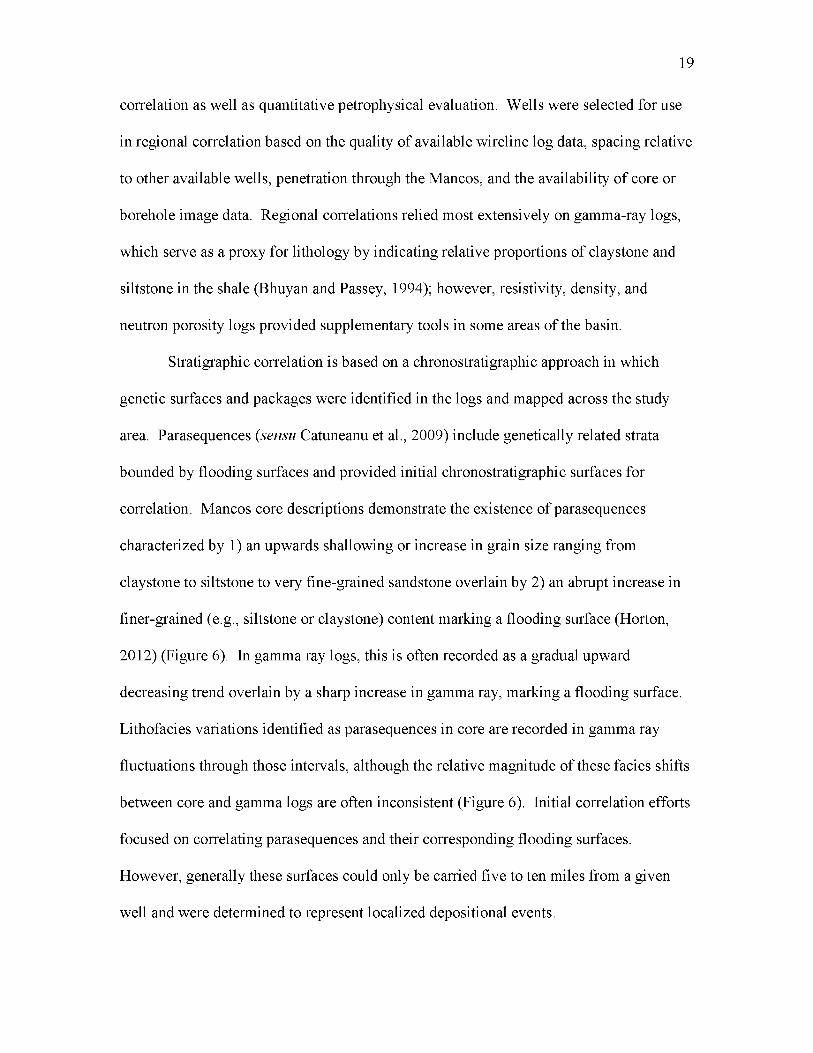
6. Gamma ray log and core analysis correlation............................................................. 20
7. West-east T-R cycle cross section from southeastern Uinta Basin, U T ................. 24
8. West-east T-R cycle cross section from northeastern Uinta Basin, U T ................. 26
9. North-south T-R cycle cross section from eastern Uinta Basin, U T .......................28
10. Stacking pattern summary of Mancos Shale T-R cycles.......................................... 29
11. Relative sea level curve of Mancos Shale....................................................................36
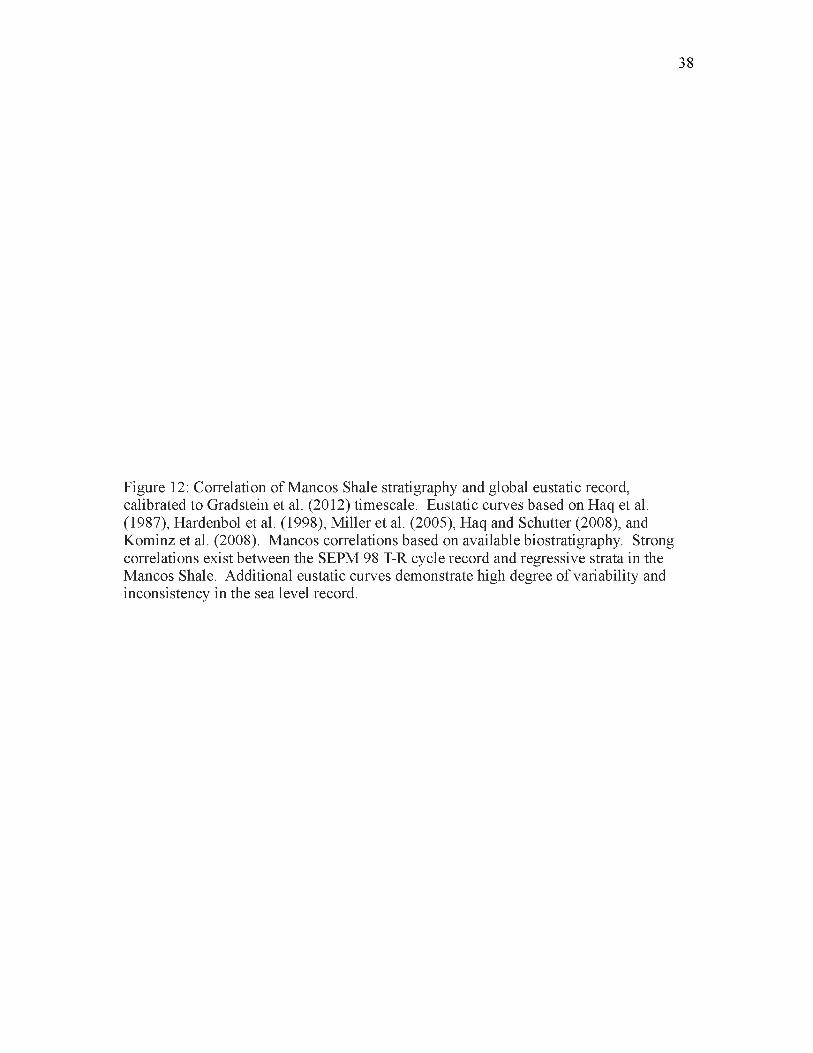
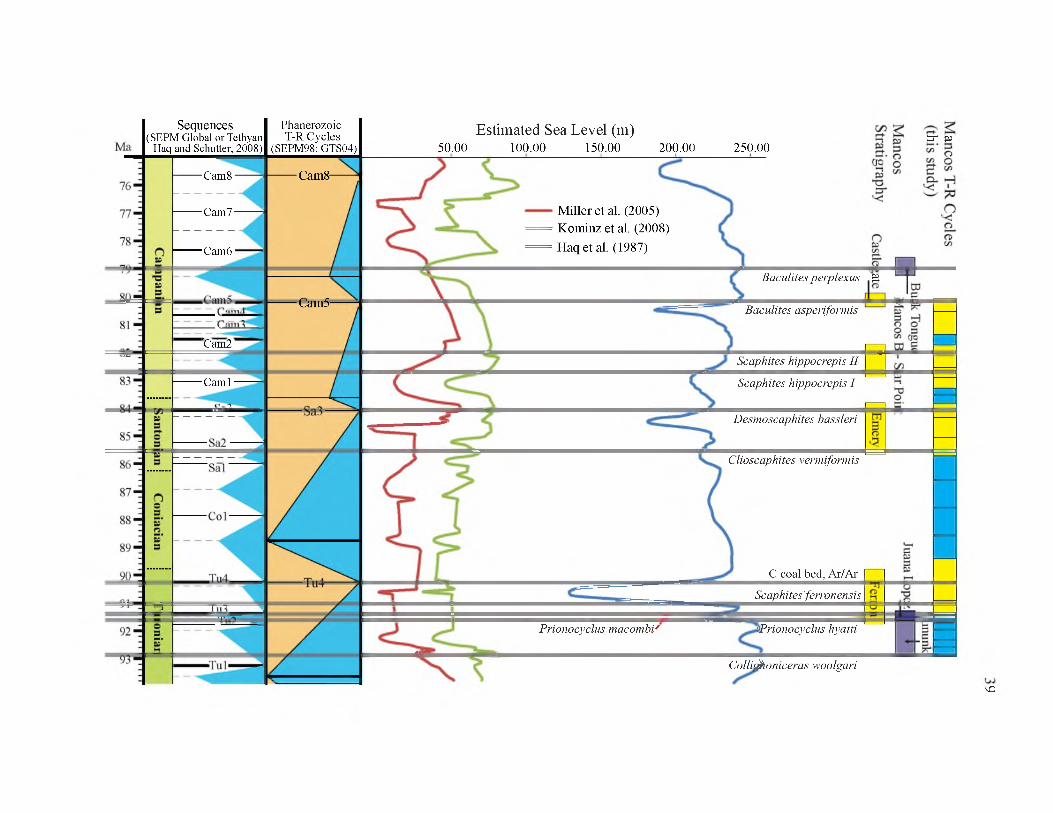
12. Comparison of Upper Cretaceous records of sea level change and MancosShale Relative sea level (calibrated with Gradstein et al., 2012)............................. 38
13. Sevier foreland backstripping analysis and subsidence history (modified from Pang and Nummedal, 1995).......................................................................................... 42
14. Basin-wide data distribution map with regional cross section traces......................57
15. Type log, Mancos Shale.................................................................................................64
16. Outcrop photos from exposures of the Mancos Shale in the Uinta B asin .............. 67
17. Exposure of Mancos B, Prairie Canyon, C O .............................................................. 69
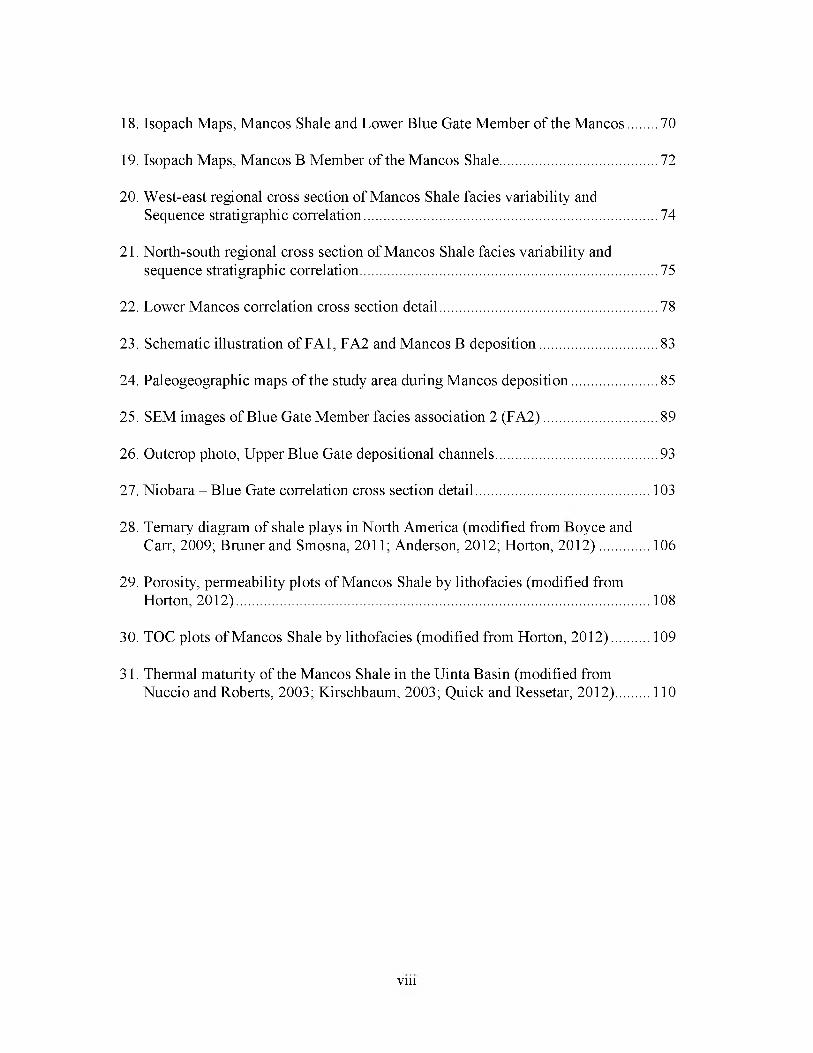
18. Isopach Maps, Mancos Shale and Lower Blue Gate Member of the M ancos........70
19. Isopach Maps, Mancos B Member of the Mancos Shale.......................................... 72
20. West-east regional cross section of Mancos Shale facies variability and Sequence stratigraphic correlation................................................................................74
21. North-south regional cross section of Mancos Shale facies variability and sequence stratigraphic correlation.................................................................................75
22. Lower Mancos correlation cross section detail...........................................................78
23. Schematic illustration of FA1, FA2 and Mancos B deposition............................... 83
24. Paleogeographic maps of the study area during Mancos deposition.......................85
25. SEM images of Blue Gate Member facies association 2 (FA2).............................. 89
26. Outcrop photo, Upper Blue Gate depositional channels............................................93
27. Niobara - Blue Gate correlation cross section detail...............................................103
28. Ternary diagram o f shale plays in North America (modified from Boyce and Carr, 2009; Bruner and Smosna, 2011; Anderson, 2012; Horton, 2012).............106
29. Porosity, permeability plots o f Mancos Shale by lithofacies (modified from Horton, 2012)................................................................................................................ 108
30. TOC plots of Mancos Shale by lithofacies (modified from Horton, 2012)..........109
31. Thermal maturity o f the Mancos Shale in the Uinta Basin (modified from Nuccio and Roberts, 2003; Kirschbaum, 2003; Quick and Ressetar, 2012).........110
viii

ACKNOWLEDGEMENTS
This project would not have been possible without the dedicated help from many
people. I would first like to thank my advisor, Dr. Lauren Birgenheier, for her help
introducing me to the Mancos, in the field, in the literature, in our discussions, and for
guiding me from “squiggle matching” to a more detailed understanding of this formation.
Her countless hours of editing my writing should not go unrecognized. The other
members of my committee, Dr. Cari Johnson and Dr. Robert Ressetar, each provided
great support during my time in Utah. Other faculty in the department and researchers
involved in the project, Dr. John Bartley, Dr. Stephanie Carney, Dr. Bill Keach, Dr. John
McLennan, and Dr. Lisa Stright, each exposed me to different questions and research
tools to consider in my own work. In addition, several undergraduate researchers have
done some really nice work with different aspects of Mancos petrophysics, Ryan Hillier,
Laini Larsen, and Ziqiang Yuan. James Taylor provided invaluable logistical support. I
also need to thank Brendan Horton for the detailed work he did to lay the groundwork for
this study, and his efforts to bring me up to speed and help me get rolling on the project
during my first year. This interdisciplinary project has exposed me to a number of
intelligent and dedicated researchers across a variety of related fields.
My experience at the University of Utah has been overwhelmingly positive,
thanks to the people here in the department and the natural beauty of this place. The

dedicated faculty and staff have made this a great environment to learn and work. My
classmates have been a pleasure to work with, and their help with matters both technical
and nontechnical have each been greatly appreciated. Finally, I would like to thank my
wonderful family for their unwavering support of my efforts to work with rocks.
x
CHAPTER 1
TRANSGRESSIVE-REGRESSIVE CYCLES IN THE MANCOS SHALE,
UINTA BASIN, UTAH
Abstract
The Upper Cretaceous Mancos Shale is an organic-lean, silty mudstone deposited
across much of the Western Interior Seaway of North America during the Sevier
Orogeny. This formation is dominated by fine-grained detrital quartz and clay with a few
carbonate-rich intervals. Development of hydrocarbons from this 4,000 ft (1,220 m)
thick mudstone requires a detailed understanding of lateral and vertical heterogeneity of
lithofacies, geomechanical properties, and hydrocarbon potential. Correlation of gamma-
ray logs, tied to detailed core descriptions, reveals that the Mancos Shale consists of
twenty-nine 4th order transgressive-regressive (T-R) cycles, which can be mapped
through marine mudstone deposits of the eastern Uinta Basin in Utah. T-R cycles include
genetically related strata bounded by maximum regressive surfaces (MRS) and include a
maximum flooding surface (MFS) that separates a lower transgressive phase from an
upper regressive phase. The change in claystone and siltstone content from one T-R
cycle relative to the underlying T-R cycle indicates the net change in the relative position
of shoreline, either basinward (net regressive) or landward (net transgressive) during that
period of deposition. Four 3rd order T-R cycles in the Mancos Shale are formed by the

cumulative changes in relative shoreline of stacked sets of 4th order T-R cycles, and one
2nd order T-R cycle is established by these component 3rd order cycles.
Analysis of basin-wide stacking patterns distinguishes regionally significant
surfaces from local heterogeneities and aids in the interpretation of offshore sequence
stratigraphy and in differentiating allocyclic versus autocyclic controls on deposition.
Driving mechanisms for relative sea level change vary with hierarchical rank.
Correlative 4th order T-R cycles display generally consistent stacking patterns, but lateral
variations are commonly present, suggesting the influence of both autocyclic and
rdallocyclic controls. In contrast, 3 order T-R cycles are characterized by consistent
trends in relative sea level changes throughout the study area, suggesting allocyclic
rdcontrols dominate relative sea level changes of this rank. 3 order relative sea level
changes can be tied to the global eustatic record, whereas 2nd order temporal trends are
common to other deposits of the Western Interior Seaway and appear to mainly reflect
tectonic activity in the Sevier hinterland. Furthermore, regional thickening from south to
north within the Mancos Shale suggests an increase in tectonic subsidence rates from
south to north across the Uinta Basin. Two transgressive intervals, corresponding to 4th
order cycles 5 and 12, offer the most promising targets for hydrocarbon production
because they correspond to 2nd, 3rd, and 4th order transgressive strata. This study
establishes a regionally significant sequence stratigraphic framework to identify and
predict internal distribution of lithofacies, providing a first-pass tool for assessing the
relative hydrocarbon potential of intervals within the Mancos Shale, from gamma ray
logs.
2

Introduction
Development of horizontal drilling and hydraulic fracturing allows the production
of natural gas and oil directly from organic-rich mudstone, strata previously considered
too impermeable to serve as hydrocarbon reservoirs. The need to characterize these
poorly-understood unconventional reservoirs has contributed to a rapid expansion of
research and a growing recognition of the dynamic and varied depositional environment
that typifies many mud-dominated systems (Schieber, 1999; Aplin and Macquaker,
2011). The stratigraphic evolution of mudstone-dominated successions and relationships
between sedimentation and base-level change are still enigmatic, particularly as they
relate to the lateral continuity of reservoir properties and corresponding variations in
production characteristics. However, from an exploration perspective, this is precisely
the challenge: to develop a meaningful genetic framework to guide development for the
target mud-dominated portion of the stratigraphy, which is typically geographically
removed from the paleodepositional updip equivalent succession.
The Mancos Shale was first described by Cross and Purington (1899) as “an
almost homogenous body of soft, dark gray or nearly black, carbonaceous clay shale,
varied only by the presence of a few thin bands or concretions of pure limestone ... there
are no practicable horizons for the subdivision of the complex in areal mapping” (p. 4).
This perception that mudstones are homogenous bodies of uniform deposition has been
significantly revised by new research. Research concerning mudstone depositional
processes (e.g., Schieber et al., 2007; Macquaker et al., 2007, 2010; Bhattacharya and
MacEachern, 2009), mudstone porosity and permeability (e.g., Loucks et al., 2009, 2012;
Slatt and O’Brien, 2011; Chalmers et al., 2012; Modica and Lapierre, 2012), and
3

mudstone sequence stratigraphy (e.g., Abouelresh and Slatt, 2012; Angulo and Buatois,
2012; Slatt and Rodriguez, 2012) has begun to fill significant knowledge gaps. The
transition between proximal marine facies and their downdip equivalents remains poorly
understood, particularly in relatively shallow epicontinental settings, like those of the
Cretaceous Western Interior Seaway. Defining a meaningful stratigraphic framework has
been particularly problematic in an unusually thick package like the Mancos Shale, which
is at least 4,000 ft (1,220 m) thick in the Uinta Basin. Understanding the relationships
between important lithological properties such as permeability, total organic carbon
(TOC), mineralogy, and depositional setting will allow better reservoir modeling of and
production from these tight hydrocarbon plays.
Multidisciplinary study of the Mancos Shale provides the opportunity for
exploring the relationship between rock properties, depositional environment, and
sequence stratigraphy in offshore siliciclastic mudstone. Stacking pattern analysis has
been used to demonstrate a relationship between organic richness and transgressive
packages in a variety of shale formations (Slatt and Rodriguez, 2012). This relationship
is further confirmed in high-resolution core analysis of the Mancos Shale (Kennedy,
2011; Horton, 2012). Horton (2012) identified eleven lithofacies from Mancos cores,
which were placed in an offshore depositional framework, consisting of the prodelta,
mudbelt, and sediment-starved shelf environments, in order from proximal to distal
relative to shoreline siliciclastic input. Kennedy (2011) and Horton (2012) also
developed preliminary sequence stratigraphic models from Mancos cores, suggesting that
proximal to distal trends could be identified in core and given a sequence stratigraphic
context. Lithofacies were tied to systems or sequence tracts, allowing reservoir facies to
4

be targeted based on their relationship with changes in relative sea level. However, the
regional and stratigraphic extent of these sequence stratigraphic models has yet to be
tested.
Previous workers in the Mancos Shale have either focused in detail on a relatively
small region and/or stratigraphic interval (e.g., Molenaar and Wilson, 1990; Molenaar
and Cobban, 1991; Hampson et al., 1999; Anderson and Harris, 2006) or a more
extensive interval with few surfaces of correlation within the main body of the Mancos
Shale (e.g., Johnson, 2003a; Hettinger and Kirschbaum, 2003; Kirschbaum, 2003; Rose
et al., 2004; Anna, 2012), so there is a limited established framework for identifying
lateral sequence stratigraphic and facies transitions. Analysis of stacking pattern
variations between time-correlative packages of marine shale within the Mancos from
wells around the basin establishes the degree of lateral depositional changes in these
strata. This study seeks to define a chronostratigraphic and genetic framework to
meaningfully divide the Mancos Shale in the depositionally distal, eastern portions of the
Uinta Basin.
Transgressive-regressive (T-R) cycles provide insight into the sequence
stratigraphy of distal depositional environments where stratal architecture and genetic
surfaces, including correlative conformities, are often cryptic (Embry, 2002). Recent
workers have predominantly applied a T-R sequence model to analysis of offshore shales,
including identification of 2nd, 3rd, and 4th order T-R cycles (e.g., Lash and Engelder,
2011; Sonnenberg, 2011; Hammes et al., 2011). This study uses a database of several
hundred well logs to create a basin-wide subsurface genetic correlation of T-R sequences
within the depositionally most distal expression of the Mancos Shale in the eastern Uinta
5
Basin. The Mancos Shale is an offshore system influenced by both fluvial deltaic and
wave-dominated deposition from the western shoreline of the Cretaceous Western
Interior Seaway. Fundamentally, grain size varied as a function of distance from this
shoreline; changes in average grain size reflect relative sea level fluctuation, and can be
correlated with this in mind. Stacking patterns of individual wells are compared to
identify which changes in relative sea level are regionally correlative and hence reflect
allocyclic controls, such as eustasy and tectonic subsidence, and which are only locally
evident and hence reflect autocyclic delta lobe switching or local topographic variation.
This ultimately allows for the identification of regionally significant sequence
stratigraphic surfaces. By placing stacking patterns in a sequence stratigraphic model,
lateral and vertical changes in facies can be identified and predicted in this distal marine
shale, and a model established for variability within other fine-grained deposits of the
Cretaceous Western Interior Seaway.
Geologic Background
During the Cretaceous, western North American geology was dominantly
influenced by the Sevier and subsequent Laramide Orogenies. In central Utah, the Sevier
Orogeny was characterized by north-south trending thrust faulting propagating from west
to east (DeCelles, 1994). The loading of the overthickened Sevier orogenic belt created
an adjacent foreland basin, or foredeep, to the east as flexural loading caused rapid
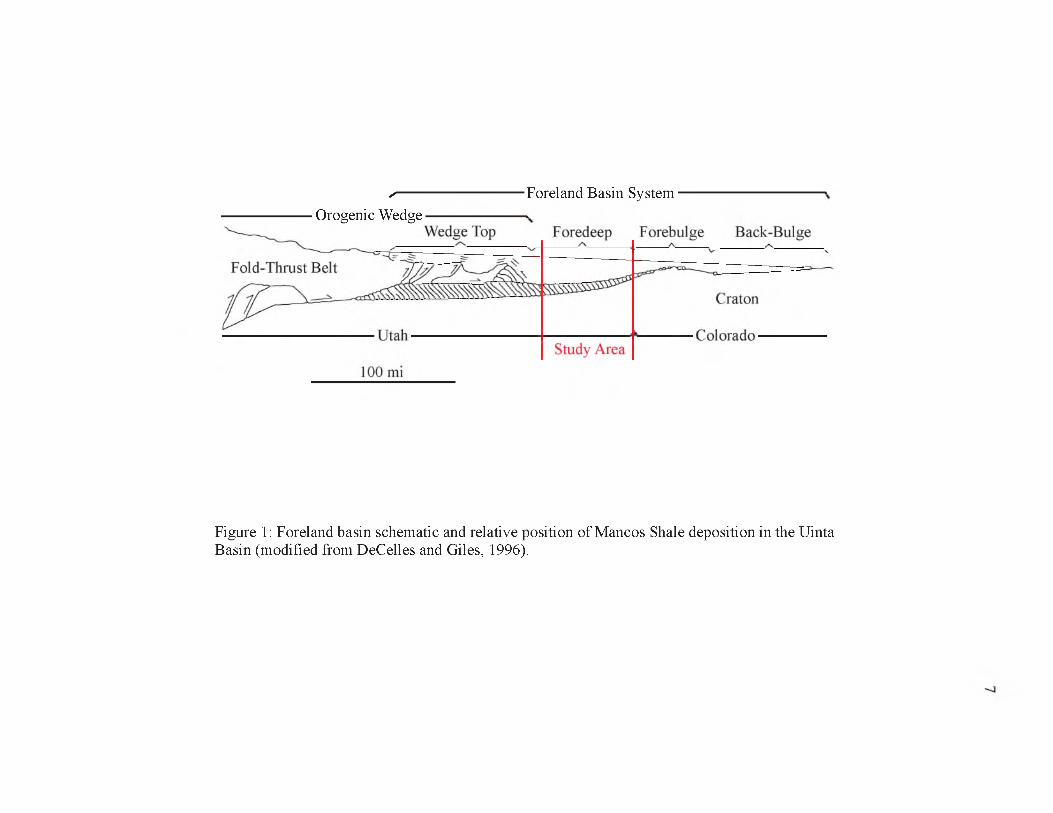
subsidence adjacent to the thrust front (DeCelles and Giles, 1996) (Figure 1). This
faulting contributed to crustal thickening and a high standing plateau along the orogenic
foreland (Livaccari, 1991), which rapidly shed sediment into this adjacent basin
(Johnson, 2003b). The forebulge migrated progressively eastward over the duration of
6
✓-------------------------- Foreland Basin System------------------------------Orogenic Wedge
Figure 1: Foreland basin schematic and relative position of Mancos Shale deposition in the Uinta Basin (modified from DeCelles and Giles, 1996).
Sevier thrust propagation (DeCelles and Coogan, 2006), which contributed to an
unconformity between the Dakota and Mancos Formations in the Uinta Basin during the
Lower Turonian, but had moved east of the basin by the Middle Turonian (White et al.,
2002; Kirschbaum and Mercier, 2013). This north-south trending foreland basin formed
the Western Interior Seaway during Cretaceous sea-level highstand, an epicontinental
seaway linking the paleo-Gulf of Mexico to the Arctic Ocean.
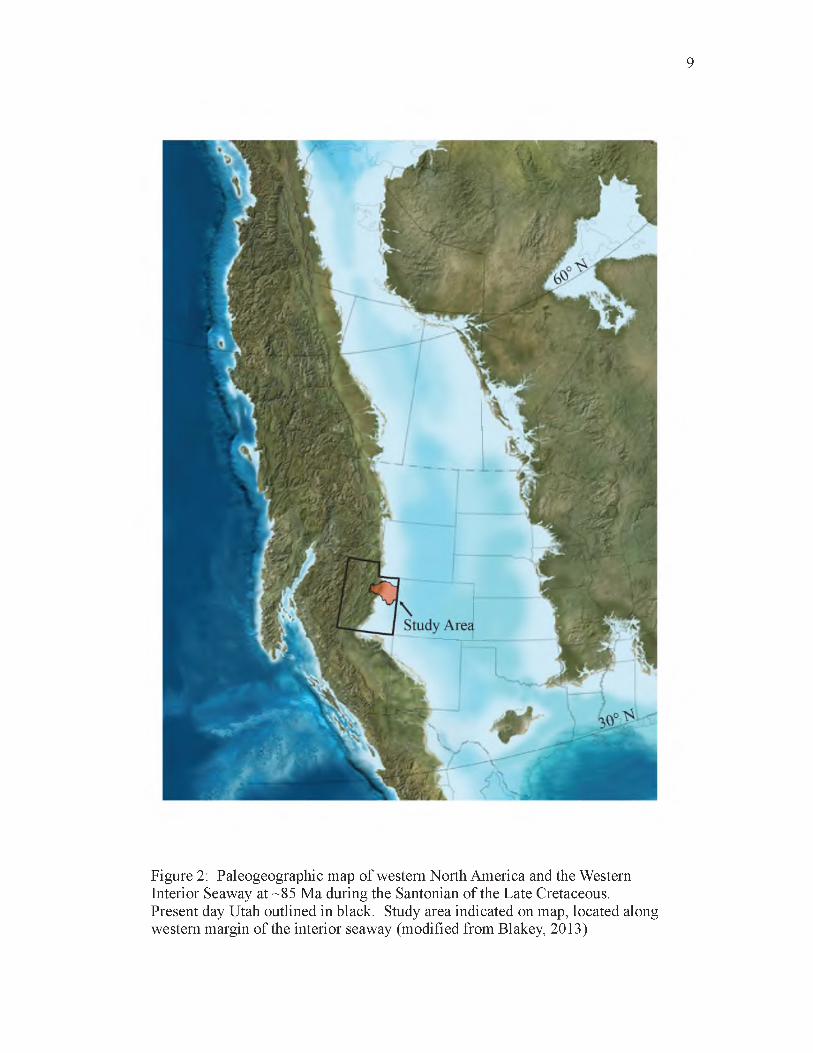
The Western Interior Seaway extended more than 3,000 mi (4,800 km) from north
to south and up to 1,000 mi (1,600 km) in width, from the Sevier thrust front in Utah to
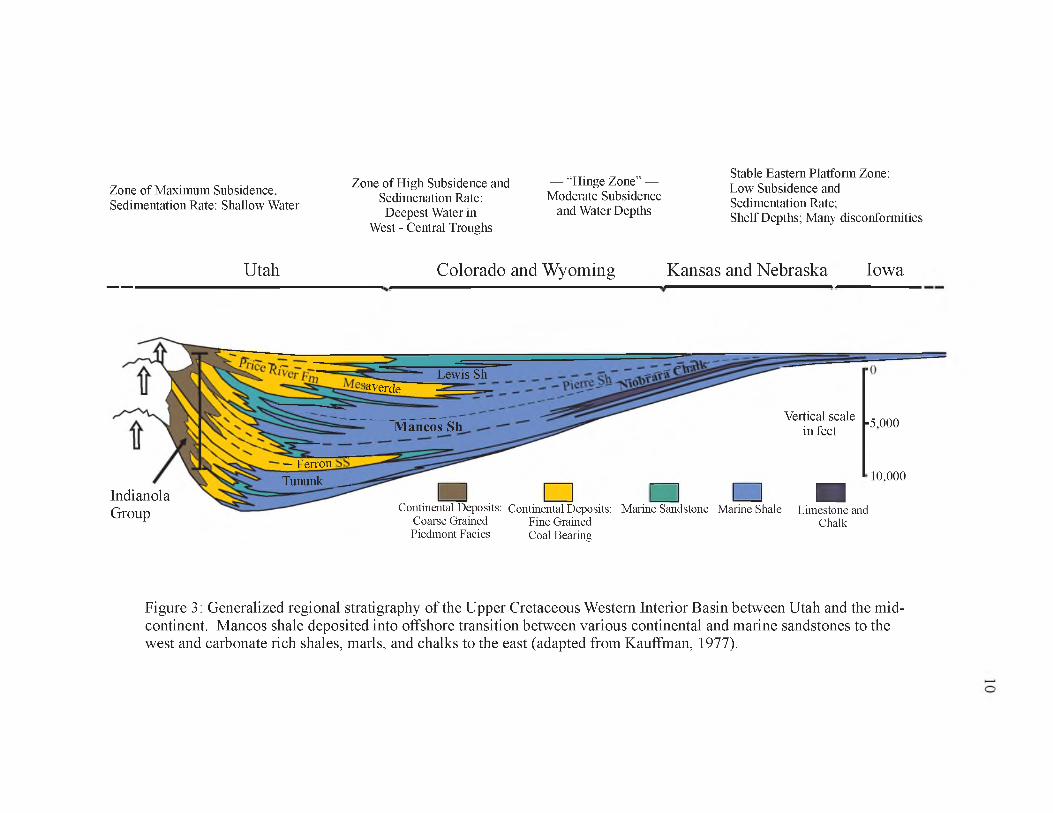
present-day Ohio (Figure 2). This broad depression had fairly uniform structure, with
active tectonic subsidence to the west and a ramped shallowing to the east (Kauffman,
1977) (Figure 3). The Mancos Shale and equivalent marine mudstone units were
deposited across much of the seaway from the Cenomanian through the Early
Campanian, approximately 96 to 80 Ma (Schwans, 1995). Marine deposition was
dominated by siliciclastic, silt- and clay-sized detritus delivered from the western
coastline, with local and regional variations in depositional style, such as wave- versus
river-dominated delta systems, and during periods of variable rates of tectonically driven
subsidence, with increasing calcareous deposits along the shallower, eastern margin
(Kauffman, 1977) (Figure 3). The Mancos Shale in the Uinta Basin consists of five
major lithostratigraphic members, the basal Tununk Shale Member, which is overlain by
the Juana Lopez Member, the Blue Gate Shale Member, the Prairie Canyon or Mancos B
Member, and the uppermost Buck Tongue. These offshore strata variously interfinger
with proximal marine and coastal plain deposits to the west, including the Ferron and
Emery Sandstones, and members of the Mesaverde Group, including the Star Point
8
9
Figure 2: Paleogeographic map of western North America and the Western Interior Seaway at ~85 Ma during the Santonian of the Late Cretaceous.Present day Utah outlined in black. Study area indicated on map, located along western margin of the interior seaway (modified from Blakey, 2013)
Zone of Maximum Subsidence, Sedimentation Rate: Shallow Water
Zone of High Subsidence and Sedimenation Rate: Deepest Water in
West - Central Troughs
— “Hinge Zone” — Moderate Subsidence
and Water Depths
Stable Eastern Platform Zone:Low Subsidence and Sedimentation Rate;Shelf Depths; Many disconfonnities
Utah Colorado and Wyoming Kansas and Nebraska Iowa
Lewis ShLaverdfi
Mancos Sh
— Ferron Tununk __ _
IndianolaGroup
Vertical scale in feet -5,000
■ □ ■ ■ ■Continental Deposits: Continental Deposits: Marine Sandstone Marine Shale Limestone and
Coarse Grained Fine Grained ChalkPiedmont Facies Coal Bearing
10,000
Figure 3: Generalized regional stratigraphy of the Upper Cretaceous Western Interior Basin between Utah and the midcontinent. Mancos shale deposited into offshore transition between various continental and marine sandstones to the west and carbonate rich shales, marls, and chalks to the east (adapted from Kauffman, 1977).
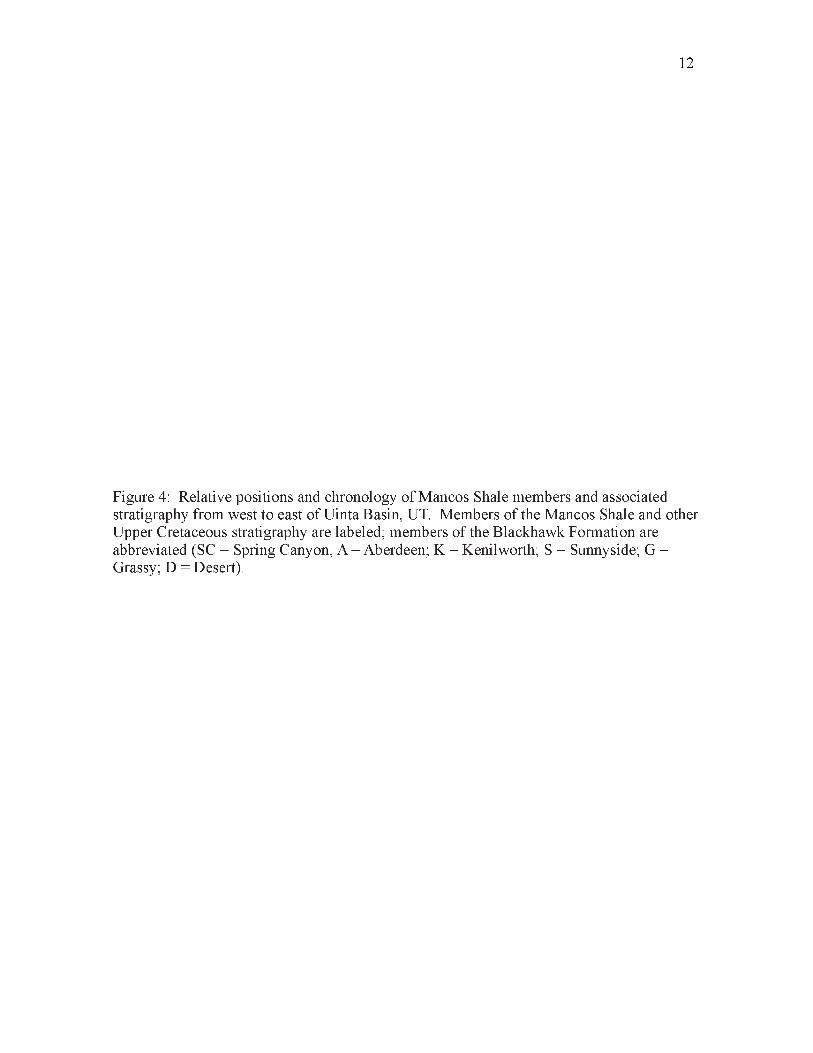
Sandstone, Blackhawk Formation, and Castlegate Sandstone (Fouch et al., 1983) (Figure
4). The chronostratigraphic relationships between the proximal marine and coastal plain
deposits in the west and the more distal marine lithostratigraphic members that make up
the Mancos Shale are not well defined.
The Late Cretaceous was a time of global greenhouse conditions and highstand
sea level. High levels of atmospheric CO2 produced during accelerated sea floor
spreading and enhanced off-ridge volcanism contributed to hothouse conditions and
stimulated organic carbon production (Arthur et al., 1985). Extensive mudstone deposits
over continental shelves and in deeper water during the Cretaceous record thirteen major
eustatic fluctuations in sea level (Cooper, 1977) and three major ocean anoxic events
(Arthur and Schlanger, 1979; Jenkyns, 1980). Higher order cyclical changes in deep-
water strata during the Cenomanian-Turonian (Sageman et al., 1997; Meyers et al., 2012)
and Coniacian-Santonian (Locklair and Sageman, 2008) have been tied to orbital forcing
and Milankovitch periodicities. The interplay between eustasy, global climate, and local
Sevier foreland tectonics are recorded by changes in sedimentary structures and the
lithology of strata deposited in the Western Interior Seaway.
Petroleum source rocks deposited during the Late Cretaceous highstand are
abundant worldwide, and the Western Interior Seaway is no exception. Other organic-
rich shales of the seaway, including the Niobrara and Mowry Formations, are proven
source rocks in many petroleum systems of the Rocky Mountains and central United
States (Kirschbaum, 2003; Sonnenberg, 2011). The Mancos Shale, which thermally
matured during the subsidence and burial of the Uinta Basin by the Laramide Orogeny
11
12
Figure 4: Relative positions and chronology of Mancos Shale members and associated stratigraphy from west to east of Uinta Basin, UT. Members of the Mancos Shale and other Upper Cretaceous stratigraphy are labeled; members of the Blackhawk Formation are abbreviated (SC = Spring Canyon; A = Aberdeen; K = Kenilworth; S = Sunnyside; G = Grassy; D = Desert).
Tim
e - M
illio
ns
of Ye
ars
Befo
re
Pres
ent
13
Marine Sandstone
Marine Mudstone
Fluvial
Organic Rich Heterolith
Sandstone Rich Heterolith
Terrestrial

14
(Nuccio and Roberts, 2003), is also a lean, but proven hydrocarbon source rock
(Kirschbaum, 2003).
Dataset
Log data from 453 wells that penetrated the Mancos Shale across the Uinta Basin
were compiled into a database. The sources of well data are varied: some data were
downloaded from the Utah Department of Natural Resources’ Division of Oil, Gas, and
Mining database (DOGM, 2013), and a significant amount of data was donated by
Anadarko Petroleum Corporation, Bill Barrett Corporation, Del Rio, Gasco, Pioneer
Resources, Questar (now QEP Resources), Wind River Resources Corporation, and XTO
Energy (now ExxonMobil Corporation). The types of data vary from well to well, but
include gamma ray, resistivity, neutron porosity and density, sonic, borehole image, and
mud logs. Of the 453 wells, 280 include wireline log data; 157 were used to construct
regional cross sections and/or isopach maps (Figure 5; Appendix A). Well log data were
collected independently by various well operators over the past half century, so
differences in logging tools, borehole conditions, and operator procedures all contribute
to variations in absolute values recorded from wells in the dataset. For that reason, well-
to-well trends are reliable but absolute values are not.
Wireline log data are collected in newly drilled wells by lowering a tool on
wireline into the borehole and recording rock properties from the drilled interval.
Wireline tools can record a variety of rock properties, including natural occurring gamma
radiation, electrical resistivity, sonic interval transit time, artificial neutron radiation
response, and photo-electric response. These petrophysical data can be used to identify

15
Figure 5: Distribution of data throughout the Uinta Basin, concentrated primarily in southeast and northeast portions of the basin. Extent of preserved, post-Mancos strata outlined in black. 457 wells included in database (Appendix A) are marked as red (gas), green (oil), or black (dry) circles. Cross sections are marked as heavy blue (Figure 7), purple (Figure 8), or red (Figure 9) lines.
Colorado
rock type and properties, including porosity, geomechanical properties, organic content,
and water and hydrocarbon saturations (Fertl and Chilingar, 1988; Passey et al. 1990;
Mullen et al., 2007; Passey et al., 2010; Vernik and Milovac, 2011). Log suites, the type
of log data recorded from each borehole, varied from well to well.
Recent core-based investigations by Kennedy (2011) and Horton (2012) provided
very useful detailed lithologic descriptions, high-resolution geochemical data, and
geomechanical test results. These core data are from among the 280 wells with log data,
and were consulted alongside the wireline logs to provide ground truth from unweathered
strata in the subsurface. Kennedy (2011) described core from a 1,712 ft (520 m) interval
of the River Gas of Utah #1 (RGU-1) well, from three miles SW of Price, UT, spanning
the top of the Tununk Member through the Ferron Sandstone and Lower Blue Gate Shale
to the lower Emery Sandstone. Horton (2012) evaluated core taken from four wells: 120
ft (36 m) intervals from three Questar wells roughly 25 miles south of Vernal, UT, the
Glen Bench 1M-4-8-22R (abbreviated “Q1” in Horton, 2012), Red Wash 8ML-6-9-24
(Q8; Horton, 2012), and Glen Bench 16M-28-8-21 (Q16; Horton, 2012), and two 120’
(36 m) intervals of the Pioneer Natural Resources Main Canyon Federal #23-7-15S-23E
(P1 and P2; Horton, 2012), located roughly 40 mi (64 km) south of the Questar wells
(Figure 5). These cores were taken from different intervals of the Lower Blue Gate
Member, and demonstrate its vertical and lateral facies variability. The core descriptions
considered details of subsurface lithology, sedimentology, and stratigraphy at the
centimeter scale. Geochemical analysis included thin section, x-ray fluorescence, x-ray
diffraction, QEMSCAN analysis, and TOC-RockEval pyrolysis (Horton, 2012). The
RGU-1 cored interval was sampled at irregular intervals of tens of feet, designed to
17

systematically capture facies variability, for geomechanical properties from unconfined
compression tests, triaxial compression tests, and indirect tensile strength tests (Kennedy,
2011). Complete descriptions of these core analyses and methods are available from
Kennedy (2011) and Horton (2012).
Existing depositional and stratigraphic models developed primarily from outcrop
and core by previous workers provided the primary lithologic background for the log-
based stratigraphy in this study; this work described members of the Mancos Shale,
including the Lower Blue Gate, Juana Lopez, and Tununk Members (Molenaar and
Cobban, 1991; Anderson and Harris, 2006; Kennedy, 2011; Horton, 2012), Ferron
Sandstone (Riemersma and Chan, 1991; Anderson and Ryer, 2004; Fielding, 2010),
Emery Sandstone (Edwards et al., 2005), isolated sandstone bodies that are distal
Blackhawk Formation equivalents, such as the Hatch Mesa Sandstone (Pattison, 2005;
Pattison et al., 2007; Pattison et al., 2009), Mancos B (Cole et al., 1997; Hampson et al.,
1999), and overlying strata of the Mesaverde Group (Yoshida, 2000; Miall and Arush,
2001; Kirschbaum and Hettinger, 2004). Key localities of previous studies were visited.
These earlier stratigraphic relationships guided the correlations presented here. Three
dimensional seismic data that cover a portion of the study area were available and were
valuable for confirming structural continuity between subsurface correlations.
Methods and Approach
PETRA was used for this study, in part because it contains correlation,
geostatistical, and petrophysical modules that can be applied to formation mapping and
evaluation. Well data were loaded as .LAS files, which allow scale manipulation during
18
correlation as well as quantitative petrophysical evaluation. Wells were selected for use
in regional correlation based on the quality of available wireline log data, spacing relative
to other available wells, penetration through the Mancos, and the availability of core or
borehole image data. Regional correlations relied most extensively on gamma-ray logs,
which serve as a proxy for lithology by indicating relative proportions of claystone and
siltstone in the shale (Bhuyan and Passey, 1994); however, resistivity, density, and
neutron porosity logs provided supplementary tools in some areas of the basin.
Stratigraphic correlation is based on a chronostratigraphic approach in which
genetic surfaces and packages were identified in the logs and mapped across the study
area. Parasequences (sensu Catuneanu et al., 2009) include genetically related strata
bounded by flooding surfaces and provided initial chronostratigraphic surfaces for
correlation. Mancos core descriptions demonstrate the existence of parasequences
characterized by 1) an upwards shallowing or increase in grain size ranging from
claystone to siltstone to very fine-grained sandstone overlain by 2) an abrupt increase in
finer-grained (e.g., siltstone or claystone) content marking a flooding surface (Horton,
2012) (Figure 6). In gamma ray logs, this is often recorded as a gradual upward
decreasing trend overlain by a sharp increase in gamma ray, marking a flooding surface.
Lithofacies variations identified as parasequences in core are recorded in gamma ray
fluctuations through those intervals, although the relative magnitude of these facies shifts
between core and gamma logs are often inconsistent (Figure 6). Initial correlation efforts
focused on correlating parasequences and their corresponding flooding surfaces.
However, generally these surfaces could only be carried five to ten miles from a given
well and were determined to represent localized depositional events.
19

20
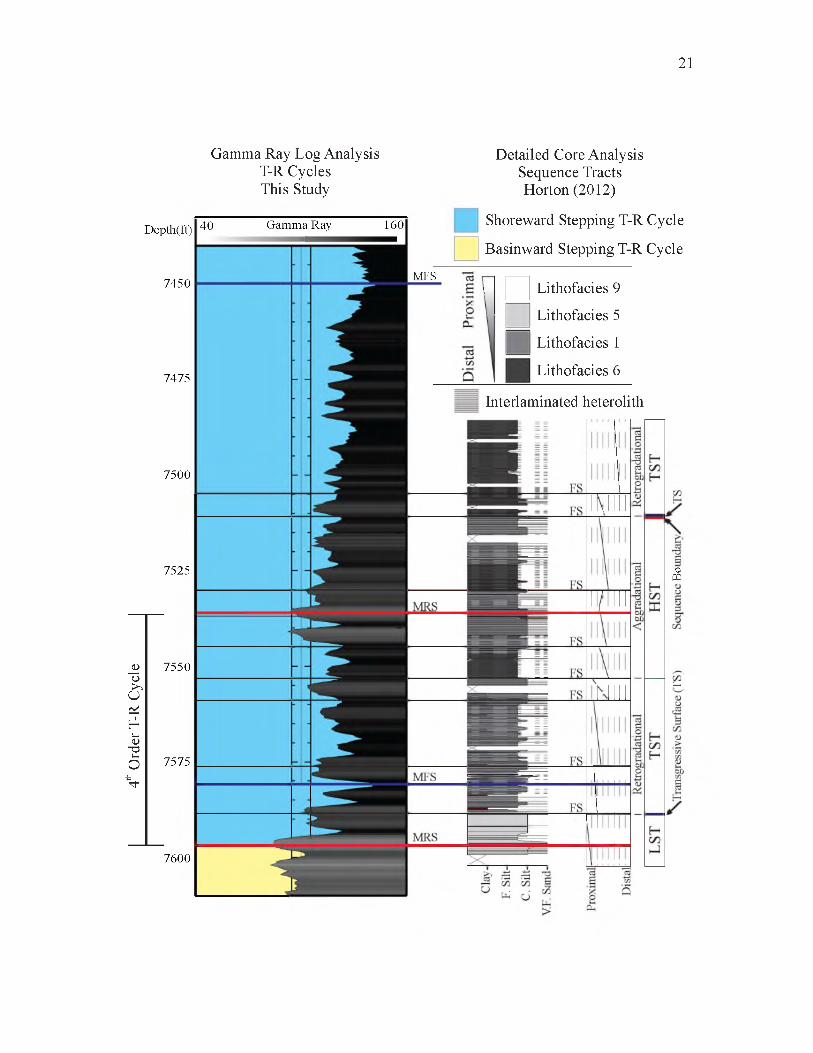
Figure 6: Correlation between gamma ray log and core analysis with T-R cycle analysis (this paper) and sequence tract analysis (Horton, 2012), respectively. 4th order MFS, MRS, and stacking patterns labeled on well log (left). Core description includes facies description, parasequence stacking patterns, and interpreted systems tracts (lowstand system tract, LST; highstand system tract, HST; transgressive system tract, TST) of Horton (2012) (right). Parasequence bounding flooding surfaces (FS) identified in core (right) correspond to fluctuations in the gamma log and 4th order T-R cycles (left; 50300 ft (15-90 m) scale) correspond generally with core based sequences (right; 5-30 ft (1.5-9 m) scale), although identified surfaces may vary by a few tens of feet. Modified from Horton (2012).
4th O
rder
T-R
Cyc
le
21
Gamma Ray Log Analysis T-R Cycles This Study
Depth(ft)
7450
40 Gamma Ray 160
7475
7500
Detailed Core Analysis Sequence Tracts Horton (2012)
Shoreward Stepping T-R Cycle
Basinward Stepping T-R Cycle
MFS aimaxiorP
a
Lithofacies 9
Lithofacies 5
Lithofacies 1
Lithofacies 6
Interlaminated heterolith
7525
7550
7575
7600
S
Cec
SH
Stacking patterns are affected by changes in relative shoreline (Catuneanu and
Zecchin, 2013). In deep-water systems, relative sea level rise is commonly preserved as
packages of gradually deepening facies (recorded as a gradual increase in gamma ray)
overlying a maximum regressive surface (MRS) and below a maximum flooding surface
(MFS). Regressive strata correspond to shallowing upwards or gradual upwards
decreasing gamma-ray activity above an MFS and below an MRS. T-R cycles are
bounded by the beginning of transgressive events (Johnson et al., 1985), and identified in
the offshore realm by the maximum regressive surface (Embry and Johannessen, 1992).
The combination of MRSs and MFSs was used to define stacked T-R cycles (Figure 6).
Transgressive-regressive cycles bounded by MRSs preserve the genetic relationships
between parasequences in environments without preserved sharp or abrupt flooding
events (Embry, 1990; 2002). T-R cycle boundaries correspond to subaerial
unconformities updip, significant time equivalent records of sea level fall, allowing
regional chronostratigraphic correlation (Embry 2002). T-R cycles share many
shortcomings of the genetic sequence model of Galloway (1989) (also called an R-T
cycle), including the influence of sedimentation on sequence boundary formation, which
become potentially diachronous. However, T-R cycles are less likely to include
genetically unrelated material within the same sequence and are more effectively
integrated with the subaerial unconformity sequence boundaries of depositional sequence
models (Embry, 2002; Catuneanu et al., 2009).
T-R cycles were correlated from well to well across the eastern Uinta Basin based
on stratigraphic position as well as well log morphology or logfacies and available core
and nearby outcrop data. These regional correlations were used to identify the regionally
22
correlative genetic units within the Mancos Shale in order to develop an internal
stratigraphic architecture and roughly chronostratigraphic framework of surfaces (MRSs)
through the formation. Wherever possible, the top of the Lower Castlegate (Lawton,
1986) was used to datum stratigraphic cross sections because it is regionally extensive
and easily identified by a blocky, clean log signature associated with fluvial channels
overlain by the Buck Tongue transgression (Yoshida, 2000), is roughly time correlative
(Fouch et al., 1983), and is the typical datum of Upper Cretaceous cross sections by other
workers (e.g., Yoshida, 2000; Hampson et al., 2001; Kirschbaum, 2003; Johnson 2003b;
Pattison, 2005). Most correlations were based on approximately 5 mi (8 km) well-to-well
spacing. This frequency captures lateral changes in stratigraphy and fits the availability
of well data.
Results
The regional extent and architecture of T-R cycles through the Mancos Shale is
evaluated from three cross sections (Figures 7, 8, and 9) and the observed patterns and
north-to-south variations are summarized (Figure 10). T-R cycles are mapped across the
basin at three scales, the 4th, 3rd, and 2nd order, each identified by their approximate
depositional duration in geological time; 4th order record several hundred thousand, 3rd
order a few million, and 2nd order a couple tens of millions of years (Slatt and Rodriguez,
2012). 4th order cycles are the fundamental unit of regional correlation because they are
the smallest regionally correlative interval of genetically related strata in the Mancos, and
demonstrate a number of fluctuations in sedimentation across the study area. In contrast,
higher rank cycles, of the 3rd and 2nd order, demonstrate consistent stacking patterns
23

24
Figure 7: West to east stratigraphic cross section hung on top of the Lower Castlegate across 25 mi (40 km) of the southeastern Uinta Basin (Figure 4). Gamma ray logs plotted with scales of 0 to 170 API. 4th order T-R cycles (1-27) document variations in stacking patterns, shoreward stepping (blue), basinward stepping (yellow), and vertically stepping (green) throughout the Mancos Shale. Relative shoreline trajectory and hence relative sea level is described at the right (red = regression, blue = transgression, green = aggradation) and indicates the presence of four 3rd order cycles. Each 4th order cycle is bounded by an upper and lower MRS, and includes a marked MFS. Well # and associated details are listed in Appendix A.
□I
I Shoreward Stepping T-R Cycle Vertically Stepping T-R Cycle Basinward Stepping T-R Cycle
4th Order MFS | Cored Interval 3ri Order MFS 3ri Order MRS

26
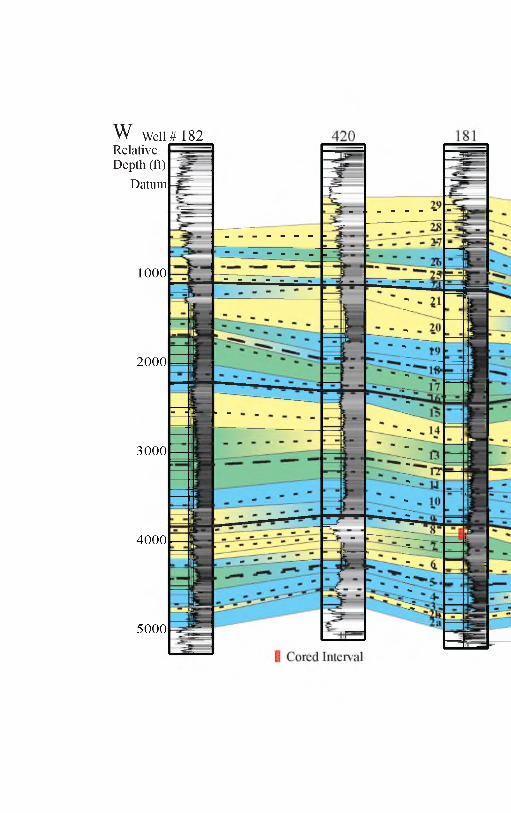
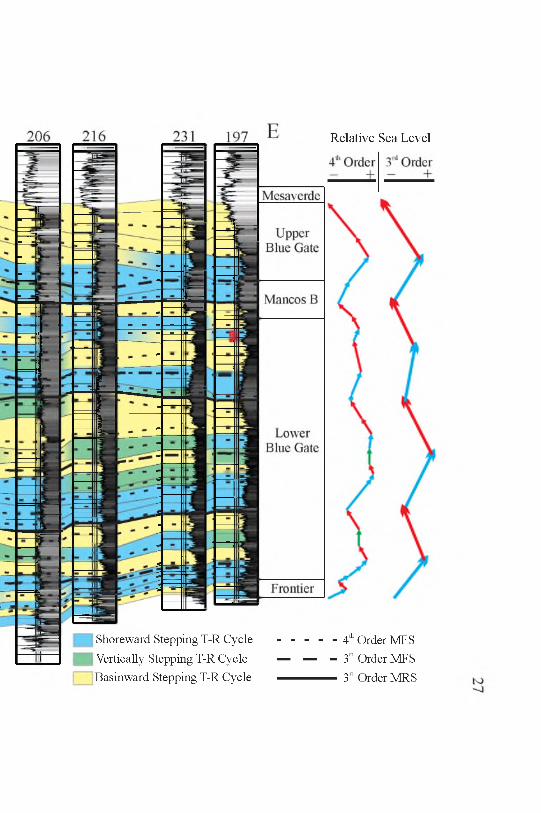
Figure 8: West to east stratigraphic cross section hung on the top of the Lower Castlegate across 30 mi of the northeastern Uinta Basin (Figure 4). Gamma ray logs plotted on 0 to 170 API scale. 4th order T-R cycles (1-29) are illustrated to document variations in stacking patterns throughout the Mancos Shale. MRS and MFS of four 3rd order T-R cycles are identified. Net changes of relative sea level are indicated (right), blue arrows indicate rising sea level, red arrows indicate falling sea level, and green indicates no net change. Well # and associated details listed in Appendix A.
2000
3000
4000
5000
1000
W Well# 182 Relative Depth (ft)
Datum
.....................4th Order MFS— — - 3rd Order MFS
---------------- 3rd Order MRS
Shoreward Stepping T-R Cycle
Vertically Stepping T-R Cycle Basinward Stepping T-R Cycle
Relative Sea Level
28
NRelative Depth (ft)
Datum
Well # 248 181 198 325 358 281
3000
4000
5000
417
4P \
S Relative Sea Level3 rd Order
29
28
27
1000 26 25 2421
20 -
2000 19
18
171615
13
12
111098
7
53 Shoreward Stepping T-R Cycle
I I Vertically Stepping T-R Cycle □ Basinward Stepping T-R Cycle
4 Order MFS3rd Order MFS3rd Order MRS
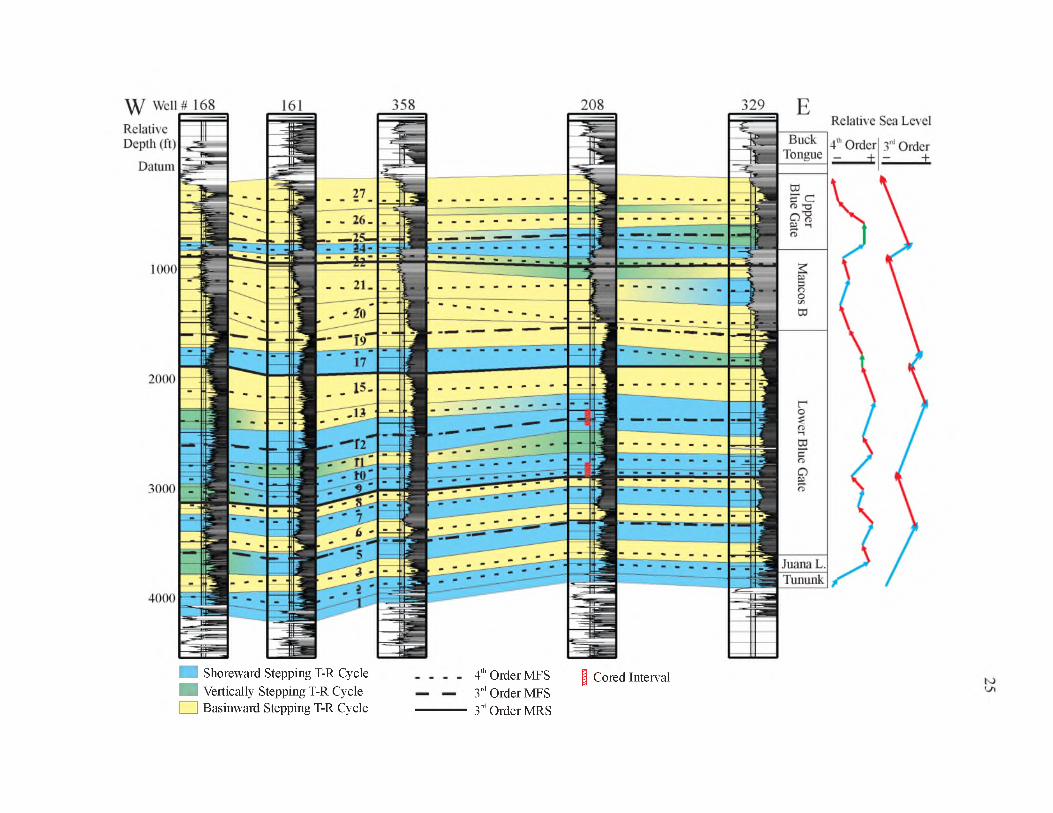
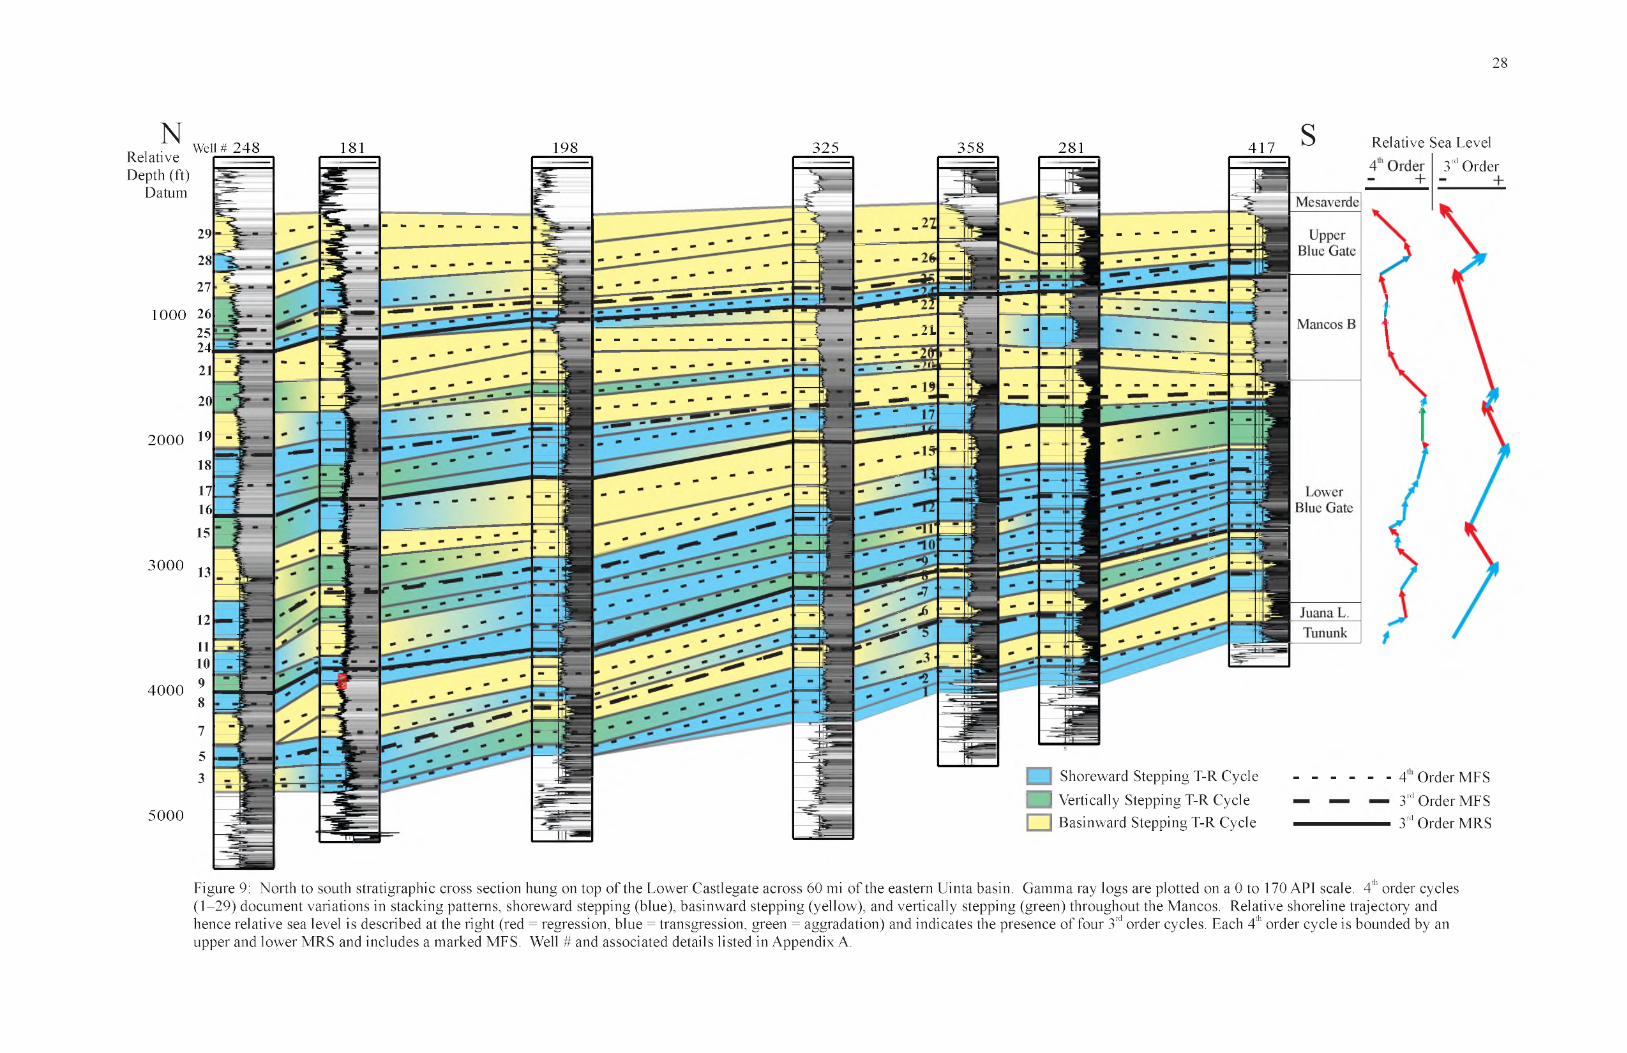
Figure 9: North to south stratigraphic cross section hung on top of the Lower Castlegate across 60 mi of the eastern Uinta basin. Gamma ray logs are plotted on a 0 to 170 API scale. 4th order cycles (1-29) document variations in stacking patterns, shoreward stepping (blue), basinward stepping (yellow), and vertically stepping (green) throughout the Mancos. Relative shoreline trajectory and hence relative sea level is described at the right (red = regression, blue = transgression, green = aggradation) and indicates the presence of four 3rd order cycles. Each 4th order cycle is bounded by an upper and lower MRS and includes a marked MFS. Well # and associated details listed in Appendix A.
29
292827262524
2322212019181716151413121110987654321
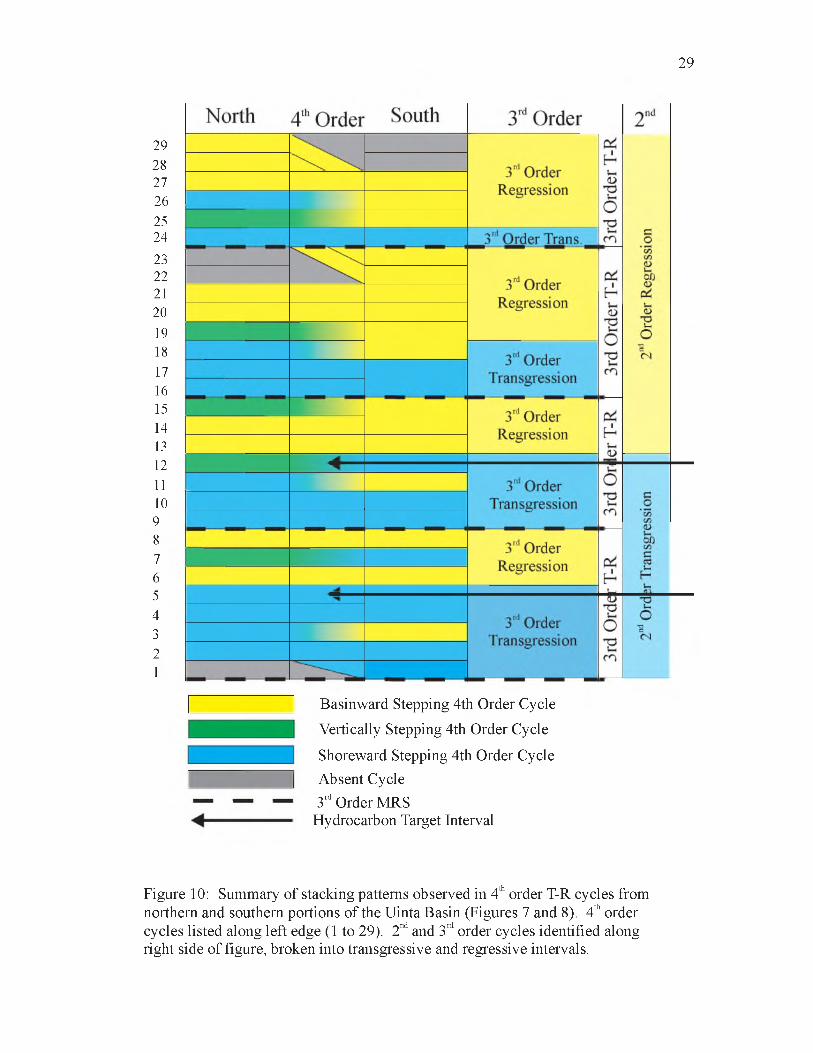
Basinward Stepping 4th Order Cycle
Vertically Stepping 4th Order Cycle
Shoreward Stepping 4th Order CycleAbsent Cycle3rd Order MRS
Hydrocarbon Target Interval
Figure 10: Summary of stacking patterns observed in 4th order T-R cycles from northern and southern portions of the Uinta Basin (Figures 7 and 8). 4th order cycles listed along left edge (1 to 29). 2nd and 3rd order cycles identified along right side of figure, broken into transgressive and regressive intervals.

across the study area, suggesting uniform dominant depositional controls across the
basin.
The distal Mancos Shale in the eastern Uinta Basin contains twenty-nine 4th order
T-R cycles between the underlying Dakota Formation and overlying Mesaverde Group.
These T-R cycles are numbered 1 through 29 (oldest to youngest) and are correlated
through the study area (Figures 7, 8, and 9). However, not all 4th order T-R cycles are
found in all areas of the basin; some cycles are truncated by others. For instance, cycle
24 truncates 22 and 23 (Figure 9). Some cycles amalgamate with others laterally, such as
16 and 17 (Figures 9 and 10). The T-R cycles vary in vertical thickness from less than
100 ft (30 m) to more than 300 ft (90 m) and can be traced laterally across much of the
2 2study area, an area of about 1,000 mi (2,600 km ).
4th order T-R cycles are each assigned a dominant stacking pattern, either
basinward stepping (i.e., progradational or net regressive) or shoreward stepping (i.e.,
retrogradational or net transgressive), based on the net change in relative sea level from
the upper MRS of one cycle to the upper MRS of the underlying cycle. Some cycles,
without a clear net change in relative sea level, are considered vertically stepping
(aggradational). In general, most correlative 4th order T-R cycles share dominant
stacking patterns, so genetically related strata will demonstrate consistent changes in the
position of relative shoreline across the study area. However, there are time-equivalent
changes in stacking patterns from well to well, demonstrating some local controls on this
scale, such as cycle 7, which dominantly steps shoreward in the south and east, but
basinward in the north and west (Figures 8 and 9).
30

East-west cross sections through the eastern Uinta Basin (Figures 7 and 8)
illustrate internal Mancos stratigraphy as well as regionally significant trends in
basinward stepping versus shoreward stepping stacking pattern distribution in 4th order T-
R cycles. The well log gamma-ray morphology follows similar patterns laterally and
vertically throughout the cross section, generally characterized by sharp changes in
shoreline movement at MRSs, and more gradual changes during MFSs. These high
gamma-ray bow trends are typical of mudstone-rich, clastic sedimentation in basinal
settings unconstrained by base level (Milton and Emery, 1996). The high gamma-ray
bow indicates a mud-dominated system, with sharp MRS inflections typical of rapid,
coarse-grained depositional events.
Variations are also present in the 4th order T-R cycle record between the northern
and southern portions of the basin (Figures 9 and 10). The northern portion of the
Mancos Shale is roughly 40% thicker than the south, but this is not accommodated
evenly though all of the T-R cycles. Thickening corresponds primarily with the middle
(cycles 13-19) and upper (cycles 28 and 29) Mancos. Other intervals are of fairly
uniform thickness across the study area, or are more dominant in the south. The
lowermost Mancos (cycles 1 and 2) onlaps the underlying unconformity towards the
north, where these cycles are not present. Some Mancos B equivalent intervals (cycles
22 and 23) are also missing from the north (Figures 9 and 10). The north is characterized
by a greater abundance of vertically stepping 4th order T-R cycles. The addition of cycles
16 and 18 in the north causes the corresponding transgressive package, which is
characterized only by cycle 17 in the south, to be significantly thicker in the north (Figure
31
9).
4th order T-R cycles are grouped by stacking patterns to establish alternating
packages or sets of dominantly shoreward or basinward stepping strata. Cycles 1 through
5 indicate a consistently shoreward stepping interval, whereas the overlying cycles, 6
through 8, are dominantly basinward stepping (Figure 10). This pattern of alternating,
regionally significant shoreward and subsequently basinward stepping 4th order T-R
cycles is found throughout the Mancos in the eastern Uinta Basin. Four laterally
continuous shoreward stepping packages, consisting of cycles 1 through 5, 9 through 12,
16 through 18, and 24 alternate with four basinward stepping packages, consisting of
cycles 6 through 8, 13 through 15, 19 through 23, and 25 through 29 (Figure 10).
Combining a shoreward stepping package of 4th order T-R cycles with an
overlying basinward stepping package of 4th order T-R cycles defines a 3rd order T-R
cycle, including the net transgression and subsequent net regression of shoreline bounded
by regionally extensive, 3rd order MRSs. The Mancos Shale contains four 3rd order T-R
cycles, made up of 4th order cycles 1 through 7, 8 through 15, 16 through 23, and 24
through 29, respectively.
Dominant shoreline directional (basinward vs. shoreward) stacking patterns of
rdthese 3 order T-R cycles are consistent throughout the entire study area (Figures 7, 8,
rdand 9), though thicknesses of individual 3 order T-R cycles vary, largely from north to
rdsouth, more so than east to west. The basal 3 order cycle thins to the north, onlapping
rdthe underlying mid-Turonian unconformity, whereas the upper three 3 order cycles
rdthicken to the north. The shoreward stepping cycles of the upper two 3 order cycles are
thicker to the north, but record a similar magnitude facies change as thinner packages to
the south, suggesting the transgression in the south was more abrupt or more poorly
32

preserved (Figure 9). Based on the relative sea level indicated by MRSs between 3
order T-R cycles, the lower two 3rd order cycles (4th order cycles 1 through 12) can be
considered dominantly shoreward stepping, whereas the upper two cycles (4th order
rdcycles 13 through 29) are dominantly basinward stepping. These 3 order stacking
patterns can be integrated into a single 2nd order T-R cycle over the full interval of the
Mancos Shale, with an MFS corresponding to 4th order T-R cycle 12 (Figure 10). 3rd
order transgressive intervals are much thicker, and represent more significant base level
shifts during 2nd order transgression than during the upper Mancos 2nd order regression.
rdConversely, 3 order regressions are thicker and correspond to greater base level shifts
during 2nd order regression than during the 2nd order transgression of the lower Mancos
(Figures 7, 8, and 9).
Discussion
rdWhereas 3 order stacking patterns recorded in the Mancos Shale are very
consistent across the basin, variable stacking patterns of time-correlative 4th order T-R
cycles are present in some cases (e.g., cycles 3, 7, and 19; Figures 7, 8, and 9),
emphasizing the increasingly important influence of local depositional control over
shorter timescales of deposition. These local variations in stacking patterns are most
evident along the northern margin of the basin (Figure 8), but are evident from different
intervals across the study area. Local variations suggest autocyclic influences on
deposition, such as deltaic lobe shifting, local faulting, or updip hinterland changes in
weathering or fluvial drainage patterns, are influencing sediment supply. This variability
in stacking patterns emphasizes the importance of identifying regionally significant
33
rd

patterns with the correlation between different areas of the basin. This mud-dominated
environment displays a high degree of variability, indicative of the dynamic nature and
depositional heterogeneity of the prodelta, mudbelt, and sediment-starved shelf
rddepositional environments (sensu Horton, 2012). The basin-wide continuity of 3 order
cycles suggests these are controlled by increasingly allocyclic processes, such as eustasy
and regional tectonics, whereas the lateral variability of many 4th order stacking patterns
suggests an increased influence from local depositional processes that are likely
modifying basin-wide controls.
The epicontinental Cretaceous Western Interior Seaway was a relatively shallow
but wide basin filled predominantly by mud-dominated deposits. In this basin, small
vertical changes in sea level would have had a significant impact on the shoreline
location, such that the shoreline migrated long horizontal distances along the shallow
shelf, perpendicular to shoreline (Franczyk et al., 1992), and coarse-grained material
from shore could be deposited well into the basin. Specifically, abrupt changes in grain
size and interpreted depositional proximity to paleoshoreline are evident from core. For
example, the coal-bearing, paralic Ferron Sandstone Member is sharply overlain by
marine mudstone (Kennedy, 2011). Additionally, admixed marine sandstone deposited
in the proximal mudbelt is sharply overlain by laminated and massive claystone, distal
sediment-starved shelf facies (Horton, 2012). Based on outcrop description and well log
characteristics, a number of other depositional environments have been documented in
the Mancos Shale. These include the isolated offshore sandstone and heterolithic bodies
of the Mancos B (Cole et al., 1997) and distal Blackhawk Formation (Pattison, 2005;
Pattison et al., 2007), as well as claystone-rich fissile shale of the Juana Lopez Member
34
(Molenaar and Cobban, 1991). Despite these abrupt stratigraphic changes in depositional
rdenvironment and lithology within the Mancos Shale, the 3 order stacking patterns
remain consistent across the basin, suggesting the consequences of an allocyclically
driven relative sea level change can be identified from wireline logs despite changes in
rdmarine depositional environments and associated lithofacies. 3 order stacking patterns
provide a robust model for identifying sequence stratigraphic patterns between various
depositional environments of the marine realm.
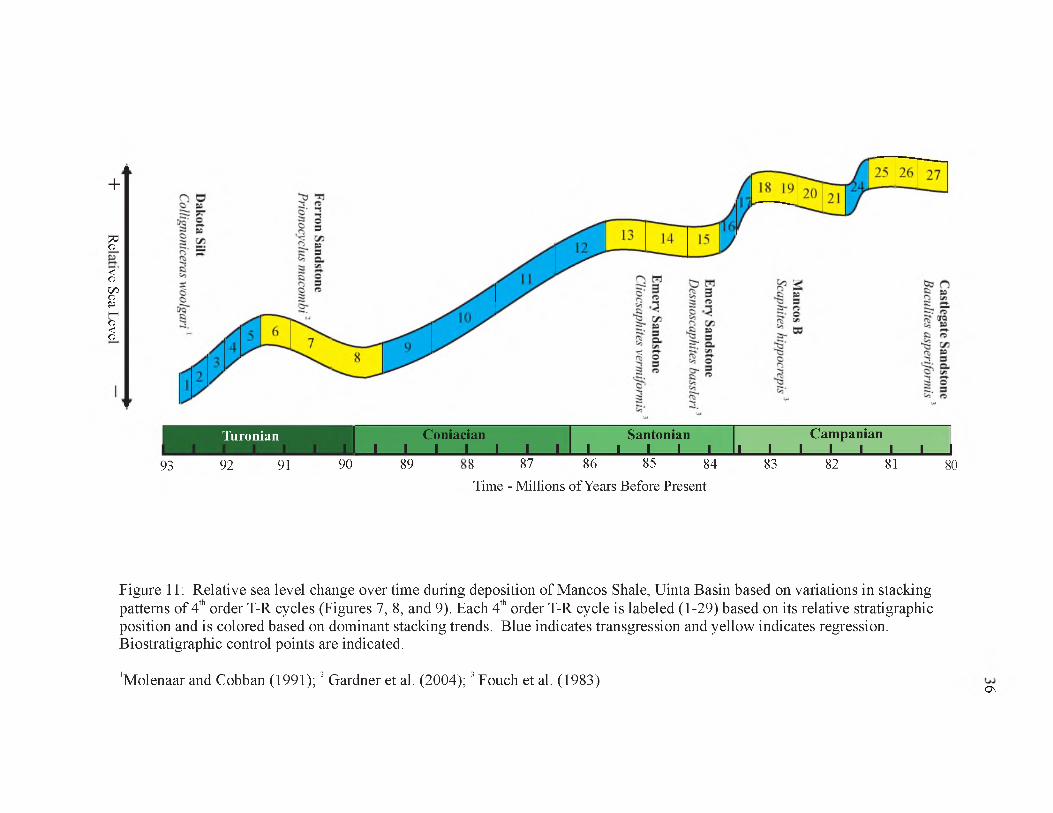
Geochronology of the Mancos Shale is based in large part on biostratigraphy of
lithostratigraphic members reported by Fouch et al. (1983) and Molenaar and Cobban
rd(1991), with some modifications (e.g., Schwans, 1995; Ryer, 2004). The lower 3 order
T-R cycle, including 4th order cycles 1 through 7, corresponds with the Middle and Late
Turonian and Early Coniacian based on the biostratigraphy of the Tununk, Juana Lopez,
and Ferron Sandstone members (Molenaar and Cobban, 1991), with which the cycle is
rdlargely correlative (Figure 11). The overlying three 3 order T-R cycles are less well
constrained by biostratigraphy, but correspond to the Upper Coniacian, Santonian, and
Lower Campanian portions of the Blue Gate Shale (Fouch et al., 1983). Regression of
the second 3rd order cycle, including 4th order cycles 8 through 15, corresponds to the
rdMiddle Santonian Emery Sandstone (Fouch et al., 1983). Regression of the third 3
order cycle corresponds to earliest Campanian Mancos B deposition (Anna, 2012), and
rdthe fourth 3 order cycle terminates at the base of the Middle Campanian Castlegate
rdFormation (Fouch et al., 1983) (Figure 11). This chronology suggests the lower 3 order
T-R cycle records four million years of deposition, whereas the upper three cycles
35
+
%ft
<ft
Vftprft<ft
93
Turonian | Coniacian Santonian Campanian 1■ ........................................................ ................................. I 1 1 1 1 1 1 1
92 91 90 89 8 87 86 85 84
Time - M illions ofY ears Before Present
83 82 81 80
Figure 11: Relative sea level change over time during deposition of Mancos Shale, Uinta Basin based on variations in stacking patterns of 4th order T-R cycles (Figures 7, 8, and 9). Each 4th order T-R cycle is labeled (1-29) based on its relative stratigraphic position and is colored based on dominant stacking trends. Blue indicates transgression and yellow indicates regression. Biostratigraphic control points are indicated.
'Molenaar and Cobban (1991);2 Gardner et al. (2004);3 Fouch et al. (1983) Q\
together record about twelve million years, each cycle corresponding to three to five
million years.
The distribution of transgressions and regressions in the Mancos suggests a semi-
rdperiodicity to the 3 order T-R cycle in the Western Interior Seaway (Figure 11). Similar
trends exist in a number of eustasy-proxy curves from the Upper Cretaceous (Miller at
al., 2003) (Figure 12). Although available geochronology lacks sufficient resolution to
confirm these global relationships (Miall, 1992; 1994), regressions in the Mancos Shale
may correlate with regressions in other geologic records (Figure 12), suggesting a
common, eustatic trigger may contribute to periods of falling relative sea level. Previous
work on the Western Interior Seaway has focused on a few, longer term cycles like the
Greenhorn and Niobrara Cyclothems (Kauffman, 1969; Tibert et al., 2009), which appear
to match the 2nd order trends observed in the Mancos Shale, suggesting a higher rank
pattern may be controlled by the tectonics of the Sevier thrust belt and corresponding
rdforeland basin. 3 order transgressions in the Mancos stratigraphic scheme presented
here appear thin and of low magnitude when they occur during periods of 2nd order
regression. For example, cycle 24 alone constitutes the entire transgressive interval of
rdthe uppermost 3 order cycle.
During the greenhouse conditions of the Late Cretaceous, glacioeustasy was
suppressed (Arthur et al., 1985). Instead, eustasy was driven by global tectonic and
oceanic thermal histories. Although the relative influence of tectonics and eustasy
remains complicated at many orders of sedimentary cyclicity (Gardner, 1995a), it appears
likely that tectonically driven controls on accommodation remain a driving influence of
high-rank rock record cyclicity in this epicontinental foreland basin, while global eustatic
37
38
Figure 12: Correlation of Mancos Shale stratigraphy and global eustatic record, calibrated to Gradstein et al. (2012) timescale. Eustatic curves based on Haq et al. (1987), Hardenbol et al. (1998), Miller et al. (2005), Haq and Schutter (2008), and Kominz et al. (2008). Mancos correlations based on available biostratigraphy. Strong correlations exist between the SEPM 98 T-R cycle record and regressive strata in the Mancos Shale. Additional eustatic curves demonstrate high degree of variability and inconsistency in the sea level record.
Sequences (SEPM Global or Tethyan
Haq and Schutter, 2008)
Phanerozoic T-R Cycles
(SEPM98; GTS04)
Cam8
Cam7
Cam6
Baculites perplexus £
Cam5- Baculites asperifonnis
rCani2Scaphites hippocrepis II
Canil Scaphites hippocrepis I
Desmoscaphites bassleri
Clioscaphites vennifonnis
C coal bed, Ar/Ar
Scaphites ferronensis
Prionocyclus macombi' iPrionocvclus hyatti
ColliAoniceras woolgari
Estimated Sea Level (m)50.00 100.00 150.00
ET fa200.00 250.00
Cam8
Miller et al. (2005) Koininz et al. (2008) Haq et al. (1987)
VO

rdeffects are reflected at the 3 order level. Diecchio and Brodersen (1994) identified
similar patterns in Ordovician foreland basin deposits of West Virginia, where five
rdmillion year, 3 order cyclicity was tied to a eustatic signal, and longer-lived, more local
variations in deposition related instead to tectonic uplifts and basin subsidence. Other
Appalachian basin strata display cyclicity on the 3rd, 4th, and lower rank scales, including
the Devonian (Brett and Baird, 1996) and Upper Mississippian (Miller and Eriksson,
2000); T-R cycles appear typical of these marine foreland basin deposits, like they do in
the Mancos.
Paleoshoreline of the Cretaceous Western Interior Seaway trended roughly north
to south, although it may have had a southwest-northeast strike through much of Utah,
corresponding roughly to strike of outcrops along the Wasatch Plateau (Franczyk et al.,
1992). Uneven deposition driven by sediment source locations, such as the location of
Ferron deltas or concentration of sediment by longshore drift, could be causes of
stratigraphic thickness changes (Ryer, 2004). However, thickening occurs predominantly
in stratigraphy overlying the Ferron, in cycles 13 through 18 (Figure 9), during which
time shallow marine strata updip, such as the Emery Sandstone, was wave dominated
(Edwards et al., 2005), which limited the influence of sediment point sources on deposit
thickness. The dominant thickening trend in the Mancos Shale is from the south to the
north, opposite of Western Interior Seaway dominant longshore currents and
perpendicular to the strike of paleoshoreline. This suggests thickening from south to
north is not controlled by longshore drift or other depositional processes.
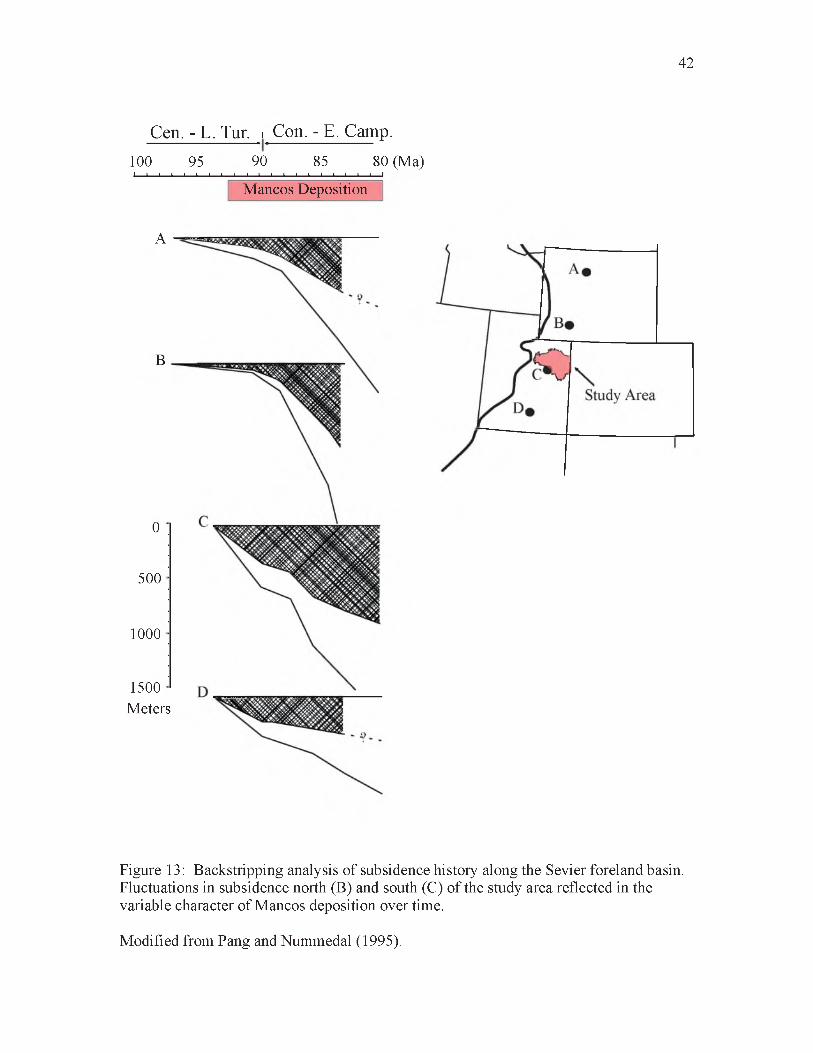
It is likely that the thickening of Mancos strata corresponds to tectonically driven
differential subsidence along the foredeep of the Sevier foreland basin. Backstripping of
40

Upper Cretaceous foreland basin deposits by Pang and Nummedal (1995) indicates that
through the Turonian, subsidence occurred more rapidly in central Utah than Wyoming,
corresponding with a period of along strike onlap to the north in the lowermost Mancos
T-R cycles (Figures 10 and 13). However, during the Coniacian and Santonian,
subsidence increased in Wyoming, but decreased in central Utah. In the northern portion
of the Uinta Basin, additional 4th order T-R cycles thicken the Santonian portion of the
Mancos Shale, corresponding to rapid subsidence in the north recognized by Pang and
Nummedal (1995). The southern portion of what is now the Uinta Basin likely subsided
more slowly, like central Utah, where decreased accommodation corresponds with
thinner equivalent strata. The Uinta Basin records the transition between rapid
subsidence in Wyoming and slower rates in southern Utah. Local variations in tectonics
are the primary driver of regional thickness changes from north to south.
The preservation of organic matter in mudrock is driven by the complex interplay
of numerous factors, including ocean anoxia (Demaison and Moore, 1980), and primary
production, dilution, and destruction of organic material during deposition (Sageman et
al., 2003; Bohacs et al., 2005). Despite the complex and dynamic conditions of marine
shale deposition, there appears to be a dominant sequence stratigraphic relationship with
the distribution of organic matter, which is most densely preserved at the condensed
interval of the transgressive systems tract (Creaney and Passey, 1993; Bohacs, 1998; Slatt
and Rodriguez, 2012) and corresponds to the transgressive portion of the T-R cycle. This
sequence stratigraphic framework matches trends observed in the Mancos from the San
Juan Basin, in which TOC was concentrated most strongly along the condensed intervals
at the top of transgressive strata (Pasley et al., 1991; 1993). Similarly, target reservoir
41
42
Cen. - L. Tur. i Con. - E. Camp.100 95 90 85 80 (Ma)
J____ i____i____ i____ i____ i____i____i____i____ i___ i____ i____i____i____ i____ i____ i___ i____ i____i____I
Mancos Deposition
A
B
500
1000
1500Meters
Figure 13: Backstripping analysis of subsidence history along the Sevier foreland basin. Fluctuations in subsidence north (B) and south (C) of the study area reflected in the variable character of Mancos deposition over time.
Modified from Pang and Nummedal (1995).
0

facies, those with the most TOC and calcite-rich facies, are observed within transgressive
deposits from Mancos core (Kennedy, 2011; Horton, 2012).
Shale gas plays require a minimum thickness, generally >200 ft (60 m), and
sufficient maturation history, >1.1% Ro (Slatt and Rodriguez, 2012), which can each be
estimated by mapping sequence stratigraphic units and building a basin model,
respectively. The strong relationship between sequence stratigraphic depositional cycles
and production parameters suggests that effective mapping of these units is critical for
hydrocarbon evaluation and prospect development, particularly in a unit as thick as the
Mancos Shale, where horizontal targets must be highgraded.
The Mancos Shale, which ranges from 3,500 ft (1,070 m) to 5,000 ft (1,525 m)
thick across the study area, provides a unique challenge for development as a horizontal
petroleum resource play, because there are a wide variety of lithologies within the
previously undifferentiated formation. Hydraulic fractures can generally be expected to
communicate with several hundred vertical feet of rock (King, 2012), only a small
portion of the Mancos thickness. The identification of 2nd, 3rd, and 4th order T-R cycles
allows the mapping of strata of relevant production thickness that have been tied to
sequence stratigraphy. Both 2nd and 3rd order sequence stratigraphy can be correlated to
the lithologic properties of the corresponding strata, so both should be considered when
identifying potential production intervals. Cycle 12 represents the most prospective T-R
cycle for production based on its correlation to 2nd, 3rd, and dominantly 4th order
rdtransgression (Figure 10). Cycle 12 is the most distal expression of the 3 order
transgression, which also includes underlying cycles 9 through 11. Cycles 1 through 5
also correspond to potentially prospective transgressions, with cycle 5 representing the
43
rdmaximum transgression and most prospective cycle of this lowermost 3 order cycle
(Figure 10). Cycles 1-5 display a regional extent similar to stratigraphically higher
transgressive units, like those of cycles 9-12, but likely reflect more proximal
depositional environments relative to cycles 9-12 based on the more proximal position of
relative shoreline at the beginning of the transgression.
Conclusions
Transgressive-regressive (T-R) cycles can be identified at a number of different
scales throughout offshore marine mudstones of the Mancos Shale. In this distal marine
shale, traditional sequence stratigraphic correlative conformities are often cryptic; based
on detailed core studies (e.g., Kennedy, 2011; Horton, 2012), changes in the relative
proportion of claystone versus siltstone and sandstone, as recorded in gamma ray logs,
provide an effective tool for determining relative changes in sea level. The relative
position of sea level can be determined during deposition by considering the change in
claystone content between one T-R cycle and the overlying cycle. Wireline logs taken
from the Uinta Basin identify twenty-nine 4th order T-R cycles that are stacked into four
3rd order cycles, which contribute to a single 2nd order cycle of relative sea level change.
4th order cycles can be genetically correlated across the basin, but display some regional
variations in stacking patterns, demonstrating the influence of autocyclic processes that
modify allocyclic controls (or vice versa) at this scale. The stacking patterns of 2nd and
rd3 order T-R cycles in the Mancos are consistent across the basin, suggesting these are
controlled by allocyclic processes and are a viable tool for predicting facies changes
throughout the formation.
44

The lower Mancos Shale is dominated by transgression whereas the upper
Mancos Shale is largely regressive, a trend which defines the dominant 2nd order T-R
rdcycle of the formation. The four 3 order T-R cycles each record about four million
years of depositional history, the timing of which may be driven by corresponding
eustatic fluctuations. This eustatic signal is moderated by tectonically driven temporal
changes in subsidence, which define the over-arching cycle of growth and decay of the
Western Interior Seaway during the Late Cretaceous. Regional thickness trends within
the Mancos also appear to be controlled largely by tectonic activity, specifically a
regional increase in tectonic subsidence rate from south to north, and provide insight into
the timing and magnitude of changes to basin structure. The evolution of stacking
patterns provides a valuable tool for placing the significant facies heterogeneity within
the Mancos Shale (Kennedy, 2011; Horton, 2012) in a useful context and within a
predictable framework.
By relating the relative hydrocarbon potential of the shale to sequence
stratigraphy, T-R cycles can be used as a first-pass tool for identifying prospective target
intervals within a thick offshore marine mudstone like the Mancos. In the Mancos Shale,
two major transgressions, corresponding to 4th order T-R cycles 5 and 12, offer promising
intervals for production because they correspond to the maximum transgression during
rdthe lower two 3 order T-R cycles, which also record the overall deepening of the
Cretaceous Western Interior Seaway (a 2nd order cycle). Cycle 12 is likely the most
prospective because it also corresponds to the 2nd order T-R cycle maximum flooding
surface, the sediment starved shelf facies of the Mancos Shale deposited during the
highest relative sea level (Horton, 2012). This differentiation of the 4,000 ft (1,220 m)
45

thick shale allows the identification of producible intervals, which can be targeted for
horizontal drilling and hydraulic fracturing.
46
CHAPTER 2
DEPOSITIONAL SEQUENCE STRATIGRAPHY AND
HYDROCARBON POTENTIAL OF THE MANCOS
SHALE, UINTA BASIN, UTAH
Abstract
The Mancos Shale, a marine offshore mudstone that was deposited in the
Cretaceous Western Interior Seaway, is a potentially significant hydrocarbon resource.
In the Uinta Basin of eastern Utah, the identification of productive sweet spots is critical
to efficient economic production from this 4,000 ft (1,220 m) thick formation. However,
a unified basin-wide facies and sequence stratigraphic correlation that tests the lateral
viability of existing outcrop and core-based geological models to identify reservoir target
intervals for the Mancos Shale is still lacking. Furthermore, seminal sequence
stratigraphic models were developed from updip shallow marine and fluvial units
exposed in the Book Cliffs, but these models have never been extended in detail to the
full thickness of correlative offshore deposits of the Mancos Shale. 157 wireline well
logs were chronostratigraphically correlated across the basin to build a regional
subsurface map and cross sections that highlight facies relationships, illustrate regional
stratal architecture, and analyze sequence stratigraphic stacking patterns within a
depositional framework.

Previous core analysis in combination with the examination of previously studied
outcrops and the new log correlation presented herein suggest reservoir targets
correspond with two organic rich facies associations found in two nonadjacent
stratigraphic intervals of the Mancos Shale, Uinta Basin, respectively, each
corresponding to the transgressive and early highstand sequence sets. These include: 1)
organic rich, heterolithic facies of the lowermost Blue Gate and Juana Lopez Members,
which contain a high proportion of terrestrial organic matter and were deposited above
storm wave base, and 2) sediment starved shelf deposits of the middle Lower Blue Gate,
organic-rich (marine organic matter dominant), calcareous claystone to siltstone
deposited below storm wave base. Variations in log signature, mudstone facies, and
stacking patterns in the distal shale were controlled by fluctuations in relative sea level,
basin geometry, and shoreline processes, which varied progressively over the fifteen
million years of Mancos deposition. The sequence stratigraphic model presented here
clearly defines paleodepositional updip to downdip genetic relationships between key
lithostratigraphic units, including the updip Ferron and Emery Sandstones and Mesaverde
Group, and downdip Tununk, Juana Lopez, Bluegate, Mancos B, and Buck Tongue
members of the Mancos Shale. This study establishes a regionally significant
depositional and sequence stratigraphic framework that can be tied to lithologic
properties, which is critical for tight shale play evaluation and completion in the Mancos
Shale of the Uinta Basin and other analogous offshore deposits of the Cretaceous
Western Interior Seaway.
48

Introduction
The production of natural gas and oil directly from shale reservoirs in North
America has provided abundant domestic energy production with the potential to phase
out the burning of coal for electricity while decreasing dependence on foreign
hydrocarbon imports (US Energy Information Administration, 2013). Between 2007 and
2012, American greenhouse gas emissions have declined by 450 million tons, a greater
decline than anywhere else in the world, due in large part to the conversion from coal to
natural gas fueled electrical generation (Wright, 2012). In order to continue development
of this hydrocarbon resource into the future, identifying and characterizing additional
hydrocarbon rich shales is critical to increasing production efficiency and volume.
The Uinta Basin of northeastern Utah has a long history of natural resource
development, including extensive natural gas production from a number of Mesozoic
sandstones. The Mancos Shale, an Upper Cretaceous marine shale, has long been
interpreted as the source for many hydrocarbons in the basin (Kirschbaum, 2003), but has
not had strong economic production in its own right (Curtice, 2013). The application of
new production techniques, particularly horizontal drilling and hydraulic fracturing,
could potentially improve the economics of hydrocarbon production from the Mancos
Shale. The Mancos Shale has been the recent target of horizontal drilling for gas and oil
in the San Juan Basin, as well as the neighboring Piceance Basin (Durham, 2012; Ridgley
et al., 2013). Production from the Uinta Basin is lagging. Detailed formation evaluation
is required to identify the most prospective reservoir target intervals in this thick, gray
shale.
49

In the Uinta Basin, the Mancos Shale, which is more than 4,000 ft (1,220 m)
thick, relatively organic-lean (1.36% average TOC; Horton, 2012), and was deposited
during fifteen million years of the Upper Cretaceous, has not previously been the subject
of a detailed, internal stratigraphic analysis. A number of cross sections from the Uinta
Basin have been constructed over the last two decades based on well log, core, and
outcrop data, although these have not presented a sequence stratigraphic framework for
the Mancos Shale. Existing cross sections either focus in detail on a relatively small
region and/or stratigraphic interval (e.g., Molenaar and Wilson, 1990; Molenaar and
Cobban, 1991; Hampson et al., 1999; Anderson and Harris, 2006) or cover a large region
but pick relatively few surfaces of correlation from within the main body of the Mancos
Shale (e.g., Johnson, 2003a; Hettinger and Kirschbaum, 2003; Kirschbaum, 2003, Rose et
al., 2004; Anna, 2012). Little research has focused on the internal stratigraphy of the
Blue Gate Member, the thickest member of the Mancos Shale, which readily weathers in
outcrop (Leythaeuser, 1973) and remains undifferentiated with either well log or seismic
data.
A sequence stratigraphic and depositional model has been established for the
Mancos Shale from detailed core description by Kennedy (2011) and Horton (2012),
which needs to be placed in a wider stratigraphic context in order to identify the regional
significance of these sedimentary facies relationships. Regional subsurface mapping of
the lithofacies distribution within the Mancos Shale allows these strata to be placed in a
sequence stratigraphic and depositional framework.
The Mancos Shale in the Uinta Basin provides valuable information regarding the
transition in facies from proximal, shallow marine sandstones deposited along the
50
western margin of the Cretaceous Western Interior Seaway to the deep-water facies
typical of Colorado (e.g., chalks and marls) and other more distal marine environments of
deposition (Figure 3). The stratigraphy of Upper Cretaceous marine sandstones in Utah
has been well documented from many miles of outcrop across the Colorado Plateau
(Fouch et al., 1983). To the east, time equivalent marine shales in Colorado, including
the Niobrara and Carlile Formations, have been well studied, in part because of their role
in petroleum systems of the Denver Basin and other basins across central North America
(Longman et al., 1998; Sonnenberg, 2011). Seminal models of sequence stratigraphy
were developed in shallow marine lithologies updip of the Mancos Shale, including the
Ferron Sandstone (Riemersma and Chan, 1991; Gardner et al., 2004), Panther Tongue
member of the Star Point Formation (Posamentier and Morris, 2000), several members of
the Blackhawk Formation (e.g., O’Byrne and Flint, 1995; Kamola and Van Wagoner,
1995), the Castlegate Sandstone (Van Wagoner, 1995), and more recent work on the
Emery Sandstone (Edwards et al., 2005) (Figure 4). Chronostratigraphic correlation
between these shallow marine and downdip mudstone deposits ties a detailed sequence
stratigraphic model to the distribution of facies in the distal basin, illuminating an
otherwise understudied relationship.
Sequence stratigraphy has proven particularly effective in analysis of most shale
hydrocarbon plays, but has not yet been applied to a thick, organic-lean formation like the
Mancos Shale. Major shale gas plays, including the Marcellus (Milici and Swezey,
2006), Barnett (Loucks and Ruppel, 2007), and Haynesville Shale (Hammes et al., 2011),
are only a few hundred feet thick, so they can be developed with a single horizontal well
completion (King, 2012). However, the Mancos is far too thick to be developed in this
51

way and previous vertical completions have not been economic, typically demonstrating
high production decline rates (Curtice, 2013), so identifying and mapping the most
prospective reservoir target intervals will be critical for efficient production.
In the Mancos Shale, promising reservoir lithofacies were characterized by
sediment starved shelf deposition during the transgressive and early highstand systems
tracts (Horton, 2012). The sediment starved shelf includes areas of deposition basinward
of the influence of most hyperpycnal flows and instead is dominated by suspension
settling (Horton, 2012). Characteristics of this facies include dominantly plane-parallel
laminations, relatively fine-grained claystone to siltstone, a lack of bioturbation, the
highest documented calcite content (avg. 29.0%), and correspond to indicators of “ideal”
brittle deformation behavior observed from Mancos core (Kennedy, 2011). Establishing
a sequence stratigraphic framework and depositional model for this formation allows for
the predictive mapping of these lithofacies and identification of the most prospective
reservoir intervals for production.
This study utilizes a database of several hundred well logs to create a basin-wide
subsurface litho- and chronostratigraphic map of the Mancos Shale in the Uinta Basin.
Log-based detailed correlations have been tied to various facies descriptions from
outcrop (e.g., Molenaar and Cobban, 1991; Edwards et al., 2005; Anderson and Harris,
2006) and core (Kennedy, 2011; Horton, 2012) in order to extend a detailed lithofacies-
based model of deposition into the subsurface throughout the Uinta Basin. Identified
stratal architecture is placed in a sequence stratigraphic framework and used to identify
various basin-wide and local influences on depositional style and corresponding
hydrocarbon production potential.
52

Geologic Background
The Upper Cretaceous Western Interior Seaway of North America was formed in
an actively subsiding foreland basin during a global sea level highstand; corresponding
strata display the coupled influences of local tectonics and eustasy. Thrusting within the
Sevier fold and thrust belt, which trended roughly north to south through central Utah
(DeCelles, 1994), thickened the orogenic hinterland (Livaccari, 1991), which shed
sediment into the adjacent foredeep (Johnson, 2003b). Episodic thrusting events along
this active orogen contributed to uneven rates of subsidence in the adjacent foreland basin
(Jordan, 1981; Pang and Nummedal, 1995) and rates of sediment supply from the thrust
front. The Mancos Shale was deposited into this foreland basin between the Cenomanian
and Lower Campanian, roughly 94 to 79 Ma, synchronous with several thrusting and
subsidence events (Schwans, 1995).
The Late Cretaceous was a period of global sea level highstand and included a
number of significant eustatic fluctuations (Haq et al., 1987; Miller et al., 2005). High
organic carbon preservation during this time is associated with large volumes of off-ridge
volcanism and accelerated sea floor spreading (Arthur et al., 1985), including three ocean
anoxic events, which record periods of carbon isotope fluctuations and enhanced organic
carbon content of sediments (Arthur and Schlanger, 1979; Jenkyns, 1980). Variations in
eustasy and global ocean chemistry played important roles in the stratigraphy and
lithology of the Mancos Shale and other deposits of the Western Interior Seaway.
Palynology from Upper Cretaceous coals and other terrestrial fauna records suggest this
was a period of stable, warm, and humid climate (Wolfe and Upchurch, 1987; Howell
and Flint, 2003).
53

In northeastern Utah, the Mancos Shale was deposited overlying a mid-Turonian
unconformity above the underlying Cenomanian Dakota Sandstone, Cedar Mountain
Formation, or Mowry Shale (Molenaar and Cobban, 1991). The roughly 4,000 ft (1,220
m) thick Mancos Shale is divided into a number of stratigraphic members that reflect
varying proportions of sandstone, siltstone, and claystone related to updip fluctuations
between proximal shallow marine sandstone and more distal marine siltstone and
claystone in present day central Utah (Figure 3). Proximal shoreface sandstones and their
downdip equivalent siltstones include, in stratigraphic order, the Frontier and Ferron,
Emery, and Mesaverde group sandstones (Molenaar and Cobban, 1991; Johnson, 2003b).
These sandstones interfinger and shale out down paleodepositional dip into mudstone
dominated members of the Mancos, including the Tununk, Juana Lopez, Blue Gate Shale,
and Buck Tongue, in stratigraphic order (Molenaar and Cobban, 1991; Johnson, 2003b)
(Figure 4). The Mancos B Member, also known as the Prairie Canyon, is an isolated,
heterolithic sandstone and siltstone body that separates the Upper and Lower Blue Gate
members across the southeastern portion of the study area. A number of other
Blackhawk equivalent isolated sandstone bodies have been identified from outcrop
encased in marine shale, suggesting across shelf transport of sands into distal
environments during lowstands (Swift et al., 1987; Chan et al., 1991; Pattison, 2005;
Pattison et al., 2007; Macquaker et al., 2007).
The Mesaverde group includes the Star Point Sandstone, Blackhawk Formation,
and Castlegate Sandstone; the Blackhawk itself is divided into six members, the Spring
Canyon, Aberdeen, Kenilworth, Sunnyside, Grassy, and Desert (Young, 1955), which
represent cyclical regressive sequences of variable coastal marine environments (Howell
54

and Flint, 2003). Broadly, the Mancos grades down paleodepositional dip into more
calcareous mudstone to the east, where both subsidence and sediment supply were
relatively low during deposition so that in present day Colorado, portions of the lower
Mancos transition into the chalk and marl-dominated organic-rich Niobrara Formation
(Kauffman, 1977).
The Uinta Basin formed during the Laramide Orogeny and postdated Mancos
deposition. It is a deep sedimentary basin bounded by Laramide-age uplifts, including
the Uinta Mountains to the north and the San Rafael Swell and Uncompaghre Uplifts to
the south, and is separated from the Piceance Basin to the east by the Douglas Creek
Arch (Johnson, 1992). One of many Laramide basins throughout western North America,
the Uinta was a ponded basin, which accumulated a thick package of fluvial and
lacustrine sediments during the subsidence and burial of underlying Mesozoic sediments
(Dickinson et al. 1988). The Mancos was rapidly buried following deposition until 25
Ma, subsequently uplifted, and in some areas eroded (Anderson and Harris, 2006). Uinta
Basin subsidence has asymmetrically favored the northern end of the basin, so the
Mancos has not matured uniformly, but has experienced earlier and more extensive
thermal maturation in the north than in the south (Nuccio and Roberts, 2003; Quick and
Ressetar, 2012). Production from the Mancos will be constrained by both primary
depositional processes as well as subsequent burial, maturity, and fracture histories.
55
Dataset
Data from 453 wells that penetrated the Mancos Shale across the Uinta Basin
were compiled into a database. The sources of well data are varied: some data were
downloaded from the Utah Department of Natural Resources’ Division of Oil, Gas, and
Mining database (DOGM, 2013), and a significant amount of data was donated by
Anadarko, Bill Barrett Corporation, Del Rio, Gasco, Pioneer Resources, Questar (now
QEP), Wind River Resources Corporation, and XTO (now ExxonMobil Corporation).
The types of data vary from well to well, but include gamma ray, resistivity, neutron
porosity and density, sonic, borehole image, and mud logs. Of the 453 wells, 280 include
wireline log data; 157 were used to construct regional cross sections and/or isopach maps
(Figure 14; Appendix A). Well log data used here were each collected independently by
various well operators over the past half century, so differences in logging tools, borehole
conditions, and operator procedures all contribute to variations in absolute values
recorded from wells in the dataset. Correlations relied on qualitative visual comparison
of stratigraphic trends from well to well rather than quantitative evaluations.
Recent core-based investigations by Kennedy (2011) and Horton (2012) provided
useful detailed lithologic descriptions, high-resolution geochemical data, and
geomechanical test results. These core data were consulted alongside the wireline log
data to provide ground truth from unweathered strata in the subsurface. Kennedy (2011)
described core from a 1,712 ft (520 m) interval of the River Gas of Utah #1 (RGU-1)
well, from three miles SW of Price, UT, spanning the top of the Tununk Member through
the Ferron Sandstone and Lower Blue Gate Shale to the basal Emery Sandstone. Horton
(2012) evaluated core taken from four wells, 120 ft (36 m) intervals from three Questar
56
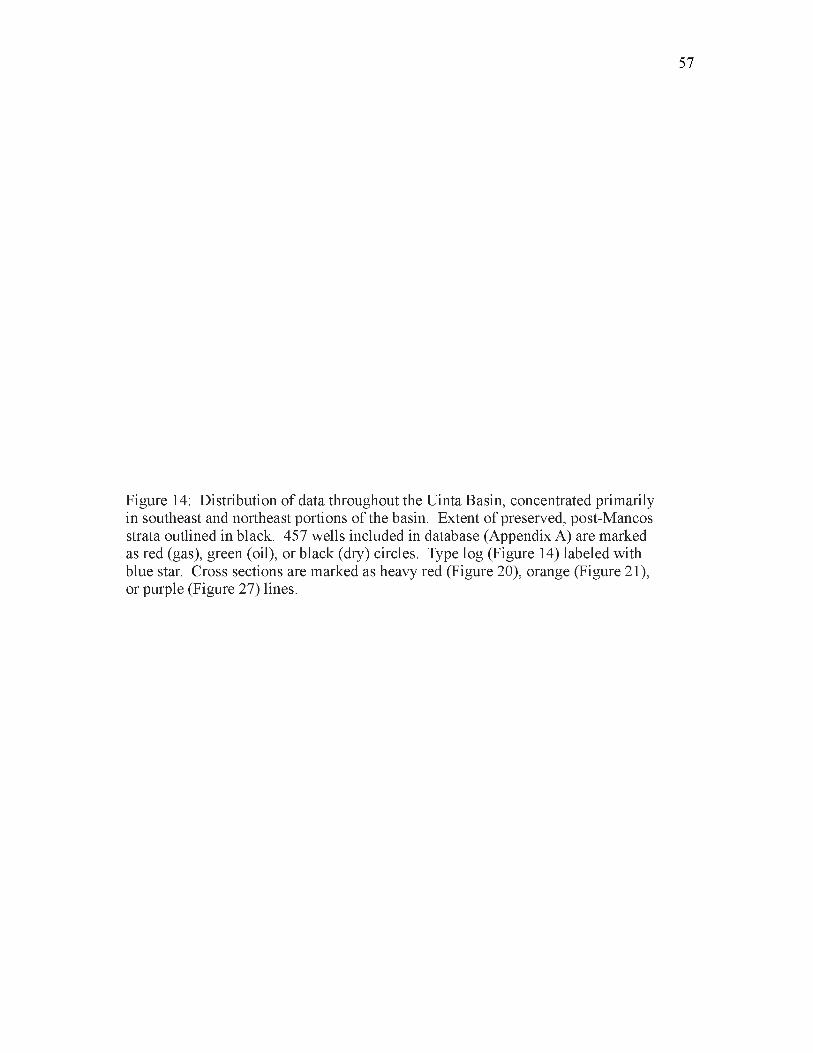
57
Figure 14: Distribution of data throughout the Uinta Basin, concentrated primarily in southeast and northeast portions of the basin. Extent of preserved, post-Mancos strata outlined in black. 457 wells included in database (Appendix A) are marked as red (gas), green (oil), or black (dry) circles. Type log (Figure 14) labeled with blue star. Cross sections are marked as heavy red (Figure 20), orange (Figure 21), or purple (Figure 27) lines.
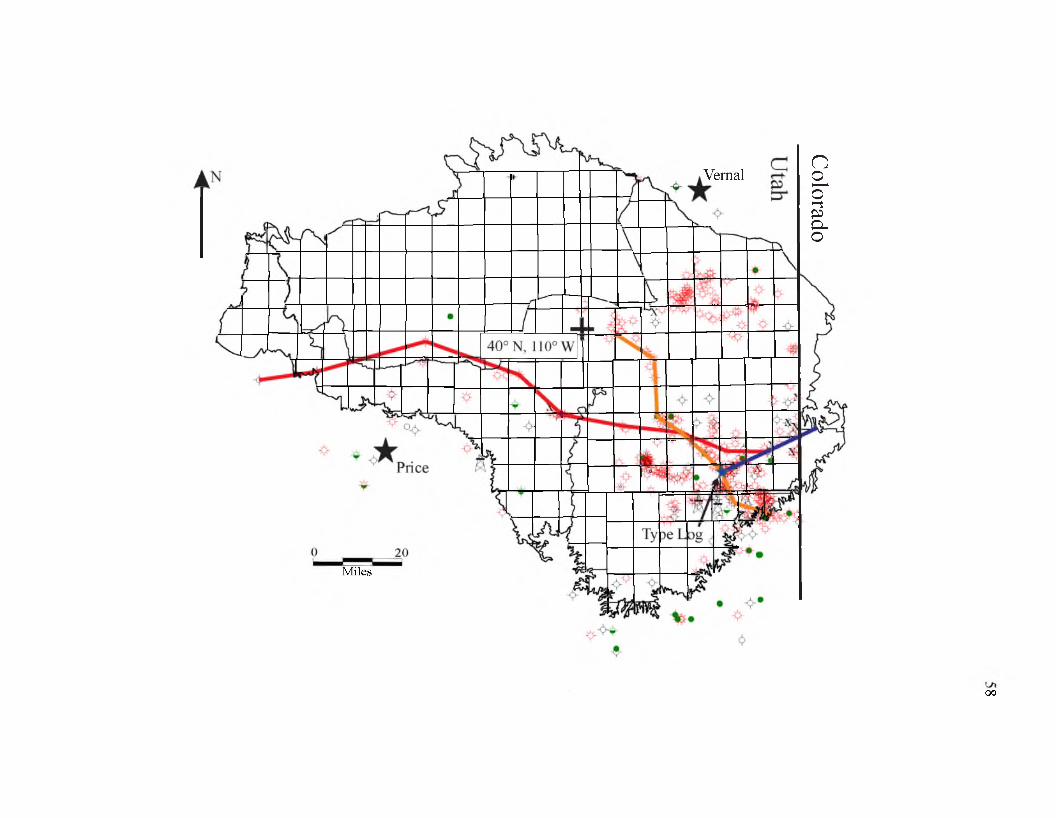
Vernal
Miles
oo
Colorado
wells roughly 25 mi (40 km) south of Vernal, UT, the Glenn Bench 1M-4-8-22R, Red
wash 8ML-6-9-24, and Glenn Bench 16M-28-8-21, and two 120 ft (36 m) intervals of the
Pioneer Natural Resources Main Canyon Federal 23-7-15S-23E, located roughly 40 mi
(64 km) south of the aforementioned Questar wells. These cores were taken from
different intervals of the Lower Blue Gate Member and demonstrate the vertical and
lateral facies variability of this member. The core descriptions considered details of
subsurface lithology, sedimentology, and stratigraphy at the centimeter scale.
Geochemical analysis included thin section, x-ray fluorescence, x-ray diffraction,
QEMSCAN analysis, and TOC-RockEval pyrolysis (Horton, 2012). The RGU-1 cored
interval was sampled to systematically capture facies variability for geomechanical
properties, from unconfined compression tests, triaxial compression tests, and indirect
tensile strength tests (Kennedy, 2011). Complete descriptions of these core analyses and
methods are available from Kennedy (2011) and Horton (2012).
Existing depositional and stratigraphic models developed primarily from outcrop
and core by previous workers of different components of the Mancos Shale, including the
Lower Blue Gate, Juana Lopez, and Tununk Members (Molenaar and Cobban, 1991;
Anderson and Harris, 2006; Kennedy, 2011; Horton, 2012), Frontier Formation
(Molenaar and Wilson, 1990), Ferron Sandstone (Riemersma and Chan, 1991; Anderson
and Ryer, 2004; Fielding, 2010), Emery Sandstone (Edwards et al., 2005), Mesaverde
Group (Yoshida, 2000; Miall and Arush, 2001; Kirschbaum and Hettinger, 2004;
Seymour and Fielding, 2013), Mancos B (Cole et al., 1997; Hampson et al., 1999), and
other isolated Mesaverde equivalent sandstones such as the Hatch Mesa (Pattison, 2005;
Pattison et al., 2007; Macquaker et al., 2007) provided the primary lithologic and
59
60
biostratigraphic background for the log-based stratigraphy in this study. Three
dimensional seismic data were available from a portion of the study area, which were
valuable for confirming structural continuity between subsurface correlations.
Methods and Approach
PETRA, an industry standard software, was used for this study, in part because it
contains correlation, geostatistical, and petrophysical modules that can be applied to
formation mapping and evaluation. Well data were loaded as .LAS files, which allow
scale manipulation during correlation as well as quantitative petrophysical evaluation.
Wells were selected for use in regional correlation based on the quality of available
wireline log data, spacing relative to other available wells, penetration through the
Mancos, and the availability of core or borehole image data. Some portions of the study
area are characterized by a high density of well data, particularly in the east, whereas the
western portion has low data density and relatively few total data points. Correlations
were based primarily on gamma ray logs, which provide a proxy for claystone content
(Bhuyan and Passey, 1994), can be indicative of lithologic stacking patterns (Singh et al.
2008; Passey et al., 2010), and were widely available from wells of different vintage and
operators. Where available, resistivity and neutron logs were used to supplement gamma
ray log-based correlations. Surfaces were picked during the construction of cross
sections, and later mapped regionally as isopach maps using PETRA geostatistical
modules.
Well log correlations were critical to establishing the regional extent and stacking
patterns of the Mancos across the study area. Major stratigraphic units, including the

Castlegate Sandstone, Blue Gate Shale, Mancos B, Dakota Silt interval of the Tununk,
and Dakota Sandstone, were picked from gamma ray logs based on the previous work of
Molenaar and Cobban (1991), Johnson (2003a), Rose et al. (2004), and Schamel (2006).
From these major surfaces, additional chronostratigraphic packages within the Mancos
Shale were identified and correlated regionally based on well log morphology as well as
flooding and regressive surfaces. Wherever possible, the top of the Lower Castlegate
(Lawton, 1986) was used to hang stratigraphic cross sections because it is regionally
extensive and easily identified by a blocky, clean log signature associated with fluvial
channels overlain by the Buck Tongue transgression (Yoshida, 2000), is roughly time
correlative (Fouch et al., 1983), and is the typical datum of Upper Cretaceous cross
sections in the Uinta Basin by other workers (e.g., Yoshida, 2000; Hampson et al., 2001;
Kirschbaum, 2003; Johnson 2003b; Pattison, 2005).
Chronostratigraphic correlations were made by identifying maximum regressive
surfaces (MRS) and maximum flooding surfaces (MFS) associated with depositional
sequences. Despite variations in lithofacies, these surfaces can be traced laterally across
the formation, bound genetically related strata, and represent roughly time significant
surfaces (Ch. 1). Where available, biostratigraphic data were incorporated in order to
corroborate and refine regional correlations. Correlations largely followed the guidelines
of Pattison et al. (2009) for shoreface-to-shelf systems, including the gradual basinward
thinning of parasequences without clinoforms, rather than abrupt thinning with steeply
dipping clinoforms, downlap, and pinch-out. While the latter method has driven
correlations for many years, most packages in the Upper Blue Gate and corresponding
Blackhawk Formations demonstrate only gradual thinning over more than 25 mi (40 km)
61

of outcrop (Book Cliffs) and in the subsurface (Pattison et al., 2009). These trends of
gradual sequence thinning and shaling out of lithofacies into the basin are also observed
throughout the subsurface data of this study.
Facies were mapped within this genetic framework across the basin in order to
illustrate the depositional history of the formation; gamma log characteristics were
matched with corresponding lithofacies so the distribution of those lithofacies could be
interpolated throughout the basin. From intervals with available core analysis, which
correspond with intervals of the Lower Blue Gate, the facies association and depositional
environment model of Horton (2012) was used to differentiate different styles of offshore
deposition. Detailed core analysis of Kennedy (2011) and Horton (2012) was tied
directly to gamma ray logs and formed type sections that could be extrapolated around
the basin. For other intervals of the Mancos, such as the organic-rich Juana Lopez
Member and the sandstone-rich Mancos B, previous facies and depositional environment
interpretations in the literature were used to interpret an anticipated log signature, which
could be mapped within the basin.
Furthermore, a number of established outcrops, including previously measured
sections from the southeast (near junction of I-70 and highway 6), northeast (Steinaker
dam) (Molenaar and Cobban, 1991), and southeast (Westwater, UT) (Anderson and
Harris, 2006) of the Uinta Basin, as well as heterolithic, sandstone rich units, including
the Hatch Mesa Sandstone at Hatch Mesa, UT, the distal Blackhawk at Woodside, UT
(Pattison, 2005; Pattison et al., 2007), and the Mancos B at Prairie Canyon, CO (Cole et
al., 1997) were visited in order to understand the facies, stacking patterns, and lateral
variability of these strata and tie lithologic properties back to gamma ray correlation. The
62

genetic and chronostratigraphic correlation provides a framework for integrating outcrop,
core, and other subsurface data into a comprehensive model for facies distributions
throughout the Mancos Shale.
Results
A new type log for the Mancos Shale in the Uinta Basin is developed here (Figure
15) with picks based on previous work in the basin (Molenaar and Cobban, 1991;
Kirschbaum, 2003; Anderson and Harris, 2006; Schamel, 2006), as well as new basin-
wide correlations presented herein. Eight stratigraphic intervals are identified, including
the Tununk Shale, Juana Lopez, Lower and Upper Blue Gate, upper and lower Mancos B,
and Buck Tongue Members of the Mancos Shale, and the Mesaverde Group. The variety
of facies observed in Mancos outcrop and core are reflected in the diverse gamma log
morphologies observed throughout the basin. The Tununk Shale overlies the mid-
Turonian unconformity above Lower Cretaceous strata, including the Dakota and Cedar
Mountain Sandstones and Mowry Shale (Molenaar and Cobban, 1991). The Juana Lopez
member is characterized by a ratty, high gamma ray interval directly overlying the
Tununk Shale. This gamma ray pattern reflects the organic-rich but heterolithic
interlaminated and interbedded sandstone, siltstone, and claystone deposits of this
member (Molenaar and Cobban, 1991; Anderson and Harris, 2006) (Figure 16).
The Lower and Upper Blue Gate members, which constitute the main body of the
Mancos, are separated by the Mancos B and are characterized by moderate to high API
values, with only subtle stratigraphic variations. This reflects gradual changes between
lithologies ranging from claystone to siltstone to sandstone-dominated heterolith
63
64
Figure 15: Mancos Shale type log taken from Pioneer Main Canyon Federal 23-7- 15S-23E well in the southeastern Uinta Basin. Lithostratigraphic units and sequence sets are labeled on the left, next to gamma ray plotted between 0 and 170 API. Third track overlays resistivity (black) and sonic (blue) logs to identify likely hydrocarbons using the A log R method (green shading). Fourth track displays calculated TOC, calibrated with core data and maturity modeling, on 0 to 10% scale (courtesy of R. Hillier). Depth relative to the top of the Lower Castlegate (correlation datum).
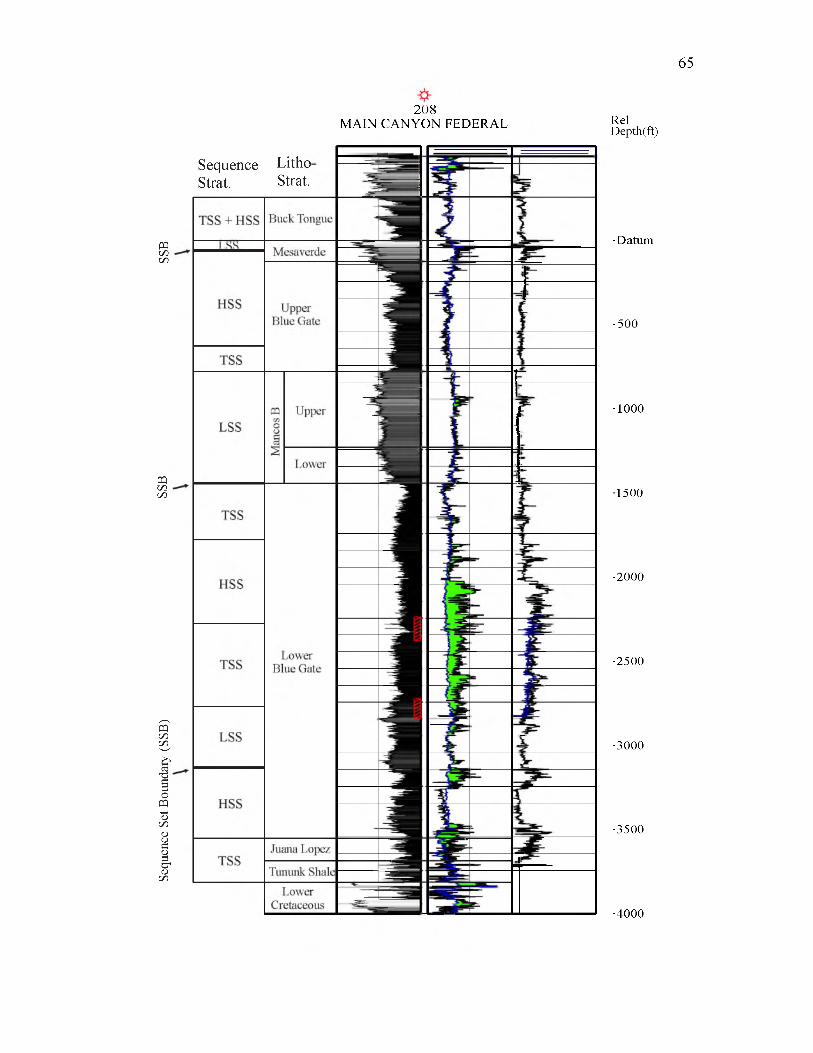
Sequ
ence
Se
t Bo
unda
ry
(SSB
) SSB
SS
B
65
208MAIN CANYON FEDERAL
Sequence Litho Strat. Strat.
RelDepth(ft)
-Datum
-500
-1000
-1500
-2000
-2500
-3000
-3500
-4000

(Kennedy, 2011; Horton, 2012). The Mancos B is an interval of lower gamma ray
values, commonly with sharp upper and basal contacts and multiple internal sharp-based
surfaces that provide a basis for internal division of the member into informal upper and
lower members herein (Figure 15). The gamma ray character reflects the sandstone-
dominated heterolithic lithology of this member (Figures 16 and 17) and its interpreted
deposition as subaqueous mass transport deposits (Cole et al., 1997). The Buck Tongue
Member displays similar gamma ray signatures to the Blue Gate Shale, but overlies the
Castlegate Sandstone.
Thickness and lithofacies of time correlative units within the Mancos vary along
both paleodepositional dip and strike according to varying depositional setting and local
accommodation. The Mancos Shale and chronostratigraphic equivalents thicken to the
west and north in the basin (Figure 18a). This thickening is accommodated primarily in
facies of the Lower Blue Gate (Figure 18b). Not all members of the shale follow similar
thickness trends; for example, the Mancos B thickens substantially to the southeast
(Figure 19). In the southern and eastern portions of the basin, where the Mancos is
thinner, vertical facies changes occur more abruptly, characterized by sharp flooding and
regressive surfaces (Figures 20 and 21). The most sharp-based surfaces in the Mancos
occur at the base and top of more distal portions of the Mancos B, where sandstone-
dominated heterolith facies abruptly overlie and underlie the finer-grained siltstone and
claystone rich units of the Blue Gate Shale (Figures 20 and 21). Additionally, in the
southeastern portion of the basin, distal equivalents of the Ferron and Frontier Sandstones
and the thin, high gamma ray shales of the Juana Lopez and lowermost Blue Gate include
a number of abrupt facies changes between interbedded finer-grained claystone and
66
67
Figure 16: Outcrop photos from exposures of the Mancos Shale in the Uinta Basin. A) Exposure of Juana Lopez Member from road cut along I-70, UT, characterized by alternating organic shale and siltstone bedding with current ripple indicators. B) Ripples preserved in fine sandstone bed of Juana Lopez Member, west of Rt. 191, 16 miles north of I-70 junction, UT. C+D) Exposure of heterolithic facies of Mancos B from Prairie Canyon, CO; C) Interlaminated rippled siltstone and sandstone; D) Mottled and bioturbated interlaminated sandstone and siltstone, burrows highlighted.
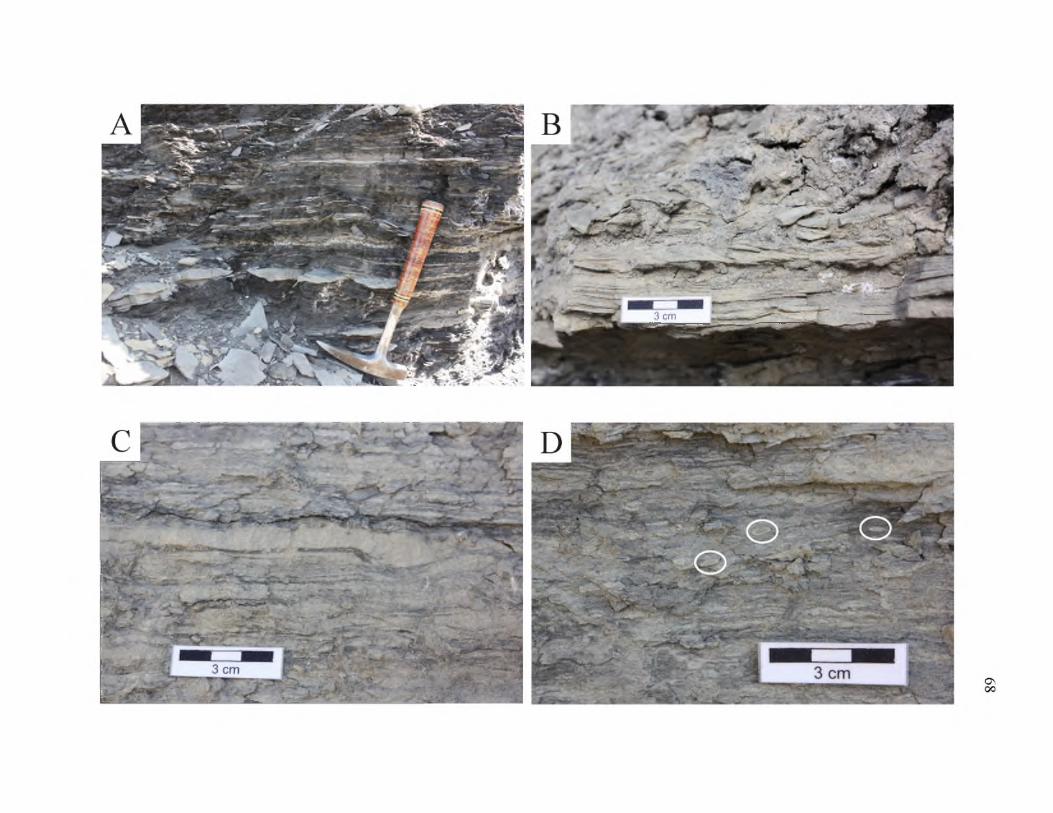
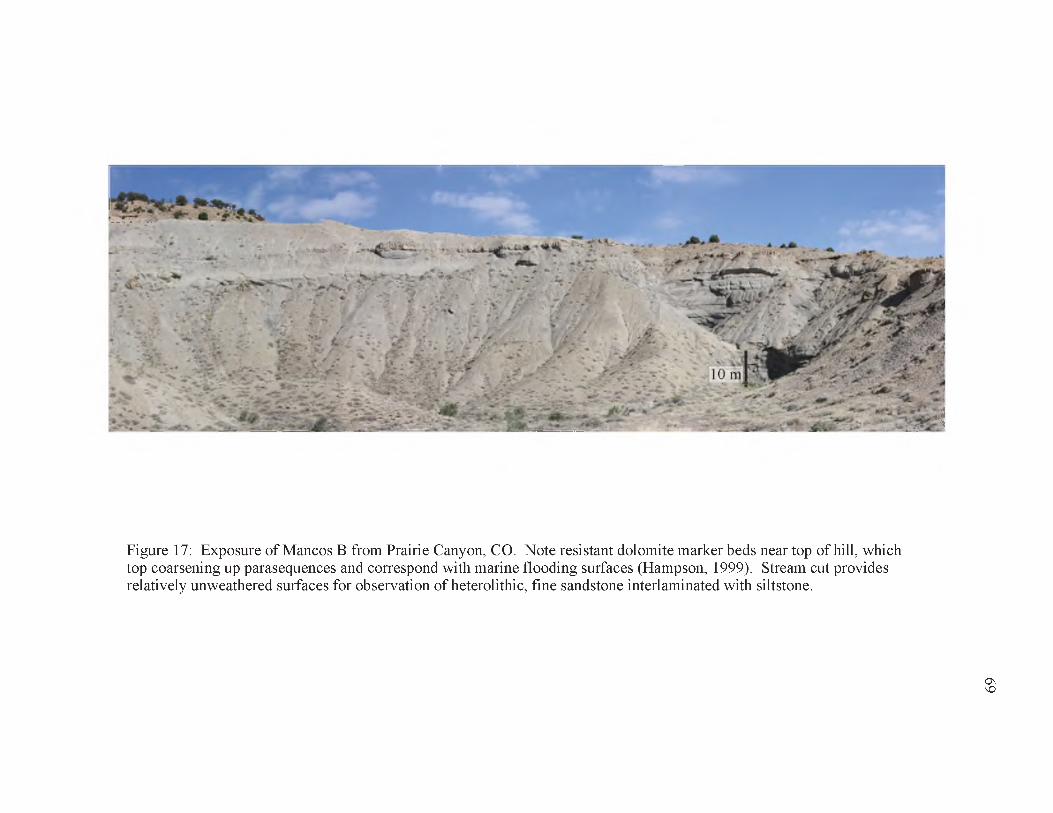
Figure 17: Exposure of Mancos B from Prairie Canyon, CO. Note resistant dolomite marker beds near top of hill, which top coarsening up parasequences and correspond with marine flooding surfaces (Hampson, 1999). Stream cut provides relatively unweathered surfaces for observation of heterolithic, fine sandstone interlaminated with siltstone.
OvVO
if K
K
70
Figure 18: Isopach maps of A) full thickness of the Mancos Shale and B) Lower Blue Gate Shale, Uinta Basin based on picks from 150 wells around the basin (black rings). Both intervals thicken strongly to the northwest. Traces of cross sections (Figures 20-red; 21-orange) included for reference.
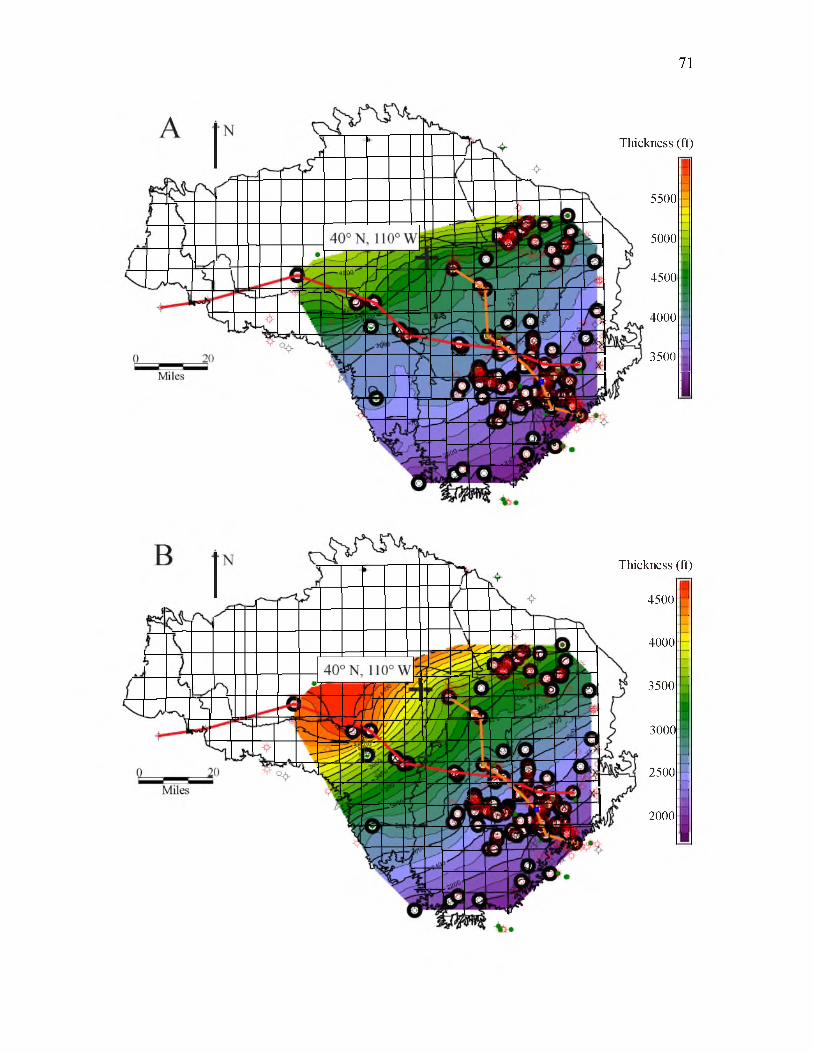
71
Thickness (ft)
5500
5000
4500
4000
3500
i
Thickness (ft)
4500
4000
3500
3000
2500
2000

72
Figure 19: Isopach maps of A) upper and B) lower Mancos B in the Uinta Basin based on picks from 150 wells around the basin (black rings). Traces of cross sections (Figures 20-red; 21-orange) included for reference.
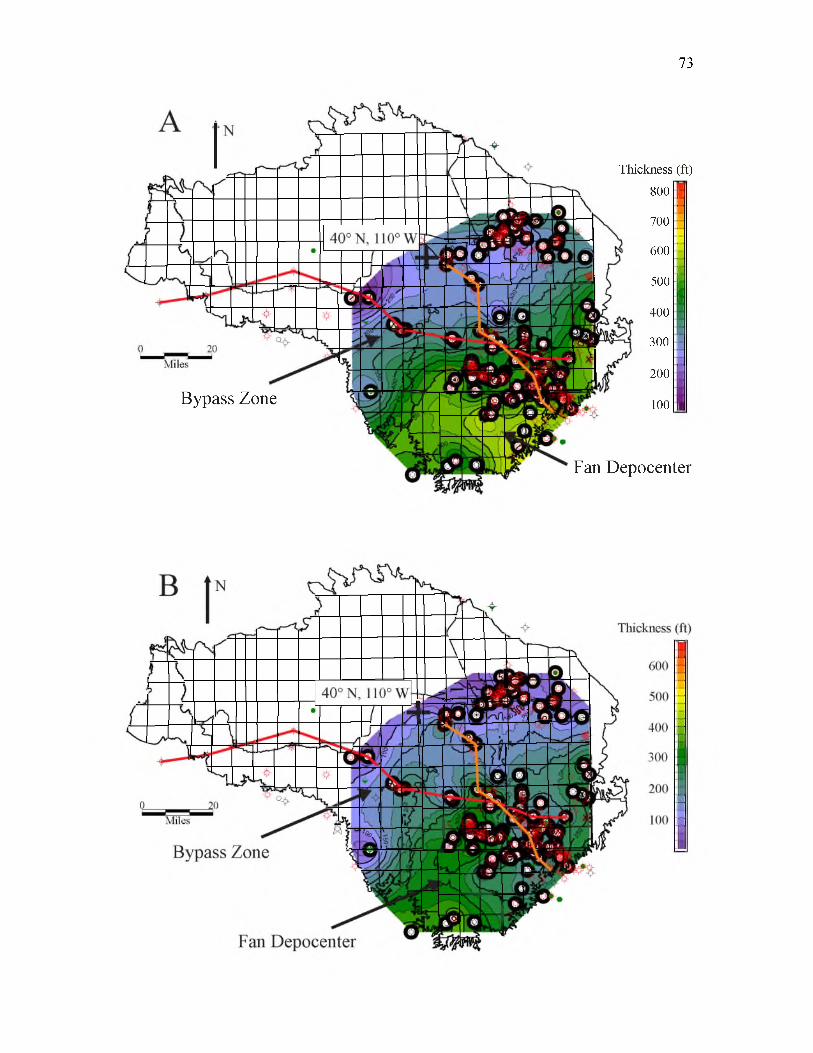
73
Bypass Zone
Thickness (ft) 800
700
600
500
400
300
200
100
Fan Depocenter
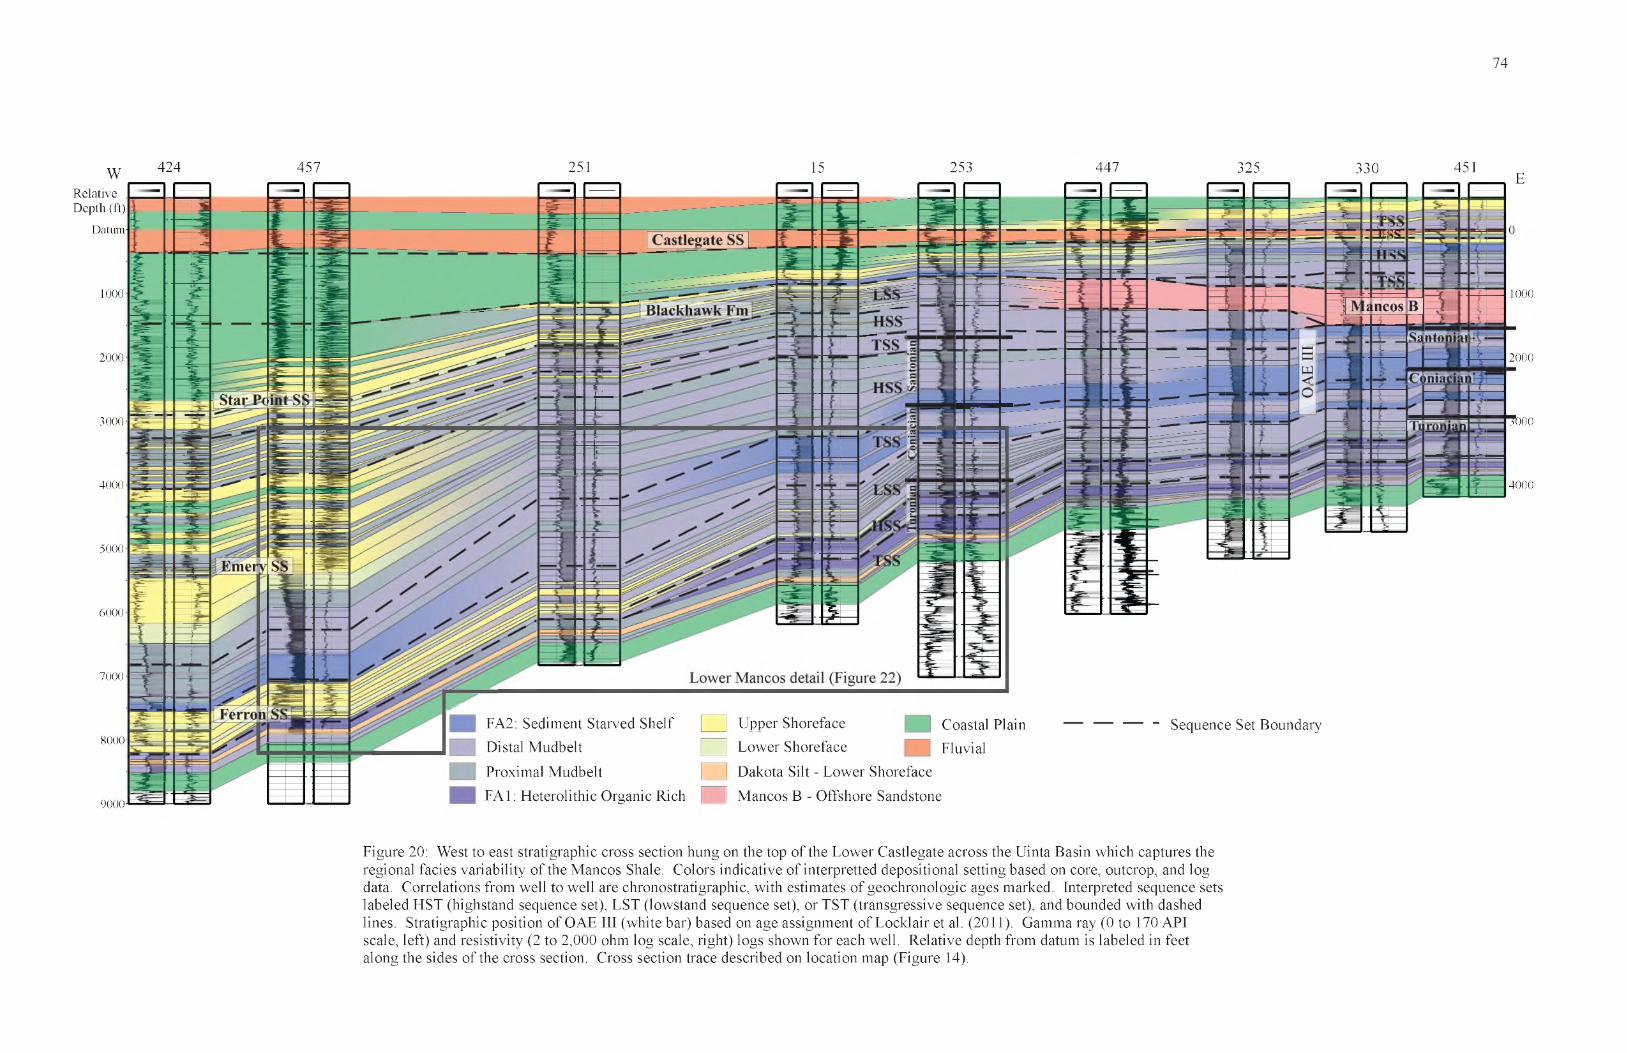
74
WRelative Depth (ft)
Datum'
1000
424 457 251 15 253 447 325 330 451
2000
3000
4000
5000
6000
7000
8000-
9000J
E
1000
2000
3000
4000
s 'FA2: Sediment Starved Shelf Upper ShorefaceDistal Mudbelt Lower Shoreface
Coastal Plain Fluvial
— — — - Sequence Set Boundary
Proximal MudbeltFA1: Heterolithic Organic Rich
Dakota Silt - Lower Shoreface
Mancos B - Offshore Sandstone
Figure 20: West to east stratigraphic cross section hung on the top of the Lower Castlegate across the Uinta Basin which captures the regional facies variability of the Mancos Shale. Colors indicative of interpretted depositional setting based on core, outcrop, and log data. Correlations from well to well are chronostratigraphic, with estimates of geochronologic ages marked. Interpreted sequence sets labeled HST (highstand sequence set), LST (lowstand sequence set), or TST (transgressive sequence set), and bounded with dashed lines. Stratigraphic position of OAE III (white bar) based on age assignment of Locklair et al. (2011). Gamma ray (0 to 170 API scale, left) and resistivity (2 to 2,000 ohm log scale, right) logs shown for each well. Relative depth from datum is labeled in feet along the sides of the cross section. Cross section trace described on location map (Figure 14).
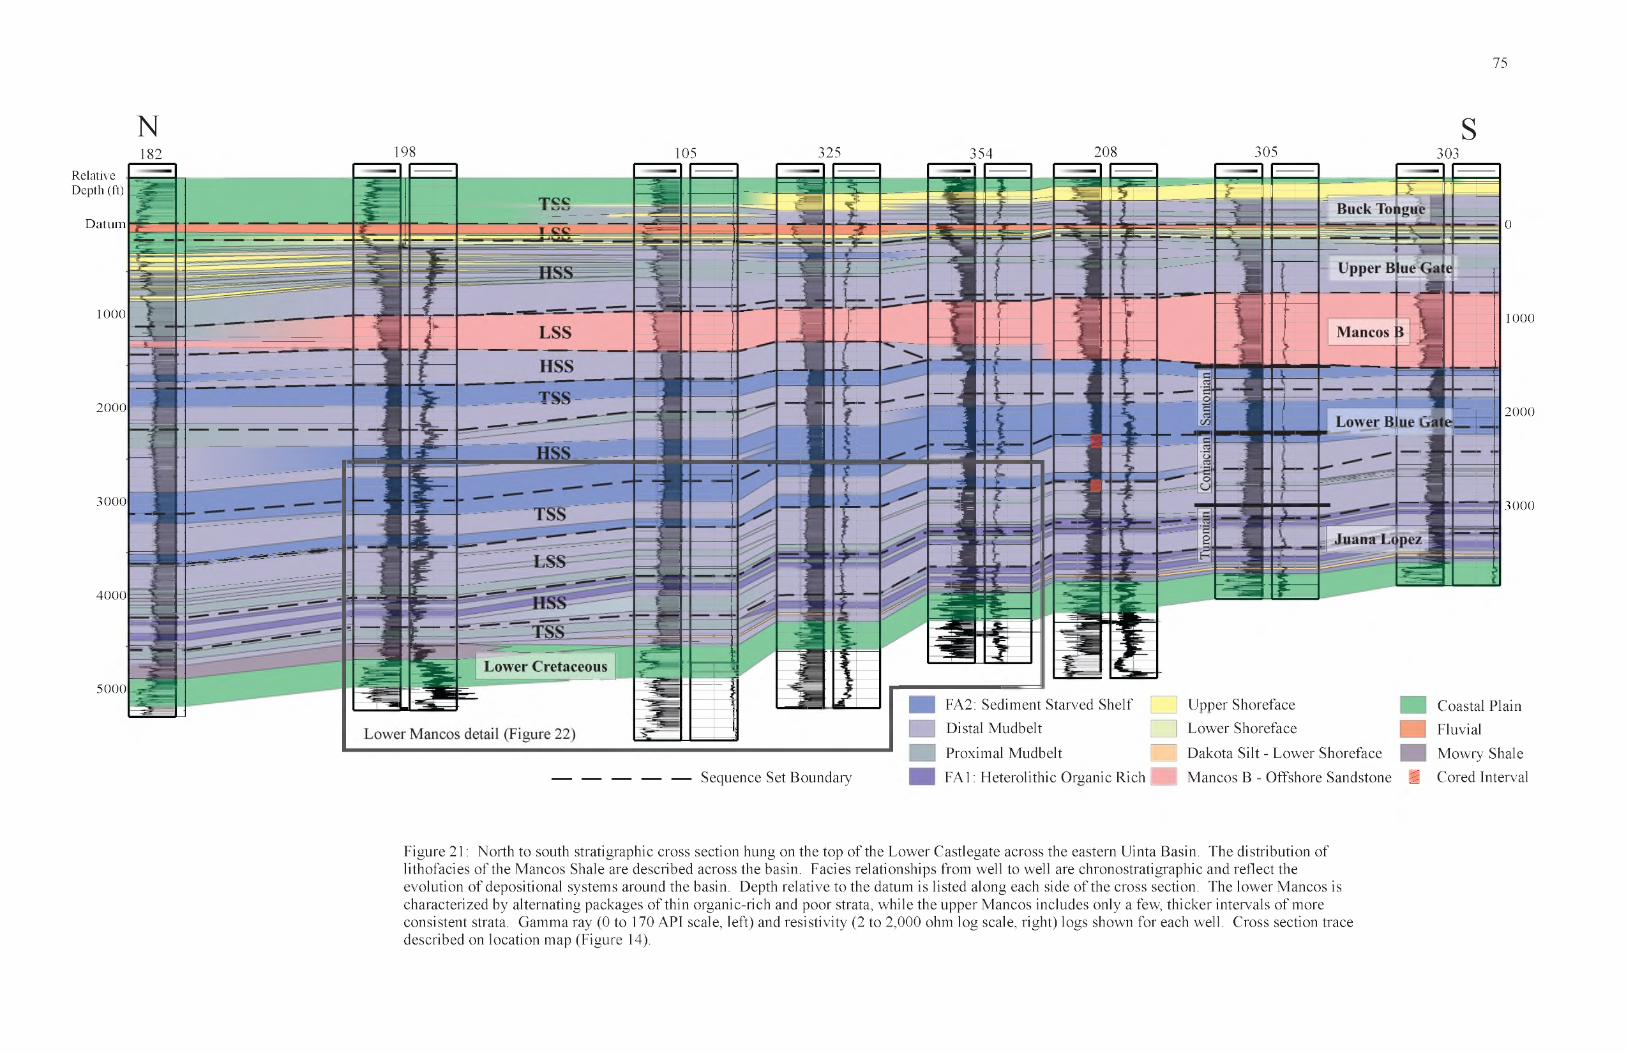
75
N182
S198 105 325 354 208 305 303
Relative Depth (ft)
Datum
1000
2000
3000
4000
5000
1000
2000
3000
Sequence Set Boundary
FA2: Sediment Starved Shelf Upper ShorefaceDistal Mudbelt Lower Shoreface
Proximal Mudbelt Dakota Silt - Lower Shoreface
FA1: Heterolithic Organic Rich Mancos B - Offshore Sandstone §
Coastal Plain Fluvial Mowry Shale Cored Interval
0
Figure 21: North to south stratigraphic cross section hung on the top of the Lower Castlegate across the eastern Uinta Basin. The distribution of lithofacies of the Mancos Shale are described across the basin. Facies relationships from well to well are chronostratigraphic and reflect the evolution of depositional systems around the basin. Depth relative to the datum is listed along each side of the cross section. The lower Mancos is characterized by alternating packages of thin organic-rich and poor strata, while the upper Mancos includes only a few, thicker intervals of more consistent strata. Gamma ray (0 to 170 API scale, left) and resistivity (2 to 2,000 ohm log scale, right) logs shown for each well. Cross section trace described on location map (Figure 14).

siltstone and coarser-grained siltstone to sandstone lithologies. In general, the gamma ray
changes across most sharp-based surfaces suggest proximal coarser-grained facies overlie
more distal, fine-grained facies, or vice versa, and record abrupt facies transitions
interpreted as abrupt changes in the relative distance to shoreline. Intervals from the
northern, central, and western portions of the basin tend to display more gradual, bow
shaped vertical gamma ray, and hence more gradual lithofacies transitions (Figures 20
and 21).
There are two major facies associations of relatively high gamma ray, organic,
and clay-rich facies identified from the distal portions of the Mancos Shale. These two
associations do not occur along the same depositional profile but instead occur in discrete
intervals of the stratigraphy. Facies Association 1 (FA1) corresponds with sharply
interbedded high and low gamma ray intervals of the Tununk, Juana Lopez, and
lowermost Blue Gate. In outcrop, these facies are organic-rich heterolith (Figure 16),
which contain dominantly organic-rich mudstone (>2% TOC over 50 ft [15 m]; Anderson
and Harris, 2006) with thinly interbedded and interlaminated fine sandstone. The
sandstone displays hummocky cross stratification and current ripples, sedimentary
structures which suggest episodic energetic deposition above storm wave base (Figure
16). Visual inspection of outcrop, palynology, and kerogen analysis suggests this interval
contains relatively abundant terrestrial organic matter, including peat swamp and
lacustrine signatures (Anderson and Harris, 2006; G. Waanders, personal communication,
2006). Across the basin, this interval is characterized by high gamma ray, laterally
continuous shales (claystone to siltstone dominated), often 100 ft (30 m) or less thick,
separated by low gamma ray intervals (siltstone to sandstone dominated), the distal
76
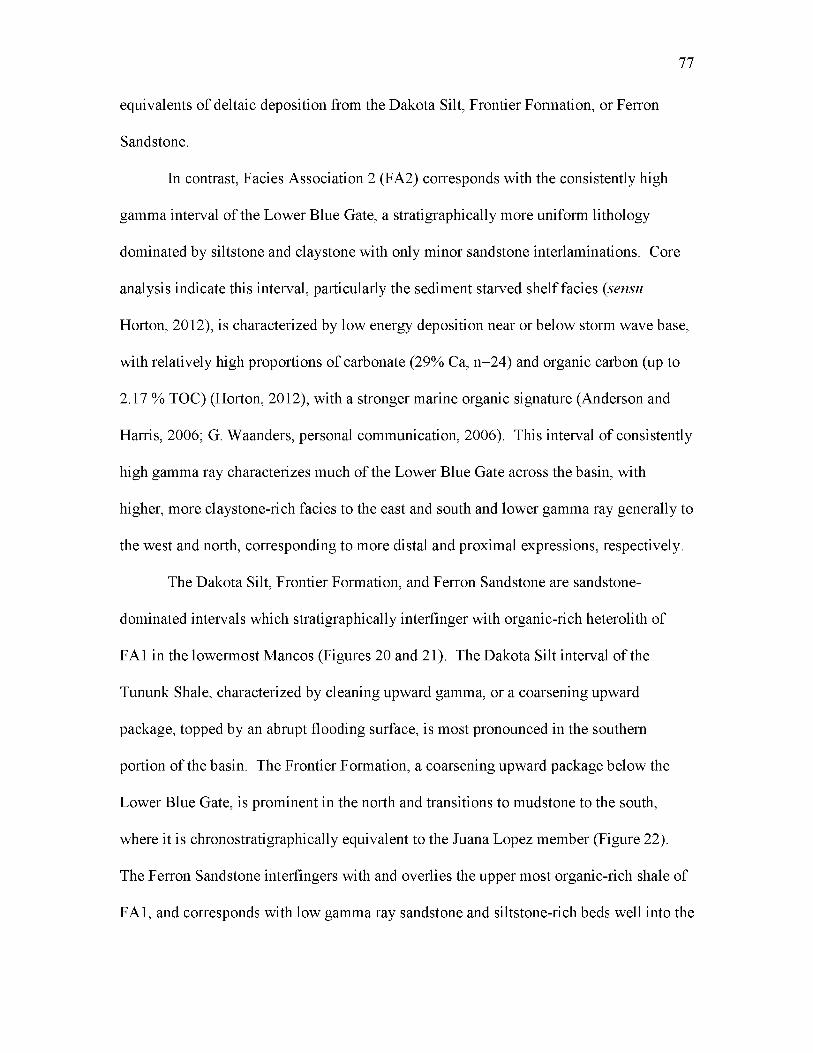
equivalents of deltaic deposition from the Dakota Silt, Frontier Formation, or Ferron
Sandstone.
In contrast, Facies Association 2 (FA2) corresponds with the consistently high
gamma interval of the Lower Blue Gate, a stratigraphically more uniform lithology
dominated by siltstone and claystone with only minor sandstone interlaminations. Core
analysis indicate this interval, particularly the sediment starved shelf facies (sensu
Horton, 2012), is characterized by low energy deposition near or below storm wave base,
with relatively high proportions of carbonate (29% Ca, n=24) and organic carbon (up to
2.17 % TOC) (Horton, 2012), with a stronger marine organic signature (Anderson and
Harris, 2006; G. Waanders, personal communication, 2006). This interval of consistently
high gamma ray characterizes much of the Lower Blue Gate across the basin, with
higher, more claystone-rich facies to the east and south and lower gamma ray generally to
the west and north, corresponding to more distal and proximal expressions, respectively.
The Dakota Silt, Frontier Formation, and Ferron Sandstone are sandstone-
dominated intervals which stratigraphically interfinger with organic-rich heterolith of
FA1 in the lowermost Mancos (Figures 20 and 21). The Dakota Silt interval of the
Tununk Shale, characterized by cleaning upward gamma, or a coarsening upward
package, topped by an abrupt flooding surface, is most pronounced in the southern
portion of the basin. The Frontier Formation, a coarsening upward package below the
Lower Blue Gate, is prominent in the north and transitions to mudstone to the south,
where it is chronostratigraphically equivalent to the Juana Lopez member (Figure 22).
The Ferron Sandstone interfingers with and overlies the upper most organic-rich shale of
FA1, and corresponds with low gamma ray sandstone and siltstone-rich beds well into the
77

78
Figure 22: Detail of lower Mancos (Tununk and Juana Lopez Members, Frontier Formation, and Ferron Sandstone) correlations from regional cross sections (Figures 20 and 21). A) 70 mi interval west to east through basin (Figure 20) describing the distal expression of the Ferron Sandstone stratigraphically overlying high gamma, heterolithic shales of the Juana Lopez. B) 30 mi interval north to south on eastern side of basin (Figure 21) depicts time correlative facies transition between Frontier Formation and Juana Lopez, both underlying low gamma ray strata of distal Ferron Sandstone.
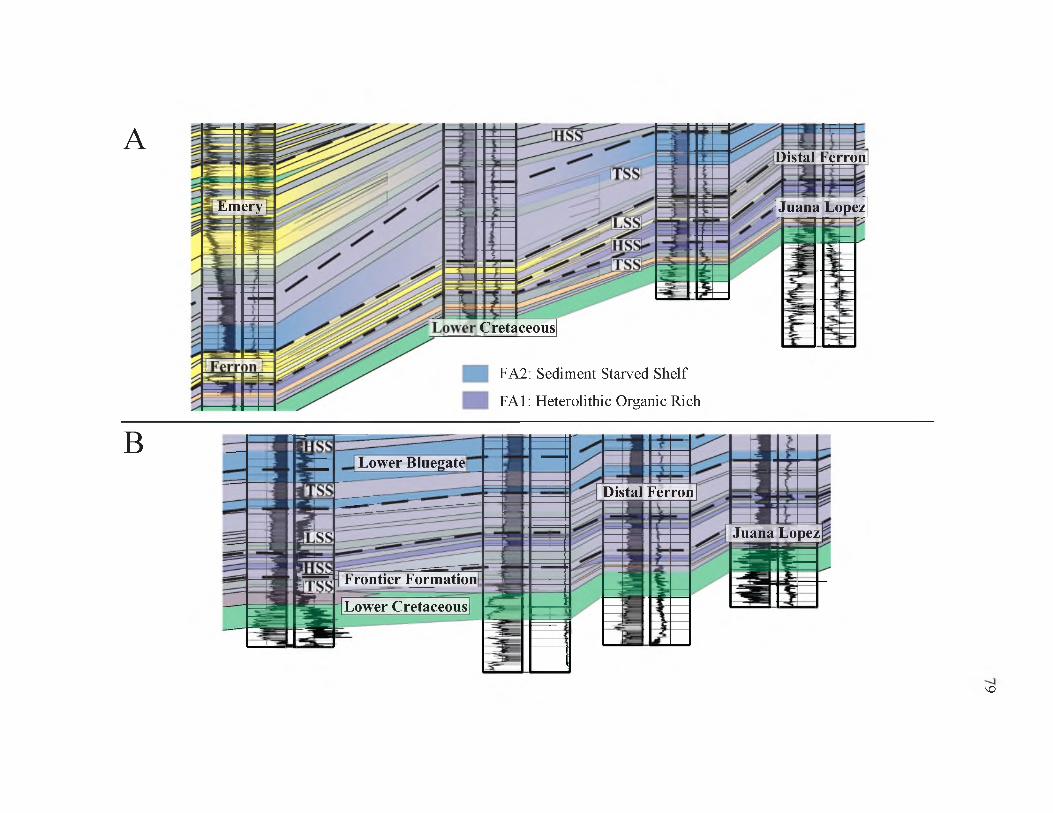
A
B
VO
Distal berron
Emery rj Juana Lopez
Cretaceous
FA2: Sediment Starved Shelf
FA1: Heterolithic Organic Rich
Lower Bluegate
Distal Ferron
Juana Lopez
Frontier Formation
Lower Cretaceous
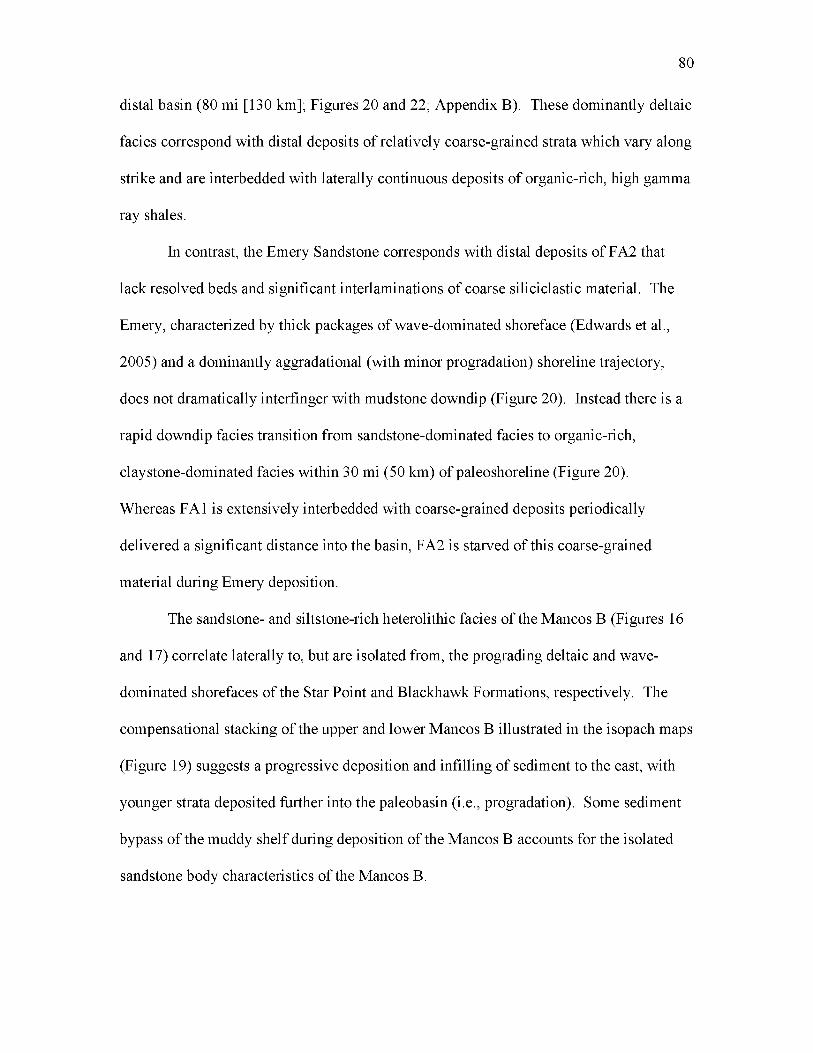
distal basin (80 mi [130 km]; Figures 20 and 22; Appendix B). These dominantly deltaic
facies correspond with distal deposits of relatively coarse-grained strata which vary along
strike and are interbedded with laterally continuous deposits of organic-rich, high gamma
ray shales.
In contrast, the Emery Sandstone corresponds with distal deposits of FA2 that
lack resolved beds and significant interlaminations of coarse siliciclastic material. The
Emery, characterized by thick packages of wave-dominated shoreface (Edwards et al.,
2005) and a dominantly aggradational (with minor progradation) shoreline trajectory,
does not dramatically interfinger with mudstone downdip (Figure 20). Instead there is a
rapid downdip facies transition from sandstone-dominated facies to organic-rich,
claystone-dominated facies within 30 mi (50 km) of paleoshoreline (Figure 20).
Whereas FA1 is extensively interbedded with coarse-grained deposits periodically
delivered a significant distance into the basin, FA2 is starved of this coarse-grained
material during Emery deposition.
The sandstone- and siltstone-rich heterolithic facies of the Mancos B (Figures 16
and 17) correlate laterally to, but are isolated from, the prograding deltaic and wave-
dominated shorefaces of the Star Point and Blackhawk Formations, respectively. The
compensational stacking of the upper and lower Mancos B illustrated in the isopach maps
(Figure 19) suggests a progressive deposition and infilling of sediment to the east, with
younger strata deposited further into the paleobasin (i.e., progradation). Some sediment
bypass of the muddy shelf during deposition of the Mancos B accounts for the isolated
sandstone body characteristics of the Mancos B.
80
This interpretation of a sediment bypass zone with downdip fan depocenter
(Figure 19) is further supported by evidence of sediment bypass and winnowing in
preferential cementation observed from Mancos outcrops that are distal equivalents of the
Blackhawk Formation in the Book Cliffs (Macquaker et al., 2007). The overall
progradation of shorefaces of the Mesaverde Group transition in a relatively short
distance down paleodepositional dip to offshore mudbelt facies (sensu Horton, 2012).
Only the Star Point Sandstone and lower members of the Blackhawk Formation,
including the Spring Canyon and Aberdeen Members, correlate with thick offshore
sandstone bodies of the Mancos B down dip, although smaller isolated sandstone bodies
have been correlated updip with other Blackhawk members, such as the Kenilworth
(Pattison, 2005). In outcrop, members of the Blackhawk Formation are characterized by
low clinoform dip angles (Hampson, 2000) and display gradual facies changes over 1-3
mi (2-5 km) down paleodepositional dip from upper shoreface into offshore mudstone
(Pattison et al., 2009).
Discussion
Depositional Framework
The depositional environment of the Mancos Shale evolved over the fifteen
million years of deposition as a product of tectonically driven fluctuations in basin
structure and global eustatic changes. The distal deposits of the Mancos evolved from
heterolithic organic-rich mudstone with interbedded and interlaminated sandstone typical
of FA1, which was deposited along a low gradient, shallow ramp in a low tectonic
subsidence and accommodation regime where fluvial dominated delta systems delivered
81

an abundance of terrestrial organic matter. Later, sediment was delivered from multiple
source wave-dominated deltas along the coast to the deeper, basinal claystone to siltstone,
specifically sediment starved shelf deposits of FA2, during Coniacian-Santonian
highstand under a high tectonic subsidence, high accommodation regime. Basin-floor
fans of the Mancos B then dominated the basin deposition, sourced from the prograding
shoreline of the Mesaverde group. These facies transitions reflect the tectonically driven
evolution of the foreland basin from a shallow ramp during the Early Turonian into a
deeper physiographic feature between the Middle Turonian and Upper Santonian, which
was subsequently infilled with shallow marine and then terrestrial sediments during the
early Campanian (Figures 23 and 24). Changing depositional conditions affected the
lateral and vertical distribution of lithofacies throughout the formation, including
corresponding proportions of quartz, clay, and carbonate, the preservation and source of
organic carbon, and the permeability and porosity of the formation.
The transition between energetic (above storm wave base), heterolithic deposition
of FA1 and low energy deposition (below storm wave base and basinward of most
hyperpycnal flows) of FA2 reveals a fundamental change in depositional environment
over this period. FA1 suggests relatively shallow water deposition with a significant
component of terrestrial organic matter and other sediment, but retains relatively high
organic matter content, with primary production likely driven by river fed nutrients
(Kosters et al., 2000). Recent work suggests that in broad, low gradient ramp settings,
the distance from shore maintains a greater influence on average grain size than water
depth, and mud transport is dominated by hyperpycnal flows and bedload transport rather
than suspension settling (Varban and Plint, 2008; Bhattacharya and MacEachern, 2009;
82
83
Figure 23: Schematic illustration of the contrasting depositional settings of the Mancos B (A), FA2 (B), and FA1 (C). Horizontal scale based on characteristic intervals from interpreted cross section (Figure 20).
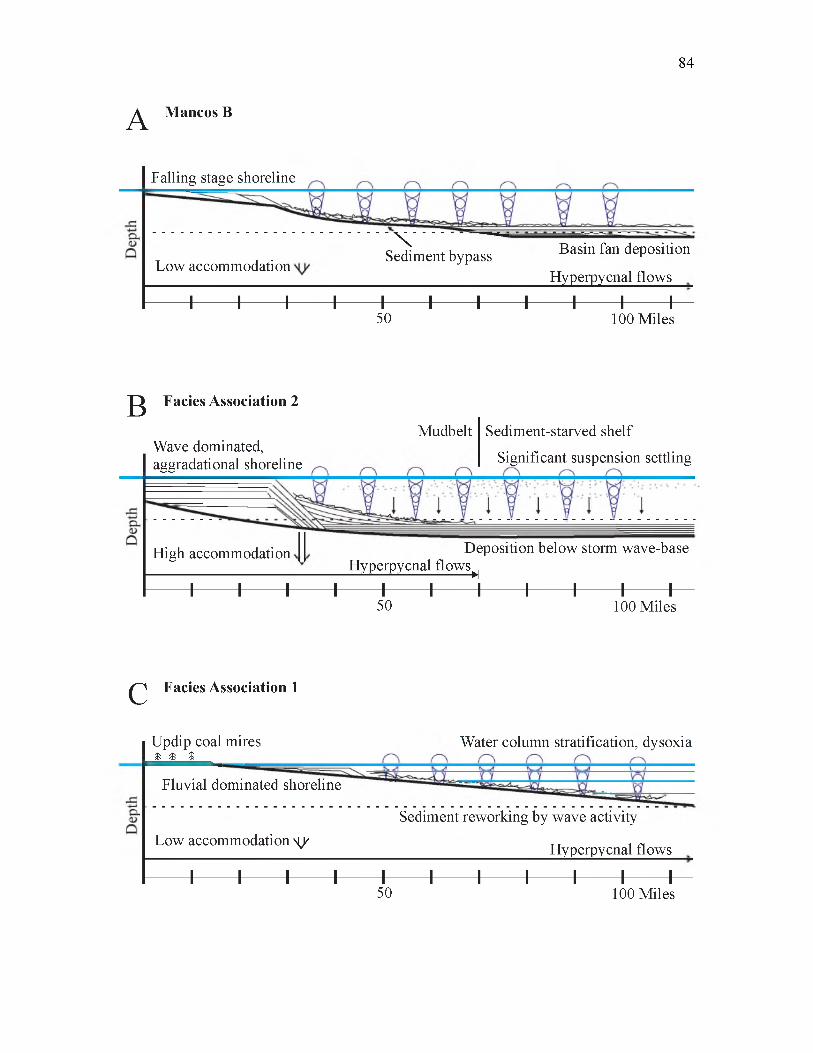
84
A Mancos B
Falling stage shoreline
Low accommodation
\ ............. —Sediment bypass Basin fan deposition
Hyperpycnal flows
---------1---------1---------1---------1— — 1---------1---------1----- H ---------1---------1--------- 1—50 100 Miles
B Facies Association 2
Wave dominated, aggradational shoreline
High accommodation
Mudbelt Sediment-starved shelf
Significant suspension settling
+ + + +
Deposition below storm wave-base Hyperpycnal flows>|
+ + + + + + +50 100 Miles
C Facies Association 1
peDe
Updip coal mires& a t
Water column stratification, dysoxia
Fluvial dominated shoreline
Low accommodation s /Sediment reworking by wave activity
_____________________Hyperpycnal flows
I------ 1------ 1------ 1------ 1------ 1------ 1------ 1------ 1------ 1------ 150 100 Miles

85
Figure 24: Paleogeographic maps of the study area from various times during the Upper Cretaceous. Representative lithostratigraphy for each is labeled. Maps have been ordered from oldest to youngest (A to G).
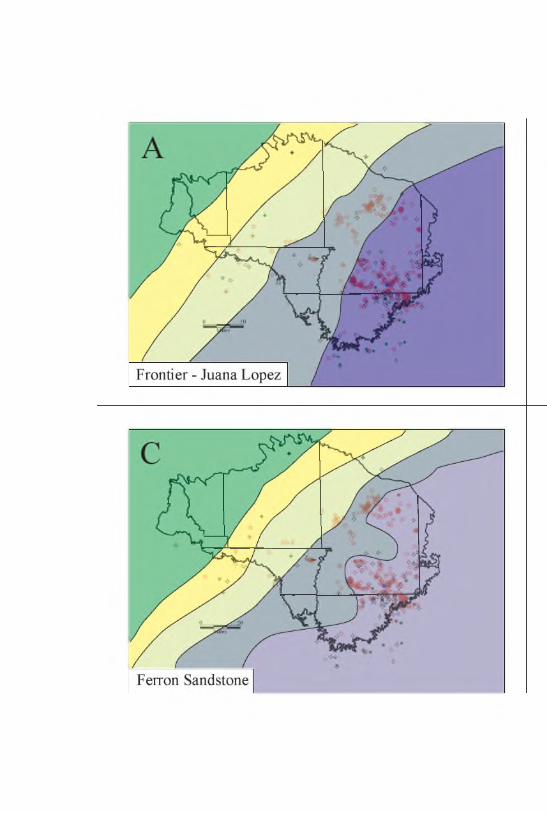
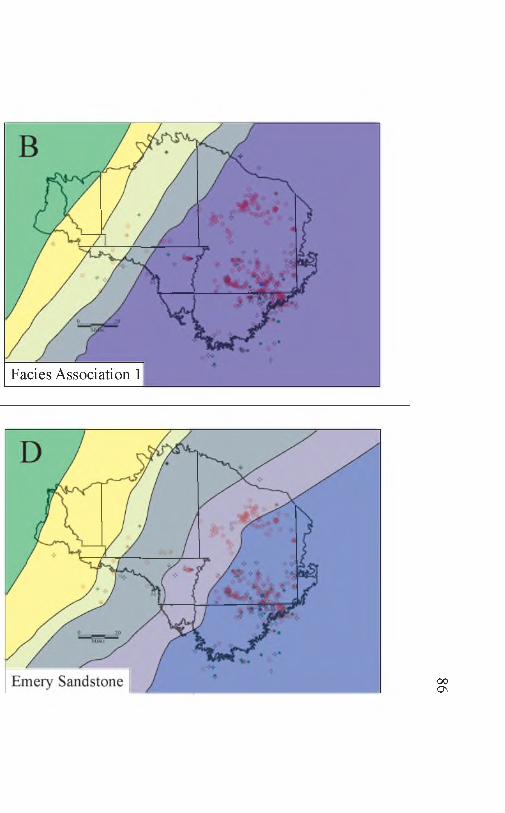
Facies Association 1
00Q\
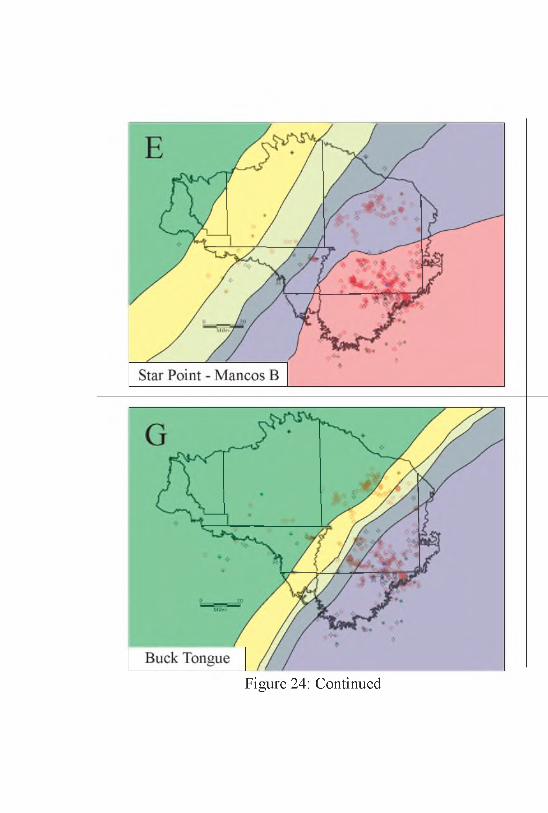
Figure 24: Continued
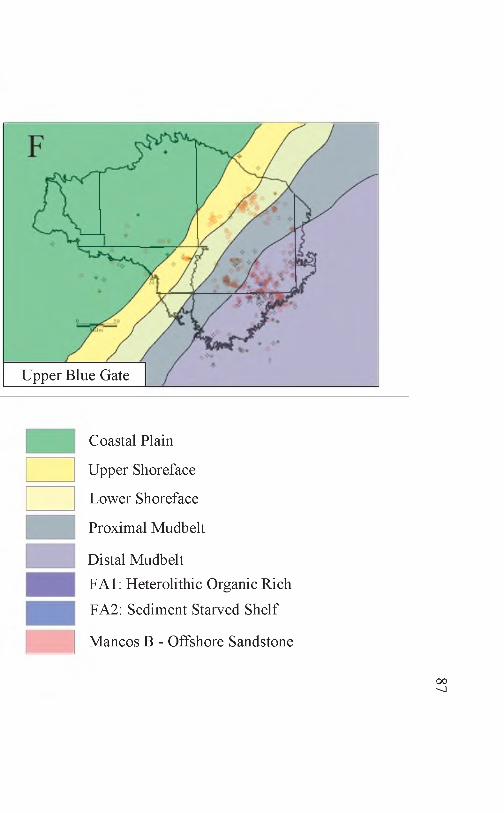
Upper Blue Gate
Coastal Plain
Upper Shoreface
Lower Shoreface
Proximal Mudbelt
Distal Mudbelt
FA1: Heterolithic Organic Rich
FA2: Sediment Starved Shelf
Mancos B - Offshore Sandstone
00<1
Macquaker et al., 2010; Plint et al., 2012). Largely unbioturbated facies of FA1 observed
from outcrop (Figure 16) suggest this was a very stressed environment for burrowers,
typical of delta front deposits (Bann and Fielding, 2004; MacEachern et al., 2005),
potentially related to brackish (Bhattacharya and MacEachern, 2009) or euxinic (Algeo et
al., 2004) water conditions, reducing the destruction of organic matter in sediments and
allowing for relatively high organic carbon preservation despite shallow water deposition.
In outcrop analysis that evaluated distal equivalent marine deposits of the Frontier and
Ferron from Westwater, UT, Anderson and Harris (2006) identified multiple sequences
of turbidite and delta front deposits interbedded with regionally extensive organic-rich
shales. Sandstone bodies within the sequences display variable paleocurrent directions,
suggestive of multiple sediment sources (Anderson and Harris, 2006). Modern analogues
for FA1 include broad shelves of the Po, Orinoco, Rhone, and Mississippi deltas, which
include organic-rich sediments with high organic content and abundant plant material
(Kosters et al., 2000).
In contrast, sedimentary structures of FA2 in the Lower Blue Gate indicate the
most carbonate and organic carbon-rich facies were deposited near or below storm wave
base and basinward of the influence of most hyperpycnal flows (Kennedy, 2011; Horton,
2012). These facies were deposited in a deeper basin than earlier or subsequent Mancos
strata, made possible by enhanced tectonic subsidence. At this time sandstone and
siltstone of the Emery was accommodated near to paleoshoreline, so the offshore
dispersal distance of terrestrial organic matter and coarse-grained siliclastics was limited.
Distal deposition of FA2 was dominated by clay and carbonate suspension settling,
including coccolithophores and silicious diatoms (Figure 25) rather than bedload
88
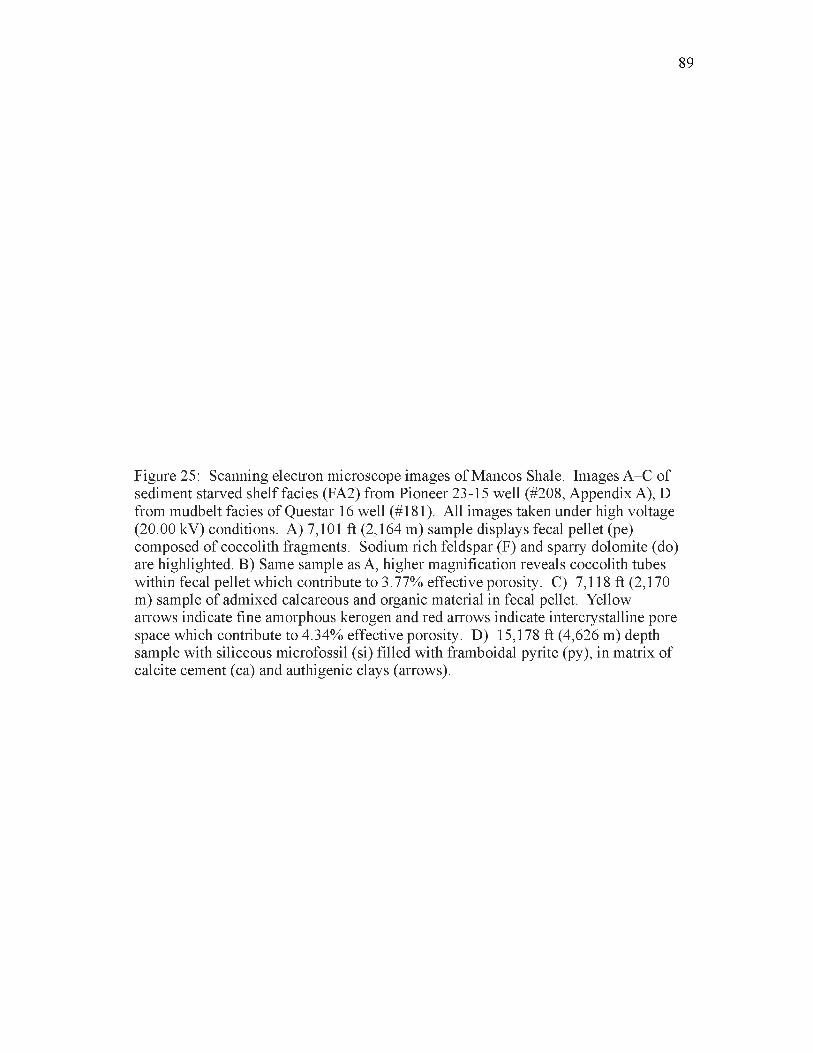
89
Figure 25: Scanning electron microscope images of Mancos Shale. Images A-C of sediment starved shelf facies (FA2) from Pioneer 23-15 well (#208, Appendix A), D from mudbelt facies of Questar 16 well (#181). All images taken under high voltage (20.00 kV) conditions. A) 7,101 ft (2,164 m) sample displays fecal pellet (pe) composed of coccolith fragments. Sodium rich feldspar (F) and sparry dolomite (do) are highlighted. B) Same sample as A, higher magnification reveals coccolith tubes within fecal pellet which contribute to 3.77% effective porosity. C) 7,118 ft (2,170 m) sample of admixed calcareous and organic material in fecal pellet. Yellow arrows indicate fine amorphous kerogen and red arrows indicate intercrystalline pore space which contribute to 4.34% effective porosity. D) 15,178 ft (4,626 m) depth sample with siliceous microfossil (si) filled with framboidal pyrite (py), in matrix of calcite cement (ca) and authigenic clays (arrows).
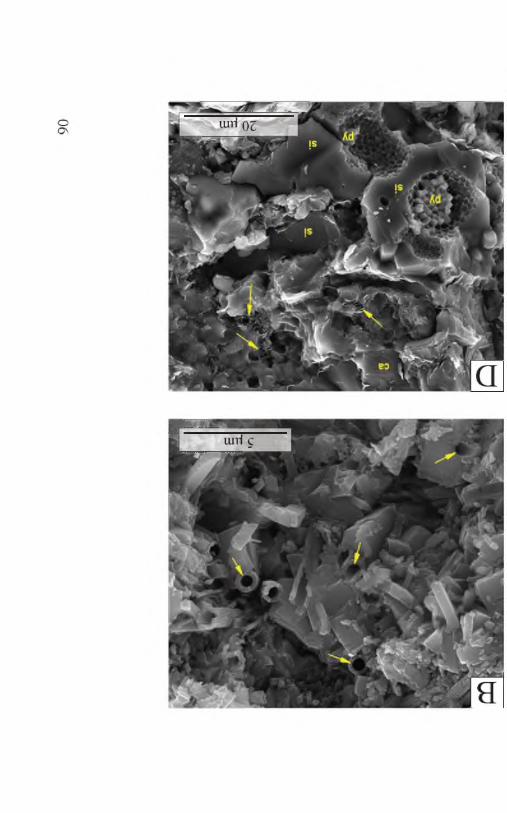
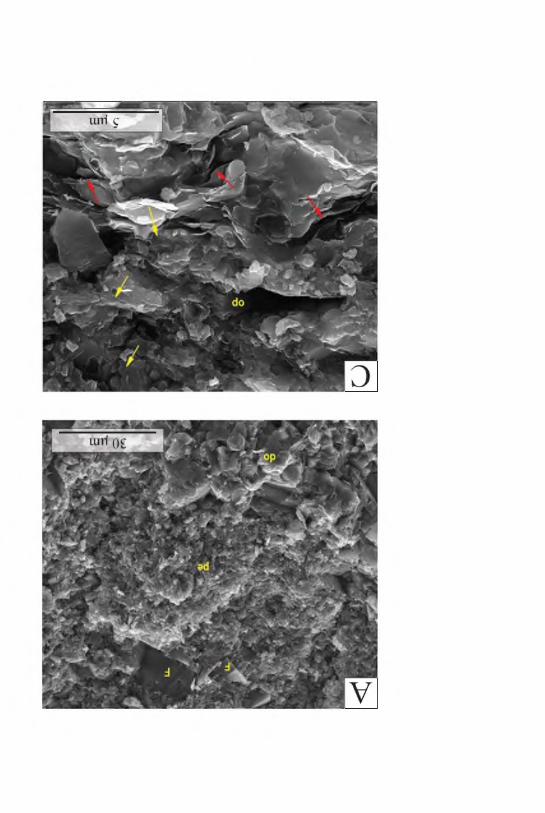
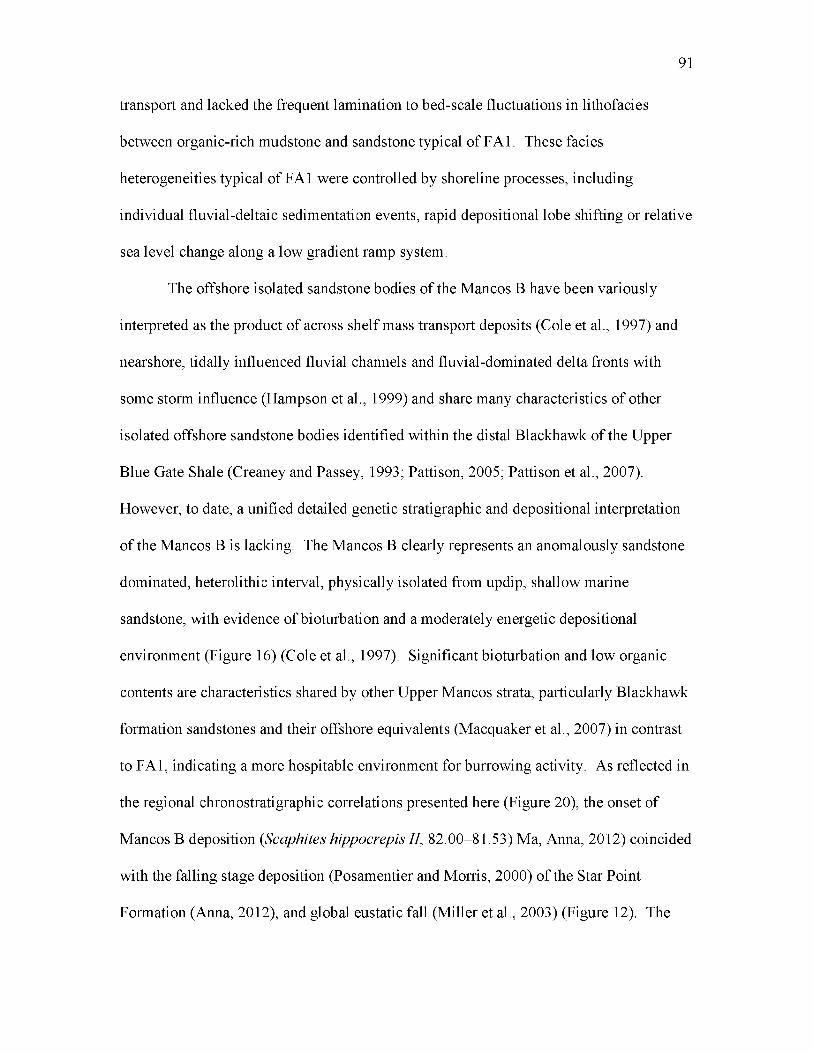
transport and lacked the frequent lamination to bed-scale fluctuations in lithofacies
between organic-rich mudstone and sandstone typical of FA1. These facies
heterogeneities typical of FA1 were controlled by shoreline processes, including
individual fluvial-deltaic sedimentation events, rapid depositional lobe shifting or relative
sea level change along a low gradient ramp system.
The offshore isolated sandstone bodies of the Mancos B have been variously
interpreted as the product of across shelf mass transport deposits (Cole et al., 1997) and
nearshore, tidally influenced fluvial channels and fluvial-dominated delta fronts with
some storm influence (Hampson et al., 1999) and share many characteristics of other
isolated offshore sandstone bodies identified within the distal Blackhawk of the Upper
Blue Gate Shale (Creaney and Passey, 1993; Pattison, 2005; Pattison et al., 2007).
However, to date, a unified detailed genetic stratigraphic and depositional interpretation
of the Mancos B is lacking. The Mancos B clearly represents an anomalously sandstone
dominated, heterolithic interval, physically isolated from updip, shallow marine
sandstone, with evidence of bioturbation and a moderately energetic depositional
environment (Figure 16) (Cole et al., 1997). Significant bioturbation and low organic
contents are characteristics shared by other Upper Mancos strata, particularly Blackhawk
formation sandstones and their offshore equivalents (Macquaker et al., 2007) in contrast
to FA1, indicating a more hospitable environment for burrowing activity. As reflected in
the regional chronostratigraphic correlations presented here (Figure 20), the onset of
Mancos B deposition (Scaphites hippocrepis II, 82.00-81.53) Ma, Anna, 2012) coincided
with the falling stage deposition (Posamentier and Morris, 2000) of the Star Point
Formation (Anna, 2012), and global eustatic fall (Miller et al., 2003) (Figure 12). The
91

Mancos B corresponds with falling sea level and represents lowstand basin floor fan
deposition, which infilled the deep basin formed during deposition of the Blue Gate in the
Coniacian and Santonian to a level above storm wave base. It is possible that sediment
was transported to more distal portions of the shelf either through small incised channel
forms like those observed in the distal Blackhawk of the Upper Blue Gate (Figure 26) or
through net across shelf transport driven by geostrophic currents as suggested by Cole et
al. (1997). Distinct bodies of regional extent are correlated within the Mancos B
suggesting multiphase deposition that correlates to multiple shallow marine sandstone
members updip (Figures 20 and 21).
Sequence Stratigraphy
Mancos equivalent strata in northeastern and central Utah have been the subject of
extensive sequence stratigraphic analysis, and provide ground truth for evaluation of the
sequence stratigraphy in more distal lithologies. Transgressive-regressive (T-R) cycles
provide a useful framework for identifying genetic stratigraphic context for the distal
Mancos Shale in the eastern portion of the Uinta Basin, where stratigraphy is fairly layer-
cake and relative proportions of claystone and sandstone provide an effective proxy for
relative sea level (Embry, 2002; Ch. 1). However, T-R cycles are unable to distinguish
the nature of regression. They cannot distinguish between highstand and lowstand
conditions. These distinctions have significant impacts on the distribution of lithofacies,
influencing the relative abundance of sandstone, carbonate, and organic matter in strata
across the basin (Bohacs, 1998; Slatt and Rodriguez, 2012). Furthermore, shallow
marine sandstone units that are the paleodepositional updip equivalents of the Mancos
92
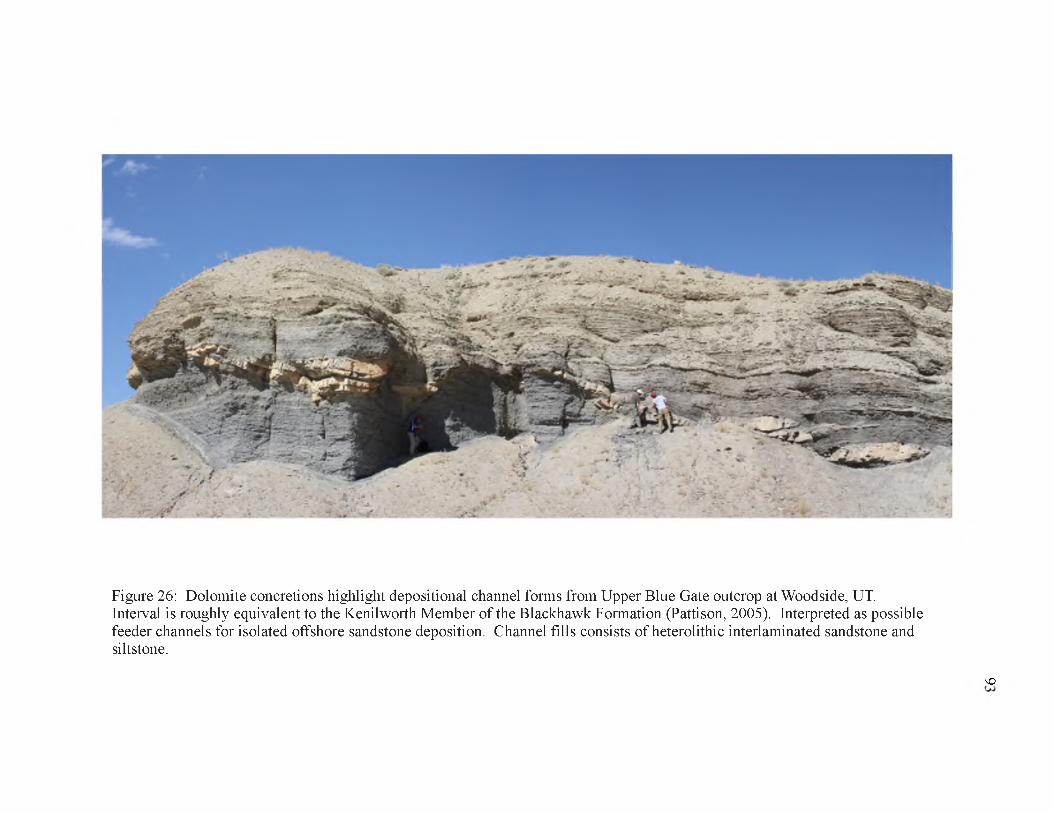
Figure 26: Dolomite concretions highlight depositional channel forms from Upper Blue Gate outcrop at Woodside, UT. Interval is roughly equivalent to the Kenilworth Member of the Blackhawk Formation (Pattison, 2005). Interpreted as possible feeder channels for isolated offshore sandstone deposition. Channel fills consists of heterolithic interlaminated sandstone and siltstone.
VO
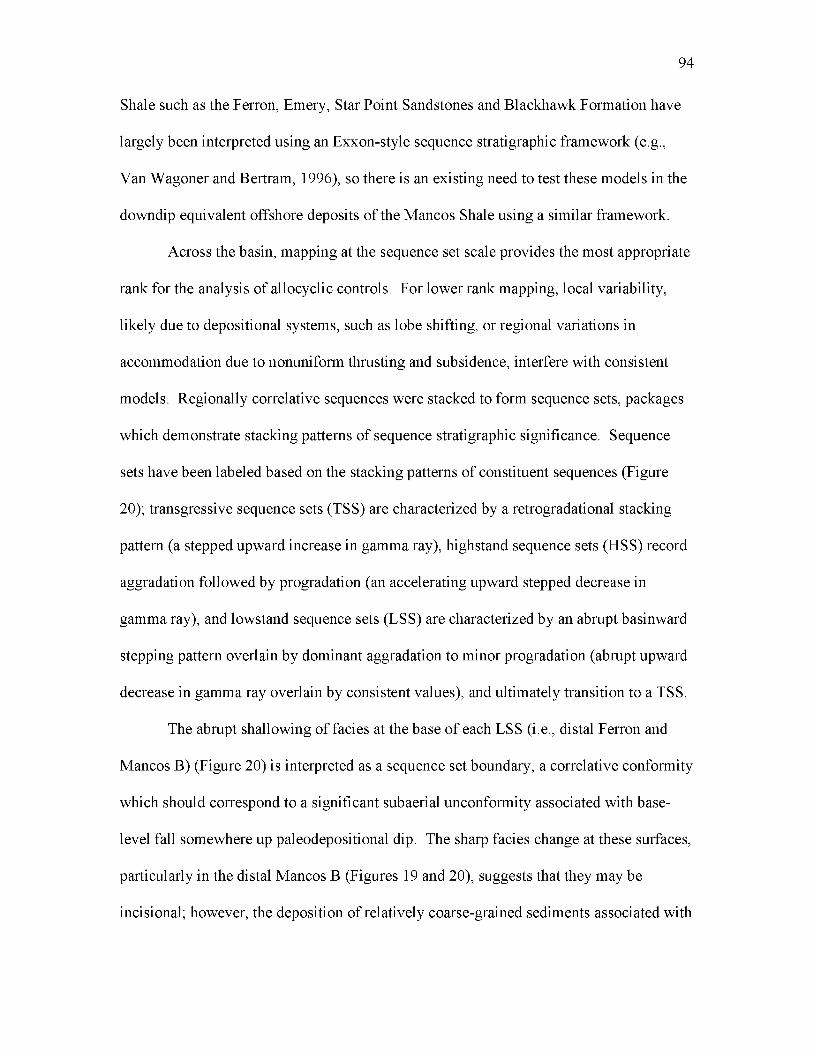
Shale such as the Ferron, Emery, Star Point Sandstones and Blackhawk Formation have
largely been interpreted using an Exxon-style sequence stratigraphic framework (e.g.,
Van Wagoner and Bertram, 1996), so there is an existing need to test these models in the
downdip equivalent offshore deposits of the Mancos Shale using a similar framework.
Across the basin, mapping at the sequence set scale provides the most appropriate
rank for the analysis of allocyclic controls. For lower rank mapping, local variability,
likely due to depositional systems, such as lobe shifting, or regional variations in
accommodation due to nonuniform thrusting and subsidence, interfere with consistent
models. Regionally correlative sequences were stacked to form sequence sets, packages
which demonstrate stacking patterns of sequence stratigraphic significance. Sequence
sets have been labeled based on the stacking patterns of constituent sequences (Figure
20); transgressive sequence sets (TSS) are characterized by a retrogradational stacking
pattern (a stepped upward increase in gamma ray), highstand sequence sets (HSS) record
aggradation followed by progradation (an accelerating upward stepped decrease in
gamma ray), and lowstand sequence sets (LSS) are characterized by an abrupt basinward
stepping pattern overlain by dominant aggradation to minor progradation (abrupt upward
decrease in gamma ray overlain by consistent values), and ultimately transition to a TSS.
The abrupt shallowing of facies at the base of each LSS (i.e., distal Ferron and
Mancos B) (Figure 20) is interpreted as a sequence set boundary, a correlative conformity
which should correspond to a significant subaerial unconformity associated with base-
level fall somewhere up paleodepositional dip. The sharp facies change at these surfaces,
particularly in the distal Mancos B (Figures 19 and 20), suggests that they may be
incisional; however, the deposition of relatively coarse-grained sediments associated with
94
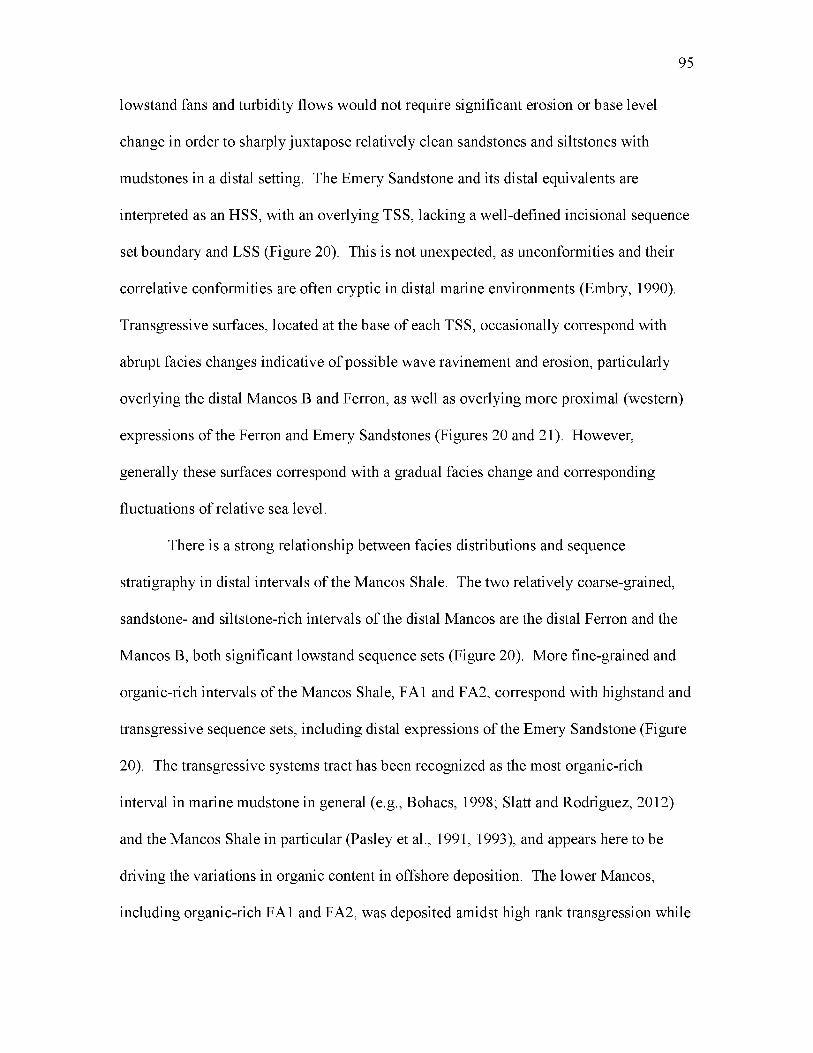
lowstand fans and turbidity flows would not require significant erosion or base level
change in order to sharply juxtapose relatively clean sandstones and siltstones with
mudstones in a distal setting. The Emery Sandstone and its distal equivalents are
interpreted as an HSS, with an overlying TSS, lacking a well-defined incisional sequence
set boundary and LSS (Figure 20). This is not unexpected, as unconformities and their
correlative conformities are often cryptic in distal marine environments (Embry, 1990).
Transgressive surfaces, located at the base of each TSS, occasionally correspond with
abrupt facies changes indicative of possible wave ravinement and erosion, particularly
overlying the distal Mancos B and Ferron, as well as overlying more proximal (western)
expressions of the Ferron and Emery Sandstones (Figures 20 and 21). However,
generally these surfaces correspond with a gradual facies change and corresponding
fluctuations of relative sea level.
There is a strong relationship between facies distributions and sequence
stratigraphy in distal intervals of the Mancos Shale. The two relatively coarse-grained,
sandstone- and siltstone-rich intervals of the distal Mancos are the distal Ferron and the
Mancos B, both significant lowstand sequence sets (Figure 20). More fine-grained and
organic-rich intervals of the Mancos Shale, FA1 and FA2, correspond with highstand and
transgressive sequence sets, including distal expressions of the Emery Sandstone (Figure
20). The transgressive systems tract has been recognized as the most organic-rich
interval in marine mudstone in general (e.g., Bohacs, 1998; Slatt and Rodriguez, 2012)
and the Mancos Shale in particular (Pasley et al., 1991, 1993), and appears here to be
driving the variations in organic content in offshore deposition. The lower Mancos,
including organic-rich FA1 and FA2, was deposited amidst high rank transgression while
95
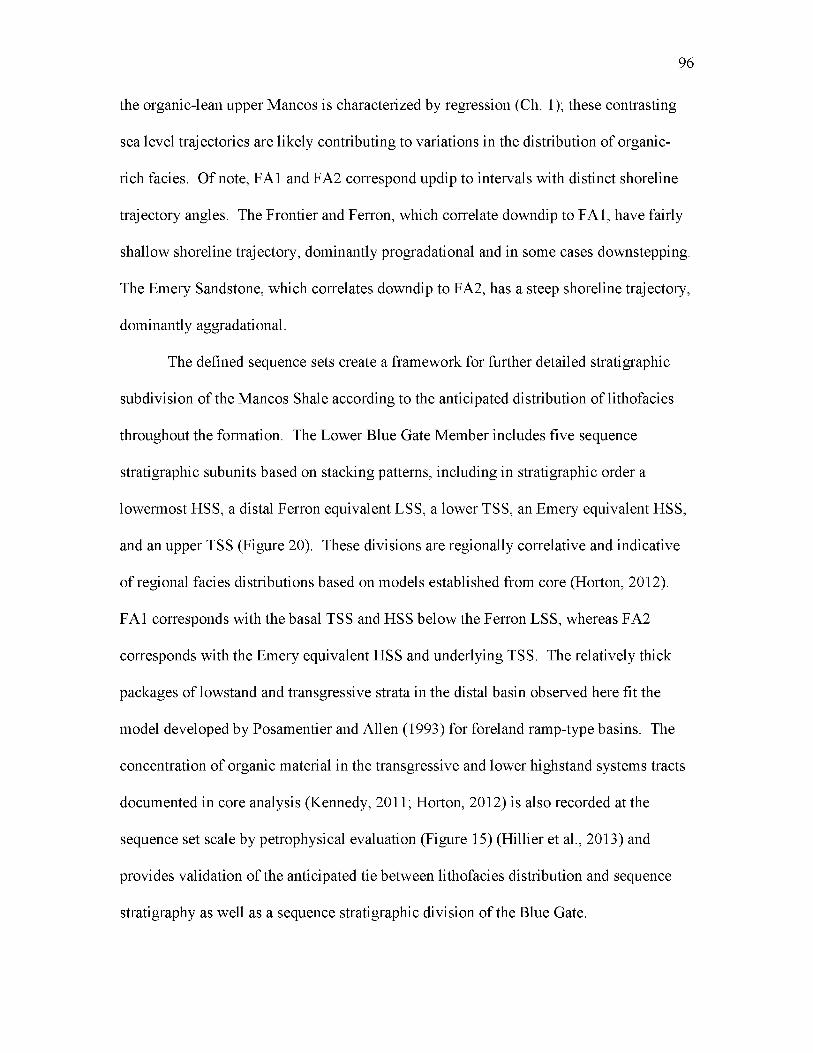
the organic-lean upper Mancos is characterized by regression (Ch. 1); these contrasting
sea level trajectories are likely contributing to variations in the distribution of organic-
rich facies. Of note, FA1 and FA2 correspond updip to intervals with distinct shoreline
trajectory angles. The Frontier and Ferron, which correlate downdip to FA1, have fairly
shallow shoreline trajectory, dominantly progradational and in some cases downstepping.
The Emery Sandstone, which correlates downdip to FA2, has a steep shoreline trajectory,
dominantly aggradational.
The defined sequence sets create a framework for further detailed stratigraphic
subdivision of the Mancos Shale according to the anticipated distribution of lithofacies
throughout the formation. The Lower Blue Gate Member includes five sequence
stratigraphic subunits based on stacking patterns, including in stratigraphic order a
lowermost HSS, a distal Ferron equivalent LSS, a lower TSS, an Emery equivalent HSS,
and an upper TSS (Figure 20). These divisions are regionally correlative and indicative
of regional facies distributions based on models established from core (Horton, 2012).
FA1 corresponds with the basal TSS and HSS below the Ferron LSS, whereas FA2
corresponds with the Emery equivalent HSS and underlying TSS. The relatively thick
packages of lowstand and transgressive strata in the distal basin observed here fit the
model developed by Posamentier and Allen (1993) for foreland ramp-type basins. The
concentration of organic material in the transgressive and lower highstand systems tracts
documented in core analysis (Kennedy, 2011; Horton, 2012) is also recorded at the
sequence set scale by petrophysical evaluation (Figure 15) (Hillier et al., 2013) and
provides validation of the anticipated tie between lithofacies distribution and sequence
stratigraphy as well as a sequence stratigraphic division of the Blue Gate.
96

Driving Mechanisms
The correlation of chronostratigraphic markers provides a framework for
understanding the stratigraphic evolution of the Mancos Shale in the Uinta Basin.
However, absolute age control is required in order to relate this formation to the global
geological record. Ash beds are located within the Mancos, but these have not been well
dated, and geochronology is based primarily on biostratigraphy, which is well
constrained for the Cretaceous Western Interior Seaway (Kauffman et al., 1993). Age
control for the Mancos Shale in northeastern Utah has been reported largely by Fouch et
al. (1983) and Molenaar and Cobban (1991), with more recent work by Anderson and
Harris (2006) and Anna (2012), and a compilation of Ferron biostratigraphy is reported in
Gardner et al. (2004). The base of the Tununk Shale is younger to the west, near
Farnham Dome, where the Early Turonian Mytiloides was identified, whereas the Late
Cenomanian Pycnodonte newberryi was found south of Green River. The Dakota Silt,
near the base of the Mancos, includes Middle Turonian Collinoniceras woolgari, (92.90
Ma, Molenaar and Cobban, 1991). These lower Mancos intervals suggest a roughly four
million hiatus exists between the Mancos and underlying Cenomanian Dakota, Cedar
Mountain, and Mowry strata (Molenaar and Cobban, 1991). Middle Campanian
Baculitesperplexus (79.01-78.34) Ma) from the Buck Tongue (Anna, 2012) and
Baculites asperiformis (80.21-79.64) Ma) from the Castlegate Sandstone (Fouch et al.,
1983) constrain the end of Mancos deposition.
Late Cretaceous eustasy has been the subject of study from European and North
American strata (e.g., Haq et al., 1987; Hancock, 1993; Sahagian et al., 1996; Miller et
al., 2003) and can be used to separate the relative influence of eustasy and tectonics in sea
97

level changes recorded in the rock record. Several major eustatic regressions are
identified from multiple records during the time of Mancos deposition; at 90, 84, and 80
Ma (Miller et al., 2003), which correspond with the timing of Ferron (Ar/Ar, 90.25 ± 0.45
Ma, Gardner, 1995a), Emery (Clioscaphites vermiformis, 85.56-85.23 Ma to
Desmoscaphites bassleri, 84.08-83.64 Ma, Fouch et al., 1983), and Mesaverde Group
Star Point - Mancos B (Scaphites hippocrepis I, 82.7-81.94 Ma, Fouch et al., 1983;
Anna, 2012) , and Castlegate (Baculites asperiformis, 80.21-79.64 Ma, Fouch et al.,
1983) deposition, respectively (Figure 12). Furthermore, stratigraphic unconformities
updip, in the Indianola group of the terrestrial hinterland, correspond with these
regressions and their correlative conformities (Schwans, 1995). These relationships
suggest the timing of these regressive events is controlled at least in part by global
eustatic change. However, recent work suggests that mantle flow-induced dynamic
topography can cause fluctuations of up to 100 m of vertical change along otherwise
stable crust (e.g., Moucha et al., 2008; Muller et al., 2008; Conrad and Husson, 2009),
suggesting that confidently isolating a eustatic signal at any particular location is nearly
impossible.
Tectonically driven subsidence in the Sevier foredeep was neither spatially nor
temporally uniform, and this variation had a significant impact on basin and Mancos
Shale stratigraphy. Variations in the position of the forebulge over time affected the
deposition of lower Mancos strata. During the Late Cretaceous, the Western Interior
Seaway was an overfilled basin, so the forebulge was buried by sediment and did not
restrict sedimentation to the foredeep (Flemings and Jordan, 1989). However,
stratigraphic evidence and modeling suggests the forebulge likely contributed to
98
sedimentation bypass and erosion and was responsible for nondeposition during the early
Turonian across northeastern Utah (White et al., 2002; Kirschbaum and Mercier, 2013).
This contributed to the mid-Turonian unconformity of progressively younger age to the
east at the base of the Mancos Shale in the Uinta Basin. Variable subsidence along the
thrust front caused uneven subsidence along strike, further complicating basin geometry
over time. Backstripping analysis suggests subsidence in southern Wyoming accelerated
rapidly after 90 Ma, whereas central Utah experienced only moderate subsidence (Pang
and Nummedal, 1995) (Figure 13). Furthermore, variations in stacking patterns of the
Star Point sandstone through central Utah indicate increasing tectonic subsidence to the
north during its deposition (Hampson et al. 2011). The relative thickening of the Mancos
Shale in the northern portion of the basin relative to the south (Figures 9, 18, and 21)
appears to correspond to a transition between more rapid subsidence in Wyoming and the
more subdued tectonic activity of central Utah. Tectonically driven increases in sediment
supply, weathered from the hinterland, and subsidence driven increases in
accommodation drive the thickening of this interval and its generally coarser-grained
character to the north.
Thrusting in the Sevier hinterland occurred episodically, alternating between
periods of activity and quiescence. The Turonian was a period of relative quiescence
between the Charleston-Nebo-Pavant I event and active Coniacian and Santonian
thrusting along the Tintic Valley-Pavant II thrust (Schwans, 1995). The rapid subsidence
during this Coniacian-Santonian thrusting is evident in the thick highstand, dominantly
aggradational to slightly progradational (high angle shoreline trajectory) packages of the
Emery Sandstone (Edwards et al., 2005) and the correlative distal, sediment starved
99
deposits (FA2) of the Blue Gate Shale. Rapid subsidence during this time may have
outpaced eustatic fall, created significant accommodation relative to sediment supply, and
resulted in net relative sea level stasis (i.e., no relative sea level fall), eliminating the
expression of sequence set boundaries in the succession. Emery deposition during active
thrusting and associated subsidence (Schwans, 1995), created unique stratigraphic
relationships predicted by Swift et al. (1987) in which subsidence that increased landward
prevented incision during lowstand and ensuing transgression. Similarly, paralic to
shallow marine strata deposited during the time equivalent rapid Santonian subsidence in
the Kaiparowits Plateau of southern Utah also record almost exclusively transgressive
and highstand sedimentation, and preserve complete T-R cycles in marginal marine strata
(Shanley and McCabe, 1995; Allen and Johnson, 2010, 2011; Dooling, 2012).
Deposited during tectonic quiescence, the Ferron Sandstone, Mancos B, and Star
Point Sandstone display stacking patterns in outcrop typical of a forced regression in
relative sea level (Riemersma and Chan, 1991; Hampson et al., 1999; Posamentier and
Morris, 2000) and correspond with sequence set boundaries visible from wireline logs
(Figures 15 and 20). In a low accommodation setting, coarse-grained sediments are
deposited in increasingly distal portions of the basin, rather than accumulating in thicker
packages adjacent to shore. Modeling work of foreland basin stratigraphy suggests that
periods of rapid subsidence will preserve regressive and transgressive facies without
erosive surfaces (Karner, 1986; Posamentier and Allen, 1993), which is typical of the
Emery Sandstone, but contrasts with the low accommodation deposition of the Ferron
and Star Point Sandstones. While eustatic fluctuations influenced the timing of
regressions along the coast, the basin-wide stacking patterns of shallow marine sandstone
100

bodies and their distal equivalent regressive strata are controlled in large part by
tectonically driven subsidence histories and associated accommodation.
Variations between downdip mudstone deposits of FA1 and FA2 were largely
controlled by the interplay of tectonically driven accommodation, shoreline trajectories,
and coastal processes. Shallow, sharply progradational shoreline trajectories of the lower
Mancos distribute coarse-grained sediments widely across the basin. Both fluvial-
dominated deltaic deposition and the continued influence of storm energy are effective
for distributing material downslope along the shallow depositional ramp (Varban and
Plint, 2008; Bhattacharya and MacEachern, 2009; Plint et al., 2012) (Figure 23).
Terrestrial organic matter and coarse-grained deposits were readily added to distal
mudstones of FA1, which remain interbedded with well-developed deltas on the low
gradient ramp. The position of deltas along the coast changed with time, tending to
young to the south (Gardner, 1995b) which is reflected in stratigraphy presented here
(Figures 20, 21, and 22; Appendix B) and previous biostratigraphy (Molenaar and
Cobban, 1991). With multiple point sources, the influence of regressive deltaic deposits
is subject to significant local variability and suggests the role of coastal processes is
subject to temporal and spatial variability during the shallow ramp deposition of FA1.
In contrast, the sediment starved deposits of FA2 correspond with a steep,
dominantly aggradational shoreline trajectory and wave-dominated coastlines during
tectonic activity and high accommodation. Coarse grained deposits and terrestrial
organic matter were trapped by wave activity along the coastline and accommodated by
tectonic subsidence, starving the distal basin of this detritus. In addition, storm energy
was less effective at mobilizing and redistributing sediment along the deeper basin
101
seafloor (Figure 23). The sediment starved shelf setting isolated FA2 from the dynamics
of coastal processes and eustatic changes, so this interval of organic rich mudstone is far
thicker and more stratigraphically lithologically uniform than the earlier FA1.
The Middle Coniacian-Santonian ocean anoxic event (OAE) III corresponds to
Niobrara deposition in distal portions of the Western Interior Seaway (Locklair et al.,
2011) and the transgressive and highstand sequence sets of the Lower Blue Gate in the
Uinta Basin (Figures 20 and 27). OAE III lacks typical S13C excursion of OAE II,
although this appears to be a result of dilution caused by increased carbonate production
alongside organic matter preservation which was on par with previous ocean anoxic
events (Locklair et al., 2011). Lithofacies of FA2 identified in cores taken from Mancos
strata of this age in the Pioneer Main Canyon Federal 23-7-15S-23E well (Figure 27) are
characterized by significantly increased TOC and carbonate content (Horton, 2012) and
contain dispersed coccolithophores that are visible in SEM (Figure 25), suggesting
oceanic conditions supportive of organic matter preservation, and chalk deposition in
more distal environments of the Niobrara also had some more depositionally proximal
record in the facies of the Mancos Shale. The Coniacian-Santonian was characterized by
subsidence driven deep-water conditions and increasingly anoxic ocean chemistry,
factors that contributed to the deposition of highly carbonate and organic-rich, sediment
starved mudstone deposits.
Hydrocarbon Production Implications
Though organic-lean and relatively clay-rich, the significant volume of source
rock in the Mancos Shale suggests the potential development of this resource and similar
102
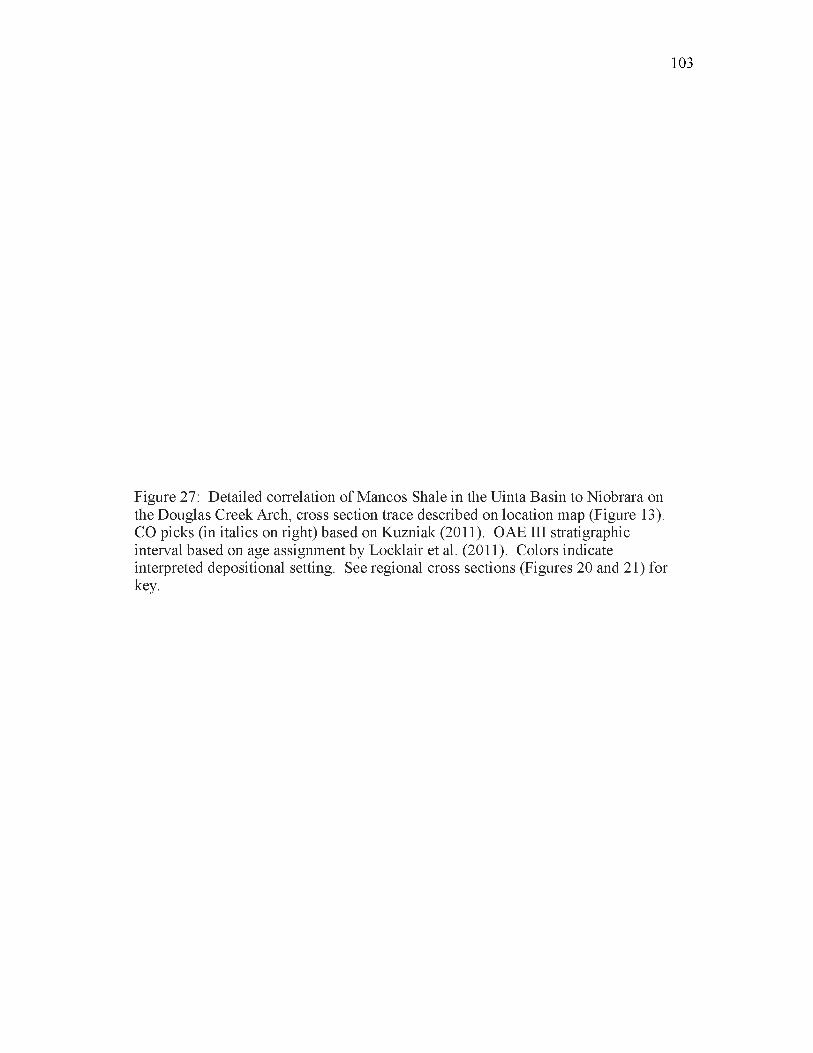
103
Figure 27: Detailed correlation of Mancos Shale in the Uinta Basin to Niobrara on the Douglas Creek Arch, cross section trace described on location map (Figure 13). CO picks (in italics on right) based on Kuzniak (2011). OAE III stratigraphic interval based on age assignment by Locklair et al. (2011). Colors indicate interpreted depositional setting. See regional cross sections (Figures 20 and 21) for key.
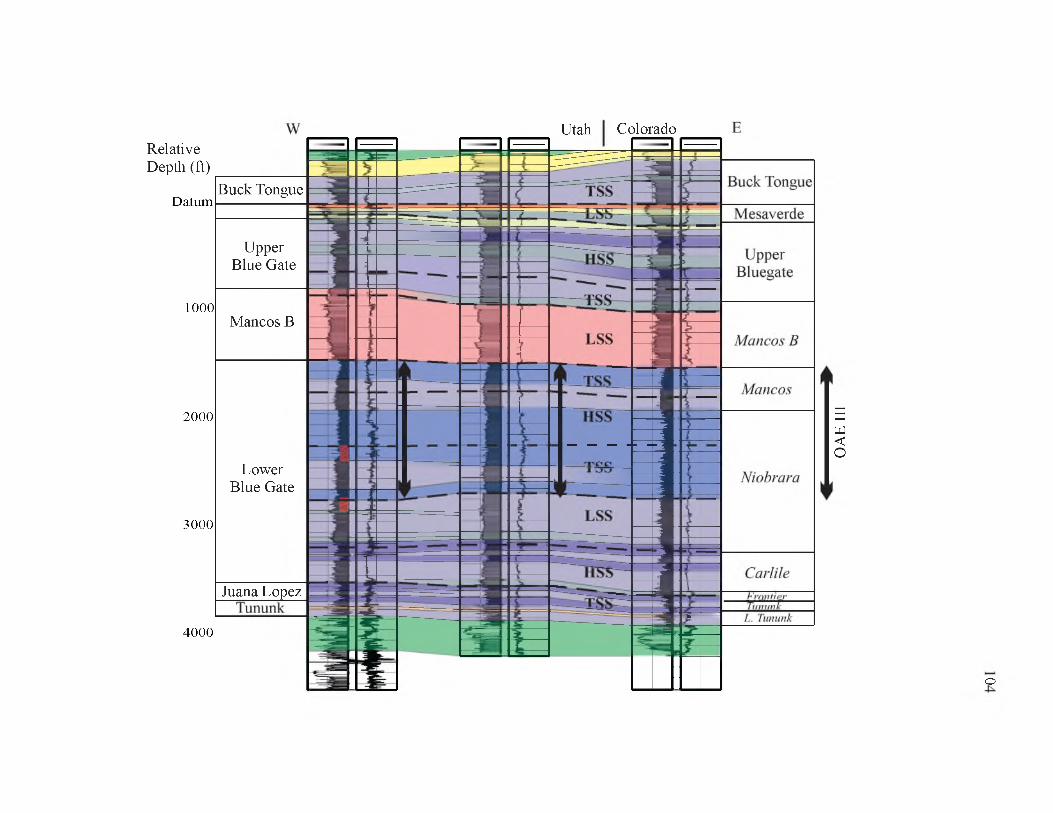
Utah ColoradoRelative Depth (ft)
Datum
1000
2000
3000
Buck Tongue
Upper Blue Gate
Mancos B
Lower Blue Gate
Juana Lopez =
4000
o
OAE
III
lithologies of the Cretaceous Western Interior Seaway should not be ignored as the
development of tight oil and gas continues to expand across North America. The
composition of the most prospective lithofacies in the Mancos do not vary considerably
from those of other tight shale plays currently in production (Horton, 2012) (Figure 28).
The Mancos has long been identified as a significant source rock, and the Mancos/Mowry
petroleum system in the Uinta basin has been assessed with 3.1 TCF gas potential
(Kirschbaum, 2003). The first horizontal well was drilled in the Mancos Shale in the
Uinta Basin in 2010. It targeted an interval of the upper Lower Blue Gate and came on
with 1,234 BBLS oil and 69,638 MCF gas in the first month of production and produced
5,135 BBLS oil and 401,958 MCF gas over the first year (DOGM, 2013). Potential for
development of this resource has been demonstrated, although maximizing the economics
for development requires targeting only those intervals with the best opportunities for
success.
Petrophysical evaluation using the A log R technique on eleven wells from the
eastern Uinta Basin, calibrated with available core data, has illustrated a few intervals of
the Mancos with calculated TOC values of 3-4% that are regionally extensive across the
dataset available (Figure 15). The calculated highest TOC intervals correspond to FA1
(organic rich heterolithic intervals of the Juana Lopez and lowermost Blue Gate) as well
as FA2 (distal, claystone to siltstone sediment-starved shelf deposits of the Lower Blue
Gate) (Hillier et al., 2013) (Figure 15). These two intervals each correspond to
transgressive and early highstand sequence sets, during which dilution from siliclastics
are anticipated as relatively low and the preservation potential of organic material
relatively high (e.g., Pasley et al., 1991; Posamentier and Weimer, 1993; Bohacs et al.,
105
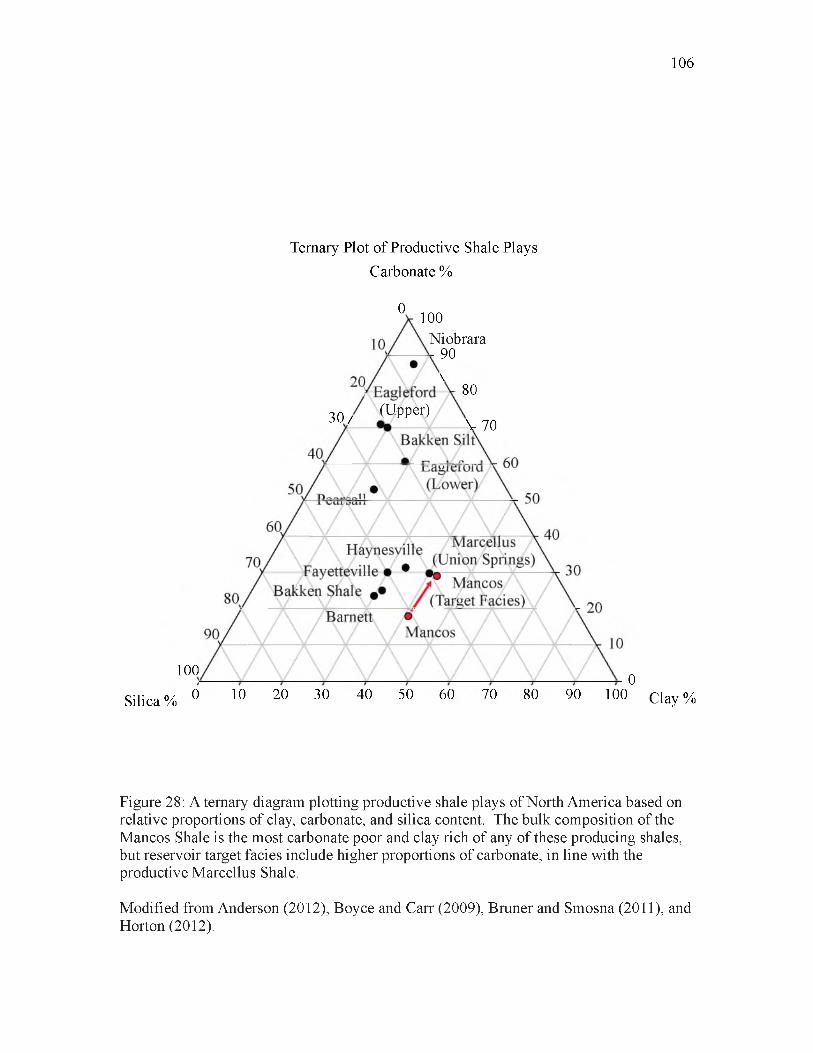
106
Ternary Plot of Productive Shale Plays Carbonate %
0 100Niobrara
90
; ̂ 8030 (Upper)307 V 70
100
Silica % 0 10 20 30 40 50 60 70 80 90 100 Clay %0
Figure 28: A ternary diagram plotting productive shale plays of North America based on relative proportions of clay, carbonate, and silica content. The bulk composition of the Mancos Shale is the most carbonate poor and clay rich of any of these producing shales, but reservoir target facies include higher proportions of carbonate, in line with the productive Marcellus Shale.
Modified from Anderson (2012), Boyce and Carr (2009), Bruner and Smosna (2011), and Horton (2012).
2005; Slatt and Rodriguez, 2012). The distal sediment-starved shelf deposits (FA2)
described in detail from core are believed to offer the greatest potential for production
based on an abundance of organic material and calcite cement, which lends a natural
brittleness to the otherwise clay-rich formation (Horton, 2012).
Furthermore, Kennedy’s (2011) findings support the conclusion that the sediment
starved shelf deposits display the most ideal geomechanical failure behavior and, hence,
potentially favorable hydraulic fracture potential. It is unlikely that the organic-rich
heterolith typical of the Juana Lopez formation contains similar quantities of calcite as
the sediment starved shelf deposits, largely because it was deposited in a shallower
setting above storm wave base relative to FA2. A higher abundance of detrital fine
sandstone and siltstone could displace claystone from the facies and provide a certain
amount of brittleness for hydraulic fracture and higher porosity and permeability for
increased hydrocarbon storage and production. Other intervals of the Mancos Shale are
less prospective, characterized by similar porosity and permeability values (Figure 29)
but a lower organic content (Horton, 2012) (Figure 30).
Laramide tectonic activity played a major role in the rapid burial of the Mancos
Shale into the oil and gas window in various portions of the asymmetric Uinta Basin. In
the northern Uinta Basin, the Mancos entered the gas to the overmature window, but was
less deeply buried to the south, where much of the formation entered the condensate and
oil windows (Nuccio and Roberts, 2003; Quick and Ressetar, 2012) (Figure 31). The
majority of the Mancos in the Uinta Basin provides opportunities for natural gas
production, as has been undertaken to date by one horizontal and numerous vertical
wells. However, success with liquids production from the Mancos in the San Juan Basin
107
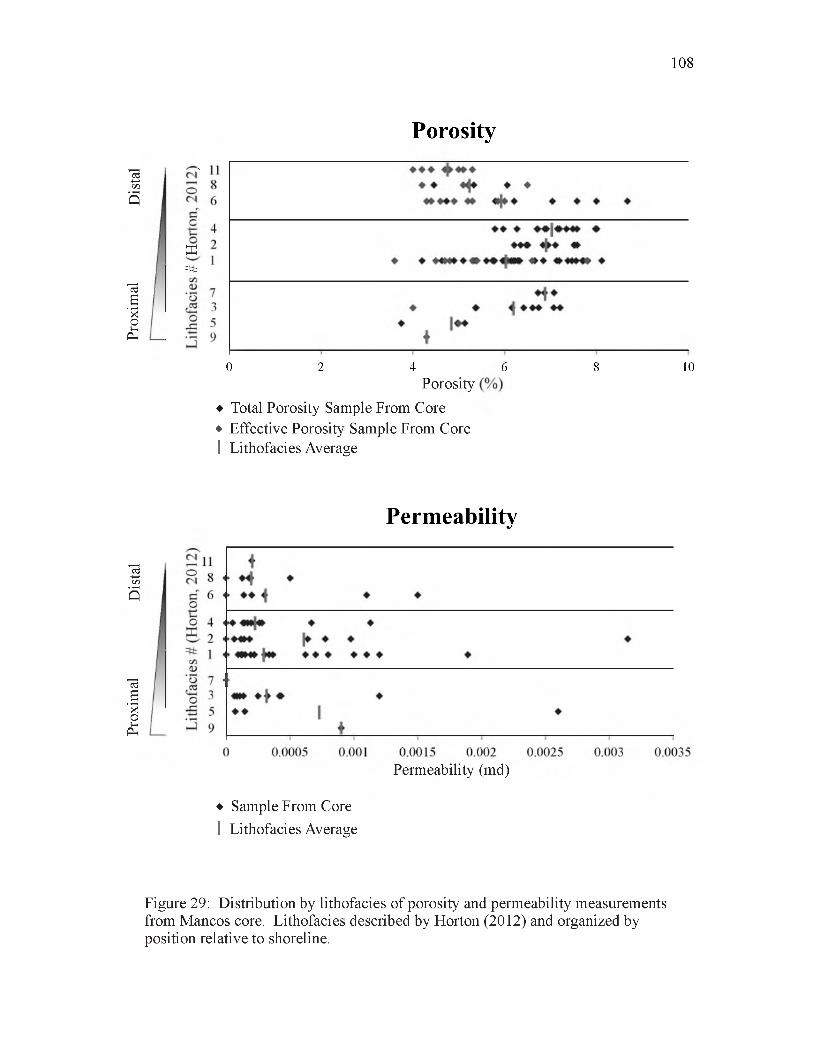
Prox
imal
D
istal
Pr
oxim
al
Dis
tal
108
Porosity
2012n,orto
E=ttsieci
afoithoLi
0 2 4Porosity
♦ Total Porosity Sample From Core♦ Effective Porosity Sample From Core I Lithofacies Average
106 8
Permeability
Permeability (md)
♦ Sample From CoreI Lithofacies Average
Figure 29: Distribution by lithofacies of porosity and permeability measurements from Mancos core. Lithofacies described by Horton (2012) and organized by position relative to shoreline.
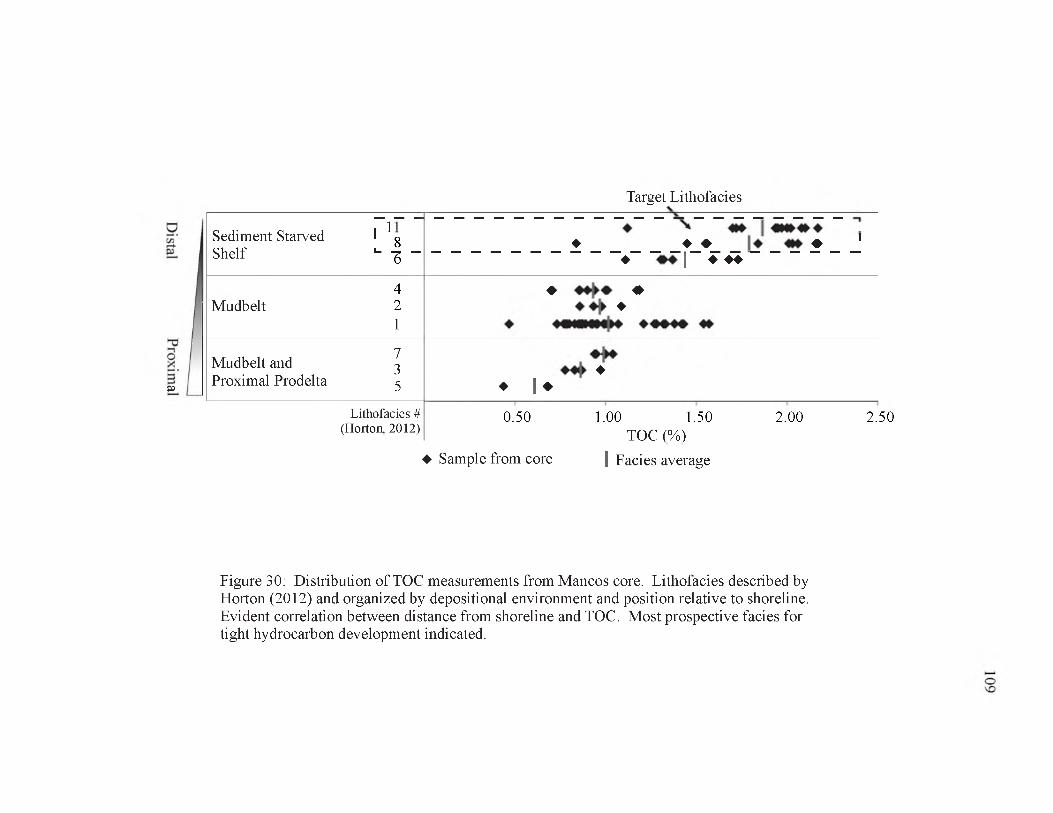
Target Lithofacies
Sediment Starved 1 ̂g Shelf ■" -ft ♦ ♦ ♦ ♦ 1
♦ | ♦ ♦ ♦
4Mudbelt 2
1
♦ «► ♦
7Mudbelt and 3
Proximal Prodelta 5♦
♦ 1 ♦fa
Lithofacies # (Horton, 2012)
0.50
♦ Sample from core
1.00 1.50TOC (%)
I Facies average
2.00 2.50
Figure 30: Distribution of TOC measurements from Mancos core. Lithofacies described by Horton (2012) and organized by depositional environment and position relative to shoreline. Evident correlation between distance from shoreline and TOC. Most prospective facies for tight hydrocarbon development indicated.
110
Figure 31: Thermal maturity of the Mancos Shale in the Uinta Basin at the A) middle (Nuccio and Roberts, 2003; Kirschbaum, 2003) and B) base (Quick and Ressetar, 2012) of the formation.
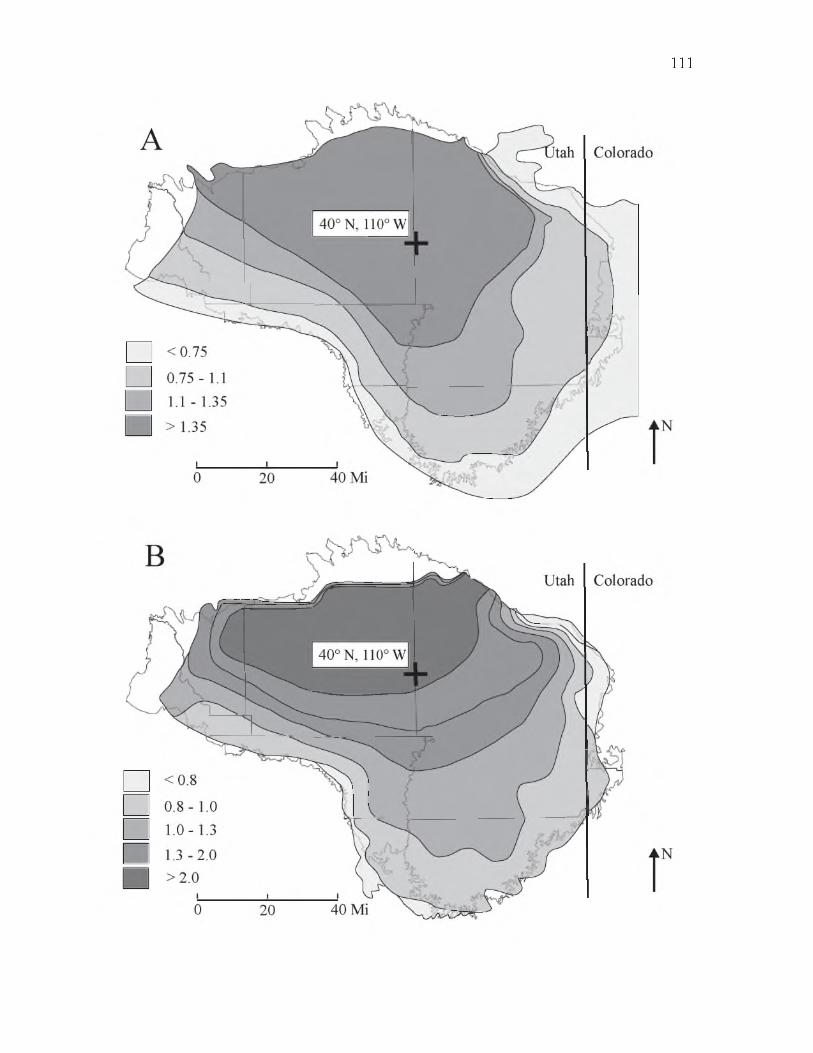
111

112
(Slothower, 2012; Ridgely et al., 2013) and oil and condensate window maturation
histories in the Uinta Basin suggest liquids production may also be possible from
particular combinations of geographic and depth or stratigraphic zones in the Uinta
Basin.
Conclusions
The Mancos Shale was deposited across what is now the Uinta Basin during
fifteen million years of the Late Cretaceous into the foreland basin of the Sevier fold and
thrust belt. This heterolithic to mudstone-dominated marine shale represents the
depositional transition between shallow marine sandstones currently exposed in central
Utah and distal marine shales of the eastern Western Interior Seaway. The mudstone-
dominated, organic-rich, distal deposits of the Mancos in the eastern Uinta Basin can be
divided into two major facies associations. FA1 is typified by interbedded and
interlaminated organic rich mudstone and fine sandstone deposited along a low-gradient
shallow ramp above storm wave base with more abundant terrestrial organic matter input.
FA1 corresponds stratigraphically to the distal Tununk, Juana Lopez, and lowermost Blue
Gate Members. FA2 is composed of relatively marine organic-rich claystone to siltstone
facies with relatively higher calcite content deposited on the sediment starved shelf below
storm wave base during a period of high accommodation. As a result of higher
subsidence rates, FA2 was deposited during active thrusting and reflects higher maximum
water depth than more typical shallow ramp facies deposited in other Mancos strata,
including FA1. During a period of relative tectonic quiescence in the early Campanian

which corresponded with eustatic fall, the basin filled with increasingly coarse-grained
deposits transported away from the coast.
Both tectonics and eustasy demonstrate influence on the evolution of lithofacies
in the Mancos Shale. Whereas the stratigraphic occurrence of shoreface sandstones
appears to correlate with eustatic falls, the way these eustatic falls are expressed in facies
of more distal strata is variable and is dominantly controlled by tectonically driven
accommodation variations through space and time. The major sandstone-rich
components of the Mancos Shale, the Ferron/Frontier, Emery, Star Point-Mancos B, and
Blackhawk, each appear to correspond to eustatic falls identified from a variety of
additional sea level records around the world. Whereas the Ferron/Frontier and Star
Point-Mancos B correspond with sea level lowstand and are characterized by sandstone
and siltstone-rich facies in relatively distal portions of the basin which interfinger with
organic-rich deposits of FA1 in the lower Mancos, the Emery Sandstone corresponds
with sea level highstand and mudstone-dominated facies in the distal realm (FA2). This
depositional pattern appears to be the product of active subsidence in the Coniacian and
Santonian, which outpaced the synchronous eustatic fall during Emery deposition in
order to maintain a high relative sea level. Both eustasy and tectonic factors strongly
affect sedimentation in an active foreland basin like the Western Interior Seaway.
While the use of T-R cycles produces a robust record of relative sea level change,
the addition of detail from outcrop and stratal stacking patterns in the subsurface allow
the creation of a more detailed sequence stratigraphic framework that distinguishes
between highstand and lowstand sequence set conditions and clearly identifies sequence
set boundaries, or more commonly their correlative conformities in the offshore
113

environment, through correlation to their expression in proximal shallow marine
environments. The Mancos Shale includes two major sequence set boundaries, one
corresponding with the base of the Ferron Sandstone and a second corresponding to the
base of the Mancos B. There is a clear association between sequence sets and lithofacies
distributions in the distal, eastern portion of the basin; lowstand sequence sets correspond
with increased coarse-grained detrital components, whereas transgressive and highstand
sequence sets are dominated by increasing organic and calcareous components. This
relationship between distal facies and sequence stratigraphy allows it to be used for the
predictive mapping of lithofacies throughout the formation.
Economic production of hydrocarbons from the Mancos Shale is dependent upon
the identification of “sweet spots” based on primary and secondary characteristics of
units in the formation. Core-based analysis has identified intervals of the formation
compositionally similar to other successful resource plays of North America in an
otherwise clay-rich, organic-lean shale (Horton, 2012). Primary lithological
characteristics can be predicted using sequence stratigraphy to identify facies with
suitable geomechanical and production potential, which appear to correlate with organic
and calcite-rich facies of the transgressive and lower highstand systems tracts (Horton,
2012). Two potential target intervals are identified that correspond to FA1 and FA2.
These two facies associations are each relatively high in organic content and correspond
with transgression and early highstand, but reflect different depositional settings.
Variations in the proportion of calcite and detrital quartz suggest each would likely
behave differently during production. A thorough consideration of primary depositional
characteristics alongside subsequent burial history is critical for efficient hydrocarbon
114

production from relatively organic lean tight shale plays like the Mancos Shale and other
Upper Cretaceous shales of the Western Interior Seaway.
115

APPENDIX A
WELL DATABASE
Appendix A summarizes all of the well data available for use in this study. Wells
are ordered randomly, and this well order is used to identify select wells throughout the
study. Any wells with an “x” in the last column were incorporated into cross sections
and/or isopach maps.
Well log abbreviations:
gr gamma rayrho densitydphi porosity from densitynphi porosity from neutronsp spontaneous potentialohm resitivitydt sonicpe photoelectric factorcalc calculated petrophysics - geomechanics, mineralogy, and/or water saturation
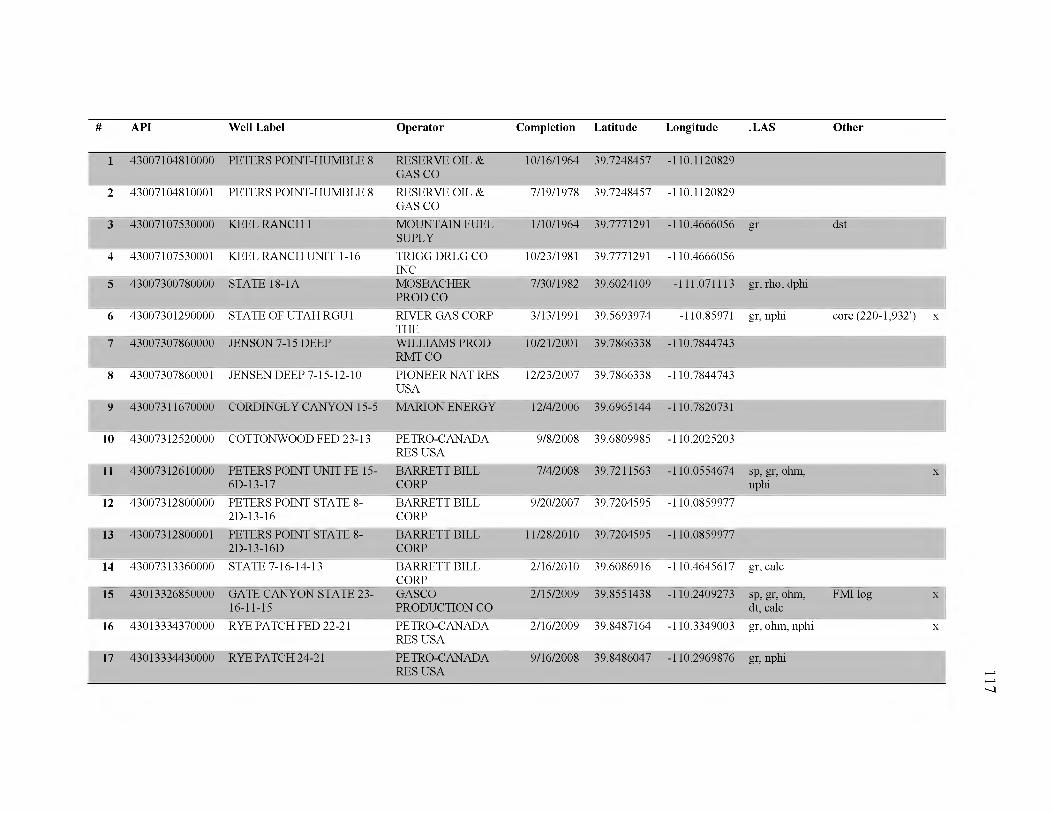
# API Well Label Operator Completion Latitude Longitude .LAS Other
1 43007104810000 PETERS POINT-HUMBLE 8 RESERVE OIL & GAS CO
10/16/1964 39.7248457 -110.1120829
2 43007104810001 PETERS POINT-HUMBLE 8 RESERVE OIL & GAS CO
7/19/1978 39.7248457 -110.1120829
3 43007107530000 KEEL RANCH 1 MOUNTAIN FUEL SUPLY
1/10/1964 39.7771291 -110.4666056 gr dst
4 43007107530001 KEEL RANCH UNIT 1 -16 TRIGG DRLG CO INC
10/23/1981 39.7771291 -110.4666056
5 43007300780000 STATE 18-1A MOSBACHER PROD CO
7/30/1982 39.6024109 -111.071113 gr, rho, dphi
6 43007301290000 STATE OF UTAH RGU1 RIVER GAS CORP THE
3/13/1991 39.5693974 -110.85971 gr, nphi core (220-1,932') x
7 43007307860000 JENSON 7-15 DEEP WILLIAMS PROD RMTCO
10/21/2001 39.7866338 -110.7844743
8 43007307860001 JENSEN DEEP 7-15-12-10 PIONEER NAT RES USA
12/23/2007 39.7866338 -110.7844743
9 43007311670000 CORDINGLY CANYON 15-5 MARION ENERGY 12/4/2006 39.6965144 -110.7820731
10 43007312520000 COTTONWOOD FED 23-13 PETRO-CANADA RES USA
9/8/2008 39.6809985 -110.2025203
11 43007312610000 PETERS POINT UNIT FE 15- 6D-13-17
BARRETT BILL CORP
7/4/2008 39.7211563 -110.0554674 sp, gr, ohm, nphi
X
12 43007312800000 PETERS POINT STATE 8- 2D-13-16
BARRETT BILL CORP
9/20/2007 39.7204595 -110.0859977
13 43007312800001 PETERS POINT STATE 8- 2D-13-16D
BARRETT BILL CORP
11/28/2010 39.7204595 -110.0859977
14 43007313360000 STATE 7-16-14-13 BARRETT BILL CORP
2/16/2010 39.6086916 -110.4645617 gr, calc
15 43013326850000 GATE CANYON STATE 23- 16-11-15
GASCOPRODUCTION CO
2/15/2009 39.8551438 -110.2409273 sp, gr, ohm, dt, calc
FMI log x
16 43013334370000 RYE PATCH FED 22-21 PETRO-CANADA RES USA
2/16/2009 39.8487164 -110.3349003 gr, ohm, nphi X
17 43013334430000 RYE PATCH 24-21 PETRO-CANADA RES USA
9/16/2008 39.8486047 -110.2969876 gr, nphi 117
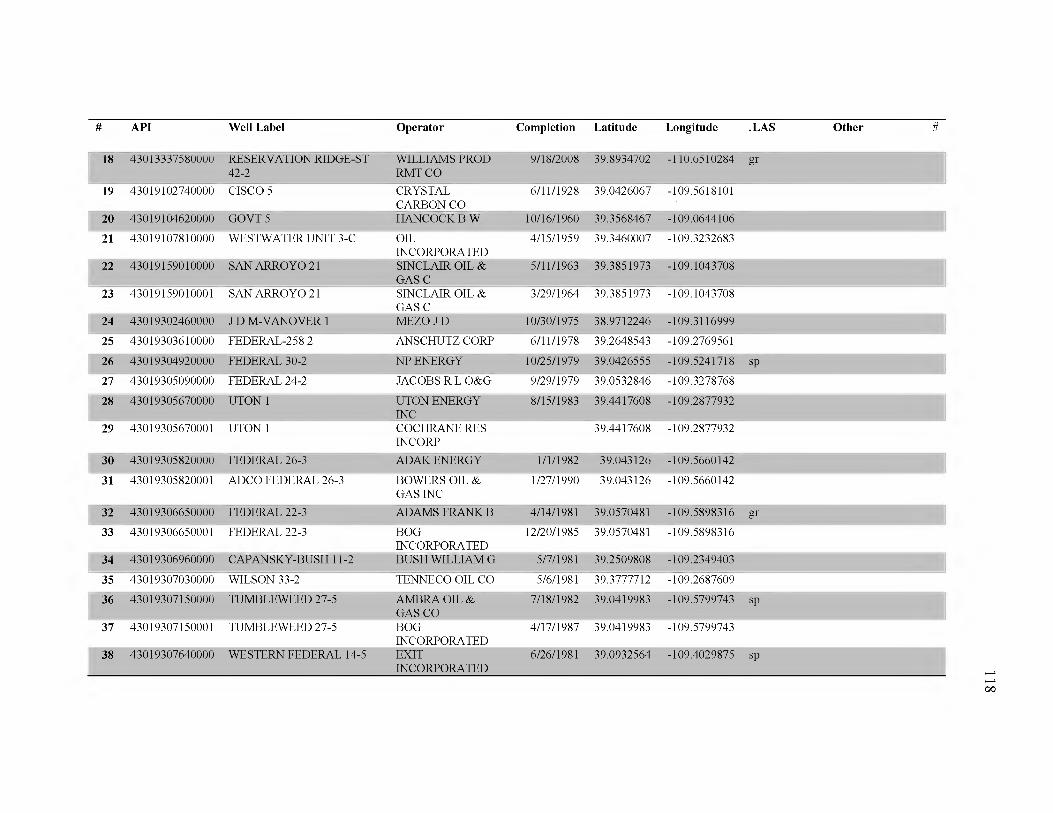
# API Well Label Operator Completion Latitude Longitude .LAS Other #
18 43013337580000 RESERVATION RIDGE-ST 42-2
WILLIAMS PROD RMTCO
9/18/2008 39.8934702 -110.6510284 gr
19 43019102740000 CISCO 5 CRYSTAL CARBON CO
6/11/1928 39.0426067 -109.5618101
20 43019104620000 GOVT 5 HANCOCK B W 10/16/1960 39.3568467 -109.0644106
21 43019107810000 WESTWATER UNIT 3-C OILINCORPORATED
4/15/1959 39.3460007 -109.3232683
22 43019159010000 SAN ARROYO 21 SINCLAIR OIL & GAS C
5/11/1963 39.3851973 -109.1043708
23 43019159010001 SAN ARROYO 21 SINCLAIR OIL & GAS C
3/29/1964 39.3851973 -109.1043708
24 43019302460000 J D M-VANOVER 1 MEZO.TD 10/30/1975 38.9712246 -109.3116999
25 43019303610000 FEDERAL-258 2 ANSCHUTZ CORP 6/11/1978 39.2648543 -109.2769561
26 43019304920000 FEDERAL 30-2 NP ENERGY 10/25/1979 39.0426555 -109.5241718 sp
27 43019305090000 FEDERAL 24-2 JACOBS RLO&G 9/29/1979 39.0532846 -109.3278768
28 43019305670000 UTON 1 UTON ENERGY INC
8/15/1983 39.4417608 -109.2877932
29 43019305670001 UTON 1 COCHRANE RES INCORP
39.4417608 -109.2877932
30 43019305820000 FEDERAL 26-3 ADAK ENERGY 1/1/1982 39.043126 -109.5660142
31 43019305820001 ADCO FEDERAL 26-3 BOWERS OIL & GAS INC
1/27/1990 39.043126 -109.5660142
32 43019306650000 FEDERAL 22-3 ADAMS FRANK B 4/14/1981 39.0570481 -109.5898316 gr33 43019306650001 FEDERAL 22-3 BOG
INCORPORATED12/20/1985 39.0570481 -109.5898316
34 43019306960000 CAPANSKY-BUSH 11-2 BUSH WILLIAM G 5/7/1981 39.2509808 -109.2349403
35 43019307030000 WILSON 33-2 TENNECO OIL CO 5/6/1981 39.3777712 -109.2687609
36 43019307150000 TUMBLEWEED 27-5 AMBRA OIL & GAS CO
7/18/1982 39.0419983 -109.5799743 sp
37 43019307150001 TUMBLEWEED 27-5 BOGINCORPORATED
4/17/1987 39.0419983 -109.5799743
38 43019307640000 WESTERN FEDERAL 14-5 EXITINCORPORATED
6/26/1981 39.0932564 -109.4029875 sp
118
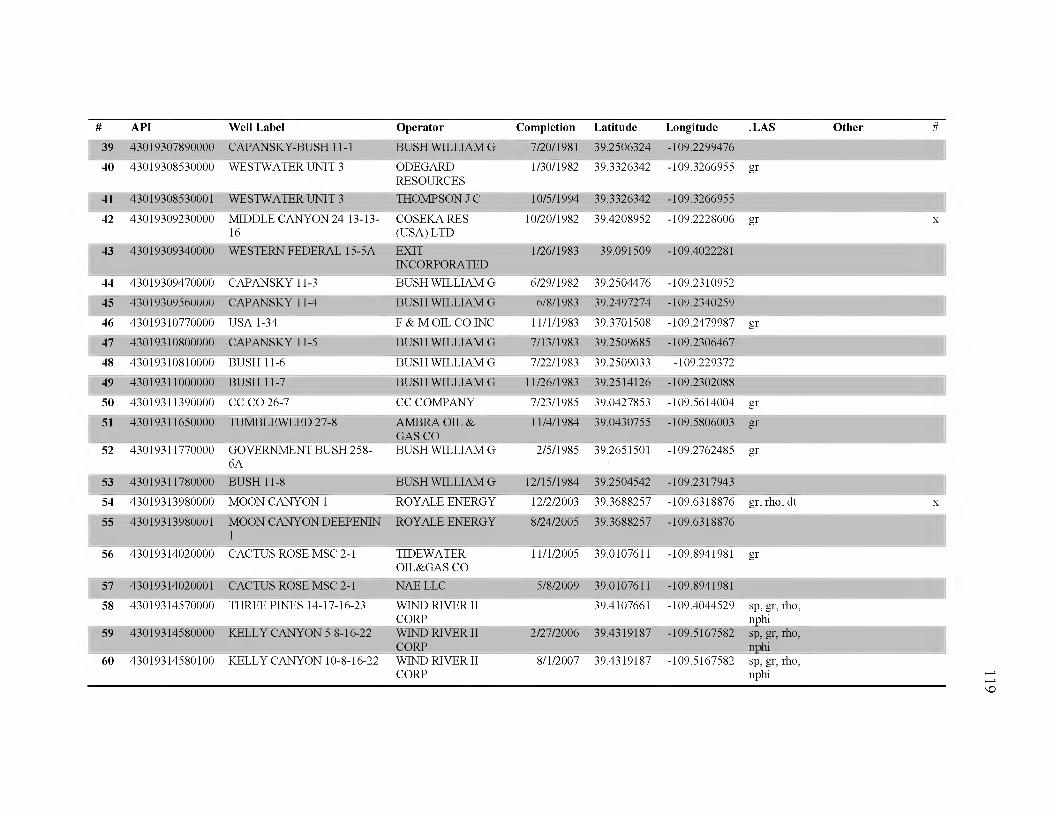
# API Well Label Operator Completion Latitude Longitude .LAS Other #
39 43019307890000 CAPANSKY-BUSH 11-1 BUSH WILLIAM G 7/20/1981 39.2506324 -109.2299476
40 43019308530000 WESTWATER UNIT 3 ODEGARDRESOURCES
1/30/1982 39.3326342 -109.3266955 gr
41 43019308530001 WESTWATER UNIT 3 THOMPSON J C 10/5/1994 39.3326342 -109.3266955
42 43019309230000 MIDDLE CANYON 24 13-13- 16
COSEKA RES (USA) LTD
10/20/1982 39.4208952 -109.2228606 gr X
43 43019309340000 WESTERN FEDERAL 15-5A EXITINCORPORATED
1/26/1983 39.091509 -109.4022281
44 43019309470000 CAPANSKY 11-3 BUSH WILLIAM G 6/29/1982 39.2504476 -109.2310952
45 43019309560000 CAPANSKY 11-4 BUSH WILLIAM G 6/8/1983 39.2497274 -109.2340259
46 43019310770000 USA 1-34 F & M OIL CO INC 11/1/1983 39.3701508 -109.2479987 gr47 43019310800000 CAPANSKY 11-5 BUSH WILLIAM G 7/13/1983 39.2509685 -109.2306467
48 43019310810000 BUSH 11-6 BUSH WILLIAM G 7/22/1983 39.2509033 -109.229372
49 43019311000000 BUSH 11-7 BUSH WILLIAM G 11/26/1983 39.2514126 -109.2302088
50 43019311390000 CC CO 26-7 CC COMPANY 7/23/1985 39.0427853 -109.5614004 gr51 43019311650000 TUMBLEWEED 27-8 AMBRA OIL &
GAS CO11/4/1984 39.0430755 -109.5806003 gr
52 43019311770000 GOVERNMENT BUSH 258- 6A
BUSH WILLIAM G 2/5/1985 39.2651501 -109.2762485 gr
53 43019311780000 BUSH 11-8 BUSH WILLIAM G 12/15/1984 39.2504542 -109.2317943
54 43019313980000 MOON CANYON 1 ROYALE ENERGY 12/2/2003 39.3688257 -109.6318876 gr, rho, dt X
55 43019313980001 MOON CANYON DEEPENIN 1
ROYALE ENERGY 8/24/2005 39.3688257 -109.6318876
56 43019314020000 CACTUS ROSE MSC 2-1 TIDEWATER OIL&GAS CO
11/1/2005 39.0107611 -109.8941981 gr
57 43019314020001 CACTUS ROSE MSC 2-1 NAE LLC 5/8/2009 39.0107611 -109.8941981
58 43019314570000 THREE PINES 14-17-16-23 WIND RIVER II CORP
39.4107661 -109.4044529 sp, gr, rho, nphi
59 43019314580000 KELLY CANYON 5 8-16-22 WIND RIVER II CORP
2/27/2006 39.4319187 -109.5167582 sp, gr, rho, nphi
60 43019314580100 KELLY CANYON 10-8-16-22 WIND RIVER II CORP
8/1/2007 39.4319187 -109.5167582 sp, gr, rho, nphi 119
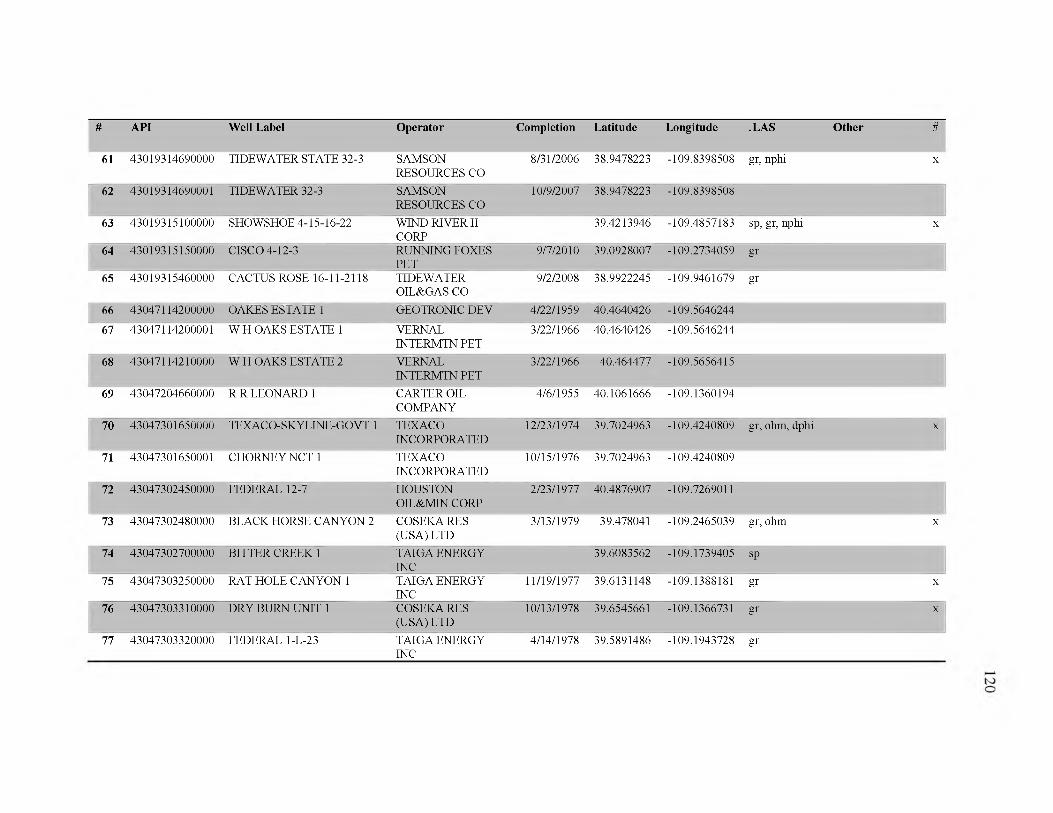
# API Well Label Operator Completion Latitude Longitude .LAS Other #
61 43019314690000 TIDEWATER STATE 32-3 SAMSON RESOURCES CO
8/31/2006 38.9478223 -109.8398508 gr, nphi X
62 43019314690001 TIDEWATER 32-3 SAMSON RESOURCES CO
10/9/2007 38.9478223 -109.8398508
63 43019315100000 SHOWSHOE 4-15-16-22 WIND RIVER II CORP
39.4213946 -109.4857183 sp, gr, nphi X
64 43019315150000 CISCO 4-12-3 RUNNING FOXES PET
9/7/2010 39.0928007 -109.2734059 gr
65 43019315460000 CACTUS ROSE 16-11-2118 TIDEWATER OIL&GAS CO
9/2/2008 38.9922245 -109.9461679 gr
66 43047114200000 OAKES ESTATE 1 GEOTRONIC DEV 4/22/1959 40.4640426 -109.5646244
67 43047114200001 W H OAKS ESTATE 1 VERNALINTERMTNPET
3/22/1966 40.4640426 -109.5646244
68 43047114210000 W H OAKS ESTATE 2 VERNALINTERMTNPET
3/22/1966 40.464477 -109.5656415
69 43047204660000 R R LEONARD 1 CARTER OIL COMPANY
4/6/1955 40.1061666 -109.1360194
70 43047301650000 TEX AC O- SK YLINE-GO VT 1 TEXACOINCORPORATED
12/23/1974 39.7024963 -109.4240809 gr, ohm, dphi X
71 43047301650001 CHORNEYNCT 1 TEXACOINCORPORATED
10/15/1976 39.7024963 -109.4240809
72 43047302450000 FEDERAL 12-7 HOUSTON OIL&MIN CORP
2/23/1977 40.4876907 -109.7269011
73 43047302480000 BLACK HORSE CANYON 2 COSEKA RES (USA) LTD
3/13/1979 39.478041 -109.2465039 gr, ohm X
74 43047302700000 BITTER CREEK 1 TAIGA ENERGY INC
39.6083562 -109.1739405 sp
75 43047303250000 RAT HOLE CANYON 1 TAIGA ENERGY INC
11/19/1977 39.6131148 -109.1388181 gr X
76 43047303310000 DRY BURN UNIT 1 COSEKA RES (USA) LTD
10/13/1978 39.6545661 -109.1366731 gr X
77 43047303320000 FEDERAL l-L-23 TAIGA ENERGY 4/14/1978 39.5891486 -109.1943728 grINC
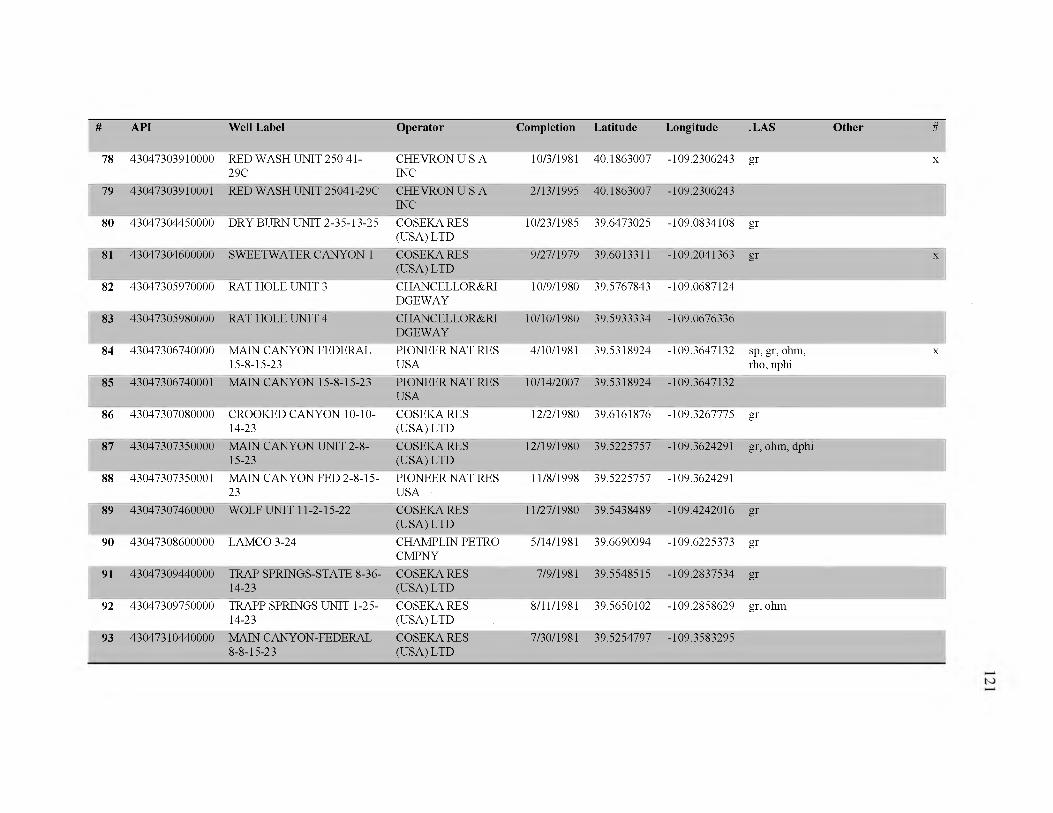
# API Well Label Operator Completion Latitude Longitude .LAS Other #
78 43047303910000 RED WASH UNIT 250 41- 29C
CHEVRON US A INC
10/3/1981 40.1863007 -109.2306243 gr X
79 43047303910001 RED WASH UNIT 25041-29C CHEVRON US A INC
2/13/1995 40.1863007 -109.2306243
80 43047304450000 DRY BURN UNIT 2-35-13-25 COSEKA RES (USA) LTD
10/23/1985 39.6473025 -109.0834108 gr
81 43047304600000 SWEETWATER CANYON 1 COSEKA RES (USA) LTD
9/27/1979 39.6013311 -109.2041363 gr X
82 43047305970000 RAT HOLE UNIT 3 CHANCELLOR&RIDGEWAY
10/9/1980 39.5767843 -109.0687124
83 43047305980000 RAT HOLE UNIT 4 CHANCELLOR&RIDGEWAY
10/10/1980 39.5933334 -109.0676336
84 43047306740000 MAIN CANYON FEDERAL 15-8-15-23
PIONEER NAT RES USA
4/10/1981 39.5318924 -109.3647132 sp, gr, ohm, rho, nphi
X
85 43047306740001 MAIN CANYON 15-8-15-23 PIONEER NAT RES USA
10/14/2007 39.5318924 -109.3647132
86 43047307080000 CROOKED CANYON 10-10- 14-23
COSEKA RES (USA) LTD
12/2/1980 39.6161876 -109.3267775 gr
87 43047307350000 MAIN CANYON UNIT 2-8- 15-23
COSEKA RES (USA) LTD
12/19/1980 39.5225757 -109.3624291 gr, ohm, dphi
88 43047307350001 MAIN CANYON FED 2-8-15- 23
PIONEER NAT RES USA
11/8/1998 39.5225757 -109.3624291
89 43047307460000 WOLF UNIT 11-2-15-22 COSEKA RES (USA) LTD
11/27/1980 39.5438489 -109.4242016 gr
90 43047308600000 LAMCO 3-24 CHAMPLIN PETRO CMPNY
5/14/1981 39.6690094 -109.6225373 gr
91 43047309440000 TRAP SPRINGS-STATE 8-36- 14-23
COSEKA RES (USA) LTD
7/9/1981 39.5548515 -109.2837534 gr
92 43047309750000 TRAPP SPRINGS UNIT 1-25- 14-23
COSEKA RES (USA) LTD
8/11/1981 39.5650102 -109.2858629 gr, ohm
93 43047310440000 MAIN CANYON-FEDERAL COSEKA RES 7/30/1981 39.5254797 -109.35832958-8-15-23 (USA) LTD
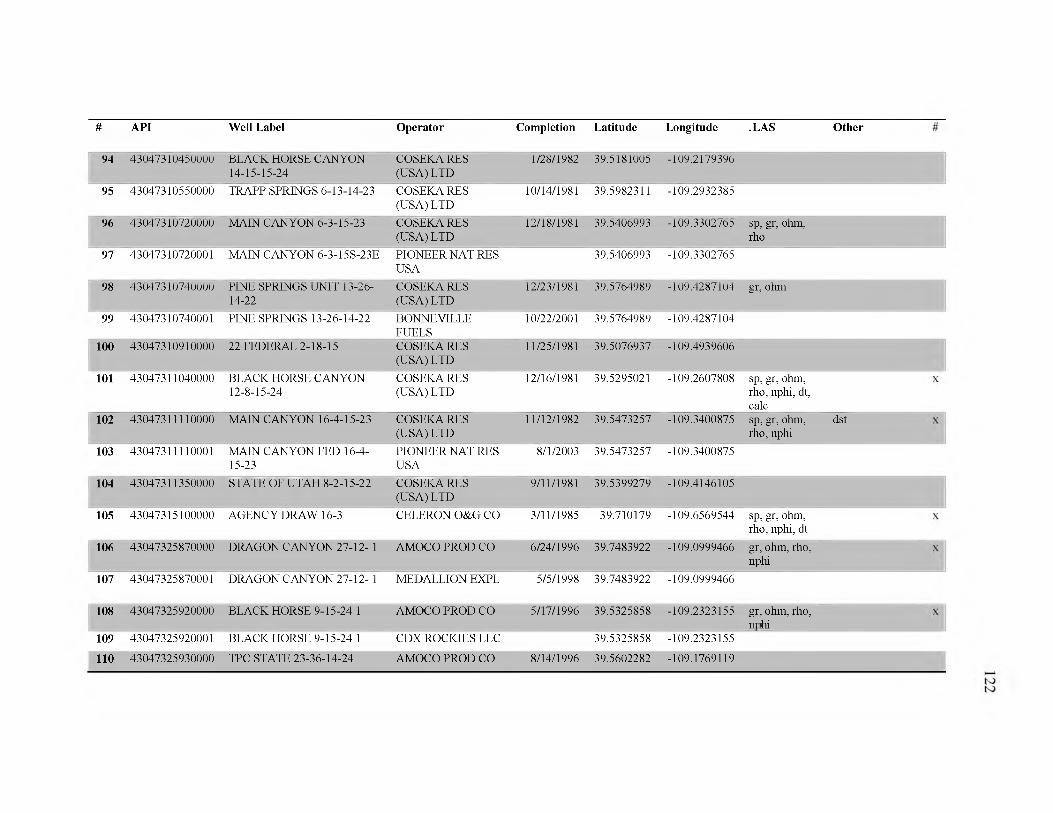
#
94
95
96
97
98
99
100
101
102
103
104
105
106
107
108
109
110
API Well Label Operator Completion Latitude Longitude .LAS Other
43047310450000 BLACK HORSE CANYON COSEKA RES 1/28/1982 39.5181005 -109.217939614-15-15-24 (USA) LTD
43047310550000 TRAPP SPRINGS 6-13-14-23 COSEKARES 10/14/1981 39.5982311 -109.2932385(USA) LTD
43047310720000 MAIN CANYON 6-3-15-23 COSEKARES 12/18/1981 39.5406993 -109.3302765 sp, gr, ohm,(USA) LTD rho
43047310720001 MAIN CANYON 6-3-15S-23E PIONEER NAT RES 39.5406993 -109.3302765USA
43047310740000 PINE SPRINGS UNIT 13-26- COSEKARES 12/23/1981 39.5764989 -109.4287104 gr, ohm14-22 (USA) LTD
43047310740001 PINE SPRINGS 13-26-14-22 BONNEVILLE 10/22/2001 39.5764989 -109.4287104FUELS
43047310910000 22 FEDERAL 2-18-15 COSEKARES 11/25/1981 39.5076937 -109.4939606(USA) LTD
43047311040000 BLACK HORSE CANYON COSEKARES 12/16/1981 39.5295021 -109.2607808 sp, gr, ohm,12-8-15-24 (USA) LTD rho, nphi, dt,
calc43047311110000 MAIN CANYON 16-4-15-23 COSEKARES 11/12/1982 39.5473257 -109.3400875 sp, gr, ohm, dst
(USA) LTD rho, nphi43047311110001 MAIN CANYON FED 16-4- PIONEER NAT RES 8/1/2003 39.5473257 -109.3400875
15-23 USA43047311350000 STATE OF UTAH 8-2-15-22 COSEKARES 9/11/1981 39.5399279 -109.4146105
(USA) LTD43047315100000 AGENCY DRAW 16-3 CELERON O&GCO 3/11/1985 39.710179 -109.6569544 sp, gr, ohm,
rho, nphi, dt43047325870000 DRAGON CANYON 27-12-1 AMOCO PROD CO 6/24/1996 39.7483922 -109.0999466 gr, ohm, rho,
nphi43047325870001 DRAGON CANYON 27-12-1 MEDALLION EXPL 5/5/1998 39.7483922 -109.0999466
43047325920000 BLACK HORSE 9-15-24 1 AMOCO PROD CO 5/17/1996 39.5325858 -109.2323155 gr, ohm, rho,nphi
43047325920001 BLACK HORSE 9-15-24 1 CDX ROCKIES LLC 39.5325858 -109.2323155
43047325930000 TPC STATE 23-36-14-24 AMOCO PROD CO 8/14/1996 39.5602282 -109.1769119
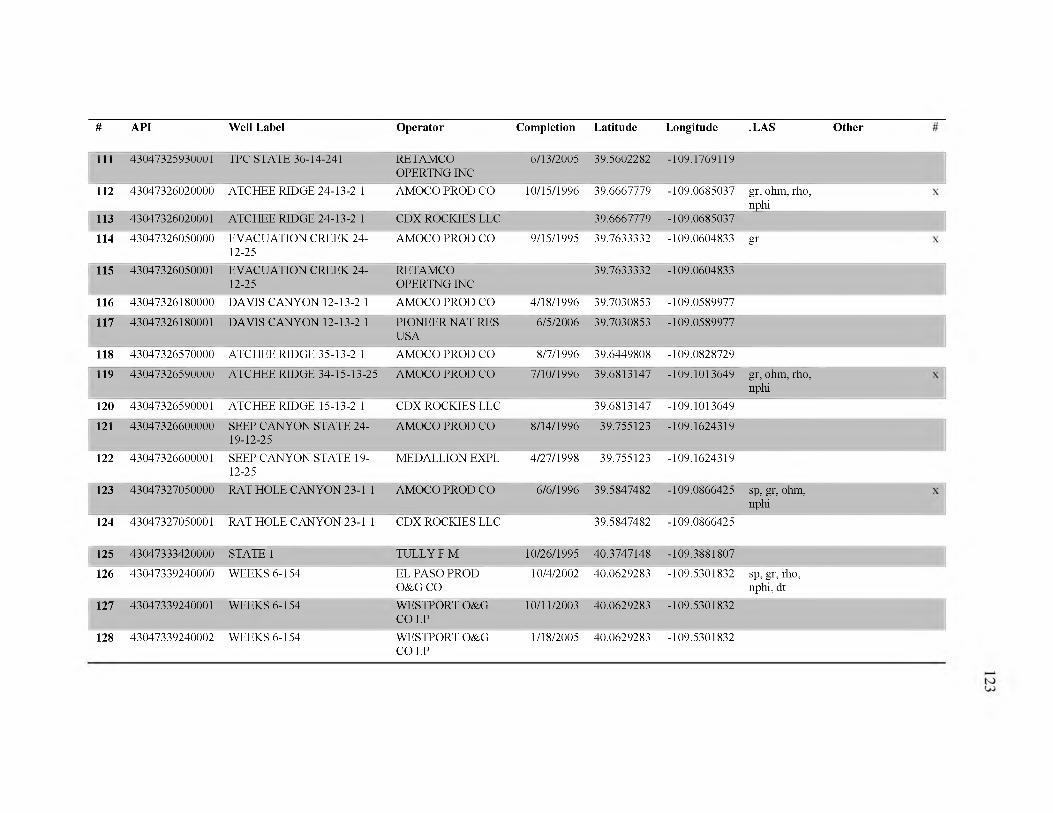
#
111
112
113
114
115
116
117
118
119
120
121
122
123
124
125
126
127
128
API Well Label Operator Completion Latitude Longitude .LAS Other
43047325930001 TPC STATE 36-14-241 RETAMCO 6/13/2005 39.5602282 -109.1769119OPERTNGINC
43047326020000 ATCHEE RIDGE 24-13-2 1 AMOCO PROD CO 10/15/1996 39.6667779 -109.0685037 gr, ohm, rho,nphi
43047326020001 ATCHEE RIDGE 24-13-2 1 CDX ROCKIES LLC 39.6667779 -109.0685037
43047326050000 EVACUATION CREEK 24- AMOCO PROD CO 9/15/1995 39.7633332 -109.0604833 gr 12-25
43047326050001 EVACUATION CREEK 24- RETAMCO 39.7633332 -109.0604833 12-25 OPERTNGINC
43047326180000 DAVIS CANYON 12-13-2 1 AMOCO PROD CO 4/18/1996 39.7030853 -109.0589977
43047326180001 DAVIS CANYON 12-13-2 1 PIONEER NAT RES 6/5/2006 39.7030853 -109.0589977USA
43047326570000 ATCHEE RIDGE 35-13-2 1 AMOCO PROD CO 8/7/1996 39.6449808 -109.0828729
43047326590000 ATCHEE RIDGE 34-15-13-25 AMOCO PROD CO 7/10/1996 39.6813147 -109.1013649 gr, ohm, rho,nphi
43047326590001 ATCHEE RIDGE 15-13-2 1 CDX ROCKIES LLC 39.6813147 -109.1013649
43047326600000 SEEP CANYON STATE 24- AMOCO PROD CO 8/14/1996 39.755123 -109.1624319 19-12-25
43047326600001 SEEP CANYON STATE 19- MEDALLION EXPL 4/27/1998 39.755123 -109.1624319 12-25
43047327050000 RAT HOLE CANYON 23-1 1 AMOCO PROD CO 6/6/1996 39.5847482 -109.0866425 sp, gr, ohm,nphi
43047327050001 RAT HOLE CANYON 23-1 1 CDX ROCKIES LLC 39.5847482 -109.0866425
43047333420000 STATE 1 TULLYFM 10/26/1995 40.3747148 -109.3881807
43047339240000 WEEKS 6-154 EL PASO PROD 10/4/2002 40.0629283 -109.5301832 sp, gr, rho,O&G CO nphi, dt
43047339240001 WEEKS 6-154 WESTPORT O&G 10/11/2003 40.0629283 -109.5301832CO LP
43047339240002 WEEKS 6-154 WESTPORT O&G 1/18/2005 40.0629283 -109.5301832CO LP
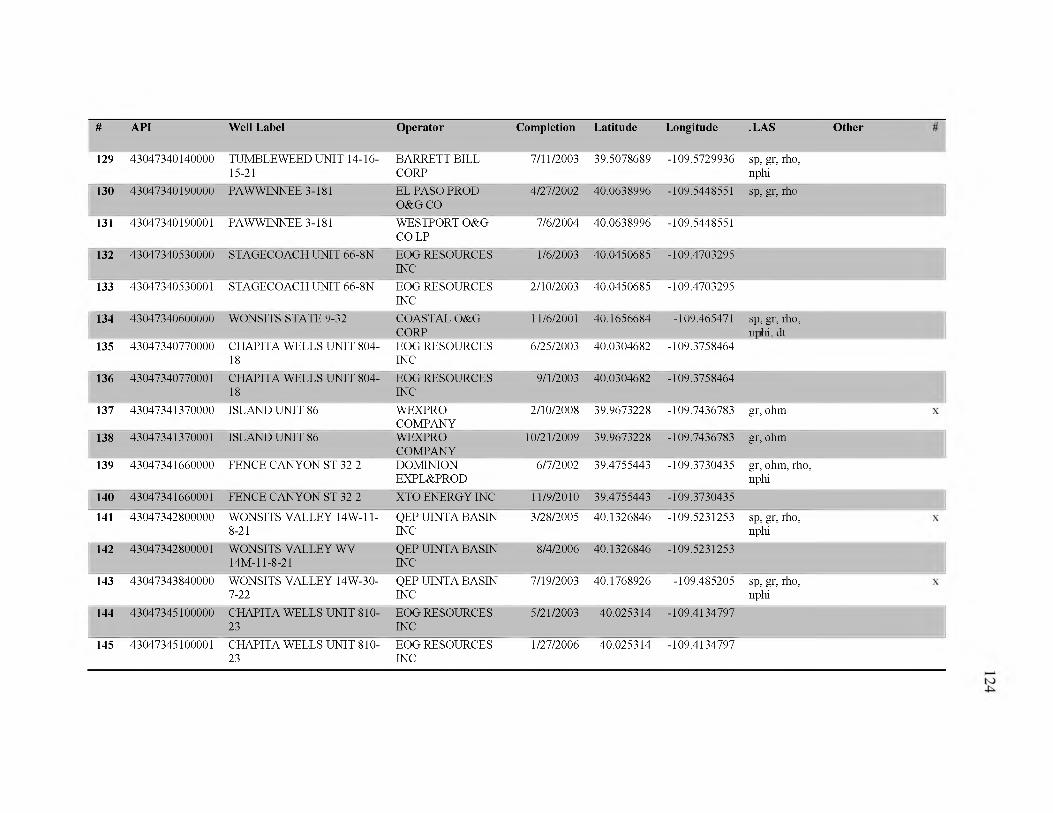
#
129
130
131
132
133
134
135
136
137
138
139
140
141
142
143
144
145
API Well Label
43047340140000 TUMBLEWEED UNIT 14-16-15-21
43047340190000 PAWWINNEE 3-181
43047340190001 PAWWINNEE 3-181
43047340530000 STAGECOACH UNIT 66-8N
43047340530001 STAGECOACH UNIT 66-8N
43047340600000 WONSITS STATE 9-32
43047340770000 CHAPITA WELLS UNIT 804- 18
43047340770001 CHAPITA WELLS UNIT 804- 18
43047341370000 ISLAND UNIT 86
43047341370001 ISLAND UNIT 86
43047341660000 FENCE CANYON ST 32 2
43047341660001 FENCE CANYON ST 32 2
43047342800000 WONSITS VALLEY 14W-11- 8-21
43047342800001 WONSITS VALLEY WV 14M-11-8-21
43047343840000 WONSITS VALLEY 14W-30- 7-22
43047345100000 CHAPITA WELLS UNIT 810- 23
BARRETT BILL 7/11/2003 39.5078689CORPEL PASO PROD 4/27/2002 40.0638996O&G COWESTPORT O&G 7/6/2004 40.0638996CO LPEOG RESOURCES 1/6/2003 40.0450685INCEOG RESOURCES 2/10/2003 40.0450685 INCCOASTAL O&G 11/6/2001 40.1656684CORPEOG RESOURCES 6/25/2003 40.0304682 INCEOG RESOURCES 9/1/2003 40.0304682INCWEXPRO 2/10/2008 39.9673228COMPANYWEXPRO 10/21/2009 39.9673228COMPANYDOMINION 6/7/2002 39.4755443EXPL&PRODXTO ENERGY INC 11/9/2010 39.4755443
Operator Completion Latitude
QEP UINTA BASIN 3/28/2005 40.1326846 INCQEP UINTA BASIN 8/4/2006 40.1326846 INCQEP UINTA BASIN 7/19/2003 40.1768926 INCEOG RESOURCES 5/21/2003 40.025314 INC
-109.5729936 sp, gr, rho, nphi
-109.5448551 sp, gr, rho
Longitude .LAS Other
-109.5448551
-109.4703295
-109.4703295
-109.465471 sp, gr, rho, nphi, dt
-109.3758464
-109.3758464
-109.7436783 gr, ohm
-109.7436783 gr, ohm
-109.3730435 gr, ohm, rho, nphi
-109.3730435
-109.5231253 sp, gr, rho, nphi
-109.5231253
-109.485205 sp, gr, rho, nphi
-109.4134797
43047345100001 CHAPITA WELLS UNIT 810- EOG RESOURCES 23 INC
1/27/2006 40.025314 -109.4134797
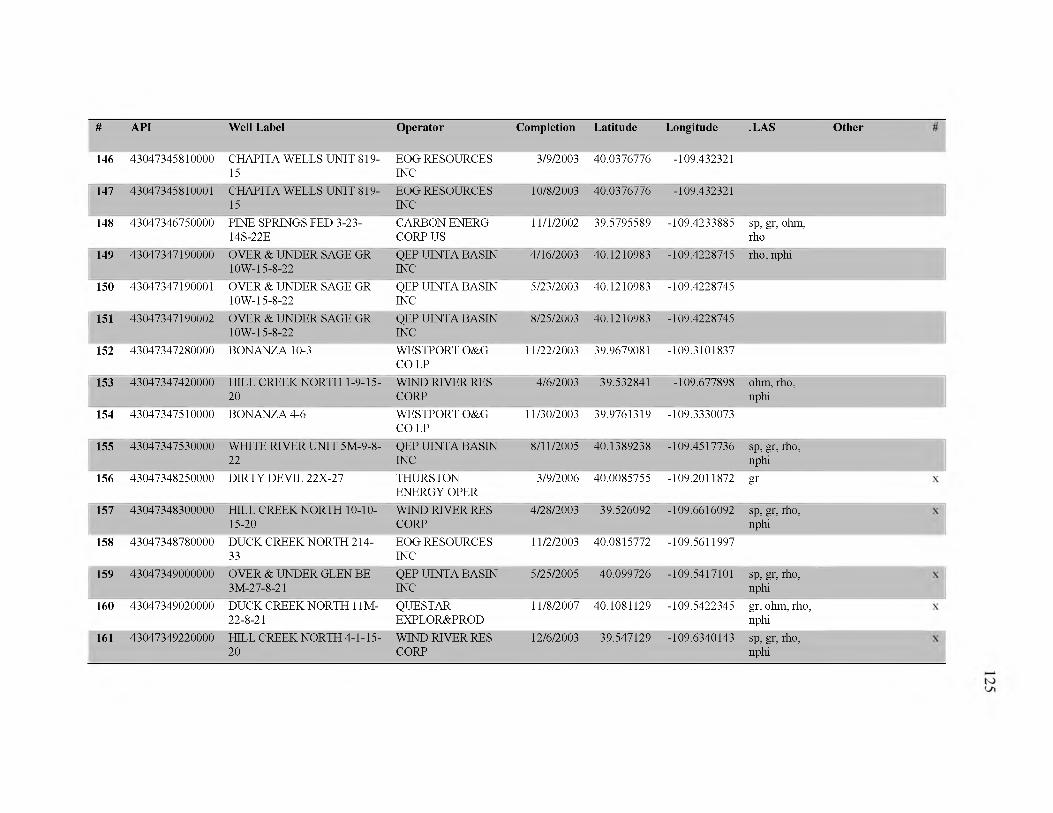
#
146
147
148
149
150
151
152
153
154
155
156
157
158
159
160
161
43047345810000
API
CHAPITA WELLS UNIT 819- 15
Well Label
EOG RESOURCES INC
Operator
3/9/2003
Completion
40.0376776
Latitude
-109.432321
Longitude .LAS Other
43047345810001 CHAPITA WELLS UNIT 819- 15
EOG RESOURCES INC
10/8/2003 40.0376776 -109.432321
43047346750000 PINE SPRINGS FED 3-23- 14S-22E
CARBON ENERG CORPUS
11/1/2002 39.5795589 -109.4233885 sp, gr, ohm, rho
43047347190000 OVER & UNDER SAGE GR 10W-15-8-22
QEP UINTA BASIN INC
4/16/2003 40.1210983 -109.4228745 rho, nphi
43047347190001 OVER & UNDER SAGE GR 10W-15-8-22
QEP UINTA BASIN INC
5/23/2003 40.1210983 -109.4228745
43047347190002 OVER & UNDER SAGE GR 10W-15-8-22
QEP UINTA BASIN INC
8/25/2003 40.1210983 -109.4228745
43047347280000 BONANZA 10-3 WESTPORT O&G CO LP
11/22/2003 39.9679081 -109.3101837
43047347420000 HILL CREEK NORTH 1-9-15- 20
WIND RIVER RES CORP
4/6/2003 39.532841 -109.677898 ohm, rho, nphi
43047347510000 BONANZA 4-6 WESTPORT O&G CO LP
11/30/2003 39.9761319 -109.3330073
43047347530000 WHITE RIVER UNIT 5M-9-8- 22
QEP UINTA BASIN INC
8/11/2005 40.1389238 -109.4517736 sp, gr, rho, nphi
43047348250000 DIRTY DEVIL 22X-27 THURSTON ENERGY OPER
3/9/2006 40.0085755 -109.2011872 gr
43047348300000 HILL CREEK NORTH 10-10- 15-20
WIND RIVER RES CORP
4/28/2003 39.526092 -109.6616092 sp, gr, rho, nphi
43047348780000 DUCK CREEK NORTH 214- 33
EOG RESOURCES INC
11/2/2003 40.0815772 -109.5611997
43047349000000 OVER & UNDER GLEN BE 3M-27-8-21
QEP UINTA BASIN INC
5/25/2005 40.099726 -109.5417101 sp, gr, rho, nphi
43047349020000 DUCK CREEK NORTH 11M- 22 - 8-21
QUESTAREXPLOR&PROD
11/8/2007 40.1081129 -109.5422345 gr, ohm, rho, nphi
43047349220000 HILL CREEK NORTH 4-1-15- WIND RIVER RES 20 CORP
12/6/2003 39.547129 -109.6340143 sp, gr, rho,nphi
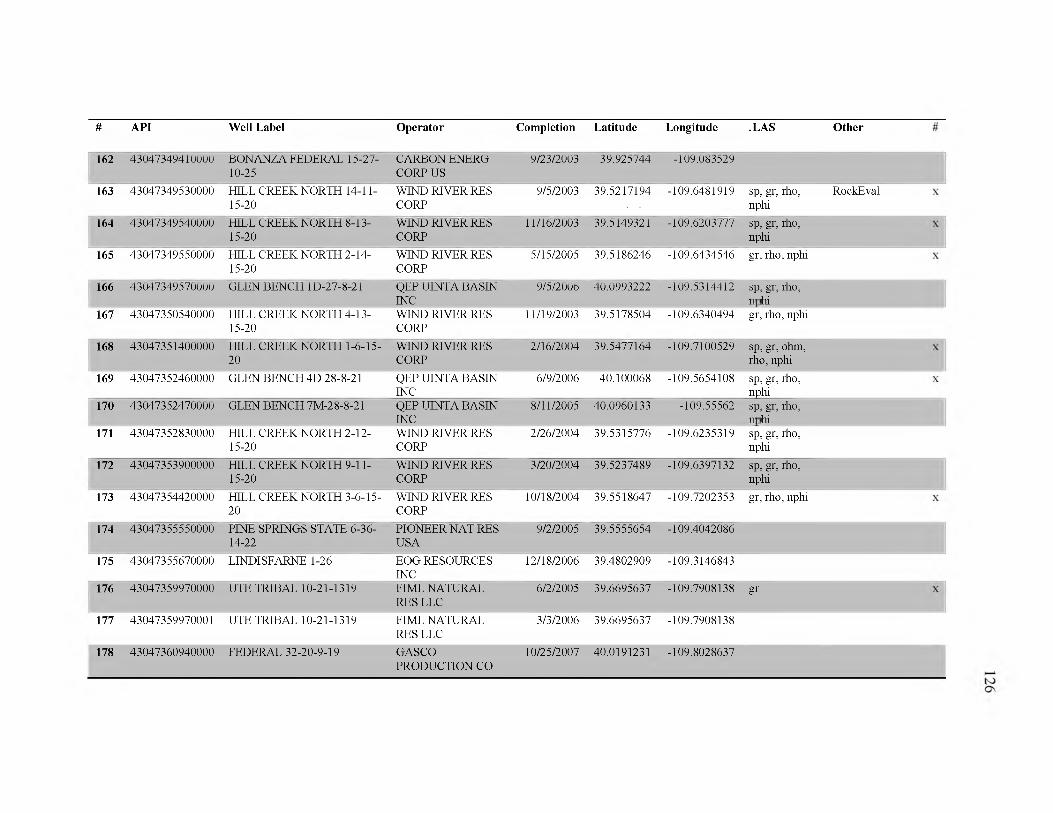
#
162
163
164
165
166
167
168
169
170
171
172
173
174
175
176
177
178
API Well Label Operator Completion Latitude Longitude .LAS Other
43047349410000 BONANZA FEDERAL 15-27- 10-25
CARBON ENERG CORPUS
9/23/2003 39.925744 -109.083529
43047349530000 HILL CREEK NORTH 14-11- 15-20
WIND RIVER RES CORP
9/5/2003 39.5217194 -109.6481919 sp, gr, rho, nphi
RockEval
43047349540000 HILL CREEK NORTH 8-13- 15-20
WIND RIVER RES CORP
11/16/2003 39.5149321 -109.6203777 sp, gr, rho, nphi
43047349550000 HILL CREEK NORTH 2-14- 15-20
WIND RIVER RES CORP
5/15/2005 39.5186246 -109.6434546 gr, rho, nphi
43047349570000 GLEN BENCH ID-27-8-21 QEP UINTA BASIN INC
9/5/2006 40.0993222 -109.5314412 sp, gr, rho, nphi
43047350540000 HILL CREEK NORTH 4-13- 15-20
WIND RIVER RES CORP
11/19/2003 39.5178504 -109.6340494 gr, rho, nphi
43047351400000 HILL CREEK NORTH 1-6-15- 20
WIND RIVER RES CORP
2/16/2004 39.5477164 -109.7100529 sp, gr, ohm, rho, nphi
43047352460000 GLEN BENCH 4D 28-8-21 QEP UINTA BASIN INC
6/9/2006 40.100068 -109.5654108 sp, gr, rho, nphi
43047352470000 GLEN BENCH 7M-28-8-21 QEP UINTA BASIN INC
8/11/2005 40.0960133 -109.55562 sp, gr, rho, nphi
43047352830000 HILL CREEK NORTH 2-12- 15-20
WIND RIVER RES CORP
2/26/2004 39.5315776 -109.6235319 sp, gr, rho, nphi
43047353900000 HILL CREEK NORTH 9-11- 15-20
WIND RIVER RES CORP
3/20/2004 39.5237489 -109.6397132 sp, gr, rho, nphi
43047354420000 HILL CREEK NORTH 3-6-15- 20
WIND RIVER RES CORP
10/18/2004 39.5518647 -109.7202353 gr, rho, nphi
43047355550000 PINE SPRINGS STATE 6-36- 14-22
PIONEER NAT RES USA
9/2/2005 39.5555654 -109.4042086
43047355670000 LINDISFARNE 1-26 EOG RESOURCES INC
12/18/2006 39.4802909 -109.3146843
43047359970000 UTE TRIBAL 10-21-1319 FIML NATURAL RES LLC
6/2/2005 39.6695637 -109.7908138 gr
43047359970001 UTE TRIBAL 10-21-1319 FIML NATURAL RES LLC
3/3/2006 39.6695637 -109.7908138
43047360940000 FEDERAL 32-20-9-19 GASCOPRODUCTION CO
10/25/2007 40.0191231 -109.8028637
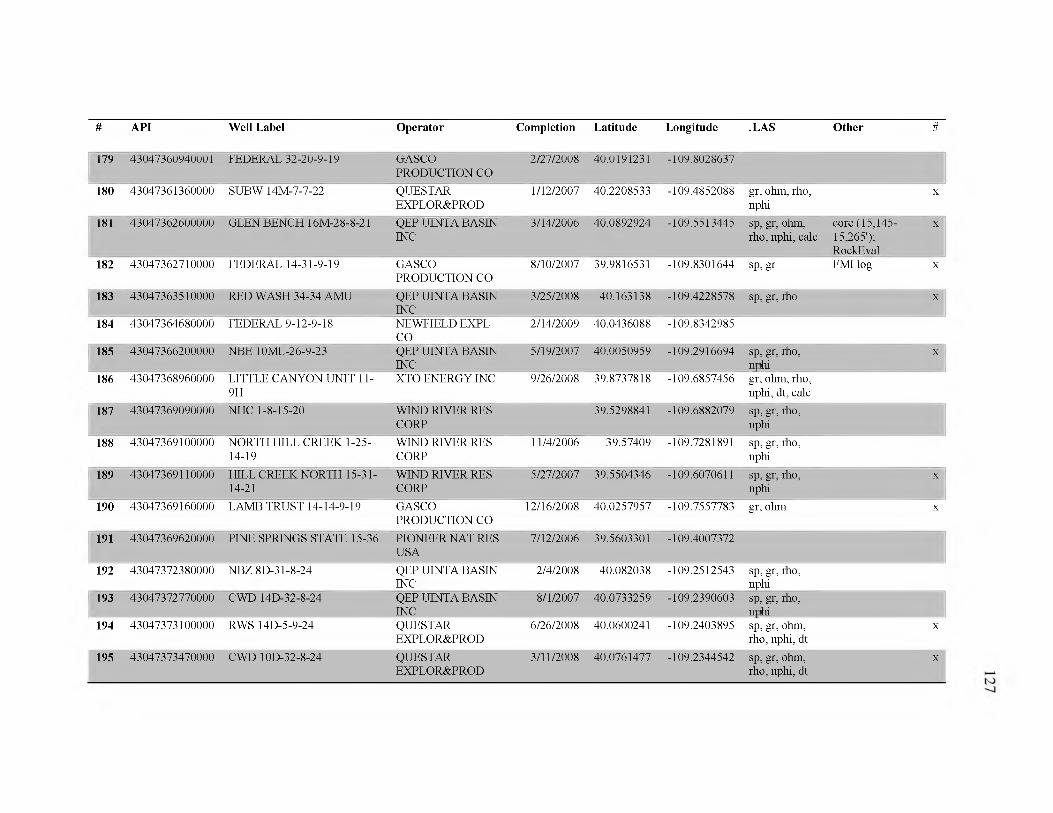
# API Well Label Operator Completion Latitude Longitude .LAS Other #
179 43047360940001 FEDERAL 32-20-9-19 GASCOPRODUCTION CO
2/27/2008 40.0191231 -109.8028637
180 43047361360000 SUBW 14M-7-7-22 QUESTAREXPLOR&PROD
1/12/2007 40.2208533 -109.4852088 gr, ohm, rho, nphi
X
181 43047362600000 GLEN BENCH 16M-28-8-21 QEP UINTA BASIN INC
3/14/2006 40.0892924 -109.5513445 sp, gr, ohm, rho, nphi, calc
core (15,145-15,265');RockEval
X
182 43047362710000 FEDERAL 14-31-9-19 GASCOPRODUCTION CO
8/10/2007 39.9816531 -109.8301644 sp, gr FMI log X
183 43047363510000 RED WASH 34-34 AMU QEP UINTA BASIN INC
3/25/2008 40.163138 -109.4228578 sp, gr, rho X
184 43047364680000 FEDERAL 9-12-9-18 NEWFIELD EXPL CO
2/14/2009 40.0436088 -109.8342985
185 43047366200000 NBE 10ML-26-9-23 QEP UINTA BASIN INC
5/19/2007 40.0050959 -109.2916694 sp, gr, rho, nphi
X
186 43047368960000 LITTLE CANYON UNIT 11- 9H
XTO ENERGY INC 9/26/2008 39.8737818 -109.6857456 gr, ohm, rho, nphi, dt, calc
187 43047369090000 NHC 1-8-15-20 WIND RIVER RES CORP
39.5298841 -109.6882079 sp, gr, rho, nphi
188 43047369100000 NORTH HILL CREEK 1-25- 14-19
WIND RIVER RES CORP
11/4/2006 39.57409 -109.7281891 sp, gr, rho, nphi
189 43047369110000 HILL CREEK NORTH 15-31- 14-21
WIND RIVER RES CORP
5/27/2007 39.5504346 -109.6070611 sp, gr, rho, nphi
X
190 43047369160000 LAMB TRUST 14-14-9-19 GASCOPRODUCTION CO
12/16/2008 40.0257957 -109.7557783 gr, ohm X
191 43047369620000 PINE SPRINGS STATE 15-36 PIONEER NAT RES USA
7/12/2006 39.5603301 -109.4007372
192 43047372380000 NBZ 8D-31-8-24 QEP UINTA BASIN INC
2/4/2008 40.082038 -109.2512543 sp, gr, rho, nphi
193 43047372770000 CWD 14D-32-8-24 QEP UINTA BASIN INC
8/1/2007 40.0733259 -109.2390603 sp, gr, rho, nphi
194 43047373100000 RWS 14D-5-9-24 QUESTAREXPLOR&PROD
6/26/2008 40.0600241 -109.2403895 sp, gr, ohm, rho, nphi, dt
X
195 43047373470000 CWD 10D-32-8-24 QUESTAREXPLOR&PROD
3/11/2008 40.0761477 -109.2344542 sp, gr, ohm, rho, nphi, dt
X
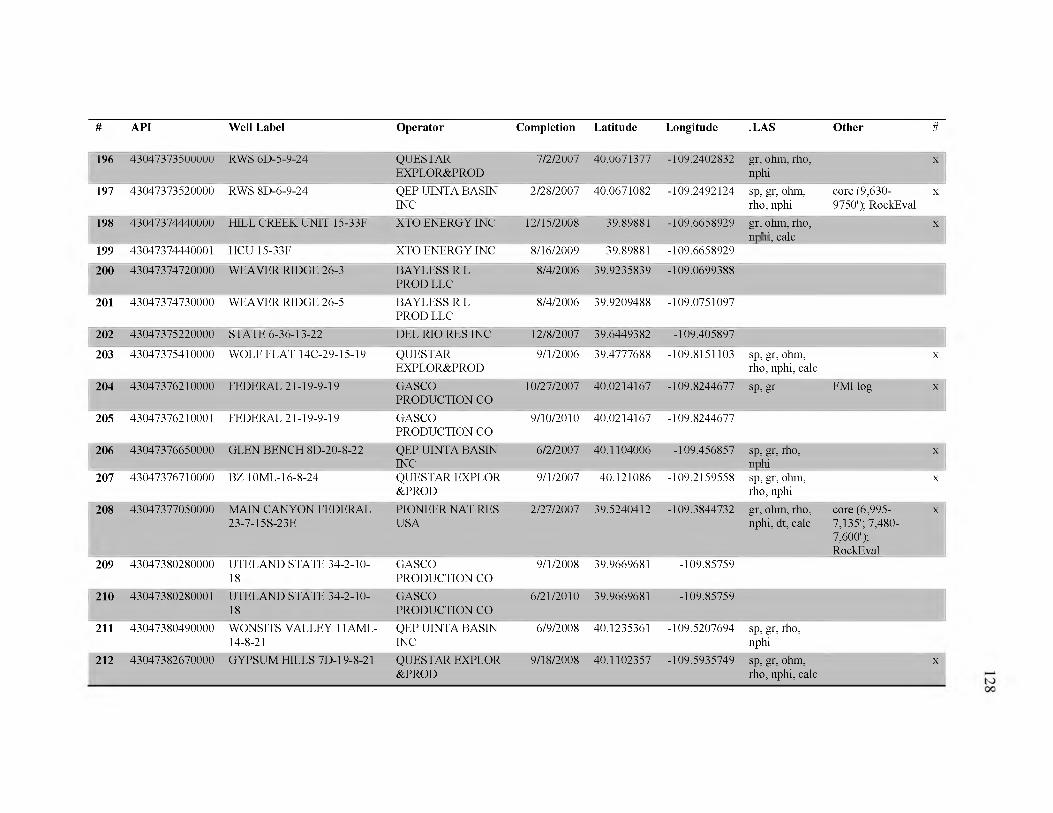
# API Well Label Operator Completion Latitude Longitude .LAS Other #
196 43047373500000 RWS 6D-5-9-24 QUESTAREXPLOR&PROD
7/2/2007 40.0671377 -109.2402832 gr, ohm, rho, nphi
X
197 43047373520000 RWS 8D-6-9-24 QEP UINTA BASIN INC
2/28/2007 40.0671082 -109.2492124 sp, gr, ohm, rho, nphi
core (9,630- x 9750'); RockEval
198 43047374440000 HILL CREEK UNIT 15-33F XTO ENERGY INC 12/15/2008 39.89881 -109.6658929 gr, ohm, rho, nphi, calc
X
199 43047374440001 HCU 15-33F XTO ENERGY INC 8/16/2009 39.89881 -109.6658929
200 43047374720000 WEAVER RIDGE 26-3 BAYLESS R L PROD LLC
8/4/2006 39.9235839 -109.0699388
201 43047374730000 WEAVER RIDGE 26-5 BAYLESS R L PROD LLC
8/4/2006 39.9209488 -109.0751097
202 43047375220000 STATE 6-36-13-22 DEL RIO RES INC 12/8/2007 39.6449382 -109.405897
203 43047375410000 WOLF FLAT 14C-29-15-19 QUESTAREXPLOR&PROD
9/1/2006 39.4777688 -109.8151103 sp, gr, ohm, rho, nphi, calc
X
204 43047376210000 FEDERAL 21-19-9-19 GASCOPRODUCTION CO
10/27/2007 40.0214167 -109.8244677 sp, gr FMI log x
205 43047376210001 FEDERAL 21-19-9-19 GASCOPRODUCTION CO
9/10/2010 40.0214167 -109.8244677
206 43047376650000 GLEN BENCH 8D-20-8-22 QEP UINTA BASIN INC
6/2/2007 40.1104006 -109.456857 sp, gr, rho, nphi
X
207 43047376710000 BZ 10ML-16-8-24 QUESTAR EXPLOR &PROD
9/1/2007 40.121086 -109.2159558 sp, gr, ohm, rho, nphi
X
208 43047377050000 MAIN CANYON FEDERAL 23-7-15S-23E
PIONEER NAT RES USA
2/27/2007 39.5240412 -109.3844732 gr, ohm, rho, nphi, dt, calc
core (6,995- x 7,135'; 7,480- 7,600');RockEval
209 43047380280000 UTELAND STATE 34-2-10- 18
GASCOPRODUCTION CO
9/1/2008 39.9669681 -109.85759
210 43047380280001 UTELAND STATE 34-2-10- 18
GASCOPRODUCTION CO
6/21/2010 39.9669681 -109.85759
211 43047380490000 WONSITS VALLEY 11 AML- 14-8-21
QEP UINTA BASIN INC
6/9/2008 40.1235361 -109.5207694 sp, gr, rho, nphi
212 43047382670000 GYPSUM HILLS 7D-19-8-21 QUESTAR EXPLOR 9/18/2008 40.1102357 -109.5935749 sp, gr, ohm, x&PROD rho, nphi, calc
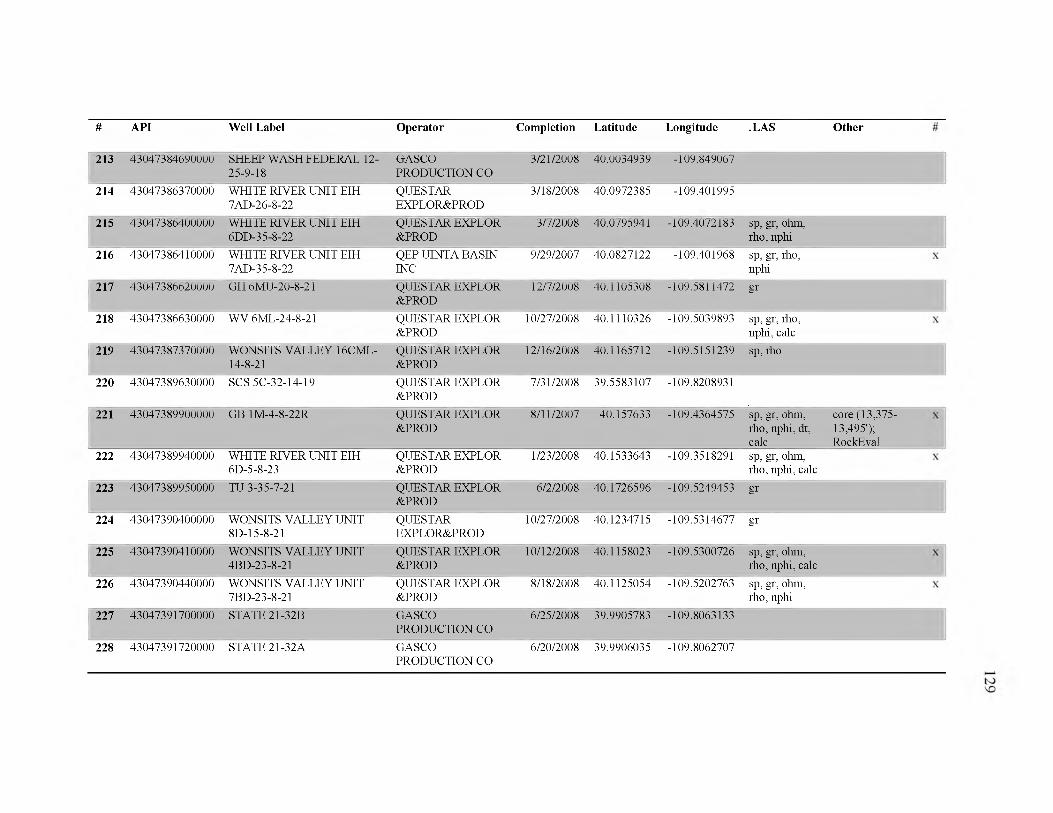
#
213
214
215
216
217
218
219
220
221
222
223
224
225
226
227
228
API Well Label Operator Completion Latitude Longitude .LAS Other
43047384690000 SHEEP WASH FEDERAL 12- 25-9-18
GASCOPRODUCTION CO
3/21/2008 40.0034939 -109.849067
43047386370000 WHITE RIVER UNIT EIH 7AD-26-8-22
QUESTAREXPLOR&PROD
3/18/2008 40.0972385 -109.401995
43047386400000 WHITE RIVER UNIT EIH 6DD-3 5-8-22
QUESTAR EXPLOR &PROD
3/7/2008 40.0795941 -109.4072183 sp, gr, ohm, rho, nphi
43047386410000 WHITE RIVER UNIT EIH 7AD-35-8-22
QEP UINTA BASIN INC
9/29/2007 40.0827122 -109.401968 sp, gr, rho, nphi
43047386620000 GH 6MU-20-8-21 QUESTAR EXPLOR &PROD
12/7/2008 40.1105308 -109.5811472 gr
43047386630000 WV 6ML-24-8-21 QUESTAR EXPLOR &PROD
10/27/2008 40.1110326 -109.5039893 sp, gr, rho, nphi, calc
43047387370000 WONSITS VALLEY 16CML- 14-8-21
QUESTAR EXPLOR &PROD
12/16/2008 40.1165712 -109.5151239 sp, rho
43047389630000 SCS 5C-32-14-19 QUESTAR EXPLOR &PROD
7/31/2008 39.5583107 -109.8208931
43047389900000 GB 1M-4-8-22R QUESTAR EXPLOR &PROD
8/11/2007 40.157633 -109.4364575 sp, gr, ohm, core (13,375- rho, nphi, dt, 13,495'); calc RockEval
43047389940000 WHITE RIVER UNIT EIH 6D-5-8-23
QUESTAR EXPLOR &PROD
1/23/2008 40.1533643 -109.3518291 sp, gr, ohm, rho, nphi, calc
43047389950000 TU 3-35-7-21 QUESTAR EXPLOR &PROD
6/2/2008 40.1726596 -109.5249453 gr
43047390400000 WONSITS VALLEY UNIT 8D-15-8-21
QUESTAREXPLOR&PROD
10/27/2008 40.1234715 -109.5314677 gr
43047390410000 WONSITS VALLEY UNIT 4BD-23-8-21
QUESTAR EXPLOR &PROD
10/12/2008 40.1158023 -109.5300726 sp, gr, ohm, rho, nphi, calc
43047390440000 WONSITS VALLEY UNIT 7BD-23-8-21
QUESTAR EXPLOR &PROD
8/18/2008 40.1125054 -109.5202763 sp, gr, ohm, rho, nphi
43047391700000 STATE 21-32B GASCOPRODUCTION CO
6/25/2008 39.9905783 -109.8063133
43047391720000 STATE 21-32A GASCOPRODUCTION CO
6/20/2008 39.9906035 -109.8062707
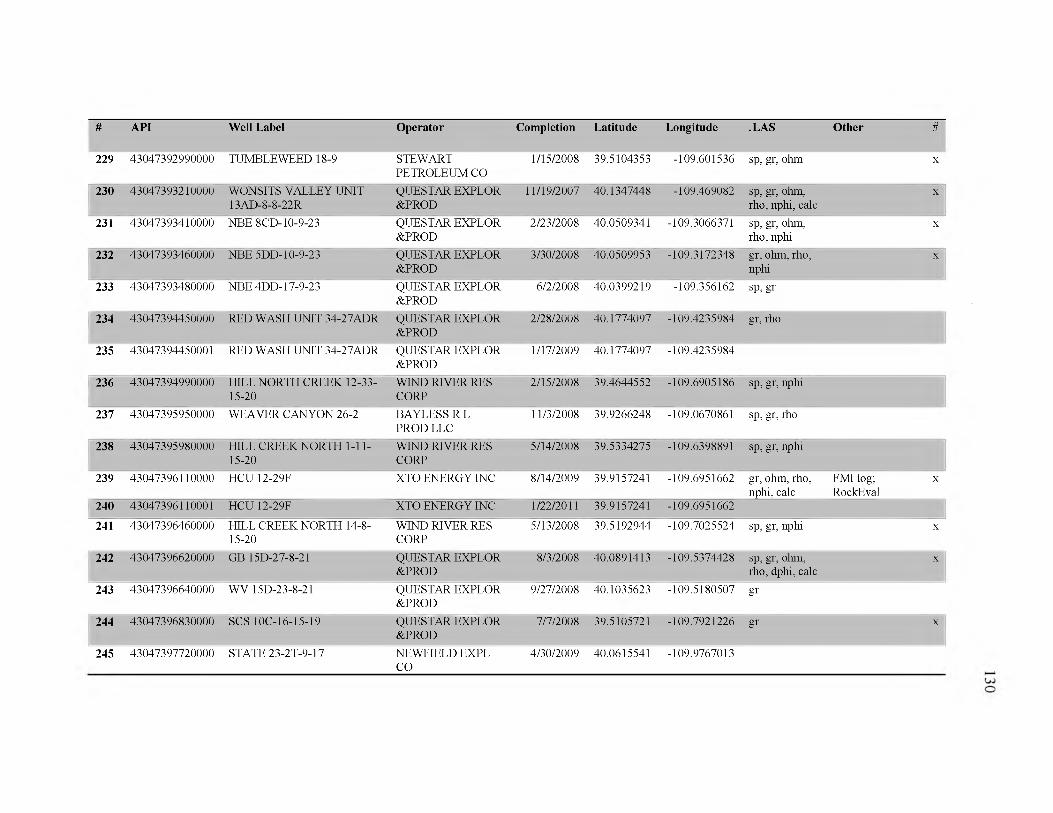
# API Well Label Operator Completion Latitude Longitude .LAS Other #
229 43047392990000 TUMBLEWEED 18-9 STEWART PETROLEUM CO
1/15/2008 39.5104353 -109.601536 sp, gr, ohm X
230 43047393210000 WONSITS VALLEY UNIT 13AD-8-8-22R
QUESTAR EXPLOR &PROD
11/19/2007 40.1347448 -109.469082 sp, gr, ohm, rho, nphi, calc
X
231 43047393410000 NBE 8CD-10-9-23 QUESTAR EXPLOR &PROD
2/23/2008 40.0509341 -109.3066371 sp, gr, ohm, rho, nphi
X
232 43047393460000 NBE 5DD-10-9-2 3 QUESTAR EXPLOR &PROD
3/30/2008 40.0509953 -109.3172348 gr, ohm, rho, nphi
X
233 43047393480000 NBE 4DD-17-9-2 3 QUESTAR EXPLOR &PROD
6/2/2008 40.0399219 -109.356162 sp, gr
234 43047394450000 RED WASH UNIT 34-27ADR QUESTAR EXPLOR &PROD
2/28/2008 40.1774097 -109.4235984 gr, rho
235 43047394450001 RED WASH UNIT 34-27ADR QUESTAR EXPLOR &PROD
1/17/2009 40.1774097 -109.4235984
236 43047394990000 HILL NORTH CREEK 12-33- 15-20
WIND RIVER RES CORP
2/15/2008 39.4644552 -109.6905186 sp, gr, nphi
237 43047395950000 WEAVER CANYON 26-2 BAYLESS R L PROD LLC
11/3/2008 39.9266248 -109.0670861 sp, gr, rho
238 43047395980000 HILL CREEK NORTH 1-11- 15-20
WIND RIVER RES CORP
5/14/2008 39.5334275 -109.6398891 sp, gr, nphi
239 43047396110000 HCU 12-29F XTO ENERGY INC 8/14/2009 39.9157241 -109.6951662 gr, ohm, rho, nphi, calc
FMI log; x RockEval
240 43047396110001 HCU 12-29F XTO ENERGY INC 1/22/2011 39.9157241 -109.6951662
241 43047396460000 HILL CREEK NORTH 14-8- 15-20
WIND RIVER RES CORP
5/13/2008 39.5192944 -109.7025524 sp, gr, nphi X
242 43047396620000 GB 15D-27-8-21 QUESTAR EXPLOR &PROD
8/3/2008 40.0891413 -109.5374428 sp, gr, ohm, rho, dphi, calc
X
243 43047396640000 WV 15D-23-8-21 QUESTAR EXPLOR &PROD
9/27/2008 40.1035623 -109.5180507 gr
244 43047396830000 SCS 10C-16-15-19 QUESTAR EXPLOR &PROD
7/7/2008 39.5105721 -109.7921226 gr X
245 43047397720000 STATE 23-2T-9-17 NEWFIELD EXPL 4/30/2009 40.0615541 -109.9767013CO
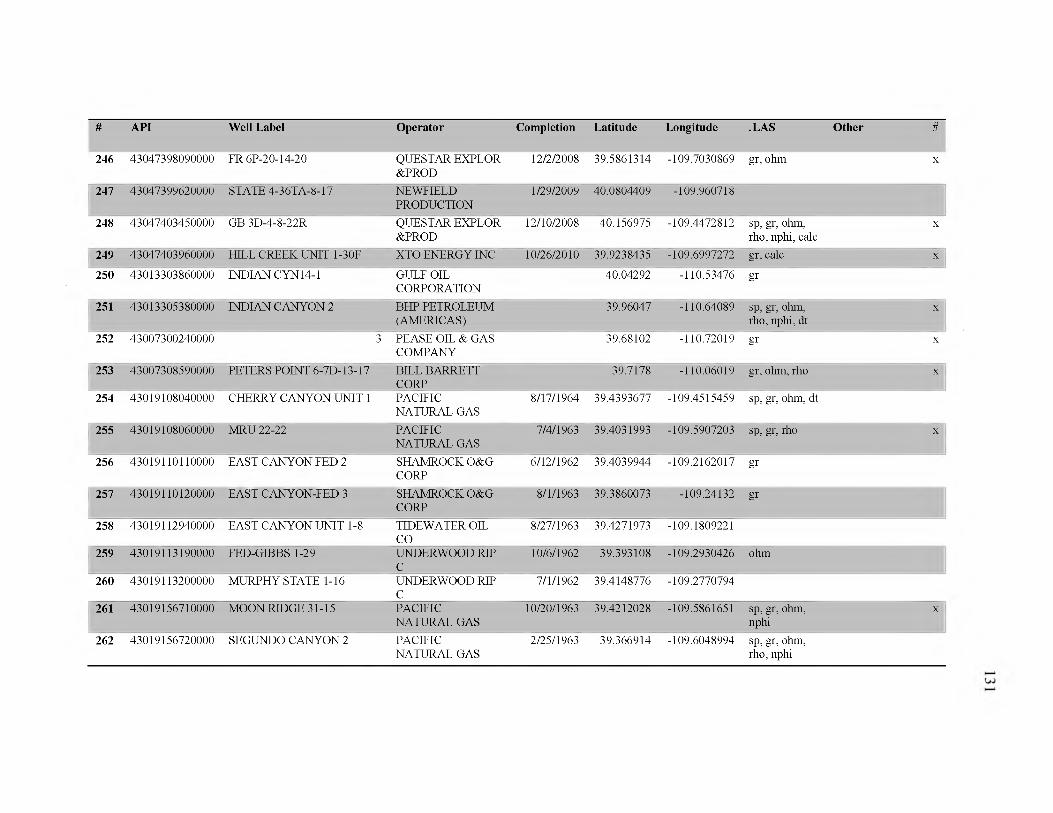
# API Well Label Operator Completion Latitude Longitude .LAS Other #
246 43047398090000 FR 6P-2 0-14-20 QUESTAR EXPLOR &PROD
12/2/2008 39.5861314 -109.7030869 gr, ohm X
247 43047399620000 STATE 4-36TA-8-17 NEWFIELDPRODUCTION
1/29/2009 40.0804409 -109.960718
248 43047403450000 GB 3D-4-8-22R QUESTAR EXPLOR &PROD
12/10/2008 40.156975 -109.4472812 sp, gr, ohm, rho, nphi, calc
X
249 43047403960000 FULL CREEK UNIT 1-30F XTO ENERGY INC 10/26/2010 39.9238435 -109.6997272 gr, calc X
250 43013303860000 INDIAN CYN14-1 GULF OIL CORPORATION
40.04292 -110.53476 gr
251 43013305380000 INDIAN CANYON 2 BHP PETROLEUM (AMERICAS)
39.96047 -110.64089 sp, gr, ohm, rho, nphi, dt
X
252 43007300240000 3 PEASE OIL & GAS COMPANY
39.68102 -110.72019 gr X
253 43007308590000 PETERS POINT 6-7D-13-17 BILL BARRETT CORP
39.7178 -110.06019 gr, ohm, rho X
254 43019108040000 CHERRY CANYON UNIT 1 PACIFIC NATURAL GAS
8/17/1964 39.4393677 -109.4515459 sp, gr, ohm, dt
255 43019108060000 MRU 22-22 PACIFIC NATURAL GAS
7/4/1963 39.4031993 -109.5907203 sp, gr, rho X
256 43019110110000 EAST CANYONFED 2 SHAMROCK O&G CORP
6/12/1962 39.4039944 -109.2162017 gr
257 43019110120000 EAST CANYON-FED 3 SHAMROCK O&G CORP
8/1/1963 39.3860073 -109.24132 gr
258 43019112940000 EAST CANYON UNIT 1-8 TIDEWATER OIL CO
8/27/1963 39.4271973 -109.1809221
259 43019113190000 FED-GIBBS 1-29 UNDERWOOD RIP C
10/6/1962 39.393108 -109.2930426 ohm
260 43019113200000 MURPHY STATE 1-16 UNDERWOOD RIP C
7/1/1962 39.4148776 -109.2770794
261 43019156710000 MOON RIDGE 31-15 PACIFIC NATURAL GAS
10/20/1963 39.4212028 -109.5861651 sp, gr, ohm, nphi
X
262 43019156720000 SEGUNDO CANYON 2 PACIFIC NATURAL GAS
2/25/1963 39.366914 -109.6048994 sp, gr, ohm, rho, nphi
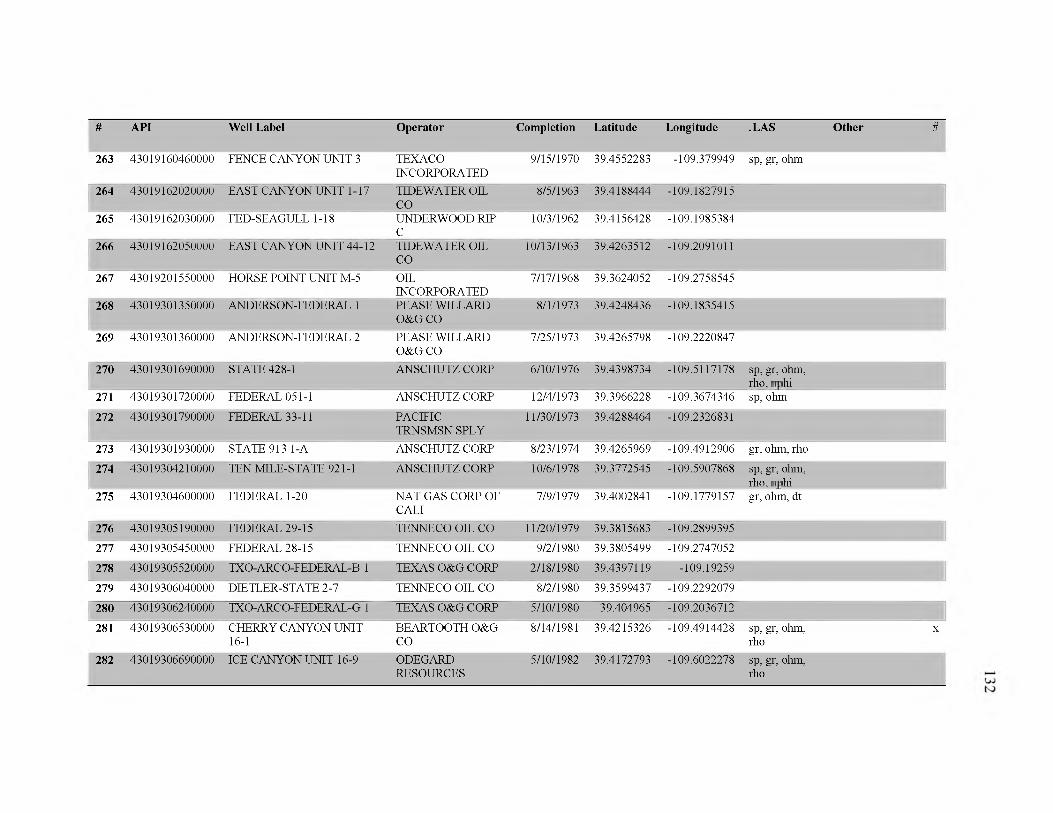
# API Well Label Operator Completion Latitude Longitude .LAS Other #
263 43019160460000 FENCE CANYON UNIT 3 TEXACOINCORPORATED
9/15/1970 39.4552283 -109.379949 sp, gr, ohm
264 43019162020000 EAST CANYON UNIT 1-17 TIDEWATER OIL CO
8/5/1963 39.4188444 -109.1827915
265 43019162030000 FED-SEAGULL 1-18 UNDERWOOD RIP C
10/3/1962 39.4156428 -109.1985384
266 43019162050000 EAST CANYON UNIT 44-12 TIDEWATER OIL CO
10/13/1963 39.4263512 -109.2091011
267 43019201550000 HORSE POINT UNIT M-5 OILINCORPORATED
7/17/1968 39.3624052 -109.2758545
268 43019301350000 ANDERSON-FEDERAL 1 PEASE WILLARD O&G CO
8/1/1973 39.4248436 -109.1835415
269 43019301360000 ANDERSON-FEDERAL 2 PEASE WILLARD O&G CO
7/25/1973 39.4265798 -109.2220847
270 43019301690000 STATE 428-1 ANSCHUTZ CORP 6/10/1976 39.4398734 -109.5117178 sp, gr, ohm, rho, nphi
271 43019301720000 FEDERAL 051-1 ANSCHUTZ CORP 12/4/1973 39.3966228 -109.3674346 sp, ohm
272 43019301790000 FEDERAL 33-11 PACIFIC TRNSMSN SPLY
11/30/1973 39.4288464 -109.2326831
273 43019301930000 STATE 913 1-A ANSCHUTZ CORP 8/23/1974 39.4265969 -109.4912906 gr, ohm, rho
274 43019304210000 TEN MILE-STATE 921-1 ANSCHUTZ CORP 10/6/1978 39.3772545 -109.5907868 sp, gr, ohm, rho, nphi
275 43019304600000 FEDERAL 1-20 NAT GAS CORP OF CALI
7/9/1979 39.4002841 -109.1779157 gr, ohm, dt
276 43019305190000 FEDERAL 29-15 TENNECO OIL CO 11/20/1979 39.3815683 -109.2899395
277 43019305450000 FEDERAL 28-15 TENNECO OIL CO 9/2/1980 39.3805499 -109.2747052
278 43019305520000 TXO-ARC O-FEDERAL-B 1 TEXAS O&G CORP 2/18/1980 39.4397119 -109.19259
279 43019306040000 DIETLER-STATE 2-7 TENNECO OIL CO 8/2/1980 39.3599437 -109.2292079
280 43019306240000 TXO-ARC O-FEDERAL-G 1 TEXAS O&G CORP 5/10/1980 39.404965 -109.2036712
281 43019306530000 CHERRY CANYON UNIT 16-1
BEARTOOTH O&G CO
8/14/1981 39.4215326 -109.4914428 sp, gr, ohm, rho
X
282 43019306690000 ICE CANYON UNIT 16-9 ODEGARDRESOURCES
5/10/1982 39.4172793 -109.6022278 sp, gr, ohm, rho
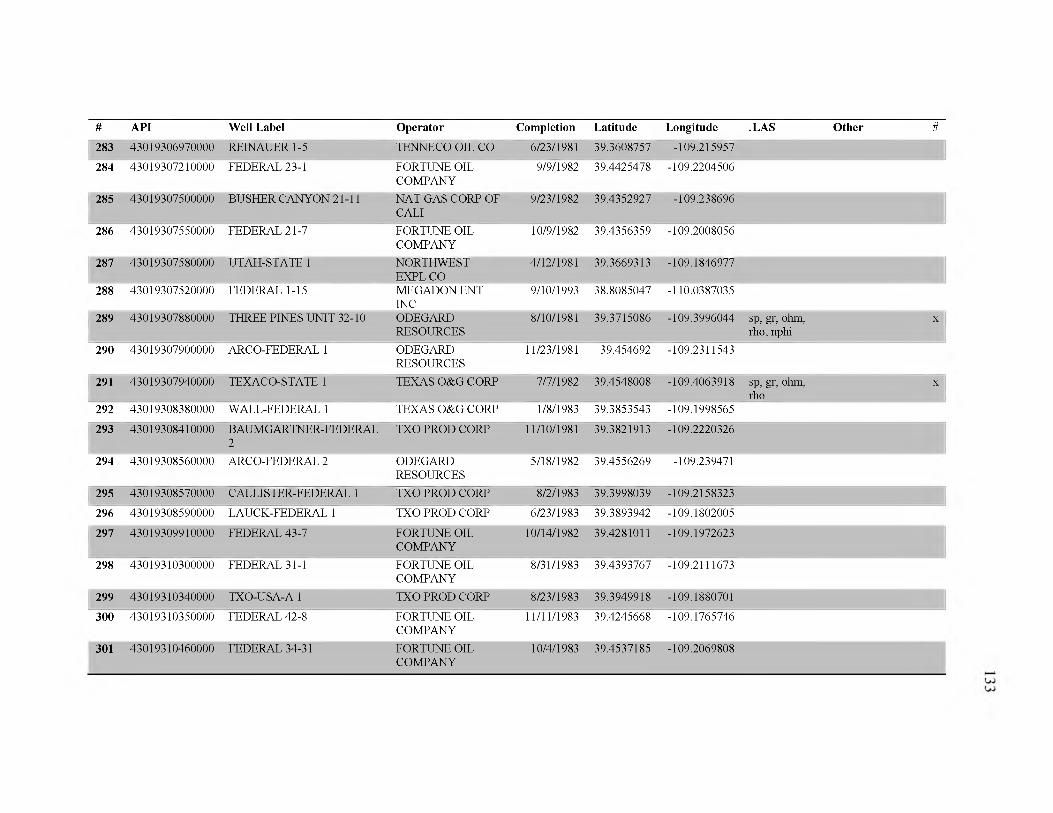
# API Well Label Operator Completion Latitude Longitude .LAS Other #
283 43019306970000 REINAUER 1-5 TENNECO OIL CO 6/23/1981 39.3608757 -109.215957
284 43019307210000 FEDERAL 23-1 FORTUNE OIL COMPANY
9/9/1982 39.4425478 -109.2204506
285 43019307500000 BUSHER CANYON 21-11 NAT GAS CORP OF CALI
9/23/1982 39.4352927 -109.238696
286 43019307550000 FEDERAL 21-7 FORTUNE OIL COMPANY
10/9/1982 39.4356359 -109.2008056
287 43019307580000 UTAH-STATE 1 NORTHWEST EXPLCO
4/12/1981 39.3669313 -109.1846977
288 43019307520000 FEDERAL 1-15 MEGADONENTINC
9/10/1993 38.8085047 -110.0387035
289 43019307880000 THREE PINES UNIT 32-10 ODEGARDRESOURCES
8/10/1981 39.3715086 -109.3996044 sp, gr, ohm, rho, nphi
X
290 43019307900000 ARCO-FEDERAL 1 ODEGARDRESOURCES
11/23/1981 39.454692 -109.2311543
291 43019307940000 TEXACO-STATE 1 TEXAS O&G CORP 7/7/1982 39.4548008 -109.4063918 sp, gr, ohm, rho
X
292 43019308380000 WALL-FEDERAL 1 TEXAS O&G CORP 1/8/1983 39.3853543 -109.1998565
293 43019308410000 BAUMGARTNER-FEDERAL2
TXO PROD CORP 11/10/1981 39.3821913 -109.2220326
294 43019308560000 ARCO-FEDERAL 2 ODEGARDRESOURCES
5/18/1982 39.4556269 -109.239471
295 43019308570000 CALLISTER-FEDERAL 1 TXO PROD CORP 8/2/1983 39.3998039 -109.2158323
296 43019308590000 LAUCK-FEDERAL 1 TXO PROD CORP 6/23/1983 39.3893942 -109.1802005
297 43019309910000 FEDERAL 43-7 FORTUNE OIL COMPANY
10/14/1982 39.4281011 -109.1972623
298 43019310300000 FEDERAL 31-1 FORTUNE OIL COMPANY
8/31/1983 39.4393767 -109.2111673
299 43019310340000 TXO-USA-A 1 TXO PROD CORP 8/23/1983 39.3949918 -109.1880701
300 43019310350000 FEDERAL 42-8 FORTUNE OIL COMPANY
11/11/1983 39.4245668 -109.1765746
301 43019310460000 FEDERAL 34-31 FORTUNE OIL COMPANY
10/4/1983 39.4537185 -109.2069808
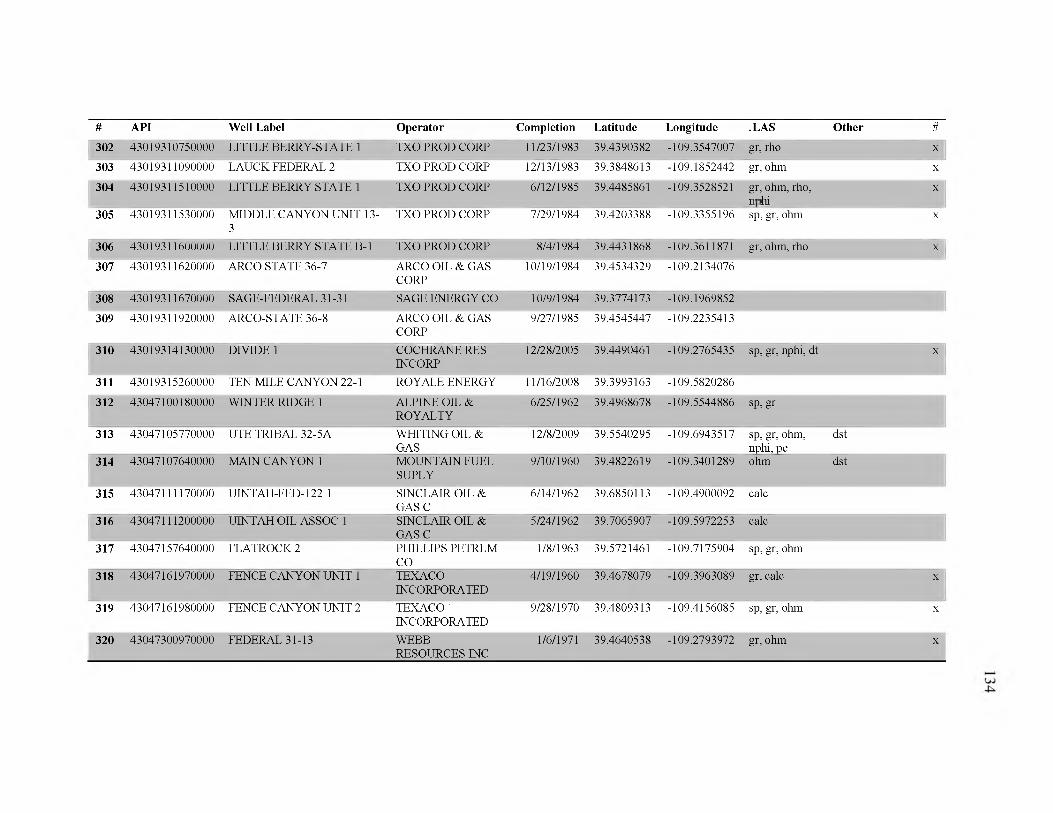
# API Well Label Operator Completion Latitude Longitude .LAS Other #
302 43019310750000 LITTLE BERRY-STATE 1 TXO PROD CORP 11/23/1983 39.4390382 -109.3547007 gr, rho X
303 43019311090000 LAUCK FEDERAL 2 TXO PROD CORP 12/13/1983 39.3848613 -109.1852442 gr, ohm X
304 43019311510000 LITTLE BERRY STATE 1 TXO PROD CORP 6/12/1985 39.4485861 -109.3528521 gr, ohm, rho, nphi
X
305 43019311530000 MIDDLE CANYON UNIT 13- 3
TXO PROD CORP 7/29/1984 39.4203388 -109.3355196 sp, gr, ohm X
306 43019311600000 LITTLE BERRY STATE B-l TXO PROD CORP 8/4/1984 39.4431868 -109.3611871 gr, ohm, rho X
307 43019311620000 ARCO STATE 36-7 ARCO OIL & GAS CORP
10/19/1984 39.4534329 -109.2134076
308 43019311670000 SAGE-FEDERAL 31-31 SAGE ENERGY CO 10/9/1984 39.3774173 -109.1969852
309 43019311920000 ARCO-STATE 36-8 ARCO OIL & GAS CORP
9/27/1985 39.4545447 -109.2235413
310 43019314130000 DIVIDE 1 COCHRANE RES INCORP
12/28/2005 39.4490461 -109.2765435 sp, gr, nphi, dt X
311 43019315260000 TEN MILE CANYON 22-1 ROYALE ENERGY 11/16/2008 39.3993163 -109.5820286
312 43047100180000 WINTER RIDGE 1 ALPINE OIL & ROYALTY
6/25/1962 39.4968678 -109.5544886 sp, gr
313 43047105770000 UTE TRIBAL 32-5A WHITING OIL & GAS
12/8/2009 39.5540295 -109.6943517 sp, gr, ohm, nphi, pe
dst
314 43047107640000 MAIN CANYON 1 MOUNTAIN FUEL SUPLY
9/10/1960 39.4822619 -109.3401289 ohm dst
315 43047111170000 UINTAH-FED-122 1 SINCLAIR OIL & GAS C
6/14/1962 39.6850113 -109.4900092 calc
316 43047111200000 UINTAH OIL ASSOC 1 SINCLAIR OIL & GAS C
5/24/1962 39.7065907 -109.5972253 calc
317 43047157640000 FLATROCK 2 PHILLIPS PETRLM CO
1/8/1963 39.5721461 -109.7175904 sp, gr, ohm
318 43047161970000 FENCE CANYON UNIT 1 TEXACOINCORPORATED
4/19/1960 39.4678079 -109.3963089 gr, calc X
319 43047161980000 FENCE CANYON UNIT 2 TEXACOINCORPORATED
9/28/1970 39.4809313 -109.4156085 sp, gr, ohm X
320 43047300970000 FEDERAL 31-13 WEBBRESOURCES INC
1/6/1971 39.4640538 -109.2793972 gr, ohm X
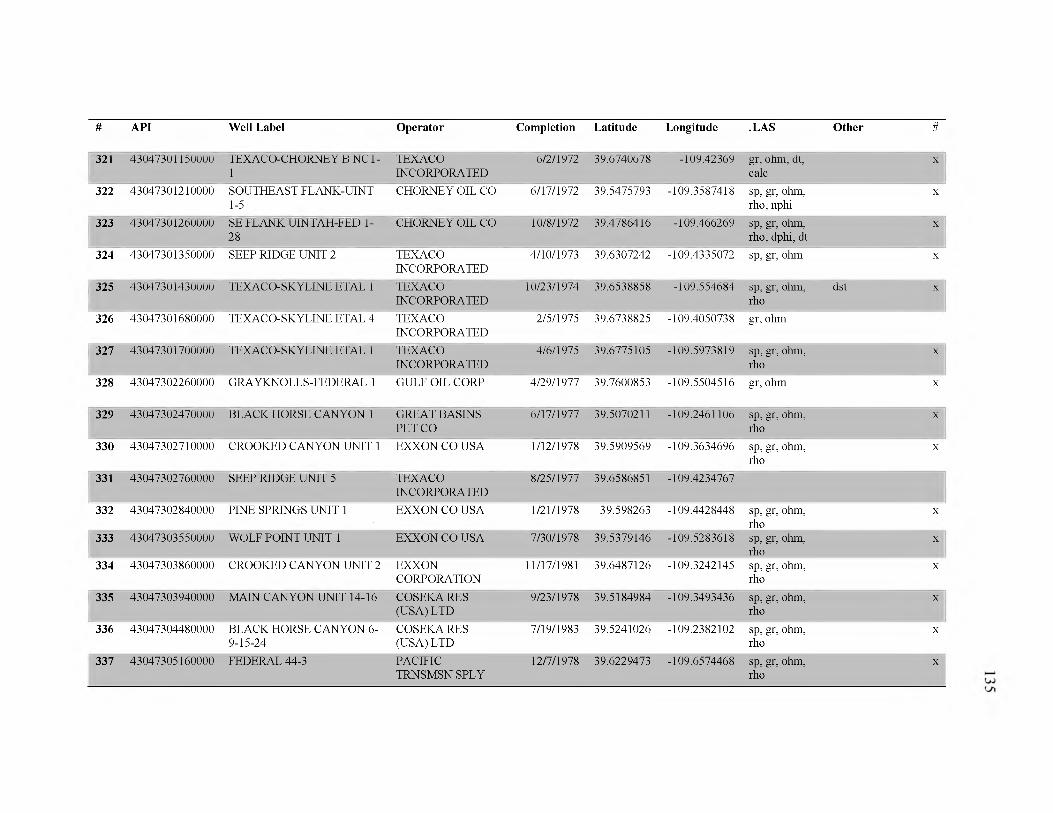
# API Well Label Operator Completion Latitude Longitude .LAS Other #
321 43047301150000 TEXACO-CHORNEY B NCT- 1
TEXACOINCORPORATED
6/2/1972 39.6740678 -109.42369 gr, ohm, dt, calc
X
322 43047301210000 SOUTHEAST FLANK-UINT 1-5
CHORNEY OIL CO 6/17/1972 39.5475793 -109.3587418 sp, gr, ohm, rho, nphi
X
323 43047301260000 SE FLANK UINTAH-FED 1- 28
CHORNEY OIL CO 10/8/1972 39.4786416 -109.466269 sp, gr, ohm, rho, dphi, dt
X
324 43047301350000 SEEP RIDGE UNIT 2 TEXACOINCORPORATED
4/10/1973 39.6307242 -109.4335072 sp, gr, ohm X
325 43047301430000 TEX AC O- SKYLINE ETAL 1 TEXACOINCORPORATED
10/23/1974 39.6538858 -109.554684 sp, gr, ohm, rho
dst x
326 43047301680000 TEX AC O- SKYLINE ETAL 4 TEXACOINCORPORATED
2/5/1975 39.6738825 -109.4050738 gr, ohm
327 43047301700000 TEX AC O- SKYLINE ETAL 1 TEXACOINCORPORATED
4/6/1975 39.6775105 -109.5973819 sp, gr, ohm, rho
X
328 43047302260000 GRAYKNOLLS-FEDERAL 1 GULF OIL CORP 4/29/1977 39.7600853 -109.5504516 gr, ohm X
329 43047302470000 BLACK HORSE CANYON 1 GREAT BASINS PET CO
6/17/1977 39.5070211 -109.2461106 sp, gr, ohm, rho
X
330 43047302710000 CROOKED CANYON UNIT 1 EXXON CO USA 1/12/1978 39.5909569 -109.3634696 sp, gr, ohm, rho
X
331 43047302760000 SEEP RIDGE UNIT 5 TEXACOINCORPORATED
8/25/1977 39.6586851 -109.4234767
332 43047302840000 PINE SPRINGS UNIT 1 EXXON CO USA 1/21/1978 39.598263 -109.4428448 sp, gr, ohm, rho
X
333 43047303550000 WOLF POINT UNIT 1 EXXON CO USA 7/30/1978 39.5379146 -109.5283618 sp, gr, ohm, rho
X
334 43047303860000 CROOKED CANYON UNIT 2 EXXONCORPORATION
11/17/1981 39.6487126 -109.3242145 sp, gr, ohm, rho
X
335 43047303940000 MAIN CANYON UNIT 14-16 COSEKA RES (USA) LTD
9/23/1978 39.5184984 -109.3493436 sp, gr, ohm, rho
X
336 43047304480000 BLACK HORSE CANYON 6- 9-15-24
COSEKA RES (USA) LTD
7/19/1983 39.5241026 -109.2382102 sp, gr, ohm, rho
X
337 43047305160000 FEDERAL 44-3 PACIFIC TRNSMSN SPLY
12/7/1978 39.6229473 -109.6574468 sp, gr, ohm, rho
X
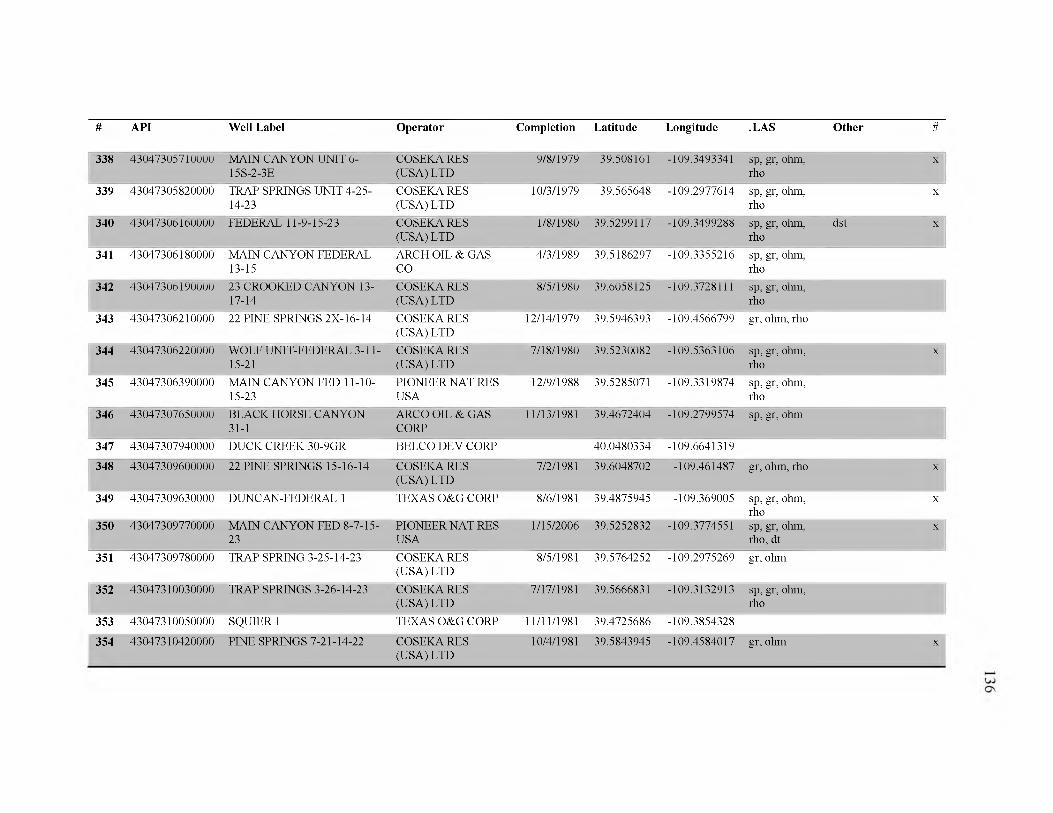
# API Well Label Operator Completion Latitude Longitude .LAS Other #
338 43047305710000 MAIN CANYON UNIT 6- 15S-2-3E
COSEKA RES (USA) LTD
9/8/1979 39.508161 -109.3493341 sp, gr, ohm, rho
X
339 43047305820000 TRAP SPRINGS UNIT 4-25- 14-23
COSEKA RES (USA) LTD
10/3/1979 39.565648 -109.2977614 sp, gr, ohm, rho
X
340 43047306160000 FEDERAL 11-9-15-23 COSEKA RES (USA) LTD
1/8/1980 39.5299117 -109.3499288 sp, gr, ohm, rho
dst x
341 43047306180000 MAIN CANYON FEDERAL 13-15
ARCH OIL & GAS CO
4/3/1989 39.5186297 -109.3355216 sp, gr, ohm, rho
342 43047306190000 23 CROOKED CANYON 13- 17-14
COSEKA RES (USA) LTD
8/5/1980 39.6058125 -109.3728111 sp, gr, ohm, rho
343 43047306210000 22 PINE SPRINGS 2X-16-14 COSEKA RES (USA) LTD
12/14/1979 39.5946393 -109.4566799 gr, ohm, rho
344 43047306220000 WOLF UNIT-FEDERAL 3-11- 15-21
COSEKA RES (USA) LTD
7/18/1980 39.5230082 -109.5363106 sp, gr, ohm, rho
X
345 43047306390000 MAIN CANYON FED 11-10- 15-23
PIONEER NAT RES USA
12/9/1988 39.5285071 -109.3319874 sp, gr, ohm, rho
346 43047307650000 BLACK HORSE CANYON 31-1
ARCO OIL & GAS CORP
11/13/1981 39.4672404 -109.2799574 sp, gr, ohm
347 43047307940000 DUCK CREEK 30-9GR BELCO DEV CORP 40.0480334 -109.6641319
348 43047309600000 22 PINE SPRINGS 15-16-14 COSEKA RES (USA) LTD
7/2/1981 39.6048702 -109.461487 gr, ohm, rho X
349 43047309630000 DUNCAN-FEDERAL 1 TEXAS O&G CORP 8/6/1981 39.4875945 -109.369005 sp, gr, ohm, rho
X
350 43047309770000 MAIN CANYON FED 8-7-15- 23
PIONEER NAT RES USA
1/15/2006 39.5252832 -109.3774551 sp, gr, ohm, rho, dt
X
351 43047309780000 TRAP SPRING 3-25-14-23 COSEKA RES (USA) LTD
8/5/1981 39.5764252 -109.2975269 gr, ohm
352 43047310030000 TRAP SPRINGS 3-26-14-23 COSEKA RES (USA) LTD
7/17/1981 39.5666831 -109.3132913 sp, gr, ohm, rho
353 43047310050000 SQUIER 1 TEXAS O&G CORP 11/11/1981 39.4725686 -109.3854328
354 43047310420000 PINE SPRINGS 7-21-14-22 COSEKARES 10/4/1981 39.5843945 -109.4584017 gr, ohm x(USA) LTD
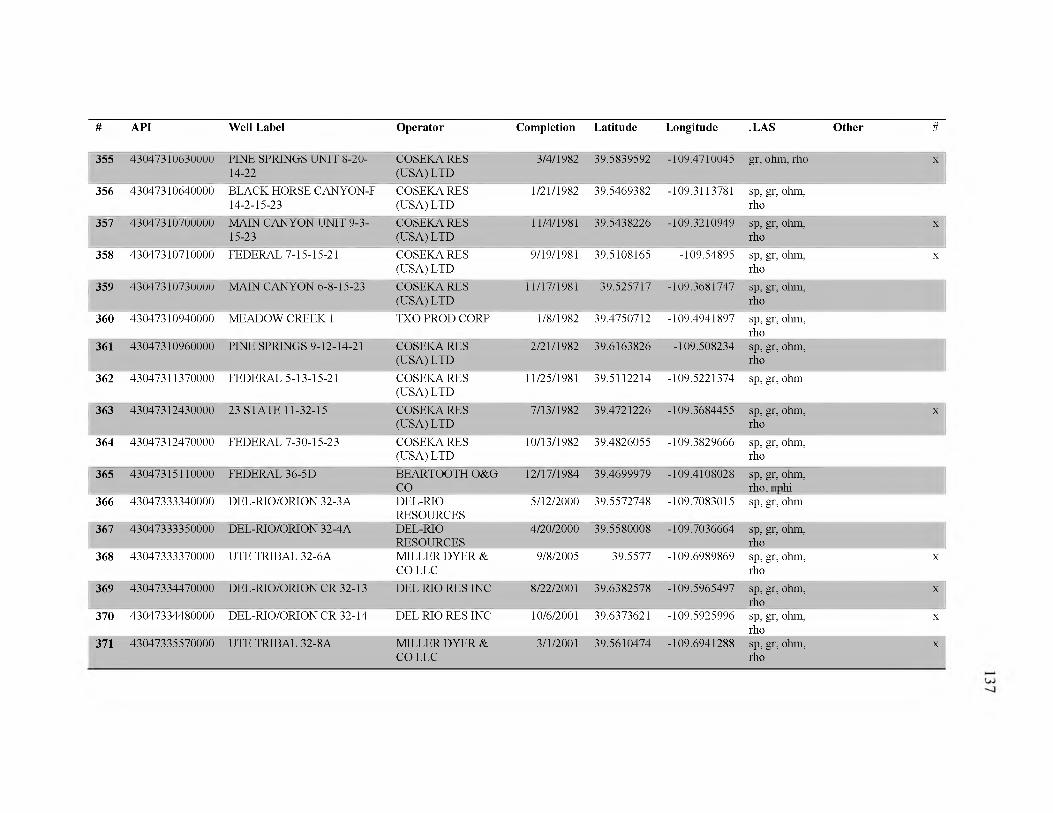
# API Well Label Operator Completion Latitude Longitude .LAS Other #
355 43047310630000 PINE SPRINGS UNIT 8-20- 14-22
COSEKA RES (USA) LTD
3/4/1982 39.5839592 -109.4710045 gr, ohm, rho X
356 43047310640000 BLACK HORSE CANYON-F 14-2-15-23
COSEKA RES (USA) LTD
1/21/1982 39.5469382 -109.3113781 sp, gr, ohm, rho
357 43047310700000 MAIN CANYON UNIT 9-3- 15-23
COSEKA RES (USA) LTD
11/4/1981 39.5438226 -109.3210949 sp, gr, ohm, rho
X
358 43047310710000 FEDERAL 7-15-15-21 COSEKA RES (USA) LTD
9/19/1981 39.5108165 -109.54895 sp, gr, ohm, rho
X
359 43047310730000 MAIN CANYON 6-8-15-23 COSEKA RES (USA) LTD
11/17/1981 39.525717 -109.3681747 sp, gr, ohm, rho
360 43047310940000 MEADOW CREEK 1 TXO PROD CORP 1/8/1982 39.4750712 -109.4941897 sp, gr, ohm, rho
361 43047310960000 PINE SPRINGS 9-12-14-21 COSEKA RES (USA) LTD
2/21/1982 39.6163826 -109.508234 sp, gr, ohm, rho
362 43047311370000 FEDERAL 5-13-15-21 COSEKA RES (USA) LTD
11/25/1981 39.5112214 -109.5221374 sp, gr, ohm
363 43047312430000 23 STATE 11-32-15 COSEKA RES (USA) LTD
7/13/1982 39.4721226 -109.3684455 sp, gr, ohm, rho
X
364 43047312470000 FEDERAL 7-30-15-23 COSEKA RES (USA) LTD
10/13/1982 39.4826055 -109.3829666 sp, gr, ohm, rho
365 43047315110000 FEDERAL 36-5D BEARTOOTH O&G CO
12/17/1984 39.4699979 -109.4108028 sp, gr, ohm, rho, nphi
366 43047333340000 DEL-RIO/ORION 32-3A DEL-RIORESOURCES
5/12/2000 39.5572748 -109.7083015 sp, gr, ohm
367 43047333350000 DEL-RIO/ORION 32-4A DEL-RIORESOURCES
4/20/2000 39.5580008 -109.7036664 sp, gr, ohm, rho
368 43047333370000 UTE TRIBAL 32-6A MILLER DYER & CO LLC
9/8/2005 39.5577 -109.6989869 sp, gr, ohm, rho
X
369 43047334470000 DEL-RIO/ORION CR 32-13 DEL RIO RES INC 8/22/2001 39.6382578 -109.5965497 sp, gr, ohm, rho
X
370 43047334480000 DEL-RIO/ORION CR 32-14 DEL RIO RES INC 10/6/2001 39.6373621 -109.5925996 sp, gr, ohm, rho
X
371 43047335570000 UTE TRIBAL 32-8A MILLER DYER & 3/1/2001 39.5610474 -109.6941288 sp, gr, ohm, xCO LLC rho
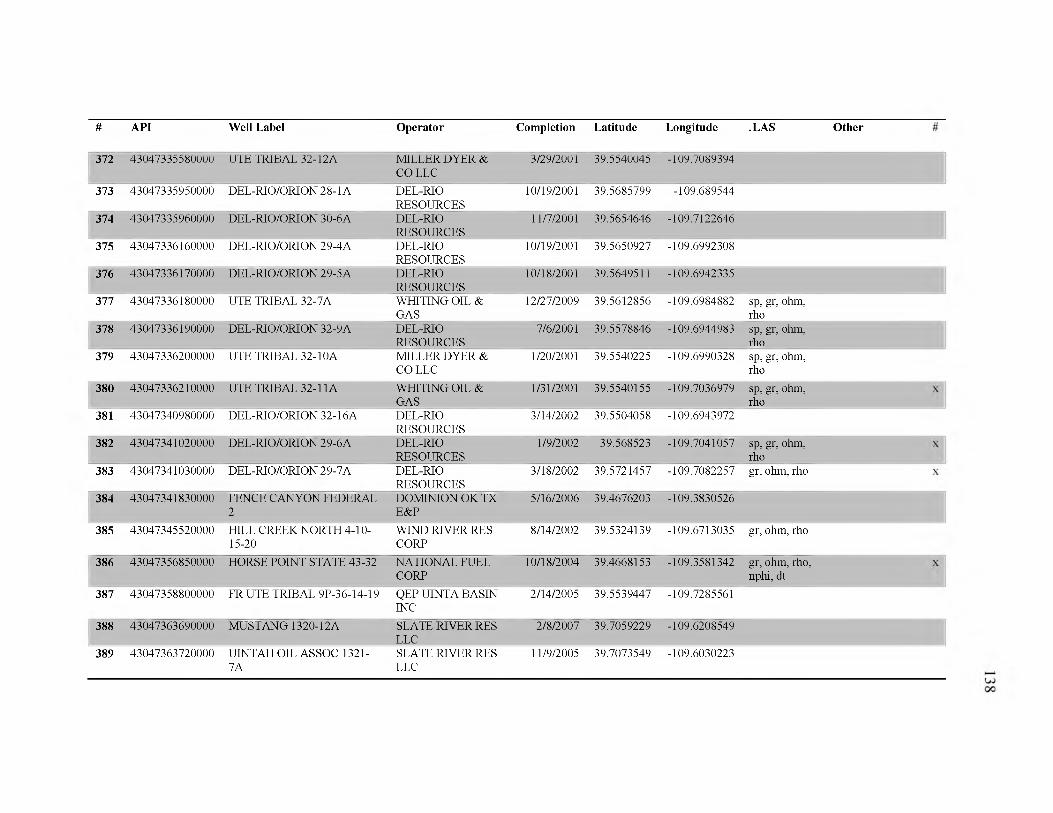
#
372
373
374
375
376
377
378
379
380
381
382
383
384
385
386
387
388
389
API Well Label Operator Completion Latitude Longitude .LAS Other
43047335580000 UTE TRIBAL 32-12A MILLER DYER & COLLC
3/29/2001 39.5540045 -109.7089394
43047335950000 DEL-RIO/ORION28-1A DEL-RIORESOURCES
10/19/2001 39.5685799 -109.689544
43047335960000 DEL-RIO/ORION 30-6A DEL-RIORESOURCES
11/7/2001 39.5654646 -109.7122646
43047336160000 DEL-RIO/ORION 2 9-4 A DEL-RIORESOURCES
10/19/2001 39.5650927 -109.6992308
43047336170000 DEL-RIO/ORION 2 9-5 A DEL-RIORESOURCES
10/18/2001 39.5649511 -109.6942335
sp, gr, ohm, rho
43047336180000 UTE TRIBAL 32-7A WHITING OIL & GAS
12/27/2009 39.5612856 -109.6984882
sp, gr, ohm, rho
43047336190000 DEL-RIO/ORION 32-9A DEL-RIORESOURCES
7/6/2001 39.5578846 -109.6944983
1/20/2001 39.5540225 -109.6990328 sp, gr, ohm,rho
43047336200000 UTE TRIBAL 32-10A MILLER DYER & COLLC
sp, gr, ohm, rho
43047336210000 UTE TRIBAL 32-11A WHITING OIL & GAS
1/31/2001 39.5540155 -109.7036979
43047340980000 DEL-RIO/ORION 32-16A DEL-RIORESOURCES
3/14/2002 39.5504058 -109.6943972
43047341020000 DEL-RIO/ORION 2 9-6 A DEL-RIORESOURCES
1/9/2002 39.568523 -109.7041057 sp, gr, ohm, rho
43047341030000 DEL-RIO/ORION 2 9-7 A DEL-RIORESOURCES
3/18/2002 39.5721457 -109.7082257 gr, ohm, rho
43047341830000 FENCE CANYON FEDERAL 2
DOMINION OK TX E&P
5/16/2006 39.4676203 -109.3830526
43047345520000 HILL CREEK NORTH 4-10- 15-20
WIND RIVER RES CORP
8/14/2002 39.5324139 -109.6713035 gr, ohm, rho
43047356850000 HORSE POINT STATE 43-32 NATIONAL FUEL CORP
10/18/2004 39.4668153 -109.3581342 gr, ohm, rho, nphi, dt
43047358800000 FRUTE TRIBAL 9P-36-14-19 QEP UINTA BASIN INC
2/14/2005 39.5539447 -109.7285561
43047363690000 MUSTANG 1320-12A SLATE RIVER RES LLC
2/8/2007 39.7059229 -109.6208549
43047363720000 UINTAH OIL ASSOC 1321- 7A
SLATE RIVER RES LLC
11/9/2005 39.7073549 -109.6030223
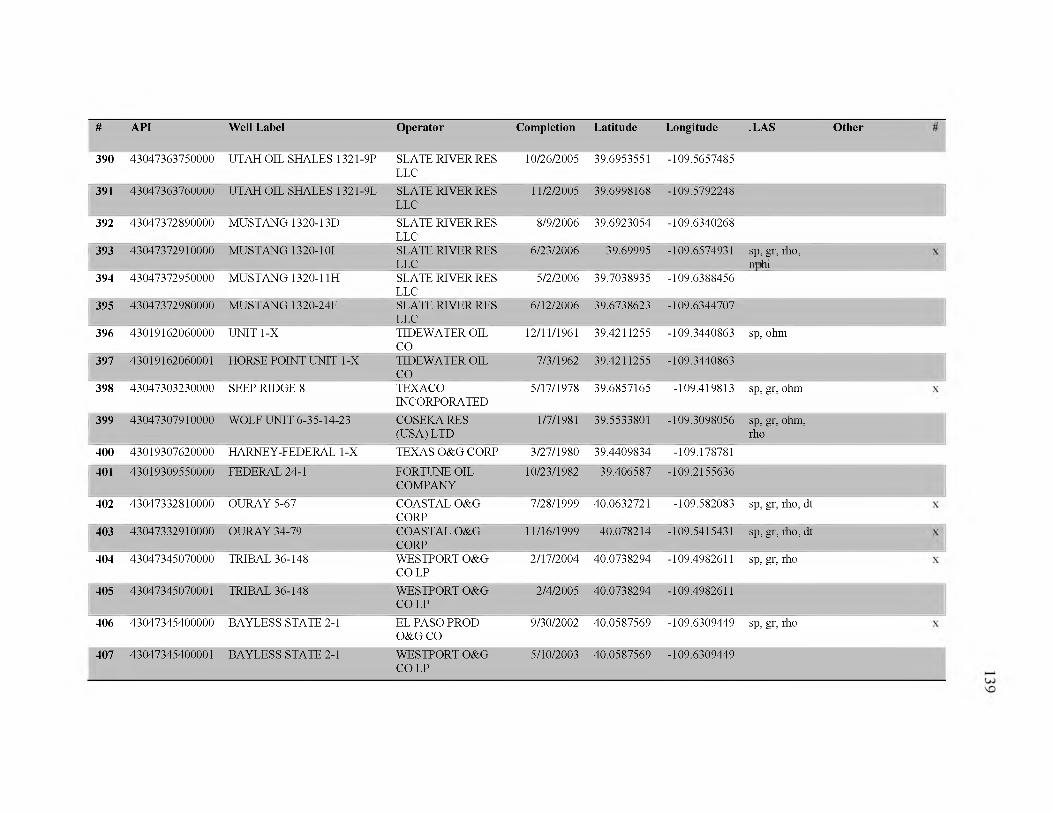
#
390
391
392
393
394
395
396
397
398
399
400
401
402
403
404
405
406
407
43047363750000 UTAH OIL SHALES 1321-9P SLATE RIVER RES 10/26/2005 39.6953551 -109.5657485LLC
43047363760000 UTAH OIL SHALES 1321-9L SLATE RIVER RES 11/2/2005 39.6998168 -109.5792248LLC
43047372890000 MUSTANG 1320-13D SLATE RIVER RES 8/9/2006 39.6923054 -109.6340268LLC
43047372910000 MUSTANG 1320-101 SLATE RIVER RES 6/23/2006 39.69995 -109.6574931 sp, gr, rho,LLC nphi
43047372950000 MUSTANG 1320-11H SLATE RIVER RES 5/2/2006 39.7038935 -109.6388456LLC
43047372980000 MUSTANG 1320-24E SLATE RIVER RES 6/12/2006 39.6738623 -109.6344707LLC
43019162060000 UNIT 1-X TIDEWATER OIL 12/11/1961 39.4211255 -109.3440863 sp, ohmCO
43019162060001 HORSE POINT UNIT 1-X TIDEWATER OIL 7/3/1962 39.4211255 -109.3440863CO
43047303230000 SEEP RIDGE 8 TEXACO 5/17/1978 39.6857165 -109.419813 sp, gr, ohmINCORPORATED
43047307910000 WOLF UNIT 6-35-14-23 COSEKARES 1/7/1981 39.5533801 -109.3098056 sp, gr, ohm,(USA) LTD rho
43019307620000 HARNEY-FEDERAL 1-X TEXAS O&GCORP 3/27/1980 39.4409834 -109.178781
API Well Label Operator Completion Latitude Longitude .LAS Other
43019309550000 FEDERAL 24-1 FORTUNE OIL 10/23/1982 39.406587 -109.2155636COMPANY
43047332810000 OURAY 5-67 COASTAL O&G 7/28/1999 40.0632721 -109.582083 sp, gr, rho, dtCORP
43047332910000 OURAY 34-79 COASTAL O&G 11/16/1999 40.078214 -109.5415431 sp, gr, rho, dtCORP
43047345070000 TRIBAL 36-148 WESTPORT O&G 2/17/2004 40.0738294 -109.4982611 sp, gr, rhoCO LP
43047345070001 TRIBAL 36-148 WESTPORT O&G 2/4/2005 40.0738294 -109.4982611CO LP
43047345400000 BAYLESS STATE 2-1 EL PASO PROD 9/30/2002 40.0587569 -109.6309449 sp, gr, rhoO&G CO
43047345400001 BAYLESS STATE 2-1 WESTPORT O&G CO LP
5/10/2003 40.0587569 -109.6309449
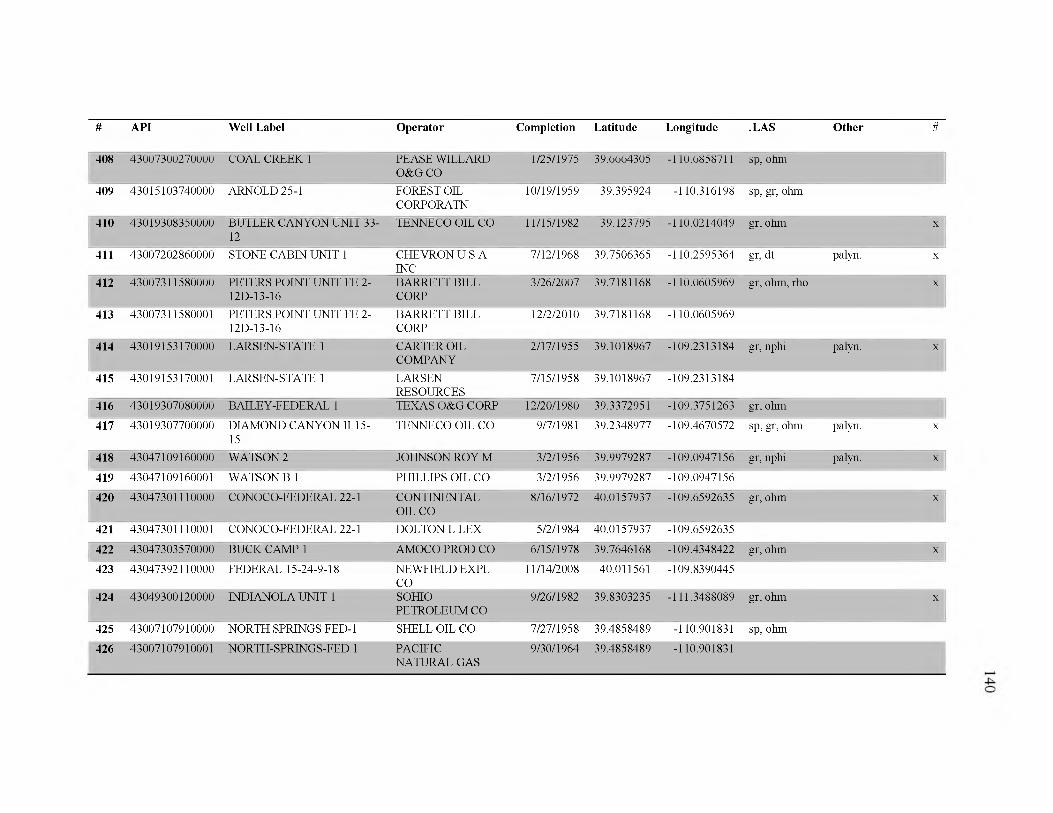
# API Well Label Operator Completion Latitude Longitude .LAS Other #
408 43007300270000 COAL CREEK 1 PEASE WILLARD O&G CO
1/25/1975 39.6664305 -110.6858711 sp, ohm
409 43015103740000 ARNOLD 25-1 FOREST OIL CORPORATN
10/19/1959 39.395924 -110.316198 sp, gr, ohm
410 43019308350000 BUTLER CANYON UNIT 33- 12
TENNECO OIL CO 11/15/1982 39.123795 -110.0214049 gr, ohm X
411 43007202860000 STONE CABIN UNIT 1 CHEVRON U S A INC
7/12/1968 39.7506365 -110.2595364 gr, dt palyn. X
412 43007311580000 PETERS POINT UNIT FE 2- 12D-13-16
BARRETT BILL CORP
3/26/2007 39.7181168 -110.0605969 gr, ohm, rho X
413 43007311580001 PETERS POINT UNIT FE 2- 12D-13-16
BARRETT BILL CORP
12/2/2010 39.7181168 -110.0605969
414 43019153170000 LARSEN-STATE 1 CARTER OIL COMPANY
2/17/1955 39.1018967 -109.2313184 gr, nphi palyn. X
415 43019153170001 LARSEN-STATE 1 LARSENRESOURCES
7/15/1958 39.1018967 -109.2313184
416 43019307080000 BAILEY-FEDERAL 1 TEXAS O&G CORP 12/20/1980 39.3372951 -109.3751263 gr, ohm
417 43019307700000 DIAMOND CANYON II 15- 15
TENNECO OIL CO 9/7/1981 39.2348977 -109.4670572 sp, gr, ohm palyn. X
418 43047109160000 WATSON 2 JOHNSON ROY M 3/2/1956 39.9979287 -109.0947156 gr, nphi palyn. X
419 43047109160001 WATSON B 1 PHILLIPS OIL CO 3/2/1956 39.9979287 -109.0947156
420 43047301110000 CONOCO-FEDERAL 22-1 CONTINENTAL OIL CO
8/16/1972 40.0157937 -109.6592635 gr, ohm X
421 43047301110001 CONOCO-FEDERAL 22-1 DOLTON L LEX 5/2/1984 40.0157937 -109.6592635
422 43047303570000 BUCK CAMP 1 AMOCO PROD CO 6/15/1978 39.7646168 -109.4348422 gr, ohm X
423 43047392110000 FEDERAL 15-24-9-18 NEWFIELD EXPL CO
11/14/2008 40.011561 -109.8390445
424 43049300120000 INDIANOLA UNIT 1 SOHIOPETROLEUM CO
9/26/1982 39.8303235 -111.3488089 gr, ohm X
425 43007107910000 NORTH SPRINGS FED-1 SHELL OIL CO 7/27/1958 39.4858489 -110.901831 sp, ohm
426 43007107910001 NORTH-SPRINGS-FED 1 PACIFIC NATURAL GAS
9/30/1964 39.4858489 -110.901831
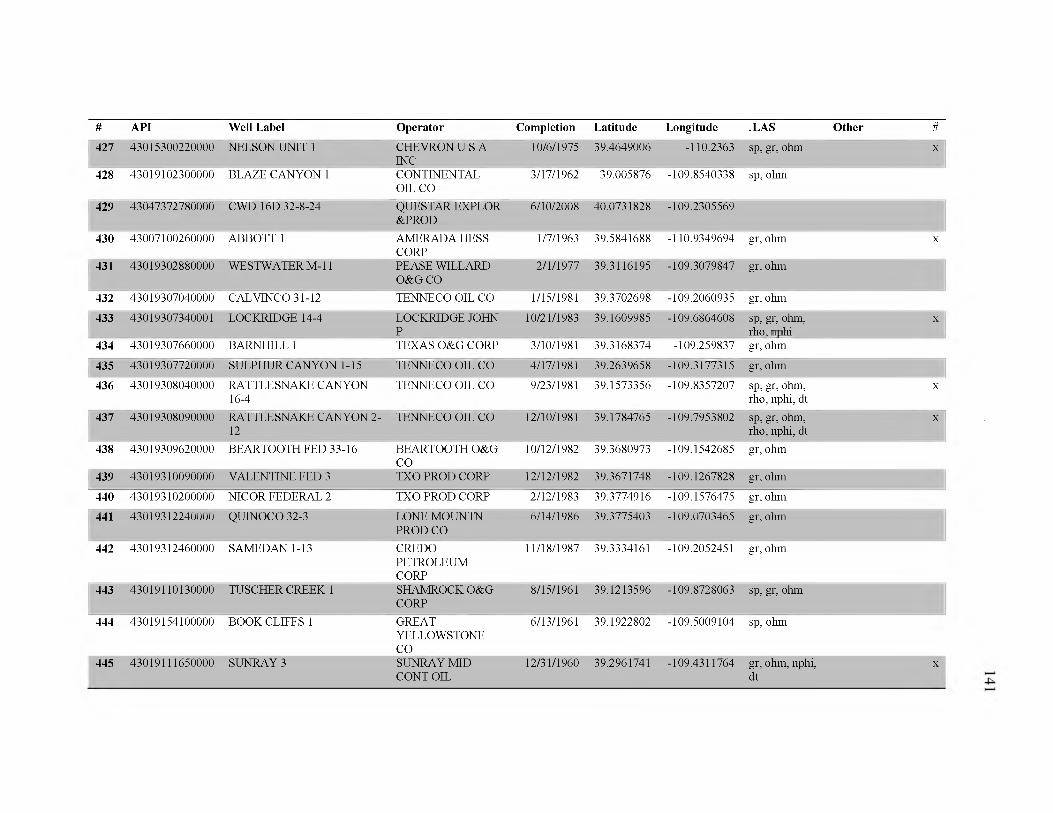
# API Well Label Operator Completion Latitude Longitude .LAS Other #
427 43015300220000 NELSON UNIT 1 CHEVRON U S A INC
10/6/1975 39.4649006 -110.2363 sp, gr, ohm X
428 43019102300000 BLAZE CANYON 1 CONTINENTAL OIL CO
3/17/1962 39.005876 -109.8540338 sp, ohm
429 43047372780000 CWD 16D 32-8-24 QUESTAR EXPLOR &PROD
6/10/2008 40.0731828 -109.2305569
430 43007100260000 ABBOTT 1 AMERADA HESS CORP
1/7/1963 39.5841688 -110.9349694 gr, ohm X
431 43019302880000 WESTWATER M -ll PEASE WILLARD O&G CO
2/1/1977 39.3116195 -109.3079847 gr, ohm
432 43019307040000 CALVINCO 31-12 TENNECO OIL CO 1/15/1981 39.3702698 -109.2060935 gr, ohm
433 43019307340001 LOCKRIDGE 14-4 LOCKRIDGE JOHN P
10/21/1983 39.1609985 -109.6864608 sp, gr, ohm, rho, nphi
X
434 43019307660000 BARNHILL 1 TEXAS O&G CORP 3/10/1981 39.3168374 -109.259837 gr, ohm
435 43019307720000 SULPHUR CANYON 1-15 TENNECO OIL CO 4/17/1981 39.2639658 -109.3177315 gr, ohm
436 43019308040000 RATTLESNAKE CANYON 16-4
TENNECO OIL CO 9/23/1981 39.1573356 -109.8357207 sp, gr, ohm, rho, nphi, dt
X
437 43019308090000 RATTLESNAKE CANYON 2- 12
TENNECO OIL CO 12/10/1981 39.1784765 -109.7953802 sp, gr, ohm, rho, nphi, dt
X
438 43019309620000 BEARTOOTH FED 33-16 BEARTOOTH O&G CO
10/12/1982 39.3680973 -109.1542685 gr, ohm
439 43019310090000 VALENTINE FED 3 TXO PROD CORP 12/12/1982 39.3671748 -109.1267828 gr, ohm
440 43019310200000 NIC OR FEDERAL 2 TXO PROD CORP 2/12/1983 39.3774916 -109.1576475 gr, ohm
441 43019312240000 QUINOCO 32-3 LONE MOUNTN PROD CO
6/14/1986 39.3775403 -109.0703465 gr, ohm
442 43019312460000 SAMEDAN 1-13 CREDOPETROLEUMCORP
11/18/1987 39.3334161 -109.2052451 gr, ohm
443 43019110130000 TUSCHER CREEK 1 SHAMROCK O&G CORP
8/15/1961 39.1213596 -109.8728063 sp, gr, ohm
444 43019154100000 BOOK CLIFFS 1 GREATYELLOWSTONECO
6/13/1961 39.1922802 -109.5009104 sp, ohm
445 43019111650000 SUNRAY3 SUNRAYMID CONT OIL
12/31/1960 39.2961741 -109.4311764 gr, ohm, nphi, dt
X
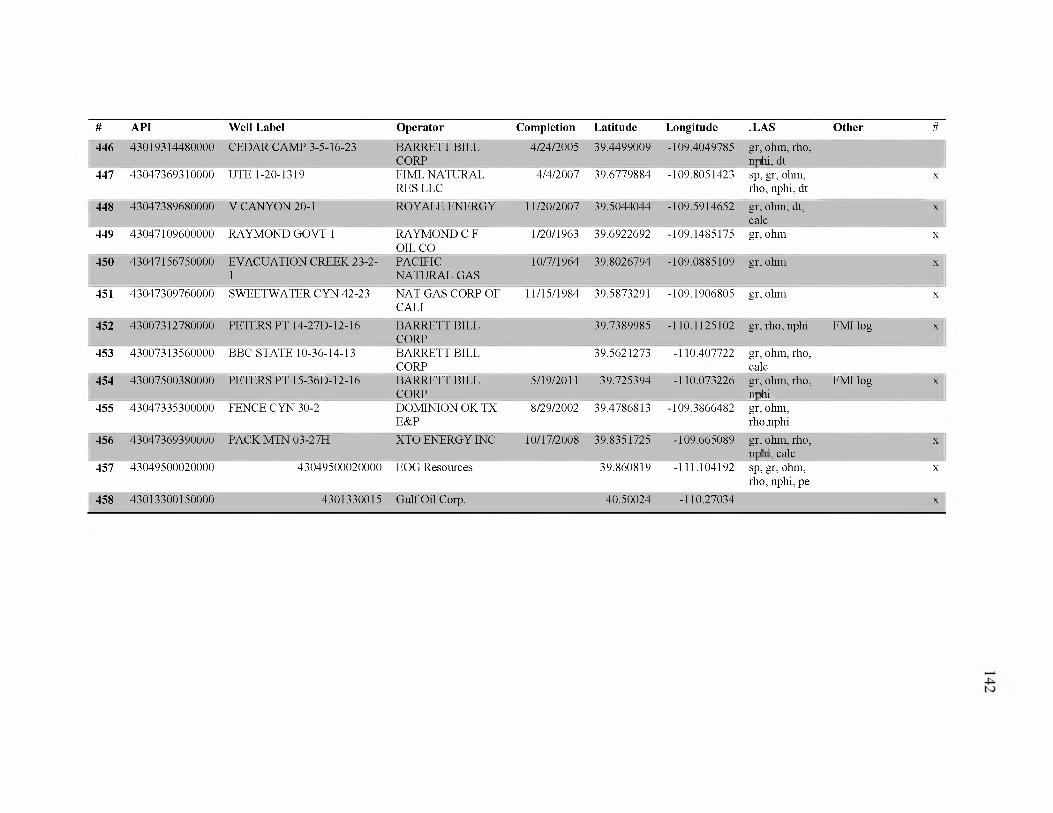
# API Well Label Operator Completion Latitude Longitude .LAS Other #
446 43019314480000 CEDAR CAMP 3-5-16-23 BARRETT BILL CORP
4/24/2005 39.4499009 -109.4049785 gr, ohm, rho, nphi, dt
447 43047369310000 UTE 1-20-1319 FIML NATURAL RES LLC
4/4/2007 39.6779884 -109.8051423 sp, gr, ohm, rho, nphi, dt
X
448 43047389680000 V CANYON 20-1 ROYALE ENERGY 11/20/2007 39.5044044 -109.5914652 gr, ohm, dt, calc
X
449 43047109600000 RAYMOND GOVT 1 RAYMOND C F OIL CO
1/20/1963 39.6922692 -109.1485175 gr, ohm X
450 43047156750000 EVACUATION CREEK 23-2- 1
PACIFIC NATURAL GAS
10/7/1964 39.8026794 -109.0885109 gr, ohm X
451 43047309760000 SWEETWATER CYN 42-23 NAT GAS CORP OF CALI
11/15/1984 39.5873291 -109.1906805 gr, ohm X
452 43007312780000 PETERS PT 14-27D-12-16 BARRETT BILL CORP
39.7389985 -110.1125102 gr, rho, nphi FMI log X
453 43007313560000 BBC STATE 10-36-14-13 BARRETT BILL CORP
39.5621273 -110.407722 gr, ohm, rho, calc
454 43007500380000 PETERS PT 15-36D-12-16 BARRETT BILL CORP
5/19/2011 39.725394 -110.073226 gr, ohm, rho, nphi
FMI log X
455 43047335300000 FENCE CYN 30-2 DOMINION OK TX E&P
8/29/2002 39.4786813 -109.3866482 gr, ohm, rho,nphi
456 43047369390000 PACK MTN 03-27H XTO ENERGY INC 10/17/2008 39.8351725 -109.665089 gr, ohm, rho, nphi, calc
X
457 43049500020000 43049500020000 EOG Resources 39.860819 -111.104192 sp, gr, ohm, rho, nphi, pe
X
458 43013300150000 4301330015 Gulf Oil Corp. 40.50024 -110.27034 X
APPENDIX B
REVISED LOWER MANCOS STRATIGRAPHY
This study has identified a number of chronostratigraphic stratal relationships
which have not been recognized in the previous literature. The Ferron Sandstone, which
represents the most significant sandstone-rich, progradational, delta front deposit of the
Turonian and Coniacian, has been correlated with relatively low gamma ray facies of the
distal Lower Blue Gate (Figures 19 and 21). These low gamma ray strata correspond
with sandstone rich, siltstone heterolith (facies 9 of Horton, 2012) likely sourced from a
strong sediment source along the western margin of the seaway like the Ferron delta. It is
unlikely that a package of sandstone and siltstone this thick (> 500 ft (150 m)) could be
sourced from another feature of the seaway. Underlying these low gamma ray strata are a
number of high gamma ray mudstone units, each about 100 ft (30 m) thick separated by
relatively low gamma ray, coarser-grained facies (Figures 19 and 21). These high
gamma ray mudstone beds are regionally extensive over the eastern 100 mi of the basin
before pinching out to the east (Figure 19). These mudstone beds correspond to four
sequences, which each step dominantly shoreward (retrogradational), and stack to form a
transgressive and a highstand sequence set. The high gamma ray shale interval of this
lower TSS correspond with the Juana Lopez of Molenaar and Cobban (1991). This same
interval appears to be chronostratigraphically equivalent with the Frontier Formation of

the northern Uinta Basin (Figures 20 and 21). The high gamma ray interval identified by
Molenaar and Cobban as the Juana Lopez is nearly morphologically identical to other
high gamma ray shale beds of the lowermost Blue Gate.
In contrast to the stratigraphic relationships described above, previous correlations
have identified the Juana Lopez member as synchronous (Molenaar and Cobban, 1991),
and potentially overlying (Gardner, 1995b) portions of the Ferron Sandstone and Frontier
Formation. These correlations are based largely on biostratigraphy (Fouch et al., 1983;
Molenaar and Cobban, 1991). In addition, Molenaar and Cobban (1991) mapped cuesta
forming outcrops of marine shale with thin, platy, very fine-grained interbedded
sandstone previously identified as Ferron Sandstone, instead as Juana Lopez. However,
the exact nature of the stratigraphic relationship between the Juana Lopez, Ferron
Sandstone, and Frontier Formation, particularly the transition from the Juana Lopez to the
east and the Ferron to the west, is not clearly defined by Molenaar and Cobban (1991).
A number of mitigating factors should be considered in order to reconcile new
log-based correlations with previous stratigraphy. The Ferron delta system varies in age
along the margin of the Western Interior Seaway, tending to young to the south (Gardner,
1995b), and consists of a number of members, which have been miscorrelated frequently
by workers of different generations and research interests (Ryer, 2004), suggesting some
biostratigraphy may have been miscorrelated (Schwans, 1988). While the Ferron
Sandstone has been extensively subdivided by different workers, the Lower Bluegate and
Juana Lopez shales have seen only limited research, which has been dominantly focused
on the San Juan Basin in New Mexico (e.g., Rankin, 1944; Dane et al., 1966; Pasley et
al., 1993). Given the poor quality and limited thickness of section of marine shale
144

outcrops and the dearth of marker layers in subsurface data from the Mancos Shale, the
miscorrelation of limited section does not seem unreasonable. The similar gamma
signature of multiple shale layers in the subsurface suggests there may be multiple
stratigraphic intervals of highly organic, heterolithic shale matching the lithofacies of the
Juana Lopez Member, which may have been mapped instead as a single unit in the past.
The Juana Lopez has been identified as the muddiest portion of the Western
Interior Seaway. It seems unlikely this would be time correlative to a river-dominated,
lowstand delta like the Ferron, given the tendency for basin floor sand deposition to
correspond with lowstands (Posamentier and Allen, 1993) and shelf edge deltas (Dixon et
al., 2012). Instead the relationship between these two intervals has likely been obscured
by the poor quality of exposures of mud-rich offshore depositional systems. Significant
shifts of shoreline along a shallow ramp and local delta lobe shifting likely create a
complicated and frequently discontinuous stratigraphic record in the Turonian of eastern
Utah.
145
REFERENCES
Abouelresh, M.O., and R.M. Slatt, 2012, Lithofacies and sequence stratigraphy of the BarnettShale in east-central Forth Worth Basin, Texas: AAPG Bulletin, v. 96, p. 1-22, doi: 10.1306/04261110116.
Algeo, T.J., L. Schwark, and J.C. Hower, 2004, High-resolution geochemistry and sequence stratigraphy of the Hushpuckney Shale (Swope Formation, eastern Kansas): implications for climate-environmental dynamics of the Late Pennsylvanian Midcontinent Seaway: Chemical Geology, v. 206, p. 259-288, doi: 10.1016/j.chemgeo.2003.12.028
Allen, J.L. and C.L. Johnson, 2010, Sedimentary facies, paleoenvironments, and relative sea level changes in the John Henry Member, Cretaceous Straight Cliffs Formation, Southern Utah, USA, in S.M. Carney, D.E. Tabet, and C.L. Johnson, eds., Geology of south central Utah: Utah Geological Association Publication 39, p. 225-247.
Allen, J.L. and C.L. Johnson, 2011, Architecture and formation of transgressiveregressive cycles in marginal marine strata of the John Henry Member, Straight Cliffs Formation,Upper Cretaceous of Southern Utah, USA: Sedimentology, v. 58, p. 1486-1513, doi: 10.1111/j 1365-3091.2010.01223.x
Anderson, D.S., and N.B. Harris, 2006, Integrated sequence stratigraphic andgeochemical resource characterization of the Lower Mancos Shale, Uinta Basin, Utah: Utah Geological Survey, Open-File Report 483, 129 p.
Anderson, P.B., and T.A. Ryer, 2004, Regional stratigraphy of the Ferron Sandstone, in T.C. Chidsey, R.D. Adams, and T.H. Morris, eds., Analog for fluvial-deltaic reservoir modeling: Ferron Sandstone of Utah: AAPG Studies in Geology, v. 50, p. 211-224.
Anderson, T., 2012, Eagle Ford Ternary Diagram, In tri-plot_Mineral_types.xls (Ed.), Excel, EGI Internal Report: EGI.
Angulo, S., and L.A. Buatois, 2012, Integrating depositional models, ichnology, and sequence stratigraphy in reservoir characterization: the middle member of the Devonian Carboniferous Bakken Formation of subsurface Saskatchewan revisited: AAPG Bulletin, v. 96, p. 1017-1043, doi: 10.1306/11021111045.
147
Anna, L.O., 2012, West-east lithostratigraphic cross section of Cretaceous rocks fromcentral Utah to western Kansas: U.S. Geological Survey Open-File Report 20121074, 2 sheets.
Aplin, A.C., and J.H.S. MacQuaker, 2011, Mudstone diversity: origins and implications for source, seal, and reservoir properties in petroleum systems: AAPG Bulletin, v. 95, p. 2031-2059, doi: 10.1306/03281110162.
Arthur, M.A., W.A. Dean, and S.O. Schlanger, 1985, Variations in the global carboncycle in the Cretaceous related to climate, volcanism, and changes in atmospheric CO2: Geophysical Monograph, v. 32, p. 504-529.
Arthur, M.A. and S.O. Schlanger, 1979, Cretaceous “ocean anoxic events” as causalfactors in development of reef-reservoired giant oil fields: AAPG Bulletin, v. 63, p. 870-885.
Bann, K.L., and C.R. Fielding, 2004, An integrated ichnological and sedimentological comparison of non-deltaic shoreface and subaqueous delta deposits in Permian reservoir units of Australia, in D. Mcllroy, ed., The application of ichnology to palaeoenvironmental and stratigraphic analysis: The Geological Society, London, SpecialPublications, v. 228, p. 273-310.
Bhattacharya, J.P., and J.A. MacEachern, 2009, Hyperpycnal rivers and prodeltaic shelves in the Cretaceous Seaway of North America: Journal of Sedimentary Research, v. 79, p. 184-209, doi: 10.2110/jsr.2009.026.
Bhuyan, K., and Q.R. Passey, 1994, Clay estimation from GR and neutron-densityporosity logs: Transactions of the SPWLA, 35th Annual Logging Symposium, June 19-22, p. 1-15.
Blakey, R., 2013, http://cpgeosystems.com/images/NAM_key-85Ma_LateK-sm.jpg, accessed 7/17/2013.
Bohacs, K.M., 1998, contrasting expressions of depositional sequences in mudrocks from marine to non marine environs, in J. Schieber, Zimmerle, and P. Sethi, eds.,Shales and Mudstones I, p. 33-78.
Bohacs, K.M., G.J., Grabowski Jr., A.R. Carroll, P.J. Mankiewicz, K.J. Miskell-Gerhardt, J.R. Schwalbach, M.B. Wegner, and J.A. Simo, 2005, Production, destruction, and dilution -the many paths to source rock development, The Deposition of Organic Carbon Rich Sediments: Models, Mechanisms, and Consequences:SEPM Special Publication no. 82, p. 61-101.
Boyce, M. L., and T.R. Carr, 2009, Lithostratigraphy andPetrophysics of the Devonian Marcellus Interval in West Virginia and Southwestern Pennsylvania, 29th Annual
148
GCSSEPM Foundation Bob F. Perkins Research Conference, Houston, TX, http://search.proquest.com/docview/916837583?accountid=14677.
Brett, C.E., and G.C. Baird, 1996, Middle Devonian sedimentary cycles and sequences in the northern Appalachian Basin, in B.J. Witzke, G.A. Ludvigson, and J. Day, eds., Paleozoic Sequence Stratigraphy: View from the North American Craton: GSA Special Paper 306, p. 213-241.
Bruner, K. R., and R. Smosna, 2011, A Comparative Study of the Mississippian Barnett Shale, Fort Worth Basin, and Devonian Marcellus Shale, Appalachian Basin in D. J. Soeder, Ed., National Energy Technology Laboratory: U.S. Department of Energy.
Catuneanu, O. and M. Zecchin, 2013, High-resolution sequence stratigraphy of clastic shelvesll: controls on sequence development: Marine and Petroleum Geology, v. 39, p. 26-38.
Catuneanu, O., V. Abreu, J.P. Bhattacharya, M.D. Blum, R.W. Dalrymple, P.G. Eriksson, C.R. Fielding, W.L. Fisher, W.E. Galloway, M.R. GIbling, K.A. Giles, J.M. Holbrook, R. Jordan, C.G.St.C. Kendall, B. Macurda, O.J. Martinsen, A.D. Miall, J.E. Neal, D.Nummedal, L. Pomar, H.W. Posamentier, B.R. Pratt, J.F. Sarg, K.W. Shanley, R.J.Steel, A. Strasser, M.E. Tucker, and C. Winker, 2009, Towards the standardization of sequence stratigraphy: Earth-Science Reviews, v. 92, p. 1-33.
Chalmers, G.R., R.M. Bustin, and I.M. Power, 2012, Characterization of gas shale pore systems by porosimetry, pycnometry, surface area, and field emission scanning electron microscopy/transmission electron microscopy image analyses: examples from the Barnett, Woodford, Haynesville, Marcellus, and Doig units: AAPG Bulletin, v. 96, p. 1099-1119, doi: 10.1306/10171111052.
Chan, M.A., S.L. Newman, and F.E. May, 1991, Deltaic and shelf deposits in theCretaceous Blackhawk Formation and Mancos Shale, Grand County, Utah: Utah Geological Survey, Miscellaneous Publication 91-6, 83 p.
Cole, R.D., R.G. Young, and G.C. Willis, 1997, The Praire Canyon Member, a new unit of the Upper Cretaceous Mancos Shale, west-central Colorado and east-central Utah: Utah Geological Survey Miscellaneous Publication 97-4, 26 p.
Conrad, C.P., and L. Husson, 2009, Influence of dynamic topography on sea level and its rate of change: Lithosphere, v. 1, p. 110-120, doi: 10.1130/L32.1.
Cooper, M.R., 1977, Eustasy during the Cretaceous: its implications and importance: Paleogeography, Paleoclimatology, Paleoecology, v. 22, p. 1-60.
149
Creaney, S. and Q.R. Passey, 1993, Recurring patterns of total organic carbon and source rock quality within a sequence stratigraphic framework: AAPG Bulletin, v. 77, p. 386-401.
Cross, W. and C.W. Purington, 1899, Description of the Telluride Quadrangle, Colorado.
Curtice, R., 2013, Review of the deep Mancos shale gas wells in Utah, unpublished report, 33 p.
Dane, C.H., W.A. Cobban, and E.G. Kauffman, 1966, Stratigraphy and regionalrelationships of a reference section for the Juana Lopez Member, Mancos Shale, in the San Juan Basin, New Mexico: U.S. Geological Survey Bulletin 1224-H,15 p.
DeCelles, P.G., 1994, Late Cretaceous - Paleocene synorogenic sedimentation and kinematic history of the Sevier thrust belt, northeast Utah and southwest Wyoming: GSA Bulletin, v. 106, p. 32-56.
Decelles, P.G., and J.C. Coogan, 2006, Regional structure and kinematic history of the Sevier fold-and-thrust belt, central Utah: GSA Bulletin, v. 118, p. 841-864, doi: 10.1130/B25759.1.
DeCelles, P.G., and K.A. Giles, 1996, Foreland basin systems: Basin Research, v. 8, p. 105-123.
Demaison, G.J., and G.T. Moore, 1980, Anoxic environments and oil source bed genesis: AAPG Bulletin, v. 64, p. 1179-1209.
Dickinson, W.R., M.A. Klute, M.J. Hayes, S.U. Janecke, E.R. Lundin, M.A. McKittrick, and M.A. Olivares, 1988, Paleogeographic and paleotectonic setting of Laramide sedimentary basins in the central Rocky Mountain region: GSA Bulletin, v. 100, p. 1023-1039.
Diecchio, R.J., and B.T. Brodersen, 1994, Recognition of regional (eustatic?) and local (tectonic?) relative sea level events in outcrop and gamma ray logs, Ordovician, West Virginia: Tectonic and Eustatic Controls on Sedimentary Cycles, SEPM Concepts in Sedimentology and Paleontology #4, p. 171-180.
Dixon, J.F., R.J. Steel, and C. Olariu, 2012, Shelf-edge delta regime as a predictor ofdeep water deposition: Journal of Sedimentary Research, v. 82, p. 681-687, doi: 10.2110/jsr.2012.59.
DOGM, <http://oilgas.ogm.utah.gov>
150
Dooling, P.R., 2012, Tidal facies, stratigraphic architecture, and along-strike variability of a high energy, transgressive shoreline, Late Cretaceous, Kaiparowits Plateau, Southern Utah, Master of Science, University of Utah, Salt Lake City, Utah.
Durham, L.S., 2012, Mancos-Niobrara play full of surprises: AAPG Explorer,<https://www.aapg.org/explorer/2012/08aug/mancos0812.cfm>, accessed 8/9/2013.
Edwards, C.M., J.A. Howell, and S.S. Flint, 2005, Depositional and stratigraphicarchitecture of the Santonian Emery Sandstone of the Mancos Shale: Implications for Late Cretaceous evolution of the Western Interior Foreland Basin of central Utah, U.S.A: Journal of Sedimentary Research, v. 75, p. 280-299, doi: 10.2110/jsr.2005.021.
Embry, A.F., 1990, Depositional sequences - theoretical considerations, boundaryrecognition, and relationships to other genetic units in A. M 0 rk, ed., Sequence Stratigraphy Field Workshop, Svalbard: Continental Shelf Institute (IKU), Trondheim, p. 1-26.
Embry, A.F., 2002, Transgressive-regressive (T-R) sequence stratigraphy, in J.Armentrout, and N. Rosen, eds., Gulf Coast SEPM Conference Proceedings, Houston, Texas, p. 151-172.
Embry, A.F. and E. Johannesen, 1992, T-R sequence stratigraphy, facies analysis, and reservoir distribution in the uppermost Triassic - Lower Jurassic succession, western Sverdrup Basin, Arctic Canada in T.O. Vorren, E. Bergsager, 0.A . Dahl Stamnes, E. Holter, B. Johansen, E. Lie, and T.B. Lund, eds., Arctic Geology and Petroleum Potential: Norwegian Petroleum Society Special Publication 2, p. 121146.
Fertl, W.H., and G.V. Chillingar, 1988, Total organic carbon content determined from well logs: SPE Formation Evaluation, SPE 15612, p. 407-419.
Fielding, C.R., 2010, Planform and facies variability in asymmetric deltas: facies analysis and depositional architecture of the Turonian Ferron Sandstone in the western Henry Mountains, south-central Utah, U.S.A: Journal of Sedimentary Research, v. 80, p. 455-479, doi: 10.2110/jsr.2010.047.
Flemings, P.B., and T.E. Jordan, 1989, A synthetic stratigraphic model of foreland basin development, Journal of Geophysical Research, v. 94 (B4), p. 3851-3866.
Fouch, T.D., T.F. Lawton, D.J. Nichols, W.B. Cashion, and W.A. Cobban, 1983, Patterns and timing of synorogenic sedimentation in Upper Cretaceous rocks of central and northeast Utah, in M.W. Reynolds, and E.D. Dolly, eds., Mesozoic Paleogeography of West Central United States: Rocky Mountain Section SEPM, Denver, Colorado, p. 305-336.
151
Franczyk, K.J., T.D. Fouch, R.C. Johnson, C.M. Molenaar, and W.A. Cobban, 1992,Cretaceous and Tertiary paleogeographic reconstructions for the Uinta-Piceance basin study area, Colorado and Utah: U.S. Geological Survey Bulletin 1787-Q,48 p.
Galloway, W.E., 1989, Genetic stratigraphic sequences in basin analysis I: architecture and genesis of flooding-surface bounded depositional units: AAPG Bulletin, v.73, p. 125-142.
Gardner, M.H., 1995a, The stratigraphic hierarchy and tectonic history of the midCretaceous foreland basin of central Utah: Stratigraphic Evolution of Foreland Basins, SEPM special Publication No. 52, p. 283-303.
Gardner, M.H., 1995b, Tectonic and eustatic controls on the stratal architecture of mid Cretaceous stratigraphic sequences, central Western Interior Foreland Basin of North America: Stratigraphic Evolution of Foreland Basins, SEPM Special Publication No. 52, p. 243-281.
Gardner, M.H., T.A. Cross, and M. Levorsen, 2004, Stacking patterns, sediment volume partitioning, and facies differentiation in shallow-marine and coastal-plain strata of the Cretaceous Ferron Sandstone, Utah, in T.C. Chidsey, R.D. Adams, and T.H. Morris, eds., Analogue for Fluvial-Deltaic Reservoir Modeling: Ferron Sandstone of Utah: AAPG Studies in Geology 50, p. 93-124.
Gradstein, F.M., J.G. Ogg, M.D. Schmitz, and G.M. Ogg, 2012, The Geologic Timescale 2012: Boston, USA, Elsevier, doi: 10.1016/B978-0-444-59425-9.00004-4.
Hammes, U., H.S. Hamlin, and T.E. Ewing, 2011, Geologic analysis of the UpperJurassic Haynesville Shale in east Texas and west Louisiana: AAPG Bulletin, v. 95, p. 1643-1666, doi: 10.1306/02141110128.
Hampson, G.J., 2000, Discontinuity surfaces, clinoforms, and facies architecture in a wave dominated, shoreface - shelf parasequence: Journal of Sedimentary Research, v. 70, p. 325-340.
Hampson, G.J., P.M. Burgess, and J.A. Howell, 2001, Shoreface tongue geometryconstrains history of relative sea level fall: examples from Late Cretaceous strata in the Book Cliffs area, Utah: Terra Nova, v. 13, p. 188-196.
Hampson, G.J., M.R. Gani, K.E. Sharman, N. Irfan, and B. Bracken, 2011, Along-strike and down-dip variations in shallow marine sequence stratigraphic architecture: Upper Cretaceous Star Point Sandstone, Wasatch Plateau, central Utah, USA: Journal of Sedimentary Research, v. 81, p. 159-184, doi: 10.2110/jsr.2011.15.
Hampson, G.J., J.A. Howell, and S.S. Flint, 1999, A sedimentological and sequencestratigraphic re-interpretation of the Upper Cretaceous Prairie Canyon Member
152
(“Mancos B”) and associated strata, Book Cliffs Area, Utah, U.S.A: Journal of Sedimentary Research, v. 69, p. 414-433.
Hancock, J.M., 1993, Transatlantic correlations in the Campanian-Maastrichtian stages by eustatic changes of sea-level, in E.A. Hailwood, and R.B. Kidd, eds., High Resolution Stratigraphy: Geological Society, London, Special Publication 70, p. 241-256.
Haq, B.U., J. Hardenbol, and P.R. Vail, 1987, Chronology of fluctuating sea levels since the Triassic: Science, v. 235, p. 1156-1167.
Haq, B.U., and S.R. Schutter, 2008, A chronology of Paleozoic sea-level changes: Science, v. 322, p. 64-68.
Hardenbol, J., J. Thierry, M.B. Farley, T. Jacquin, P.-C. De Graciansky, and P.R. Vail, 1998, Mesozoic and Cenozoic sequence chronostratigraphic framework of European Basins: Mesozoic and Cenozoic Sequence Stratigraphy of European Basins, SEPM SpecialPublications, v. 60, p. 3-13.
Hettinger, R.D., and M.A. Kirschbaum, 2003, Stratigraphy of the Upper CretaceousMancos Shale (upper part) and Mesaverde Group in the southern part of the Uinta and Piceance Basins, Utah and Colorado: Petroleum Systems and Geological Assessment of Oil and Gas in the Uinta-Piceance Province, Utah and Colorado: U.S. Geological Survey Digital Data Series DDS-69-B (1.0 ed., pp. 25). Denver, CO 80225: U.S. Geological Survey, Information Services.
Hillier, R., L. Stright, and R. Ressetar, 2013, Estimating total organic carbon content in the Cretaceous Mancos Shale: AAPG Rocky Mountain Section Meeting, Salt Lake City, September 22-24.
Horton, B., 2012, Variability of the Mancos Shale: Developing Preliminary Depositional Sequence Stratigraphic Models of a Developing Shale Gas Play. Master of Science, University of Utah, Salt Lake City, Utah.
Howell, J.A., and S.S. Flint, 2003, Siliciclastics case study: the Book Cliffs, in A. Coe, ed., The Sedimentary Record of Sea Level Change: Cambridge, U.K., Open University and Cambridge University Press, p. 135-208.
Jenkyns, H.C., 1980, Cretaceous anoxic events: from continents to oceans: Journal of the Geologic Society, London, v. 137, p. 171-188.
Johnson, J.G., G. Klapper, and C.A. Sandberg, 1985, Devonian eustatic fluctuations in Euramerica: GSA Bulletin, v. 96, p. 567-587.
Johnson, R.C., 2003a, Northwest to southeast cross section of Cretaceous and LowerTertiary rocks across the eastern part of the Uinta Basin, UT: Petroleum Systems
153
and Geological Assessment of Oil and Gas in the Uinta-Piceance Province, Utah and Colorado: U.S. Geological Survey Digital Data Series DDS-69-B (1.0 ed., pp. 9). Denver, CO 80225: U.S. Geological Survey, Information Services.
Johnson, R.C., 2003b, Depositional framework of the Upper Cretaceous Mancos Shale and the lower part of the Upper Cretaceous Mesaverde group, Western Colorado and Eastern Utah: Petroleum Systems and Geological Assessment of Oil and Gas in the Uinta Piceance Province, Utah and Colorado: U.S. Geological Survey Digital Data Series DDS-69-B (1.0 ed., pp. 28). Denver, CO 80225: U.S. Geological Survey, Information Services.
Johnson, S.Y., 1992, Phanerozoic evolution of sedimentary basins in the Uinta-Piceance Basin region, northwestern Colorado and northeastern Utah: U.S. Geological Survey, Bulletin 1787, 48 p.
Jordan, T.E., 1981, Thrust loads and foreland basin evolution, Cretaceous, Western United States: AAPG Bulletin, v. 65, p. 2506-2520.
Kamola, D.L., and J.C. Van Wagoner, 1995, Stratigraphy and facies architecture of parasequences with examples from the Spring Canyon Member, Blackhawk Formation, Utah, in J.C. Van Wagoner, and G.T. Bertram, eds., Sequence Stratigraphy of Foreland Basin Deposits: Outcrop and Subsurface Examples from the Cretaceous of North America: AAPG Memoir, vol. 64, p. 27-54.
Karner, G.D., 1986, Effects of lithospheric in-plane stress on sedimentary basin stratigraphy: Tectonics, v. 5, p. 573-588.
Kauffman, E.G., 1969, Cretaceous marine cycles of the western interior: The Mountain Geologist, v. 6, p. 227-245.
Kauffman, E.G., 1977, Geological and biological overview: Western Interior Cretaceous Basin: The Mountain Geologist, v. 14, p. 75-99.
Kauffman, E.G., B.B. Sageman, J.I. Kirkland, W.P. Elder, P.J. Harries, and T. Villamil, 1993, Molluscan biostratigraphy of the Cretaceous Western Interior Basin, North America, in W.G.E. Caldwell, and E.G. Kauffman, eds., Evolution of the Western Interior Basin: Geological Association of Canada, Special Paper 39, p. 397-434.
Kennedy, A.D., 2011, Geological Predictors of the Hydrocarbon Extraction Potential of the Mancos Shale, Master of Science, University of Utah, Salt Lake City, Utah.
King, G.E., 2012, Hydraulic fracturing 101: what every representative, environmentalist, regulator, reporter, investor, university researcher, neighbor, and engineer should know about estimated frac risk and improving frac performance in unconventional gas and oil wells, SPE 152596, 80 p.
154
Kirschbaum, M.A., 2003, Geologic assessment of undiscovered oil and gas resources of the Mancos/Mowry total petroleum system, Uinta-Piceance Province, Utah and Colorado: Petroleum Systems and Geological Assessment of Oil and Gas in the Uinta-Piceance Province, Utah and Colorado: U.S. Geological Survey Digital Data Series DDS-69-B (1.0 ed., pp. 51). Denver, CO 80225: U.S. Geological Survey, Information Services.
Kirschbaum, M.A. and R.D. Hettinger, 2004. Facies analysis and sequence stratigraphic framework of Upper Campanian strata (Nelson and Mount Garfield Formations, Bluecastle Tongue of the Castlegate Sandstone, and Mancos Shale), eastern Book Cliffs, Colorado and Utah: U.S. Geological Survey Digital Data Series DDS-69 G, 46 p.
Kirschbaum, M.A. and T.J. Mercier, 2013, Controls on deposition and preservation of Cretaceous Mowry Shale and Frontier Formation equivalents, Rocky Mountain Region, Colorado, Utah, and Wyoming: AAPG Bulletin, vol. 97, p. 899-921, doi: 10.1306/10011212090.
Kominz, M.A., J.V. Browning, K.G. Miller, P.J. Sugarman, S. Mizintseva, and C.R. Scotese, 2008, Late Cretaceous to Miocene sea-level estimates from the New Jersey and Delaware coastal plain coreholes: an error analysis: Basin Research, v. 20, p. 211-226, doi: 10.1111/j.1365-2117.2008.00354.x.
Kosters, E.C., J.G. VanderZwaan, and F.J. Jorissen, 2000, Production, preservation, and prediction of source rock facies in deltaic settings: International Journal of Coal Geology, v. 43, p. 13-26.
Kuzniak, K., 2011, New Stratigraphic Interpretations, Geochemistry, and Petrophysics of the Lower Mancos Group, Douglas Creek Arch, Northwestern Colorado, U.S.A., Master of Science, Colorado School of Mines, Golden, Colorado.
Lash, G.G., and t. Engelder, 2011, Thickness trends and sequence stratigraphy of the Middle Devonian Marcellus Formation, Appalachian Basin: implications for Acadian foreland basin evolution, AAPG Bulletin, vol. 95, p. 61-103, doi: 10.1306/06301009150.
Lawton, T.F., 1986, Fluvial systems of the Upper Cretaceous Mesaverde group andPaleocene North Horn Formation, Central Utah: a record of transition from thin skinned to thick skinned deformation in the foreland region, in J.A. Peterson, ed., Paleotectonics and Sedimentation in the Rocky Mountain Region, United States: AAPG Memoir 41, p. 423-442.
Leythaeuser, D., 1973, Effects of weathering on organic matter in shales: Geochimica et Cosmochimica Acta, v. 37, p. 113-120.
155
Livaccari, R.F., 1991, Role of crustal thickening and extensional collapse in the tectonic evolution of the Sevier-Laramide orogeny, western United States: Geology, v. 19, p. 1104-1107.
Locklair, R.E., and B.B. Sageman, 2008, Cyclostratigraphy of the Upper Cretaceous Niobrara Formation, Western Interior, U.S.A.: a Coniacian-Santonian orbital timescale: Earth and Planetary Science Letters, v. 269, p. 540-553, doi: 10.1016/j.espl.2008.03.021.
Locklair, R.E., B.B. Sageman, and A. Lerman, 2011, Marine carbon burial flux and the carbon isotope record of Late Cretaceous (Coniacian - Santonian) Oceanic Anoxic Event III: Sedimentary Geology, v. 235, p. 38-49, doi: 10.1016/j.sedgeo.2010.06.026.
Longman, M.W., B.A. Luneau, and S.M. Landon, 1998, Nature and distribution of Niobrara lithologies in the Cretaceous Western Interior Seaway of the rocky mountain region: The Mountain Geologist, v. 35, p. 137-170.
Loucks, R.G., R.M. Reed, S.C. Ruppel, and U. Hammes, 2012, Spectrum of pore types and networks in mudrocks and a descriptive classification for matrix-related mudrock pores: AAPG Bulletin, v. 96, p. 1071-1098, doi: 10.1306/08171111061.
Loucks, R.G. and S.C. Ruppel, 2007, Mississippian Barnett Shale: lithofacies anddepositional setting of a deep-water shale gas succession in the Fort Worth Basin, Texas: AAPG Bulletin, v. 91, p. 579-601, doi: 10.1306/11020606059.
Loucks, R.G., R.M. Reed, S.C. Ruppel, and D.M. Jarvie, 2009, Morphology, genesis, and distribution of nanometer-scale pores in siliceous mudstones of the Mississippian Barnett Shale: Journal of Sedimentary Research, v. 79, p. 848-861, doi: 10.2110/jsr.2009/092.
MacEachern, J.A., K.L. Bann, J.P. Bhattacharya, and C.D. Howell, 2005, Ichnology of deltas: organism responses to the dynamic interplay of rivers, waves, storms, and tides: River Deltas - Concepts, Models, and Examples, SEPM Special Publications No. 83, p. 49-85.
Macquaker, J.H.S., S.J. Bentley, and K.M. Bohacs, 2010, Wave-enhanced sediment gravity flows and mud dispersal across continental shelves: Reappraising sediment transport processes operating in ancient mudstone successions: Geology, v. 38, p. 947-950, doi: 10.1130/G31093.1.
Macquaker, J.H.S., K.G. Taylor, and R.L. Gawthorpe, 2007, High-resolution facies analysis of mudstones: implications for paleoenvironmental and sequence stratigraphic interpretations of offshore ancient mud-dominated successions: Journal of Sedimentary Research, v. 77, p. 324-339, doi: 10.2110/jsr.2007.029.
156
Meyers, S.R., S.E. Siewert, B.S. Singer, B.B. Sageman, D.J. Condon, J.D. Obradovich, B.R. Jicha, and D.A. Sawyer, 2012, Intercalibration of radioisotopic and astrochronologic time scales for the Cenomanian-Turonian boundary interval, Western Interior Basin, USA: Geology, v. 40, p. 7-10, doi: 10.1130/G32261.1.
Miall, A.D., 1992, The Exxon global cycle chart: an event for every occasion?: Geology, v. 20, p. 787-790.
Miall, A.D., 1994, Sequence stratigraphy and chronostratigraphy: problems of definition and precision in correlation, and their implications for global eustasy: Geoscience Canada, v. 21, p. 1-26.
Miall, A.D., and M. Arush, 2001, The Castlegate Sandstone of the Book Cliffs, Utah: sequence stratigraphy, paleogeography, and tectonic controls: Journal of Sedimentary Research, v. 71, p. 537-548.
Milici, R.C., and C.S. Swezey, 2006, Assessment of Appalachian Basin oil and gasresources: Devonian shale - middle and upper Paleozoic total petroleum system: U.S. Geological Survey, Open File Report Series 2006-1237, 70 p.
Miller, D.J. and K.A. Eriksson, 2000, Sequence stratigraphy of Upper Mississippianstrata in the central Appalachians: a record of glacioeustasy and tectonoeustasy in a foreland basin setting: AAPG Bulletin, v. 84, p. 210-233.
Miller, K.G., M.A. Kominz, J.V. Browning, J.D. Wright, G.S. Mountain, M.E. Katz, P.J. Sugarman, B.S. Cramer, N. Christie-Blick, and S.F. Pekar, 2005, The Phanerozoic record of global sea-level change: Science, v. 310, p. 1293-1298.
Miller, K.G., P.J. Sugarman, J.V. Browning, M.A. Kominz, J.C. Hernandez, R.K. Olsson, J.D. Wright, M.D. Feigenson, and W. Van Sickel, 2003, Late Cretaceous chronology of large, rapid sea level changes: glacioeustasy during the greenhouse world: Geology, v. 31, p. 585-588.
Milton, N. J. and D. Emery, 1996, Outcrop and Well Data, in Sequence Stratigraphy, D. Emery and K. Myers, eds., Blackwell Publishing Ltd., Oxford, UK, p. 61-79. doi: 10.1002/9781444313710.ch4.
Modica, C.J. and S.G. Lapierre, 2012, Estimation of kerogen porosity in source rocks as a function of thermal transformation: examples from the Mowry Shale in the Powder River Basin of Wyoming: AAPG Bulletin, v. 96, p. 87-108, doi: 10.1306/04111110201.
Molenaar, C.M. and W.A. Cobban, 1991, Middle Cretaceous stratigraphy on the South and East sides of the Uinta Basin, northeastern Utah and northwestern Colorado: U.S. Geological Survey Bulletin 1787: Evolution of Sedimentary Basins - Uinta and Piceance Basins, ch. P, 34 p.
157
Molenaar, C.M. and B.W. Wilson, 1990, The Frontier Formation and associated rocks of Northeastern Utah and Northwestern Colorado: U.S. Geological Survey Bulletin 1787: Evolution of Sedimentary Basins - Uinta and Piceance Basins, ch. M, 21 p.
Moucha, R., A.M. Forte, J.X. Mitrovica, D.B. Rowley, S. Quere, N.A. Simmons, and S.P. Grand, 2008, Dynamic topography and long-term sea-level variations: there is no such thing as a stable continental platform: Earth and Planetary Science Letters, v. 271, p. 101-108.
Mullen, M., R. Roundtree, and B. Baree, 2007, A composite determination of mechanical rock properties for stimulation design (what to do when you don’t have a sonic log), SPE 108139, 13 p.
Muller, R.D., M. Sdrolias, C. Gaina, B. Steinberger, and C. Heine, 2008, Long-term sea level fluctuations driven by ocean basin dynamics: Science, v. 319, p. 1357-1362, doi: 10.1126/science.1151540.
Nuccio, V.F. and L.N.R. Roberts, 2003, Thermal maturity and oil and gas generationhistory of petroleum systems in the Uinta-Piceance Province, Utah and Colorado: Petroleum Systems and Geological Assessment of Oil and Gas in the Uinta Piceance Province, Utah and Colorado: U.S. Geological Survey Digital Data Series DDS-69-B (1.0 ed., pp. 39). Denver, CO 80225: U.S. Geological Survey, Information Services.
O’Byrne, C.J. and S. Flint, 1995, Sequence, parasequence, and intraparasequencearchitecture of the Grassy Member, Blackhawk Formation, Book Cliffs, Utah, USA, in J.C. Van Wagoner, and G.T. Bertram, eds., Sequence Stratigraphy of Foreland Basin Deposits: Outcrop and Subsurface Examples from the Cretaceous of North America: AAPG Memoir, v. 64, p. 225-255.
Pang, M. and D. Nummedal, 1995, Flexural subsidence and basement tectonics of the Cretaceous Western Interior basin, United States: Geology, v. 23, p. 173-176.
Pasley, M.A., W.A. Gregory, and G.F. Hart, 1991, Organic matter variations intransgressive and regressive shales: Organic Geochemistry, v. 17, p. 483-509.
Pasley, M.A., G.W. Riley, and D. Nummedal, 1993, Sequence stratigraphic significance of organic matter variations: example from the Upper Cretaceous Mancos Shale of the San Juan Basin, New Mexico in B.J. Katz, and R.M. Pratt, eds., Source Rocks in a Sequence Stratigraphic Framework: AAPG Studies in Geology, v. 37, p. 221-241.
Passey, Q.R., K.M. Bohacs, W.L. Esch, R. Klimentidis, and S. Sinha, 2010, From oilprone source rock to gas-producing shale reservoir - geologic and petrophysical characterization of unconventional shale-gas reservoirs: SPE 131350, 29 p.
158
Passey, Q.R., S. Creaney, J.B. Kulla, F.J. Moretti, and J.D. Stroud, 1990, A practicalmethod for organic richness from porosity and resistivity logs: AAPG Bulletin, v.74, p. 1777-1794.
Pattison, A.J., 2005, Storm influenced prodelta turbidite complex in the lower Kenilworth member at Hatch Mesa, Book Cliffs, Utah, U.S.A.: implications for shallow marine facies models: Journal of Sedimentary Research, v. 75, p. 420-439.
Pattison, A.J., R.B. Ainsworth, and T.R. Hoffman, 2007, Evidence of across shelf transport of fine-grained sediments: turbidite-filled shelf channels in the Campanian Aberdeen Member, Book Cliffs, Utah, USA: Sedimentology, v. 54, p. 1033-1063, doi: 10.1111/j.13653091.2007.00871.x.
Pattison, S.A.J., K.G. Taylor, and J.H.S. Macquaker, 2009, A shore-to-basin transect through the Mancos Shale mud belt: sedimentological controls on lithofacies variability in unconventional hydrocarbon plays, Book Cliffs, Utah: Field Trip No. 18 Guidebook, Society for Sedimentary Geology (SEPM), AAPG Annual Convention and Exhibition, 7-10 June, Colorado Convention Center, Denver, Colorado, 168 p.
Plint, A.G., J.H.S. Macquaker, and B.L. Varban, 2012, Bedload transport of mud across a wide, storm influenced ramp: Cenomanian-Turonian Kaskapau Formation, western Canada foreland basin: Journal of Sedimentary Research, v. 82, p. 801822. doi: 10.2110/jsr.2012.64
Posamentier, H.W., and G.P. Allen, 1993, Siliclastic sequence stratigraphic patterns in foreland ramp-type basins: Geology, v. 21, p. 455-458.
Posamentier, H.W., and W.R. Morris, 2000, Aspects of stratal architecture of forcedregressive deposits in D. Hunt, and R.L. Gawthorpe, eds., Sedimentary Responses to Forced Regressions: Geological Society, London, Special Publications, v. 172, p. 19-46.
Posamentier, H.W. and P.R. Vail, 1988, Eustatic controls on clastic deposition II sequence and systems tract models. Sea Level Changes - An Integrated Approach, SEPM Special Publication no. 42, p. 125-154.
Quick, J.C. and R. Ressetar, 2012, Thermal maturity of the Mancos Shale within theUinta Basin, Utah and Colorado: AAPG Search and Discovery Article # 50616.
Rankin, C.H., 1944, Stratigraphy of the Colorado group, Upper Cretaceous, in northern New Mexico: Colorado School of Mines Bulletin, v. 20, 27 p.
Ridgely, J.L., S.M. Condon, and J.R. Hatch, 2013, Geology and oil and gas assessment of the Mancos-Menefee composite total petroleum system. Ch. 4 of Petroleum Systems and Geological Assessment of Undiscovered Oil and Gas Resources in
159
the San Juan Basin Province, Exclusive of Paleozoic Rocks, New Mexico and Colorado: U.S. Geological Survey Digital Data Series DDS-69-F, p. 1-97.
Riemersma, P.E. and M.A. Chan, 1991, Facies of the Lower Ferron Sandstone and Blue Gate Shale members of the Mancos Shale: lowstand and early transgressive facies architecture: Special Publications of the International Association of Sedimentologists, v. 14, p. 489-510.
Rose, K.K., A.S.B. Douds, J.A. Pancake, H.R. Pratt III, and R. Boswell, 2004, Assessing sub economic natural gas resources in the Anadarko and Uinta Basins: AAPG Search and Discovery Article #10069.
Ryer, T.A., 2004, Previous studies of the Ferron Sandstone, in T.C. Chidsey, R.D.Adams, and T.H. Morris, eds., Analogue for Fluvial-Deltaic Reservoir Modeling: Ferron Sandstone of Utah: AAPG Studies in Geology 50, p. 3-38.
Sageman, B.B., A.E. Murphy, J.P. Werne, C.A. Ver Straeten, D.J. Hollander, and T.W.Lyons, 2003, A tale of shales: the relative roles of production, decomposition, and dilution in the accumulation of organic rich strata, Middle-Upper Devonian, Appalachian Basin: Chemical Geology, v. 195, p. 229-273.
Sageman, B.B., J. Rich, M.A. Arthur, G.E. Birchfield, and W.E. Dean, 1997, Evidence for Milankovitch periodicities in Cenomanian-Turonian lithologic and geochemical cycles, Western Interior U.S.A: Journal of Sedimentary Research, v. 67, p. 286-302.
Sahagian, D., O. Pinous, A. Olferiev, and V. Zakharov, 1996, Eustatic curve for the middle Jurassic - Cretaceous based on Russian platform and Siberian stratigraphy: zonal resolution: AAPG Bulletin, v. 80, p. 1433-1458.
Schamel, S., 2006, Shale gas resources of Utah: assessment of previously undiscovered gas discoveries: Utah Geological Survey, Open-File Report 499, 84 p.
Schieber, J., 1999, Distribution and deposition of mudstone facies in the Upper Devonian SonyeaGroup of New York: Journal of Sedimentary Research, v. 69, p. 909-925.
Schieber, J., J. Southard, and K. Thaisen, 2007, Accretion of mudstone beds from migrating floccule ripples: Science, v. 318, p. 1760-1763.
Schwans, P., 1988, Stratal Packages at the Subsiding Margin of the Cretaceous Foreland Basin, Utah. (Volumes I + II): PhD Dissertation, The Ohio State University, Columbus, Ohio.
Schwans, P., 1995, Controls on sequence stacking and fluvial to shallow-marinearchitecture in a foreland basin, in J.C. Van Wagoner, and G.T. Bertram, eds., Sequence Stratigraphy of Foreland Basin Deposits: Outcrop and Subsurface
160
Examples from the Cretaceous of North America. AAPG Memoir, v. 64, p. 103-136.
Seymour, D.L. and C.R. Fielding, 2013, High resolution correlation of the Upper Cretaceous stratigraphy between the Book Cliffs and the western Henry Mountains syncline, Utah, USA: Journal of Sedimentary Research, v. 83, p. 475494. doi: http://dx.doi.org/10.2110/jsr.2013.37
Shanley, K.W. and P.J. McCable, 1995, Sequence stratigraphy of Turonian - Santonian strata, Kaiparowits Plateau, southern Utah, U.S.A.: implications for regional correlation and foreland basin evolution, in J.C. Van Wagoner, and G.T. Bertram, eds., Sequence Stratigraphy of Foreland Basin Deposits: Outcrop and Subsurface Examples from the Cretaceous of North America: AAPG Memoir, v. 64, p. 55 102.
Singh, P., R. Slatt, and W. Coffey, 2008, Barnett Shale - unfolded: sedimentology, sequence stratigraphy, and regional mapping: Gulf Coast Association of Geological Societies Transactions, v. 58, p. 777-795.
Slatt, R.M. and N.R. O’Brien, 2011, Pore types in the Barnett and Woodford gas shales: contribution to understanding gas storage and migration pathways in fine grained rocks: AAPG Bulletin, v. 95, p. 2017-2030, doi: 10.1306/03301110145.
Slatt, R.M. and N.D. Rodriguez, 2012, Comparative sequence stratigraphy and organicgeochemistry of gas shales: commonality or coincidence?: Journal of Natural Gas Science and Engineering, v. 8, p. 68-84. doi: 10.1016/j.jngse.2012.01.008.
Slothower, C., 2012, Encana Corp. releases first Mancos Shale results: Farmington Daily Times, June 22, <http://www.daily-times.com/ci_20917335/encana-corp-releases first mancos-shale-results>, accessed 6/13/13.
Sonnenberg, S.A., 2011, The Niobrara petroleum system: a new resource play in the Rocky Mountain region, in J.E. Estes-Jackson, and D.S. Anderson, eds.,Revisiting and Revitalizing the Niobrara in the Central Rockies: Rocky Mountain Association of Geologists, Denver, Colorado, p. 13-32.
Swift, D.J.P., P.M. Hudelson, R.L. Brenner, and P. Thompson, 1987, Shelf construction in a foreland basin: storm beds, shelf sandbodies, and shelf-slope depositional sequences in the Upper Cretaceous Mesaverde Group, Book Cliffs, Utah: Sedimentology, v. 34, p. 423-457.
Tibert, N.E., J.-P. Colin, and R.M. Leckie, 2009, Taxonomy, biostratigraphy andpaleoecology of Cenomanian and Turonian ostracodes from the Western Interior Basin, Southwest Utah, USA: Revue de micropaleontology, v. 52, p. 85-105. doi: 10.1016/j.revmic.2007.02.006.
161
U.S. Energy Information Administration, 2013, Annual Energy Outlook, Early Release,16 p.
Waanders, G., 2006, Palynology and thermal maturation report, Chevron USA Stone Cabin No. 1 well, unpublished report.
Waanders, G., 2006, Palynology and thermal maturation report, Phillips Petroleum Watson 1B well, unpublished report.
Waanders, G., 2006, Palynology and thermal maturation report, Tenneco Oil Diamond Canyon II 15-15 well, unpublished report.
Van Wagoner, J.C., 1995, Sequence stratigraphy and marine to nonmarine facies architecture of foreland basin strata, Book Cliffs, Utah, USA, in J.C. Van Wagoner, and G.T. Bertram, eds., Sequence Stratigraphy of Foreland Basin Deposits: Outcrop and Subsurface Examples from the Cretaceous of North America: AAPG Memoir, v. 64, p. 137-223.
Van Wagoner, J.C. and G.T. Bertram, eds., 1996, Sequence Stratigraphy of ForelandBasin Deposits. Outcrop and Subsurface Examples from the Cretaceous of North America: AAPG Memoir, v. 64, xxi + 487 p.
Varban, B.L. and A.G. Plint, 2008, Paleoenvironments, paleogeography, andphysiography of a large, muddy, shallow ramp: Late Cenomanian - Turonian Kaskapau Formation, Western Canada foreland basin: Sedimentology, v. 55, p. 201-233. doi: 10.1111/j.13653091.2007.00902.x
Vernik, L., and J. Milovak, 2011, Rock physics of organic shales: The Leading Edge, March, p. 318-323.
White, T., K. Furlong, and M. Arthur, 2002, Forebulge migration in the Cretaceous Western Interior basin of the Central United States: Basin Research, v. 14, p. 43-54.
Wolfe, J.A., and G.R. Upchurch Jr., 1987, North American nonmarine climates and vegetation during the Late Cretaceous: Palaeogeography, Palaeoclimatology, Palaeoecology, v. 61, p. 33-77.
Wright, S., 2012, An unconventional bonanza: The Economist, v. 404, 18 p.
Yoshida, S., 2000, Sequence and facies architecture of the upper Blackhawk Formation and the lower Castlegate Sandstone (Upper Cretaceous), Book Cliffs, Utah, USA: Sedimentary Geology, v. 136, p. 239-276.

162
Young, R.G., 1955, Sedimentary facies and intertonguing in the Upper Cretaceous of the Book Cliffs, Utah-Colorado: GSA Bulletin, v. 66, p. 177-202.