Embed Size (px)
Citation preview
Sequential Anaerobic-Aerobic Digestion: A new process technology for biosolids product quality
improvement
Nitin Kumar
Thesis submitted to the faculty of the Virginia Polytechnic Institute and State University
in partial fulfillment of the requirements for the degree of
Master of Science in
Environmental Engineering
John T. Novak, Ph.D. Gregory D. Boardman, Ph.D.
Nancy G. Love, Ph.D.
January 30, 2006 Blacksburg, Virginia
Keywords: Sequential anaerobic aerobic digestion, Dewatering, Odor control, Biosolids,
and Nitrogen removal.
© Copyright 2006, Nitin Kumar
Sequential Anaerobic-Aerobic Digestion: A new process technology
for biosolids product quality improvement Nitin Kumar
(Abstract)
Anaerobic digestion is widely used for stabilization of solids in sewage sludges. Recent
changes in the priorities and goals of digestion processes are focusing more attention on the
efficiency of these processes. Increasing hauling cost and restrictions for land applications
are two factors which are driving the increased attention to digestion efficiency. Noxious
odor production from the land applied biosolids is another important issue related to
digestion efficiency. Existing anaerobic digestion or aerobic digestion processes failed to
provide simultaneous solution to biosolids related problems i.e. simultaneous VS reduction,
better dewatering of biosolids and lesser odors from the biosolids.
Studies done by Novak et al. (2004) using different activated sludges show that anaerobic-
aerobic digestion and aerobic-anaerobic digestion both increase volatile solids reduction
compared to a single digestion environment. They proposed that there are 4 VS fractions in
sludges: (1) a fraction degradable only under aerobic conditions, (2) a fraction degradable
only under anaerobic conditions, (3) a fraction degradable under both anaerobic and aerobic
conditions, and (4) a non degradable fraction. It has also been found (Akunna et al., 1993)
that anaerobic-aerobic sequential treatment of wastewater can help in achieving substantial
nitrogen removal. These results suggest that sequential anaerobic-aerobic digestion can
address multiple biosolid related problems.
This study was designed to understand the effect of sequential anaerobic-aerobic digestion on
the properties of resulting effluent biosolids. The study was carried out in two operation
phases and during both phases one digester was maintained at thermophilic conditions and
the other at mesophilic temperature conditions. In first operation phase (Phase-I)
thermophilic digester was operating at 20 day SRT and mesophilic anaerobic digester was at
10 day SRT. The aerobic digesters following anaerobic digesters were operating at 6 day
SRT. In second operation phase (Phase-II), both thermophilic and mesophilic anaerobic
digesters were operating at 15 day SRT and both had two aerobic digesters operating in
parallel at 3 day and 6 day SRTs.
In addition, batch experiments were also conducted to measure the performance of aerobic-
anaerobic digestion sequence. Another study was carried out to understand the nitrogen
removal mechanism during aerobic digestion of anaerobic digested sludge. The feed sludge
was spiked with four different concentrations of nitrate and nitrite.
It was observed during the study that aerobic digestion of anaerobic sludge helps in achieving
higher Volatile solid reduction (~65% vs ~ 46% for mesophilic digestion and ~52% for
thermophilic digestion). This result supports the hypothesis concerning the different fractions
in volatile solids. Experimental results also show that the increase in VSR upon increasing
anaerobic digestion SRT (more than 15 days) is less than the increase in the VSR due to the
same increment of aerobic digestion SRT. Reduction in COD and VFA were also measured
to be more than 50% during aerobic digestion.
Investigation of nitrogen fate during the sequential anaerobic-aerobic digestion show more
than 50% total nitrogen removal. Higher nitrogen removal was in thermophilic anaerobic –
aerobic digester combination than that in mesophilic anaerobic–aerobic combination. The
most probable reason for the removal was simultaneous nitrification and denitrification.
Higher concentration of readily available VFA from thermophilic anaerobic digested sludge
provide advantage in denitrification in following aerobic digester.
The resulting biosolids produced during sequential digestion process were also analyzed for
dewatering properties and odor production. Proteins and polysaccharides concentrations were
observed to decrease during aerobic digestion for thermophilic anaerobic - aerobic digestion
combination, while in another combinations polysaccharide concentrations increases at
aerobic phase with 3 day digestion. The concentration of polysaccharides decreases at higher
digestion period of 6 and 9. The result of decrease in polysaccharide and protein was
III
reflected by the reduction in the polymer dose consumption and decrease in the optimum
CST for the biosolids resulting from the sequential anaerobic aerobic digestion.
Experimental results from odor experiments show that odor production potential of the
biosolids decreases with increase in both anaerobic phase SRT and aerobic phase SRT.
Thermophilic biosolids produces comparatively low odors but for longer periods, while
mesophilic biosolids produces higher magnitude of odors during storage but only for
comparative shorter period. Aerobic digestion of anaerobic sludge helps in reducing more
than 50% odor production, but freeze-thaw cycle experiment shows that in both anaerobic
and sequential anaerobic – aerobic digested sludges have higher potential for odor
production. Higher aerobic digestion SRTs (6 days and above) shows more potential of
reducing odors, but more experimental work is required to be done.
IV
Acknowledgements
I gratefully acknowledge the guidance I have received from Dr John Novak over the period
of my masters’ education at Virginia Tech. He has given the research group freedom of
thought and allowed our growth in various directions while being readily accessible for any
doubts and clarifications we have had. I especially thank him for giving me the opportunity
to work on this project as it gave me the chance to interact with various other professionals in
the Environmental Engineering industry. He has been kind to me in keeping me funded and
focused on research. I thank my other faculty members –Dr. Gregory Boardman, Dr. Nancy
Love and Dr. Clifford Randall for their inputs and timely guidance.
I acknowledge the DCWASA for the monetary support and for providing the sludge samples
for this study. I would like to extend my thanks to Dr. Sudhir Murthy for sharing his
experience and knowledge during the project.
I would also like to acknowledge and thank the timely help and advice from Julie Petruska
and Jody Smiley regarding the lab practices and experimental methods. Betty Wingate and
Sherry Burke have been most co-operative and supportive in administrative issues and I duly
acknowledge their help. Lastly, I thank fellow researchers and friends Christopher Muller,
Chul Park, David Inman, Sangeetha Subramanian, Saurabh Agarwal and Nitin Verma for
having innumerable valuable discussions with me throughout the span of this study and
maintaining a friendly environment in the laboratory.
V
Dedication
To my family… My father for encouraging me to pursue my dream My mother for inspiring in me, her love of all life, truth and education My brother, grandparents and uncle for their unquestioned love and affection towards me
VI
Table of Contents
Abstract .................................................................................................................................................. ii Acknowledgements ................................................................................................................................ v Dedication ............................................................................................................................................. vi I Literature Review .................................................................................................................. 1 Aerobic digestion................................................................................................................................. 1 Anaerobic digestion ............................................................................................................................ 2 Anaerobic digestion fundamental........................................................................................ 2 Comparison between mesophilic and thermophilic digestion process.......................... 4 VFA degradation .................................................................................................................... 5 Multistage digestion process ............................................................................................................. 5 Acid-gas phased digestion ................................................................................................... 6 Temperature phased anaerobic digestion (TPAD) ............................................................ 6 Aerobic pre-/post- treatment of anaerobic sludge ......................................................................... 6 Waste-activated sludge and role of cations ..................................................................................... 8 Odor production in biosolids............................................................................................................. 8 Nitrogen removal ............................................................................................................................. 10 Summary and study objectives........................................................................................................ 11 References ........................................................................................................................................... 12 II Efficient nitrogen removal and volatile solids reduction in sequential anaerobic- aerobic digestion process ................................................................................................................ 19 Introduction........................................................................................................................................ 19 Materials and methods ..................................................................................................................... 22 Bioreactor operation............................................................................................................. 22 Analytical methods .............................................................................................................. 25 Results and discussion...................................................................................................................... 26 Anaerobic digester performance ........................................................................................ 26 Volatile solids removal during anaerobic and aerobic digestion .................................. 29 Nitrogen removal ............................................................................................................................. 35 Conclusion.......................................................................................................................................... 41 References ........................................................................................................................................... 42 III Sequential anaerobic-aerobic digestion for odor reduction and improvement in dewatering in dewatering properties of digested sludge......................................................... 44 Introduction........................................................................................................................................ 44 Materials and methods ..................................................................................................................... 46 Bioreactor operation............................................................................................................. 46 Analytical method ................................................................................................................ 48 Results and discussion...................................................................................................................... 50 Relationship between biopolymer and dewatering ........................................................ 50 Odor generation ................................................................................................................... 56 Conclusions ........................................................................................................................................ 63
VII
References ........................................................................................................................................... 64 Appendix A Research Note: Role of nitrate and nitrite in volatile solids and nitrogen removal via denitrification in sequential anaerobic-aerobic digestion of solids ................................ 68 Introduction........................................................................................................................................ 68 Methods and materials ..................................................................................................................... 70 Batch bioreactors for nitrogen removal studies ............................................................... 70 Analytical methods .............................................................................................................. 70 Results and discussions .................................................................................................................... 71 Effect of nitrate and nitrite on nitrogen removal ............................................................. 71 Effect of nitrate and nitrite on pH ...................................................................................... 76 Effect of nitrate and nitrite on volatile solids reduction ................................................. 77 Conclusions ........................................................................................................................................ 80 References ........................................................................................................................................... 80 B Engineering Significance................................................................................................... 82
VIII
List of Figures
Chapter I - Literature Review Figure I-1 - Overview of metabolic process and intermediate steps of solids digestions during the anaerobic digestion process......................................................................... 3 Chapter II - Efficient nitrogen removal and volatile solids reduction in sequential anaerobic-aerobic digestion process Figure II-1 – Typical digestion sequence and configuration of digesters used in the study of anaerobic-aerobic digestion process. Arrows represent the direction of the mass flow ................................................................................................................................................. 24 Figure II-2 – Comparison of volatile solids reduction in different anaerobic digesters operation at different SRTs. Th-15 VSR data is from digester recovery period.. ..................... 30 Figure II-3 – Average biogas yield from anaerobic digesters vs total gas produced per day. ............................................................................................................................................... 30 Figure II-4 – Comparison of COD removal from anaerobically digested effluent in aerobic digestion stage. COD removal increases with increase in the SRT and influent temperature. Data from anaerobic digesters are boxed to mark additional COD removal during aerobic digestion and the total digestion SRTs are marked along... ............................. 31 Figure II-5 – Comparison of aerobic phase digestion SRT and effect of anaerobic digestion on volatile solids removal. .............................................................................................. 33 Figure II-6 – Comparison of VS removal from different influent during aerobic digestion process. Solid lines represent the linear fitting of data.............................................. 33 Figure II-7 – Comparison of performance of thermophilic digestion on VSR and role of aerobic digestion in attaining cut-off VSR limits...................................................................... 35 Figure II-8 – Effect of temperature and anaerobic phase digestion period on the release of NH3 due to degradation of proteins. Comparative TKN, Organic nitrogen content and ammonia levels in different digesters are presented as well............................................... 37 Figure II-9 – Typical TKN and ammonia concentration in aerobic digested effluent operated at 3, 6 and 9 day................................................................................................................. 37 Figure II-10 – Effect of aerobic phase digestion period and influent characteristics on the nitrogen removal in aerobic digestion phase. Figure shows percentage of TKN and NH3 removed with digestion period in aerobic digesters.................................................................... 38 Figure II-11 – Effect of aerobic stage SRT on the residual Nitrate and Nitirite concentration in the aerobic digested effluent. ............................................................................. 39 Figure II-12 – ORP profile for the aerobic digesters operated at 3, 6 and 9 day SRT receiving thermophilic influent. Anaerobic condition with reducing environment exists for 10 hrs after addition of anaerobic digested sludge. ORP adjusted to represent potential with respect to H2/H+ cell. ........................................................................................................................ 40 Figure II-13 – ORP profile in aerobic digesters receiving mesophilic digested influent. ORP adjusted to represent potential with respect to H2/H+ cell. ............................... 40
IX
Chapter III - Sequential anaerobic-aerobic digestion for odor reduction and improvement in dewatering in dewatering properties of digested sludge Figure III-1 – Protein concentration of influent and effluent of aerobic digesters. The influent from two different SRTs has been averaged to represent day 0 protein concentrations .................................................................................................................................... 51 Figure III-2 – Polysaccharide conc. at different SRTs for mesophilic-anaerobic and thermophilic-anaerobic influent in the aerobic digesters ............................................................ 52 Figure III-3 – Comparison of Aerobic digestion SRTs and influent type on the total biopolymer conc. removal in the aerobic digesters ...................................................................... 53 Figure III-4 – Comparison of Capillary suction time (CST) for the anaerobic digested sludges. ............................................................................................................................................... 54 Figure III-5 – Comparison of polymer dose requirement for the anaerobic digested sludges. NOTE: Data for the Th-15 digester was collected during the poor performance period. ................................................................................................................................................. 54 Figure III-6 – Effect of aerobic stage SRT and influent sludge in aerobic digesters on the CST. Day-0 data is the representative average value of CSTs measured for anaerobic digested sludges from different phases.......................................................................................... 55 Figure III-7 – Optimum polymer dose requirement after the aerobic digestion and effect of influent sludge on the polymer requirements. Day-0 data is the representative average value of CSTs measured for anaerobic digested sludges from different phases....... 55 Figure III-8 - Odor potential (odors from BESA amended biosolids) changes as a function on anaerobic digestion SRT.............................................................................................. 58 Figure III-9 - Odor potential changes in the sequentially anaerobic-aerobic digested biosolids as a function of aerobic digestion SRT. More dramatic change was observed for mesophilic sludge than thermophilic ............................................................................................. 59 Figure III-10 – Comparison between the typical odor generation profiles of different anaerobic digested biosolids and effect of freeze-thaw on the odor generation from biosolids. ............................................................................................................................................. 59 Figure III-11 – Comparison of organic sulfur concentration in Mesophilic digested biosolids and mesophilic biosolids spiked with BESA for inhibiting methanogenic activity in sample. High digestion period reduces the odors from the biosolids ....................................... 60 Figure III-12 – Comparison of typical odor production curve after only anaerobic digestion, sequential anaerobic-aerobic digestion and freeze thaw treatment of both anaerobic and anaerobic-aerobic digested samples ..................................................................... 61 Figure III-13 – Effect of freeze-thaw period and digestion time on the odor production from biosolids samples ................................................................................................ 62 Figure III-14 – Effect on odor generation tendency of biosolids due to aerobic stage digestion period and influent sludge. The biosolids were treated under freeze-thaw cycle of 1 week ................................................................................................................................................. 63 Appendix A - Role of nitrate and nitrite in volatile solids and nitrogen removal via denitrification in sequential anaerobic-aerobic digestion of solids Figure A-1 – Effect of nitrite spike on TKN removal with digestion period ............... 73 Figure A-2 – Effect of nitrate spike on the TKN removal during the aerobic digestion….......................................................................................................................................... 73 Figure A-3 – Change in ammonium conc. during aerobic digestion and effect of nitrite spike on removal.................................................................................................................... 74
X
Figure A-4 – Effect of nitrate conc. on the ammonium removal from the aerobic digester at different SRTs ................................................................................................................. 74 Figure A-5 – Volatile fatty acid removal during the aerobic digestion. Approximately 80% removal was measured at 3rd day of the operation .............................................................. 75 Figure A-6 – Correlation between the ammonium–ion during aerobic digestion and corresponding volatile fatty acids concentrations. All linear correlation had R2 greater than 0.9 ................................................................................................................................................ 75 Figure A-7 – pH profile during the aerobic digestion of the anaerobic sludge spiked with nitrite .......................................................................................................................................... 76 Figure A-8 – pH profile of the different digesters spiked by nitrate during aerobic digestion.............................................................................................................................................. 77 Figure A-9 – Effect of nitrite spike on volatile solid removal during aerobic digestion. Linear correlation curve shows strong relationship between VSR and SRT. ........................... 78 Figure A-10 – Nitrate spike effects volatile solids removal in negatively. Low VSR in high nitrate spiked digesters has been found................................................................................ 78 Figure A-11 – Strong correlation between percentage volatile solid removal and percentage of TKN removed during aerobic digestion exists. For no nitrite spike no linear correlation exits.................................................................................................................................. 79
XI
List of Tables
Chapter I - Literature Review Table I-1 - Advantages and disadvantages of thermophilic digestion process over mesophilic digestion .......................................................................................................................... 4 Chapter II - Efficient nitrogen removal and volatile solids reduction in sequential anaerobic-aerobic digestion process Table II-1 – Digester combination during two phases of study and acronyms of the digesters used during result analysis ............................................................................................. 22 Table II-2 – Digester operation parameters comparison (Average values with standard deviation) ........................................................................................................................... 27 Table II-3 – Distribution of major volatile fatty acid (VFA) concentrations in different sludges and comparison of different VFA fractions with total VFA concentration. ............... 28 Table II-4 – Nitrogen Mass balance in aerobic digesters (All masses are in mg- N/day). Nitrate and nitrite in the anaerobic influent digester were lower than the measurable concentration. ............................................................................................................... 36 Chapter III - Sequential anaerobic-aerobic digestion for odor reduction and improvement in dewatering in dewatering properties of digested sludge Table III-1 - Digester combination during two phases of study and acronyms of the digesters used during result analysis ............................................................................................ 47 Table III-2 – Summary of biopolymer and solids in different digesters during two operation phases................................................................................................................................ 50 Table III-3 – Cation concentration in different effluent sludges and comparison between ratio of sum of monovalent cations and divalent cations ............................................ 56 Table III-4 - Peak organic sulfur concentration in biosolids samples prepared from different sludges and treatments..................................................................................................... 62
XII
List of Acronyms
SRT Solid Retention Time
VSR Volatile solids removal
Me-10 Mesophilic anaerobic digester operating at 10 day SRT
Me-15 Mesophilic anaerobic digester operating at 15 day SRT
MeAer3 Aerobic digester operating at 3 day SRT and receiving feed from mesophilic anaerobic digester
MeAer6 Aerobic digester operating at 6 day SRT and receiving feed from mesophilic anaerobic digester
MeAer9 Aerobic digester operating at 9 day SRT and receiving feed from mesophilic anaerobic digester
Th-15 Thermophilic anaerobic digester operating at 15 day SRT
Th-20 Thermophilic anaerobic digester operating at 20 day SRT
ThAer3 Aerobic digester operating at 3 day SRT and receiving feed from thermophilic anaerobic digester
ThAer6 Aerobic digester operating at 6 day SRT and receiving feed from thermophilic anaerobic digester
ThAer9 Aerobic digester operating at 9 day SRT and receiving feed from thermophilic anaerobic digester
Thermo (ThAer) series Group of aerobic digesters receiving feed from thermophilic anaerobic digester
Meso (ThAer) series Group of aerobic digesters receiving feed from mesophilic anaerobic digester
ORP Oxidation reduction potential
CST Capillary suction time
BESA Bromoethane sulfonic acid
Fz Th Freeze thaw
XIII
Chapter 1
Literature Review
1.1 Aerobic Digestion
Aerobic digestion is a process that stabilizes waste organic matter using oxygen as the terminal
electron acceptor. During aerobic digestion, biodegradable particulate matter is hydrolyzed and
converted into biodegradable soluble organic matter, releasing ammonia and phosphate. Organic
matter is converted to carbon dioxide, water and active biomass by heterotrophic bacteria. The
lysis: regrowth model using IAWQ ASM No.1 is the common models used to simulate the
aerobic digestion process (Grady et al., 1999).
The volatile solid reduction during aerobic digestion depends on several factors including the
temperature of the operation, solids retention time (SRT) and fraction of biodegradable solids in
the solids (Grady et al., 1999). The operational temperature and SRT can be optimized to gain
efficient solids removal, but the biodegradable solids fraction depends upon the source of
wastewater and wastewater operational characteristics. The specific oxygen uptake rate (SOUR)
and volatile solid removal (VSR) are two common parameters used to measure the degree of
sludge stabilization by aerobic digestion (Eikum & Paulsrud, 1977). Aerobic digestion results in
loss of both volatile suspended solids and fixed suspended solids. Degradation of biodegradable
solids leaves higher amount of non-biodegradable stabilized solids (Eikum & Paulsrud, 1977 and
Grady et al., 1999).
Aerobic digestion can be successfully used for digestion of solids with a high nitrogen content.
Mulder et al (2001) found that optimization of temperature and SRT can achieve efficient
oxidation of ammonia to nitrite and in subsequent stages, denitrification can be used for nitrogen
removal from the system. Oxidation of ammonia leads to the loss of alkalinity during the process
which will decrease the pH of the system so alkalinity addition may be required to maintain the
- 1 -
pH. A disadvantage of aerobic digestion includes inefficient destruction of pathogens at lower
SRTs. Authothermal themophilic aerobic digestion (ATAD) can help in simultaneous volatile
solid removal and pathogen destruction. A high concentration of solids (40,000 mg/L to 60,000
mg/L) is digested aerobically at 45-65 oC. Studies found no nitrification in the ATAD system,
which leads to increase in pH due to ammonia accumulation (Grady et al., 1999). High
concentrations of ammonia and high temperatures can result in inactivation of pathogens in the
system. Contrary to these investigations, Kim et al (2004) and Mason et al (1992) suggested that
aerobic digestion at thermophilic temperatures (more than 55 oC) can also remove nitrogen from
solution by the action of a bacillus-like genre of micro-organisms. The low solubility of oxygen,
foaming and poor dewatering are major problem associated with the ATAD systems (Grady et
al., 1999).
1.2 Anaerobic Digestion
The anaerobic digestion process is a well established digestion process in the wastewater
treatment industry. Mesophilic digestion (35 oC) is widely used for the digestion of municipal
sludge. This can usually achieve more than 38 % volatile solid reduction as per requirement of
40 CFR 503 part (b) to achieve Class-B biosolids. The major disadvantage of the mesophilic
digestion process is that it cannot achieve Class-A biosolids because the process fails to fulfill
the time-temperature exposure criteria for pathogen destruction. Other digestion processes
including the single stage thermophilic digestion and dual stage digestion processes have been
considered and investigated to achieve the Class-A biosolids. The major advantage of Class-A
biosolids is that they have flexibility in land application over Class-B biosolids. A subsequent
section will provide the detail discussion of various anaerobic digestion processes and their
advantages/disadvantages.
1.2.1 Anaerobic Digestion Fundamental
The anaerobic digestion process is thought to consist of 4 steps (see Figure I-1):
1. Hydrolysis,
2. Acidogenesis,
3. Acetogenesis, and
- 2 -
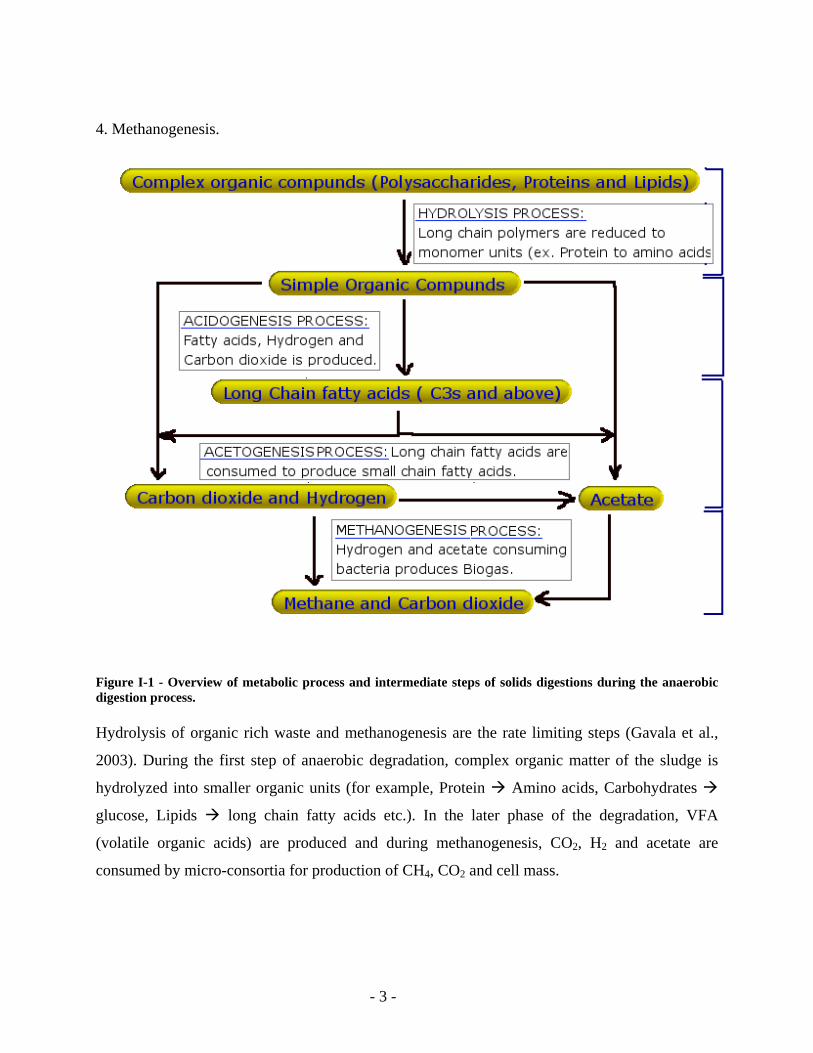
4. Methanogenesis.
Figure I-1 - Overview of metabolic process and intermediate steps of solids digestions during the anaerobic digestion process. Hydrolysis of organic rich waste and methanogenesis are the rate limiting steps (Gavala et al.,
2003). During the first step of anaerobic degradation, complex organic matter of the sludge is
hydrolyzed into smaller organic units (for example, Protein Amino acids, Carbohydrates
glucose, Lipids long chain fatty acids etc.). In the later phase of the degradation, VFA
(volatile organic acids) are produced and during methanogenesis, CO2, H2 and acetate are
consumed by micro-consortia for production of CH4, CO2 and cell mass.
- 3 -
1.2.2 Comparison between mesophilic and thermophilic digestion process
Mesophilic digestion (35 oC) is a widely accepted sludge treatment process in the US and
Europe, but it has limitation in term of pathogen destruction. Due to the high pathogen presence
in biosolids, regulation 40 CFR 503 part (b) limits the solid disposal options for the resulting
biosolids. Investigations suggest that thermophilic digestion can achieve 3-log pathogen
destruction with a minimum 10 day SRT, but at an additional cost of higher energy to elevate the
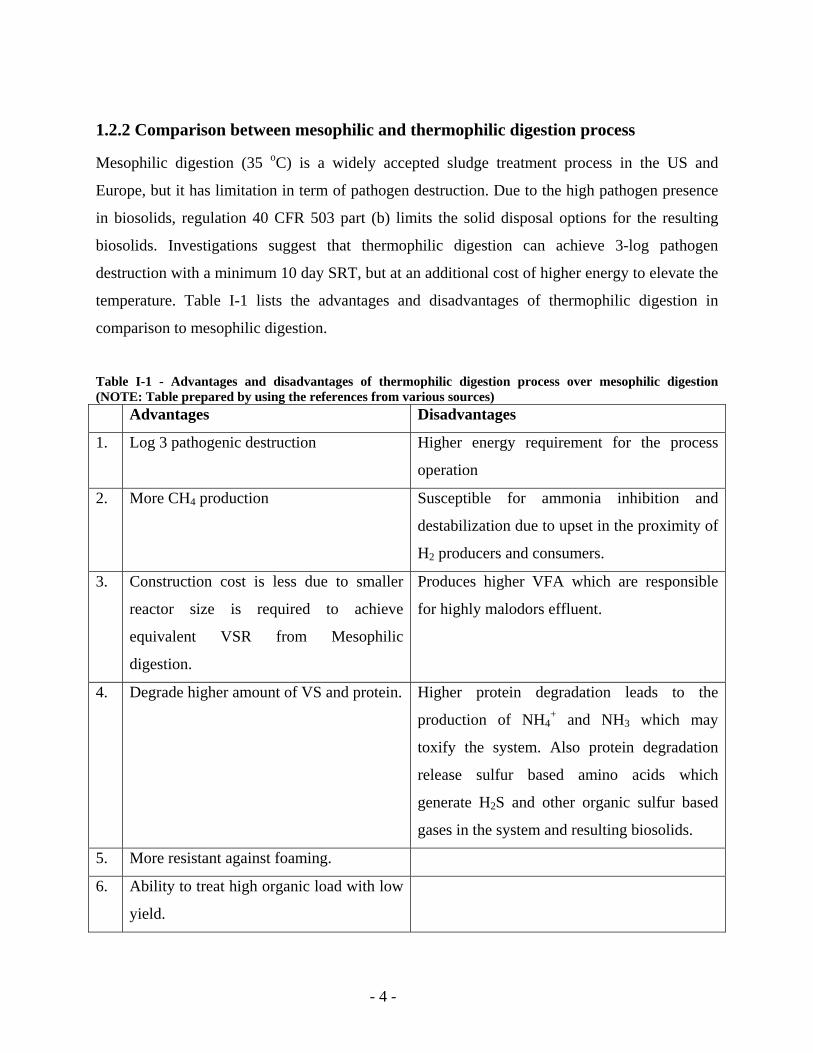
temperature. Table I-1 lists the advantages and disadvantages of thermophilic digestion in
comparison to mesophilic digestion.
Table I-1 - Advantages and disadvantages of thermophilic digestion process over mesophilic digestion (NOTE: Table prepared by using the references from various sources) Advantages Disadvantages
1. Log 3 pathogenic destruction Higher energy requirement for the process
operation
2. More CH4 production Susceptible for ammonia inhibition and
destabilization due to upset in the proximity of
H2 producers and consumers.
3. Construction cost is less due to smaller
reactor size is required to achieve
equivalent VSR from Mesophilic
digestion.
Produces higher VFA which are responsible
for highly malodors effluent.
4. Degrade higher amount of VS and protein. Higher protein degradation leads to the
production of NH4+ and NH3 which may
toxify the system. Also protein degradation
release sulfur based amino acids which
generate H2S and other organic sulfur based
gases in the system and resulting biosolids.
5. More resistant against foaming.
6. Ability to treat high organic load with low
yield.
- 4 -
1.2.3 VFA Degradation
Meon et al (2003) during their comparative study of thermophilic and mesophilic digestion
found that mesophilic digestion produces less VFA and that the VFA concentration increases
with a decrease in the SRT of the digestion process. It has been found that acetic acid is the
major volatile acid, being 4-5 times higher than other volatile acids. Their studies also suggest
that upon decreasing the SRT of the digestion process, propionate, butyrate and valeric acids
accumulate rather than acetic acid.
Low VFA levels are critical for the stability of the anaerobic digesters especially thermophilic
digesters. During methanogenesis, the proximity of H2-producing and H2-consuming microbes is
important for maintaining a low H2 concentration in the digester (Parkin and Owen, 1986). In the
absence of microbial proximity, the pH gets reduced leading to an increase in propionate and
butyrate. Higher chain fatty acids are not the preferred substrate for methanogenesis and further
drop the pH destabilizing the whole anaerobic digestion process (Wang et al., 1999).
1.3 Multi-stage digestion processes
Single stage digestion processes including aerobic and anaerobic digestion have the disadvantage
that the input of new feed recontaminates the sludge with pathogens. Therefore, designers have
used multistage digestion processes to achieve higher VS reduction and achieve higher
pathogenic reduction. To achieve higher VS reduction and process stability, digestion stages are
designed to exploit the benefits of different genre of microbial communities. Most common
microbial communities considered in the process design are acetogens, methanogens,
thermophilic microbes and mesophilic microbes for anaerobic digestion process and
heterotrophic microbes for aerobic digestion. The major focus for multistage digestion has been
on the acid-gas phased digestion (A/GPD) and temperature phased anaerobic digestion (TPAD)
processes. Studies by Tapana et al (2000a, b), and Park et al (2004) also looked into the effect of
pre- and post- aerobic treatment of anaerobic digested sludge. In a subsequent section,
anaerobic/aerobic treatment will be reviewed.
- 5 -
1.3.1 Acid-gas phased digestion
Pohland & Ghosh (1971) first proposed acid-gas phased digestion (A/GPD). In the first stage of
digestion, a low pH is maintained by using low SRT and a high organic load. The low pH
condition favors the growth of acetogens and at SRTs as low as 12 hrs to 2 days, methanogens
are washed out. The second phase, which has higher a SRT (15 to 20 days), is more suitable for
methanogenic growth.
The principal advantage of A/GPD is the ability to optimize hydrolysis and acidogenesis
reactions in the acid reactor and acetogenesis and methane formation in gas phase digester. Other
documented advantages of A/GPD are –
1. More effective for handling organic shock loads (Fox and Pohland, 1994), and
2. Acid stage digesters can help in detoxifying the influent which may otherwise cause harm to
the methanogens, providing a more stabile system in comparison to the single stage digestion.
1.3.2 Temperature phased anaerobic digestion (TPAD)
The TPAD process utilizes the benefits of thermophilic and mesophilic organism during the
different digestion phases of the process. In the TPAD process, the thermophilic stage has SRT
in the range of 3-5 days and the mesophilic stage has SRT range of 15 to 20 days (Dichtl, 1997).
The higher temperature and higher SRTs of the first stage helps to overcome the shortcomings
which are present in single stage digestion processes and A/GPD process as well.
Studies conducted by Inman et al (2004) and Han & Dangue (1997) showed that the TPAD
system can achieve higher volatile reduction than mesophilic digestion and it can produce higher
amount of methane than single stage mesophilic digestion. Vandeburgh & Ellis (2002) showed
that the TPAD process is capable of tolerating higher nitrogen loads.
1.3.3 Aerobic pre- /post- treatment of anaerobic sludge
Aerobic pretreatment and post treatment of anaerobic sludge has been considered by only few
researchers. This combination has been found to produce results superior to conventional
mesophilic digestion in term of dewatering, odor generation and VS reduction. Tapana and
- 6 -
Pagilla (2000a, b) during their investigation of pre and post thermophilic-aerobic treatment of
anaerobic sludge found VS reductions up to 65% with an aerobic digester SRT as short as 1 day.
These researchers found improved dewatering properties for both pre and post treatment in
comparison to conventional mesophilic digester. In another study, Tapana and Pagilla (2000b)
found a VS reduction of 61% for swine sludge as well.
Novak and Park (2004) carried out batch digestion to investigate the effect of pre- and post-
treatment of aerobic digestion on anaerobic sludge. They found that for similar digestion SRTs
under mesophilic conditions, both pre- and post- treatments achieved the same 60% VS
reduction. They also suggested that aerobic pretreatment of WAS leads to the formation of
nitrate which may impede the anaerobic digestion process. During the aerobic-anaerobic
digestion tests, glucose was added during the anaerobic digestion phase to consume the nitrate
produced in the initial aerobic digestion phase. Their study also suggests that the organic
material in sludge can be categorized as:
1. Only anaerobically digestible material.
2. Only aerobically digestible material,
3. Material which can be digested by both anaerobic and aerobic digestion process, and
4. Non-digestible material.
Subramanian (2005) during her studies found that sequentially digested sludge (anaerobic-
aerobic digestion sequence) results in a low CST while anaerobic digested sludges have CST
approximately 10 times higher. In addition, anaerobically digested sludge consumes a higher
polymer conditioning dose in comparison to anaerobic-aerobic sequentially digested sludges.
Her results showed that specific resistance to filtration (SRF) for thermophilic anaerobic sludge
followed by aerobic digestion decreases more than 50%, while for sequential mesophilic
anaerobic–aerobic digestion the decrease is less than 25%. She also found that upon sequential
anaerobic-aerobic digestion, the bound water content of the resulting biosolids also decreased
substantially.
- 7 -
1.4 Waste-activated sludge and the role of cations
Waste-activated sludge contributes a substantial amount of solids and the digestion of the
material in sludge floc has been found to be associated with cations present in the floc matrix
(Park et al, 2005). Novak & Higgins (1997), Novak et al (2003) and Park et al (2004) found that
the major cations associated with the sludge floc are sodium, potassium, calcium, magnesium,
iron and aluminum. Frølund et al (1996) proposed a sludge floc model in which a floc consists of
micro-consortia embedded in matrix of biopolymers including proteins, polysaccharide, DNA
and humic acids. These biopolymers are bound in the sludge matrix and are associated with
different cations. During aerobic digestion, divalent cations accumulate in the solution resulting
from the release of lectin-like proteins which are then degraded. Higgins and Novak (1997), and
Novak et al (2003) suggest that lectin-like protein is bound in the sludge floc matrix along with
polysaccharide. The polysaccharides concentration increases during aerobic digestion because of
cessation of polysaccharide degrading enzyme’s activity (Novak et al, 2003). During anaerobic
digestion, ferric bound biopolymer is released upon the reduction of Fe(III) to Fe(II) and is
degraded (Park et al, 2004).
Movovalent cations are considered to deflocculate activated sludge floc, while multi-valent
cations are found to stabilize the floc matrix (Novak and Higgins, 1997; Murthy and Novak,
1999). Kakii et al (1985) in their study, found that aluminum and ferric cations have higher
valency and lower solubility than any other type of cations and hence play more critical role in
floc formation. It has also been documented that iron has a strong tendency to get bound along
with proteins. The role of aluminum is considered equally important in the sludge. It is found to
coagulate polysaccharides and humic acids from the solution, but little information is available
about the role of aluminum associated biopolymer.
1.5 Odor production in biosolids
Odor production from the digested biosolids is one of the major problem utilities are trying to
solve. Odor restricts biosolids disposal options for the utilities and increases the cost of biosolid
handling. Studies carried out by Muller et al (2004) and Novak & Murthy (2002) suggest that
- 8 -
centrifugation of biosolids along with polymer addition shear the sludge solids and makes
additional biopolymer available for microbial degradation. They also suggest that biosolids
produced using a belt filter press will produce less odors in comparison to that from a centrifuge.
Digested biosolids have high protein in solution and contain undigested volatile solids which can
serve as good food source for anaerobic microorganisms. During biosolids storage, anaerobic
conditions persist and the protein is broken down into cysteine and methionine followed by
production of methanethiol, which is then converted to sulfide by methanogenic bacteria. Other
gases which are considered to contribute towards the odors from the biosolids are dimethyl
sulfide (DMS) and dimethly disulfide (DMDS). Higgins et al 2002 and Lomas et al (1999a, b, c
and 2001) suggest that sulfur based gases are either consumed or get demethylated by set of
other bacteria present in the biosolids. Methanogenic consortia are found to be more active under
anaerobic conditions for cycling sulfur based gases. Higgins et al (2003) summarized the cycling
of sulfur based odor causing gases as a set of interconnected reactions. It was suggested that
methyl mercaptan can be methylated form to dimethyl sulfide or it can be oxidized to dimethyl
sulfide. Demethylation of dimethyl disulfide produces dimethyl sulfide, which on demethylation
produces hydrogen sulfide. Methionine, cysteine, and sulfate are the substrate for the used by
microbes for the energy generation.
Verma (2005) found that the iron content in the sludge was correlated with the odor generation
from the anaerobically digested biosolids. A strong correlation between VS reduction by
anaerobic digestion and the iron content of the sludge has been found by Park et al (2005)
supporting the role of Fe reduction during anaerobic digestion. In another study (Verma, 2005),
the effect of the anaerobic digestion SRT has been investigated and investigators found that the
peak organic sulfur concentration in digester headspace as well as biosolid cake decreases with
an increase in the digester SRT. Methanogens in the biosolids can reduce the odor by consuming
organic sulfur compounds and producing H2S, which later precipitate out as FeS if sufficient iron
is present in biosolids (Novak et al, 2005).
- 9 -
Another factor which has been found associated with excess odor from the sludge has been
freezing followed by thawing. When biosolids are applied on the land after dewatering process,
they under go freeze-thaw process during the seasonal cycle and it has been reported that after
freeze-thaw cycle biosolids produce more odors (Personal communication with S. Murthy).
Freeze-thaw has been investigated for the purpose of sludge conditioning because it enhances
sludge dewatering, reduces sludge bound water (Lee and Hsu, 1994) and transforms the floc
structure into a more compact form (Vesilind et al, 1991, Kawaski and Matsuda, 1995). Lee et al
(1999) also found that instant freezing the sludge has no effect on microbial activity reduction.
This suggests that microbes will be able to recover as soon as the sludge is thawed and they will
use the bioavailable protein for growth resulting in odor generation from the biosolids.
1.6 Nitrogen removal
Treatment of sludge having a high nitrogen content has always been a difficult task, especially
for anaerobic treatment because ammonia can inhibit microbes that are active in this process
(Hansen et al, 1997 and Sung et al, 2003). Aerobic treatment has been mainly considered for the
treatment of sludge that contains higher influent nitrogen, but challenges still remains due to the
inhibition of nitrification by free ammonia and nitrous acid. Bhargava and Datar (1988) reported
that the optimal temperature for the nitrification is between 25-30 degree C and maximum
nitrification is achieved at 30 degree C. The optimal pH range for both steps of nitrifications is
between 6 and 8. It has been suggested that at thermophilic conditions little or no nitrification
will occur due to inactivation of nitrifying organisms (EPA, 1990), but Kim et al (2003) found
that in thermophilic aerobic digestion nitrogen removal can be achieved. They found that 91%
nitrogen removal can be achieved with an HRT of 3 days and temperature ranging from 50 to 70 oC. In another study Kim et al (2004) found that the Bacillus genre of microbial community is
more important in removal of ammonia from a thermophilic aerobic digester. They also found
that 29% nitrogen removal took place due to nitrogen gas formation due to deammonification.
N2O is also found in the gas mixture suggesting a biologically assisted nitrogen reduction
process.
- 10 -
Another study carried out by Akunna et al (1994) showed aerobic post treatment of anaerobic
digested effluent can achieve another 30% COD removal and 70% nitrogen removal in the
effluents. Another result from the same study suggests that carbon and nitrogen removal in
sludge is a result of aeration rate and the recycle-to-influent ratio. Recycling of the sludge also
has been found to impact the methane production in the anaerobic treatment phase as well
(Akunna et al, 1994). Systems having higher organic load are more suitable for the heterotrophic
bacteria which out compete autotrophic nitrifiers that lead to nitrification inhibition. Pollice et al
(2002) investigated the effect of sludge age and aeration on oxidation of ammonia to nitrite. The
results indicate that the sludge age is critical parameter for partial nitrification when the oxygen
supply is not limiting. The oxidation of ammonia to nitrite was successfully achieved during a
sludge retention time of about 10 days. The ratio of nitrite to nitrate depends upon the SRT due
to difference in the growth rate of ammonia oxidizing bacteria and nitrite oxidizing bacteria.
Nitrite oxidizing bacteria have slow growth rate, hence nitrate production is lower than nitrite
production from the oxidation of ammonia (Hellinga et al, 1998).
1.7 Summary and Study objectives
The literature review and work done in the environmental laboratories of Virginia Tech suggests
that either of anaerobic or aerobic digestion process alone cannot achieve all desired qualities
(higher VS reduction, better dewatering, and low order production) in resulting biosolids.
Anaerobic digested sludges are stable and have low volatile solids, but they have poor
dewatering which increases the polymer demand & hence operation cost. They also produce
higher sulfur odor which limit the disposal options. Aerobic sludge show comparative better
dewatering but have low pathogen reduction potential as compared to anaerobic digested sludge.
The concentration of influent nitrogen in the digesters is also a limiting factor in the selection of
a digestion process. The size of wastewater treatment utilities and financial constraints are other
aspects that control the design of digestion processes. The results from the recent studies suggest
that combination of anaerobic-aerobic digestion processes may help in producing better
biosolids. This study aims to investigate the performance of anaerobic-aerobic digestion by
studying –
1. The effect of anaerobic and aerobic SRTs on VS reduction,
- 11 -
2. Nitrogen removal in the aerobic digesters,
3. Effect of anaerobic phase temperature on the nitrogen removal,
4. Change in the dewatering properties upon aerobic digestion of anaerobic effluent, w.r.t.
to dewatering of only anaerobic digested effluent,
5. The effect of aerobic digester on the odor generation from resulting biosolids and effect
of aerobic SRTs on the odor production, and
6. The effect of freeze-thaw on the odor production.
1.8 References
Akunna, J., Bizeau, C., Moletta, R., Bernet, N., and Heduit, A (1994). Combined organic
carbon and complete nitrogen removal using anaerobic and aerobic upflow filters. Water Sci.
Tech., 30 (12): 297-306.
Bhargava, D.S. and Datar M.T (1988). Progress and kinetics of aerobic digestion of
secondary sludges. Water Res., 22 (1): 37-47.
Bhargava, D.S. and Datar M.T (1989). An analysis of nitrification during the aerobic
digestion of secondary sludges. Environ Pollut., 58: 57-72.
Dichtl, N (1997) Thermophilic and mesophilic (two-stage) anaerobic digestion. Water
and Env. Mgmt: Journal of CIWEM., 11 (2): 98-104.
Eikum, A.S.; and Paulsrud, B. (1977). Method for measuring degree of stability of
aerobic stabilized sludge. Water Res., 11 (9): 763-770.
EPA. (1990). Autothermal thermophilic aerobic digestion of municipal wastewater
sludge. EPA Technology transfer, EPA/625/10-90/007.
Fox, P., and Pohland, F.G (1994). Anaerobic treatment applications and fundamentals:
substrate specificity during phase separation. Water Env. Res., 66 (5): 716-724.
- 12 -
Frolund, B., Palmgren, R., Keiding, K. and Nielsen, P. H. (1996): Extraction of
Extracellular Polymers from Activated Sludge using a Cation Exchange Resin. Wat. Res., 30:
1749-1758.
Gavala, H.N., Yenal, U., Skiadas, I.V, Westermann, P, and Ahring, B.K (2003).
Mesophilic and thermophilic anaerobic digestion of primary and secondary sludge. Effect of
pre-treatment at elevated temperature. Water Research, 37: 4561 – 4572.
Grady L, Diagger G. and Lim (1999) Biological Wastewater Treatment, 2nd Edition.
Publishers – Marcel Dekker, USA.
Hansen, K.H.; Angelidaki, I; Ahrin, B.K., (1997). Anaerobic digestion of swine manure:
inhibition by ammonia. Water. Res., 32: 5-12.
Han, Y., Dague, R.R. (1997) Laboratory studies on the temperature-phased anaerobic
digestion of domestic primary sludge. Water Environ. Res., 69 (6): 1139-1143.
Hartree, E.F. (1972) Determination of Protein: A Modification of the Lowry Method
That Gives a Linear Photometric Response. Anal. Biochem., 48: 422.
Hellinga C.; Schellen, A.A.J.C; Mulder, J.W.; van Loosdrecht, M.C.M and Heijnen, J.J.
(1998). The SHARON process: An innovative method for nitrogen removal from ammonium-rich
wastewater. Water Science Technology, 37 (9): 135-142.
Higgins. M.J, and Novak, J.T. (1997). Characterization of exocellular protein and its
role in bioflocculation. Jour. of Envron. Engr., 123: 479-485.
Higgins, M.J., Yarosz, D.P., Chen, Y., Murthy, S.N., Maas, N.A., Cooney, J.R. and
- 13 -
Glindemann, D. (2002). Mechanisms of Volatile Sulfur Compound and Odor production in
Digested Biosolids. Residuals and Biosolids Conference 2003, Baltimore, MD.
Inman, D.C., (2004). Comparative study of alternatives anaerobic- digestion
technologies. Thesis submitted at Virginia Tech.
Kakii, K., Kitamura, S., Shirakashi, T., and Kuriyama, M. (1985). Effect of calcium ion
on sludge characteristics. J. Fermentation Tech., 63: 263-270.
Kawaski, K. and Matsuda, A. (1995) Effect of dissolved solids concentration on freezing
and thawing of excess activated sludge. Kagaku Kogaku Ronbunsyu., 21: 859-865.
Kim, S., Yi,Y.-S., An, S., Choi, S.I., Choi, E. and Yun, Z. (2003). Gas Analysis reveals
novel aerobic deammonification in thermophilic aerobic digestion. Wat. Sci. Tech., 47(10): 131-
138.
Kim, S., Lee, J.-W., Lee, H. –W., Lee, S. –Y., Park, Y. –K., Han, J.-H., S. Choi, S.I., and
Yun, Z. (2004). Nitrogen removal characteristics analyzed with gas and microbial community in
thermophilic aerobic digestion for piggery waste treatment. Water Sci. Tech., 49 (5-6): 349-357.
Lee, D. J. and Hsu, Y.H. (1994). Fast freeze-thaw treatment on activated sludge: floc
structure and sludge dewaterability. Environ. Sci. Tech., 28: 1444-1449.
Lee, D. J.; Chu, C.P; W.C, Feng; Chang, B; and Chou, C.H. (1999). Reduction of
microbial density level in wastewater activated sludge via freezing and thawing. Water Res., 33
(16): 3532–3535.
Lomans, B.P., H.J.M. Op Den Camp, A. Pol, C. Van Der Drift, and G.D. Vogels (1999a)
Role of Methanogens and Other bacteria in Degradation of Dimethyl Sulfide and Methanethiol
in Anoxic Freshwater Sedimetns. Applied Env. Microbio., 65: 2116-2121
- 14 -
Lomans, B.P., R. Mass, R. Luderer, H.J.M. Op Den Camp, A. Pol, C. Van Der Drift, and
G.D. Vogels (1999b) Isolation and Characterization of Methanomethylovorans hollandica
gen.nov., sp. Nov., Isolater from Freshwater Sediment, A Methylotrophic Methanogen Able to
Frow on Dimethyl Sulfide and Methanethiol. Applied Env. Microbiol., 65: 3641-3650.
Lomans, B.P., H.J.M. Op Den Camp, A. Pol, and G.D. Vogels (1999c) Anaerobic versus
Aerobic Degradation of Dimethyl Sulfide and Methanethiol in Anoxic Freshwater Sediments.
Applied and Env. Microbiol., 65: 438-443.
Lomans, B.P., R. Luderer, P. Steenbakkers, A. Pol, C. Van Der Drift, G.D. Vogels, and
J.J.M. Op Den Camp (2001) Microbial Populations Involved in Cycling of Dimethyl Sulfide and
Methanethiol in Freshwater Sediments. Applied and Env. Microbiol., 67: 1044-1051.
Mavinic, D.C. and Koeres, D.A.(1982). Fate of Nitrogen in aerobic sludge digestion.
Journal of water pollution control federation, 54: 352- 360.
Mason, C.A., Haner, A. and Hamer, G. (1992). Aerobic thermophilic waste sludge
treatment. Wat. Sci. Tech., 25 (1): 113-118.
Metcalf and Eddy Inc. (2003) Wastewater engineering: Treatment and reuse. 4th Edition.
McGraw-Hill, New York, NY.
Moen, G.H., Stensel, D., Lepisto, R., and Ferguson, J.F. (2003). Effects of solids
retention time on the performance of thermophilic and mesophilic digestion of combined
municipal wastewater sludges. Water Env. Res., 75 (6): 539-548.
Mulder J.W., Loosdrecht, M.C.M, Hellinga, C. and Kempen, R. (2001). Full Scale
application of the SHARON process for treatment of rejection water of digested sludge
dewatering. Water Sci. & Tech., 43 (11): 127 – 134.
- 15 -
Muller, C.D., Verma, N., Higgins, M.J. and Novak J.T. (2004). The Role of Shear in the
Generation of Nuisance Odors from Dewatered Biosolids. WEFTEC 2004 Annual Conference,
New Orleans, LA.
Murthy, S.N. and Novak, J.T., (1999). Factors affecting floc properties during aerobic
digestion: implications for dewatering. Water Environ. Res, 71: 197 – 202.
Murthy, S.N., Forbes, B., Burrowes, P., Esqueda, T., Glindemann, D., Novak, J.T.,
Higgins, M.J., Mendenhall, T. and Toffey, W. (2002a). Impact of High Shear Solids Processing
on Production of Volatile Sulfur Compounds from Anaerobically Digested Biosolids. WEFTEC
2002 Annual Conference, Chicago, IL.
Murthy, S.N., Higgins, M.J., Chen, Y., Toffey, W. and Golembeski, J. (2003). Influence
of Solids Characteristics and Dewatering Process on Volatile Sulfur Compound Production from
Anaerobically Digested Biosolids. Biosolids Conference 2003.
Novak J.T., Sadler, M.E. and Murthy S.N. (2003). Mechanism of floc destruction during
anaerobic and aerobic digestion and the effect on conditioning and dewatering of biosolids.
Water Res., 37: 3136 – 3144.
Novak J.T., C. Park and M.M. Abu-Orf. (2004). Conditioning and Dewatering of
Digested Waste Activated Sludges. Jour Res. Sci. Tech., 1: 47 – 53.
Novak J.T., C. D. Muller and S. N. Murthy (2001) Floc Structure and the Role of Cations
Wat. Sci. Tech., 44: 209 – 213.
Novak, J.T., Adams, G., Chen, Y-C., Erdal, Z., Forbes, R.H. Jr., Glindemann, D.,
Hargreaves, J.R., Hentz, L., Higgins, M.J., Murthy, S.N. and Witherspoon, J. (2005). Odorous
Gas Generation Patterns From Anaerobically Digested Biosolids. Wat. Env. Res., 77, (in press)
- 16 -
Novaes, R.F.V. (1986). Microbiology of anaerobic digestion. Water Sci. Tech., 18: 1 -14.
Park,C., Abu-Orf, M.M., and Novak, J.T. (2004). Predicting the digestibility of waste
activated sludges using cation analysis. MS thesis submitted at Virginia Tech.
Parkin, G. F., Owen, W.F. (1986) Fundamentals of anaerobic digestion of wastewater
sludges. J. Environ. Eng., 112: 867-920.
Pohland, F.G., and Ghosh, S. (1971) Developments in anaerobic stagilization of organic
wastes—the two-phase concept. Env. Letters, 1 (4): 255-266.
Pollice, A., Tandoi, V. and Lestingi, C. (2002). Influence of aeration and sludge retention
time on ammonia oxidation to nitrite and nitrate. Water Res., 36 (10): 2541-2546.
Subramanian, S., (2005). Digestion processes and their effect on dewatering and Bound
water content of sludge. MS thesis submitted at Virginia Tech.
Sung, S.; and Liu, T. (2003). Ammonia inhibiton on thermophilic anaerobic digestion.
Chemosphere, 53: 43- 52.
Tapana, C. and Pagilla, K.R. (2000a). Aerobic thermophilic and anaerobic mesophilic
treatment of sludge. Jour. of Env. Engr. September, 790-795
Tapana, C. and Pagilla, K.R. (2000b). Aerobic thermophilic and anaerobic mesophilic
treatment of Swine waste. Water Res. 34 (10): 2747 – 2753.
Vandenburgh, S.R., Ellis, T.G. (2002) Effects of varying solids concentration and
organic loading on the performance of temperature phased anaerobic digestion process. Water
Env. Res. 74 (2): 142-148.
- 17 -
Verma, N., (2005). Anaerobic Digestion: Factors Effecting Odor Generation. MS thesis
submitted at Virginia Tech.
Vesilind, P.A., Wallinmaa, S. and Marte,C. J. (1991). Freeze-thaw sludge conditioning
and double layer compression. Can. J. Civ. Eng., 18: 1078-1083.
Wang, Q; Kuninobu, M; Ogawa, H; nd Kato, Y. (1999). Degradation of volatile fatty
acids in high quality efficient anaerobic digestion. Biomass & Bioenergy, 16: 407-416
- 18 -
Chapter 2
Efficient Nitrogen removal and volatile solid reduction in sequential
anaerobic-aerobic digestion process
Kumar, Nitin2; Novak, J.T.1,2 and Murthy Sudhir3
1Corresponding author 2 Virginia Tech, Blacksburg 3 DC wastewater and sewer authority, Washington DC.
Abstract
Sequential anaerobic–aerobic digestion has been studied for use in wastewater treatment, but has
had limited use for digestion of waste solids. Recent studies suggest that some solids in sludge
are degraded only during anaerobic digestion and some only during aerobic digestion. Therefore,
dual digestion (anaerobic/aerobic) is expected to provide additional volatile solids reduction
beyond that which can be achieved by either anaerobic or aerobic digestion alone. In this
investigation, dual digestion was compared with single stage anaerobic digestion using both
mesophilic (350C) and thermophilic (550C) digestion. The results show that dual digestion was
able to achieve more than 60% VS reduction, compared to 46% and 52% by mesophilic and
thermophilic digestion, respectively alone. Aerobic digestion SRTs of 3, 6 and 9 days were
studied and increased VS reduction was observed for all aerobic detention times. This study also
shows that more than 50% total nitrogen could be removed from the anaerobic effluent after
digesting at aerobic conditions.
Keywords – Thermophilic digestion, Mesophilic digestion, sequential anaerobic-aerobic
digestion, nitrogen removal, denitrification, ammonia stripping, and TKN removal.
2.1 Introduction
Biosolids management is one of the important aspects for the wastewater treatment utility
because of financial and health and safety issues. The cost of biosolid hauling is a major
expenditure for wastewater treatment utilities. Pathogens and odor problems may restrict the
- 19 -
biosolid disposal options and affect hauling cost. Biosolids applied to land can also impact
ground water quality, primarily through nitrogen contamination. Mesophilic (35 oC) anaerobic
digestion is one of the common solid stabilization processes for removal of volatile solids and
COD. Utilities that have high influent organic nitrogen content may prefer to use aerobic
digestion due to the inhibition of the anaerobic process by ammonia. Both conventional aerobic
and anaerobic digestion processes at mesophilic temperature have disadvantages, including the
inability to achieve desired pathogen reductions, poor dewatering and odor production.
Operations at thermophilic temperature are relatively more prone to destabilization, but have
potential of producing class-A biosolids.
Ghosh and Pohland (1971) studied dual phase digestion processes (acid/gas phased digestion,
A/GPD, and temperature phased anaerobic digestion, TPAD) and found that dual phase digestion
processes can perform better than single phased digestion. A/GPD and TPAD both provide stable
digestion and can tolerate comparatively high concentrations of ammonia and other toxins. These
digestion processes provide higher VS reduction, more methane production and higher pathogen
reduction, however they have the disadvantages of poor dewatering and high odor production.
Another major disadvantage of anaerobic digestion is the high concentration of nitrogen in the
digested sludge and subsequent centrate produced during dewatering. Recycle of centrate back
to the head of the plant add a high ammonia-nitrogen load into the system.
Tapana et al (2002) investigated an anaerobic and aerobic digestion combination to treat swine
waste, to determine the effect of pre and post aerobic treatment of anaerobic digestion. They
found that with both thermophilic aerobic- mesophilic anaerobic combination and mesophilic
anaerobic–thermophilic aerobic digestion a higher load of nitrogen could be treated with
comparatively better dewatering properties and higher VS reduction. Both combinations have
been found to meet the class-A requirements for pathogen reduction. The study suggested that
one day of aerobic digestion can be sufficient to achieve the desired treatment goals.
Subramanian (2005) also found improved dewatering and low polymer conditioning requirement
for sequential anaerobic-aerobic digested biosolids.
- 20 -
Novak et al (2003) found that during anaerobic and aerobic digestion of waste activated sludge
(WAS), VS reduction was due to the degradation of different portions of the floc matrix. Novak
and Higgins (1997) proposed a floc structure in which proteins and polysaccharides are bound to
each other with divalent cations (calcium and magnesium). The proteins observed were similar to
lectin and during aerobic digestion this lectin-type protein gets degraded releasing divalent
cations and polysaccharide in the solution. Polysaccharide degradation was not substantial and it
was found that during aerobic digestion polysaccharide degrading enzymes are inhibited. Park et
al (2004) has shown that anaerobic digestion of WAS degrades iron bound protein. Both these
studies together suggest that different fractions of volatile solids exit. Only particular types of
fractions are degraded during anaerobic and aerobic digestion processes.
Another important aspect of the anaerobic-aerobic sequential digestion process is removal of
nitrogen. Akunna et al (1994) showed that aerobic post treatment of anaerobic digested effluent
can achieve another 30% COD removal and 70% nitrogen removal. The investigators show that
at a low COD/N ratio, nitrogen is lost from the system as N2 and N2O. Hanaki et al (1992)
reported that pH, dissolved oxygen (DO) and short detention time are the other factors that affect
N2O formation during denitrification.
Sequential anaerobic-aerobic digestion has the potential for improving digestion of waste sludges
and reducing the nitrogen in recycle streams. The objectives of this investigation were to
evaluate the performance of sequential anaerobic-aerobic digestion in detail, including:
1. The effect of anaerobic and aerobic phase digestion detention times on the volatile solids
reduction,
2. The effectiveness of the nitrogen removal process in two phase anaerobic-aerobic
digestion, and
3. The effect of the anaerobic phase temperature (mesophilic versus thermophilic) on
nitrogen removal in aerobic phase.
- 21 -
During this study one of the thermophilic digester performed poorly and provide the opportunity
to study the effectiveness of aerobic digestion when the first stage anaerobic digestion process
malfunctioned.
2.2 Material and methods
2.2.1 Bioreactor operation:
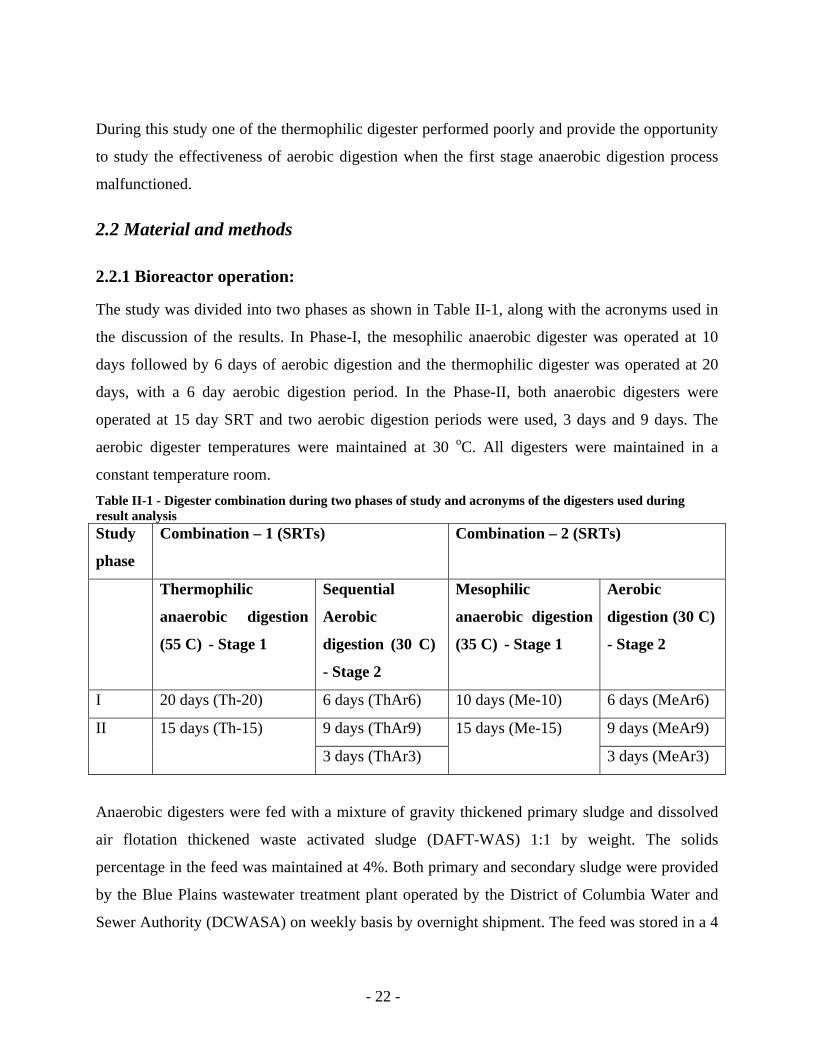
The study was divided into two phases as shown in Table II-1, along with the acronyms used in
the discussion of the results. In Phase-I, the mesophilic anaerobic digester was operated at 10
days followed by 6 days of aerobic digestion and the thermophilic digester was operated at 20
days, with a 6 day aerobic digestion period. In the Phase-II, both anaerobic digesters were
operated at 15 day SRT and two aerobic digestion periods were used, 3 days and 9 days. The
aerobic digester temperatures were maintained at 30 oC. All digesters were maintained in a
constant temperature room. Table II-1 - Digester combination during two phases of study and acronyms of the digesters used during result analysis Study
phase
Combination – 1 (SRTs) Combination – 2 (SRTs)
Thermophilic
anaerobic digestion
(55 C) - Stage 1
Sequential
Aerobic
digestion (30 C)
- Stage 2
Mesophilic
anaerobic digestion
(35 C) - Stage 1
Aerobic
digestion (30 C)
- Stage 2
I 20 days (Th-20) 6 days (ThAr6) 10 days (Me-10) 6 days (MeAr6)
9 days (ThAr9) 9 days (MeAr9) II 15 days (Th-15)
3 days (ThAr3)
15 days (Me-15)
3 days (MeAr3)
Anaerobic digesters were fed with a mixture of gravity thickened primary sludge and dissolved
air flotation thickened waste activated sludge (DAFT-WAS) 1:1 by weight. The solids
percentage in the feed was maintained at 4%. Both primary and secondary sludge were provided
by the Blue Plains wastewater treatment plant operated by the District of Columbia Water and
Sewer Authority (DCWASA) on weekly basis by overnight shipment. The feed was stored in a 4
- 22 -
oC room until used. Sludge was fed to the anaerobic digesters once per day and an equivalent
volume of digested sludge was removed from the digester. The anaerobic digested effluent was
fed to the aerobic digesters, maintaining the volume of the digester to keep the SRT constant.
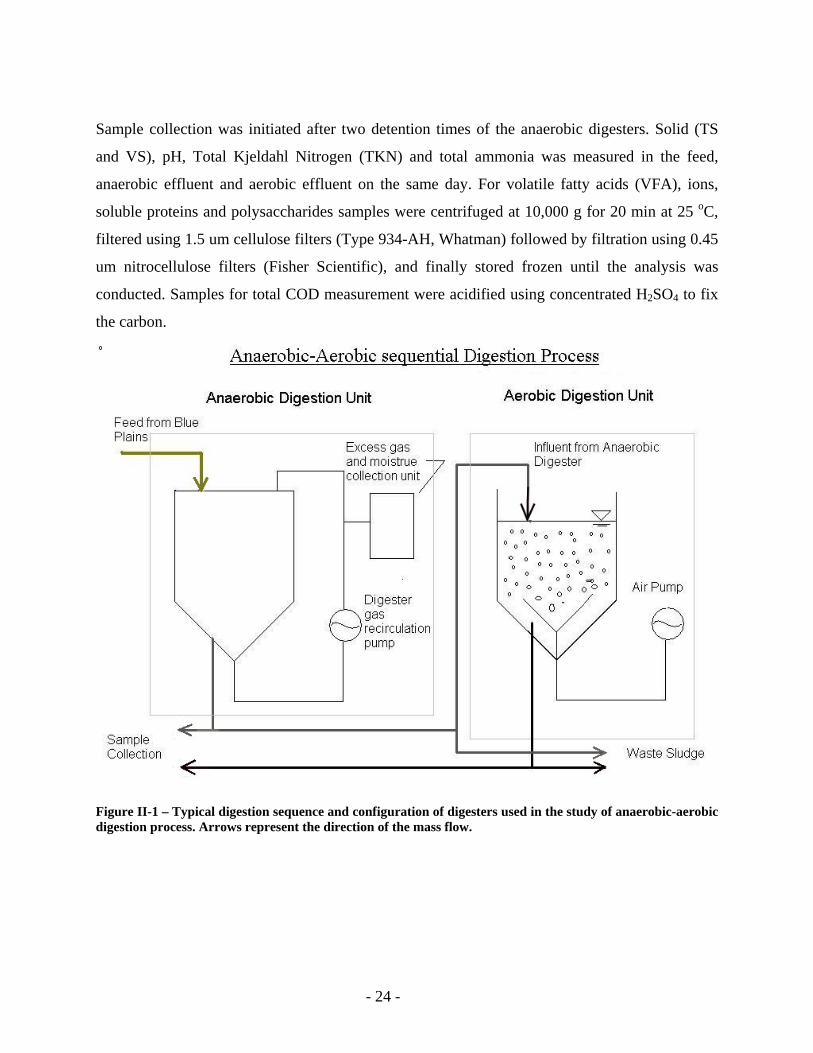
Figure II-1 shows the mass-flow and stage set-up of anaerobic-aerobic sequential digestion
process.
For anaerobic digestion, plastic conical (egg-shaped) fermenters manufactured by Hobby
Beverage Equipment Company were used. Anaerobic digesters were mixed by re-circulating gas
from the headspace to the bottom of digester using Cole-Parmer 6-600 RPM variable speed
pumps (operated at 40% of their maximum possible speed). No extra heating was provided for
maintaining the temperature of the mesophilic digester, but for thermophilic digestion, hot water
at 63 oC was circulated through poly-vinyl pipe around the periphery of thermophilic digester
and the system was wrapped in insulating material to avoid heat loss. Gas produced during the
digestion process from anaerobic digesters was collected in airtight Tedlar gas bags (Fisher
Scientific) and periodic measurement of the gas volume and gas content was carried out. Due to
the high operating temperature, water evaporated from the thermophilic digester and it was
captured using a water trap. The average water loss was 50 ml per day and this water was
reintroduced in the digester daily.
Aerobic digestion was carried out in stainless steel digesters provided by Blinchmann
Engineering, except for digestion carried out at the 3 day SRT. For the 3 day aerobic digester, 9
L glass digesters (Fisher Scientific) were used due to the small operation volume (only 3 L). For
aerobic digestion, mixing was achieved using external pumps (Cole Parmer, 6-600 RPM) and for
aeration, air was supplied from a compressor and aeration-stones were used for oxygen transfer.
Water was lost from the aerobic digesters due to evaporation and this water was replaced each
day by adding distilled water prior to the sampling and wasting the effluent from the digesters.
The dissolved oxygen level in all of the digesters was maintained at 3.0 ppm using flow
regulating values.
- 23 -
Sample collection was initiated after two detention times of the anaerobic digesters. Solid (TS
and VS), pH, Total Kjeldahl Nitrogen (TKN) and total ammonia was measured in the feed,
anaerobic effluent and aerobic effluent on the same day. For volatile fatty acids (VFA), ions,
soluble proteins and polysaccharides samples were centrifuged at 10,000 g for 20 min at 25 oC,
filtered using 1.5 um cellulose filters (Type 934-AH, Whatman) followed by filtration using 0.45
um nitrocellulose filters (Fisher Scientific), and finally stored frozen until the analysis was
conducted. Samples for total COD measurement were acidified using concentrated H2SO4 to fix
the carbon.
Figure II-1 – Typical digestion sequence and configuration of digesters used in the study of anaerobic-aerobic digestion process. Arrows represent the direction of the mass flow.
- 24 -
2.2.4 Analytical methods:
For determining the performance of the digesters, total solids, volatile solids in and out of each
digester were measured according to Standard Methods for the Examination of Water and
Wastewater (Standard Methods) (APHA 1999). Gas production, percentage gas distribution, pH,
DO, digester temperature, chemical oxygen demand (COD), Total Kjeldahl Nitrogen (TKN),
ammonia, selected dissolved ions and volatile fatty acids (VFA) measurements were done
according to standard methods (APHA, 1999). DO, pH, solids percentage measurement were
conducted on alternative days, while TKN and ammonia concentrations were measured once a
week. The COD was measured on 5 samples collected during each operation phase.
The gas volume was measured every alternative day while emptying the gas bags and gas
content measurements were done once a week. Gas volume measurements were made with a gas
flow sensor (McMillan Co., 100T), coupled with an analog input process meter (with totalizer
feature). Methane and carbon-dioxide percentage in gas were analyzed using a Shimadzu GC14-
A gas chromatograph (Shimadzu Scientific Instruments, Columbia, MD) using a thermal
conductivity detector (TCD). Helium was used as the carrier gas with 17 mL/min flow in the
detector column. For measuring the ammonia stripping from the aerobic digesters, an annular
denuder (URG Crop.) was used with internal coating of 1% citric acid solution. Annular denuder
preparation and sampling was done as it is mentioned in Compendium of Methods for Inorganic
Air Pollutant (Method IO-4.2)
Samples for VFA and anion analysis were collected twice a week. VFAs and dissolved anions
(NO2-, and NO3
-), samples were centrifuged at 10,000 g for 20 min at 25 oC followed by 1.5um
filtration. The filtered samples were frozen and then thawed at room temperature for analysis.
Thawed samples were centrifuged at 5,000 g for 10 min and filtered further at 0.45 µm. 900 µL
VFA samples were acidified by adding 100 µL phosphoric acid and were analyzed using a
Shimadzu GC-14-A gas chromatograph with a flame ionization detector. Helium, nitrogen, and
hydrogen were the main gases used for analysis purpose. Air was used for makeup and flow rate
of different gases were:
- 25 -
1. Helium – 17 mL/min
2. Nitrogen – 13 mL/min,
3. Hydrogen – 45 mL/min, and
4. Air – 450 mL/min.
Anion concentration in the samples were measured using Dionex D-120 ion chromatograph
(Dionex Corp., Sunnyvale–CA). For cation measurement, CS-12 column equipped with
conductivity detection with self generating suppression of eluent. 20mM methanesulfonic acid
was used for eluent at 1 mL/min flow rate, while for anion measurement AS9-HC column was
used with AG9-HC guard column.
Oxidation and reduction potential (ORP) in the aerobic digesters was measured using the OPR
probe (Model 96-78-BN) from Thermo Electron Corp. and light solution was used to calibrate
the instrument. Due to the volatile environment in the aerobic digesters ORP measurements were
taken after 1 min after introducing the probe in the aerobic digester.
2.3 Results and Discussion
2.3.1 Anaerobic Digester performance
Phase-I - For the first phase of study, anaerobic detention times were selected to support the data
for another study running in parallel. A six day aerobic SRT was selected for aerobic digestion of
volatile solids to provide sufficient time for nitrifying bacteria to grow.
Phase-II - SRTs were selected in this phase to directly compare the performance of the
thermophilic and mesophilic digestion and following aerobic digesters. Fifteen day anaerobic
digestion was used since it is the most common detention time for anaerobic digestion. For
aerobic digestion, 3 and 9 days SRTs were used to investigate in detail the effect of aerobic
detention time on different performance parameters including VFAs, volatile solid reduction, and
nitrogen removal from the anaerobic digested effluent. Table II-2 summarizes the average
- 26 -
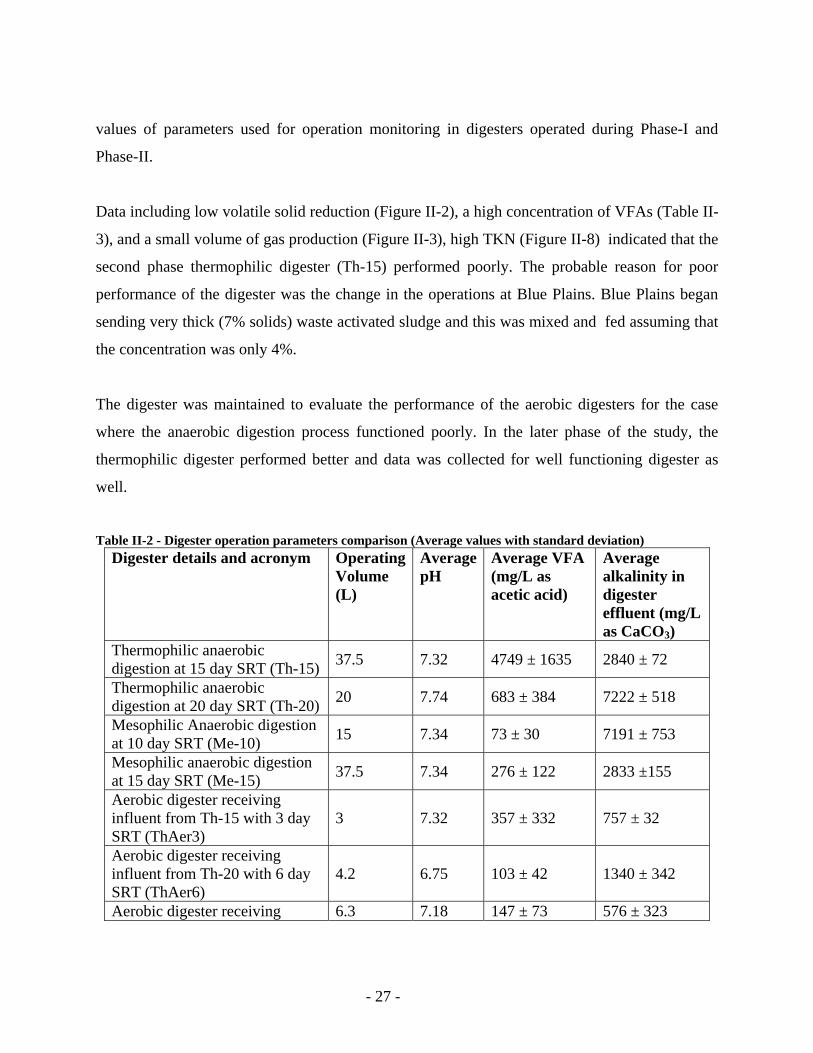
values of parameters used for operation monitoring in digesters operated during Phase-I and
Phase-II.
Data including low volatile solid reduction (Figure II-2), a high concentration of VFAs (Table II-
3), and a small volume of gas production (Figure II-3), high TKN (Figure II-8) indicated that the
second phase thermophilic digester (Th-15) performed poorly. The probable reason for poor
performance of the digester was the change in the operations at Blue Plains. Blue Plains began
sending very thick (7% solids) waste activated sludge and this was mixed and fed assuming that
the concentration was only 4%.
The digester was maintained to evaluate the performance of the aerobic digesters for the case
where the anaerobic digestion process functioned poorly. In the later phase of the study, the
thermophilic digester performed better and data was collected for well functioning digester as
well.
Table II-2 - Digester operation parameters comparison (Average values with standard deviation)
Digester details and acronym Operating Volume (L)
Average pH
Average VFA (mg/L as acetic acid)
Average alkalinity in digester effluent (mg/L as CaCO3)
Thermophilic anaerobic digestion at 15 day SRT (Th-15) 37.5 7.32 4749 ± 1635 2840 ± 72
Thermophilic anaerobic digestion at 20 day SRT (Th-20) 20 7.74 683 ± 384 7222 ± 518
Mesophilic Anaerobic digestion at 10 day SRT (Me-10) 15 7.34 73 ± 30 7191 ± 753
Mesophilic anaerobic digestion at 15 day SRT (Me-15) 37.5 7.34 276 ± 122 2833 ±155
Aerobic digester receiving influent from Th-15 with 3 day SRT (ThAer3)
3 7.32 357 ± 332 757 ± 32
Aerobic digester receiving influent from Th-20 with 6 day SRT (ThAer6)
4.2 6.75 103 ± 42 1340 ± 342
Aerobic digester receiving 6.3 7.18 147 ± 73 576 ± 323
- 27 -
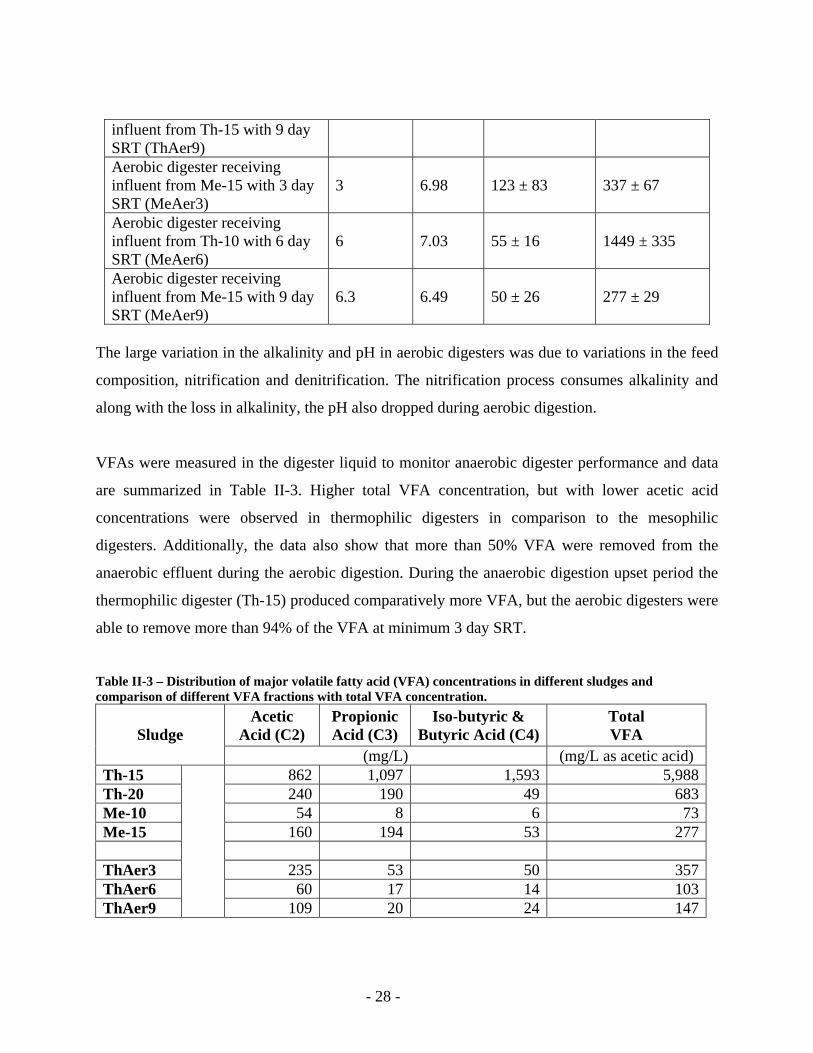
influent from Th-15 with 9 day SRT (ThAer9) Aerobic digester receiving influent from Me-15 with 3 day SRT (MeAer3)
3 6.98 123 ± 83 337 ± 67
Aerobic digester receiving influent from Th-10 with 6 day SRT (MeAer6)
6 7.03 55 ± 16 1449 ± 335
Aerobic digester receiving influent from Me-15 with 9 day SRT (MeAer9)
6.3 6.49 50 ± 26 277 ± 29
The large variation in the alkalinity and pH in aerobic digesters was due to variations in the feed
composition, nitrification and denitrification. The nitrification process consumes alkalinity and
along with the loss in alkalinity, the pH also dropped during aerobic digestion.
VFAs were measured in the digester liquid to monitor anaerobic digester performance and data
are summarized in Table II-3. Higher total VFA concentration, but with lower acetic acid
concentrations were observed in thermophilic digesters in comparison to the mesophilic
digesters. Additionally, the data also show that more than 50% VFA were removed from the
anaerobic effluent during the aerobic digestion. During the anaerobic digestion upset period the
thermophilic digester (Th-15) produced comparatively more VFA, but the aerobic digesters were
able to remove more than 94% of the VFA at minimum 3 day SRT.
Table II-3 – Distribution of major volatile fatty acid (VFA) concentrations in different sludges and comparison of different VFA fractions with total VFA concentration.
Acetic Acid (C2)
Propionic Acid (C3)
Iso-butyric & Butyric Acid (C4)
Total VFA Sludge
(mg/L) (mg/L as acetic acid) Th-15 862 1,097 1,593 5,988Th-20 240 190 49 683Me-10 54 8 6 73Me-15 160 194 53 277 ThAer3 235 53 50 357ThAer6 60 17 14 103ThAer9
109 20 24 147
- 28 -
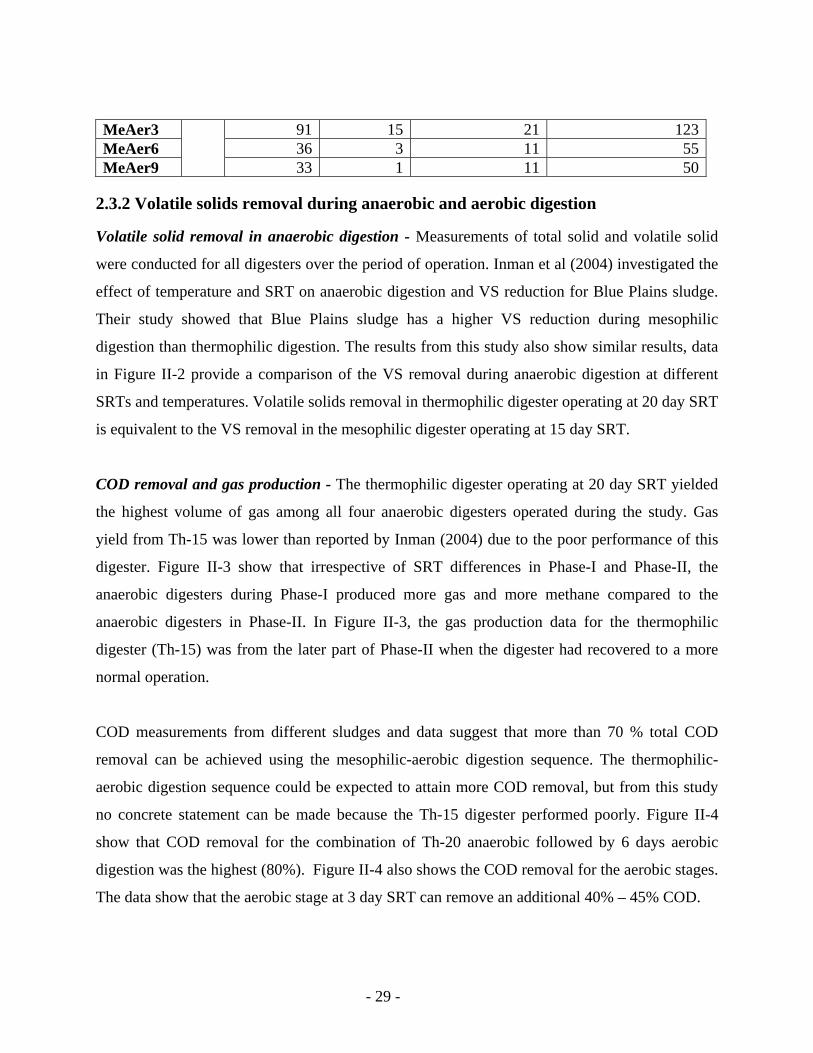
MeAer3 91 15 21 123MeAer6 36 3 11 55MeAer9 33 1 11 50
2.3.2 Volatile solids removal during anaerobic and aerobic digestion
Volatile solid removal in anaerobic digestion - Measurements of total solid and volatile solid
were conducted for all digesters over the period of operation. Inman et al (2004) investigated the
effect of temperature and SRT on anaerobic digestion and VS reduction for Blue Plains sludge.
Their study showed that Blue Plains sludge has a higher VS reduction during mesophilic
digestion than thermophilic digestion. The results from this study also show similar results, data
in Figure II-2 provide a comparison of the VS removal during anaerobic digestion at different
SRTs and temperatures. Volatile solids removal in thermophilic digester operating at 20 day SRT
is equivalent to the VS removal in the mesophilic digester operating at 15 day SRT.
COD removal and gas production - The thermophilic digester operating at 20 day SRT yielded
the highest volume of gas among all four anaerobic digesters operated during the study. Gas
yield from Th-15 was lower than reported by Inman (2004) due to the poor performance of this
digester. Figure II-3 show that irrespective of SRT differences in Phase-I and Phase-II, the
anaerobic digesters during Phase-I produced more gas and more methane compared to the
anaerobic digesters in Phase-II. In Figure II-3, the gas production data for the thermophilic
digester (Th-15) was from the later part of Phase-II when the digester had recovered to a more
normal operation.
COD measurements from different sludges and data suggest that more than 70 % total COD
removal can be achieved using the mesophilic-aerobic digestion sequence. The thermophilic-
aerobic digestion sequence could be expected to attain more COD removal, but from this study
no concrete statement can be made because the Th-15 digester performed poorly. Figure II-4
show that COD removal for the combination of Th-20 anaerobic followed by 6 days aerobic
digestion was the highest (80%). Figure II-4 also shows the COD removal for the aerobic stages.
The data show that the aerobic stage at 3 day SRT can remove an additional 40% – 45% COD.
- 29 -
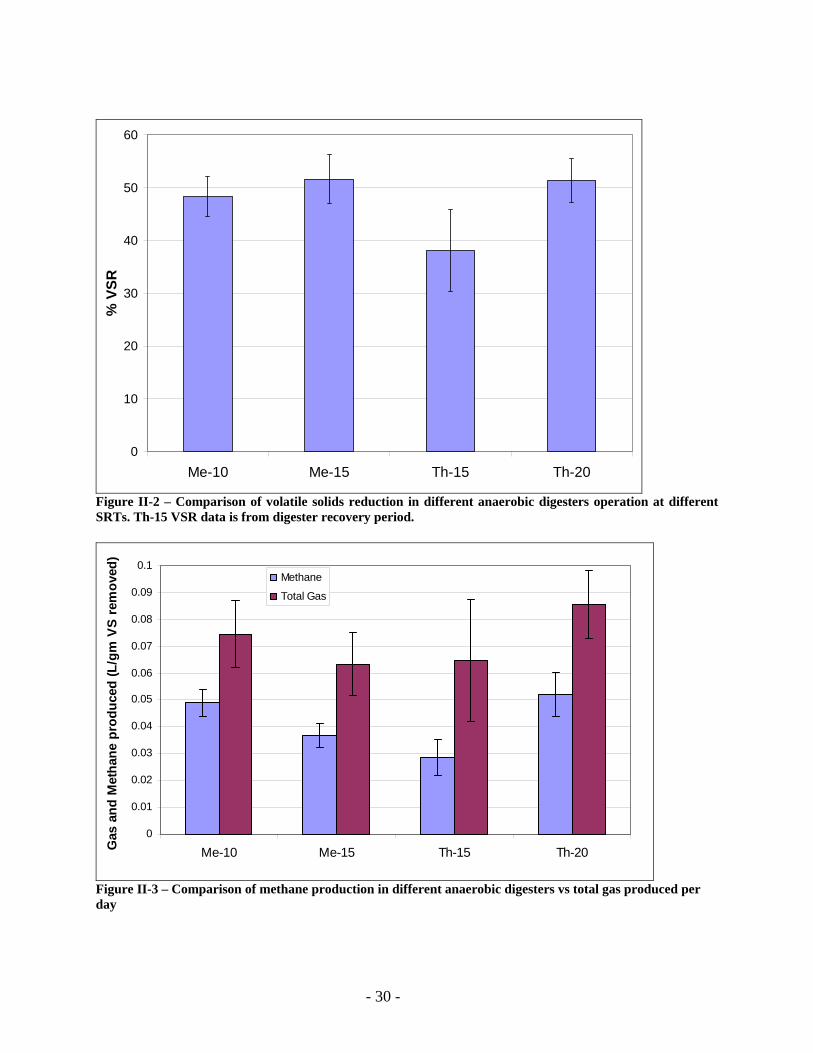
0
10
20
30
40
50
60
Me-10 Me-15 Th-15 Th-20
% V
SR
Figure II-2 – Comparison of volatile solids reduction in different anaerobic digesters operation at different SRTs. Th-15 VSR data is from digester recovery period.
0
0.01
0.02
0.03
0.04
0.05
0.06
0.07
0.08
0.09
0.1
Me-10 Me-15 Th-15 Th-20Gas
and
Met
hane
pro
duce
d (L
/gm
VS
rem
oved
)
Methane
Total Gas
Figure II-3 – Comparison of methane production in different anaerobic digesters vs total gas produced per day
- 30 -
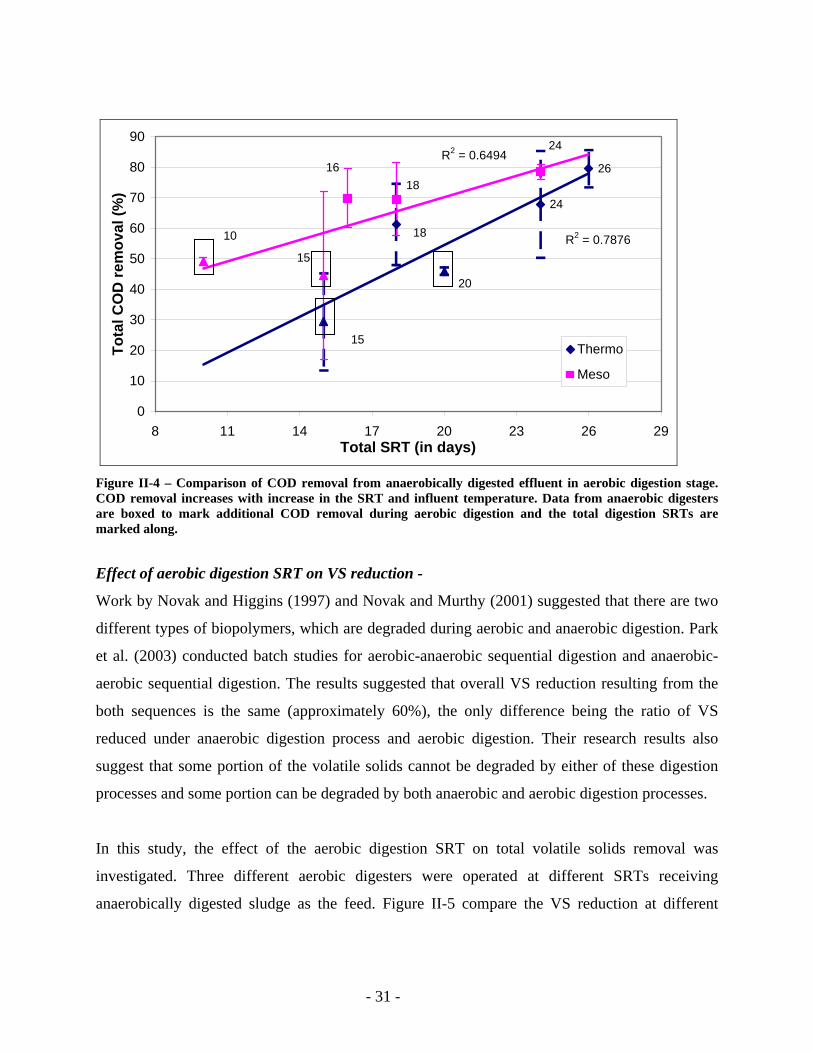
24
26
20
18
15
24
1618
15
10
R2 = 0.6494
R2 = 0.7876
0
10
20
30
40
50
60
70
80
90
8 11 14 17 20 23 26 2Total SRT (in days)
Tota
l CO
D re
mov
al (%
)
9
Thermo
Meso
Figure II-4 – Comparison of COD removal from anaerobically digested effluent in aerobic digestion stage. COD removal increases with increase in the SRT and influent temperature. Data from anaerobic digesters are boxed to mark additional COD removal during aerobic digestion and the total digestion SRTs are marked along.
Effect of aerobic digestion SRT on VS reduction -
Work by Novak and Higgins (1997) and Novak and Murthy (2001) suggested that there are two
different types of biopolymers, which are degraded during aerobic and anaerobic digestion. Park
et al. (2003) conducted batch studies for aerobic-anaerobic sequential digestion and anaerobic-
aerobic sequential digestion. The results suggested that overall VS reduction resulting from the
both sequences is the same (approximately 60%), the only difference being the ratio of VS
reduced under anaerobic digestion process and aerobic digestion. Their research results also
suggest that some portion of the volatile solids cannot be degraded by either of these digestion
processes and some portion can be degraded by both anaerobic and aerobic digestion processes.
In this study, the effect of the aerobic digestion SRT on total volatile solids removal was
investigated. Three different aerobic digesters were operated at different SRTs receiving
anaerobically digested sludge as the feed. Figure II-5 compare the VS reduction at different
- 31 -
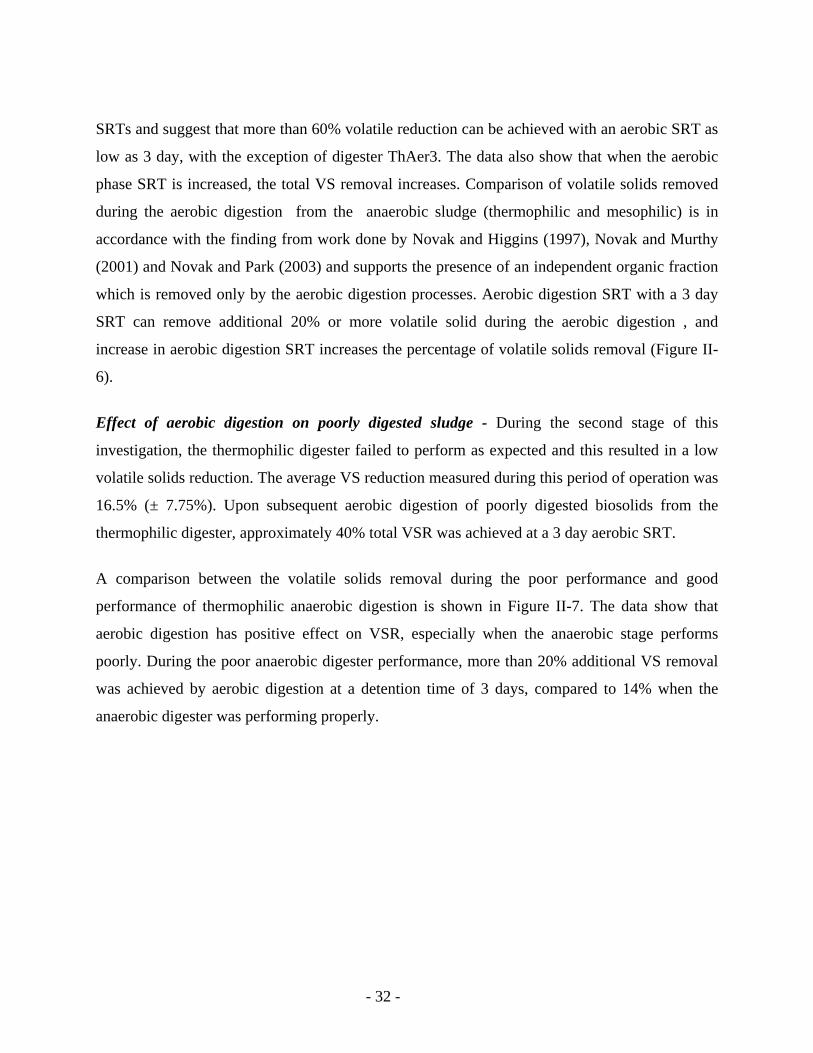
SRTs and suggest that more than 60% volatile reduction can be achieved with an aerobic SRT as
low as 3 day, with the exception of digester ThAer3. The data also show that when the aerobic
phase SRT is increased, the total VS removal increases. Comparison of volatile solids removed
during the aerobic digestion from the anaerobic sludge (thermophilic and mesophilic) is in
accordance with the finding from work done by Novak and Higgins (1997), Novak and Murthy
(2001) and Novak and Park (2003) and supports the presence of an independent organic fraction
which is removed only by the aerobic digestion processes. Aerobic digestion SRT with a 3 day
SRT can remove additional 20% or more volatile solid during the aerobic digestion , and
increase in aerobic digestion SRT increases the percentage of volatile solids removal (Figure II-
6).
Effect of aerobic digestion on poorly digested sludge - During the second stage of this
investigation, the thermophilic digester failed to perform as expected and this resulted in a low
volatile solids reduction. The average VS reduction measured during this period of operation was
16.5% (± 7.75%). Upon subsequent aerobic digestion of poorly digested biosolids from the
thermophilic digester, approximately 40% total VSR was achieved at a 3 day aerobic SRT.
A comparison between the volatile solids removal during the poor performance and good
performance of thermophilic anaerobic digestion is shown in Figure II-7. The data show that
aerobic digestion has positive effect on VSR, especially when the anaerobic stage performs
poorly. During the poor anaerobic digester performance, more than 20% additional VS removal
was achieved by aerobic digestion at a detention time of 3 days, compared to 14% when the
anaerobic digester was performing properly.
- 32 -
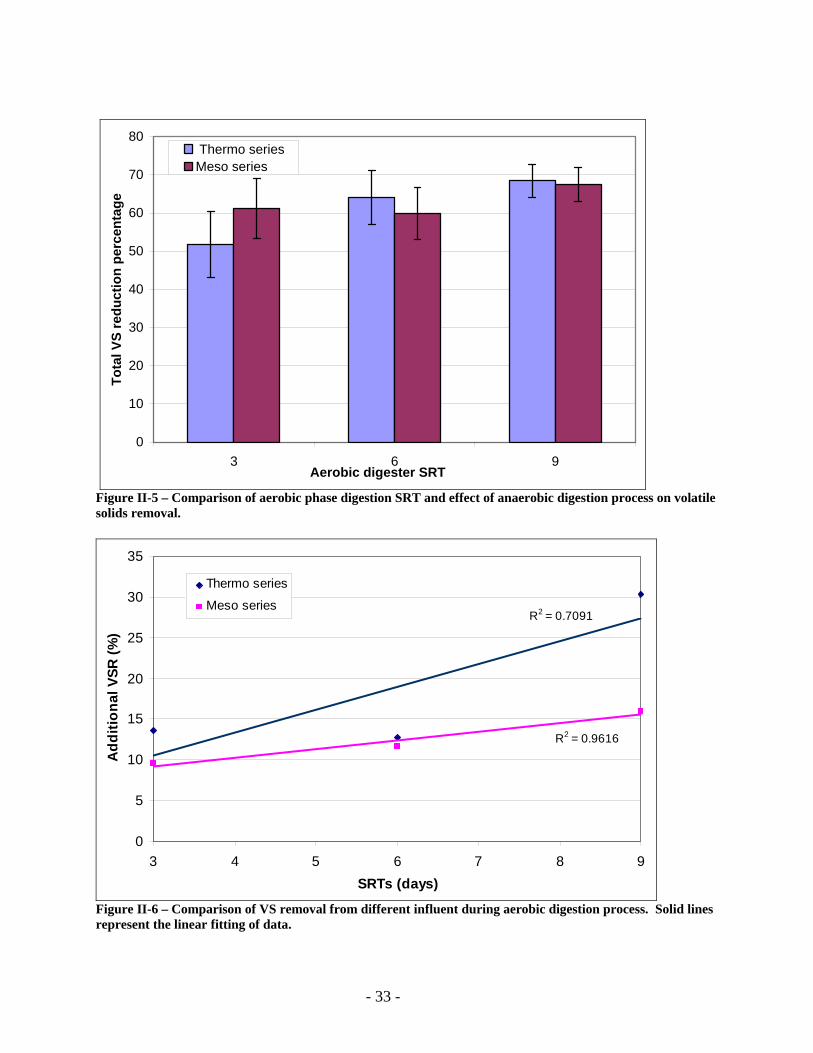
0
10
20
30
40
50
60
70
80
3 6 9Aerobic digester SRT
Tota
l VS
redu
ctio
n pe
rcen
tage
Thermo seriesMeso series
Figure II-5 – Comparison of aerobic phase digestion SRT and effect of anaerobic digestion process on volatile solids removal.
R2 = 0.9616
R2 = 0.7091
0
5
10
15
20
25
30
35
3 4 5 6 7 8SRTs (days)
Add
ition
al V
SR (%
)
9
Thermo series
Meso series
Figure II-6 – Comparison of VS removal from different influent during aerobic digestion process. Solid lines represent the linear fitting of data.
- 33 -
Previous work (Novak and Murthy, 2001 and Novak and Park, 2004) and this study (Figure II-6
and Figure II-7) suggest that there exist four significant fractions of volatile solids that can be
degraded under –
1. Aerobic conditions (type-1),
2. Anaerobic conditions (type-2),
3. Both Aerobic and anaerobic conditions (type-3), and
4. Neither under aerobic nor anaerobic conditions (type-4).
During the normal operation of sequential anaerobic-aerobic digestion, the anaerobic stage
digester removes the type-2 fraction and major portion of type-3 VS fraction. In the following
aerobic digester the type-1 fraction and some additional portion of type-3 VS fraction get
removed.
The anaerobic digestion upset study suggests that, when anaerobic digestion gets upset, only a
small portion of type-2 and type-3 VS fractions is removed during the anaerobic stage. It is the
later aerobic stage which removes the major portions of VS fractions of type-1 and type-3,
saving the overall digestion process from failure. The Figure II-7 shows that minimum 3 day of
aerobic digestion helped to achieve upto 40% VSR even with a poorly performing anaerobic
digester.
Anaerobic-aerobic sequential digestion also has an engineering advantage. It may provide the
option of optimizing the SRT of the anaerobic and aerobic phases (Figure II-7) for minimizing
the cost and energy requirements for the operation. Optimized anaerobic-phase and aerobic
phase SRTs may simultaneously remove higher volatile solids with less digester volume and a
low energy consumption.
- 34 -
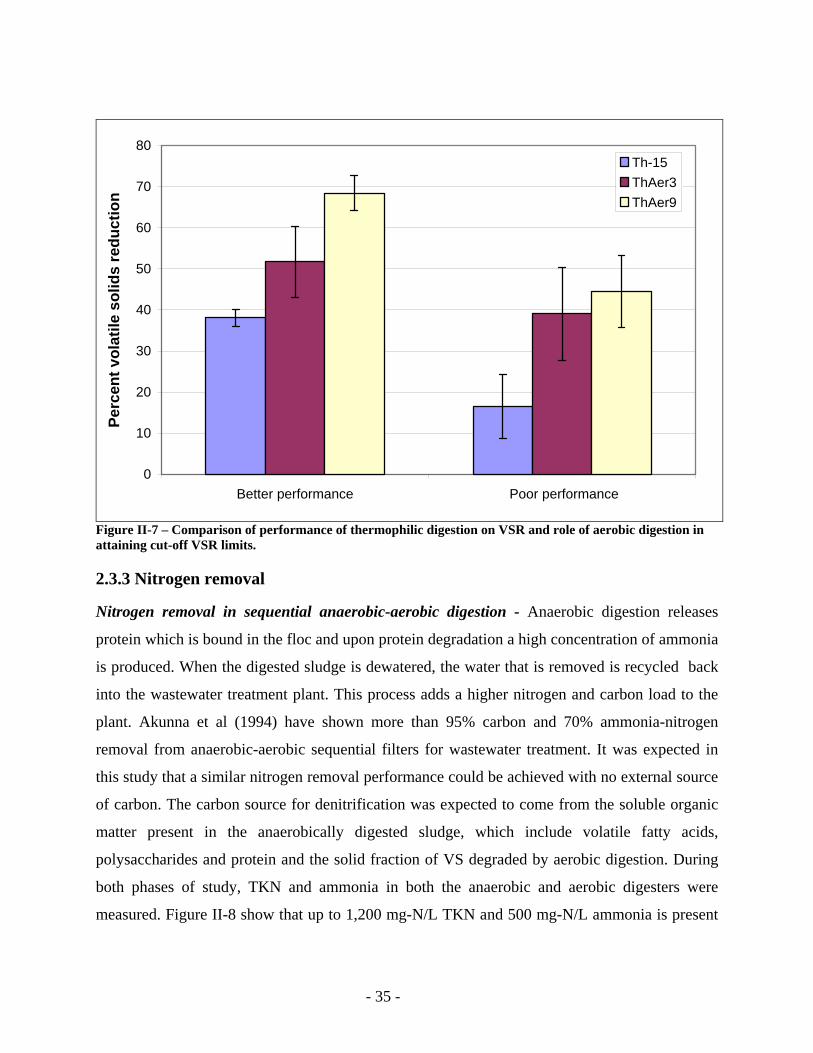
0
10
20
30
40
50
60
70
80
Better performance Poor performance
Perc
ent v
olat
ile s
olid
s re
duct
ion
Th-15ThAer3ThAer9
Figure II-7 – Comparison of performance of thermophilic digestion on VSR and role of aerobic digestion in attaining cut-off VSR limits.
2.3.3 Nitrogen removal
Nitrogen removal in sequential anaerobic-aerobic digestion - Anaerobic digestion releases
protein which is bound in the floc and upon protein degradation a high concentration of ammonia
is produced. When the digested sludge is dewatered, the water that is removed is recycled back
into the wastewater treatment plant. This process adds a higher nitrogen and carbon load to the
plant. Akunna et al (1994) have shown more than 95% carbon and 70% ammonia-nitrogen
removal from anaerobic-aerobic sequential filters for wastewater treatment. It was expected in
this study that a similar nitrogen removal performance could be achieved with no external source
of carbon. The carbon source for denitrification was expected to come from the soluble organic
matter present in the anaerobically digested sludge, which include volatile fatty acids,
polysaccharides and protein and the solid fraction of VS degraded by aerobic digestion. During
both phases of study, TKN and ammonia in both the anaerobic and aerobic digesters were
measured. Figure II-8 show that up to 1,200 mg-N/L TKN and 500 mg-N/L ammonia is present
- 35 -
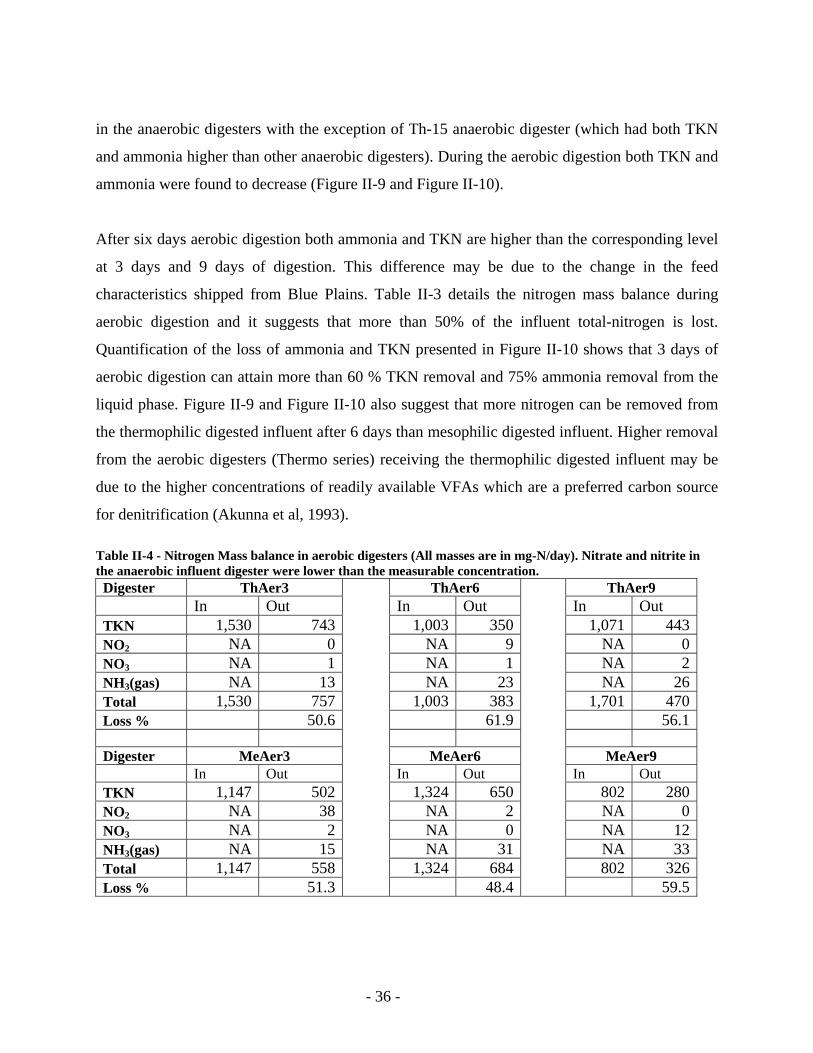
in the anaerobic digesters with the exception of Th-15 anaerobic digester (which had both TKN
and ammonia higher than other anaerobic digesters). During the aerobic digestion both TKN and
ammonia were found to decrease (Figure II-9 and Figure II-10).
After six days aerobic digestion both ammonia and TKN are higher than the corresponding level
at 3 days and 9 days of digestion. This difference may be due to the change in the feed
characteristics shipped from Blue Plains. Table II-3 details the nitrogen mass balance during
aerobic digestion and it suggests that more than 50% of the influent total-nitrogen is lost.
Quantification of the loss of ammonia and TKN presented in Figure II-10 shows that 3 days of
aerobic digestion can attain more than 60 % TKN removal and 75% ammonia removal from the
liquid phase. Figure II-9 and Figure II-10 also suggest that more nitrogen can be removed from
the thermophilic digested influent after 6 days than mesophilic digested influent. Higher removal
from the aerobic digesters (Thermo series) receiving the thermophilic digested influent may be
due to the higher concentrations of readily available VFAs which are a preferred carbon source
for denitrification (Akunna et al, 1993). Table II-4 - Nitrogen Mass balance in aerobic digesters (All masses are in mg-N/day). Nitrate and nitrite in the anaerobic influent digester were lower than the measurable concentration. Digester ThAer3 ThAer6 ThAer9 In Out In Out In Out TKN 1,530 743 1,003 350 1,071 443NO2 NA 0 NA 9 NA 0NO3 NA 1 NA 1 NA 2NH3(gas) NA 13 NA 23 NA 26Total 1,530 757 1,003 383 1,701 470Loss % 50.6 61.9 56.1 Digester MeAer3 MeAer6 MeAer9 In Out In Out In Out TKN 1,147 502 1,324 650 802 280NO2 NA 38 NA 2 NA 0NO3 NA 2 NA 0 NA 12NH3(gas) NA 15 NA 31 NA 33Total 1,147 558 1,324 684 802 326Loss % 51.3 48.4 59.5
- 36 -
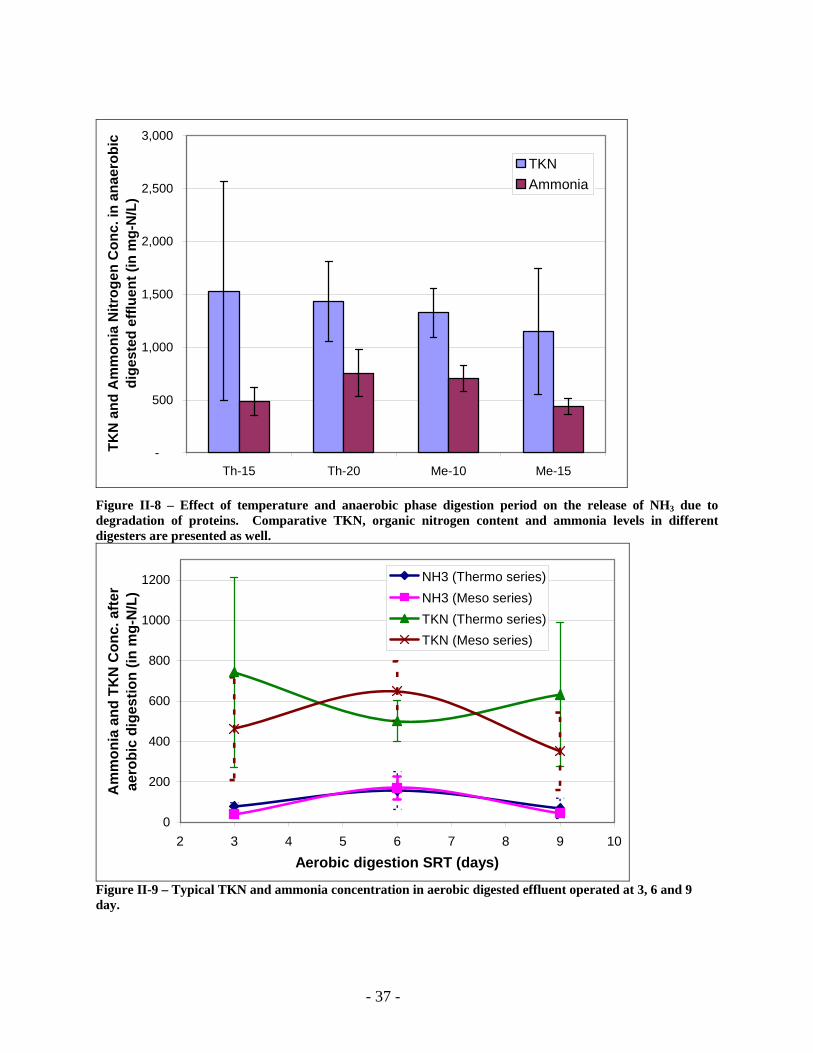
-
500
1,000
1,500
2,000
2,500
3,000
Th-15 Th-20 Me-10 Me-15
TKN
and
Am
mon
ia N
itrog
en C
onc.
in a
naer
obic
di
gest
ed e
fflue
nt (i
n m
g-N
/L)
TKNAmmonia
Figure II-8 – Effect of temperature and anaerobic phase digestion period on the release of NH3 due to degradation of proteins. Comparative TKN, organic nitrogen content and ammonia levels in different digesters are presented as well.
0
200
400
600
800
1000
1200
2 3 4 5 6 7 8 9Aerobic digestion SRT (days)
Am
mon
ia a
nd T
KN
Con
c. a
fter
aero
bic
dige
stio
n (in
mg-
N/L
)
10
NH3 (Thermo series)NH3 (Meso series)TKN (Thermo series)TKN (Meso series)
Figure II-9 – Typical TKN and ammonia concentration in aerobic digested effluent operated at 3, 6 and 9 day.
- 37 -
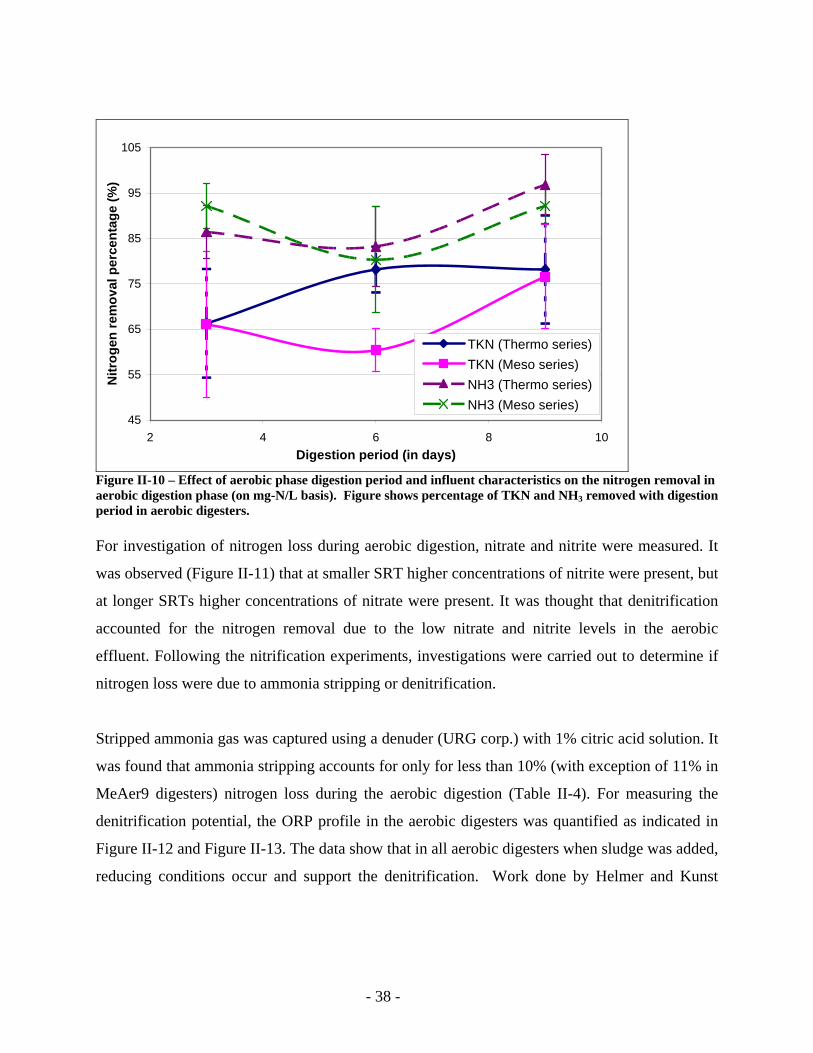
45
55
65
75
85
95
105
2 4 6 8Digestion period (in days)
Nitr
ogen
rem
oval
per
cent
age
(%)
10
TKN (Thermo series)TKN (Meso series)NH3 (Thermo series)NH3 (Meso series)
Figure II-10 – Effect of aerobic phase digestion period and influent characteristics on the nitrogen removal in aerobic digestion phase (on mg-N/L basis). Figure shows percentage of TKN and NH3 removed with digestion period in aerobic digesters. For investigation of nitrogen loss during aerobic digestion, nitrate and nitrite were measured. It
was observed (Figure II-11) that at smaller SRT higher concentrations of nitrite were present, but
at longer SRTs higher concentrations of nitrate were present. It was thought that denitrification
accounted for the nitrogen removal due to the low nitrate and nitrite levels in the aerobic
effluent. Following the nitrification experiments, investigations were carried out to determine if
nitrogen loss were due to ammonia stripping or denitrification.
Stripped ammonia gas was captured using a denuder (URG corp.) with 1% citric acid solution. It
was found that ammonia stripping accounts for only for less than 10% (with exception of 11% in
MeAer9 digesters) nitrogen loss during the aerobic digestion (Table II-4). For measuring the
denitrification potential, the ORP profile in the aerobic digesters was quantified as indicated in
Figure II-12 and Figure II-13. The data show that in all aerobic digesters when sludge was added,
reducing conditions occur and support the denitrification. Work done by Helmer and Kunst
- 38 -
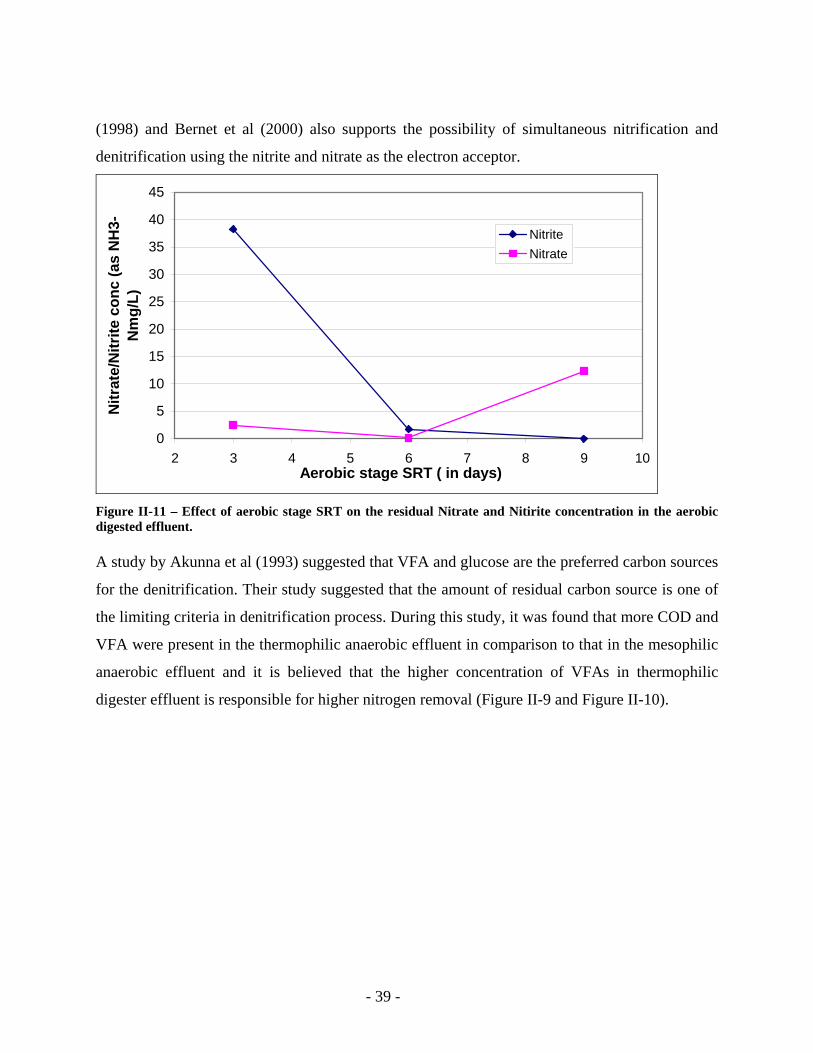
(1998) and Bernet et al (2000) also supports the possibility of simultaneous nitrification and
denitrification using the nitrite and nitrate as the electron acceptor.
0
5
10
15
20
25
30
35
40
45
2 3 4 5 6 7 8 9Aerobic stage SRT ( in days)
Nitr
ate/
Nitr
ite c
onc
(as
NH
3-N
mg/
L)
10
NitriteNitrate
Figure II-11 – Effect of aerobic stage SRT on the residual Nitrate and Nitirite concentration in the aerobic digested effluent. A study by Akunna et al (1993) suggested that VFA and glucose are the preferred carbon sources
for the denitrification. Their study suggested that the amount of residual carbon source is one of
the limiting criteria in denitrification process. During this study, it was found that more COD and
VFA were present in the thermophilic anaerobic effluent in comparison to that in the mesophilic
anaerobic effluent and it is believed that the higher concentration of VFAs in thermophilic
digester effluent is responsible for higher nitrogen removal (Figure II-9 and Figure II-10).
- 39 -
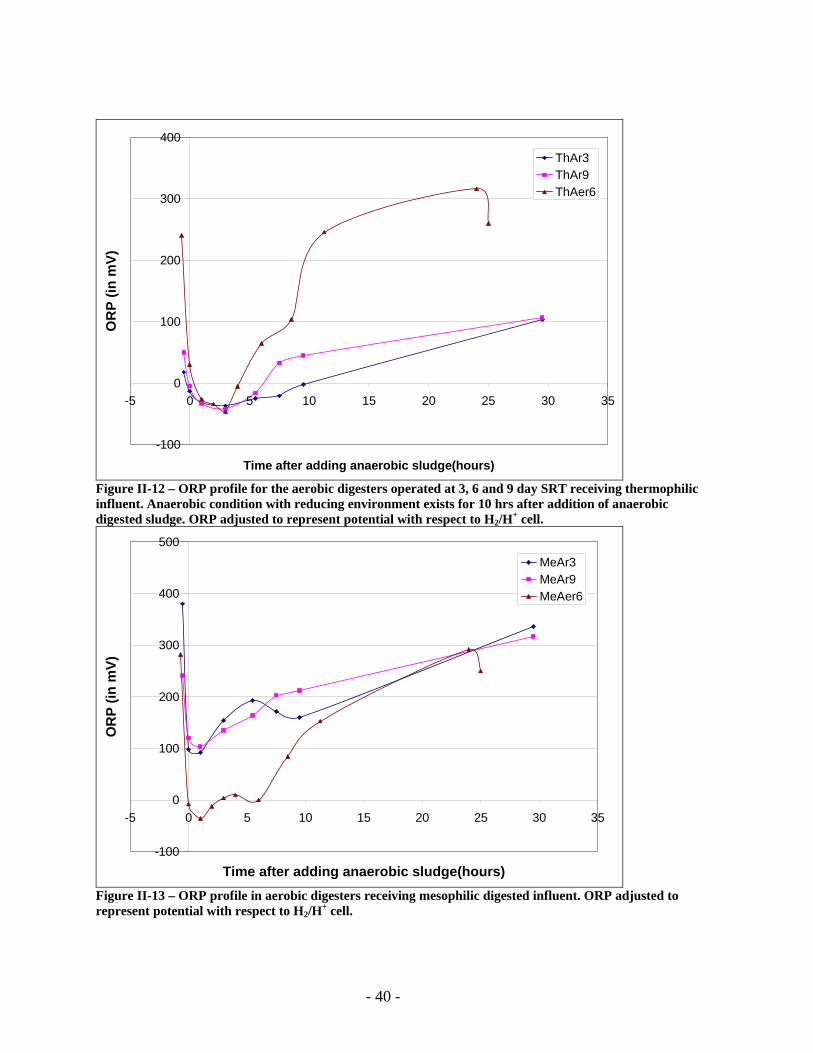
-100
0
100
200
300
400
-5 0 5 10 15 20 25 30 35
Time after adding anaerobic sludge(hours)
OR
P (in
mV)
ThAr3ThAr9ThAer6
Figure II-12 – ORP profile for the aerobic digesters operated at 3, 6 and 9 day SRT receiving thermophilic influent. Anaerobic condition with reducing environment exists for 10 hrs after addition of anaerobic digested sludge. ORP adjusted to represent potential with respect to H2/H+ cell.
-100
0
100
200
300
400
500
-5 0 5 10 15 20 25 30 35
Time after adding anaerobic sludge(hours)
OR
P (in
mV)
MeAr3MeAr9MeAer6
Figure II-13 – ORP profile in aerobic digesters receiving mesophilic digested influent. ORP adjusted to represent potential with respect to H2/H+ cell.
- 40 -
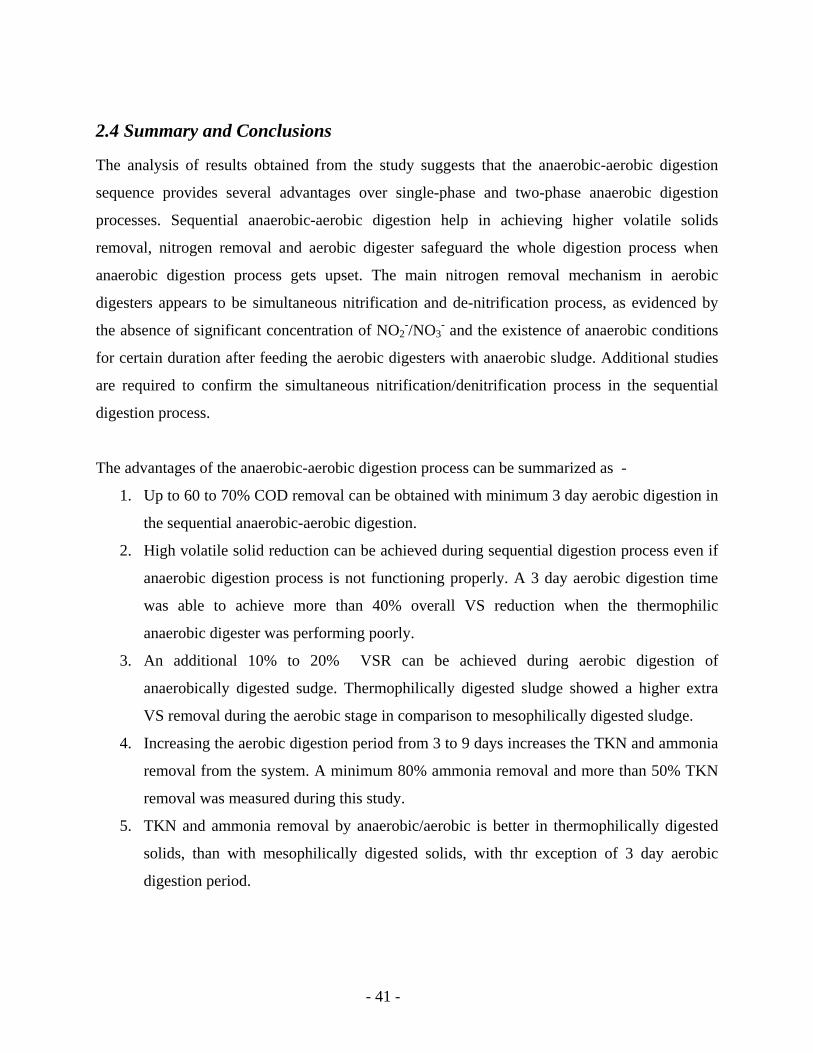
2.4 Summary and Conclusions
The analysis of results obtained from the study suggests that the anaerobic-aerobic digestion
sequence provides several advantages over single-phase and two-phase anaerobic digestion
processes. Sequential anaerobic-aerobic digestion help in achieving higher volatile solids
removal, nitrogen removal and aerobic digester safeguard the whole digestion process when
anaerobic digestion process gets upset. The main nitrogen removal mechanism in aerobic
digesters appears to be simultaneous nitrification and de-nitrification process, as evidenced by
the absence of significant concentration of NO2-/NO3
- and the existence of anaerobic conditions
for certain duration after feeding the aerobic digesters with anaerobic sludge. Additional studies
are required to confirm the simultaneous nitrification/denitrification process in the sequential
digestion process.
The advantages of the anaerobic-aerobic digestion process can be summarized as -
1. Up to 60 to 70% COD removal can be obtained with minimum 3 day aerobic digestion in
the sequential anaerobic-aerobic digestion.
2. High volatile solid reduction can be achieved during sequential digestion process even if
anaerobic digestion process is not functioning properly. A 3 day aerobic digestion time
was able to achieve more than 40% overall VS reduction when the thermophilic
anaerobic digester was performing poorly.
3. An additional 10% to 20% VSR can be achieved during aerobic digestion of
anaerobically digested sudge. Thermophilically digested sludge showed a higher extra
VS removal during the aerobic stage in comparison to mesophilically digested sludge.
4. Increasing the aerobic digestion period from 3 to 9 days increases the TKN and ammonia
removal from the system. A minimum 80% ammonia removal and more than 50% TKN
removal was measured during this study.
5. TKN and ammonia removal by anaerobic/aerobic is better in thermophilically digested
solids, than with mesophilically digested solids, with thr exception of 3 day aerobic
digestion period.
- 41 -
2.5 References
Akunna, J., Bizeau, C., Moletta, R., Bernet, N., and Heduit, A (1994). Combined organic
carbon and complete nitrogen removal using anaerobic and aerobic upflow filters. Water Sci.
Tech., 30 (12): 297-306.
Akunna, J., Bizeau, C., and Moletta, R (1993). Nitrate and nitrite reduction with
anaerobic sludge using various carbon sources: Glucose, glycerol, acetic acid, lactic acid, and
methanol. Wat. Res., 27: 1303-1312.
Bernet. N., Delgenes, N., Akunna, J.C., Delgenes, J.P., and Moletta. R (2000). Combined
anaerobic-aerobic SBR for the treatment of piggery wastewater. Wat. Res. 34(2): 611-619.
Pohland, F.G., and Ghosh, S. (1971) Developments in anaerobic stagilization of organic
wastes—the two-phase concept. Env. Letters, 1 (4): 255-266.
Grady L, Diagger G. and Lim (1999) Biological Wastewater Treatment, 2nd Edition.
Publishers – Marcel Dekker, USA.
Hanaki, K., Hong, Z. and Matsuo T. (1992) Production of nitrous oxide gas during
denitrification of wastewater. Wat. Sci. Tech. 26 (5/6): 1027-1036.
Inman, D.C. (2004). Comparative study of alternatives anaerobic- digestion
technologies. MS thesis submitted at Virginia Tech.
Novak J.T., Sadler, M.E. and Murthy S.N. (2003). Mechanism of floc destruction during
anaerobic and aerobic digestion and the effect on conditioning and dewatering of biosolids.
Water Res., 37: 3136 – 3144.
- 42 -
Higgins. M.J, and Novak, J.T. (1997). Characterization of exocellular protein and its
role in bioflocculation. Jour. of Envron. Engr., 123: 479-485.
Novak J.T., C. Park and M.M. Abu-Orf (2004) Conditioning and Dewatering of Digested
Waste Activated Sludges. Jour Res. Sci. Tech., 1: 47 – 53.
Subramanian, S., (2005). Digestion processes and their effect on dewatering and Bound
water content of sludge. MS thesis submitted at Virginia Tech.
Tapana, C. and Pagilla, K.R. (2000b). Aerobic thermophilic and anaerobic mesophilic
treatment of Swine waste. Water Res. 34 (10): 2747 – 2753
- 43 -
Chapter 3
Sequential Anaerobic-aerobic digestion for Odor reduction and
improvement in dewatering properties of digested sludge
Kumar, Nitin2; Novak, J.T.1,2 and Murthy Sudhir3
1Corresponding author 2 Virginia Tech, Blacksburg 3 DC wastewater and sewer authority, Washington DC.
Abstract
Sequential anaerobic-aerobic treatment is a well established technology for wastewater
treatment, but its use for sludge digestion has received less attention. In this research, protein and
polysaccharide concentrations in anaerobic and followed by sequential aerobic digesters were
monitored. More than 30 % and up to 85% of the combined protein and polysaccharides present
in the anaerobic digester were degraded after sequential anaerobic-aerobic digestion.
Improvement in the dewatering properties was also found as evidenced by the decrease in CST
and the polymer dose requirement for the sequentially digested sludge. Following sequential
anaerobic–aerobic digestion, it was found that sludges that were digested under thermophilic
anaerobic conditions produced approximately 30% lower odors than mesophilic digested
biosolids and the addition of an aerobic digestion step reduced odors an additional 40%. Freeze-
thaw treatment of digested biosolids showed that even after anaerobic-aerobic digestion, sludges
retain a potential for high and rapid odor production. It appears that following freeze-thaw
treatment, additional proteins are made bioavailable, resulting in the higher odor generation.
Keywords: Dewatering, Biosolids, Odor, Freeze thaw, Anaerobic aerobic digestion,
thermophilic digestion and mesophilic digestion.
3.1 Introduction
Anaerobically digested sludges are often found to have poor dewatering properties and may also
generate odors, especially if the dewatering process includes high solids centrifugation. Poor
- 44 -
dewatering and strong odors are the cause of concern for wastewater treatment utilities due to the
additional costs for conditioning polymers and public relations problems associated with odors.
The release of biopolymers, primarily proteins and polysaccharides, into solution during
digestion is considered to be responsible for deterioration of dewatering properties (Novak et al,
2003). Research by Novak and Higgins (1997) and Novak and Murthy (2001) suggest that there
are two different types of biopolymer which are released during anaerobic and aerobic digestion.
During aerobic digestion, polysaccharides accumulate due to the low activity of polysaccharide
degrading enzymes. In anaerobic digestion, protein accumulates in solution and the ratio of
protein to polysaccharides is found to be higher than that in aerobic digestion. Frølund et al
(1996) proposed that activated sludge consists of a matrix of micro-organism and biopolymers,
bound by cations. In the sludge matrix, the approximate content of biopolymer is – proteins 50%,
polysaccharide 20%, DNA 1% and humic materials 20%. Novak and Higgins (1997) have found
that some polysaccharides are bound with lectin-type proteins present in sludge floc by Calcium
(Ca) and Magnesium (Mg). Other investigations by Murthy et al (2000) and Muller et al (2001)
suggests that proteins present in sludge have a strong tendency to bind with trivalent cations.
Cations, including Ca, Mg, Iron (Fe) and Aluminum (Al) were found to be a critical component
of the activated sludge floc structure and thus play an important role in sludge digestion
processes, dewatering and odor generation. Investigations into the role of aluminum in sludge
floc are relatively few compared to iron. It is thought that aluminum selectivity for
polysaccharide and humics is higher than iron, while iron more favorably binds to proteins (Lu,
et al, 1999). Novak and Muller (2001) found that among the different oxidations states of iron,
Fe (III) binds solution protein more efficiently than Fe(II).
Recent studies at Virginia Tech., have shown that cations play an important role in floc
destruction during anaerobic and aerobic digestion. Park et al (2005) found that the total VS
reduction by either anaerobic-aerobic digestion or aerobic-anaerobic digestion is the same; only
portions of VS removed during the separate anaerobic or aerobic stage changes. This suggests
that there is some portion of VS that can be degraded only during aerobic digestion and some
- 45 -
portion degraded only under anaerobic conditions. In the same study of different sludges, Park et
al (2005) found that protein release during anaerobic digestion was strongly correlated with VS
removal. The iron concentration in the feed sludge to an anaerobic digester could be correlated to
the percent VS reduction, while an increase in calcium and magnesium in solution was
associated with increased solids destruction by aerobic digestion. Subramanian (2005) found
improved dewatering for sequential anaerobic-aerobic digested biosolids due to the reduction of
bound water and low concentration of proteins and polysaccharide.
Verma (2005) in a study of 11 treatment plant’s sludges found the role of metals is important in
odor generation from the biosolids. Their study suggests that the peak organic sulfur decreases
with an increase in the digestion period of the sludge, but VS reduction showed a poor
correlation with sulfur odors. It was suggested that the iron content in the digested sludge is the
main constituent that controls organic sulfur gas generation. Higgins et al (2006) suggested that
methanogens play an important role in controlling the odors by consuming the organic-sulfur
gases.
The literature suggests that both anaerobic and aerobic digestion processes degrade significantly
different portions of sludge but a fraction of solids can be digested under both digestion
processes. Therefore, by utilizing combined anaerobic-aerobic digestion, higher solids
destruction and lower odors generation might be possible. The major objective of this study was
to determine the effect of sequential anaerobic-aerobic digestion on odor production and to
understand the effects of freeze thaw conditions on the odor production potential of digested
sludges. Another objective of the study was to investigate the dewatering properties of
sequentially digested sludges.
3.2 Material and methods
3.2.1 Bioreactor operation:
The study was divided into two phases and during both phases, two anaerobic digesters, one
thermophilic (55 oC) and another mesophilic (35 oC) were used for the first stage anaerobic
- 46 -
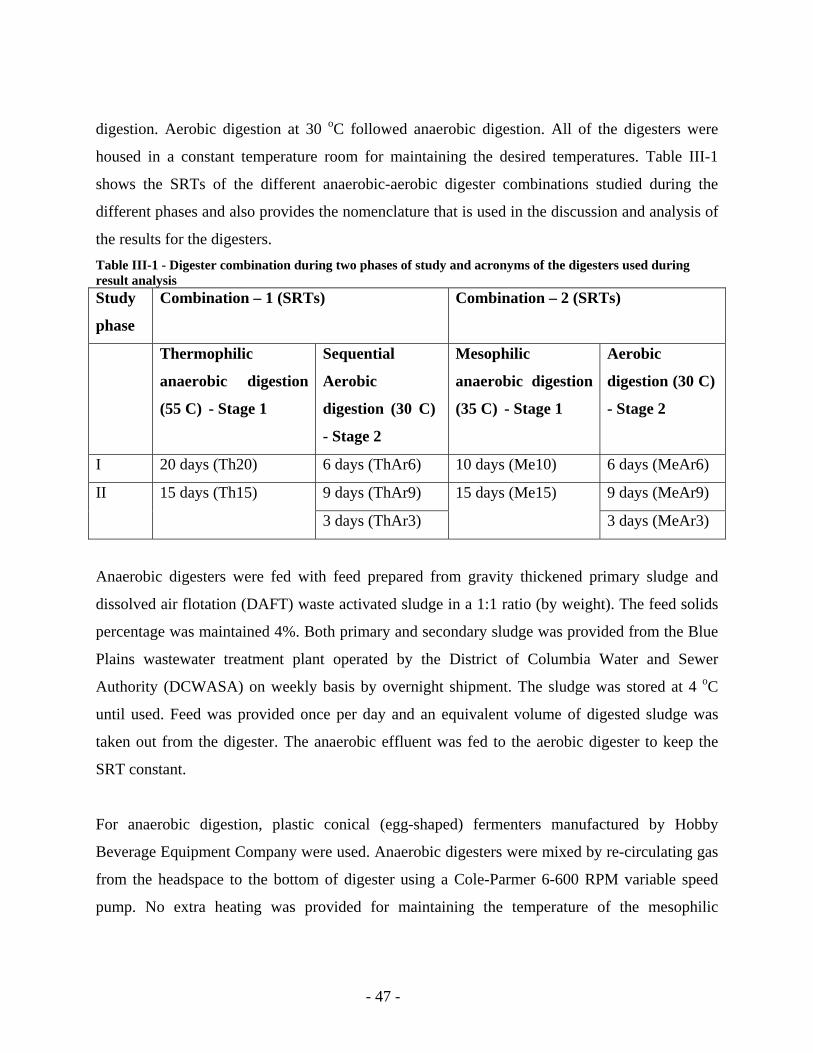
digestion. Aerobic digestion at 30 oC followed anaerobic digestion. All of the digesters were
housed in a constant temperature room for maintaining the desired temperatures. Table III-1
shows the SRTs of the different anaerobic-aerobic digester combinations studied during the
different phases and also provides the nomenclature that is used in the discussion and analysis of
the results for the digesters. Table III-1 - Digester combination during two phases of study and acronyms of the digesters used during result analysis Study
phase
Combination – 1 (SRTs) Combination – 2 (SRTs)
Thermophilic
anaerobic digestion
(55 C) - Stage 1
Sequential
Aerobic
digestion (30 C)
- Stage 2
Mesophilic
anaerobic digestion
(35 C) - Stage 1
Aerobic
digestion (30 C)
- Stage 2
I 20 days (Th20) 6 days (ThAr6) 10 days (Me10) 6 days (MeAr6)
9 days (ThAr9) 9 days (MeAr9) II 15 days (Th15)
3 days (ThAr3)
15 days (Me15)
3 days (MeAr3)
Anaerobic digesters were fed with feed prepared from gravity thickened primary sludge and
dissolved air flotation (DAFT) waste activated sludge in a 1:1 ratio (by weight). The feed solids
percentage was maintained 4%. Both primary and secondary sludge was provided from the Blue
Plains wastewater treatment plant operated by the District of Columbia Water and Sewer
Authority (DCWASA) on weekly basis by overnight shipment. The sludge was stored at 4 oC
until used. Feed was provided once per day and an equivalent volume of digested sludge was
taken out from the digester. The anaerobic effluent was fed to the aerobic digester to keep the
SRT constant.
For anaerobic digestion, plastic conical (egg-shaped) fermenters manufactured by Hobby
Beverage Equipment Company were used. Anaerobic digesters were mixed by re-circulating gas
from the headspace to the bottom of digester using a Cole-Parmer 6-600 RPM variable speed
pump. No extra heating was provided for maintaining the temperature of the mesophilic
- 47 -
digesters, but for thermophilic digesters, hot water at 63 oC was re-circulated through poly-vinyl
tubes along the periphery of thermophilic digester and the entire system was wrapped up in
insulating material to avoid heat loss. Gas produced during anaerobic digestion was collected in
30 liter air tight Tedlar gas bags (Fisher Scientific) and periodic measured for the gas volume and
gas content. Due to the higher operating temperature, water evaporated from the thermophilic
digester and it was captured using water trap. The average water loss was 50 ml per day and this
water was reintroduced in the digester on a periodic basis.
Aerobic digestion was carried out in stainless steel digesters provided by Blinchmann
Engineering, except for three day aerobic digestion. For the three day aerobic digestion, 9 L glass
digesters (Fisher Scientific) were used due to the low operation volume (only 3 L). For aerobic
digestion, mixing was achieved using external pumps (Cole Parmer, 6-600 RPM) and air was
supplied from a compressor and an aeration-stone was used to distribute the air. Due to the
higher operation temperature and limitations in closing the digesters, water was lost due to
evaporation. Water was reintroduced back in the system to the original volume every day by
adding distilled water prior to sampling and wasting the effluent from the digesters. The
dissolved oxygen level in all of the digesters was maintained at 3.0 ppm using flow regulation.
3.2.2 Analytical Methods:
For investigating dewatering properties, protein, polysaccharide, cations (including NH4+, Na+,
K+, Mg2+ and Ca2+), capillary suction time (CST) and polymer dose consumption were measured
periodically, while for odor generation, methods developed by Novak et al. (2002) and Muller et
al. (2004) were used.
Biopolymer Analysis – Samples from the raw feed, anaerobically digested sludge and from the
aerobic digesters were collected twice per week and centrifuged at 10,000 g for 20 min. The
supernatant, filtered through 1.5 µm filters (934-AH, Whatman) was used for biopolymer and
cation measurements. Samples were filtered and stored at 0oC until used. Filtration using 0.45
µm nitrocellulose filters (Fischer Scientific) was done after frozen samples were thawed at room
temperature, prior to cations measurement. Measurement of soluble proteins was done by the
- 48 -
modified Lowry et al (1951) method described by Frølund et al (1996). Soluble polysaccharides
were measured by the Dubois et al (1956) method utilizing hexose as the standard.
CST and polymer dose quantification – A 1% (by weight) solution of solid polyacrylamide
polymer, Stockhausen–650, was used for optimum polymer dose determination. For CST
measurements, 100 mL of digested sludge conditioned with polymer and sheared using a Waring
blender for 30 sec was used. Both a Triton Type 304-M and Triton Type 165 CST apparatus
were used with Whatman 17-CHR chromatography paper. The optimum polymer dose was
determined as the polymer dose providing the lowest CST.
Odor sample preparation and measurement – Odor samples were prepared by simulating the
dewatering process of a high-solids centrifuge. At the optimum polymer dose, the sludge
samples were sheared for 30 sec using a Waring blender. The resultant biosolids were dewatered
in two steps, first by centrifugation in a lab centrifuge (operated at 10,000 g for 20 min at 25 C),
followed by dewatering using hydraulic piston press by applying 30 psi pressure for 15 min with
Whatmann 41 type filter paper as the filtering media. Five microliter of a 0.127 mM
bromoethane sulfonic acid (BESA) solution was added before centrifugation to inhibit
methanogenic activity for some of the sludge cakes. The biosolid cakes were incubated in 250
mL I-CHEM glass bottles, and sealed with caps fitted with a Teflon septa, at 25 C. Freeze-thaw
samples were stored at 0 C for the desired period of freezing (1 week and 1 month) and thawed
for 1 day at 25 C prior to odor testing. After thawing, the samples were dewatered using the lab
centrifuge dewatering simulation procedure.
Odor measurements included quantification of H2S (Hydrogen sulfide), CH3S (methyl-thiol,
MT), CH3-S-CH3 (di-methyl sulfide, DMS) and CH3-S-S-CH3 (di-methyl disulfide, DMDS). For
reporting purpose, the sum of all organic sulfur gases is reported as organic sulfur. For
quantifying the amount of gases, gas samples were collected from the headspace of the sample
bottles and measurements were conducted with cyro-trapping and gas-chromatography.
- 49 -
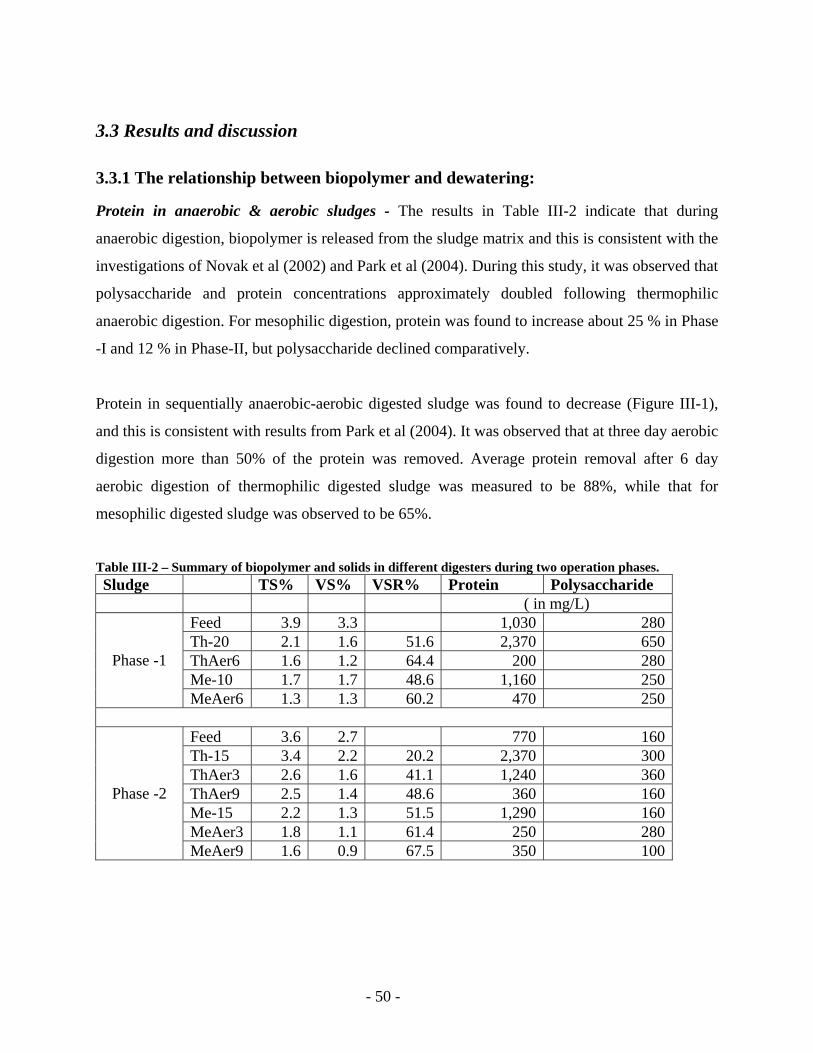
3.3 Results and discussion
3.3.1 The relationship between biopolymer and dewatering:
Protein in anaerobic & aerobic sludges - The results in Table III-2 indicate that during
anaerobic digestion, biopolymer is released from the sludge matrix and this is consistent with the
investigations of Novak et al (2002) and Park et al (2004). During this study, it was observed that
polysaccharide and protein concentrations approximately doubled following thermophilic
anaerobic digestion. For mesophilic digestion, protein was found to increase about 25 % in Phase
-I and 12 % in Phase-II, but polysaccharide declined comparatively.
Protein in sequentially anaerobic-aerobic digested sludge was found to decrease (Figure III-1),
and this is consistent with results from Park et al (2004). It was observed that at three day aerobic
digestion more than 50% of the protein was removed. Average protein removal after 6 day
aerobic digestion of thermophilic digested sludge was measured to be 88%, while that for
mesophilic digested sludge was observed to be 65%.
Table III-2 – Summary of biopolymer and solids in different digesters during two operation phases. Sludge TS% VS% VSR% Protein Polysaccharide ( in mg/L)
Feed 3.9 3.3 1,030 280Th-20 2.1 1.6 51.6 2,370 650ThAer6 1.6 1.2 64.4 200 280Me-10 1.7 1.7 48.6 1,160 250
Phase -1
MeAer6 1.3 1.3 60.2 470 250
Feed 3.6 2.7 770 160Th-15 3.4 2.2 20.2 2,370 300ThAer3 2.6 1.6 41.1 1,240 360ThAer9 2.5 1.4 48.6 360 160Me-15 2.2 1.3 51.5 1,290 160MeAer3 1.8 1.1 61.4 250 280
Phase -2
MeAer9 1.6 0.9 67.5 350 100
- 50 -
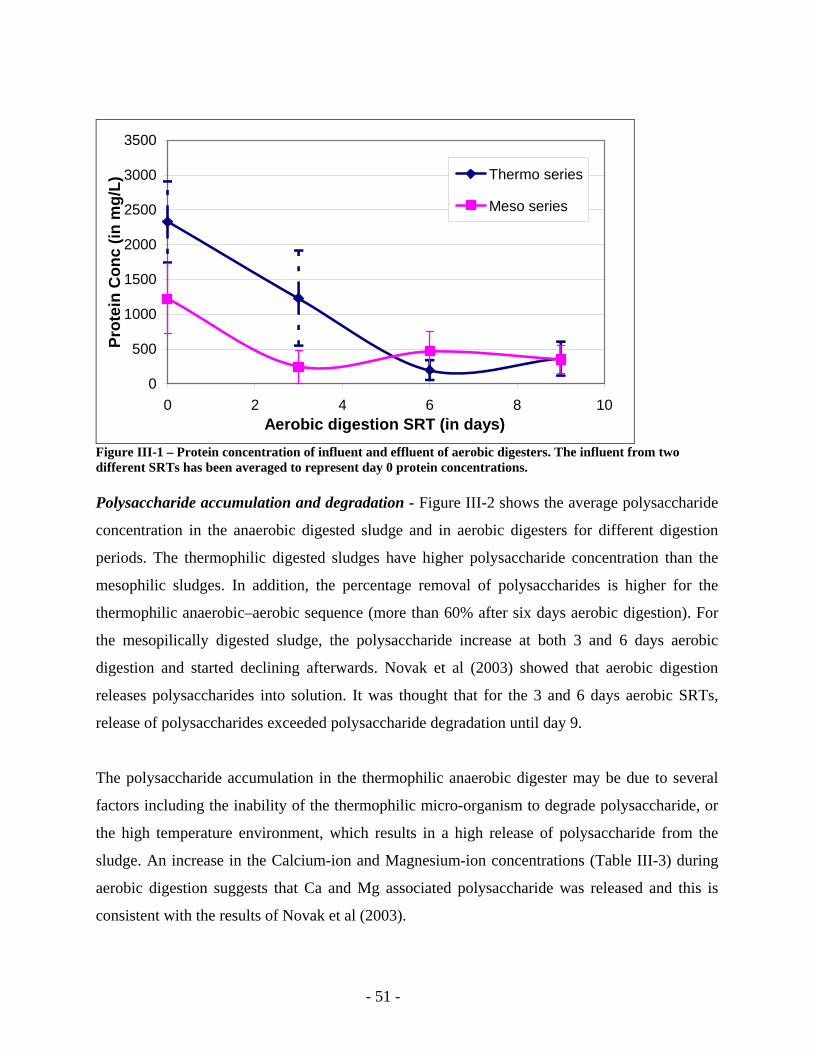
0
500
1000
1500
2000
2500
3000
3500
0 2 4 6 8Aerobic digestion SRT (in days)
Prot
ein
Con
c (in
mg/
L)
10
Thermo series
Meso series
Figure III-1 – Protein concentration of influent and effluent of aerobic digesters. The influent from two different SRTs has been averaged to represent day 0 protein concentrations. Polysaccharide accumulation and degradation - Figure III-2 shows the average polysaccharide
concentration in the anaerobic digested sludge and in aerobic digesters for different digestion
periods. The thermophilic digested sludges have higher polysaccharide concentration than the
mesophilic sludges. In addition, the percentage removal of polysaccharides is higher for the
thermophilic anaerobic–aerobic sequence (more than 60% after six days aerobic digestion). For
the mesopilically digested sludge, the polysaccharide increase at both 3 and 6 days aerobic
digestion and started declining afterwards. Novak et al (2003) showed that aerobic digestion
releases polysaccharides into solution. It was thought that for the 3 and 6 days aerobic SRTs,
release of polysaccharides exceeded polysaccharide degradation until day 9.
The polysaccharide accumulation in the thermophilic anaerobic digester may be due to several
factors including the inability of the thermophilic micro-organism to degrade polysaccharide, or
the high temperature environment, which results in a high release of polysaccharide from the
sludge. An increase in the Calcium-ion and Magnesium-ion concentrations (Table III-3) during
aerobic digestion suggests that Ca and Mg associated polysaccharide was released and this is
consistent with the results of Novak et al (2003).
- 51 -
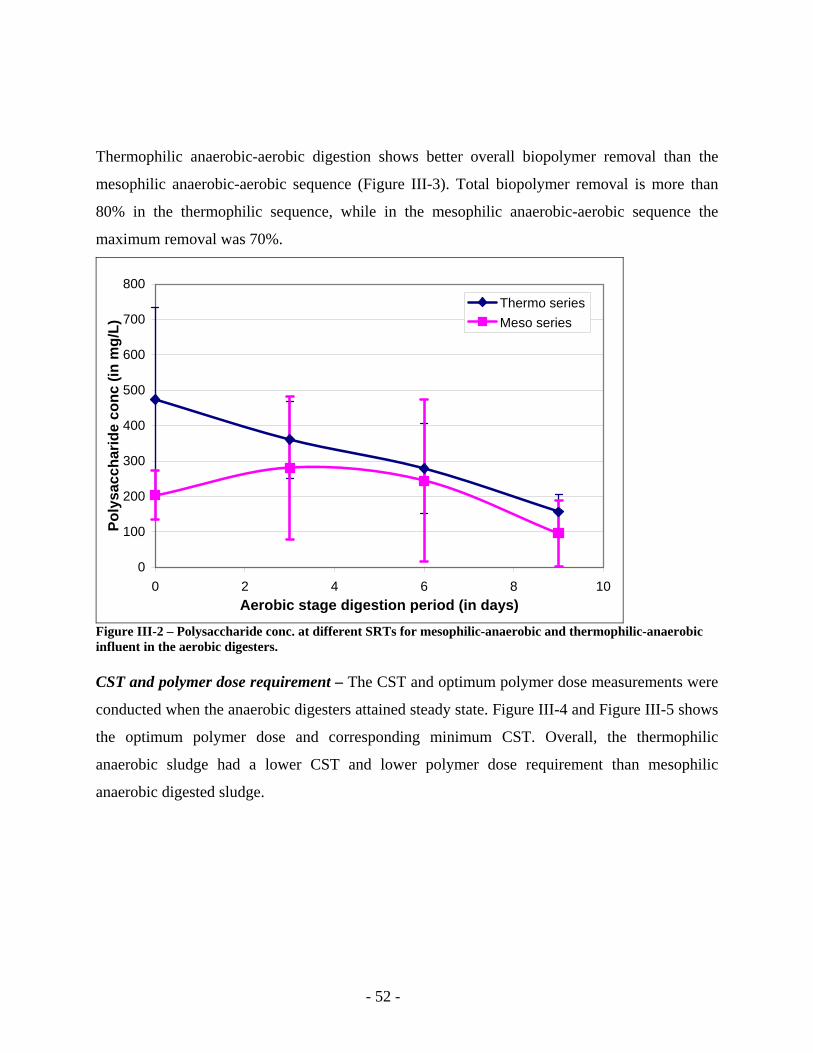
Thermophilic anaerobic-aerobic digestion shows better overall biopolymer removal than the
mesophilic anaerobic-aerobic sequence (Figure III-3). Total biopolymer removal is more than
80% in the thermophilic sequence, while in the mesophilic anaerobic-aerobic sequence the
maximum removal was 70%.
0
100
200
300
400
500
600
700
800
0 2 4 6 8Aerobic stage digestion period (in days)
Poly
sacc
harid
e co
nc (i
n m
g/L)
10
Thermo seriesMeso series
Figure III-2 – Polysaccharide conc. at different SRTs for mesophilic-anaerobic and thermophilic-anaerobic influent in the aerobic digesters. CST and polymer dose requirement – The CST and optimum polymer dose measurements were
conducted when the anaerobic digesters attained steady state. Figure III-4 and Figure III-5 shows
the optimum polymer dose and corresponding minimum CST. Overall, the thermophilic
anaerobic sludge had a lower CST and lower polymer dose requirement than mesophilic
anaerobic digested sludge.
- 52 -
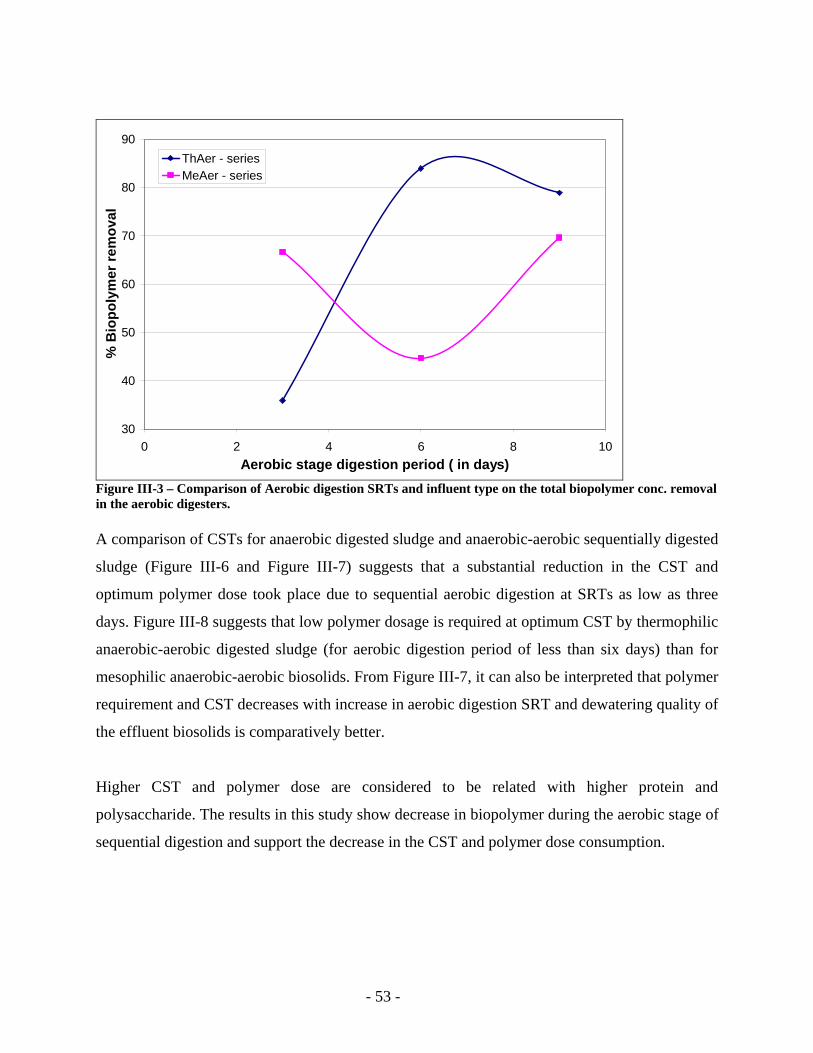
30
40
50
60
70
80
90
0 2 4 6 8Aerobic stage digestion period ( in days)
% B
iopo
lym
er re
mov
al
10
ThAer - seriesMeAer - series
Figure III-3 – Comparison of Aerobic digestion SRTs and influent type on the total biopolymer conc. removal in the aerobic digesters. A comparison of CSTs for anaerobic digested sludge and anaerobic-aerobic sequentially digested
sludge (Figure III-6 and Figure III-7) suggests that a substantial reduction in the CST and
optimum polymer dose took place due to sequential aerobic digestion at SRTs as low as three
days. Figure III-8 suggests that low polymer dosage is required at optimum CST by thermophilic
anaerobic-aerobic digested sludge (for aerobic digestion period of less than six days) than for
mesophilic anaerobic-aerobic biosolids. From Figure III-7, it can also be interpreted that polymer
requirement and CST decreases with increase in aerobic digestion SRT and dewatering quality of
the effluent biosolids is comparatively better.
Higher CST and polymer dose are considered to be related with higher protein and
polysaccharide. The results in this study show decrease in biopolymer during the aerobic stage of
sequential digestion and support the decrease in the CST and polymer dose consumption.
- 53 -
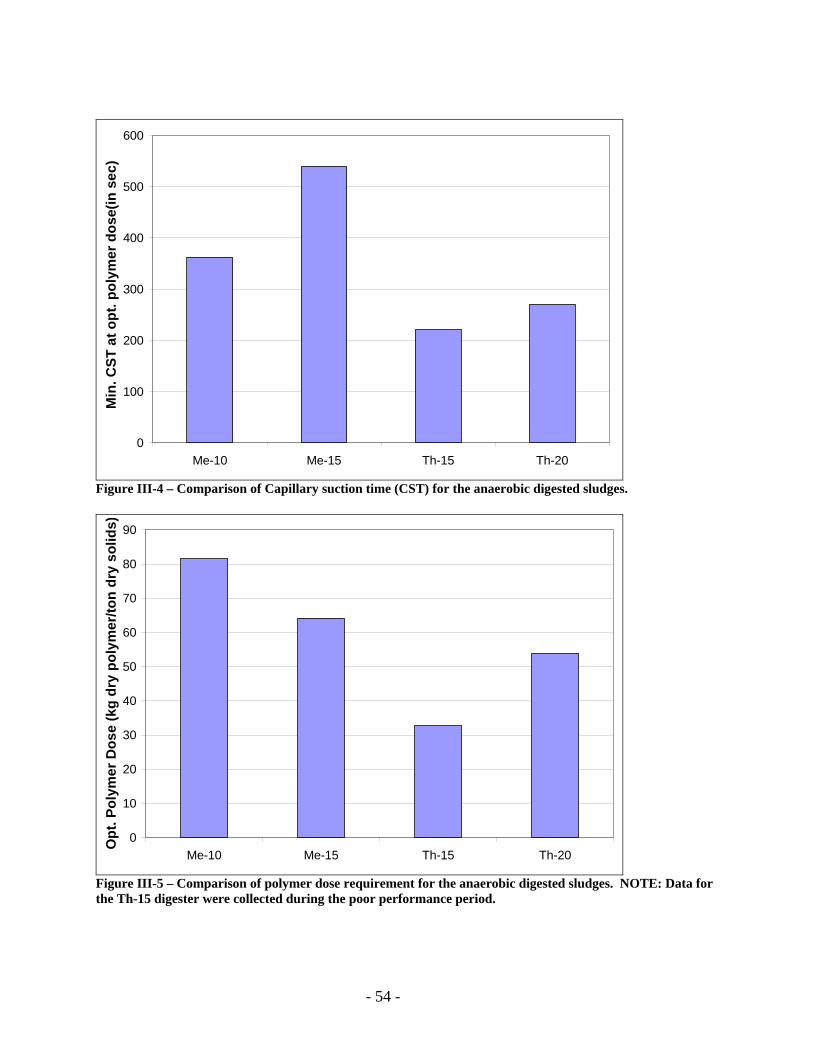
0
100
200
300
400
500
600
Me-10 Me-15 Th-15 Th-20
Min
. CST
at o
pt. p
olym
er d
ose(
in s
ec)
Figure III-4 – Comparison of Capillary suction time (CST) for the anaerobic digested sludges.
0
10
20
30
40
50
60
70
80
90
Me-10 Me-15 Th-15 Th-20
Opt
. Pol
ymer
Dos
e (k
g dr
y po
lym
er/to
n dr
y so
lids)
Figure III-5 – Comparison of polymer dose requirement for the anaerobic digested sludges. NOTE: Data for the Th-15 digester were collected during the poor performance period.
- 54 -
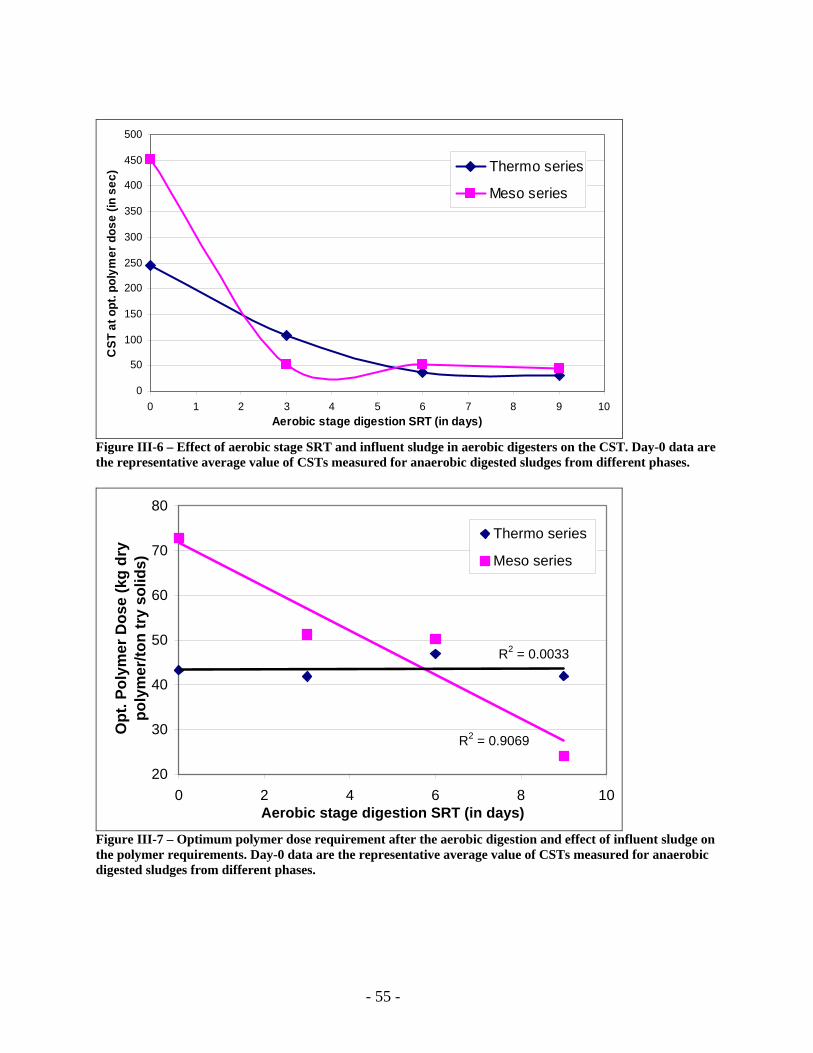
0
50
100
150
200
250
300
350
400
450
500
0 1 2 3 4 5 6 7 8 9 1Aerobic stage digestion SRT (in days)
CST
at o
pt. p
olym
er d
ose
(in s
ec)
0
Thermo series
Meso series
Figure III-6 – Effect of aerobic stage SRT and influent sludge in aerobic digesters on the CST. Day-0 data are the representative average value of CSTs measured for anaerobic digested sludges from different phases.
R2 = 0.9069
R2 = 0.0033
20
30
40
50
60
70
80
0 2 4 6 8Aerobic stage digestion SRT (in days)
Opt
. Pol
ymer
Dos
e (k
g dr
y po
lym
er/to
n tr
y so
lids)
10
Thermo series
Meso series
Figure III-7 – Optimum polymer dose requirement after the aerobic digestion and effect of influent sludge on the polymer requirements. Day-0 data are the representative average value of CSTs measured for anaerobic digested sludges from different phases.
- 55 -
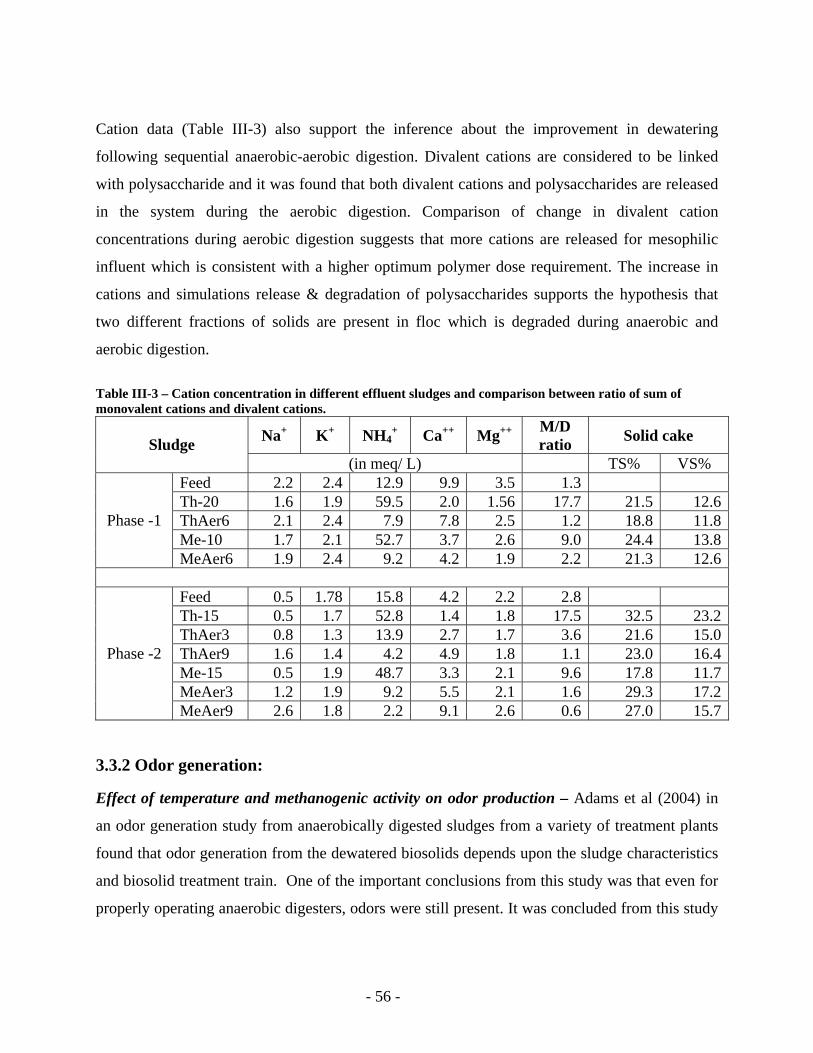
Cation data (Table III-3) also support the inference about the improvement in dewatering
following sequential anaerobic-aerobic digestion. Divalent cations are considered to be linked
with polysaccharide and it was found that both divalent cations and polysaccharides are released
in the system during the aerobic digestion. Comparison of change in divalent cation
concentrations during aerobic digestion suggests that more cations are released for mesophilic
influent which is consistent with a higher optimum polymer dose requirement. The increase in
cations and simulations release & degradation of polysaccharides supports the hypothesis that
two different fractions of solids are present in floc which is degraded during anaerobic and
aerobic digestion.
Table III-3 – Cation concentration in different effluent sludges and comparison between ratio of sum of monovalent cations and divalent cations.
Na+ K+ NH4+ Ca++ Mg++ M/D
ratio Solid cake Sludge (in meq/ L) TS% VS%
Feed 2.2 2.4 12.9 9.9 3.5 1.3 Th-20 1.6 1.9 59.5 2.0 1.56 17.7 21.5 12.6ThAer6 2.1 2.4 7.9 7.8 2.5 1.2 18.8 11.8Me-10 1.7 2.1 52.7 3.7 2.6 9.0 24.4 13.8
Phase -1
MeAer6 1.9 2.4 9.2 4.2 1.9 2.2 21.3 12.6
Feed 0.5 1.78 15.8 4.2 2.2 2.8 Th-15 0.5 1.7 52.8 1.4 1.8 17.5 32.5 23.2ThAer3 0.8 1.3 13.9 2.7 1.7 3.6 21.6 15.0ThAer9 1.6 1.4 4.2 4.9 1.8 1.1 23.0 16.4Me-15 0.5 1.9 48.7 3.3 2.1 9.6 17.8 11.7MeAer3 1.2 1.9 9.2 5.5 2.1 1.6 29.3 17.2
Phase -2
MeAer9 2.6 1.8 2.2 9.1 2.6 0.6 27.0 15.7
3.3.2 Odor generation:
Effect of temperature and methanogenic activity on odor production – Adams et al (2004) in
an odor generation study from anaerobically digested sludges from a variety of treatment plants
found that odor generation from the dewatered biosolids depends upon the sludge characteristics
and biosolid treatment train. One of the important conclusions from this study was that even for
properly operating anaerobic digesters, odors were still present. It was concluded from this study
- 56 -
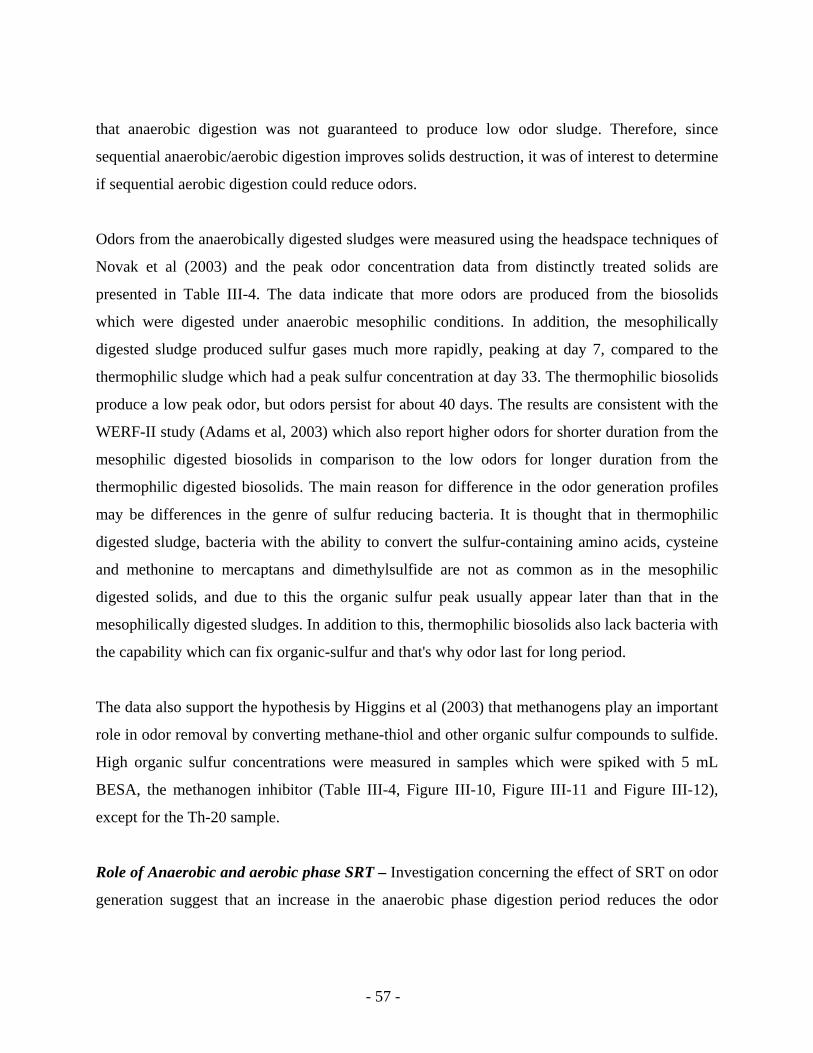
that anaerobic digestion was not guaranteed to produce low odor sludge. Therefore, since
sequential anaerobic/aerobic digestion improves solids destruction, it was of interest to determine
if sequential aerobic digestion could reduce odors.
Odors from the anaerobically digested sludges were measured using the headspace techniques of
Novak et al (2003) and the peak odor concentration data from distinctly treated solids are
presented in Table III-4. The data indicate that more odors are produced from the biosolids
which were digested under anaerobic mesophilic conditions. In addition, the mesophilically
digested sludge produced sulfur gases much more rapidly, peaking at day 7, compared to the
thermophilic sludge which had a peak sulfur concentration at day 33. The thermophilic biosolids
produce a low peak odor, but odors persist for about 40 days. The results are consistent with the
WERF-II study (Adams et al, 2003) which also report higher odors for shorter duration from the
mesophilic digested biosolids in comparison to the low odors for longer duration from the
thermophilic digested biosolids. The main reason for difference in the odor generation profiles
may be differences in the genre of sulfur reducing bacteria. It is thought that in thermophilic
digested sludge, bacteria with the ability to convert the sulfur-containing amino acids, cysteine
and methonine to mercaptans and dimethylsulfide are not as common as in the mesophilic
digested solids, and due to this the organic sulfur peak usually appear later than that in the
mesophilically digested sludges. In addition to this, thermophilic biosolids also lack bacteria with
the capability which can fix organic-sulfur and that's why odor last for long period.
The data also support the hypothesis by Higgins et al (2003) that methanogens play an important
role in odor removal by converting methane-thiol and other organic sulfur compounds to sulfide.
High organic sulfur concentrations were measured in samples which were spiked with 5 mL
BESA, the methanogen inhibitor (Table III-4, Figure III-10, Figure III-11 and Figure III-12),
except for the Th-20 sample.
Role of Anaerobic and aerobic phase SRT – Investigation concerning the effect of SRT on odor
generation suggest that an increase in the anaerobic phase digestion period reduces the odor
- 57 -
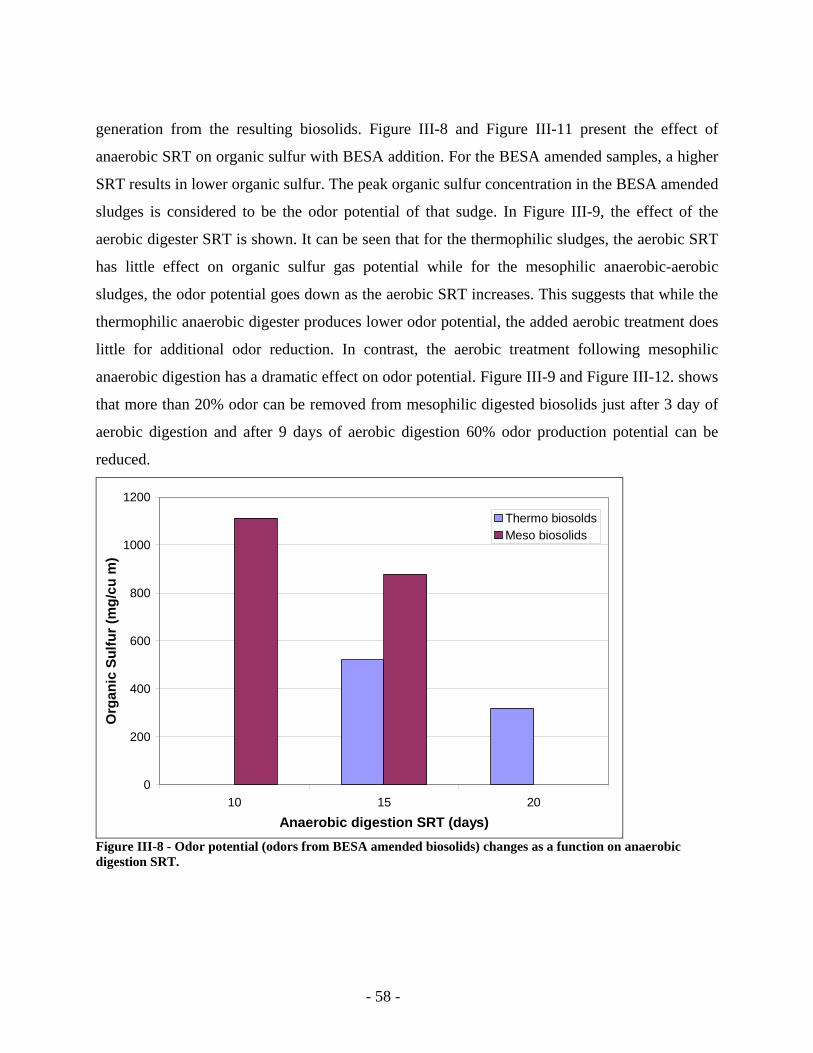
generation from the resulting biosolids. Figure III-8 and Figure III-11 present the effect of
anaerobic SRT on organic sulfur with BESA addition. For the BESA amended samples, a higher
SRT results in lower organic sulfur. The peak organic sulfur concentration in the BESA amended
sludges is considered to be the odor potential of that sudge. In Figure III-9, the effect of the
aerobic digester SRT is shown. It can be seen that for the thermophilic sludges, the aerobic SRT
has little effect on organic sulfur gas potential while for the mesophilic anaerobic-aerobic
sludges, the odor potential goes down as the aerobic SRT increases. This suggests that while the
thermophilic anaerobic digester produces lower odor potential, the added aerobic treatment does
little for additional odor reduction. In contrast, the aerobic treatment following mesophilic
anaerobic digestion has a dramatic effect on odor potential. Figure III-9 and Figure III-12. shows
that more than 20% odor can be removed from mesophilic digested biosolids just after 3 day of
aerobic digestion and after 9 days of aerobic digestion 60% odor production potential can be
reduced.
0
200
400
600
800
1000
1200
10 15 20Anaerobic digestion SRT (days)
Org
anic
Sul
fur (
mg/
cu m
)
Thermo biosoldsMeso biosolids
Figure III-8 - Odor potential (odors from BESA amended biosolids) changes as a function on anaerobic digestion SRT.
- 58 -
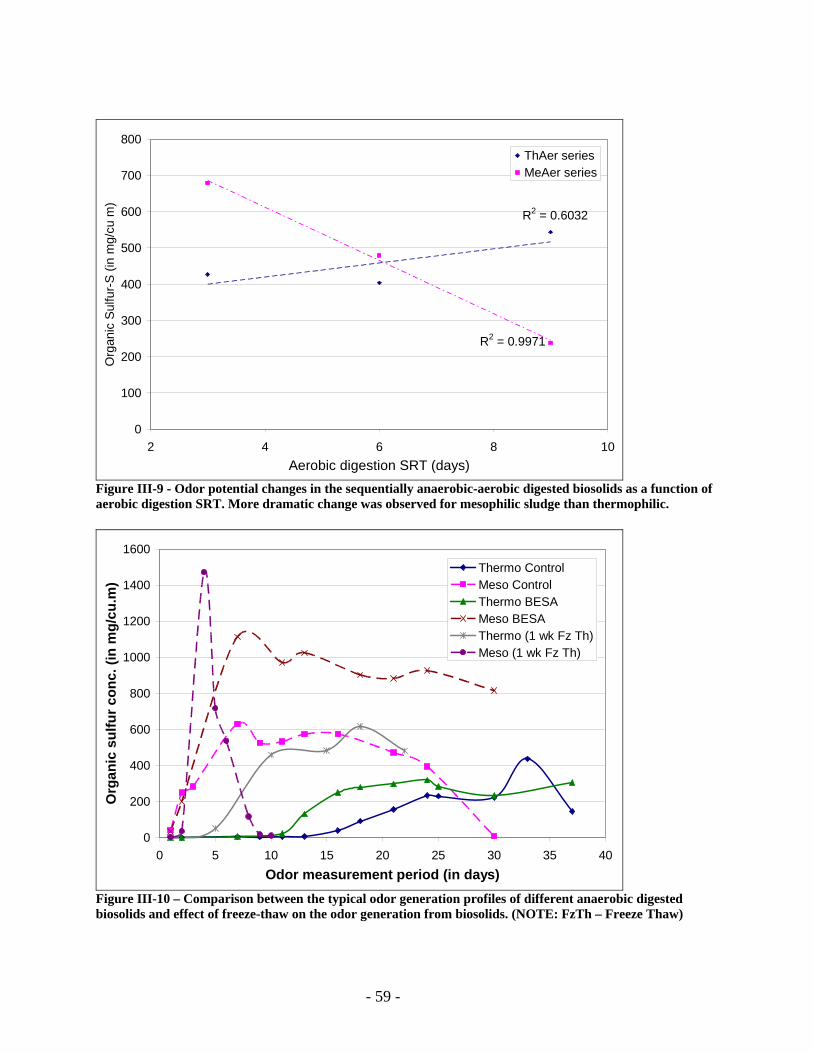
R2 = 0.6032
R2 = 0.9971
0
100
200
300
400
500
600
700
800
2 4 6 8Aerobic digestion SRT (days)
Org
anic
Sul
fur-S
(in
mg/
cu m
)
10
ThAer seriesMeAer series
Figure III-9 - Odor potential changes in the sequentially anaerobic-aerobic digested biosolids as a function of aerobic digestion SRT. More dramatic change was observed for mesophilic sludge than thermophilic.
0
200
400
600
800
1000
1200
1400
1600
0 5 10 15 20 25 30 35 40Odor measurement period (in days)
Org
anic
sul
fur c
onc.
(in
mg/
cu.m
)
Thermo ControlMeso ControlThermo BESAMeso BESAThermo (1 wk Fz Th)Meso (1 wk Fz Th)
Figure III-10 – Comparison between the typical odor generation profiles of different anaerobic digested biosolids and effect of freeze-thaw on the odor generation from biosolids. (NOTE: FzTh – Freeze Thaw)
- 59 -
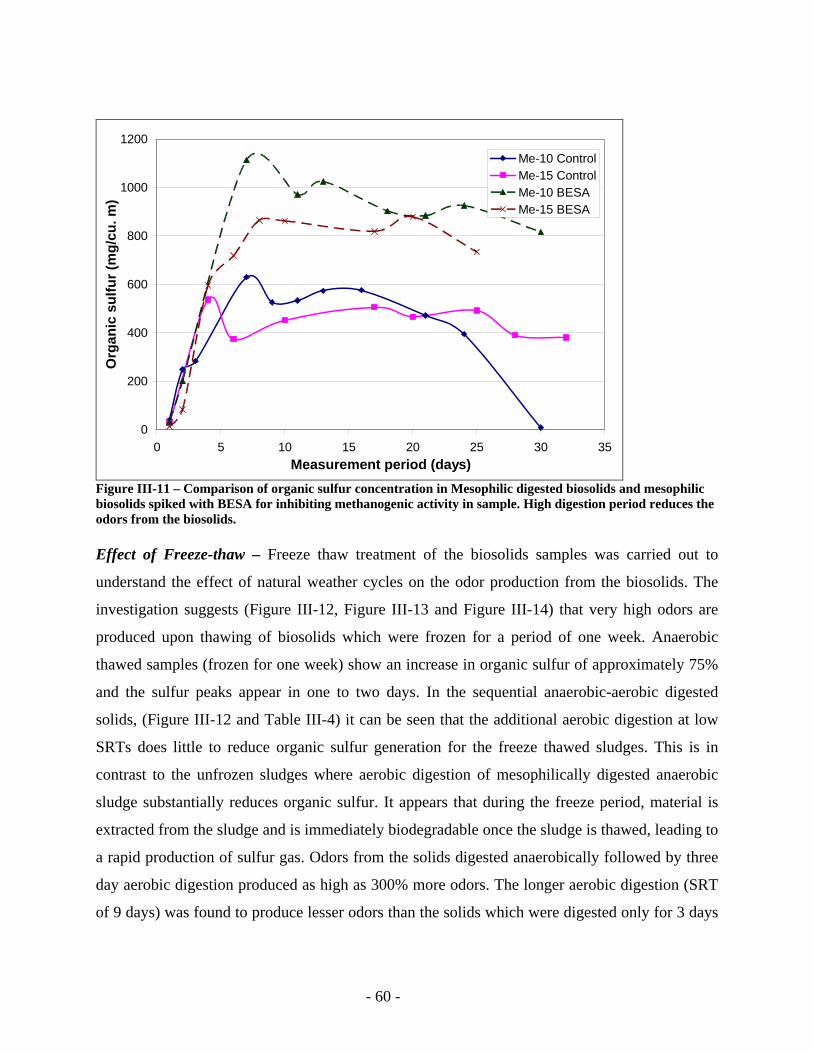
0
200
400
600
800
1000
1200
0 5 10 15 20 25 30 35Measurement period (days)
Org
anic
sul
fur (
mg/
cu. m
)
Me-10 ControlMe-15 ControlMe-10 BESAMe-15 BESA
Figure III-11 – Comparison of organic sulfur concentration in Mesophilic digested biosolids and mesophilic biosolids spiked with BESA for inhibiting methanogenic activity in sample. High digestion period reduces the odors from the biosolids. Effect of Freeze-thaw – Freeze thaw treatment of the biosolids samples was carried out to
understand the effect of natural weather cycles on the odor production from the biosolids. The
investigation suggests (Figure III-12, Figure III-13 and Figure III-14) that very high odors are
produced upon thawing of biosolids which were frozen for a period of one week. Anaerobic
thawed samples (frozen for one week) show an increase in organic sulfur of approximately 75%
and the sulfur peaks appear in one to two days. In the sequential anaerobic-aerobic digested
solids, (Figure III-12 and Table III-4) it can be seen that the additional aerobic digestion at low
SRTs does little to reduce organic sulfur generation for the freeze thawed sludges. This is in
contrast to the unfrozen sludges where aerobic digestion of mesophilically digested anaerobic
sludge substantially reduces organic sulfur. It appears that during the freeze period, material is
extracted from the sludge and is immediately biodegradable once the sludge is thawed, leading to
a rapid production of sulfur gas. Odors from the solids digested anaerobically followed by three
day aerobic digestion produced as high as 300% more odors. The longer aerobic digestion (SRT
of 9 days) was found to produce lesser odors than the solids which were digested only for 3 days
- 60 -
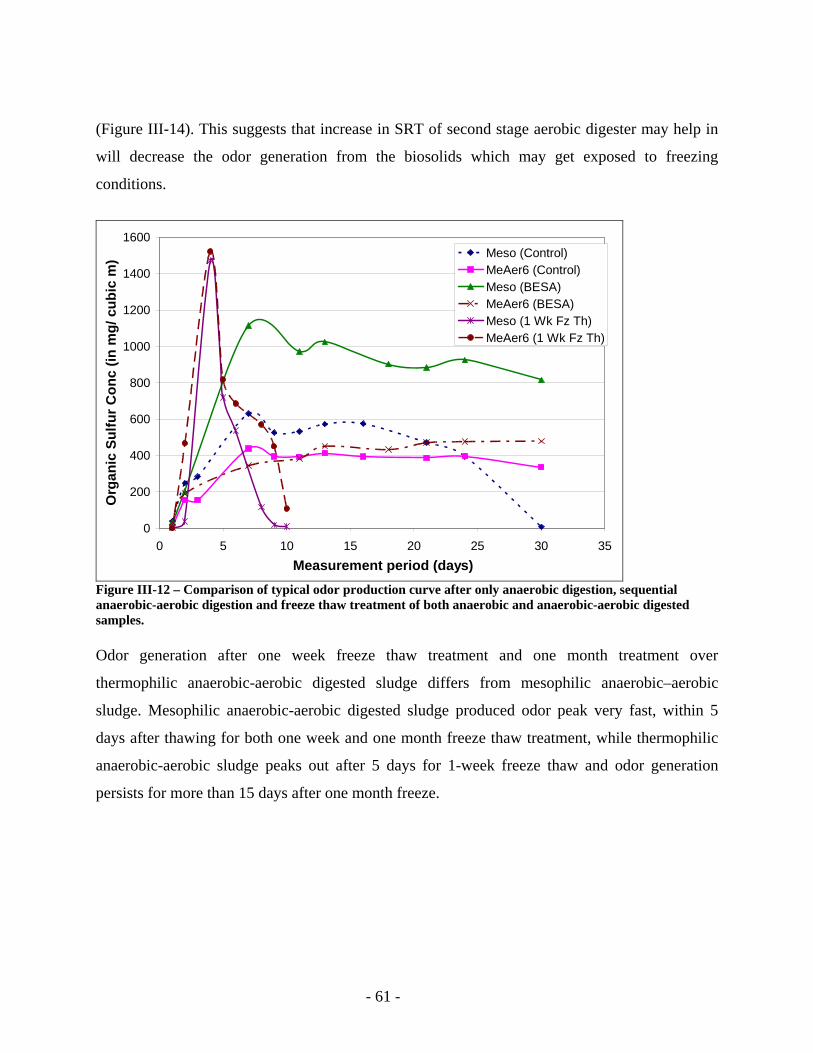
(Figure III-14). This suggests that increase in SRT of second stage aerobic digester may help in
will decrease the odor generation from the biosolids which may get exposed to freezing
conditions.
0
200
400
600
800
1000
1200
1400
1600
0 5 10 15 20 25 30 35Measurement period (days)
Org
anic
Sul
fur C
onc
(in m
g/ c
ubic
m) Meso (Control)
MeAer6 (Control)Meso (BESA)MeAer6 (BESA)Meso (1 Wk Fz Th)MeAer6 (1 Wk Fz Th)
Figure III-12 – Comparison of typical odor production curve after only anaerobic digestion, sequential anaerobic-aerobic digestion and freeze thaw treatment of both anaerobic and anaerobic-aerobic digested samples. Odor generation after one week freeze thaw treatment and one month treatment over
thermophilic anaerobic-aerobic digested sludge differs from mesophilic anaerobic–aerobic
sludge. Mesophilic anaerobic-aerobic digested sludge produced odor peak very fast, within 5
days after thawing for both one week and one month freeze thaw treatment, while thermophilic
anaerobic-aerobic sludge peaks out after 5 days for 1-week freeze thaw and odor generation
persists for more than 15 days after one month freeze.
- 61 -
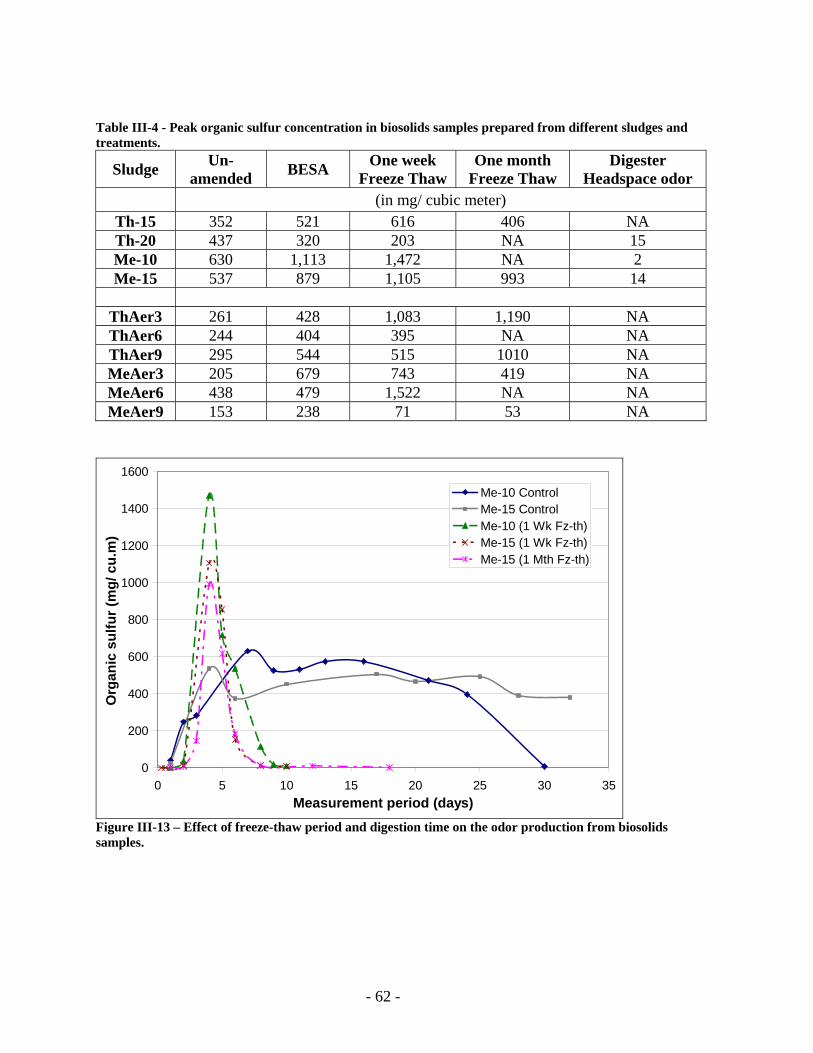
Table III-4 - Peak organic sulfur concentration in biosolids samples prepared from different sludges and treatments.
Sludge Un-amended BESA One week
Freeze Thaw One month
Freeze Thaw Digester
Headspace odor (in mg/ cubic meter)
Th-15 352 521 616 406 NA Th-20 437 320 203 NA 15 Me-10 630 1,113 1,472 NA 2 Me-15 537 879 1,105 993 14
ThAer3 261 428 1,083 1,190 NA ThAer6 244 404 395 NA NA ThAer9 295 544 515 1010 NA MeAer3 205 679 743 419 NA MeAer6 438 479 1,522 NA NA MeAer9 153 238 71 53 NA
0
200
400
600
800
1000
1200
1400
1600
0 5 10 15 20 25 30 35Measurement period (days)
Org
anic
sul
fur (
mg/
cu.
m)
Me-10 ControlMe-15 ControlMe-10 (1 Wk Fz-th)Me-15 (1 Wk Fz-th)Me-15 (1 Mth Fz-th)
Figure III-13 – Effect of freeze-thaw period and digestion time on the odor production from biosolids samples.
- 62 -
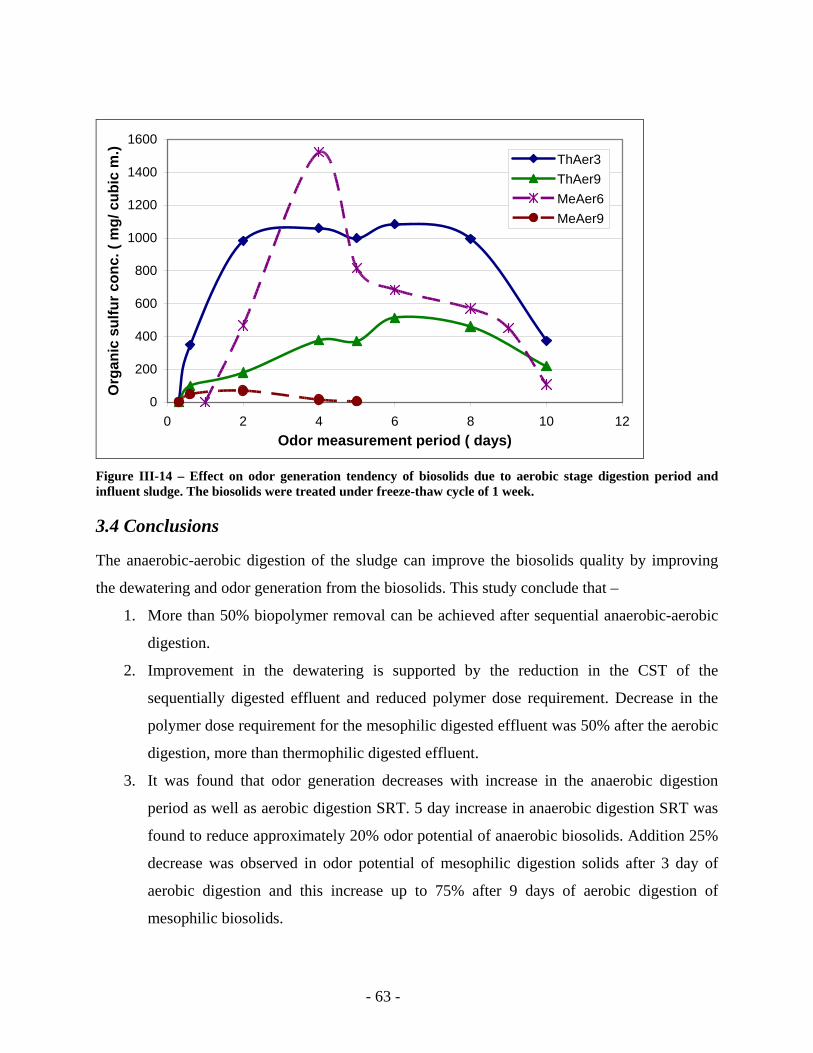
0
200
400
600
800
1000
1200
1400
1600
0 2 4 6 8 10Odor measurement period ( days)
Org
anic
sul
fur c
onc.
( m
g/ c
ubic
m.)
12
ThAer3ThAer9MeAer6MeAer9
Figure III-14 – Effect on odor generation tendency of biosolids due to aerobic stage digestion period and influent sludge. The biosolids were treated under freeze-thaw cycle of 1 week.
3.4 Conclusions
The anaerobic-aerobic digestion of the sludge can improve the biosolids quality by improving
the dewatering and odor generation from the biosolids. This study conclude that –
1. More than 50% biopolymer removal can be achieved after sequential anaerobic-aerobic
digestion.
2. Improvement in the dewatering is supported by the reduction in the CST of the
sequentially digested effluent and reduced polymer dose requirement. Decrease in the
polymer dose requirement for the mesophilic digested effluent was 50% after the aerobic
digestion, more than thermophilic digested effluent.
3. It was found that odor generation decreases with increase in the anaerobic digestion
period as well as aerobic digestion SRT. 5 day increase in anaerobic digestion SRT was
found to reduce approximately 20% odor potential of anaerobic biosolids. Addition 25%
decrease was observed in odor potential of mesophilic digestion solids after 3 day of
aerobic digestion and this increase up to 75% after 9 days of aerobic digestion of
mesophilic biosolids.
- 63 -
4. Thermophilic biosolids generate 50% lesser odor in comparison to mesophilic biosolids,
but the odor production period last longer than that for mesophilic biosolids.
5. Freeze-thaw cycle make more biopolymer available for the microbial activity, which is
followed by increased odor generation after the thawing of biosolids. The odor
generation period for freeze-thawed biosolids was found to be 4-5 days.
6. Prolonged aerobic digestion seems to reducing the odors from the biosolids, which
undergo freeze-thaw cycle. Solids digested for 9 day were found to produce 50% lesser
odors after freeze thaw than those were digested only up to 3 days.
3.5 References
Adams, G.M., Witherspoon, J., Card, T., Forbes, R., Geselbracht, J., Glindemann, D.,
Hargreaves, R. Hentz, L., Higgins, M., McEwen, D., and Murthy, S. (2003). Identifying and
Controlling the Municipal Wastewater Odor Environment Phase 2: Impacts of In-Plant
Operational Parameters on Biosolids Odor Quality. Water Environment Research Foundation:
Alexandria, VA.
Adams, G., Witherspoon, J. R., Cain. W., Cometto-Muniz, E., Forbes, B., Hentz, L.,
Novak, J.T., Higgins, M., Murthy, S., McEwen, D., Ong, H.T., and Daigger, G.T. (2004). Water
Envivonment Research Foundation (WERF) anaerobic digestion and related processes, odour
and health effects study. Water Sci. Tech., 4, 9-16.
Dubois, M., Gilles, K.A., Hamilton, J.K., Rebers, P.A., and Smith, F. (1956).
Colorimetric Methods for Determination of Sugars and Related Substances. Analytical Chem.,
28, 350.
Frolund, B., Palmgren, R., Keiding, K. and Nielsen, P. H. (1996): Extraction of
Extracellular Polymers from Activated Sludge using a Cation Exchange Resin. Wat. Res., 30,
1749-1758.
- 64 -
Hartree, E.F. (1972). Determination of Protein: A Modification of the Lowry Method
That Gives a Linear Photometric Response. Anal. Biochem., 48, 422.
Higgins, M.J., Murthy S.N., Yarosz, D.P., Novak, J.T., Glindemann, D., Toffey, W.E.
and Abu-Orf, M. (2002). Effect of Chemical Addition on Production of Volatile Sulfur
Compounds and Odor from Anaerobically Digested Biosolids. WEFTEC 2002 Annual
Conference, Chicago, IL.
Higgins, M. J. and Novak, J.T. (1997a). The Effect of Cations on the Settling and
Dewatering of Activated Sludges. Water Environ. Res., 69, 215.
Higgins, M.J. and Novak, J.T. (1997b). Characterization of Exocellular Protein and Its
Role in Bioflocculation. J. Environ. Engr. ASCE, 123, 479-485.
Higgins, M.J., Yarosz, D.P., Chen, Y.C., Murthy, S.N., Maas, N., Cooney, J.,
Glindemann, D., Novak, J.T. (2004). Cycling of Volatile Organic Sulfur Compounds in
Anaerobically Digested Biosolids and its Implications for Odors. Water Environment Research,
2004 (Submitted, November 2003).
Lowry, O.H., Rosebrough, N.J., Farr, A.L., and Randall, R.J. (1951). Protein
Measurement with the Folin Phenol Reagent. J. Biol. Chem., 193, 265.
Murthy, S. N., Novak, J.T., Holbrook, R.D., and Surovik, F. (2000). Mesophilic aeration
of autothermal thermophilic aerobically digested biosolids to improve plant operations. Wat.
Envr. Res., 72(4), 476 – 483.
Murthy, S.N., Higgins, M.J., Chen, Y., Toffey, W. and Golembeski, J. (2003). Influence
of Solids Characteristics and Dewatering Process on Volatile Sulfur Compound Production from
Anaerobically Digested Biosolids. Biosolids Conference 2003.
- 65 -
Murthy, S.N., Forbes, B., Burrowes, P., Esqueda, T., Glindemann, D., Novak, J.T.,
Higgins, M.J., Mendenhall, T. and Toffey, W. (2002). Impact of High Shear Solids Processing
on Production of Volatile Sulfur Compounds from Anaerobically Digested Biosolids. WEFTEC
2002 Annual Conference, Chicago, IL.
Muller, C.D., Nitin Verma, Matthew J. Higgins and John T. Novak. (2004). The role of
shear in the generation of nuisance odors from dewatered biosolids. WEFTEC 2004 Conference
and Exhibition Proceedings, October, 2004, New Orleans, LA.
Metcalf and Eddy Inc. (2003). Wastewater engineering: Treatment and reuse. 4th
Edition. McGraw-Hill, New York, NY.
Novak, J., D. Glindemann, S.N. Murthy, S.C. Gerwin, C. Peot. (2002). Mechanisms for
Generation and Control of Trimethyl Amine and Dimethyl Disulfide from Lime Stablilized
Biosolids. In WEF Odors and Toxic Air Emissions 2002 Conference. 2002. Albuquerque, NM:
WEF.
Novak, J.T., Sadler, M.E., and Murthy, S.N. (2003). Mechanisms of Floc Destruction
during anaerobic and aerobic digestion and the effect on conditioning and dewatering of
biosolids. Water Res., 37, 3136 - 3144.
Novak J.T., C. D. Muller and S. N. Murthy. (2001). Floc Structure and the Role of
Cations. Wat. Sci. Tech., 44: 209 – 213
Park C., Mohammad M. A., Novak J.T. (2004). Predicting the Digestibility of Waste
Activated Sludges. Wat Environ Res.
- 66 -
Subramanian, S., (2005). Digestion processes and their effect on dewatering and Bound
water content of sludge. MS Thesis submitted at Virginia Tech.
Verma, N., (2005). Anaerobic Digestion: Factors Effecting Odor Generation. MS Thesis
submitted at Virginia Tech.
- 67 -
Appendix A
Research Note: Role of nitrate and nitrite in Volatile solids and
nitrogen removal via denitrification in sequential anaerobic-aerobic
digestion of solids
Kumar, N and Novak, J.T
Abstract
During an investigation of anaerobic-aerobic sequential digestion of solids, it was observed that
more than 50% ammonia was lost from the system and no appreciable nitrite and nitrate
concentration was measured. This batch study was designed to investigate the role of
denitrification during the aerobic digestion of anaerobic digested sludge. Anaerobic digested
sludge was spiked independently with different nitrate and nitrite concentrations in separate
batches. During the study, no nitrite and nitrate was observed during the first three days of the
digestion and more than 60% ammonium was found to be removed along with 80 % VFA from
the systems. The role of nitrite and nitrate in VS & TKN removal was also investigated. Nitrite
was found to assist in VS removal and TKN removal more than the nitrates.
Key words: Nitrification, denitrification, anaerobic-aerobic treatment, nitrite and nitrates.
A.1 Introduction Nitrogen recycle from dewatered sludges following anaerobic digestion is one of the major
nutrient loads for wastewater utilities that practice anaerobic digestion. During anaerobic
digestion proteins are released from the sludge mass and ammonia is generated upon the
degradation of protein. The biosolids after anaerobic digestion are usually dewatered and the
water extracted during the process is re-introduced back at the head of the wastewater utility. The
recycled water usually has very high nitrogen content and exert extra load on the upstream
wastewater treatment processes.
- 68 -
Advance methods to remove the nitrogen from the wastewater have been engineered including
the SHARONTM process and anaerobic-aerobic sequential treatment for nitrogen removal. These
processes have disadvantage of loss in alkalinity and an additional carbon source is required
during the denitrification process. Bernet et al (2000) and Wang et al (2004) studied the
nitrification process and suggested that nitrification can be optimized by controlling the DO,
temperature (Hellinga et al, 1997) and SRT (Pollice et al, 2002). Chung et al (2002) suggested
that partial nitrification (stopping at nitrite) can provide the shortcut for the biological nitrogen
removal process and help in saving 25% energy required for aeration during nitrification.
Akunna et al (1993) suggested that the carbon source has also important role in the reduction of
nitrite and nitrate with anaerobic sludge. The authors proposed that in the presence of lactic and
acetic acid, reduction of nitrite and nitrate was 100% due to denitrification, but in the presence of
glucose and glycerol dissimilatory nitrate reduction to ammonia (ammonification) was major
nitrate/nitrite reduction pathway. In the same study, it was also suggested that the COD
requirement for nitrate and nitrite reduction in the presence of acetic acid was higher than that in
presence of glycerol and glucose. In another study (Murray et al, 1975) it was observed that
nitrification occurred at higher rates when nitrite was the electron acceptor rather than nitrate.
Bernet et al 2000 found that denitrification can take place during the filling period of aerobic
SBR reactor, when mixed liquor had low dissolved oxygen levels.
Prior to this study, an investigation was conducted of anaerobic-aerobic sequential treatment to
attain higher volatile solids (VS) removal and nitrogen removal. During the investigation, it was
found that more than 50% nitrogen loss occurred and could not be accounted by considering
nitrogen assimilation into the cells, nitrification and ammonia stripping. Denitrification was
believed to be a major nitrogen removal process in the system, but no additional carbon source
was required and no extra alkalinity addition was required. The aims of this study were to further
investigate the nitrogen removal mechanism and the role of nitrite and nitrate during the aerobic
digestion of anaerobic digested sludge. This was done by batch addition of nitrite or nitrate to
- 69 -
sludge from the aerobic reactor and following the investigation of VS, fatty acids, nitrate and
nitrite fate during the process.
A.2 Methods and Materials
A.2.1 Batch bioreactor for nitrogen removal studies:
To understand nitrogen removal in the aerobic phase, a batch aerobic digestion process was
carried out by spiking the batch digesters with different concentrations of nitrite and nitrate. The
batch aerobic digestion study was conducted using mesophilic digested biosolids as feed. The
mesophilic sludge was collected over a period of a few days from a digester maintained for
another study and the sludge was stored at 4 oC. For investigation purposes, the stored sludge
was spiked independently with three different concentrations of either nitrite or nitrate.
Concentrations used for spiking the sludge were 10 mg/L, 30 mg/L and 50 mg/L (all as NH3)
and a control was also maintained for comparison. Samples were collected from the digesters at
the 3rd, 6th, 9th and 15th days of digestion. Volatile solid reduction, pH, VFA, TKN and total
ammonia and soluble ammonium ion concentrations were measured. The dissolved oxygen (DO)
concentration was maintained at 2 ppm during the operation period of the digesters.
A.2.2 Analytical methods:
For VFA and selected ion measurements (NH4+, NO2
-, and NO3-), samples were centrifuged at
10,000 g for 20 min at 25 oC followed by filtration through a 1.5 µm glass fiber filter. The
filtered samples were frozen and then thawed at room temperature prior to the analytical
measurement. Thawed samples were centrifuged at 5,000 g for 10 min and filtered using a 0.45
um filter.
For VFA samples analysis, 900 µL samples were acidified by adding 100 µL phosphoric acid.
Samples were analyzed using a Shimadzu GC-14-A gas chromatograph with a flame ionization
detector. Helium, nitrogen, and hydrogen were the main gases used for analysis purpose. Air was
used for makeup purposes. Flow rates of the different gases were as follows:
5. Helium – 17 mL/min
- 70 -
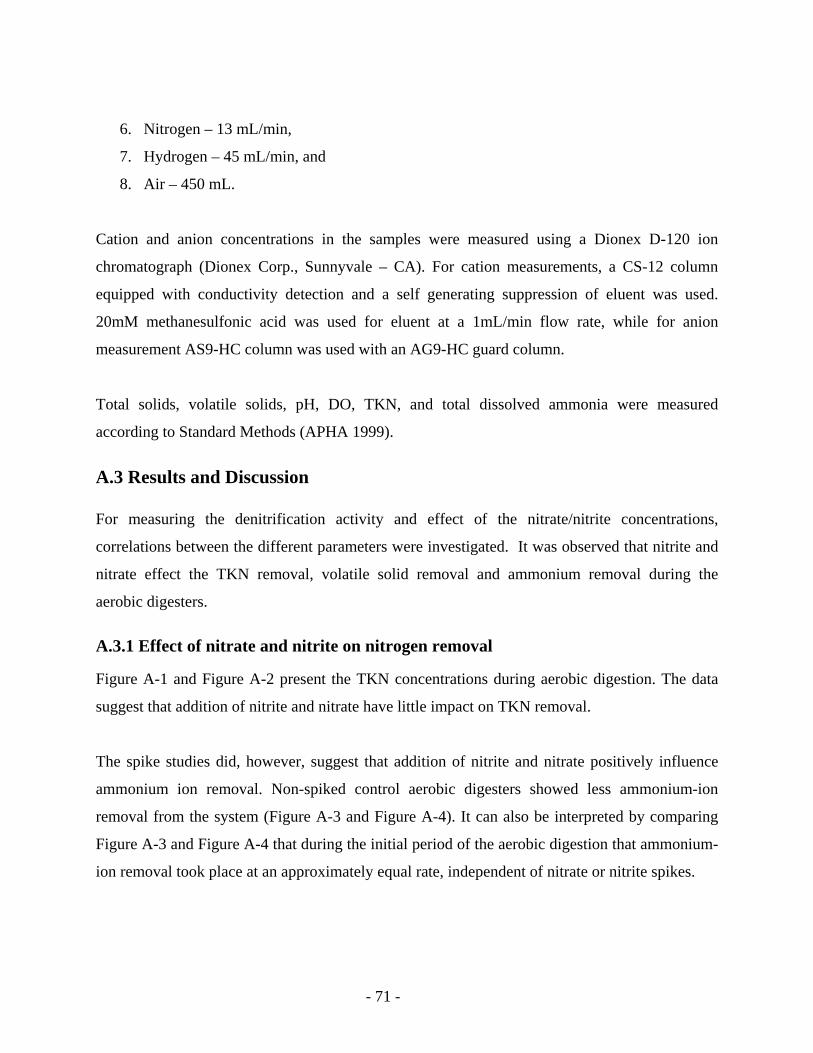
6. Nitrogen – 13 mL/min,
7. Hydrogen – 45 mL/min, and
8. Air – 450 mL.
Cation and anion concentrations in the samples were measured using a Dionex D-120 ion
chromatograph (Dionex Corp., Sunnyvale – CA). For cation measurements, a CS-12 column
equipped with conductivity detection and a self generating suppression of eluent was used.
20mM methanesulfonic acid was used for eluent at a 1mL/min flow rate, while for anion
measurement AS9-HC column was used with an AG9-HC guard column.
Total solids, volatile solids, pH, DO, TKN, and total dissolved ammonia were measured
according to Standard Methods (APHA 1999).
A.3 Results and Discussion For measuring the denitrification activity and effect of the nitrate/nitrite concentrations,
correlations between the different parameters were investigated. It was observed that nitrite and
nitrate effect the TKN removal, volatile solid removal and ammonium removal during the
aerobic digesters.
A.3.1 Effect of nitrate and nitrite on nitrogen removal
Figure A-1 and Figure A-2 present the TKN concentrations during aerobic digestion. The data
suggest that addition of nitrite and nitrate have little impact on TKN removal.
The spike studies did, however, suggest that addition of nitrite and nitrate positively influence
ammonium ion removal. Non-spiked control aerobic digesters showed less ammonium-ion
removal from the system (Figure A-3 and Figure A-4). It can also be interpreted by comparing
Figure A-3 and Figure A-4 that during the initial period of the aerobic digestion that ammonium-
ion removal took place at an approximately equal rate, independent of nitrate or nitrite spikes.
- 71 -
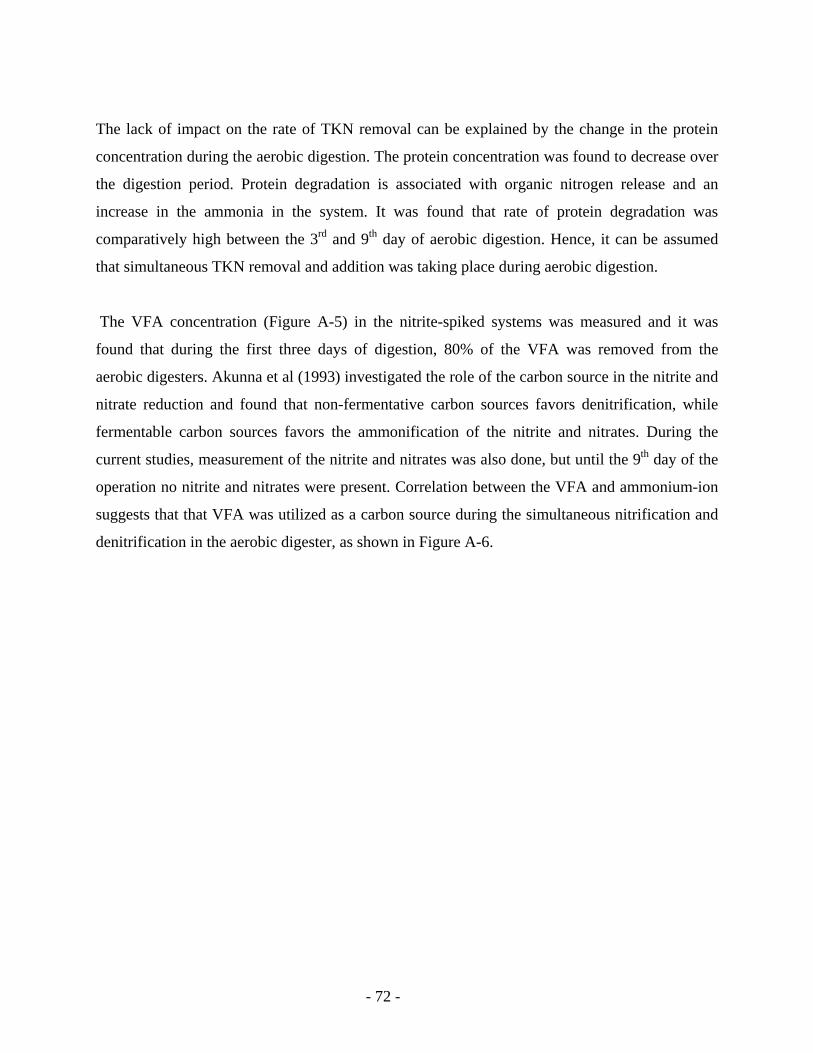
The lack of impact on the rate of TKN removal can be explained by the change in the protein
concentration during the aerobic digestion. The protein concentration was found to decrease over
the digestion period. Protein degradation is associated with organic nitrogen release and an
increase in the ammonia in the system. It was found that rate of protein degradation was
comparatively high between the 3rd and 9th day of aerobic digestion. Hence, it can be assumed
that simultaneous TKN removal and addition was taking place during aerobic digestion.
The VFA concentration (Figure A-5) in the nitrite-spiked systems was measured and it was
found that during the first three days of digestion, 80% of the VFA was removed from the
aerobic digesters. Akunna et al (1993) investigated the role of the carbon source in the nitrite and
nitrate reduction and found that non-fermentative carbon sources favors denitrification, while
fermentable carbon sources favors the ammonification of the nitrite and nitrates. During the
current studies, measurement of the nitrite and nitrates was also done, but until the 9th day of the
operation no nitrite and nitrates were present. Correlation between the VFA and ammonium-ion
suggests that that VFA was utilized as a carbon source during the simultaneous nitrification and
denitrification in the aerobic digester, as shown in Figure A-6.
- 72 -
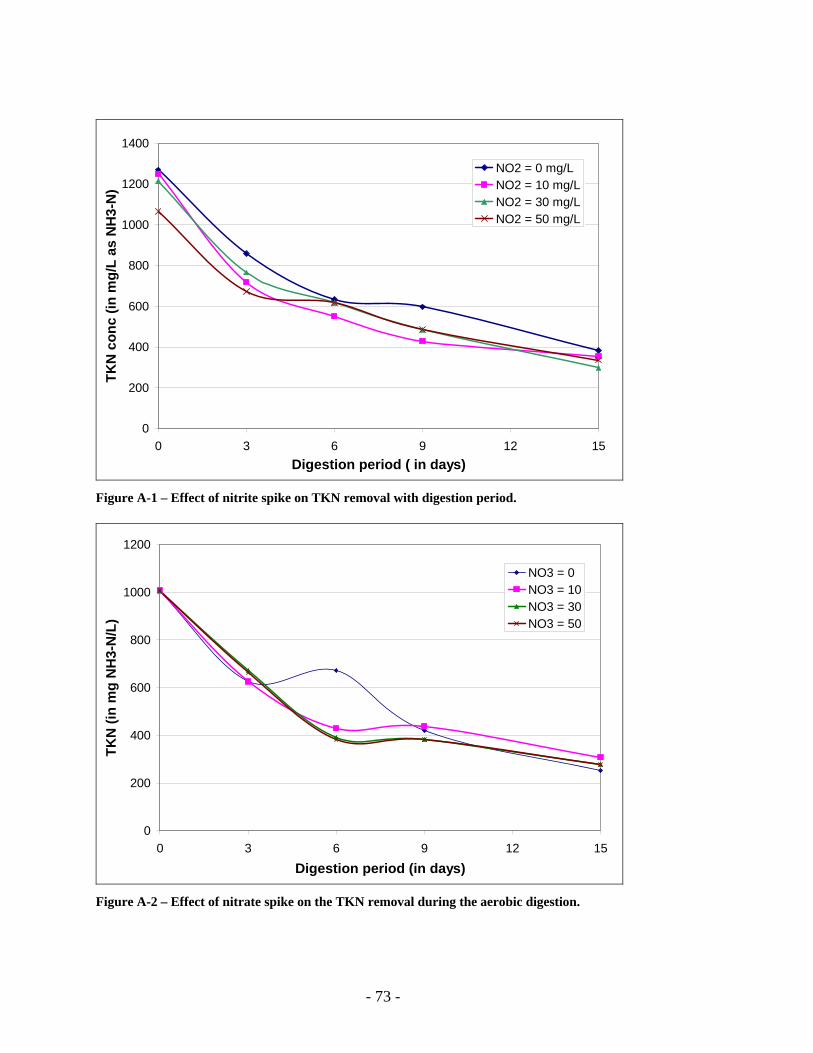
0
200
400
600
800
1000
1200
1400
0 3 6 9 12Digestion period ( in days)
TKN
con
c (in
mg/
L as
NH
3-N
)
15
NO2 = 0 mg/LNO2 = 10 mg/LNO2 = 30 mg/LNO2 = 50 mg/L
Figure A-1 – Effect of nitrite spike on TKN removal with digestion period.
0
200
400
600
800
1000
1200
0 3 6 9 12 15
Digestion period (in days)
TKN
(in
mg
NH
3-N
/L)
NO3 = 0NO3 = 10NO3 = 30NO3 = 50
Figure A-2 – Effect of nitrate spike on the TKN removal during the aerobic digestion.
- 73 -
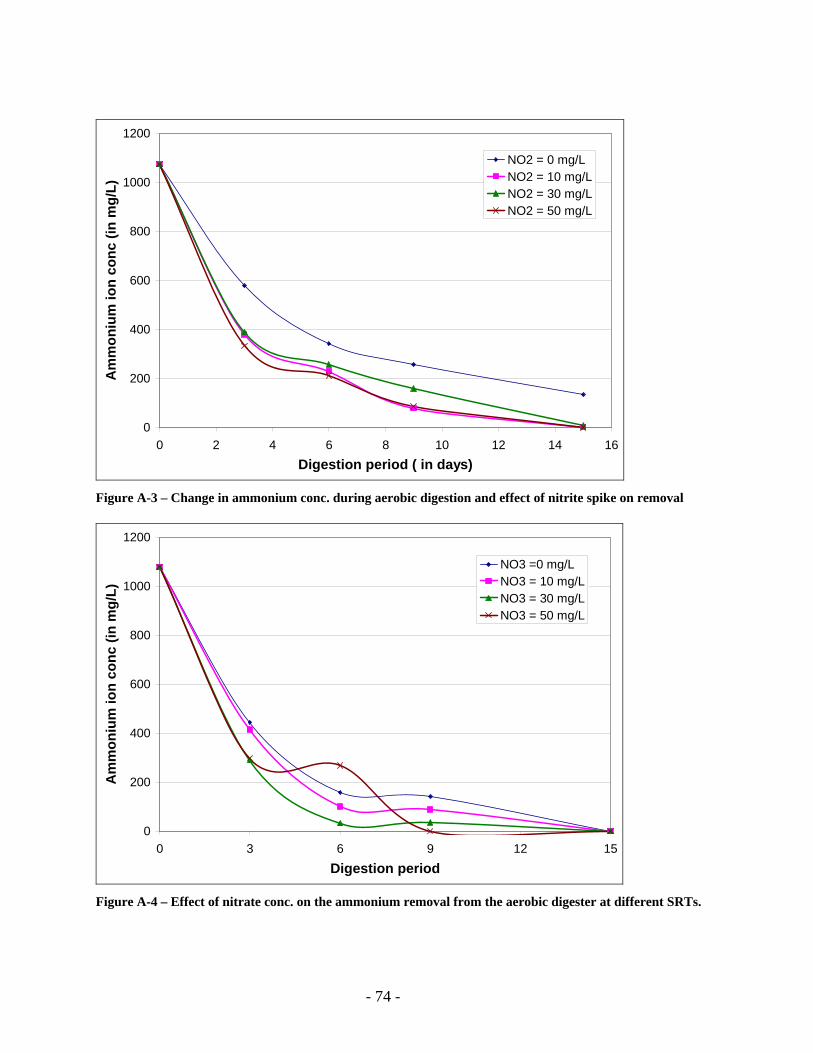
0
200
400
600
800
1000
1200
0 2 4 6 8 10 12 14 1Digestion period ( in days)
Am
mon
ium
ion
conc
(in
mg/
L)
6
NO2 = 0 mg/LNO2 = 10 mg/LNO2 = 30 mg/LNO2 = 50 mg/L
Figure A-3 – Change in ammonium conc. during aerobic digestion and effect of nitrite spike on removal
0
200
400
600
800
1000
1200
0 3 6 9 12Digestion period
Am
mon
ium
ion
conc
(in
mg/
L)
15
NO3 =0 mg/LNO3 = 10 mg/LNO3 = 30 mg/LNO3 = 50 mg/L
Figure A-4 – Effect of nitrate conc. on the ammonium removal from the aerobic digester at different SRTs.
- 74 -
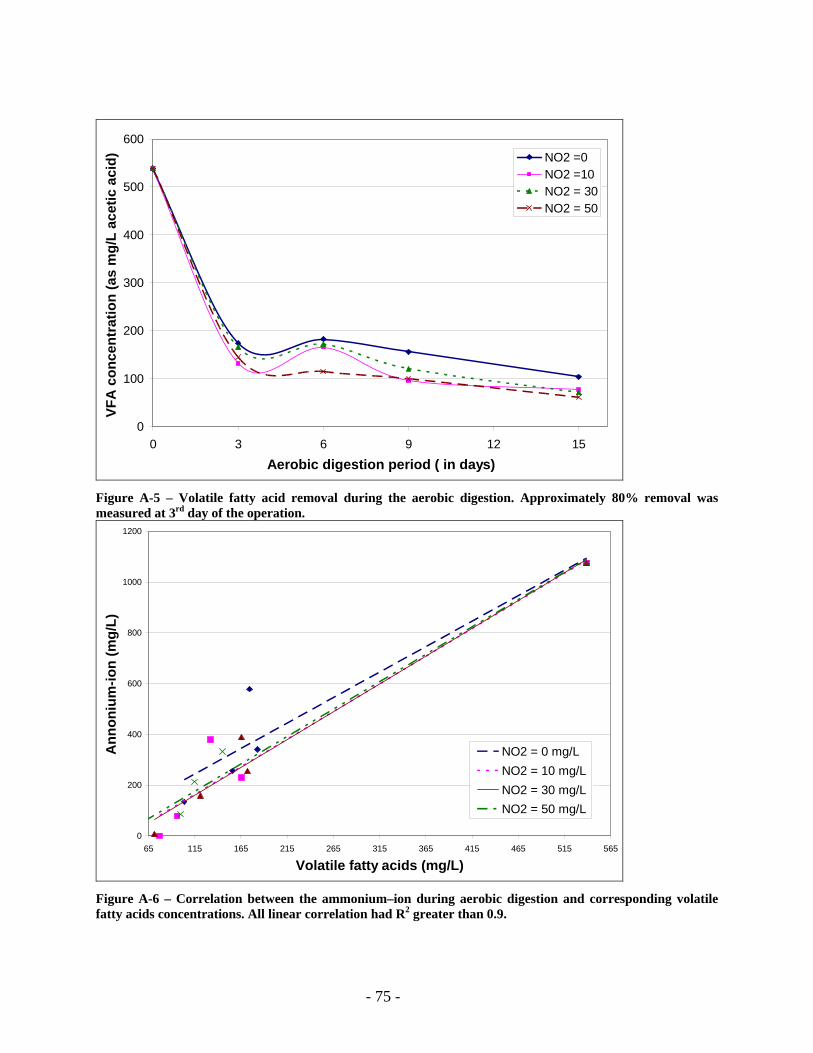
0
100
200
300
400
500
600
0 3 6 9 12 15
Aerobic digestion period ( in days)
VFA
con
cent
ratio
n (a
s m
g/L
acet
ic a
cid) NO2 =0
NO2 =10NO2 = 30NO2 = 50
Figure A-5 – Volatile fatty acid removal during the aerobic digestion. Approximately 80% removal was measured at 3rd day of the operation.
0
200
400
600
800
1000
1200
65 115 165 215 265 315 365 415 465 515 565
Volatile fatty acids (mg/L)
Ann
oniu
m-io
n (m
g/L)
NO2 = 0 mg/LNO2 = 10 mg/LNO2 = 30 mg/LNO2 = 50 mg/L
Figure A-6 – Correlation between the ammonium–ion during aerobic digestion and corresponding volatile fatty acids concentrations. All linear correlation had R2 greater than 0.9.
- 75 -
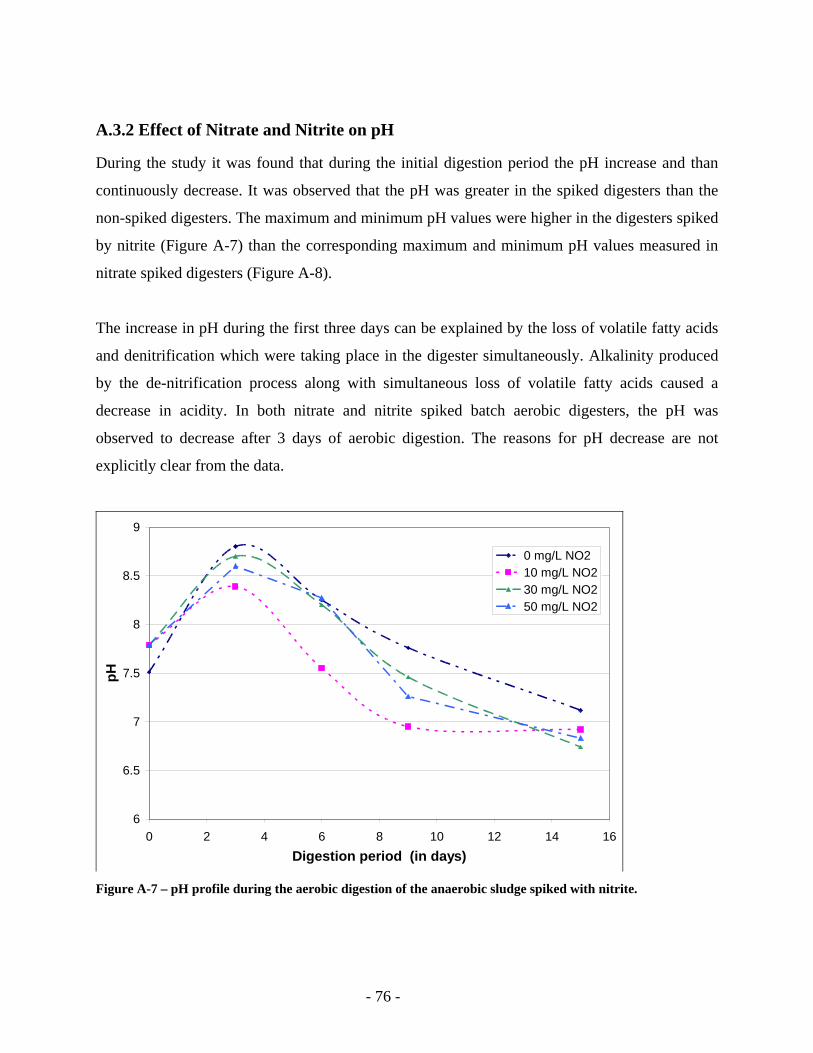
A.3.2 Effect of Nitrate and Nitrite on pH
During the study it was found that during the initial digestion period the pH increase and than
continuously decrease. It was observed that the pH was greater in the spiked digesters than the
non-spiked digesters. The maximum and minimum pH values were higher in the digesters spiked
by nitrite (Figure A-7) than the corresponding maximum and minimum pH values measured in
nitrate spiked digesters (Figure A-8).
The increase in pH during the first three days can be explained by the loss of volatile fatty acids
and denitrification which were taking place in the digester simultaneously. Alkalinity produced
by the de-nitrification process along with simultaneous loss of volatile fatty acids caused a
decrease in acidity. In both nitrate and nitrite spiked batch aerobic digesters, the pH was
observed to decrease after 3 days of aerobic digestion. The reasons for pH decrease are not
explicitly clear from the data.
6
6.5
7
7.5
8
8.5
9
0 2 4 6 8 10 12 14 1Digestion period (in days)
pH
6
0 mg/L NO210 mg/L NO230 mg/L NO250 mg/L NO2
Figure A-7 – pH profile during the aerobic digestion of the anaerobic sludge spiked with nitrite.
- 76 -
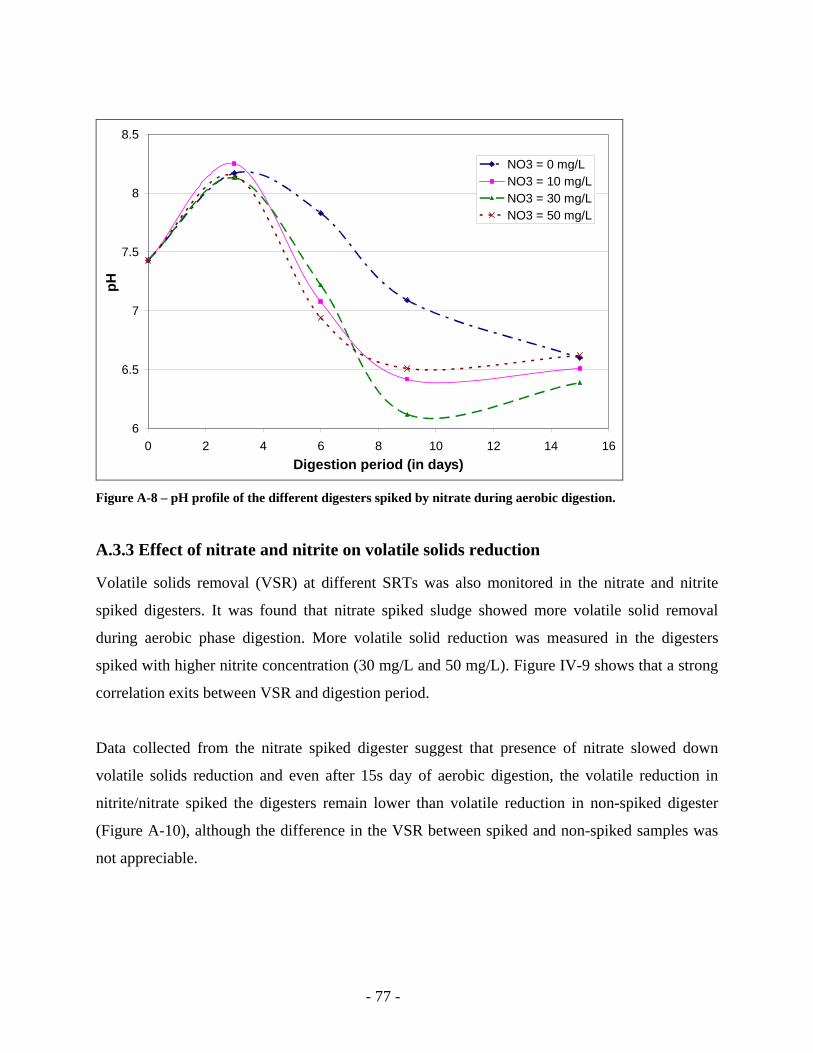
6
6.5
7
7.5
8
8.5
0 2 4 6 8 10 12 14Digestion period (in days)
pH
16
NO3 = 0 mg/LNO3 = 10 mg/LNO3 = 30 mg/LNO3 = 50 mg/L
Figure A-8 – pH profile of the different digesters spiked by nitrate during aerobic digestion.
A.3.3 Effect of nitrate and nitrite on volatile solids reduction
Volatile solids removal (VSR) at different SRTs was also monitored in the nitrate and nitrite
spiked digesters. It was found that nitrate spiked sludge showed more volatile solid removal
during aerobic phase digestion. More volatile solid reduction was measured in the digesters
spiked with higher nitrite concentration (30 mg/L and 50 mg/L). Figure IV-9 shows that a strong
correlation exits between VSR and digestion period.
Data collected from the nitrate spiked digester suggest that presence of nitrate slowed down
volatile solids reduction and even after 15s day of aerobic digestion, the volatile reduction in
nitrite/nitrate spiked the digesters remain lower than volatile reduction in non-spiked digester
(Figure A-10), although the difference in the VSR between spiked and non-spiked samples was
not appreciable.
- 77 -
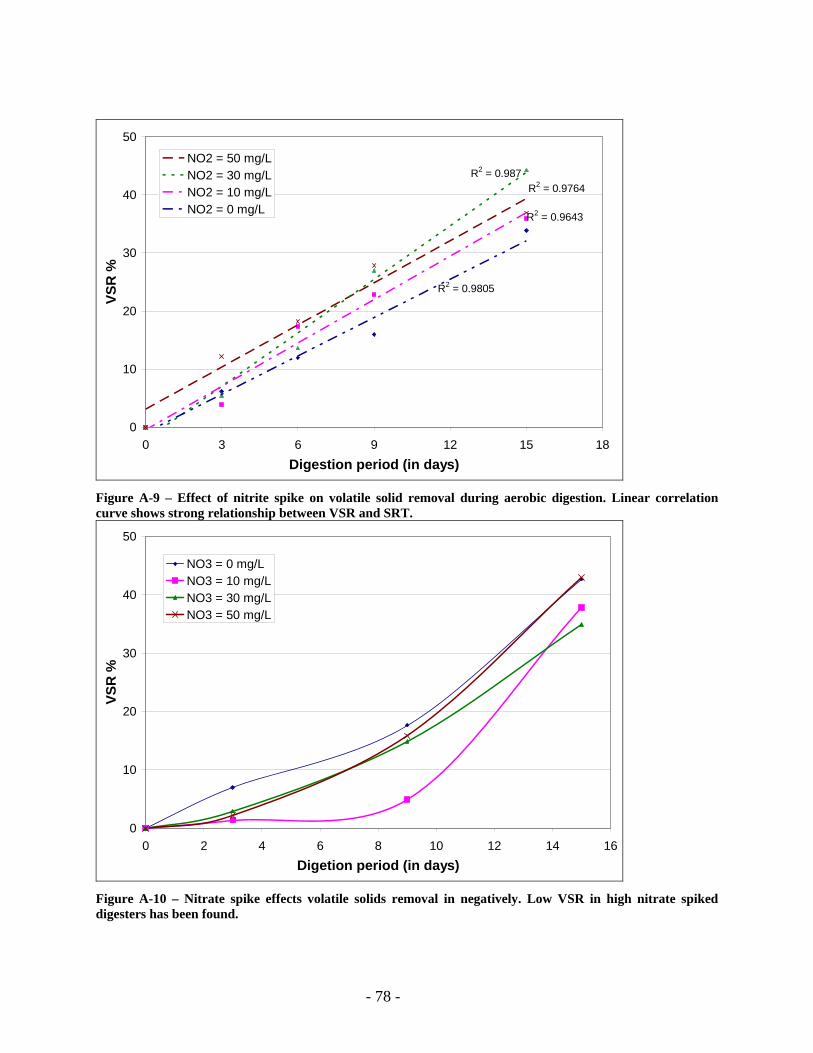
R2 = 0.9643
R2 = 0.987R2 = 0.9764
R2 = 0.9805
0
10
20
30
40
50
0 3 6 9 12 15 18Digestion period (in days)
VSR
%
NO2 = 50 mg/LNO2 = 30 mg/LNO2 = 10 mg/LNO2 = 0 mg/L
Figure A-9 – Effect of nitrite spike on volatile solid removal during aerobic digestion. Linear correlation curve shows strong relationship between VSR and SRT.
0
10
20
30
40
50
0 2 4 6 8 10 12 14Digetion period (in days)
VSR
%
16
NO3 = 0 mg/LNO3 = 10 mg/LNO3 = 30 mg/LNO3 = 50 mg/L
Figure A-10 – Nitrate spike effects volatile solids removal in negatively. Low VSR in high nitrate spiked digesters has been found.
- 78 -
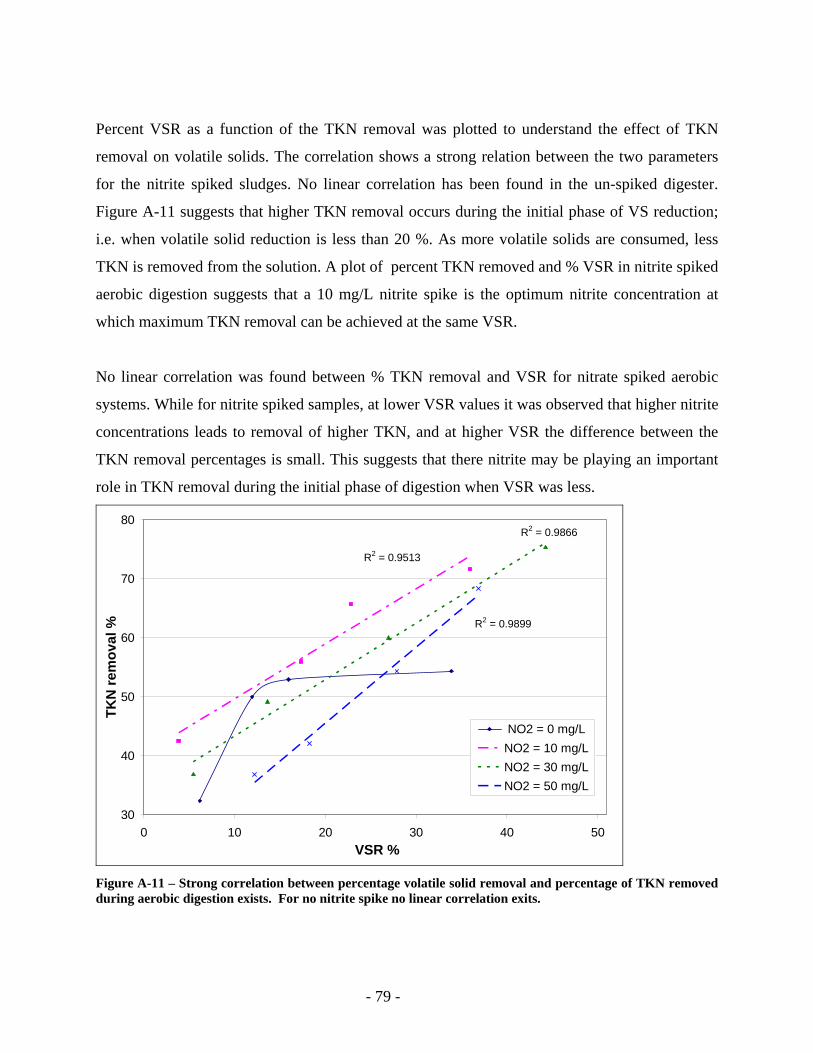
Percent VSR as a function of the TKN removal was plotted to understand the effect of TKN
removal on volatile solids. The correlation shows a strong relation between the two parameters
for the nitrite spiked sludges. No linear correlation has been found in the un-spiked digester.
Figure A-11 suggests that higher TKN removal occurs during the initial phase of VS reduction;
i.e. when volatile solid reduction is less than 20 %. As more volatile solids are consumed, less
TKN is removed from the solution. A plot of percent TKN removed and % VSR in nitrite spiked
aerobic digestion suggests that a 10 mg/L nitrite spike is the optimum nitrite concentration at
which maximum TKN removal can be achieved at the same VSR.
No linear correlation was found between % TKN removal and VSR for nitrate spiked aerobic
systems. While for nitrite spiked samples, at lower VSR values it was observed that higher nitrite
concentrations leads to removal of higher TKN, and at higher VSR the difference between the
TKN removal percentages is small. This suggests that there nitrite may be playing an important
role in TKN removal during the initial phase of digestion when VSR was less.
R2 = 0.9513
R2 = 0.9866
R2 = 0.9899
30
40
50
60
70
80
0 10 20 30 40VSR %
TKN
rem
oval
%
50
NO2 = 0 mg/LNO2 = 10 mg/LNO2 = 30 mg/LNO2 = 50 mg/L
Figure A-11 – Strong correlation between percentage volatile solid removal and percentage of TKN removed during aerobic digestion exists. For no nitrite spike no linear correlation exits.
- 79 -
A.4 Conclusions The aerobic digestion of anaerobic sludge spiked independently by nitrite or nitrate suggests that
simultaneous nitrification and denitrification can take place during the initial phase of the
digestion process. In the later phases of aerobic digestion nitrification became takes over the
denitrification. Absence of both nitrate and nitrite, strong correlation between the ammonium
loss and volatile fatty acid loss and high removal rates of both species during the initial phase of
the operation supports that denitrification can take place during the aerobic digestion of
anaerobic effluent.
It was found that nitrite spike enhance the ammonium, TKN and volatile solids removal from the
aerobic digesters, while any appreciable difference was not found in the aerobic digesters spiked
with nitrate. In addition it can be concluded that volatile fatty acid serve as a preferred carbon
source for denitrification during aerobic phase of sequential anaerobic-aerobic digestion.
A.5 References
Akunna, J.C.; Bizeau, C. and Moletta, R. (1993). Nitrate and nitrite reductions with
anaerobic sludge using various carbon sources: Glucose, Glycerol, Acetic acid, Lactic Acid and
Methanol. Water Res., 27 (8): 1303 – 1312.
Akunna, J.; Bizeau, C.; Moletta, R.; Bernet, N. and Heduit, A. (1994). Combined organic
carbon and complete nitrogen removal using anaerobic and aerobic upflow filters. Water Sci.
Tech., 30 (12): 297 – 306.
Bernet, N; Delgenes, N; Akunna, J.C; Delgenes, J.P and Moletta, R. (2000). Combined
anaerobic-aerobic SBR for the treatment of piggery wastewater. Water Res., 34 (2): 611-619.
Chung, J. and Bae, W. (2002). Nitrite reduction by a mixed culture under conditions
relevant to shortcut biological nitrogen removal. Biodegradation, 13: 163 – 170.
- 80 -
Grady L, Diagger G. and Lim (1999) Biological Wastewater Treatment, 2nd Edition.
Publishers – Marcel Dekker, USA.
Hellinga, C.; Schellen, A.A.J.C.; Mulder, J.W.; Loosdrecht, M.C.M. and Heijnen, J.J.
(1997). The SHARON PROCESS: An innovative method for nitrogen removal from ammonium-
rich wastewater. Water Sci. Tech., 37 (9): 135 – 142.
Murray, I.; Parsons, J.W. and Robinson, K. (1975). Inter-relationships between nitrogen
balance, pH and dissolved oxygen in an oxidation ditch treating farm animal waste. Water Res.,
9: 25 – 30.
Pollice, A; TAndoi, V and Lestingi, C. (2002). Influence of aeration and sludge retention
time on ammonium oxidation to nitrite and nitrate. Water Res., 36: 2541 – 246.
Wang, J and Ning, Y. (2004). Partil nitrification under limited dissolved oxygen
conditions. Process Biochem., 39: 1223 – 1229.
- 81 -
Appendix B
Engineering Significance
The study of sequential anaerobic-aerobic digestion process helped to understand the advantages
of the combined process over individual anaerobic and aerobic digestion processes. The
combined process creates the opportunity to optimize the overall process on the bases of
digestion process SRTs and temperature. Optimized selection of anaerobic and aerobic SRTs
may help in simultaneous carbon-nitrogen load from the biosolids and may help in saving the
operation cost. For example, it was observed during the investigation that percentage increase in
VSR removal due to increase in 5 day SRT of anaerobic digestion was lesser than the
corresponding increase in VSR upon increase in aerobic digestion SRT. This implies that for
additional VSR less volume is required which implies cost saving in the operation. Additional
cost saving will be due to –
1. Reduction in nitrogen loads in recycle streams, and
2. Improvement in dewatering and lesser polymer dose requirements.
Another advantage of presence of aerobic digestion after the anaerobic digester is that it may
help saving the total digestion upset if anaerobic digesters perform poor. The later stage of
aerobic digestion may act as shock absorbing unit due to the presence of more versatile and
diverse heterotrophic bacteria in the system.
The sequential anaerobic-aerobic digestion process also show the ability for the sustainable
development and some cost recovery options because of the quality of resulting biosolids. It was
observed that odors in the resulting biosolids is almost 50% less than the conventional anaerobic
biosolids and the nitrogen and carbon loading is in the appropriate range for the land
applications. In addition, if digestion is carried out at thermophilic temperatures the solids will be
able to meet class-A classification requirements and hence will be available for land application
as fertilizer. If marketed appropriately, this will help in recovering back the investment made in
- 82 -
operation of the digestion process. Even if there is not favorable market for the biosolids, they
will be more acceptable for land application because of the less odor production potential and
lesser nutrient loads; and still saving money by providing more options for biosolids usage in
comparison to only option of land fill.
- 83 -