Embed Size (px)
Citation preview

Shiller on Colombian Real Estate
“Nevertheless, I was not expecting a bubble story when I visited Colombia last month. But, once again, people there told me about an ongoing real-estate bubble, and my driver showed me around the seaside resort town of Cartagena, pointing out, with a tone of amazement, several homes that had recently sold for millions of dollars.”
“For example, the current story in Colombia appears to be that the country’s
government, now under the well-regarded management of President Juan Manuel Santos, has brought down inflation and interest rates to developed-country levels, while all but eliminating the threat posed by the FARC rebels, thereby injecting new vitality into the Colombian economy. That is a good enough story to drive a housing bubble.”
(Project Syndicate, July, 2013)
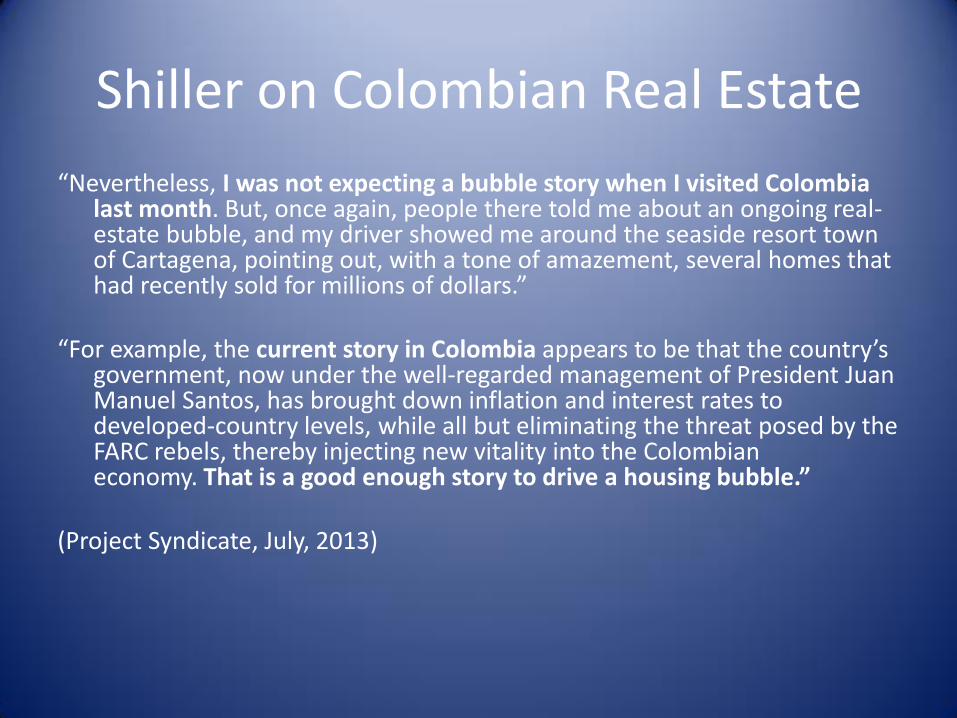
Banco de los Republicos Real Prices
Year
Total Housing Index Bogota Index Medellin Index Cali Index
1988 2013
60
80
100
120
140
0
5,000
10,000
15,000
20,000
25,000
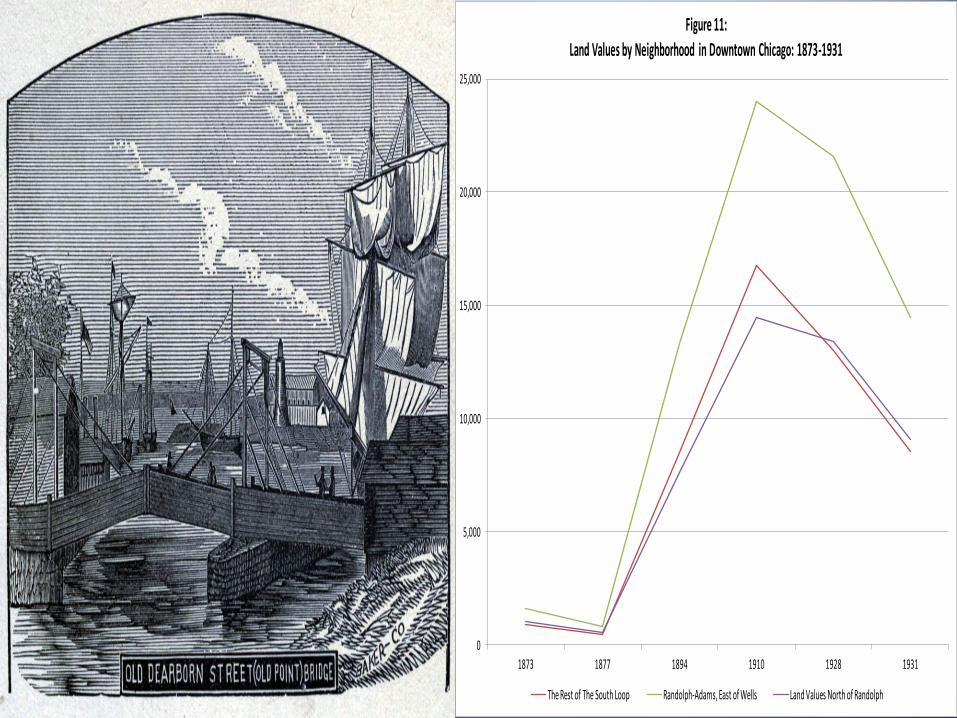
1873 1877 1894 1910 1928 1931
Figure 11:
Land Values by Neighborhood in Downtown Chicago: 1873-1931
The Rest of The South Loop Randolph-Adams, East of Wells Land Values North of Randolph
Year
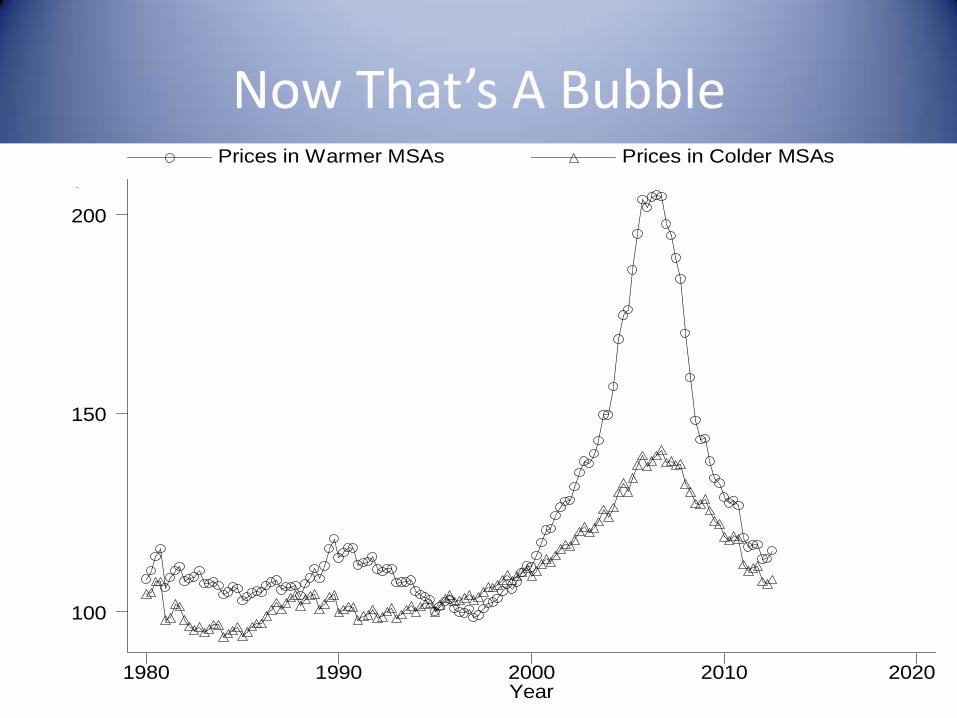
Prices in Warmer MSAs Prices in Colder MSAs
1980 1990 2000 2010 2020
100
150
200
Now That’s A Bubble
Detroit
Houston
Las Vegas
New York
Phoenix
DC
-1-.
75
-.5
-.2
5
0
.25
Ch
an
ge
in F
HF
A P
rice, 2
00
6-2
01
1
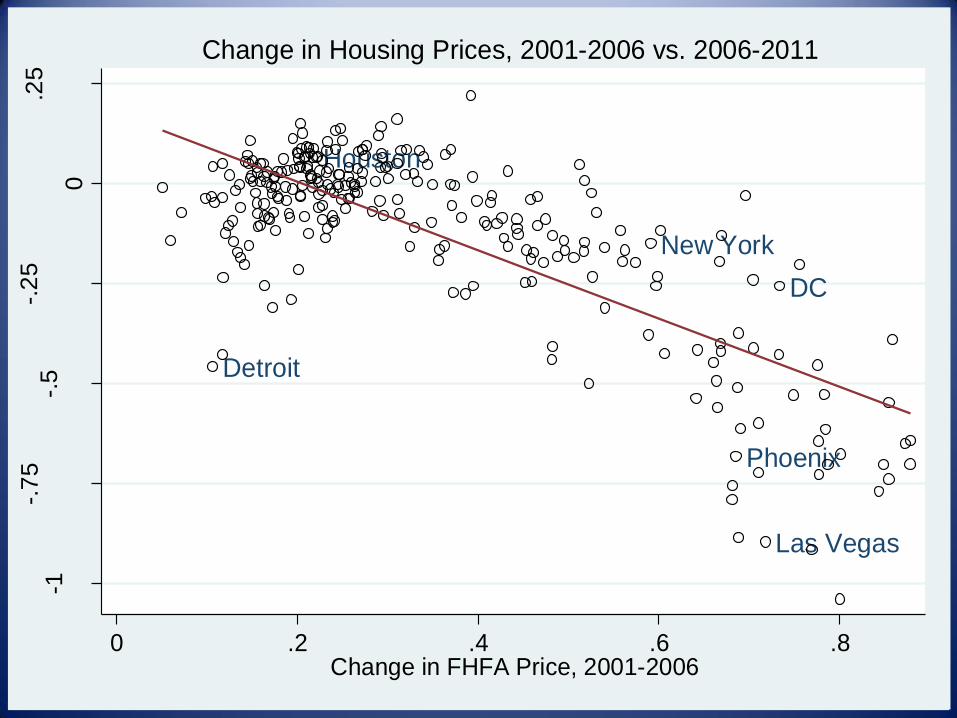
0 .2 .4 .6 .8Change in FHFA Price, 2001-2006
Change in Housing Prices, 2001-2006 vs. 2006-2011
0
.05
.1.1
5.2
Avera
ge
Cha
ng
e in
FH
FA
, 1
99
6-2
01
2
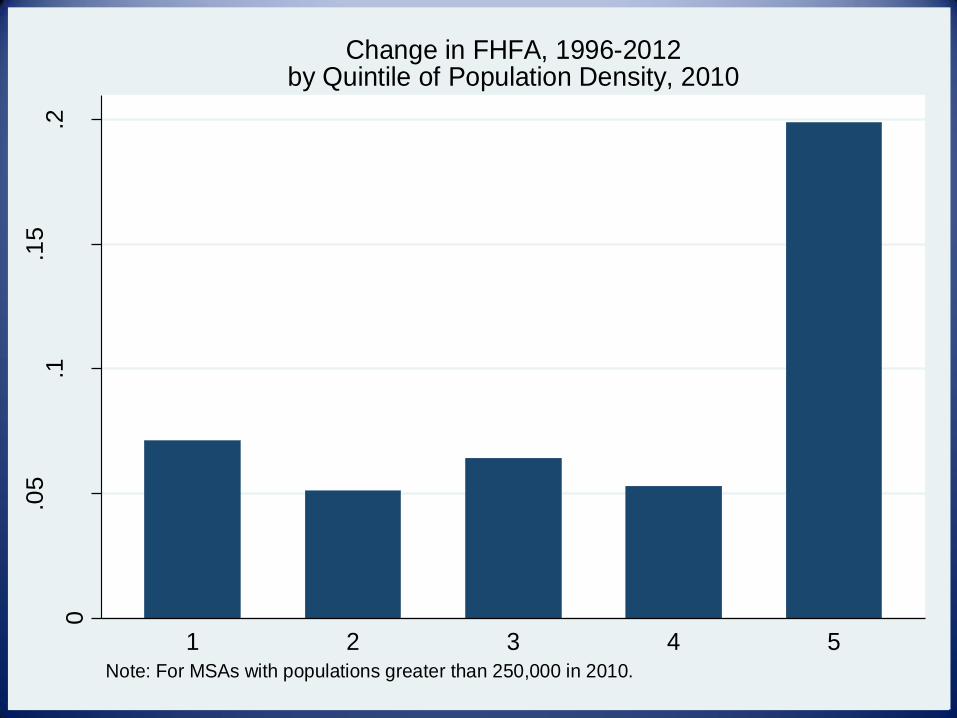
1 2 3 4 5Note: For MSAs with populations greater than 250,000 in 2010.
Change in FHFA, 1996-2012by Quintile of Population Density, 2010
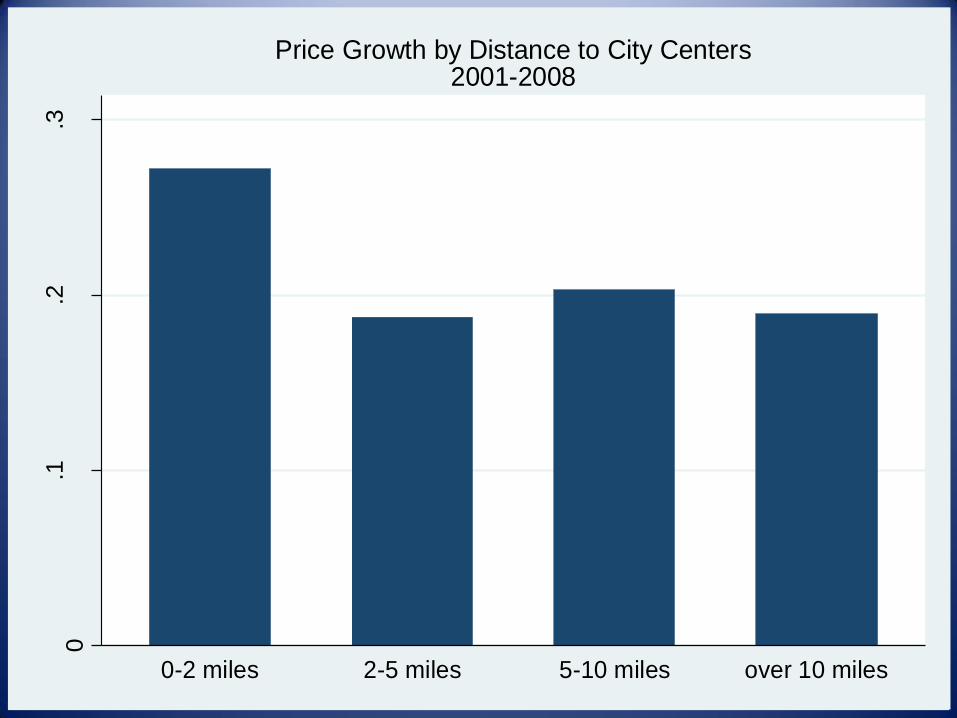
0.1
.2.3
Perc
ent G
row
th, 20
01-2
00
8
0-2 miles 2-5 miles 5-10 miles over 10 miles
Price Growth by Distance to City Centers2001-2008
-.0
50
.05
.1.1
5
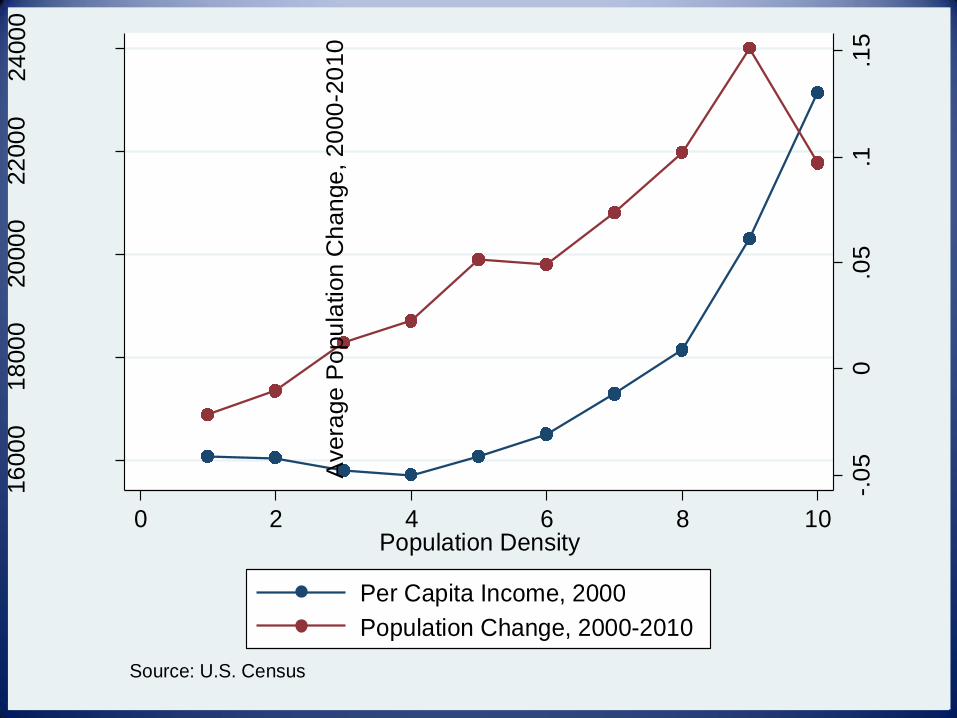
Avera
ge
Po
pu
lation
Ch
an
ge
, 20
00
-20
10
16
00
018
00
020
00
022
00
024
00
0
Avera
ge
Pe
r C
ap
ita Inco
me, 2
00
0
0 2 4 6 8 10Population Density
Per Capita Income, 2000
Population Change, 2000-2010
Source: U.S. Census
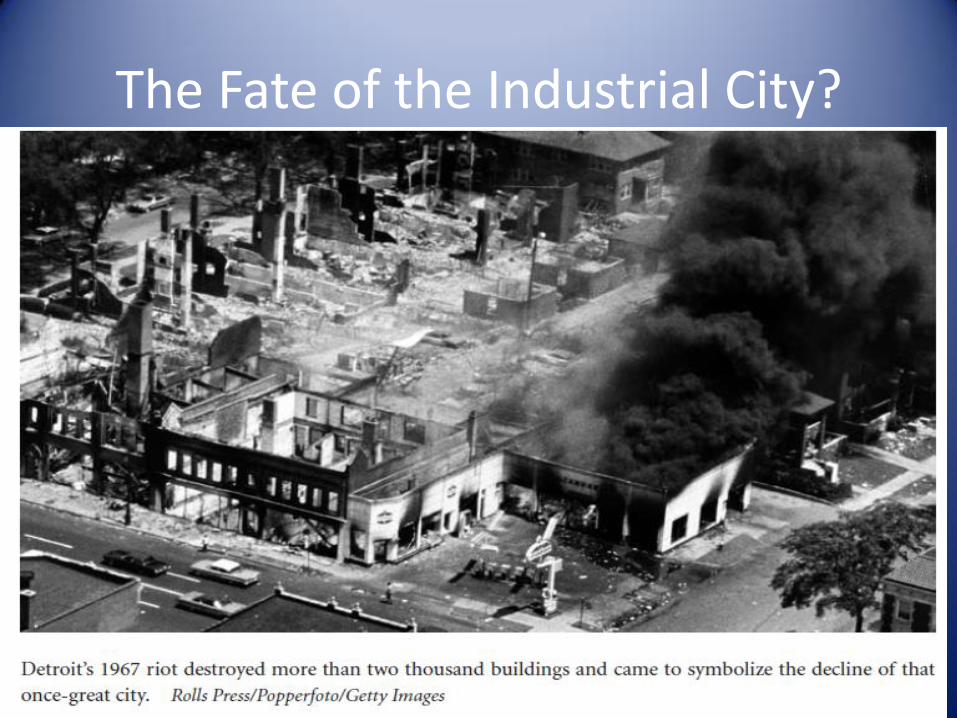
The Fate of the Industrial City?
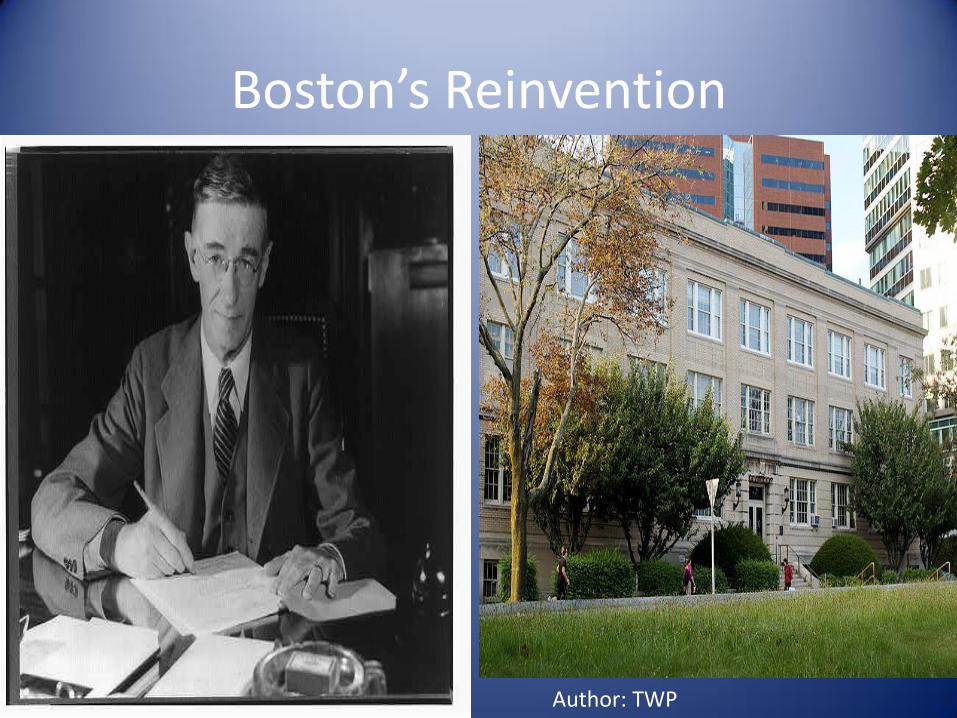
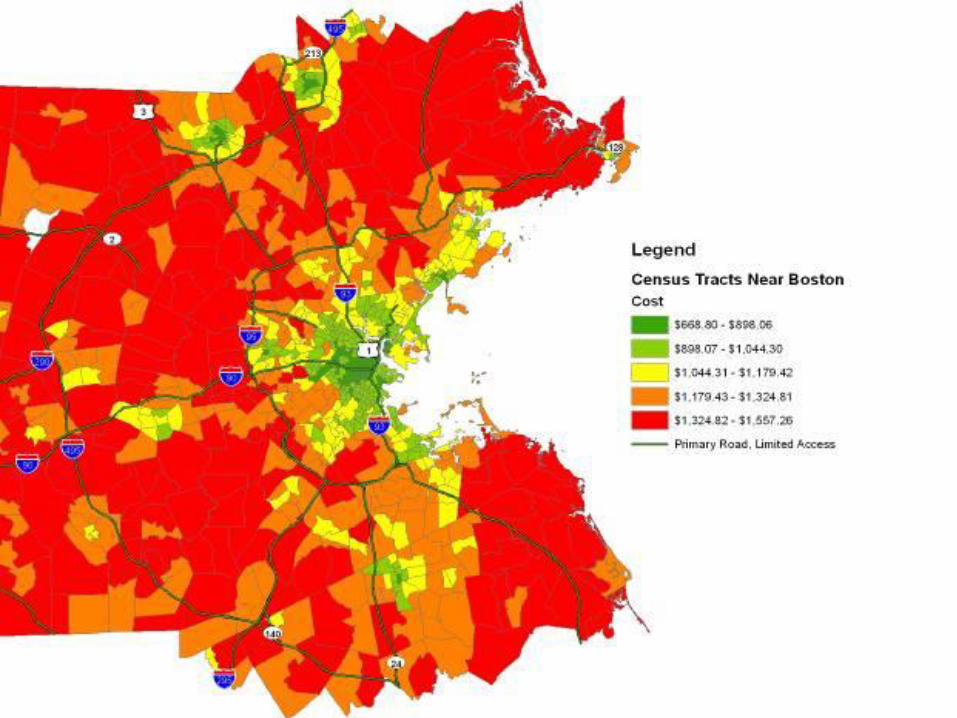
Boston’s Reinvention
Author: TWP
0
.05
.1.1
5
Avera
ge
Po
pu
lation
Gro
wth
by C
oun
ty, 2
000
-20
10
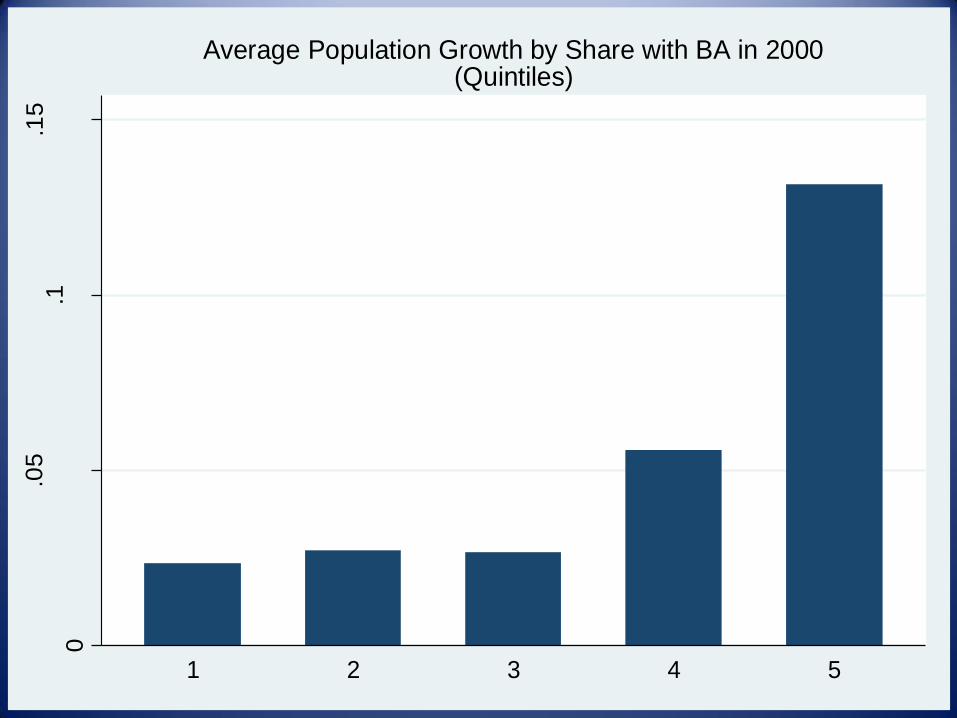
1 2 3 4 5
Average Population Growth by Share with BA in 2000(Quintiles)
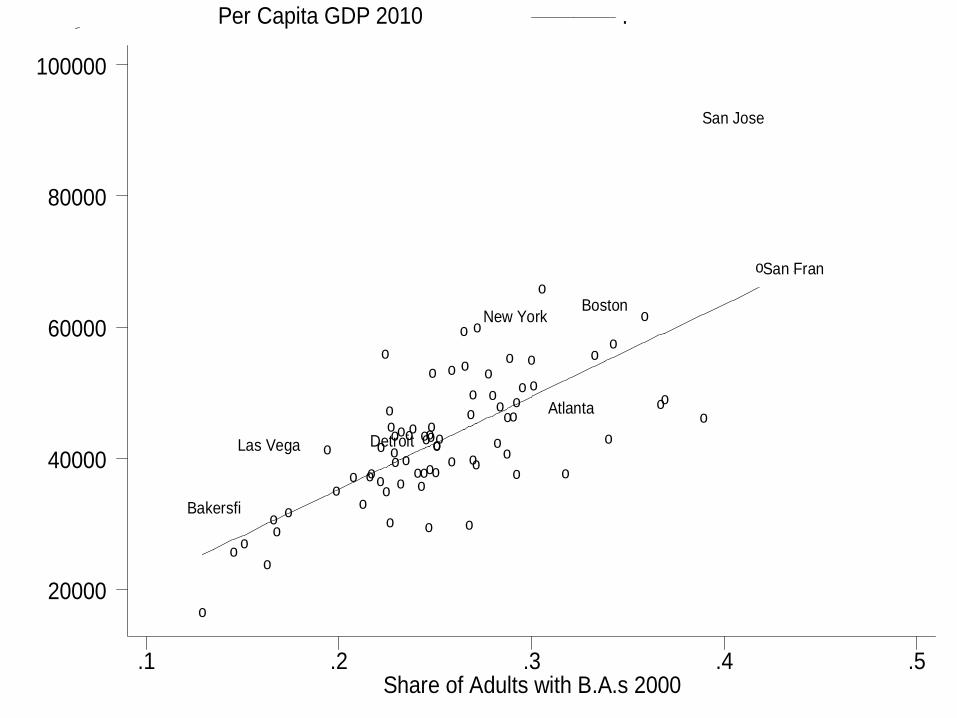
Share of Adults with B.A.s 2000
Per Capita GDP 2010 .
.1 .2 .3 .4 .5
20000
40000
60000
80000
100000
o
Bakersfi
oo
o
Las Vega
oo
o
o
oo
o
ooo
o
o
o
o
o
oDetroit
oo
o
o
o
o
oo
ooo
oo
o
o
o
oo
o
o
ooo
o
o
o
o
o
o
o
o
o
o
o
o
o
o
o
o
o
o
New York
o
oo
o
o
o
o
Atlanta
o
Boston
o
o
o
ooo
San Jose
oSan Fran
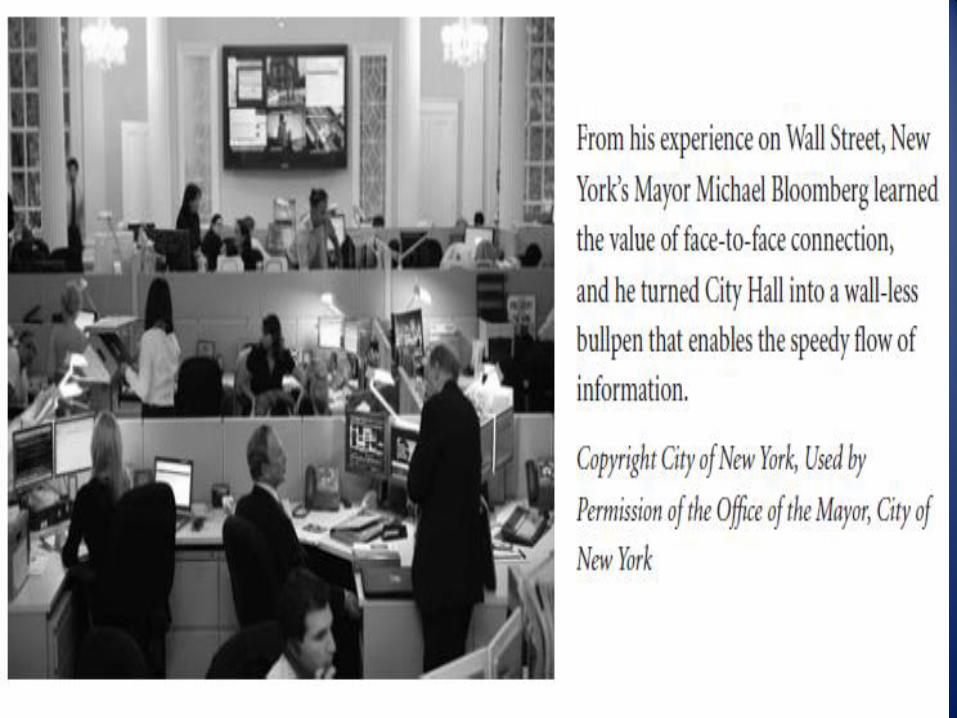

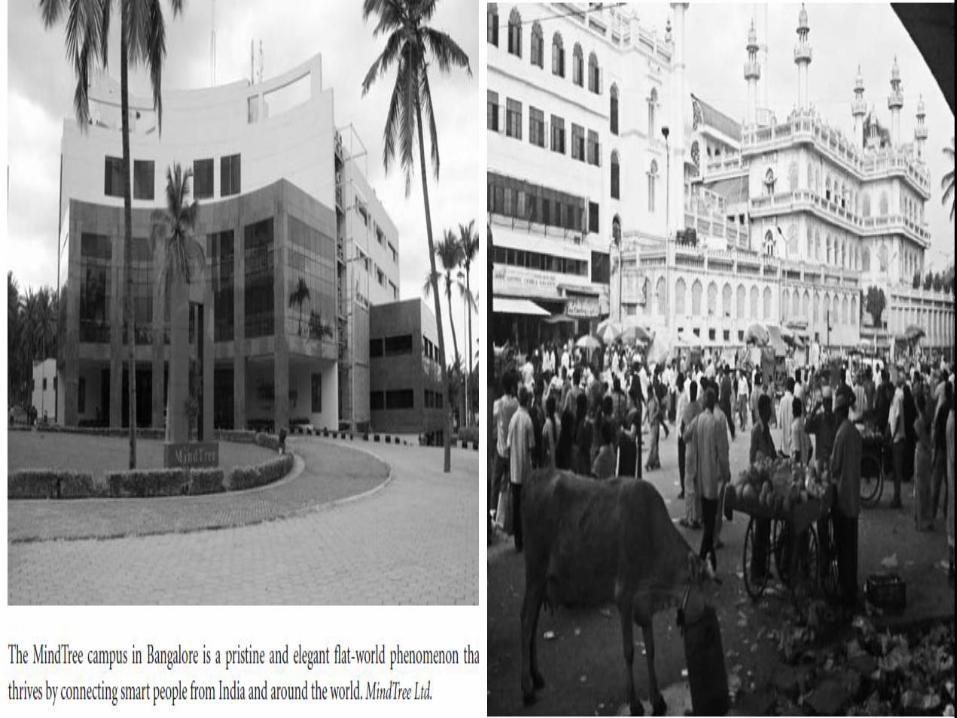
The Urban Edge: Spreading Knowledge
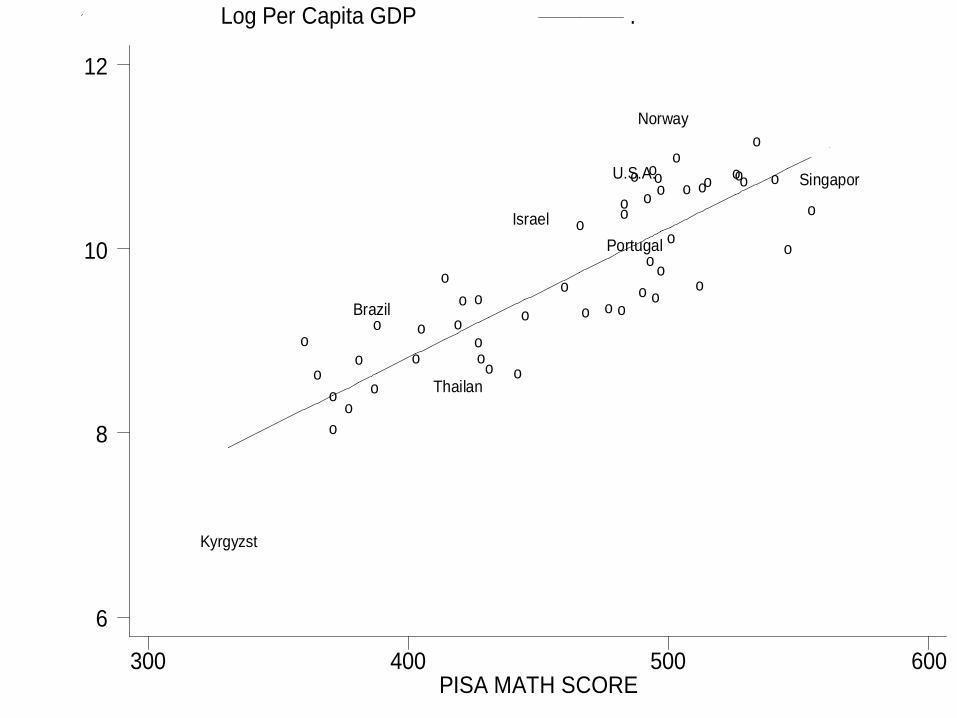
PISA MATH SCORE
Log Per Capita GDP .
300 400 500 600
6
8
10
12
Kyrgyzst
o
o
o
o
o
o
Brazil
o
o
o
o
o
o
Thailan
o
o
o
oo o
o
Israel
o
o
o o o
oo
oU.S.A.
Portugal
o
o
o
o
o
o
o
o
Norway
o
o
o
o
ooooo
o
o
o
o
Singapor
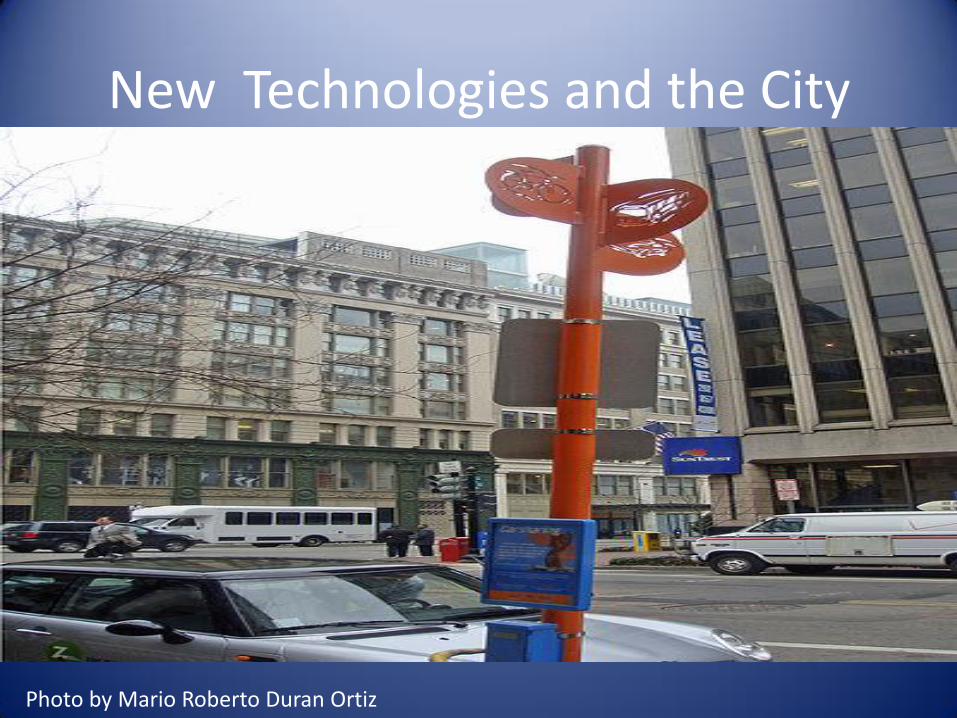
Photo by Mario Roberto Duran Ortiz
New Technologies and the City
0.5
11.5
2
Avera
ge
Pe
rcen
t C
hang
e in
Em
plo
ym
en
t, 1
977
-20
10
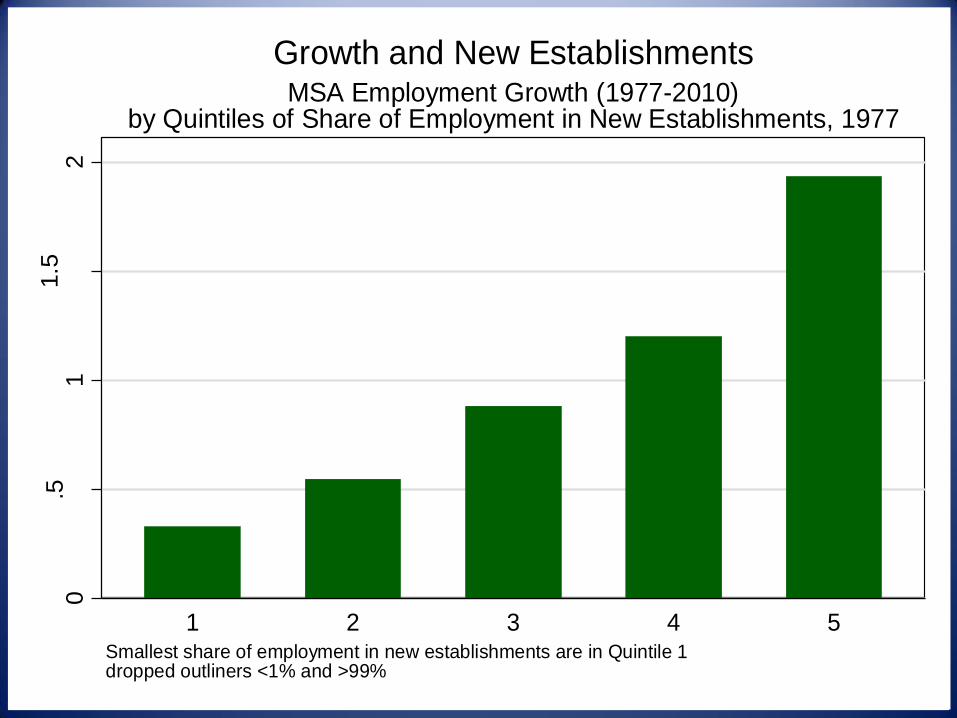
1 2 3 4 5Smallest share of employment in new establishments are in Quintile 1dropped outliners <1% and >99%
MSA Employment Growth (1977-2010)by Quintiles of Share of Employment in New Establishments, 1977
Growth and New Establishments
0.2
.4.6
.81
Sh
are
Urb
aniz
ed
$0-1000 $1000-2000 $2000-3000 $3000-4000 $4000-5000
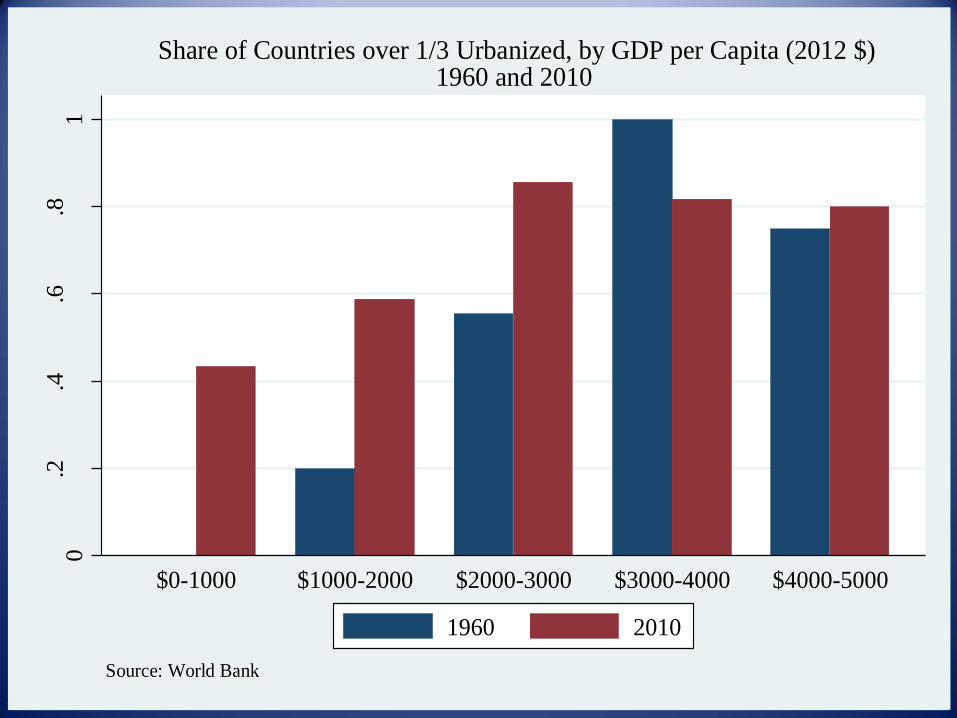
Source: World Bank
Share of Countries over 1/3 Urbanized, by GDP per Capita (2012 $)1960 and 2010
1960 2010
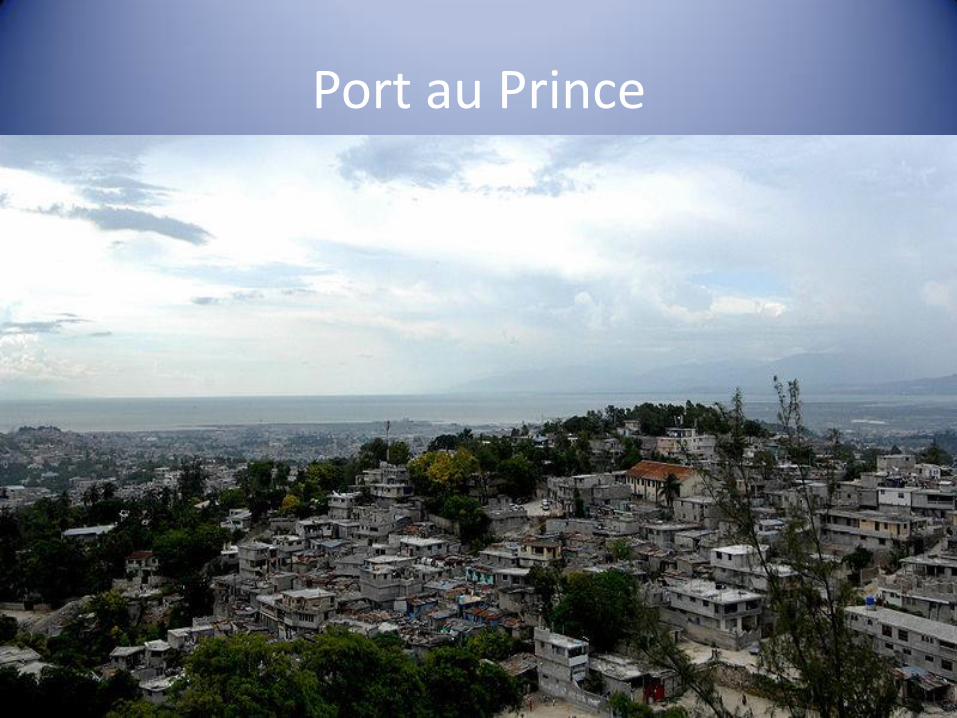
Port au Prince
Rwanda
MaliGhana
India
Moldova
Iraq
Egypt, Arab Rep.
Morocco
Guatemala
Indonesia
Ukraine
Thailand
Bulgaria
South Africa
RomaniaMalaysia
Argentina
Mexico
Russian FederationBrazil
Uruguay
Poland
Slovenia
CyprusSpain
New ZealandItaly
United Kingdom
France
Germany
Japan
Finland
CanadaUnited StatesNetherlands
Sweden
AustraliaNorway
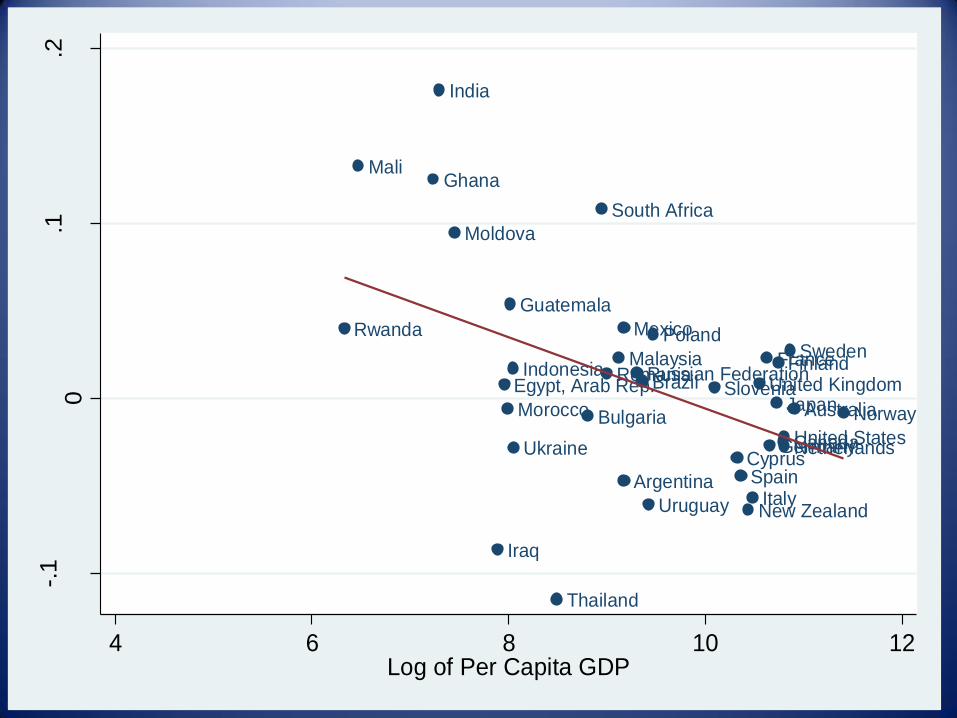
-.1
0.1
.2
Urb
an
-Ru
ral H
ap
pin
ess
4 6 8 10 12Log of Per Capita GDP
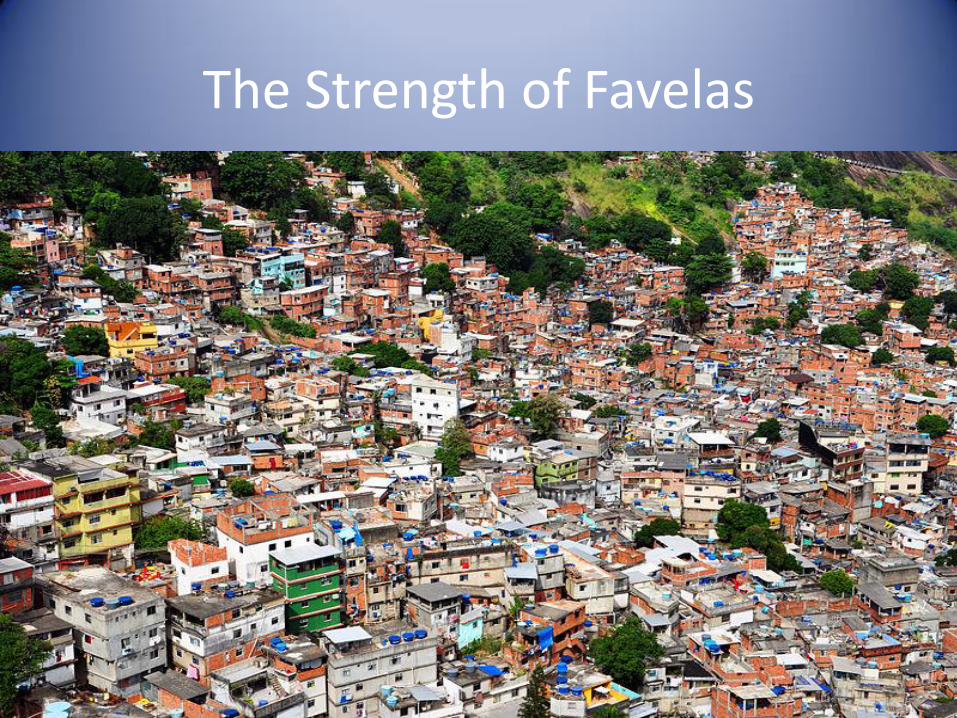
The Strength of Favelas
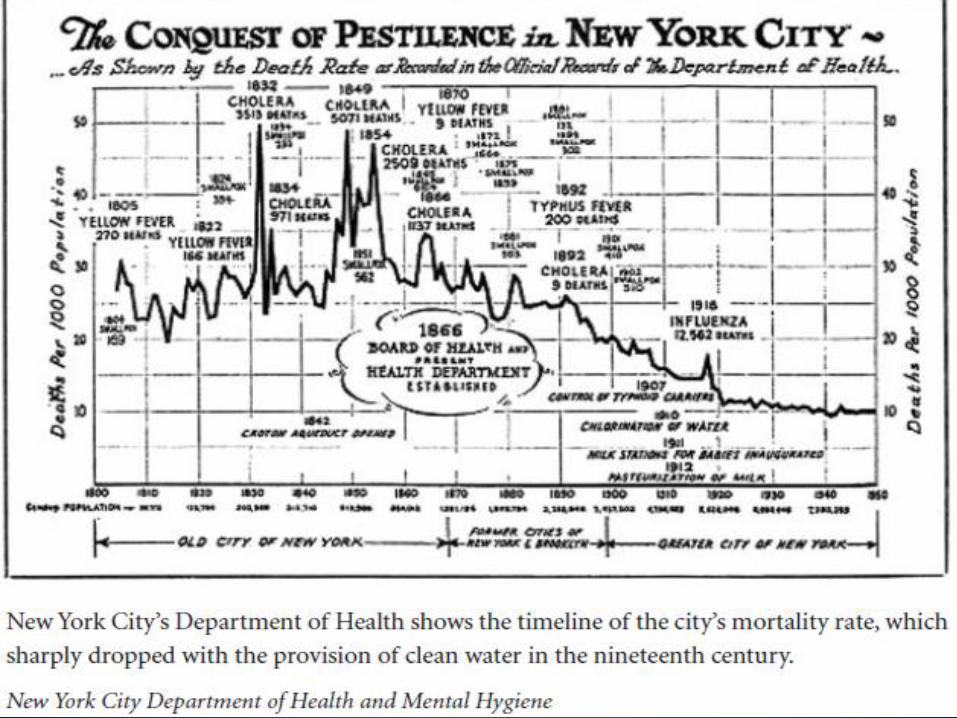

Bringing Clean Water to Nimes
Photo by Clenpat
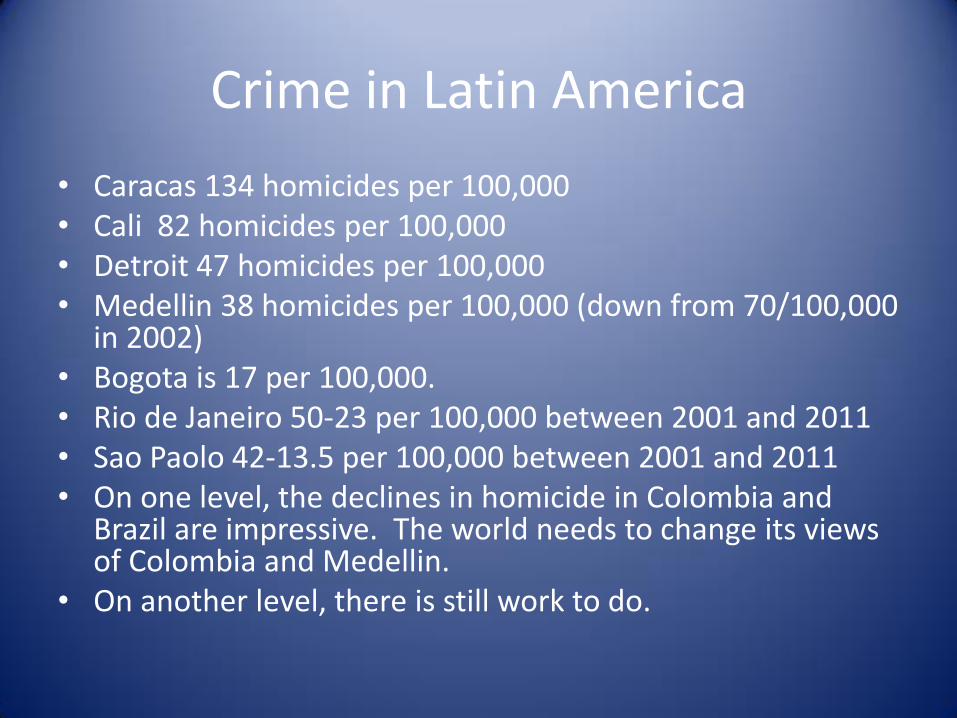
Crime in Latin America
• Caracas 134 homicides per 100,000 • Cali 82 homicides per 100,000 • Detroit 47 homicides per 100,000 • Medellin 38 homicides per 100,000 (down from 70/100,000
in 2002) • Bogota is 17 per 100,000. • Rio de Janeiro 50-23 per 100,000 between 2001 and 2011 • Sao Paolo 42-13.5 per 100,000 between 2001 and 2011 • On one level, the declines in homicide in Colombia and
Brazil are impressive. The world needs to change its views of Colombia and Medellin.
• On another level, there is still work to do.
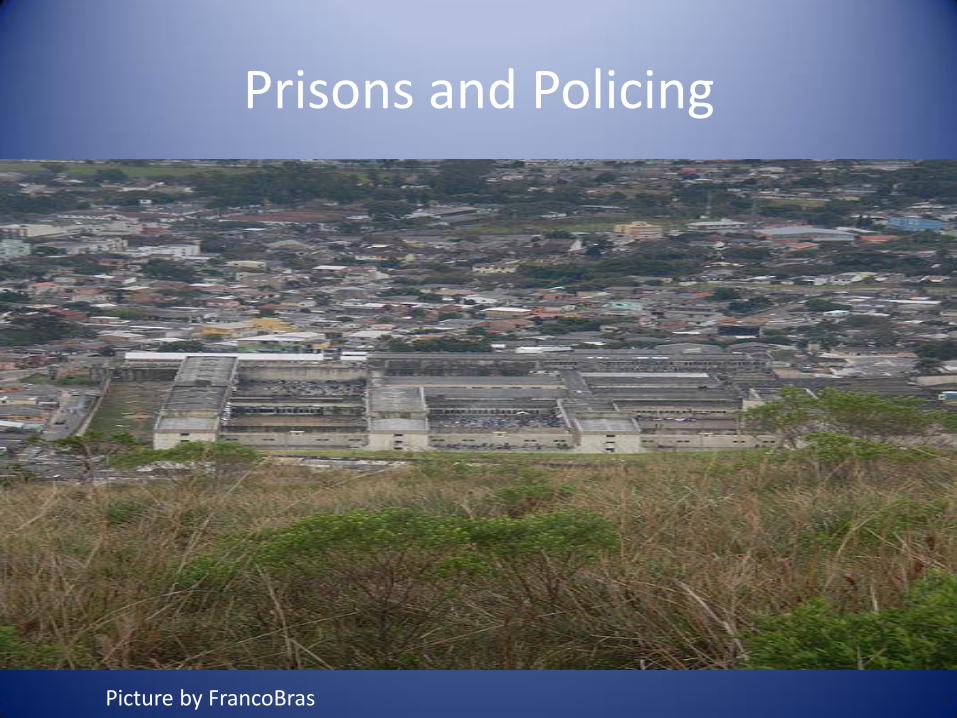
Prisons and Policing
Picture by FrancoBras

Ray Kelly vs. Ed Davis: Community policing and corruption
Ed Davis by Michael Cummo RayKelly by David Shankbone

The Brazil Model: The Dentist and the Supermarket
Supermarket by Wonderlane
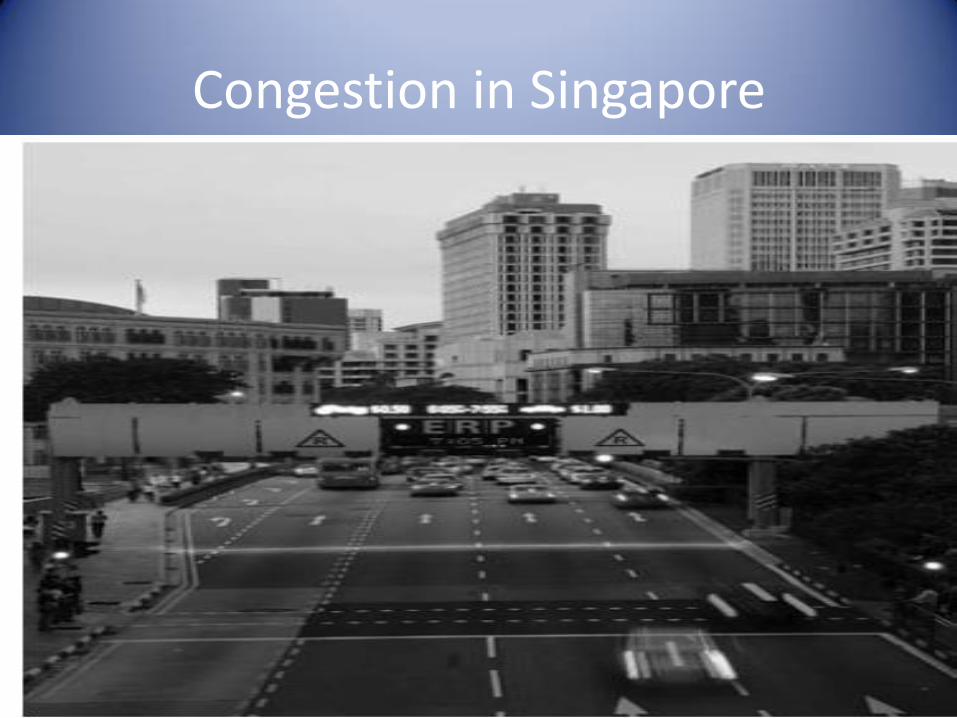
Congestion in Singapore
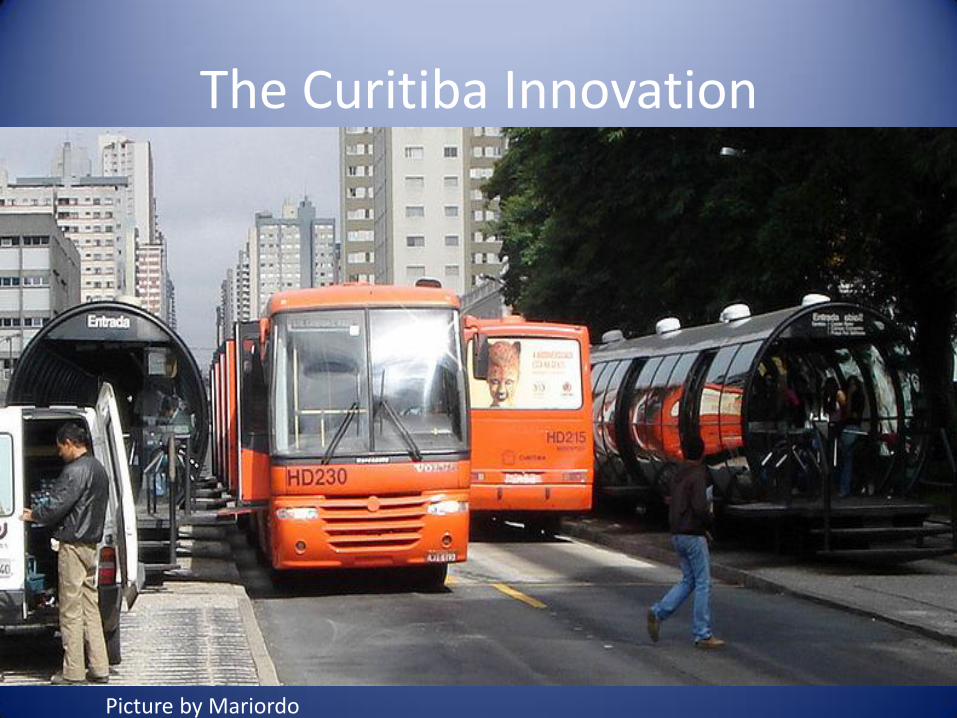
The Curitiba Innovation
Picture by Mariordo
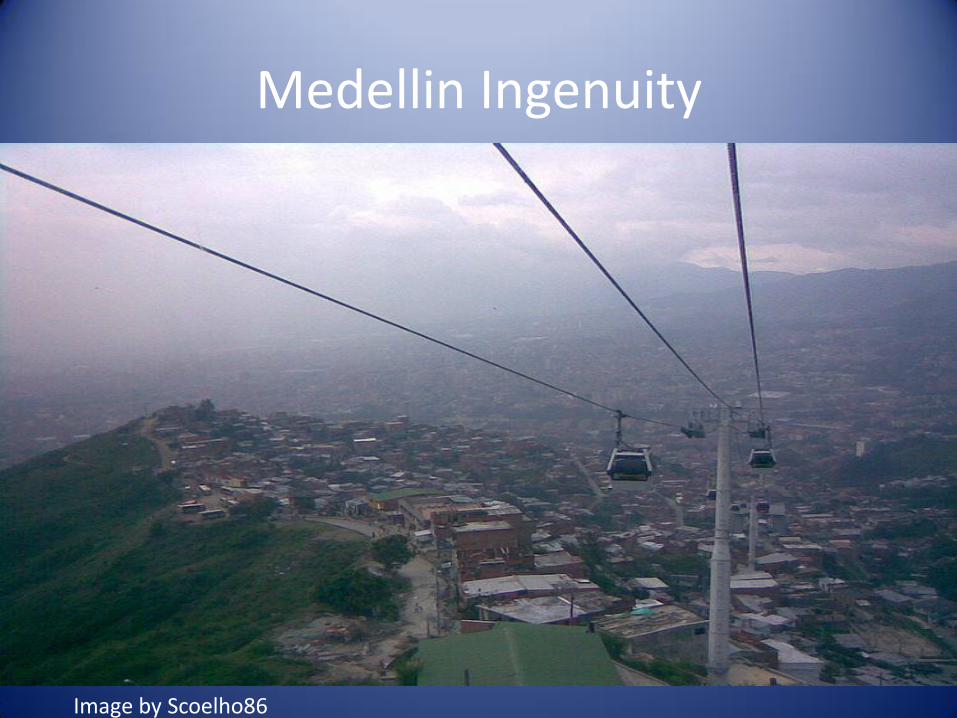
Medellin Ingenuity
Image by Scoelho86
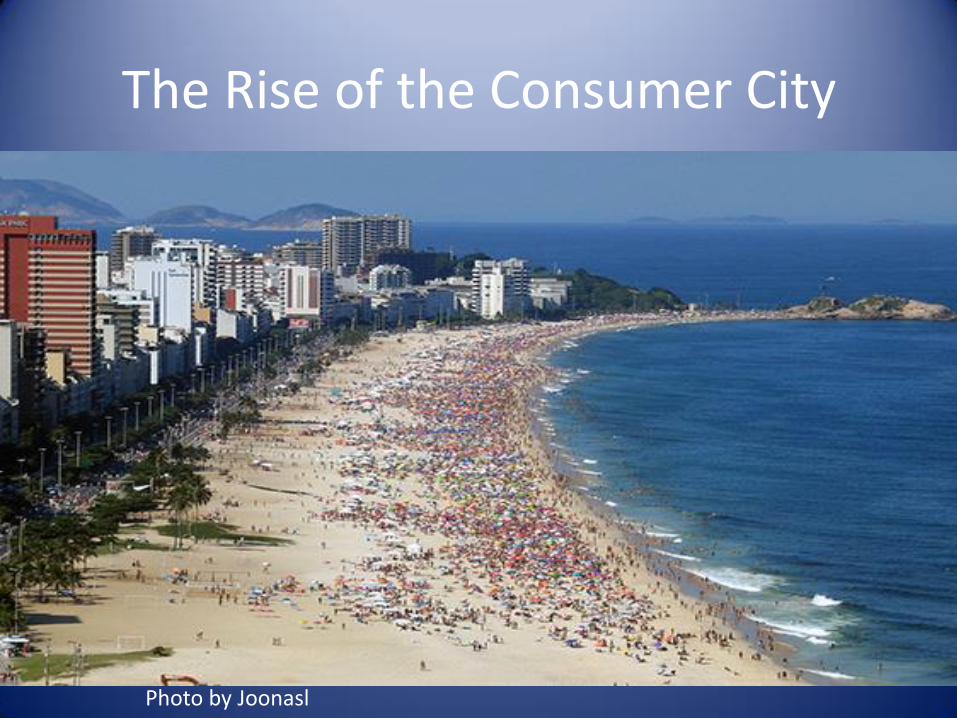
The Rise of the Consumer City
Photo by Joonasl

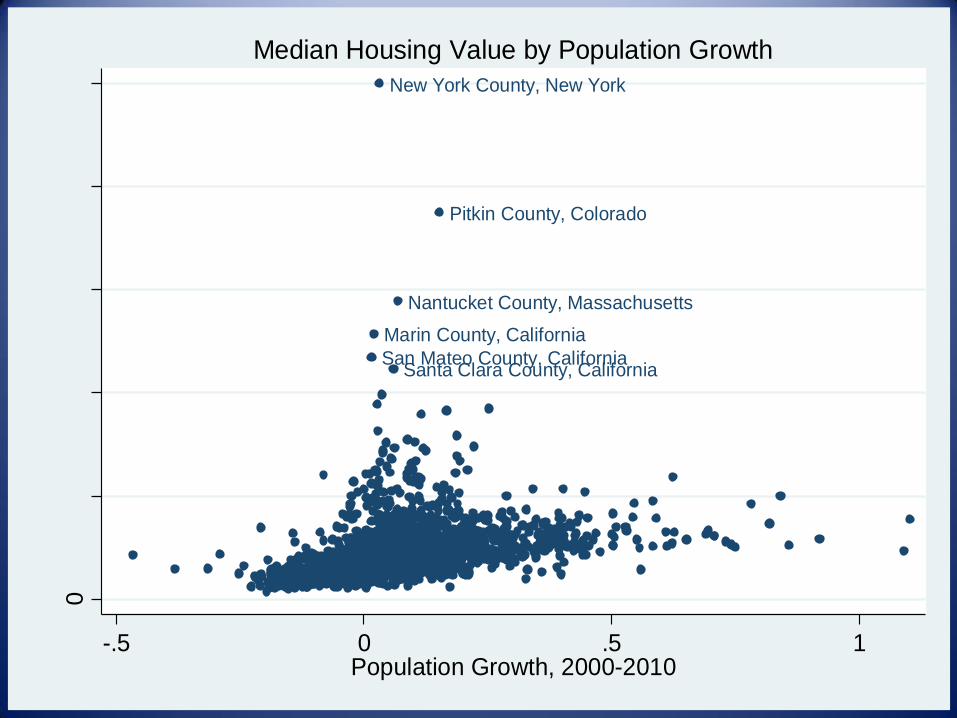
Marin County, California
San Mateo County, CaliforniaSanta Clara County, California
Pitkin County, Colorado
Nantucket County, Massachusetts
New York County, New York0
20
00
00
40
00
00
60
00
00
80
00
00
10
00
00
0
Med
ian H
ousin
g V
alu
e, 20
00
-.5 0 .5 1Population Growth, 2000-2010
Median Housing Value by Population Growth
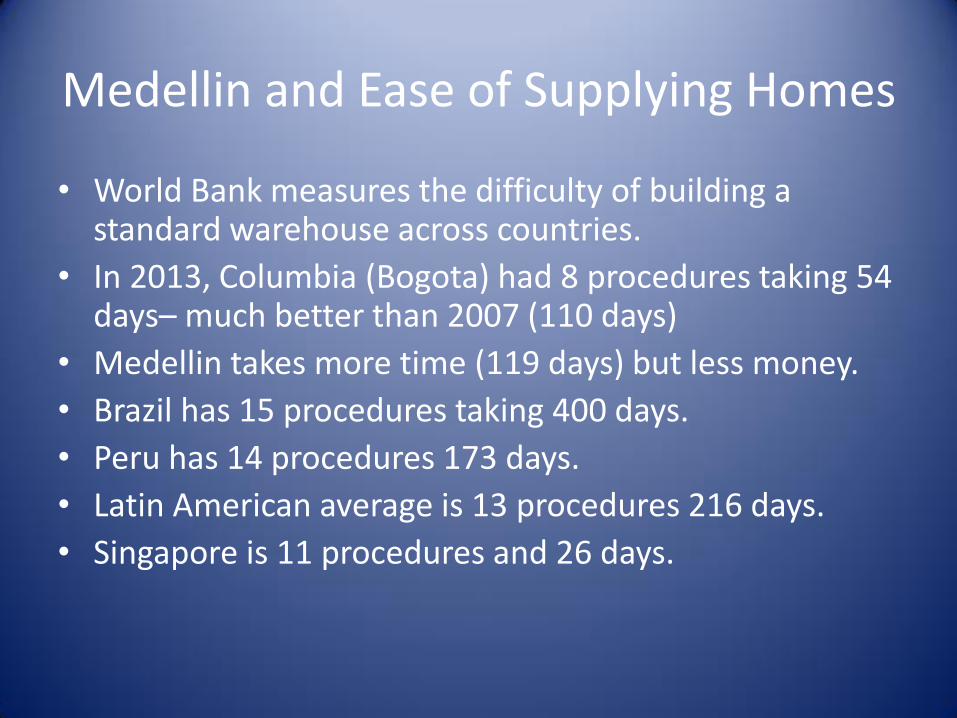
Medellin and Ease of Supplying Homes
• World Bank measures the difficulty of building a standard warehouse across countries.
• In 2013, Columbia (Bogota) had 8 procedures taking 54 days– much better than 2007 (110 days)
• Medellin takes more time (119 days) but less money.
• Brazil has 15 procedures taking 400 days.
• Peru has 14 procedures 173 days.
• Latin American average is 13 procedures 216 days.
• Singapore is 11 procedures and 26 days.
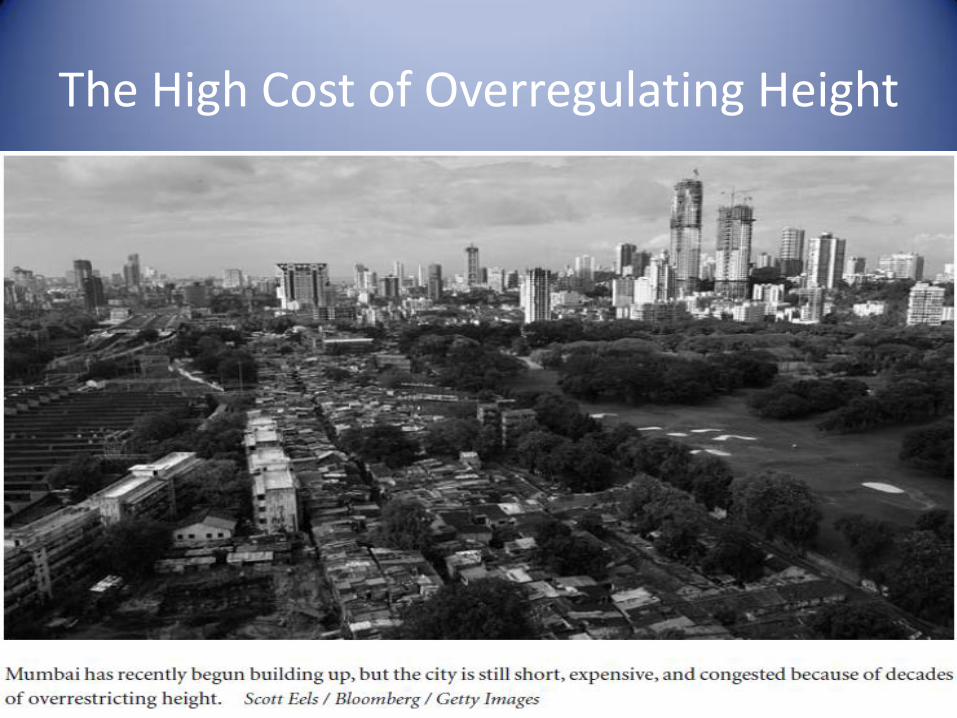
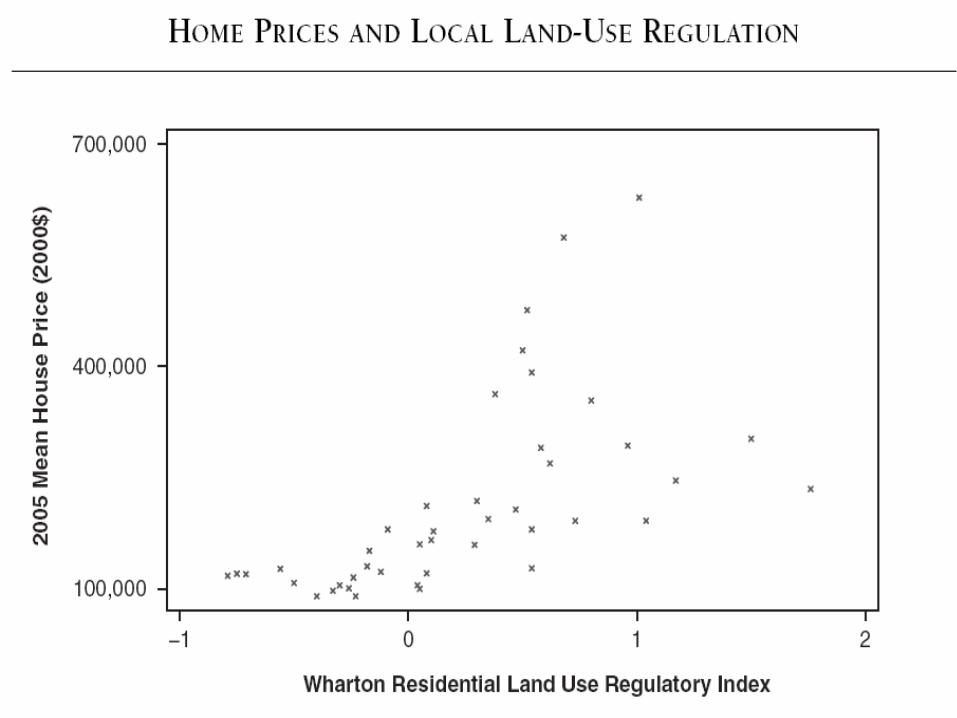
The High Cost of Overregulating Height

Image by QuarterCircleS
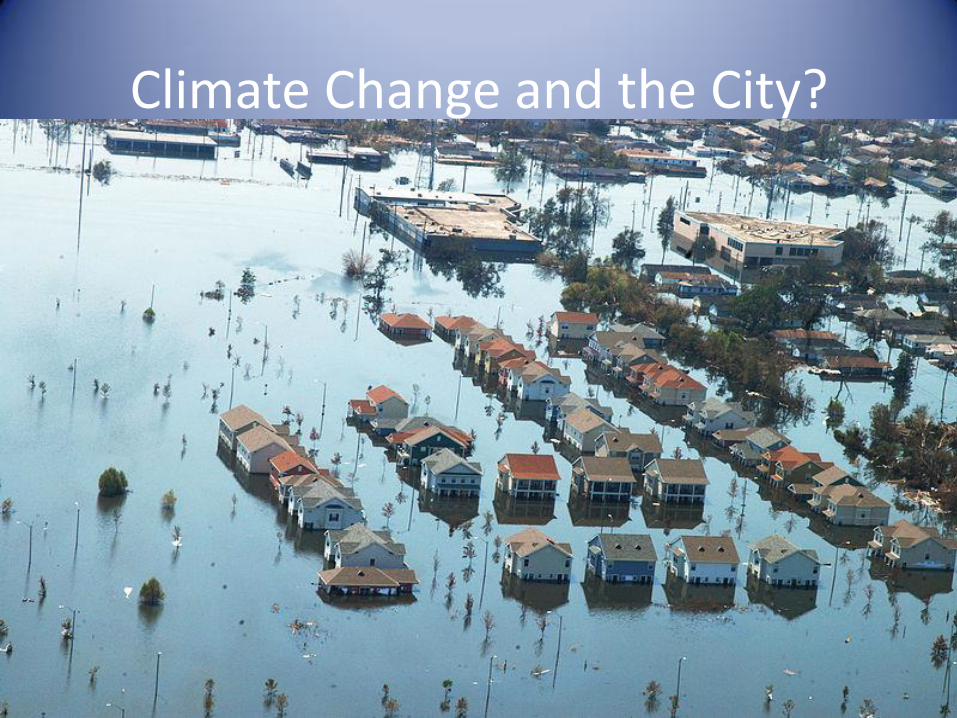
Climate Change and the City?
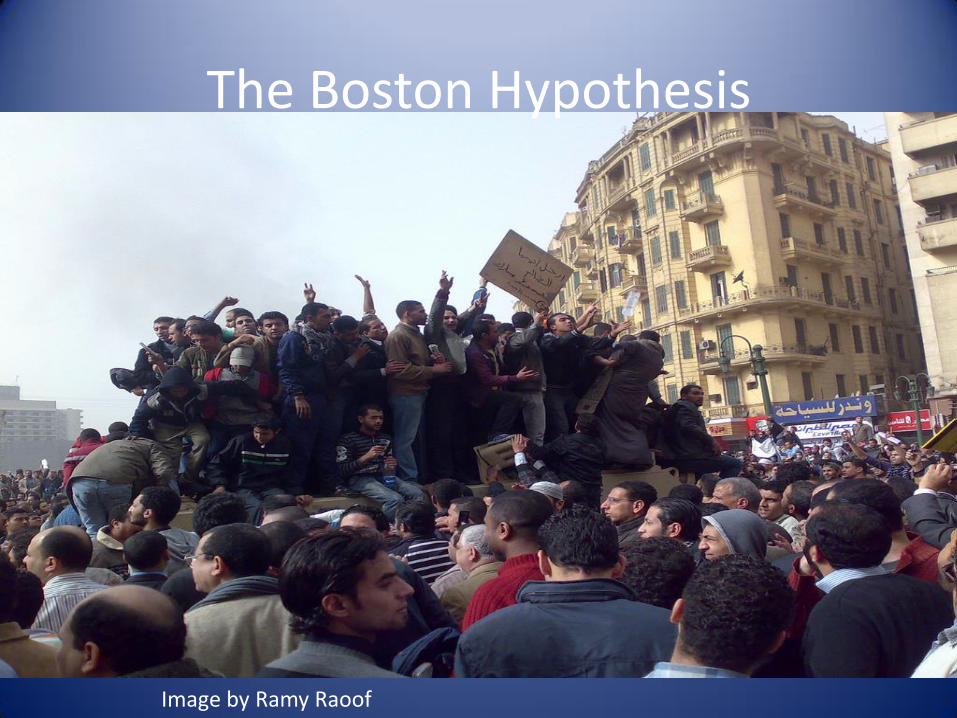
Image by Ramy Raoof
The Boston Hypothesis