Embed Size (px)
Citation preview
NBER WORKING PAPER SERIES
SIDE EFFECTS OF COMPETITION:THE ROLE OF ADVERTISING AND PROMOTION IN PHARMACEUTICAL MARKETS
Guy DavidSara Markowitz
Working Paper 17162http://www.nber.org/papers/w17162
NATIONAL BUREAU OF ECONOMIC RESEARCH1050 Massachusetts Avenue
Cambridge, MA 02138June 2011
The views expressed herein are those of the authors and do not necessarily reflect the views of theNational Bureau of Economic Research.
NBER working papers are circulated for discussion and comment purposes. They have not been peer-reviewed or been subject to the review by the NBER Board of Directors that accompanies officialNBER publications.
© 2011 by Guy David and Sara Markowitz. All rights reserved. Short sections of text, not to exceedtwo paragraphs, may be quoted without explicit permission provided that full credit, including © notice,is given to the source.
Side Effects of Competition: the Role of Advertising and Promotion in Pharmaceutical MarketsGuy David and Sara MarkowitzNBER Working Paper No. 17162June 2011JEL No. I0,K0,K2
ABSTRACT
The extent of pharmaceutical advertising and promotion can be characterized by a balancing act betweenprofitable demand expansions and potentially unfavorable subsequent regulatory actions. However,this balance also depends on the nature of competition (e.g. monopoly versus oligopoly). In this paperwe model the firm’s behavior under different competitive scenarios and test the model’s predictionsusing a novel combination of sales, promotion, advertising, and adverse event reports data. We focuson the market for erectile dysfunction drugs as the basis for estimation. This market is ideal for analysisas it is characterized by an abrupt shift in structure, all drugs are branded, the drugs are associatedwith adverse health events, and have extensive advertising and promotion. We find that advertisingand promotion expenditures increase own market share but also increase the share of adverse drugreactions. Competitors’ spending decreases market share, while also having an influence on adversedrug reactions.
Guy DavidThe Wharton SchoolUniversity of Pennsylvania202 Colonial Penn Center3641 Locust WalkPhiladelphia, PA 19104-6218and [email protected]
Sara MarkowitzDepartment of EconomicsEmory University1602 Fishburne Dr.Atlanta, GA 30322and [email protected]
1
I. Introduction
The market for pharmaceuticals is one of the most highly regulated markets in the
nation (Towse and Danzon, 2010; Danzon, 2011). The U.S. Food and Drug
Administration (FDA) interacts with pharmaceutical manufacturers before and after
drugs are approved for use to ensure their safety and efficacy. While the interaction
between manufacturers and the FDA that occurs in the pre‐approval stage has received
much attention in the literature, the effects of competition and promotion on patients’
demand and safety in the postapproval stage has received far less attention (Scherer,
2000). This paper aims to fill some of this void by modeling the firm’s choice of
promotion under different competitive and regulatory scenarios and by testing the
model’s predictions using novel combination of sales, promotion, advertising, and
adverse event reports data.
We develop models where profit maximizing pharmaceutical manufacturers choose the
level of promotion (or advertising) expenditures, knowing that higher promotion (or
advertising) expenditures raise sales but may trigger unfavorable regulatory actions
against the firm. The regulatory action results when the expansion of prescriptions to
users, who are poor matches for the drugs, leads to adverse health events. The model
prediction regarding optimal levels of advertising is sensitive to the competitive
situation at hand (monopoly versus oligopoly).
2
In the case of oligopoly, it has long been recognized that advertising can have two types
of effects on demand, either increasing demand for the entire product category or
changing the consumer mix across brands within the product category. The relative
importance of these two effects remains a subject of debate. The role of competition,
advertising, and promotion on patient safety has received much less attention. The
literature has also overlooked situations where the level of competition in the market
grows abruptly. The growth of pharmaceutical promotion, particularly direct‐to‐
consumer advertising (DTCA), along with recent drug withdrawals and other
regulatory interventions, necessitates an in‐depth study of the basic relationship
between competition, the promotion of drugs, and safety.
This paper examines the market for erectile dysfunction (ED) drugs as it is characterized
by an abrupt shift in structure, all drugs are branded (no generics) and have extensive
advertising and promotion (Kim, 2010). In addition, it is not uncommon for consumers
to experience adverse health events from ED drugs (MFMER, 2008). Our analysis,
therefore, focuses on strategic interactions among firms producing drugs within the
same class.
The market for ED drugs includes three competitors: Viagra (Pfizer), Levitra (Bayer) and
Cialis (Lilly). Viagra was introduced in March 1998 and held monopoly position for five
years, while Levitra and Cialis were introduced in August and November of 2003,
respectively.
3
This market presents a very interesting case of a switch from monopoly to oligopoly, as
it allows for tracking the dynamics of market size, market share, promotion, and adverse
event reporting as the market becomes more competitive. More specifically, it relates to
the current debate regarding the social value of “me‐too” drugs, which are structurally
very similar to the incumbent drug (Viagra). While encompassing only minor
differences, ʺme‐tooʺ products may lead to lower prices, greater variety, and improve
matching through switching (DiMasi and Paquette, 2004; Jena et al., 2009). These
products may also lead to market expansion, which may lower their overall
appropriateness, reflected through higher rates of adverse drug events (Kessler et al.,
1994, Lee, 2004).
There are additional advantages for studying the market for ED drugs. Since the quality
and fit of the drug for the patient are difficult to verify without use (experience goods)
and since the demand for ED drugs involves a high degree of patient initiation (i.e.
physicians are not likely to bring up erectile dysfunction during routine checkups), it is
not surprising that all three producers advertise extensively.1 Moreover, the long time
series spanning 1998 through 2008 (five years pre‐entry and five years post entry of
Cialis and Levitra), the absence of competition from generic drugs, and the absence of
1 Recently, a number of sources (e.g. http://www.ehow.com/how_4545815_talk-doctor-erectile-dysfunction.html) were designed explicitly to help patients who experience erectile dysfunction symptoms to approach their physicians and bring up the topic.
4
brand‐specific regulatory actions reduces the potential confounders and allows for a
more credible identification of the effect of competition on sales and safety.2
The data for this project comes from four sources: Adverse drug reaction data from the
U.S. Food and Drug Administration’s Adverse Event Reporting System (AERS), IMS’s
National Prescription Audit (NPA), data on DTCA from the TMS Media Ad$pender
database, and data on professional promotion from IMS’s Integrated Promotion Service
(IPS). We use this data to test predictions from the theoretical model and study (1) the
effect of DTCA and promotion on sales and market share in an oligopoly setting, and (2)
the effect of DTCA and promotion on adverse drug events in both the monopoly and
oligopoly settings.
Finally, patient safety represents an unexplored dimension of consumer welfare that is
assumed away in standard welfare analysis. Such welfare benefits may manifest
themselves in clinical and physical improvements (e.g. reductions in cases of mental
illness or suicide among the elderly males). The results of this paper will demonstrate
that competition may have implications beyond the commonly known demand effects.
In the pharmaceutical market, increased demand for a product may also increase the
risk of gaining patients who experience adverse drug reactions, leading to an increased
risk of regulatory intervention by the FDA or litigation, leading pharmaceutical
companies to internalize the full costs of their actions (Chan et al., 2007; Narayanan and
Manchanda, 2009; Ching and Ishihara, 2010).
2 Two regulatory actions (both were labeling changes) were taken post-entry against all three drugs. The first labeling change was in July 2005 (sudden vision loss) and the second in November 2007 (sudden decreases or loss of hearing).
5
The paper is organized as follows: Section II describes a series of models analyzing a
firm’s behavior under different competitive scenarios and the degree of regulatory
uncertainty. Section III presents our methodology and describes the data. The results are
discussed in section IV. Section V concludes.
II. Theory
In this section we develop models where profit maximizing pharmaceutical
manufacturers choose the level of advertising expenditures, knowing that higher
advertising expenditures raise sales but may trigger unfavorable regulatory actions
against the firm.3 A regulatory action against the firm may result when the expansion
of prescriptions to users, who are poor matches for the drugs, leads to adverse health
events (David et al., 2010).4 The model prediction regarding optimal levels of advertising
is sensitive to the competitive situation at hand (monopoly versus oligopoly).
In the case of oligopoly, it has long been recognized that advertising can have two types
of effects on demand, either increasing general demand for the product or altering the
distribution of consumers across brands within the product category (Waldman and
Jensen, 2001). The relative importance of these two effects depends on the marketing
channel. Direct‐to‐consumer advertising is associated with increasing demand for the
3 In the text “advertising” refers to all avenues of promotion and marketing available to the firm, including: direct-to-consumer advertising, direct-to-physician advertising (detailing), professional magazines ads, etc. 4 Advertising is shown to also have beneficial effects, such as increased compliance rate (Calfee et al., 2002; Armantier and Namoro, 2006) or shorter delays between diagnosis and treatment (Bradford et al., 2010).
6
entire class, while promotion to physicians is associated with increased market share
(Rosenthal et al., 2003; Iizuka and Jin, 2005; Meyerhofer and Zuvekas, 2008).5 There is
some evidence that competition is associated with lower advertising expenditure
(Iizuka, 2004) and that advertising by incumbent brands inhibits entry into the market
(Rizzo, 1999). However, the role of competition, advertising and promotion on patient
safety has received much less attention. The literature has also largely overlooked
situations where the level of competition in the market grows abruptly (Jena et al., 2009).
In the pharmaceutical market, increased demand for a product may also increase the
risk of gaining patients who experience adverse drug reactions (Leffler, 1981; Hurwitz
and Caves, 1988). This may result in an increased risk of regulatory action from the
FDA, and compel pharmaceutical companies to internalize the full costs of their actions.
From a welfare perspective, reductions in advertising expenditures may lead to clinical
and physical improvements (e.g. reductions in cases of mental illness).
To highlight the roles of regulatory uncertainty and competition, we introduce these
dimensions sequentially into a standard advertising framework. We start with the
classic Dorfman and Steiner (1954) model of monopoly advertising. Next we introduce
uncertainty into the model. We proceed by developing the case of oligopoly, and finally
present a model of advertising under uncertainty in oligopoly.
5 The theoretical foundations consistent with these results can be found in Brekke and Kuhn (2005) and Linnosmaa (2008).
7
1. The Basic Model
This model analyses a monopoly’s simultaneous choice of price and advertising
expenditure. Advertising expenditures operates as a demand shifter and its cost is
deducted from the firm’s operational surplus. The firm maximizes the following profit
function, given by AAPQCAPQP )),((),( , where Q represents the quantity
demanded, P represents price, and A represents advertising expenditures. Dividing the
first‐order condition with respect to advertising expenditure by the first‐order condition
with respect to price results in what is known as the Dorfman‐Steiner rule:
[1.1]
Q
A
A
Q
P
MCP
QP
A
The term on the left‐hand side is the advertising‐to‐sales ratio, a common measure of
advertising intensity. The first term on the right‐hand side is the Lerner Index, which for
the case of monopoly is also inversely related to the price elasticity of demand. The
second term is the elasticity of advertising. Therefore, equation [1.1] can be written as
D
A
QP
A
,where A is the elasticity of advertising and D is the elasticity of demand.
2. Advertising under uncertainty
Similar to Horowitz (1970), Dehez and Jacquemin (1975), and Brick and Jagpal (1981),
who introduced uncertainty to the advertising framework, the pharmaceutical
monopoly in our model maximizes expected profit by choosing price and promotion
expenditures. For simplicity we assume an exogenous probability w (for drug
8
withdrawal), under which the firm’s surplus is lost but the advertising expenditures are
sunk.6 The resulting modified Dorfamn‐Steiner rule is given by:
[2.1]
Q
A
A
Q
P
MCP
QPw
A
)1(
Note that the only difference between equation [1.1] above and [2.1] is that instead of
advertising‐to‐sales ratio on the left‐hand side we have advertising‐to‐expected sales
ratio. While this formulation deals with exogenous demand shocks (or uncertainty) it is
not well suited for dealing with uncertainty that is the product of a regulatory process.
David et al. (2010) specifically allow advertising expenditure not only to raise the
demand for the drug but also to increase the likelihood of unfavorable regulatory
interventions through the negative effect that market expansion has on the quality of the
match between the drug and it users. For simplicity, we take the probability of
regulatory action to be a known function of the level of advertising expenditure chosen
by the firm.7 Thus, the firm faces uncertainty which it can mitigate or reinforce with its
choice of promotion level.
The firm would maximize the following expected profit function,
AAPQCAPQPAwE ))),((),(())(1( , where w(A) is the probability of
regulatory action. The resulting modified Dorfamn‐Steiner rule given by:
6 Results are qualitatively similar when advertising expenditures are not sunk: ])),((),([)1( AAPQCAPQPwE .
Proofs are available from authors. 7 For an example where the interaction between the pharmaceutical firm and the FDA is explicitly modeled see David et al. (2010).
9
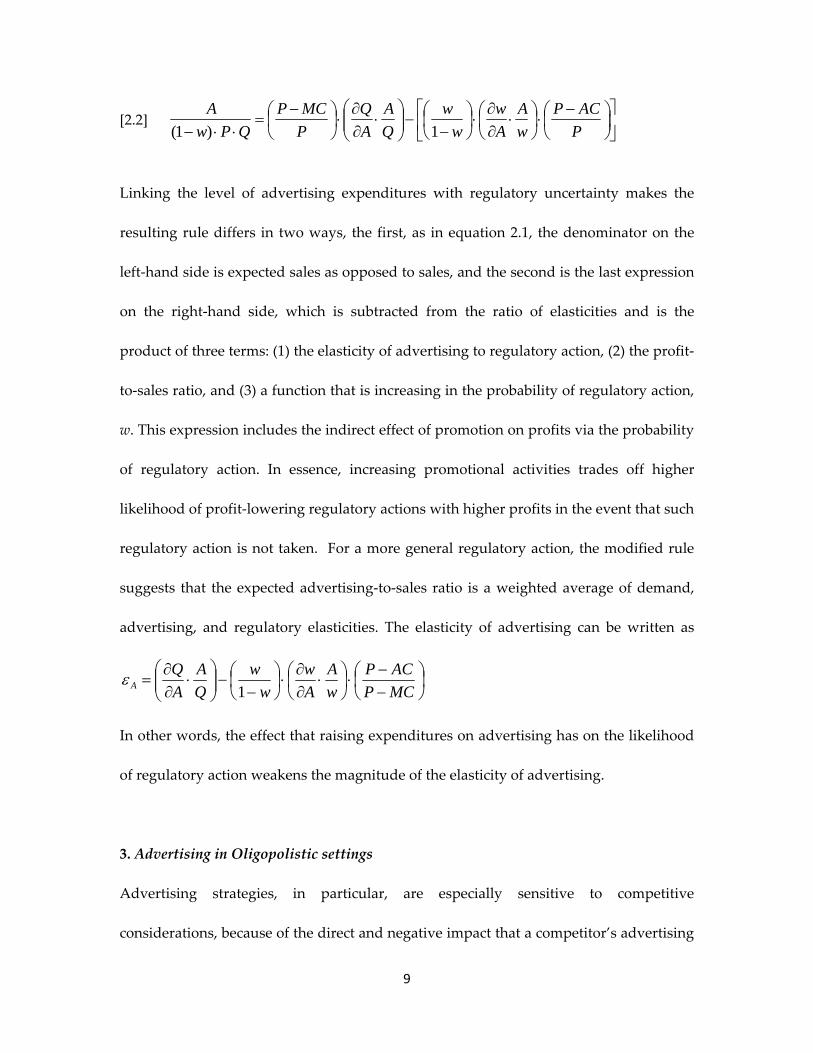
[2.2]
P
ACP
w
A
A
w
w
w
Q
A
A
Q
P
MCP
QPw
A
1)1(
Linking the level of advertising expenditures with regulatory uncertainty makes the
resulting rule differs in two ways, the first, as in equation 2.1, the denominator on the
left‐hand side is expected sales as opposed to sales, and the second is the last expression
on the right‐hand side, which is subtracted from the ratio of elasticities and is the
product of three terms: (1) the elasticity of advertising to regulatory action, (2) the profit‐
to‐sales ratio, and (3) a function that is increasing in the probability of regulatory action,
w. This expression includes the indirect effect of promotion on profits via the probability
of regulatory action. In essence, increasing promotional activities trades off higher
likelihood of profit‐lowering regulatory actions with higher profits in the event that such
regulatory action is not taken. For a more general regulatory action, the modified rule
suggests that the expected advertising‐to‐sales ratio is a weighted average of demand,
advertising, and regulatory elasticities. The elasticity of advertising can be written as
MCP
ACP
w
A
A
w
w
w
Q
A
A
QA 1
In other words, the effect that raising expenditures on advertising has on the likelihood
of regulatory action weakens the magnitude of the elasticity of advertising.
3. Advertising in Oligopolistic settings
Advertising strategies, in particular, are especially sensitive to competitive
considerations, because of the direct and negative impact that a competitor’s advertising
10
can have on a company’s market share and sales (Erickson, 1995). In monopolies
advertising may be used to generate greater awareness of the product and its value to
the customer. This can result in increasing overall market demand. However the
monopolistic supplier has no need to use advertising to increase market share. In
contrast, oligopolistic firms can gain from advertisement by increasing their market
share as well as increasing total market demand. To achieve this, they need to establish
the superiority of their products over those of their competitors, and in doing so they
must also counter the impact of advertisement of the competitors. Because of these
reasons the level of adverting tends to be higher in oligopolistic markets.
Under oligopoly, each of these dominant players has some influence on the market price
of the product as well as the total market demand. However such influence is limited
because action of any one supplier can result in counter action by competitors. Take the
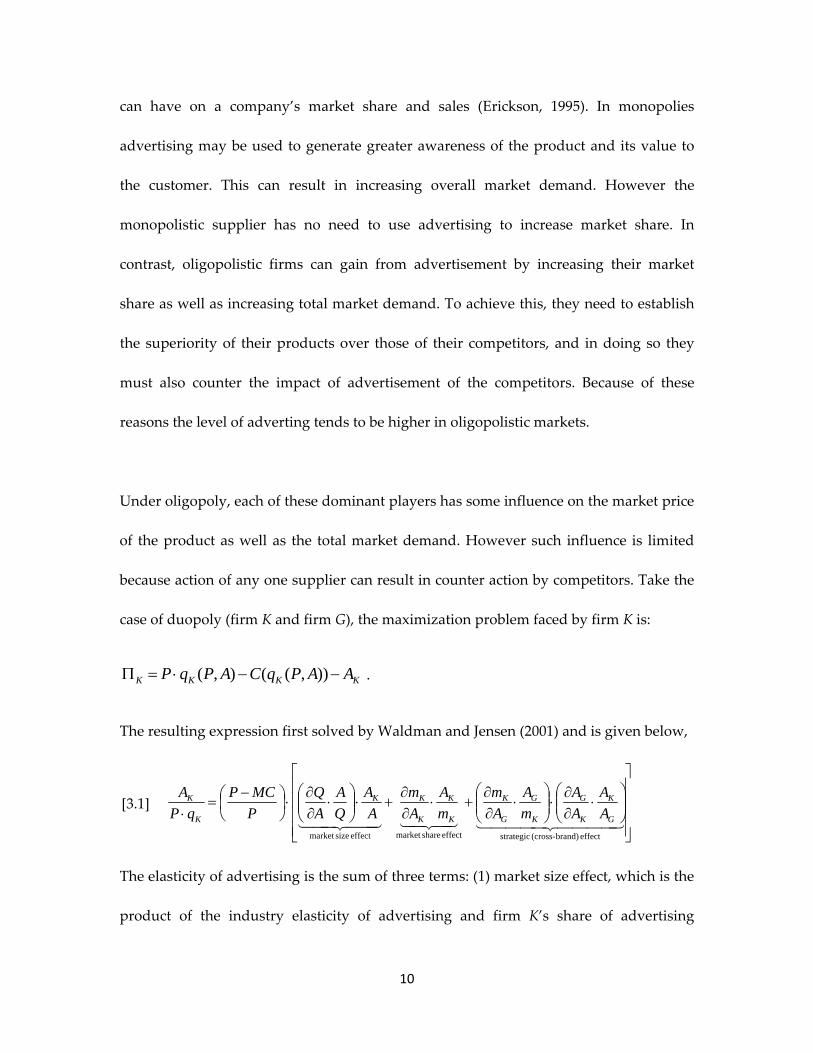
case of duopoly (firm K and firm G), the maximization problem faced by firm K is:
KKKK AAPqCAPqP )),((),( .
The resulting expression first solved by Waldman and Jensen (2001) and is given below,
[3.1]
effect brand)-(cross strategiceffect sharemarket effect sizemarket
G
K
K
G
K
G
G
K
K
K
K
KK
K
K
A
A
A
A
m
A
A
m
m
A
A
m
A
A
Q
A
A
Q
P
MCP
qP
A
The elasticity of advertising is the sum of three terms: (1) market size effect, which is the
product of the industry elasticity of advertising and firm K’s share of advertising
11
expenditures out of total industry advertising, (2) market share effect, which is the
elasticity of firm K’s market share to firm K’s advertising expenditures, and (3) strategic
(cross‐brand) effect, which is a product of the effect of firm K’s advertising expenditures
on the choice of advertising expenditures by firm G and the subsequent effect of the
change in advertising by firm G on firm K’s market share. The model is easily extandable
to the case of more than two firms, with the same three effects in place.
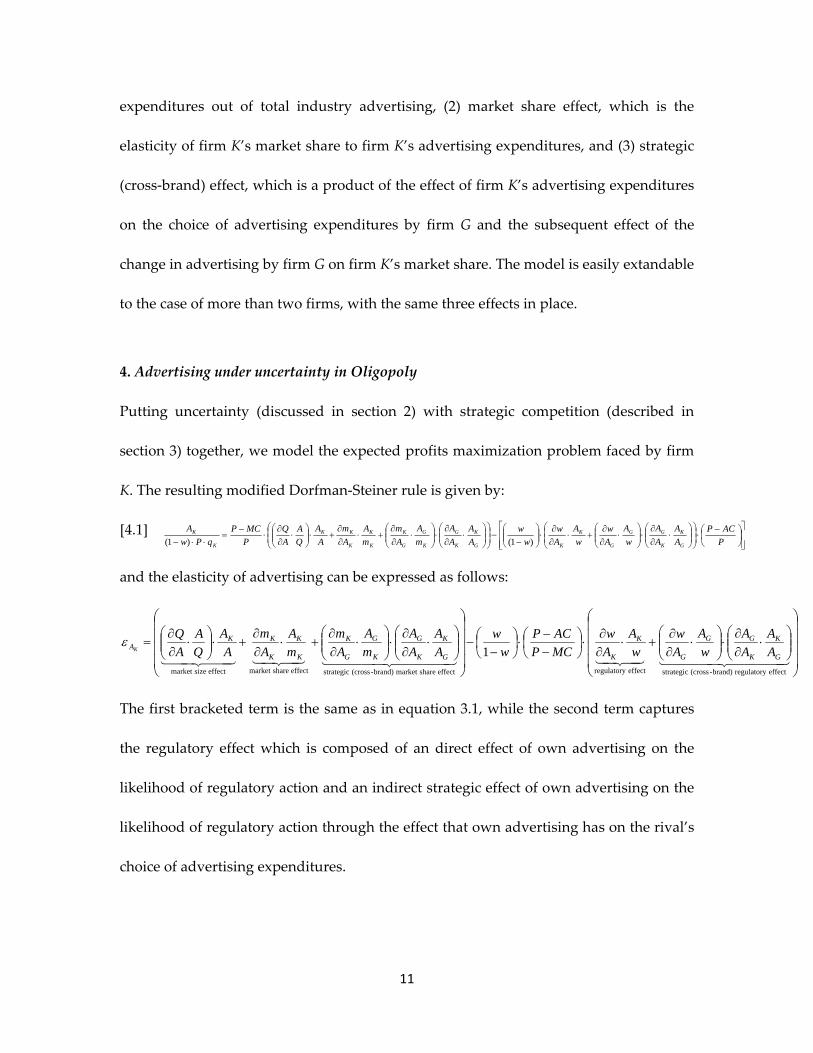
4. Advertising under uncertainty in Oligopoly
Putting uncertainty (discussed in section 2) with strategic competition (described in
section 3) together, we model the expected profits maximization problem faced by firm
K. The resulting modified Dorfman‐Steiner rule is given by:
[4.1]
P
ACP
A
A
A
A
w
A
A
w
w
A
A
w
w
w
A
A
A
A
m
A
A
m
m
A
A
m
A
A
Q
A
A
Q
P
MCP
qPw
A
G
K
K
GG
G
K
KG
K
K
G
K
G
G
K
K
K
K
KK
K
K
)1()1(
and the elasticity of advertising can be expressed as follows:
effect regulatory brand)-(cross strategiceffect regulatoryeffect sharemarket brand)-(cross strategiceffect sharemarket effect sizemarket
1 G
K
K
GG
G
K
KG
K
K
G
K
G
G
K
K
K
K
KKA A
A
A
A
w
A
A
w
w
A
A
w
MCP
ACP
w
w
A
A
A
A
m
A
A
m
m
A
A
m
A
A
Q
A
A
QK
The first bracketed term is the same as in equation 3.1, while the second term captures
the regulatory effect which is composed of an direct effect of own advertising on the
likelihood of regulatory action and an indirect strategic effect of own advertising on the
likelihood of regulatory action through the effect that own advertising has on the rival’s
choice of advertising expenditures.
12
Unlike existing models of advertising, arguing that advertising has no direct
relationship with benefits to customers, analysis of advertising in the pharmaceutical
space must take into account the nature of demand expansions in term of patient safety.
The elasticity of advertising under monopoly may be larger than, equal to, or smaller
than the elasticity of advertising under oligopoly (see equations 2.2 and 4.1). On the one
hand, a monopoly can fully appropriate its advertising expenditures, which is not the
case under oligopoly. On the other hand, a monopoly would also fully “appropriate” all
regulatory actions that stem from advertising expenditure. The effect that a switch from
monopoly to oligopoly has on the advertising‐to‐sales ratio, market share, sales, and
adverse events reported remains an empirical question.
III. Empirical Estimation
In this section, we analyze the market for ED drugs to empirically examine the effects of
advertising and promotion on Viagra’s market share as well as the number and share of
reported adverse drug events (ADEs). We focus on Viagra’s outcomes rather than that
of Cialis and Levitra as Viagra appears in both a monopoly (1998‐2003) and a
competitive (2003 and on) setting. In analyzing these outcomes, we study current and
lagged spending on own and competitors’ advertising and promotion.
To estimate the effects of spending on market share and ADEs, we use a monthly time
series of data from a variety of sources described below. We specify a simple equation
13
where the outcomes are determined by current and lagged spending on DTCA and
promotion, along with year and month dummies to capture unobserved trends. We use
ordinary least squares to estimate the coefficients and all standard errors are adjusted for
heteroskedasticity and autocorrelation according to Newey and West (1987), with a
three period lag used. Current spending pertains to the current month, and lagged
spending pertains to the remaining eleven months in the current year (months t‐1
through t‐11).
Data Sources
The data for this project combines information on drug prescriptions, direct‐to‐
consumer advertising, promotion to physicians, and reporting of adverse drug events.
Prescription data: We obtained prescription data from IMS Health’s National
Prescription Audit (NPA) database. NPA reports national monthly counts of pharmacy
sales of all prescription drugs. From this, we extract Viagra’s number of prescriptions
(in thousands) monthly from 2000 to 2008, and Cialis and Levitra’s numbers from their
entry dates in late 2003 to 2008. These prescription data are used to generate market
shares for each drug.
Adverse Drug Events: ADEs are counts of reported adverse drug events involving Viagra,
Levitra, and Cialis. Data on ADEs come from the U.S. Food and Drug Administration’s
Adverse Event Reporting System (AERS), which was designed for postmarket drug
14
safety surveillance. Manufacturers are required to submit reports of adverse events to
the AERS, while reports from doctors, consumers and lawyers are voluntarily
contributed. The FDA uses this database to inform its regulatory decisions regarding
postmarket safety of drugs. We use monthly observations from 2000 to 2008.
The AERS has information on the types of adverse events associated with drugs. From
this, we created two measures of adverse events. The first is a count of “very serious”
events based on the FDA definition from the AERS reporting instructions which
includes: death; life‐threatening injury; hospitalization; disability or permanent damage;
and congenital anomaly / birth defect. The second is a count of all adverse events
including the very serious events and those that are less severe. We focus on ADEs
where Viagra, Levitra, and Cialis are named as the primary or secondary suspect drug.
Drugs can also be categorized as concomitant or an interacting drug. Models were
tested with these expanded classifications and the results are similar to those presented
below.
The AERS data suffer from some drawbacks including a lack of data on the number of
drug users in the population, recall bias, poor case documentation and underreporting
(IOM 2007, pg. 55). We can overcome the lack of drug user data by relying on
prescription data from IMS Health’s NPA database described above. Measurement
error in the AERS will be a problem only if the error is correlated with our variables of
interest, dollars spent on advertising and promotion. Recall bias and poor case
documentation are not likely to be correlated with dollars spent. However, it is possible
15
that reporting patterns for certain drugs are influenced by advertising, for example, if
consumers are reminded to report an event based on a television commercial. This
possible endogeneity is a limitation of our analyses.
Advertising and Promotion: Data on direct to consumer advertising comes from the TMS
Media Ad$pender database (formerly Competitive Media Reports). We use total dollars
spent per month on television, magazines, billboards, and internet advertising for the
three drugs under consideration. These data are available from 2002‐2008. Monthly
data on professional promotion comes from IMS’s Integrated Promotion Service (IPS)
for 2000‐2008. We use total dollars spent on professional promotion (termed
“professional promotion”), which includes the cost of direct contact with physicians,
journal advertising, and the retail value of samples. All spending is reported in real
dollars.
For advertising and promotion expenditures, we consider current month expenditures
as a flow measure and the sum of expenditures for the previous eleven months (t‐1 to t‐
11) as a measure of the existing stock of expenditures. The choice of number of months
to use for the current period is not obvious since ADEs are reported throughout the
month. It is therefore not clear that current month’s expenditures are appropriately
matched to all observations. We also tested models in which the flow measure includes
both current and a one month lag, and results are similar. Note that since we are
interested in the effects of the entry of Levitra and Cialis on Viagra’s outcomes it is
important to use only the current month’s expenditures. Details on these specifications
16
are below. One last comment to point out is that for the stock values, we do not specify
a depreciation rate, rather, we let the coefficients on the stock reflect the product of the
marginal effect and the depreciation rate. We will interpret these coefficients
accordingly.
IV. Results
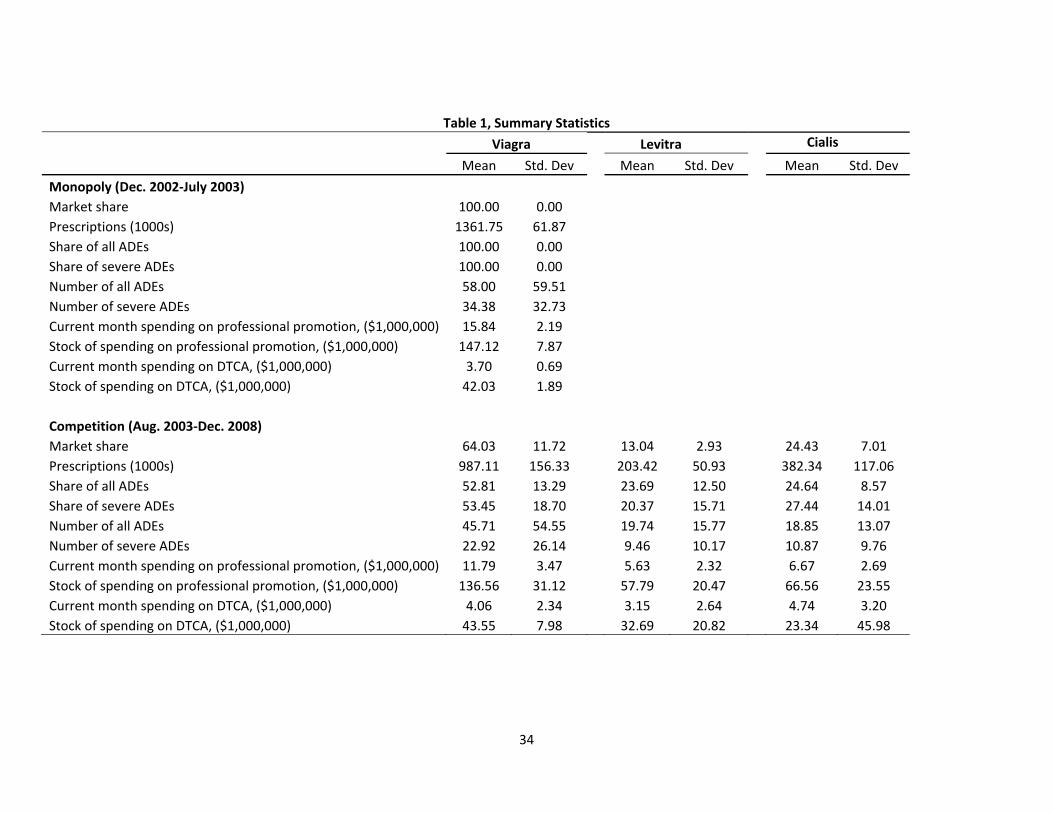
Table 1 presents means and standard deviations by drug for the key variables. We report
these moments for Viagra before and after entry by Cialis and Levitra. Figures 1
through 4 demonstrate the movements in the variables over time, and where possible,
extend the data beyond what is used in the analyses in order to show a more complete
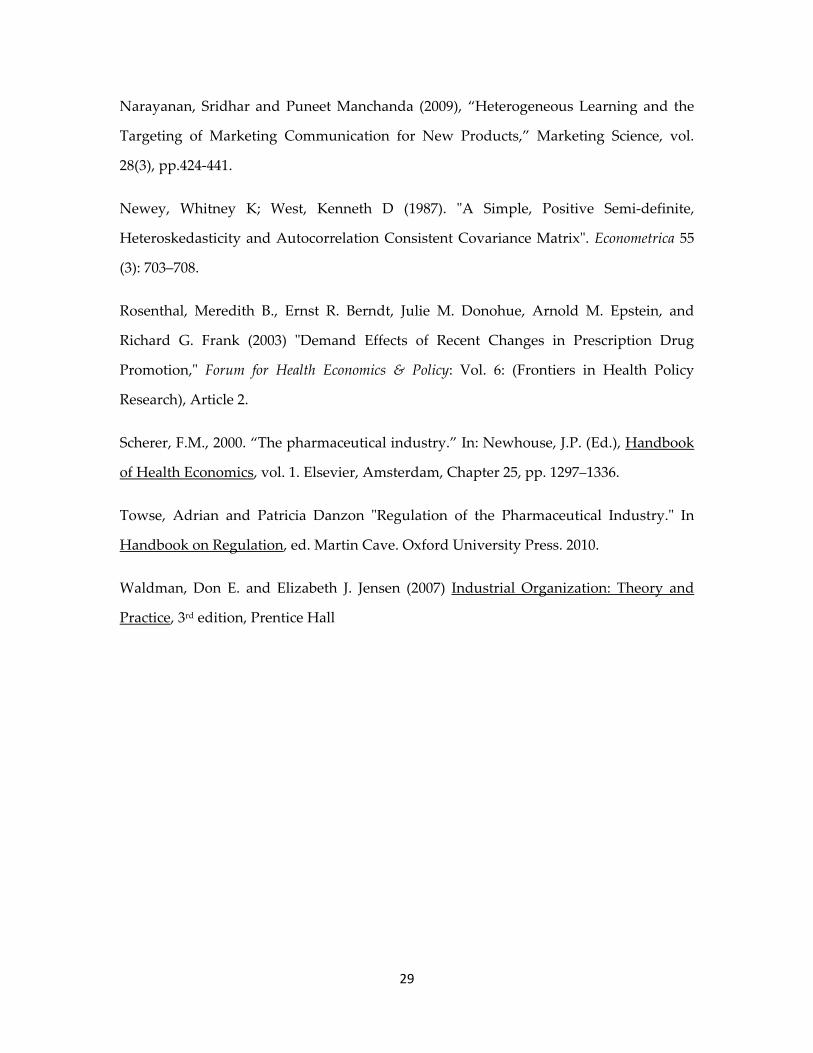
picture of the market. Figure 1 shows trends in prescriptions by drug, for each quarter
between 2000 and 2008. Viagra entered the market in March 1998, and by the end of the
first quarter in 2000 had 2.7 million prescriptions filled. The upward trend in
prescriptions continues and reaches its peak in the third quarter of 2003 when Levitra
enters the market. Cialis enters late in November of 2003, but quickly overtakes Levitra
in terms of prescriptions. Viagra’s share fell precipitously after 2003, ending 2008 with a
market share of 52 percent. Cialis and Levitra claimed 32 and 16 percent of the market,
respectively.
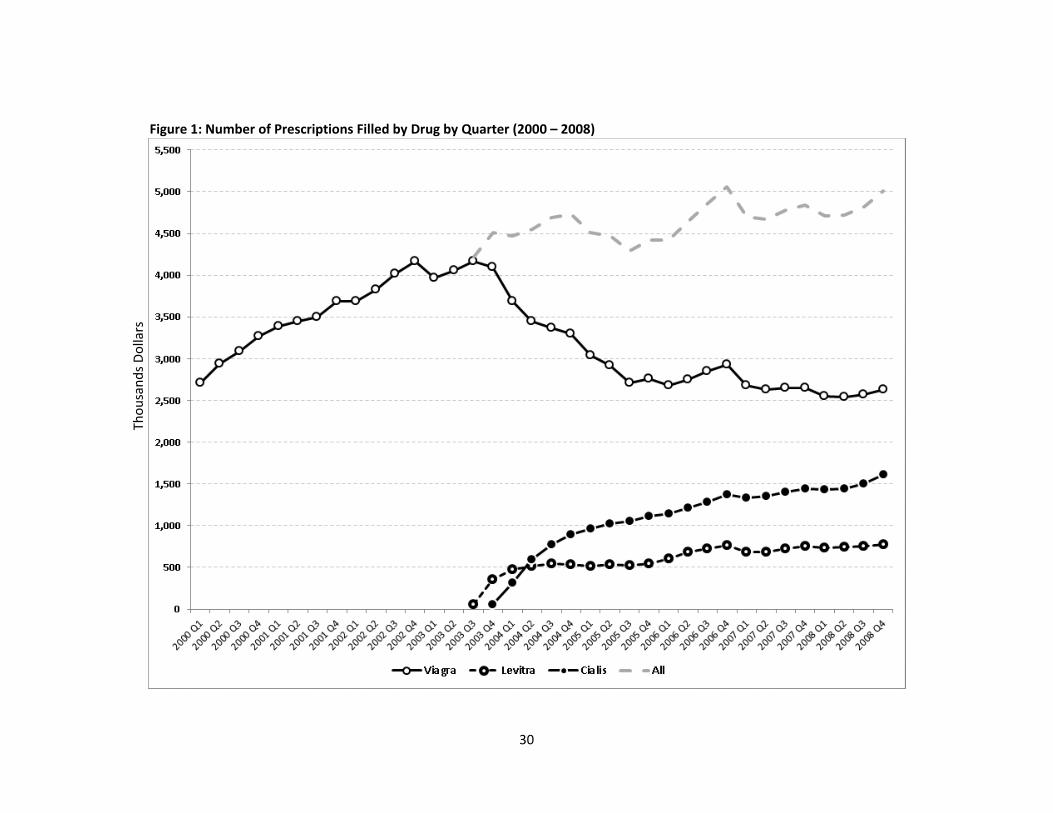
Figure 2 shows total expenditures on DTCA and professional promotion by the three
competitors. Our promotion data begins in 2002. Pfizer outspends its competitors in
almost all periods shown, with the bulk of this spending going towards professional
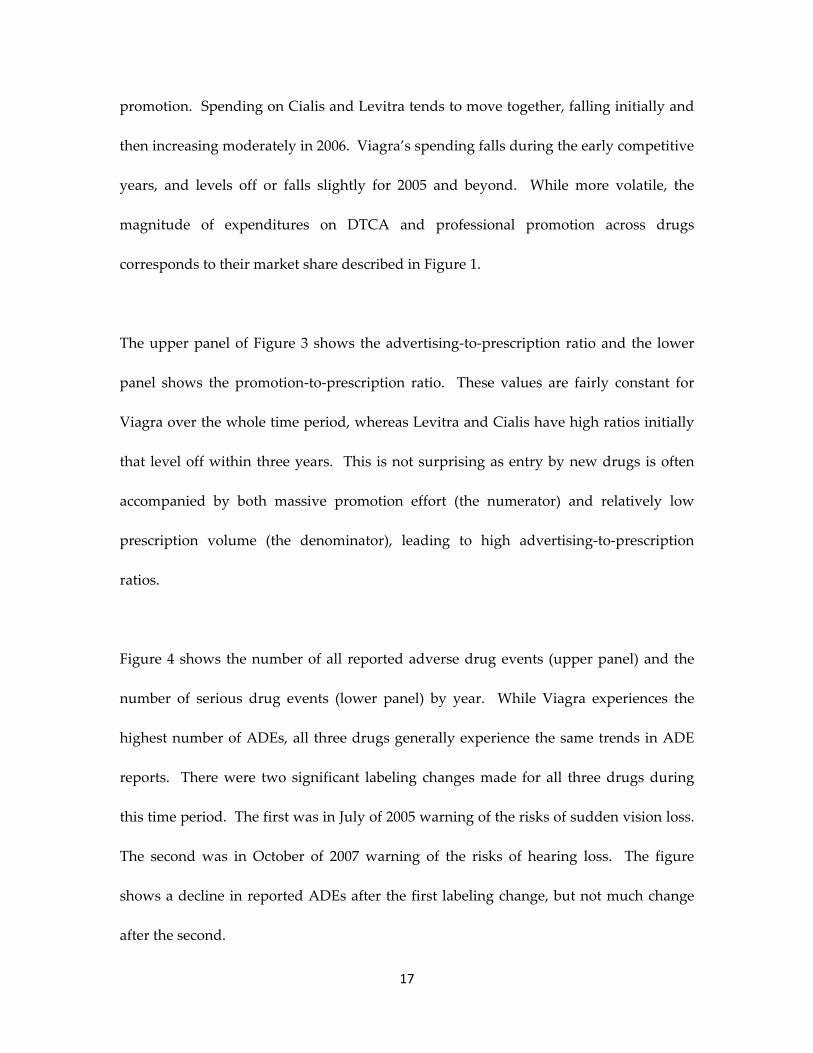
17
promotion. Spending on Cialis and Levitra tends to move together, falling initially and
then increasing moderately in 2006. Viagra’s spending falls during the early competitive
years, and levels off or falls slightly for 2005 and beyond. While more volatile, the
magnitude of expenditures on DTCA and professional promotion across drugs
corresponds to their market share described in Figure 1.
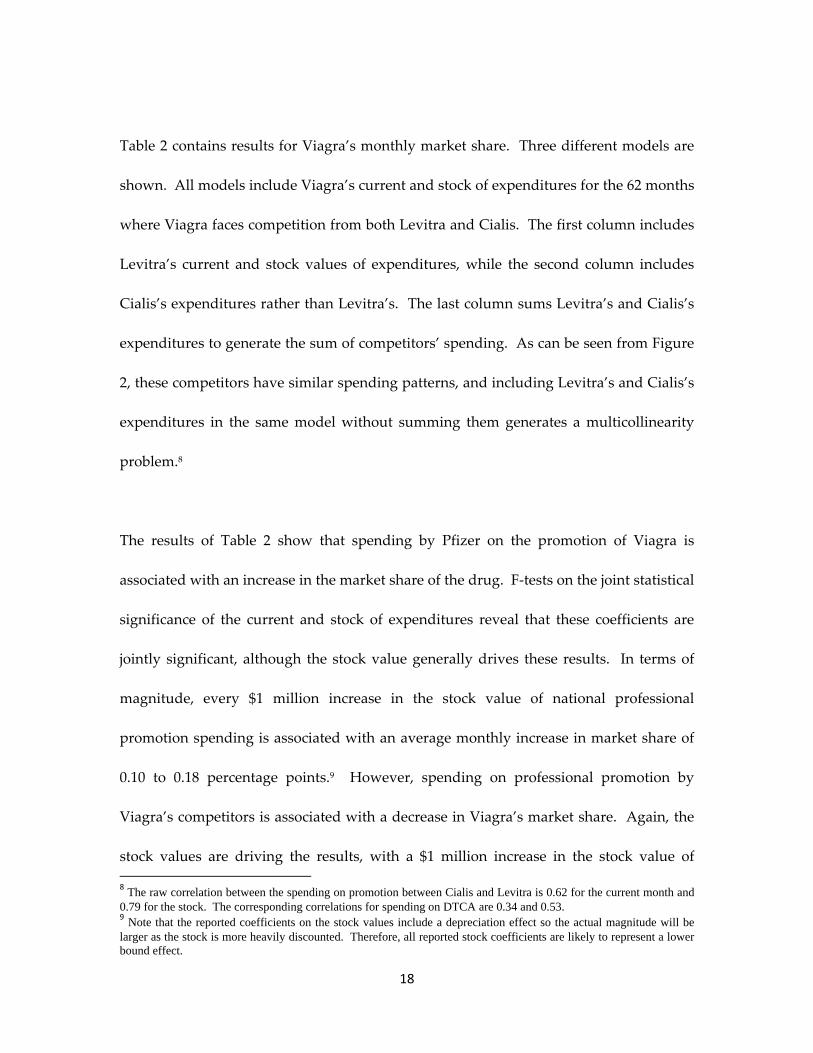
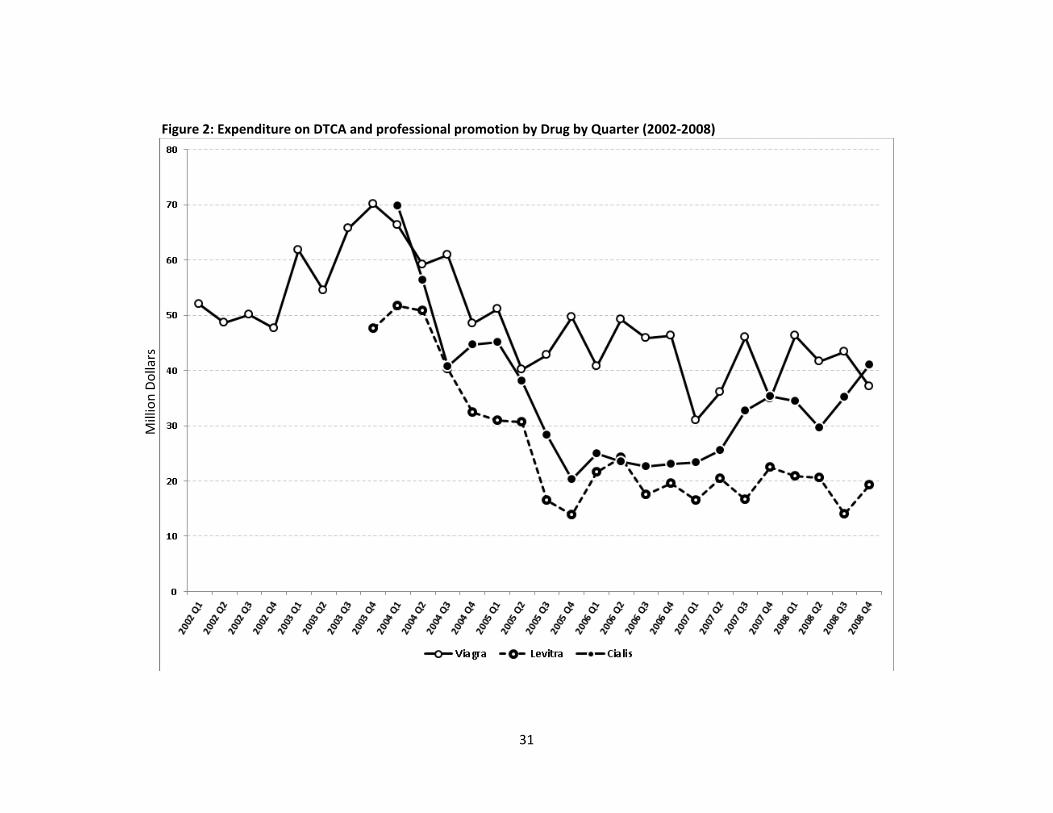
The upper panel of Figure 3 shows the advertising‐to‐prescription ratio and the lower
panel shows the promotion‐to‐prescription ratio. These values are fairly constant for
Viagra over the whole time period, whereas Levitra and Cialis have high ratios initially
that level off within three years. This is not surprising as entry by new drugs is often
accompanied by both massive promotion effort (the numerator) and relatively low
prescription volume (the denominator), leading to high advertising‐to‐prescription
ratios.
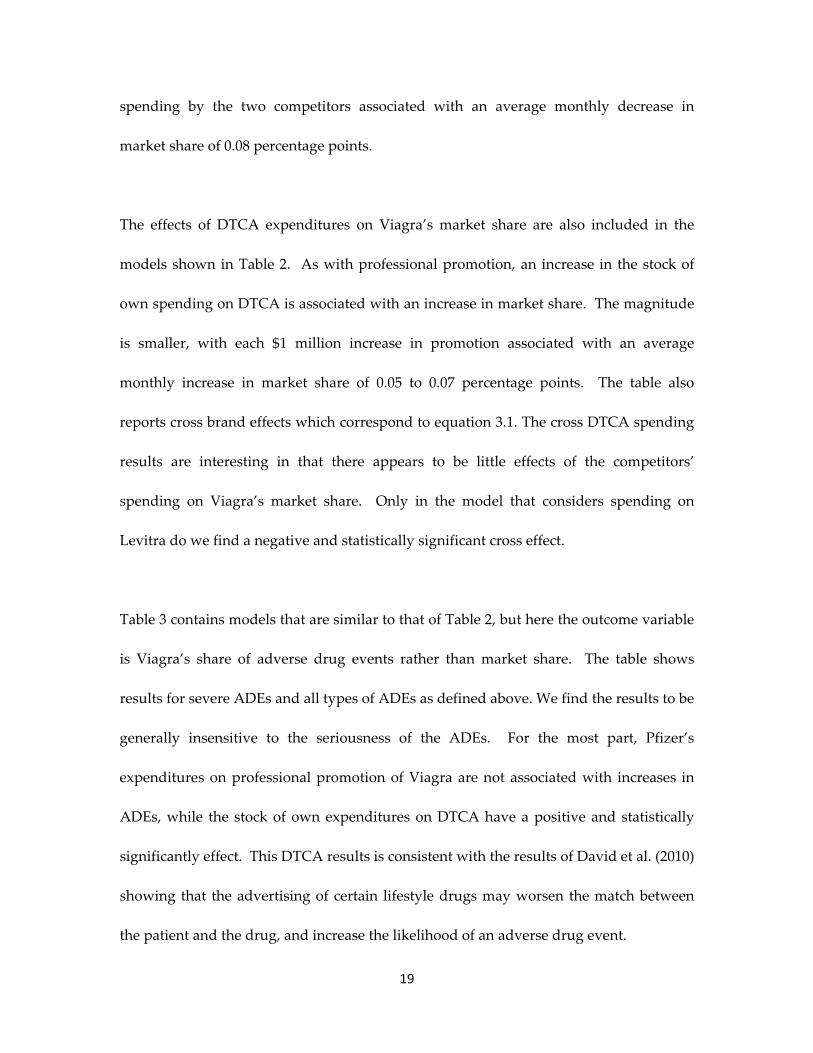
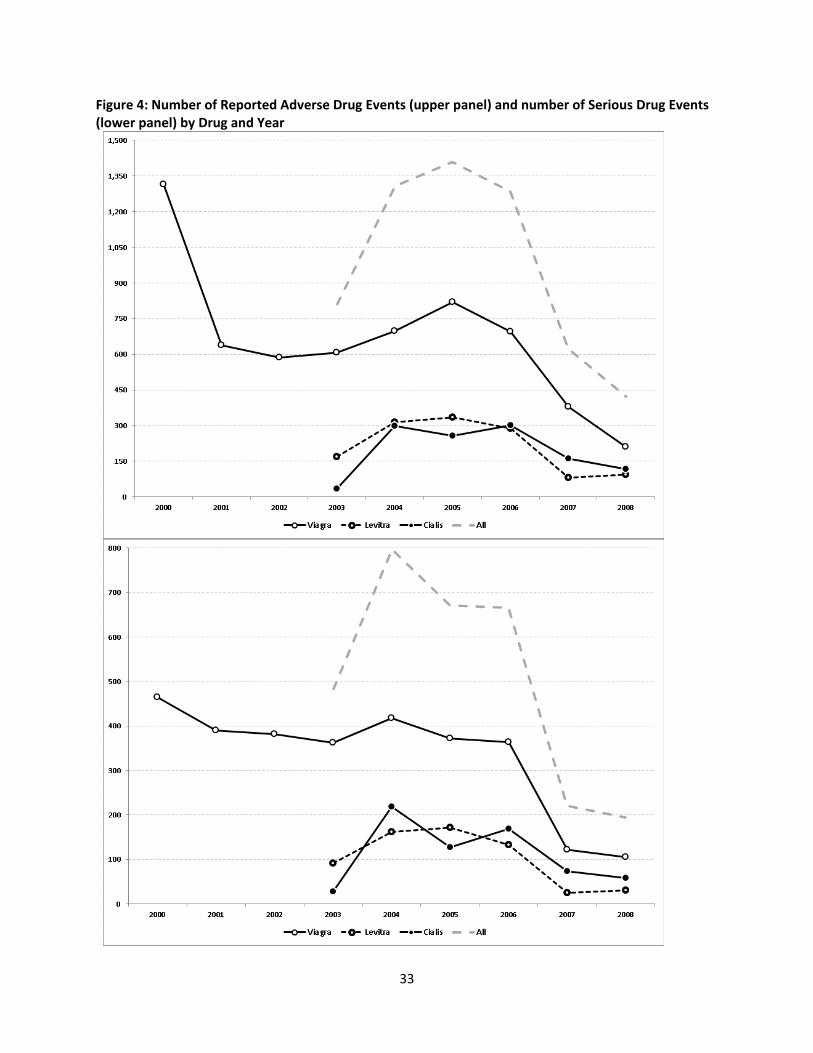
Figure 4 shows the number of all reported adverse drug events (upper panel) and the
number of serious drug events (lower panel) by year. While Viagra experiences the
highest number of ADEs, all three drugs generally experience the same trends in ADE
reports. There were two significant labeling changes made for all three drugs during
this time period. The first was in July of 2005 warning of the risks of sudden vision loss.
The second was in October of 2007 warning of the risks of hearing loss. The figure
shows a decline in reported ADEs after the first labeling change, but not much change
after the second.
18
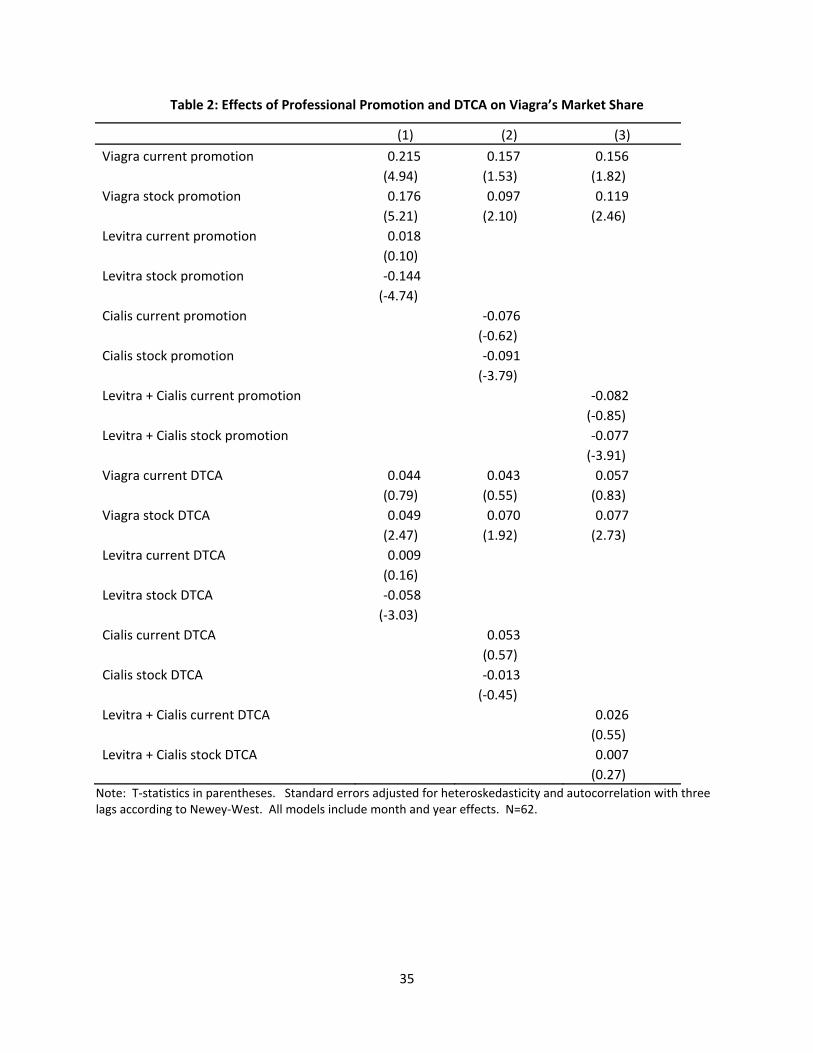
Table 2 contains results for Viagra’s monthly market share. Three different models are
shown. All models include Viagra’s current and stock of expenditures for the 62 months
where Viagra faces competition from both Levitra and Cialis. The first column includes
Levitra’s current and stock values of expenditures, while the second column includes
Cialis’s expenditures rather than Levitra’s. The last column sums Levitra’s and Cialis’s
expenditures to generate the sum of competitors’ spending. As can be seen from Figure
2, these competitors have similar spending patterns, and including Levitra’s and Cialis’s
expenditures in the same model without summing them generates a multicollinearity
problem.8
The results of Table 2 show that spending by Pfizer on the promotion of Viagra is
associated with an increase in the market share of the drug. F‐tests on the joint statistical
significance of the current and stock of expenditures reveal that these coefficients are
jointly significant, although the stock value generally drives these results. In terms of
magnitude, every $1 million increase in the stock value of national professional
promotion spending is associated with an average monthly increase in market share of
0.10 to 0.18 percentage points.9 However, spending on professional promotion by
Viagra’s competitors is associated with a decrease in Viagra’s market share. Again, the
stock values are driving the results, with a $1 million increase in the stock value of
8 The raw correlation between the spending on promotion between Cialis and Levitra is 0.62 for the current month and 0.79 for the stock. The corresponding correlations for spending on DTCA are 0.34 and 0.53. 9 Note that the reported coefficients on the stock values include a depreciation effect so the actual magnitude will be larger as the stock is more heavily discounted. Therefore, all reported stock coefficients are likely to represent a lower bound effect.
19
spending by the two competitors associated with an average monthly decrease in
market share of 0.08 percentage points.
The effects of DTCA expenditures on Viagra’s market share are also included in the
models shown in Table 2. As with professional promotion, an increase in the stock of
own spending on DTCA is associated with an increase in market share. The magnitude
is smaller, with each $1 million increase in promotion associated with an average
monthly increase in market share of 0.05 to 0.07 percentage points. The table also
reports cross brand effects which correspond to equation 3.1. The cross DTCA spending
results are interesting in that there appears to be little effects of the competitors’
spending on Viagra’s market share. Only in the model that considers spending on
Levitra do we find a negative and statistically significant cross effect.
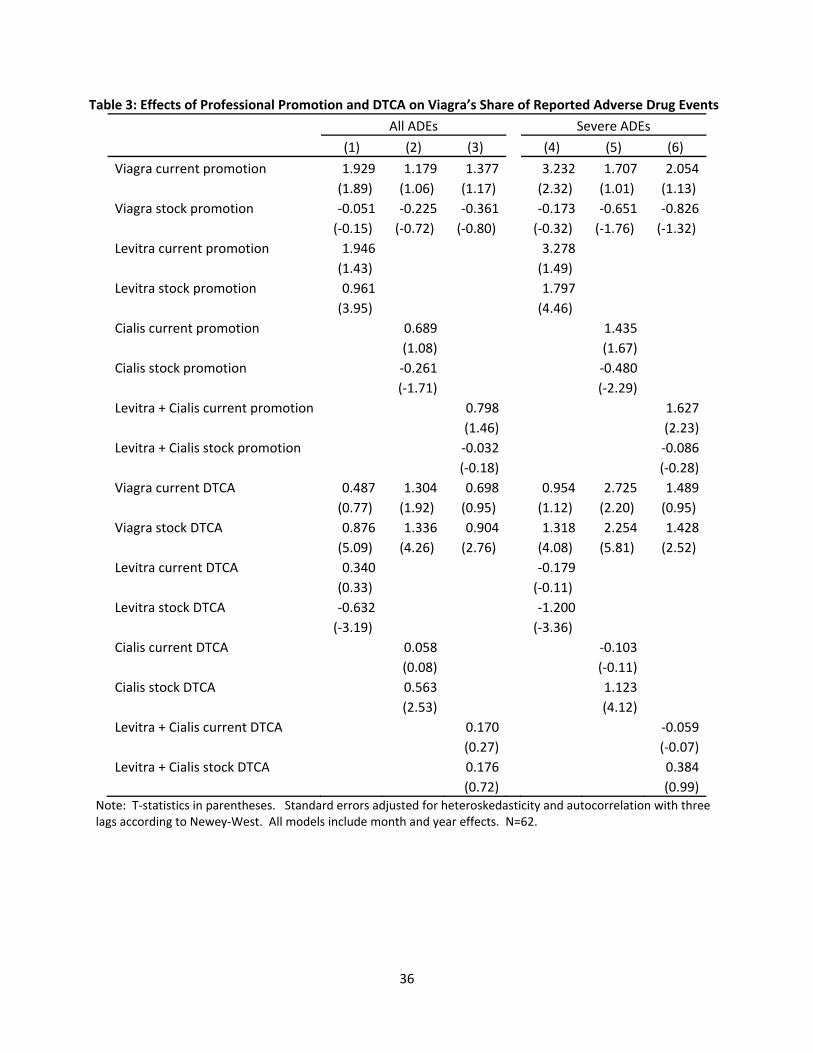
Table 3 contains models that are similar to that of Table 2, but here the outcome variable
is Viagra’s share of adverse drug events rather than market share. The table shows
results for severe ADEs and all types of ADEs as defined above. We find the results to be
generally insensitive to the seriousness of the ADEs. For the most part, Pfizer’s
expenditures on professional promotion of Viagra are not associated with increases in
ADEs, while the stock of own expenditures on DTCA have a positive and statistically
significantly effect. This DTCA results is consistent with the results of David et al. (2010)
showing that the advertising of certain lifestyle drugs may worsen the match between
the patient and the drug, and increase the likelihood of an adverse drug event.
20
Results in Table 3 also show that professional promotion spending by Viagra’s
competitors adversely affects its share of ADEs, especially when serious ADEs are
considered. Here, increases in current month spending on professional promotion by
Levitra and Cialis are associated with an increase in Viagra’s share of ADEs of over one
percentage point. However, the Cialis effect is mitigated by a smaller negative stock
effect. When combined, current professional promotion expenditures are associated
with an increase in Viagra’s share of ADEs by 1.6 percentage points (see Column 6).
DTCA by the competitors has differential effects on Viagra’s share of ADEs, with an
increase in the stock of Levitra’s DTCA associated with decreases in Viagra’s share of
ADEs, while an increase in the stock of Cialis’s DTCA is associated with an increase in
Viagra’s share. When the DTCA expenditures for the competitors are summed, the
resulting coefficient is statistically insignificant and reflects the average of the positive
and negative effects. It is not clear why DTCA by Levitra would induce the opposite
effect on patients’ match with the drug compared with DTCA by Cialis.
The models in Table 3 are informative regarding the distribution of ADEs across the
three ED drugs, but do not speak to the effects of advertising and promotion on the total
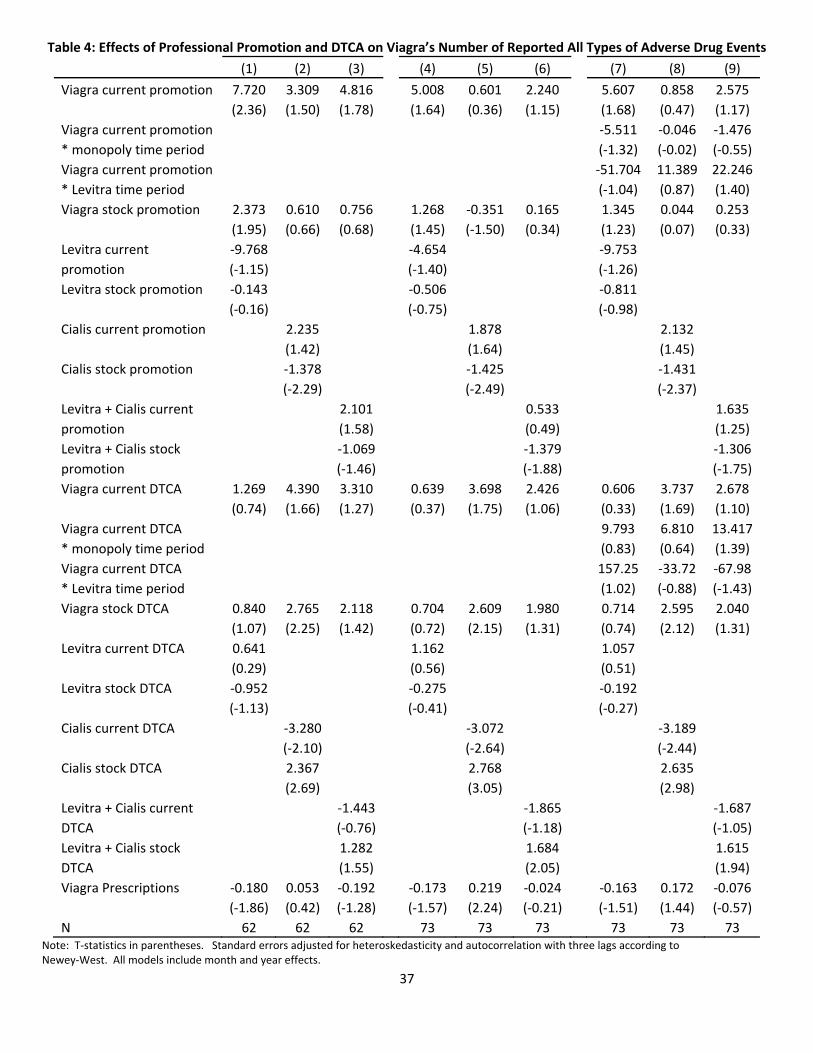
number of ADEs reported. We address this in Table 4, where the dependent variable is
the number of all Viagra ADEs mentioned as a primary or secondary suspect drug.
Results for serious ADEs are not shown, but are similar to that of all ADEs and are
available upon request. We use the simple count rather than the rate since advertising
21
and promotion can affect both the count of ADEs and the total number of prescriptions
(the denominator in the rate). We do, however, include the number of prescriptions as a
right‐hand side variable in order to control for the prevalence of the drug in the
population.
The first three columns of Table 4 contain the same sample size (n=62) and variables as
in the previous tables. We then increase the sample period to include the months before
the competitors enter the market. The available data allows us to bring the series back to
2002. We start the series in December of 2002 to allow the stock values to contain the full
eleven months prior to the current month. This results in a sample size of 73 months.
We present two different series of models using this expanded sample. In the first
(columns 4 through 6), Viagra’s own spending effect is assumed to be constant across
the time series. In the second (columns 7 through 9), we allow Viagra’s own spending
effect to vary with the introduction of the competitors. That is, these models include
variables representing current month spending, along with interactions between this
spending and 1) an indicator variable for all months prior to August 2003 when Viagra
had no competitors and 2) an indicator for August, September, and October of 2003
when Levitra was the only competitor. The current spending variable can therefore be
interpreted as the effects of Viagra’s own spending in the competitive market. This
should be comparable to the restricted time sample in the first three columns.
22
Current expenditures on professional promotion and DTCA by Pfizer for Viagra are
both associated with increases in the number of ADEs, holding constant the number of
prescriptions. However, the statistical significance of the results depends on the other
included variables. What is surprising is that the magnitude of the current spending
effects do not vary much between the models with and without the interactions
(comparing columns 4‐6 to 7‐8), and the interaction terms themselves are statistically
insignificant. This suggests that the own spending effects are constant throughout the
changes in the market structure.
Table 4 also suggests that spending on the promotion of Cialis may influence the
number of Viagra’s ADEs, however, the direction of the effects are a bit unclear as the
current and stock values have opposite signs. The total effect would sum the coefficients
of the current and stock, however, the stock value is likely subject to a discount rate,
which would result in a larger true stock effect (in absolute value). Considering this,
and the magnitudes of the coefficients, the stock and current values are fairly close to
each other and it is difficult to tell which will dominate. If the stock is not heavily
discounted then increased expenditures on the professional promotion of Cialis will be
associated with increases in the number of ADEs. This is consistent with the finding in
Table 3 for the share of ADEs.
The effects of Cialis’s DTCA are also consistent with that of Table 3, where an increase in
the stock of DTCA increases Viagra’s number and of share of ADEs. The one
23
complication here is the large negative and statistically significant coefficients on the
current value of Cialis’s DTCA that may diminish the stock effect. But to dominate, this
would require almost no discounting of the stock effect. We therefore conclude that the
competitor’s DTCA has deleterious effects on Viagra’s ADEs.
V. Discussion
This paper provides both the theoretical foundation and an empirical test comparing the
relationship between promotion activity, sales, and adverse events under monopoly and
under oligopoly by looking within a single therapeutic class (ED drugs) over time.
The theoretical predictions of the optimal level of advertising and the related effects on
market share, sales, and adverse events depend on the market structure, and may
change dramatically when entry occurs. As stressed in section II, advertising under
oligopoly treats each competitor as anticipating its rivals’ choices. Hence, while
maximizing profits by selecting its advertising expenditures, the firm explicitly
incorporates the goals and strategies of its competitors. Advertising in this setting is
designed to achieve both increases in market size and in market share. Without the
ability to appropriate its advertising expenditures, a firm would prefer to free ride on
market‐size expanding ads by rival firms.
Our empirical analysis confirm the prediction that own spending on DTCA and
promotion increases own market share, while competitors’ spending decreases own
market share. While this finding is not unique to the pharmaceutical industry, we show
24
that spending on DTCA and promotion can also result in increased adverse drug events,
which has been shown to increase the probability of regulatory actions (see David et al.
2010). In particular, DTCA by the incumbent brand (Viagra) increases its share and the
number of ADEs, and the own spending effects appear to be constant throughout the
changes in the market structure. With a few exceptions, spending on DTCA and
promotion by entrants (Levitra and Cialis) also increase the incumbent’s share and count
of ADEs.
We focus on within‐drug class changes in market structure over time. An alternative
study design would involve a cross country comparison of the effect of advertising on
sales and safety, where the countries vary in their degree of competition. Kenkel and
Mathios (2011) argue that this is a market characteristic that distinguishes the US from
New Zealand, the only two high‐income countries allowing DTCA of prescription
drugs. While in the US the heavily advertised drugs are concentrated in a small number
of medical conditions (i.e. within class competition), in New Zealand, due to
government subsidies there is often a single drug for every medical condition. Hence,
the most heavily advertised drugs are monopolies (Kenkel and Mathios, 2011). The
single exception is ED drugs, which are not subsidized in New Zealand, and therefore
have all players advertise heavily – similar to the case in the US.
In summary, since regulatory agencies are sensitive to post‐marketing safety indicators,
firms chose the level of advertising and promotional expenditures strategically. Like the
25
drugs themselves, competition in the pharmaceutical industry has side‐effects. Beyond
the well documented strategic interactions, like opportunities for free riding on rivals’
advertising and promotional campaigns, there is a potential spillover effect from rivals’
inappropriate market expansion in the form of increased reporting of adverse drug
reactions.
26
References
Armantier, Olivier and Soiliou Namoro (2006). “Prescription Drug Advertising and
Patient Compliance: A Physician Agency Approach.” Advances in Economic Analysis &
Policy 6 (1) Article 5. Berkeley Electronic Press.
Berndt, Ernst R., “The United Statesʹ Experience with Direct‐to‐Consumer Advertising of
Prescription Drugs: What Have We Learned?” In Frank A. Sloan and Chee‐Ruey Hsieh,
eds., Promoting and Coping with Pharmaceutical Innovation: An International
Perspective, Cambridge University Press, 2006.
Bradford, W David, Andrew N Kleit, Paul J Nietert, and Steven Ornstein (2010). “The
Effect of Direct‐to‐Consumer Television Advertising on the Timing of Treatment.”
Economic Inquiry 48 (2): 306 ‐ 317.
Brekke, Kurt R and Michael Kuhn (2005). “Direct to Consumer Advertising in
Pharmaceutical Markets.” Journal of Health Economics 25 (1): 102 ‐ 130.
Brick, Ivan E. and Harsharanjeet S. Jagpal “Monopoly Price‐Advertising Decision‐
Making under Uncertainty” Journal of Industrial Economics, Vol. 29, No. 3 (Mar., 1981),
pp. 279‐285.
Calfee, John E., Winston, Clifford, and Stempski, Randolph. (2002). “Direct‐to‐Consumer
Advertising and the Demand for Cholesterol‐Reducing Drugs.” The Journal of Law and
Economics, 45: 673–690.
Chan, Tat, Chakravarthi Narasimhan and Ying Xie (2007), “Impact of Treatment
Effectiveness and Side effects on Prescription Decisions: The Role of Patient
Heterogeneity and Learning,” working paper, Washington University in St. Louis.
Ching, Andrew and Masakazu Ishihara (2010), “The Effects of Detailing on Prescribing
Decisions under Quality Uncertainty,” Quantitative Marketing and Economics, vol.8(2),
pp.123‐165.
27
Crawford, Gregrory S and Matthew Shum (2005). “Uncertainty and Learning in
Pharmaceutical Demand.” Econometrica 73 (4): 1137 ‐ 1173.
Danzon, Patricia “Regulation of the BioPharmaceutical Industry” in Encyclopedia of
Law and Economics. Edward Elgar. 2011
David, Guy, Sara Markowitz, and Seth Richards‐Shubik, “The Effects of Pharmaceutical
Marketing and Promotion on Adverse Drug Events and Regulation.” American Economic
Journal – Economic Policy 2(4), November 2010, pp 1‐25.
Dehez, Pierre and Alex Jacquemin “A Note on Advertising Policy under Uncertainty
and Dynamic Conditions” Journal of Industrial Economics, Vol. 24, No. 1 (Sep., 1975), pp.
73‐78.
DiMasi, J.A. and Paquette, C. ʺThe Economics of Follow‐on Drug Research and
Development: Trends in Entry Rates and the Timing of Development.ʺ
Pharmacoeconomics, 22 no.s2 (2004): p. 1‐14.
Dorfman, Robert and Peter O. Steiner “Optimal Advertising and Optimal Quality”
American Economic Review, Vol. 44, No. 5 (Dec., 1954), pp. 826‐836.
Horowitz, Ira “A Note on Advertising and Uncertainty” Journal of Industrial Economics,
Vol. 18, No. 2 (Apr., 1970), pp. 151‐160.
Hurwitz, Mark A. and Richard E. Caves (1988), “Persuasion or Information? Promotion
and the Shares of Brand Name and Generic Pharmaceuticals,” Journal of Law and
Economics, vol.31, pp.299‐320.
Institute of Medicine. The Future Of Drug Safety: Promoting And Protecting The Health
Of The Public. Alina Baciu, Kathleen Stratton, Sheila P. Burke, Editors. The National
Academies Press: Washington, DC. 2007.
Iizuka, Toshiaki (2004). “What Explains the Use of Direct‐to‐Consumer Advertising of
Prescription Drugs?” Journal of Industrial Economics 52 (3): 349 ‐ 379.
28
Iizuka, Toshiaki, and Jin, Ginger Z. (2005). “The Effect of Prescription Drug Advertising
on Doctor Visits” Journal of Economics & Management Strategy 14 (3): 701 ‐ 727.
Jena, Anupam B., John E. Calfee, Edward C. Mansley, and Tomas J. Philipson (2009)
“‘Me‐Too’ Innovation in Pharmaceutical Markets” Forum for Health Economics & Policy:
Vol. 12(1): (Frontiers in Health Policy Research), Article 5.
Kenkel, Donald and Alan Mathios “Promotion to Physicians and Consumers.” In
Handbook on the Economics of the Bio‐pharmaceutical Industry, Patricia Danzon and
Sean Nicholson, Editors. Oxford University Press, 2011.
Kessler, D.A., Rose, J.L., Temple, R.J., Schapiro, R., and Griffin, J.P. (1994) ʺTherapeutic‐
Class Wars‐‐Drug Promotion in a Competitive Marketplace.ʺ New England Journal of
Medicine, 331 no. 20: pp. 1350‐1353.
Kim, Minki “Physician Learning and New Drug Diffusion” Working paper – University
of Chicago, 2011.
Lee, T.H. (2004) ʺʺMe‐Tooʺ Products‐‐Friend or Foe?ʺ New England Journal of Medicine,
350 no. 3: p. 211‐2.
Leffler, Keith (1981), “Persuasion or Information? The Economics of Prescription Drug
Advertising,”Journal of Law and Economics, vol.24, pp.45‐74.
Linnosmaa, Ismo Erkii (2008). “Advertising, Free‐Riding, and Price Differences in the
Market for Prescription Drugs.” B.E. Journal of Economic Analysis and Policy 8(2): Article 8.
Mayo Foundation for Medical Education and Research (MFMER) “Erectile dysfunction:
Viagra and other oral medications”. 2008.
Meyerhofer, Chad D and Samuel H Zuvekas (2008). “The Shape of Demand: What Does
It Tell Us about Direct‐to‐Consumer Marketing of Anti‐Depressants?” B.E. Journal of
Economic Analysis and Policy: Advances. 8 (2).
29
Narayanan, Sridhar and Puneet Manchanda (2009), “Heterogeneous Learning and the
Targeting of Marketing Communication for New Products,” Marketing Science, vol.
28(3), pp.424‐441.
Newey, Whitney K; West, Kenneth D (1987). ʺA Simple, Positive Semi‐definite,
Heteroskedasticity and Autocorrelation Consistent Covariance Matrixʺ. Econometrica 55
(3): 703–708.
Rosenthal, Meredith B., Ernst R. Berndt, Julie M. Donohue, Arnold M. Epstein, and
Richard G. Frank (2003) ʺDemand Effects of Recent Changes in Prescription Drug
Promotion,ʺ Forum for Health Economics & Policy: Vol. 6: (Frontiers in Health Policy
Research), Article 2.
Scherer, F.M., 2000. “The pharmaceutical industry.” In: Newhouse, J.P. (Ed.), Handbook
of Health Economics, vol. 1. Elsevier, Amsterdam, Chapter 25, pp. 1297–1336.
Towse, Adrian and Patricia Danzon ʺRegulation of the Pharmaceutical Industry.ʺ In
Handbook on Regulation, ed. Martin Cave. Oxford University Press. 2010.
Waldman, Don E. and Elizabeth J. Jensen (2007) Industrial Organization: Theory and
Practice, 3rd edition, Prentice Hall
30
Figure 1: Number of Prescriptions Filled by Drug by Quarter (2000 – 2008)
Thousands Dollars
31
Figure 2: Expenditure on DTCA and professional promotion by Drug by Quarter (2002‐2008)
Million Dollars
32
Figure 3: The Ratio of DTCA to Prescriptions (upper panel) and ratio of Professional promotion to Prescriptions (lower panel) by Drug and Quarter
33
Figure 4: Number of Reported Adverse Drug Events (upper panel) and number of Serious Drug Events (lower panel) by Drug and Year
34
Table 1, Summary Statistics
Viagra . Levitra . Cialis .
Mean Std. Dev Mean Std. Dev Mean Std. Dev
Monopoly (Dec. 2002‐July 2003)
Market share 100.00 0.00
Prescriptions (1000s) 1361.75 61.87
Share of all ADEs 100.00 0.00
Share of severe ADEs 100.00 0.00
Number of all ADEs 58.00 59.51
Number of severe ADEs 34.38 32.73
Current month spending on professional promotion, ($1,000,000) 15.84 2.19
Stock of spending on professional promotion, ($1,000,000) 147.12 7.87
Current month spending on DTCA, ($1,000,000) 3.70 0.69
Stock of spending on DTCA, ($1,000,000) 42.03 1.89
Competition (Aug. 2003‐Dec. 2008)
Market share 64.03 11.72 13.04 2.93 24.43 7.01
Prescriptions (1000s) 987.11 156.33 203.42 50.93 382.34 117.06
Share of all ADEs 52.81 13.29 23.69 12.50 24.64 8.57
Share of severe ADEs 53.45 18.70 20.37 15.71 27.44 14.01
Number of all ADEs 45.71 54.55 19.74 15.77 18.85 13.07
Number of severe ADEs 22.92 26.14 9.46 10.17 10.87 9.76
Current month spending on professional promotion, ($1,000,000) 11.79 3.47 5.63 2.32 6.67 2.69
Stock of spending on professional promotion, ($1,000,000) 136.56 31.12 57.79 20.47 66.56 23.55
Current month spending on DTCA, ($1,000,000) 4.06 2.34 3.15 2.64 4.74 3.20
Stock of spending on DTCA, ($1,000,000) 43.55 7.98 32.69 20.82 23.34 45.98
35
Table 2: Effects of Professional Promotion and DTCA on Viagra’s Market Share
(1) (2) (3)
Viagra current promotion 0.215 0.157 0.156
(4.94) (1.53) (1.82)
Viagra stock promotion 0.176 0.097 0.119
(5.21) (2.10) (2.46)
Levitra current promotion 0.018
(0.10)
Levitra stock promotion ‐0.144
(‐4.74)
Cialis current promotion ‐0.076
(‐0.62)
Cialis stock promotion ‐0.091
(‐3.79)
Levitra + Cialis current promotion ‐0.082
(‐0.85)
Levitra + Cialis stock promotion ‐0.077
(‐3.91)
Viagra current DTCA 0.044 0.043 0.057
(0.79) (0.55) (0.83)
Viagra stock DTCA 0.049 0.070 0.077
(2.47) (1.92) (2.73)
Levitra current DTCA 0.009
(0.16)
Levitra stock DTCA ‐0.058
(‐3.03)
Cialis current DTCA 0.053
(0.57)
Cialis stock DTCA ‐0.013
(‐0.45)
Levitra + Cialis current DTCA 0.026
(0.55)
Levitra + Cialis stock DTCA 0.007
(0.27) Note: T‐statistics in parentheses. Standard errors adjusted for heteroskedasticity and autocorrelation with three lags according to Newey‐West. All models include month and year effects. N=62.
36
Table 3: Effects of Professional Promotion and DTCA on Viagra’s Share of Reported Adverse Drug Events
All ADEs Severe ADEs
(1) (2) (3) (4) (5) (6)
Viagra current promotion 1.929 1.179 1.377 3.232 1.707 2.054
(1.89) (1.06) (1.17) (2.32) (1.01) (1.13)
Viagra stock promotion ‐0.051 ‐0.225 ‐0.361 ‐0.173 ‐0.651 ‐0.826
(‐0.15) (‐0.72) (‐0.80) (‐0.32) (‐1.76) (‐1.32)
Levitra current promotion 1.946 3.278
(1.43) (1.49)
Levitra stock promotion 0.961 1.797
(3.95) (4.46)
Cialis current promotion 0.689 1.435
(1.08) (1.67)
Cialis stock promotion ‐0.261 ‐0.480
(‐1.71) (‐2.29)
Levitra + Cialis current promotion 0.798 1.627
(1.46) (2.23)
Levitra + Cialis stock promotion ‐0.032 ‐0.086
(‐0.18) (‐0.28)
Viagra current DTCA 0.487 1.304 0.698 0.954 2.725 1.489
(0.77) (1.92) (0.95) (1.12) (2.20) (0.95)
Viagra stock DTCA 0.876 1.336 0.904 1.318 2.254 1.428
(5.09) (4.26) (2.76) (4.08) (5.81) (2.52)
Levitra current DTCA 0.340 ‐0.179
(0.33) (‐0.11)
Levitra stock DTCA ‐0.632 ‐1.200
(‐3.19) (‐3.36)
Cialis current DTCA 0.058 ‐0.103
(0.08) (‐0.11)
Cialis stock DTCA 0.563 1.123
(2.53) (4.12)
Levitra + Cialis current DTCA 0.170 ‐0.059
(0.27) (‐0.07)
Levitra + Cialis stock DTCA 0.176 0.384
(0.72) (0.99) Note: T‐statistics in parentheses. Standard errors adjusted for heteroskedasticity and autocorrelation with three lags according to Newey‐West. All models include month and year effects. N=62.
37
Table 4: Effects of Professional Promotion and DTCA on Viagra’s Number of Reported All Types of Adverse Drug Events
(1) (2) (3) (4) (5) (6) (7) (8) (9)
Viagra current promotion 7.720 3.309 4.816 5.008 0.601 2.240 5.607 0.858 2.575
(2.36) (1.50) (1.78) (1.64) (0.36) (1.15) (1.68) (0.47) (1.17)
Viagra current promotion ‐5.511 ‐0.046 ‐1.476
* monopoly time period (‐1.32) (‐0.02) (‐0.55)
Viagra current promotion ‐51.704 11.389 22.246
* Levitra time period (‐1.04) (0.87) (1.40)
Viagra stock promotion 2.373 0.610 0.756 1.268 ‐0.351 0.165 1.345 0.044 0.253
(1.95) (0.66) (0.68) (1.45) (‐1.50) (0.34) (1.23) (0.07) (0.33)
Levitra current ‐9.768 ‐4.654 ‐9.753
promotion (‐1.15) (‐1.40) (‐1.26)
Levitra stock promotion ‐0.143 ‐0.506 ‐0.811
(‐0.16) (‐0.75) (‐0.98)
Cialis current promotion 2.235 1.878 2.132
(1.42) (1.64) (1.45)
Cialis stock promotion ‐1.378 ‐1.425 ‐1.431
(‐2.29) (‐2.49) (‐2.37)
Levitra + Cialis current 2.101 0.533 1.635
promotion (1.58) (0.49) (1.25)
Levitra + Cialis stock ‐1.069 ‐1.379 ‐1.306
promotion (‐1.46) (‐1.88) (‐1.75)
Viagra current DTCA 1.269 4.390 3.310 0.639 3.698 2.426 0.606 3.737 2.678
(0.74) (1.66) (1.27) (0.37) (1.75) (1.06) (0.33) (1.69) (1.10)
Viagra current DTCA 9.793 6.810 13.417
* monopoly time period (0.83) (0.64) (1.39)
Viagra current DTCA 157.25 ‐33.72 ‐67.98
* Levitra time period (1.02) (‐0.88) (‐1.43)
Viagra stock DTCA 0.840 2.765 2.118 0.704 2.609 1.980 0.714 2.595 2.040
(1.07) (2.25) (1.42) (0.72) (2.15) (1.31) (0.74) (2.12) (1.31)
Levitra current DTCA 0.641 1.162 1.057
(0.29) (0.56) (0.51)
Levitra stock DTCA ‐0.952 ‐0.275 ‐0.192
(‐1.13) (‐0.41) (‐0.27)
Cialis current DTCA ‐3.280 ‐3.072 ‐3.189
(‐2.10) (‐2.64) (‐2.44)
Cialis stock DTCA 2.367 2.768 2.635
(2.69) (3.05) (2.98)
Levitra + Cialis current ‐1.443 ‐1.865 ‐1.687
DTCA (‐0.76) (‐1.18) (‐1.05)
Levitra + Cialis stock 1.282 1.684 1.615
DTCA (1.55) (2.05) (1.94)
Viagra Prescriptions ‐0.180 0.053 ‐0.192 ‐0.173 0.219 ‐0.024 ‐0.163 0.172 ‐0.076
(‐1.86) (0.42) (‐1.28) (‐1.57) (2.24) (‐0.21) (‐1.51) (1.44) (‐0.57)
N 62 62 62 73 73 73 73 73 73 Note: T‐statistics in parentheses. Standard errors adjusted for heteroskedasticity and autocorrelation with three lags according to Newey‐West. All models include month and year effects.

38
Appendix
[1.1] Monopoly – No uncertainty
AAPQCAPQP )),((),(
F.O.C w.r.t A
A
QMCP
QP
A
QP
AA
QMCP
A
Q
Q
QC
A
QP
A
)(
)(1
01)(
Leads to the usual Dorfman & Steiner (1953) rule
Q
A
A
Q
P
MCP
QP
A
[2.2] Monopoly – with uncertainty (A is sunk)
AAPQCAPQPAwE )),((),()(1
F.O.C w.r.t A
)(1
)(
)(
)(11
)(
)(1
)(
)(1)(
)()(11
01)()(
1
MCP
P
P
ACPA
A
w
Q
A
A
Qw
P
MCP
QP
A
MCP
MCP
P
P
P
ACA
A
w
Q
A
A
Qw
P
MCP
QP
A
PQ
QC
A
wA
A
wA
A
Qw
Q
A
P
MCP
QP
A
QCA
w
PQ
AQP
A
w
PQ
A
A
Qw
Q
A
P
MCP
QP
A
QCQPA
w
A
QMCPw
QCQPA
w
A
Q
Q
QC
A
QPw
A
E

39
Leads to the modified Dorfman & Steiner rule
MCP
ACP
w
A
A
ww
Q
A
A
Qw
P
MCP
QP
A)1(
or
MCP
ACP
w
A
A
w
w
w
Q
A
A
Q
P
MCP
QPw
A
1)1(
or
P
ACP
w
A
A
w
w
w
Q
A
A
Q
P
MCP
QPw
A
1)1(
Advertising‐to‐expected sales ratio [3.1] Duopoly – No uncertainty & AK is also chosen strategically
KKKK AAPqCAPqP )),((),(
F.O.C w.r.t AK
A
mQ
A
Qm
A
Qm
A
q
MCP
A
q
q
qC
A
qP
A
KK
KK
K
K
KKK
1
01)(
Note, we can rewrite A
mK
as K
G
G
K
K
K
A
A
A
m
A
m
K
G
G
K
K
KK
KK
A
A
A
m
A
mQ
A
QmMCP
A
QmMCP
A
qMCP )()()(1
By multiplying by K
K
qP
A
K
G
G
K
K
K
K
K
K
KK
K
K
K
G
G
K
K
K
K
K
K
KK
K
K
K
K
A
A
A
m
m
A
A
m
m
A
Q
A
A
Q
P
MCP
qP
A
A
A
A
mQ
qP
A
A
mQ
qP
A
A
Q
Q
q
qP
A
P
MCP
qP
A
)(
)(
Leads to the Dorfman & Steiner rule a la Waldman & Jensen (2001)
G
K
K
G
K
G
G
K
K
K
K
KK
K
K
A
A
A
A
m
A
A
m
m
A
A
m
A
A
Q
A
A
Q
P
MCP
qP
A

40
[4.1] Duopoly – with uncertainty & AK is also chosen strategically (A is sunk)
KKKK AAPqCAPqPAwE )),((),())(1(
F.O.C w.r.t AK
MCP
ACP
w
w
PA
A
A
A
w
A
A
w
w
A
A
w
A
A
A
A
m
A
A
m
m
A
A
m
Q
A
A
Q
P
MCPw
qP
A
MCPw
CqP
A
A
A
w
A
w
A
A
A
m
A
mQ
A
QmMCPw
CqPMCPw
MCPw
A
A
A
w
A
wMCP
A
A
A
m
A
mQ
A
Qmw
CqPA
wMCP
A
mQ
A
Qmw
CqPA
wMCP
A
Qmw
CqPA
wMCP
A
qw
APqCAPqPA
w
A
q
q
qC
A
qPAw
A
E
G
K
K
GG
G
K
KG
K
K
G
K
G
G
K
K
K
K
KK
K
K
K
K
G
GKK
G
G
K
K
KK
KK
G
GKK
G
G
K
K
KK
KK
K
KK
KK
KKKKK
K
KKK
)1(
1)1(
)1()1(1
)1(
)1()1(1
)1(1
)1(1
)1(1
01)),((),()(
))(1(
or
MCP
ACP
w
w
PA
A
A
A
w
A
A
w
w
A
A
w
A
A
A
A
m
A
A
m
m
A
A
m
Q
A
A
Q
P
MCPw
qP
A
G
K
K
GG
G
K
KG
K
K
G
K
G
G
K
K
K
K
KK
K
K
)1(
1)1(
Modified solution
P
ACP
A
A
A
A
w
A
A
w
w
A
A
w
w
w
A
A
A
A
m
A
A
m
m
A
A
m
A
A
Q
A
A
Q
P
MCP
qPw
A
G
K
K
GG
G
K
KG
K
K
G
K
G
G
K
K
K
K
KK
K
K
)1()1(