Embed Size (px)
Citation preview
SIMILARITY & DIVERSITY SIMILARITY & DIVERSITY SEARCHING OF CHEMICAL SEARCHING OF CHEMICAL DATABASESDATABASES
Naomie SalimNaomie Salim
Universiti Teknologi MalaysiaUniversiti Teknologi Malaysia
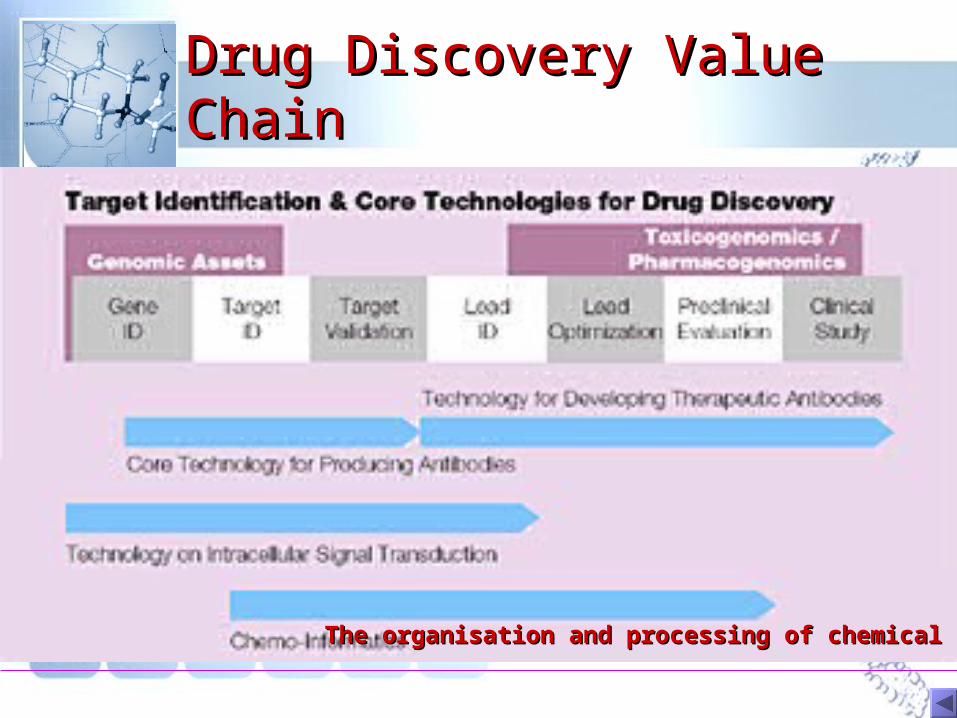
Drug Discovery Value Drug Discovery Value ChainChain
The organisation and processing of chemical dataThe organisation and processing of chemical data
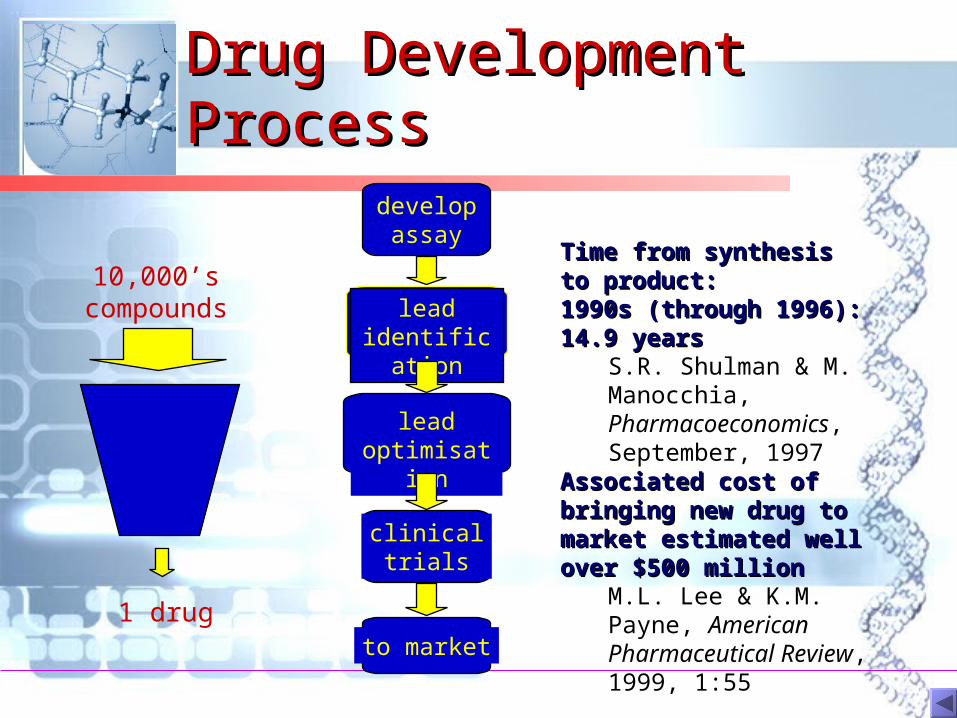
Drug Development Drug Development ProcessProcess
Time from synthesis to Time from synthesis to product: product: 1990s (through 1996): 14.9 1990s (through 1996): 14.9 yearsyears
S.R. Shulman & M. Manocchia, Pharmacoeconomics, September, 1997
Associated cost of bringing Associated cost of bringing new drug to market estimated new drug to market estimated well over $500 millionwell over $500 million
M.L. Lee & K.M. Payne, American Pharmaceutical Review, 1999, 1:55
developassay
leadoptimisation
leadidentification
clinicaltrials
to market
10,000’scompounds
1 drug
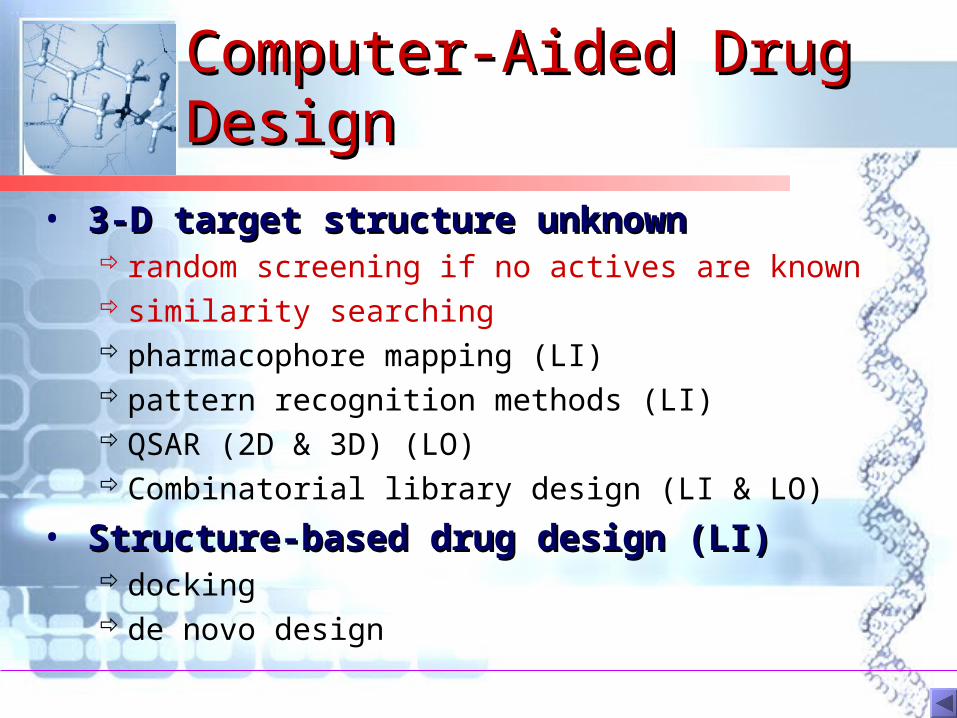
Computer-Aided Drug Computer-Aided Drug DesignDesign
• 3-D target structure unknown3-D target structure unknown random screening if no actives are known similarity searching pharmacophore mapping (LI) pattern recognition methods (LI) QSAR (2D & 3D) (LO) Combinatorial library design (LI & LO)
• Structure-based drug design (LI)Structure-based drug design (LI) docking de novo design
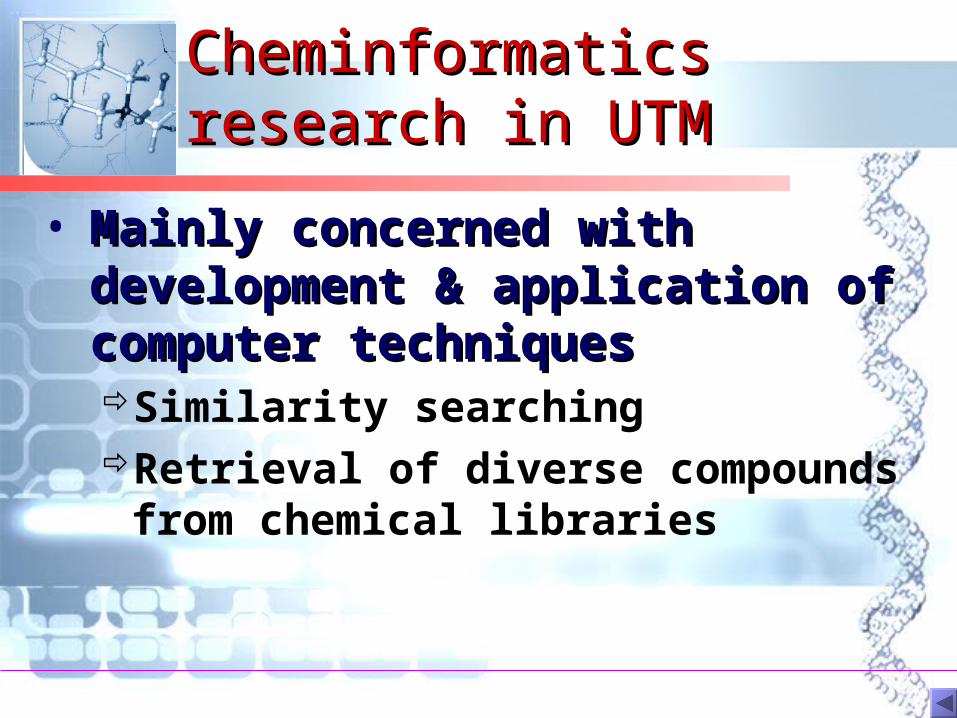
Cheminformatics Cheminformatics research in UTMresearch in UTM
• Mainly concerned with Mainly concerned with development & application of development & application of computer techniques computer techniques Similarity searchingRetrieval of diverse compounds
from chemical libraries
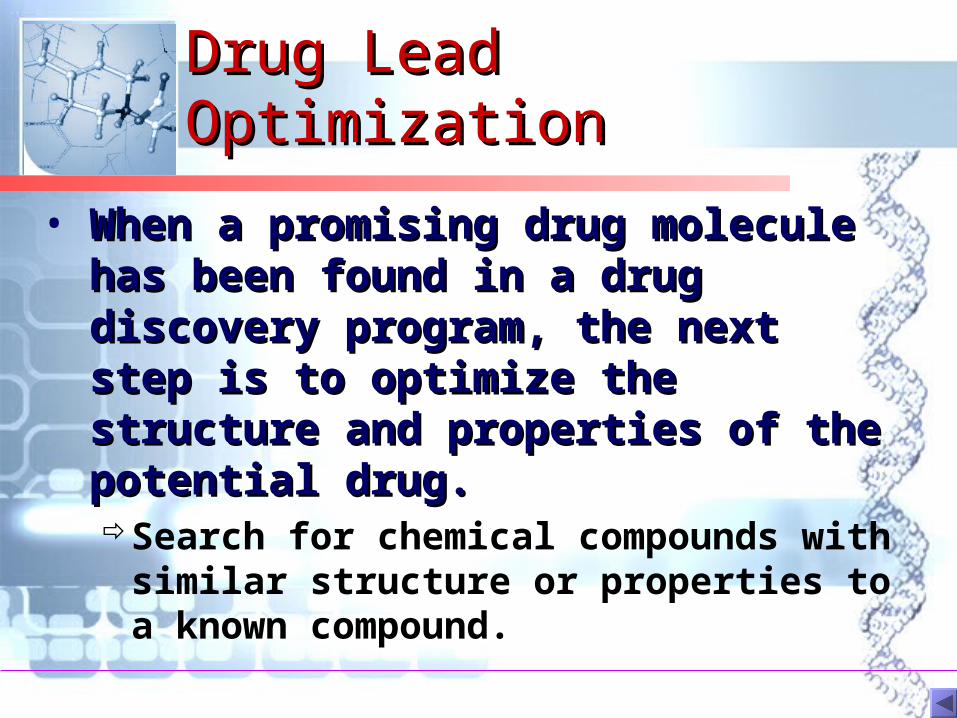
Drug Lead OptimizationDrug Lead Optimization
• When a promising drug molecule When a promising drug molecule has been found in a drug has been found in a drug discovery program, the next step discovery program, the next step is to optimize the structure and is to optimize the structure and properties of the potential drug. properties of the potential drug. Search for chemical compounds
with similar structure or properties to a known compound.
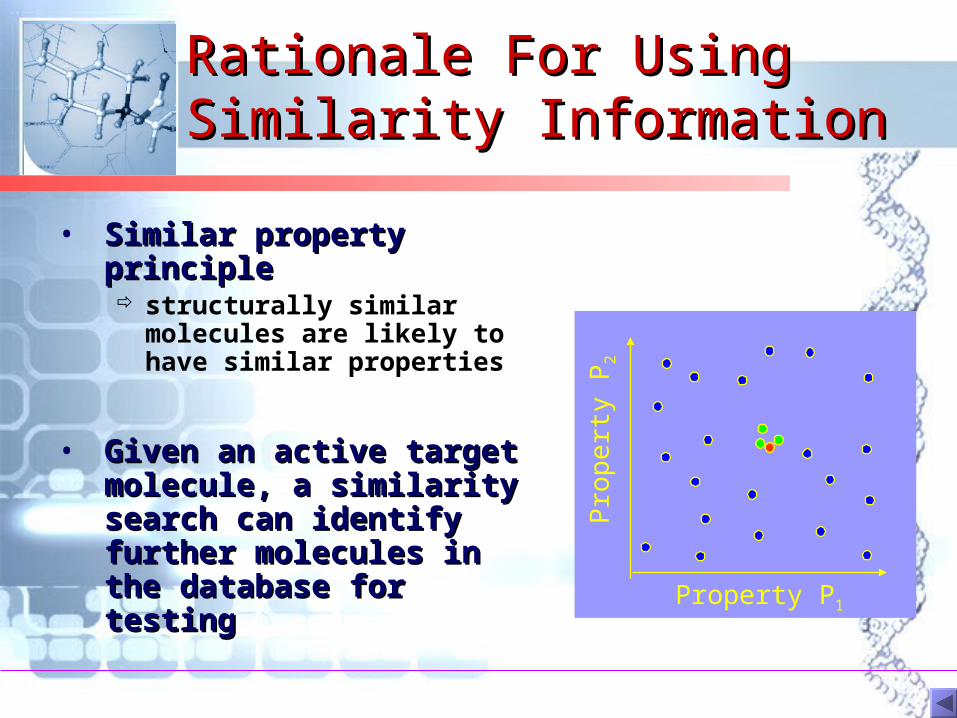
• Similar property Similar property principleprinciple structurally similar
molecules are likely to have similar properties
• Given an active target Given an active target molecule, a similarity molecule, a similarity search can identify search can identify further molecules in further molecules in the database for the database for testingtesting
Rationale For Using Rationale For Using Similarity InformationSimilarity Information
Property P1P
rope
rty
P2
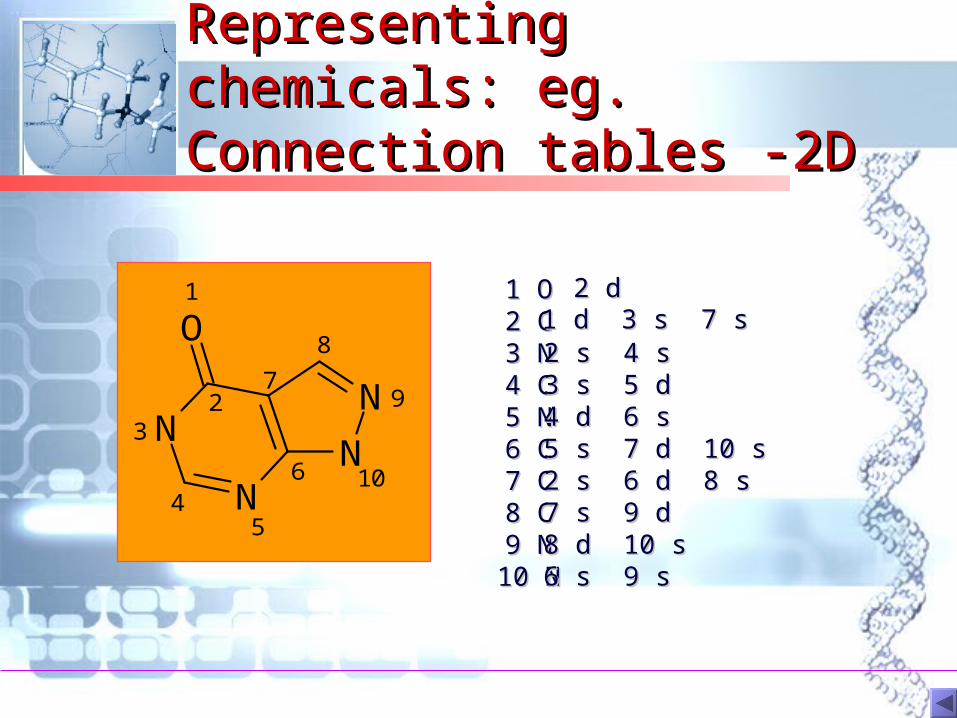
Representing chemicals: Representing chemicals: eg. Connection tables -2Deg. Connection tables -2D
N
NN
N
O1
23
45
6
7
8
9
10
1 O1 O2 C2 C3 N3 N4 C4 C5 N5 N6 C6 C7 C7 C8 C8 C9 N9 N
10 N10 N
2 d2 d1 d 3 s 7 s1 d 3 s 7 s2 s 4 s2 s 4 s3 s 5 d3 s 5 d4 d 6 s4 d 6 s5 s 7 d 10 s5 s 7 d 10 s2 s 6 d 8 s2 s 6 d 8 s7 s 9 d7 s 9 d8 d 10 s8 d 10 s6 s 9 s6 s 9 s
Bit string similarity Bit string similarity measuremeasure
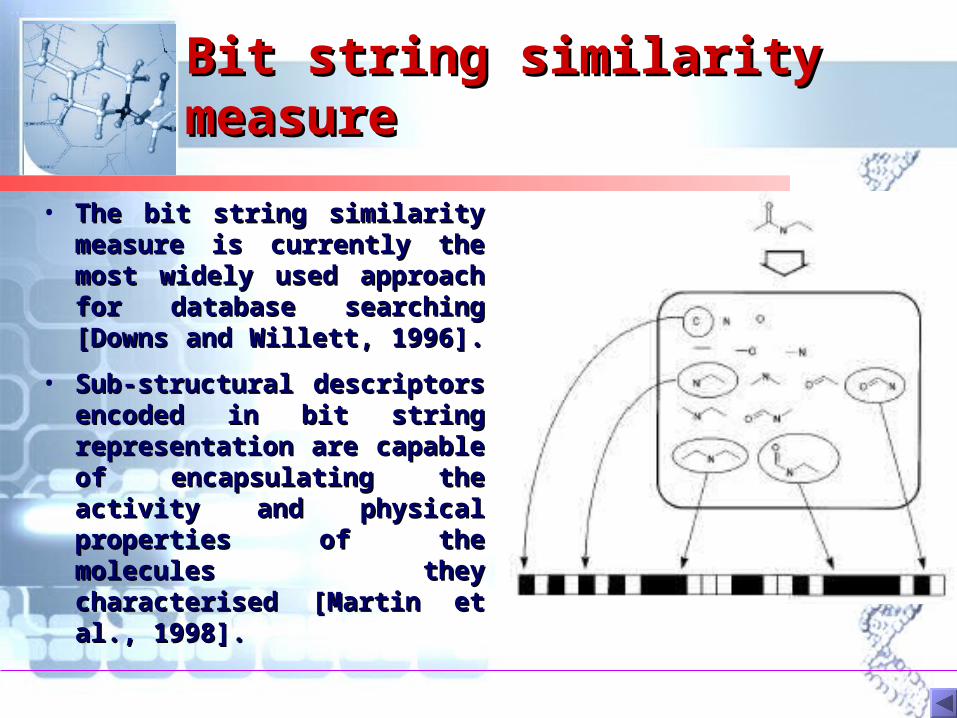
• The bit string similarity The bit string similarity measure is currently the measure is currently the most widely used approach most widely used approach for database searching for database searching [Downs and Willett, 1996]. [Downs and Willett, 1996].
• Sub-structural descriptors Sub-structural descriptors encoded in bit string encoded in bit string representation are capable representation are capable of encapsulating the of encapsulating the activity and physical activity and physical properties of the properties of the molecules they molecules they characterised [Martin et characterised [Martin et al., 1998]. al., 1998].
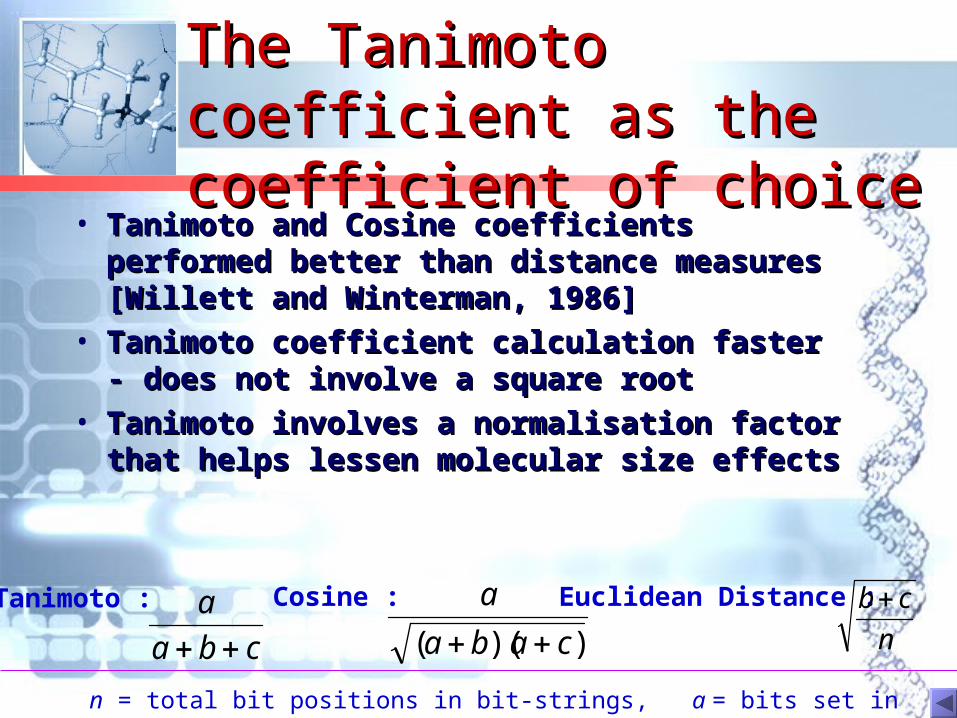
The Tanimoto coefficient The Tanimoto coefficient as the coefficient of choiceas the coefficient of choice
• Tanimoto and Cosine coefficients Tanimoto and Cosine coefficients performed better than distance measures performed better than distance measures [Willett and Winterman, 1986][Willett and Winterman, 1986]
• Tanimoto coefficient calculation faster - Tanimoto coefficient calculation faster - does not involve a square rootdoes not involve a square root
• Tanimoto involves a normalisation factor Tanimoto involves a normalisation factor that helps lessen molecular size effectsthat helps lessen molecular size effects
cba
a
))(( caba
a
Tanimoto : Cosine : Euclidean Distance :
n
cbEuc
1
n = total bit positions in bit-strings, a = bits set in both, b ,c = bits set in only one
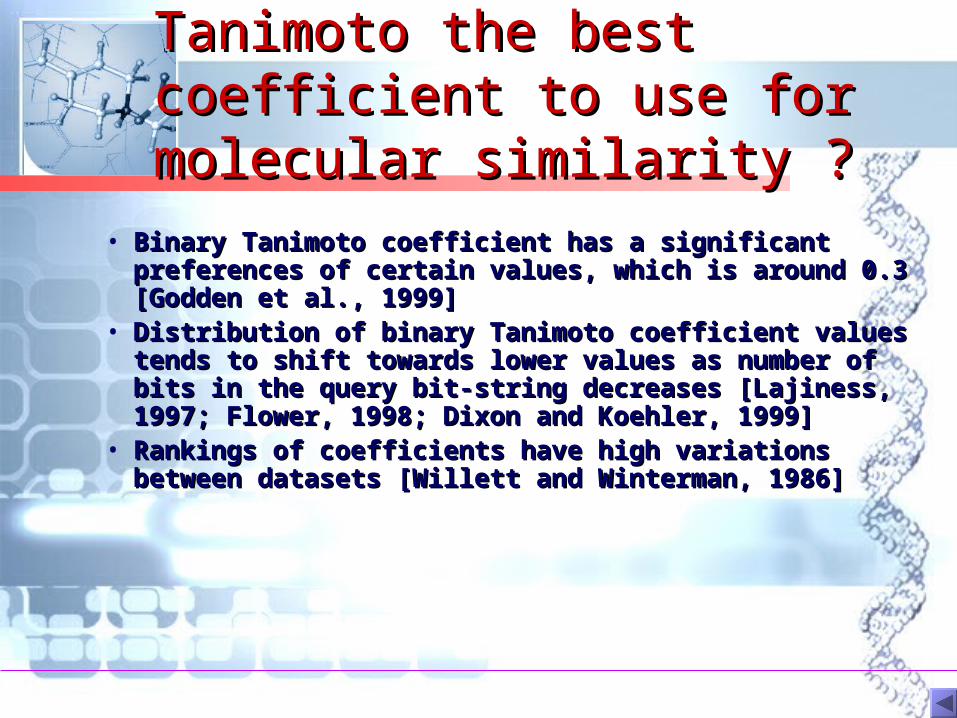
Tanimoto the best Tanimoto the best coefficient to use for coefficient to use for molecular similarity ?molecular similarity ?
• Binary Tanimoto coefficient has a significant Binary Tanimoto coefficient has a significant preferences of certain values, which is around 0.3 preferences of certain values, which is around 0.3 [Godden et al., 1999][Godden et al., 1999]
• Distribution of binary Tanimoto coefficient values Distribution of binary Tanimoto coefficient values tends to shift towards lower values as number of tends to shift towards lower values as number of bits in the query bit-string decreases [bits in the query bit-string decreases [Lajiness, Lajiness, 1997;1997; Flower, 1998; Flower, 1998; Dixon and Koehler, 1999Dixon and Koehler, 1999] ]
• Rankings of coefficients have high variations Rankings of coefficients have high variations between datasets [Willett and Winterman, 1986]between datasets [Willett and Winterman, 1986]
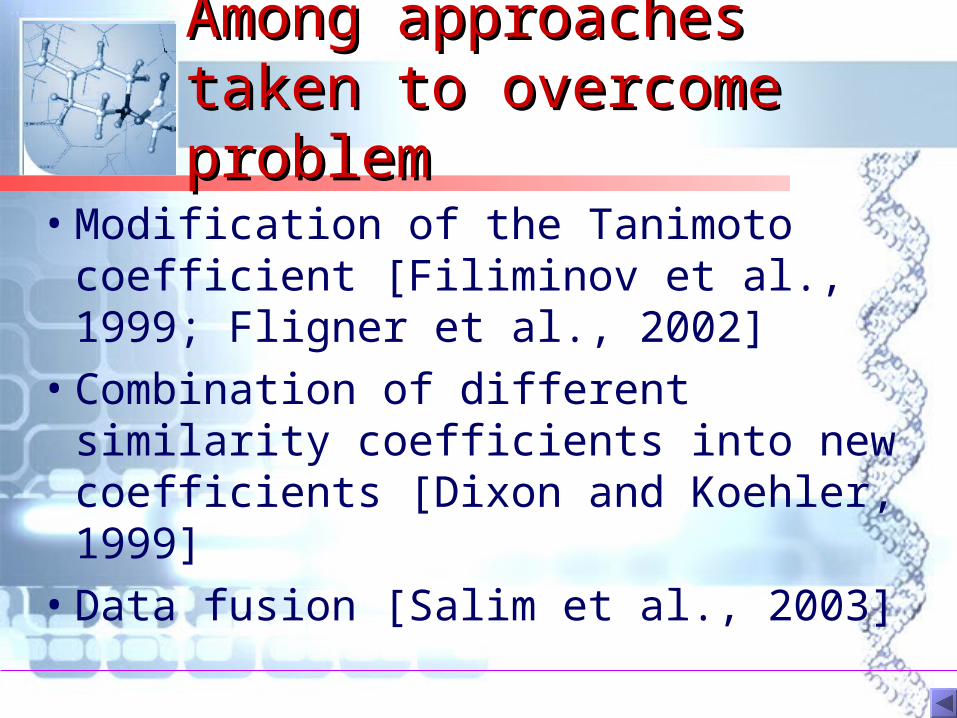
Among approaches Among approaches taken to overcome taken to overcome problemproblem
• Modification of the Tanimoto coefficient [Filiminov et al., 1999; Fligner et al., 2002]
• Combination of different similarity coefficients into new coefficients [Dixon and Koehler, 1999]
• Data fusion [Salim et al., 2003]
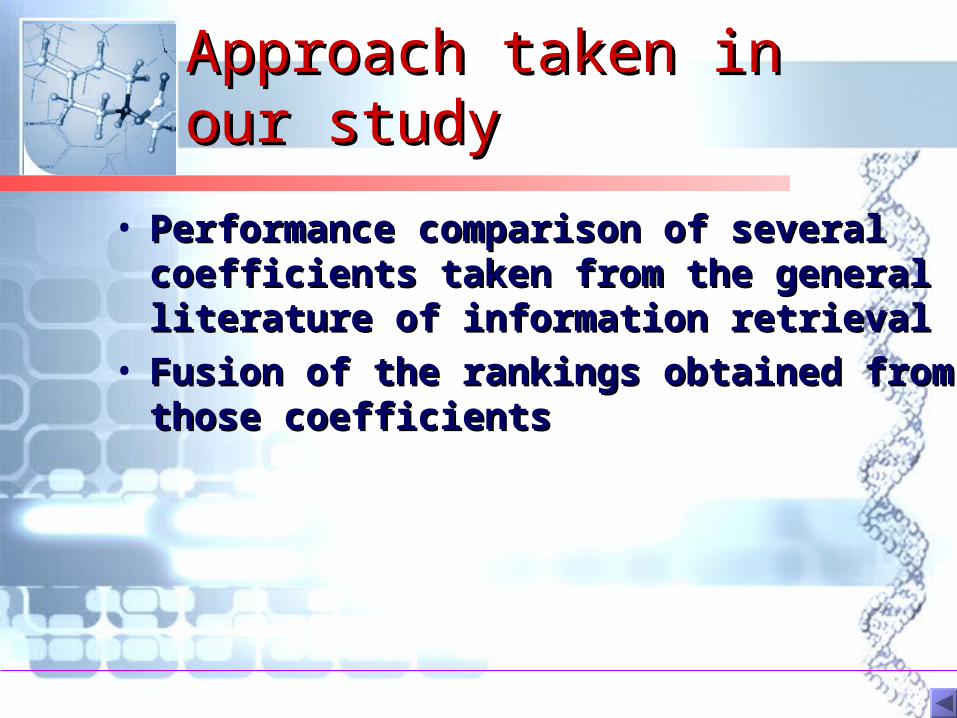
Approach taken in our Approach taken in our studystudy
• Performance comparison of several Performance comparison of several coefficients taken from the general coefficients taken from the general literature of information retrievalliterature of information retrieval
• Fusion of the rankings obtained from Fusion of the rankings obtained from those coefficientsthose coefficients
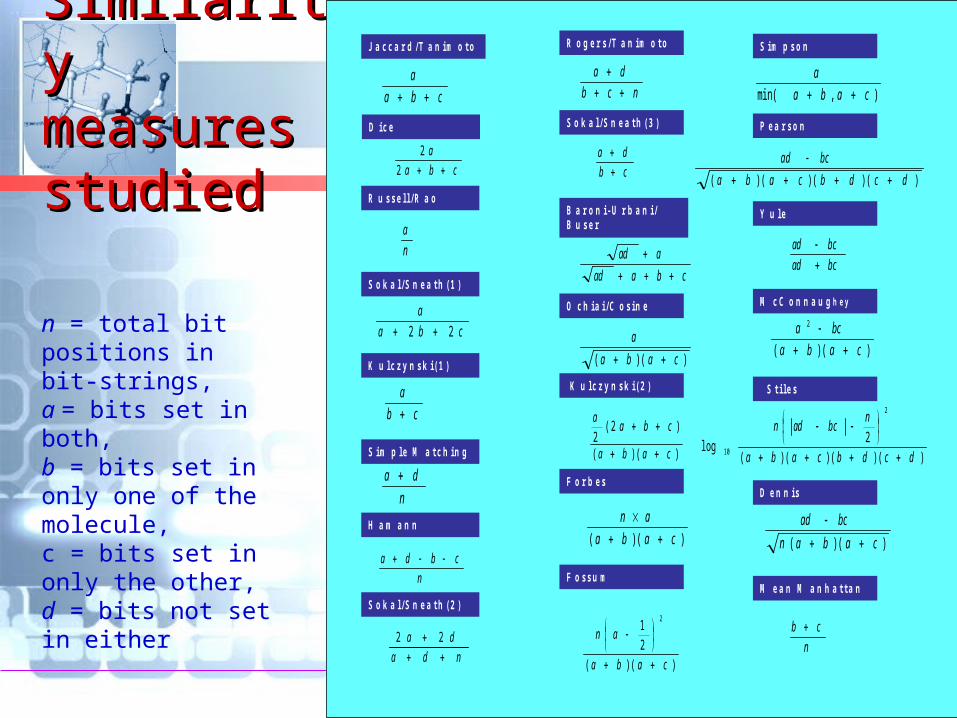
Similarity Similarity measures measures studiedstudied
n = total bit positions in bit-strings, a = bits set in both, b = bits set in only one of the molecule,c = bits set in only the other,d = bits not set in either
ncb
da
cb
da
cbaad
aad
))(( caba
a
))((
)2(2
caba
cbaa
))(( caba
an
))((
2
12
caba
an
),min( caba
a
))()()(( dcdbcaba
bcad
bcad
bcad
))((
2
caba
bca
))()()((2
log
2
10 dcdbcaba
nbcadn
))(( caban
bcad
n
cb
S i m p s o n
P e a r s o n
Y u l e
M c C o n n a u g h e y
S t i l e s
D e n n i s
M e a n M a n h a t t a n
cba
a
cba
a
2
2
n
a
cba
a
22
cb
a
n
da
n
cbda
nda
da
22
J a c c a r d / T a n i m o t oo
D i c e
R u s s e l l / R a o
S o k a l / S n e a t h ( 1 )
K u l c z y n s k i ( 1 )
S i m p l e M a t c h i n g
H a m a n n
S o k a l / S n e a t h ( 2 )
R o g e r s / T a n i m o t o
S o k a l / S n e a t h ( 3 )
B a r o n i - U r b a n i / B u s e r
O c h i a i / C o s i n e
K u l c z y n s k i ( 2 )
F o r b e s
F o s s u m
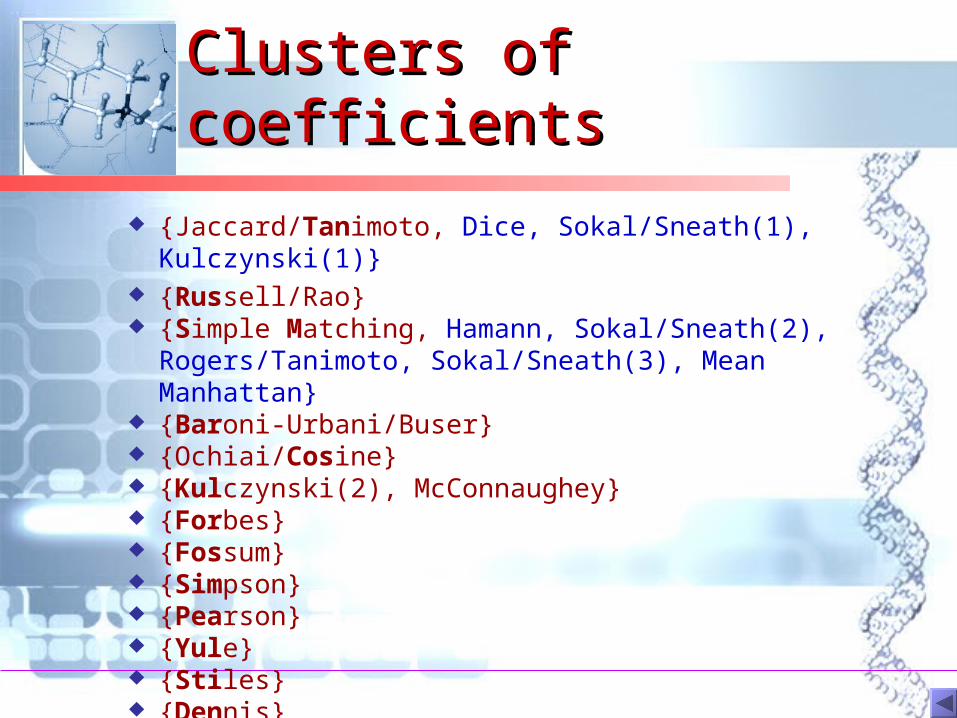
Clusters of coefficientsClusters of coefficients
{Jaccard/Tanimoto, Dice, Sokal/Sneath(1), Kulczynski(1)} {Russell/Rao} {Simple Matching, Hamann, Sokal/Sneath(2), Rogers/Tanimoto,
Sokal/Sneath(3), Mean Manhattan} {Baroni-Urbani/Buser} {Ochiai/Cosine} {Kulczynski(2), McConnaughey} {Forbes} {Fossum} {Simpson} {Pearson} {Yule} {Stiles} {Dennis}
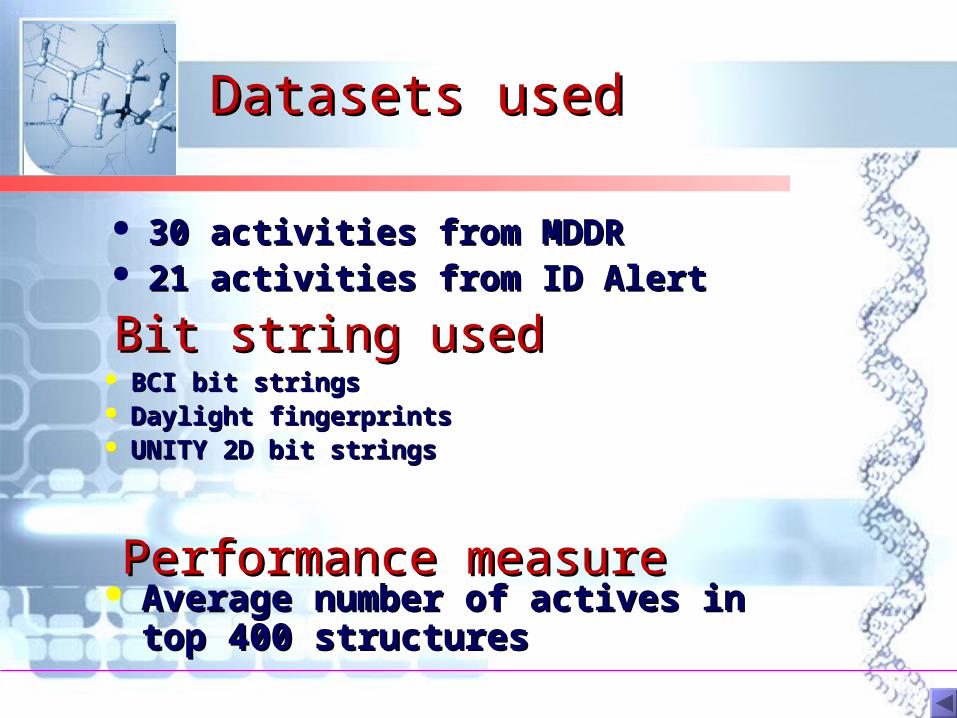
Datasets usedDatasets used
30 activities from MDDR 30 activities from MDDR 21 activities from ID Alert21 activities from ID Alert
Bit string usedBit string used BCI bit stringsBCI bit strings Daylight fingerprintsDaylight fingerprints UNITY 2D bit stringsUNITY 2D bit strings
Performance measurePerformance measure Average number of actives in Average number of actives in
top 400 structurestop 400 structures

What coefficient is What coefficient is the best for similarity the best for similarity searching ?searching ?
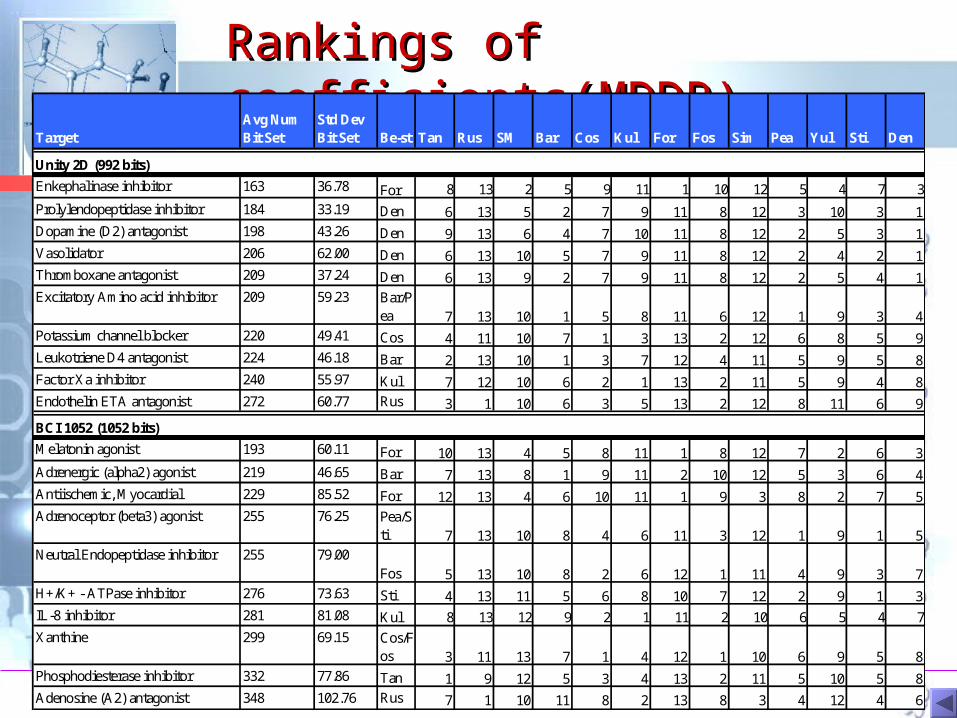
Rankings of Rankings of coefficients(MDDR) coefficients(MDDR)
TargetAvg Num Bit Set
Std Dev Bit Set Be-st Tan Rus SM Bar Cos Kul For Fos Sim Pea Yul Sti Den
Unity 2D (992 bits)
Enkephalinase inhibitor 163 36.78 For 8 13 2 5 9 11 1 10 12 5 4 7 3
Prolylendopeptidase inhibitor 184 33.19 Den 6 13 5 2 7 9 11 8 12 3 10 3 1Dopamine (D2) antagonist 198 43.26 Den 9 13 6 4 7 10 11 8 12 2 5 3 1Vasolidator 206 62.00 Den 6 13 10 5 7 9 11 8 12 2 4 2 1Thromboxane antagonist 209 37.24 Den 6 13 9 2 7 9 11 8 12 2 5 4 1Excitatory Amino acid inhibitor 209 59.23 Bar/P
ea 7 13 10 1 5 8 11 6 12 1 9 3 4Potassium channel blocker 220 49.41 Cos 4 11 10 7 1 3 13 2 12 6 8 5 9Leukotriene D4 antagonist 224 46.18 Bar 2 13 10 1 3 7 12 4 11 5 9 5 8Factor Xa inhibitor 240 55.97 Kul 7 12 10 6 2 1 13 2 11 5 9 4 8Endothelin ETA antagonist 272 60.77 Rus 3 1 10 6 3 5 13 2 12 8 11 6 9
BCI 1052 (1052 bits)
Melatonin agonist 193 60.11 For 10 13 4 5 8 11 1 8 12 7 2 6 3Adrenergic (alpha2) agonist 219 46.65 Bar 7 13 8 1 9 11 2 10 12 5 3 6 4Antiischemic, Myocardial 229 85.52 For 12 13 4 6 10 11 1 9 3 8 2 7 5Adrenoceptor (beta3) agonist 255 76.25 Pea/S
ti 7 13 10 8 4 6 11 3 12 1 9 1 5Neutral Endopeptidase inhibitor 255 79.00
Fos 5 13 10 8 2 6 12 1 11 4 9 3 7H+/K+ - ATPase inhibitor 276 73.63 Sti 4 13 11 5 6 8 10 7 12 2 9 1 3IL-8 inhibitor 281 81.08 Kul 8 13 12 9 2 1 11 2 10 6 5 4 7
Xanthine 299 69.15 Cos/Fos 3 11 13 7 1 4 12 1 10 6 9 5 8
Phosphodiesterase inhibitor 332 77.86 Tan 1 9 12 5 3 4 13 2 11 5 10 5 8Adenosine (A2) antagonist 348 102.76 Rus 7 1 10 11 8 2 13 8 3 4 12 4 6
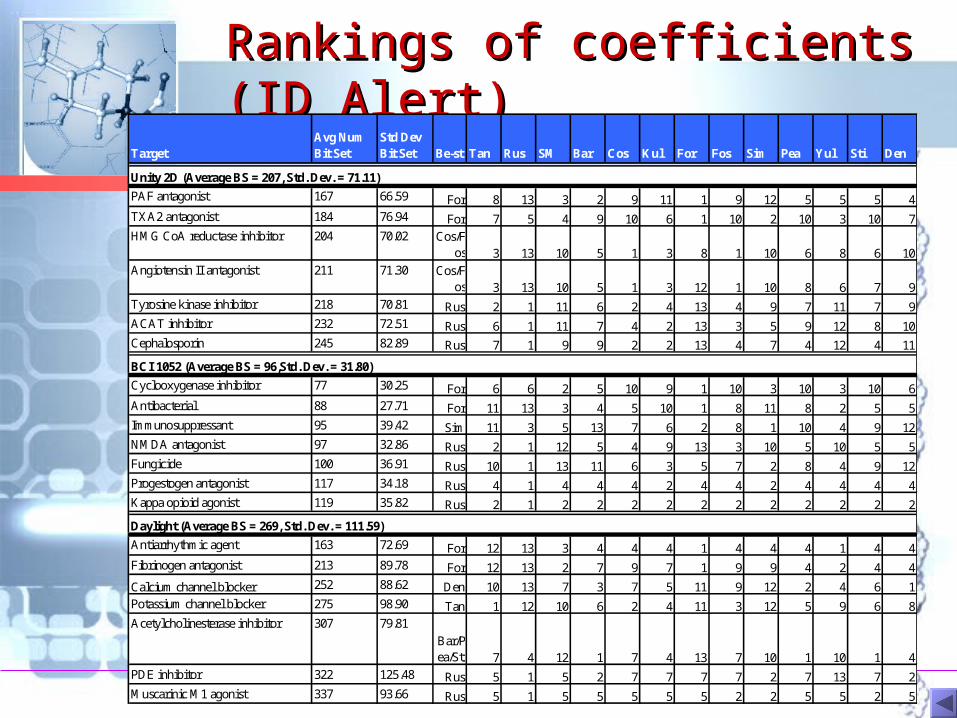
Rankings of coefficients (ID Rankings of coefficients (ID Alert) Alert)
TargetAvg Num Bit Set
Std Dev Bit Set Be-st Tan Rus SM Bar Cos Kul For Fos Sim Pea Yul Sti Den
Unity 2D (Average BS = 207, Std. Dev. = 71.11)
PAF antagonist 167 66.59 For 8 13 3 2 9 11 1 9 12 5 5 5 4TXA2 antagonist 184 76.94 For 7 5 4 9 10 6 1 10 2 10 3 10 7HMG CoA reductase inhibitor 204 70.02 Cos/F
os 3 13 10 5 1 3 8 1 10 6 8 6 10Angiotensin II antagonist 211 71.30 Cos/F
os 3 13 10 5 1 3 12 1 10 8 6 7 9Tyrosine kinase inhibitor 218 70.81 Rus 2 1 11 6 2 4 13 4 9 7 11 7 9ACAT inhibitor 232 72.51 Rus 6 1 11 7 4 2 13 3 5 9 12 8 10Cephalosporin 245 82.89 Rus 7 1 9 9 2 2 13 4 7 4 12 4 11
BCI 1052 (Average BS = 96,Std. Dev. = 31.80)
Cyclooxygenase inhibitor 77 30.25 For 6 6 2 5 10 9 1 10 3 10 3 10 6Antibacterial 88 27.71 For 11 13 3 4 5 10 1 8 11 8 2 5 5Immunosuppressant 95 39.42 Sim 11 3 5 13 7 6 2 8 1 10 4 9 12NMDA antagonist 97 32.86 Rus 2 1 12 5 4 9 13 3 10 5 10 5 5Fungicide 100 36.91 Rus 10 1 13 11 6 3 5 7 2 8 4 9 12Progestogen antagonist 117 34.18 Rus 4 1 4 4 4 2 4 4 2 4 4 4 4Kappa opioid agonist 119 35.82 Rus 2 1 2 2 2 2 2 2 2 2 2 2 2
Daylight (Average BS = 269, Std. Dev. = 111.59)
Antiarrhythmic agent 163 72.69 For 12 13 3 4 4 4 1 4 4 4 1 4 4Fibrinogen antagonist 213 89.78 For 12 13 2 7 9 7 1 9 9 4 2 4 4
Calcium channel blocker 252 88.62 Den 10 13 7 3 7 5 11 9 12 2 4 6 1Potassium channel blocker 275 98.90 Tan 1 12 10 6 2 4 11 3 12 5 9 6 8Acetylcholinesterase inhibitor 307 79.81
Bar/Pea/Sti 7 4 12 1 7 4 13 7 10 1 10 1 4
PDE inhibitor 322 125.48 Rus 5 1 5 2 7 7 7 7 2 7 13 7 2Muscarinic M1 agonist 337 93.66 Rus 5 1 5 5 5 5 5 2 2 5 5 2 5
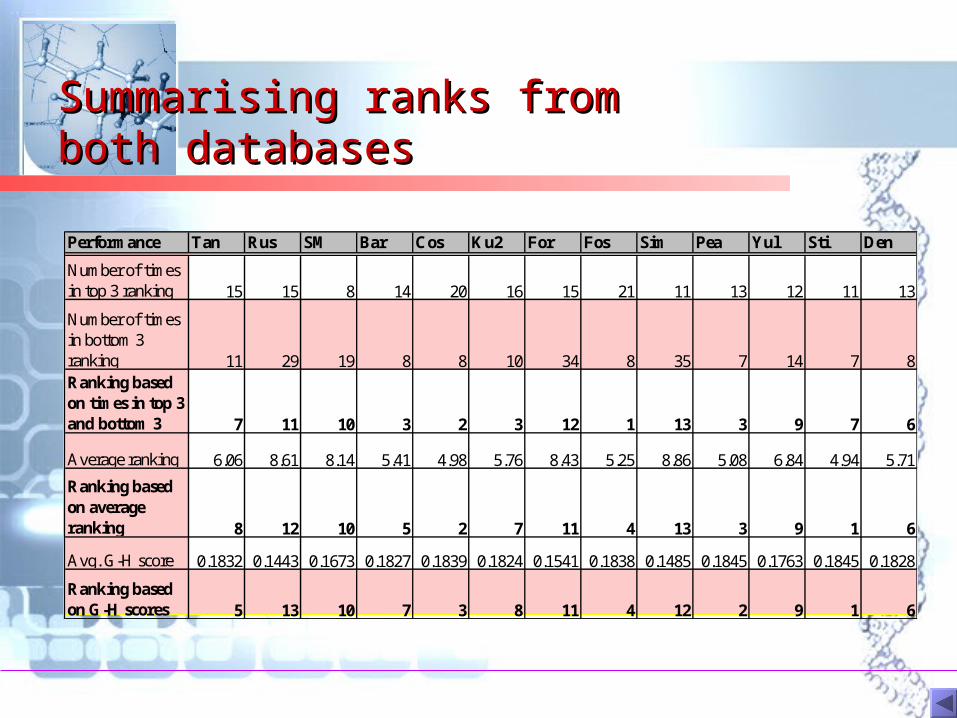
Summarising ranks from Summarising ranks from both databasesboth databases
Performance Tan Rus SM Bar Cos Ku2 For Fos Sim Pea Yul Sti Den
Number of times in top 3 ranking 15 15 8 14 20 16 15 21 11 13 12 11 13
Number of times in bottom 3 ranking 11 29 19 8 8 10 34 8 35 7 14 7 8Ranking based on times in top 3 and bottom 3 7 11 10 3 2 3 12 1 13 3 9 7 6
Average ranking 6.06 8.61 8.14 5.41 4.98 5.76 8.43 5.25 8.86 5.08 6.84 4.94 5.71
Ranking based on average ranking 8 12 10 5 2 7 11 4 13 3 9 1 6
Avg. G-H score 0.1832 0.1443 0.1673 0.1827 0.1839 0.1824 0.1541 0.1838 0.1485 0.1845 0.1763 0.1845 0.1828
Ranking based on G-H scores 5 13 10 7 3 8 11 4 12 2 9 1 6
Any coefficient Any coefficient consistently better consistently better than Tanimoto ? How than Tanimoto ? How do coefficients do coefficients performed when performed when compared to compared to Tanimoto ?Tanimoto ?
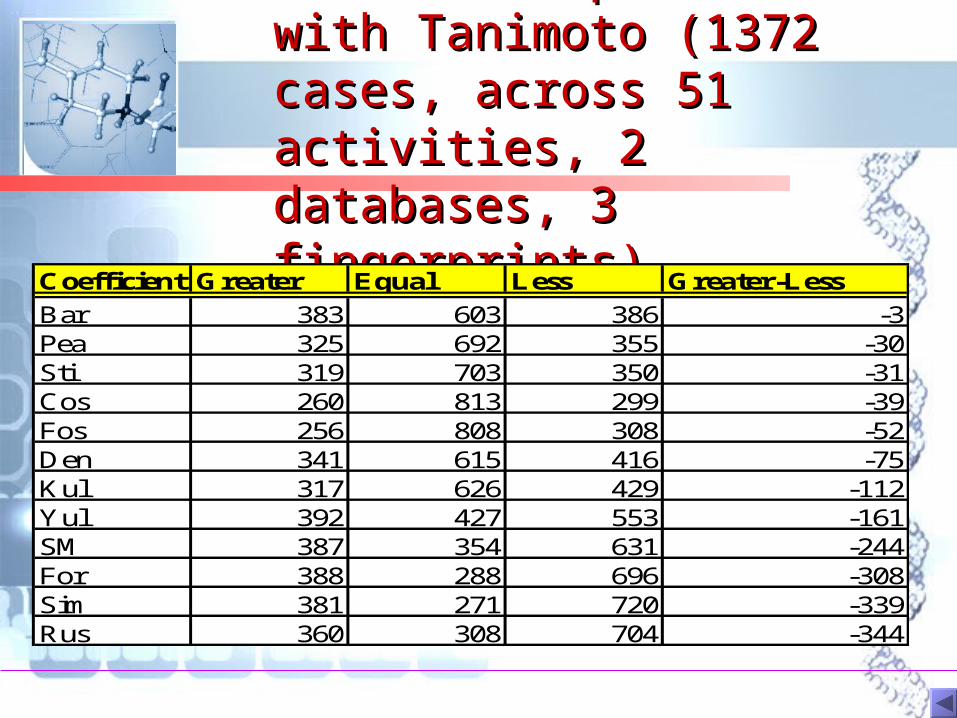
Overall comparison with Overall comparison with Tanimoto (1372 cases, Tanimoto (1372 cases, across 51 activities, 2 across 51 activities, 2 databases, 3 databases, 3 fingerprints)fingerprints)
Coefficient Greater Equal Less Greater-Less
Bar 383 603 386 -3Pea 325 692 355 -30Sti 319 703 350 -31Cos 260 813 299 -39Fos 256 808 308 -52Den 341 615 416 -75Kul 317 626 429 -112Yul 392 427 553 -161SM 387 354 631 -244For 388 288 696 -308Sim 381 271 720 -339Rus 360 308 704 -344
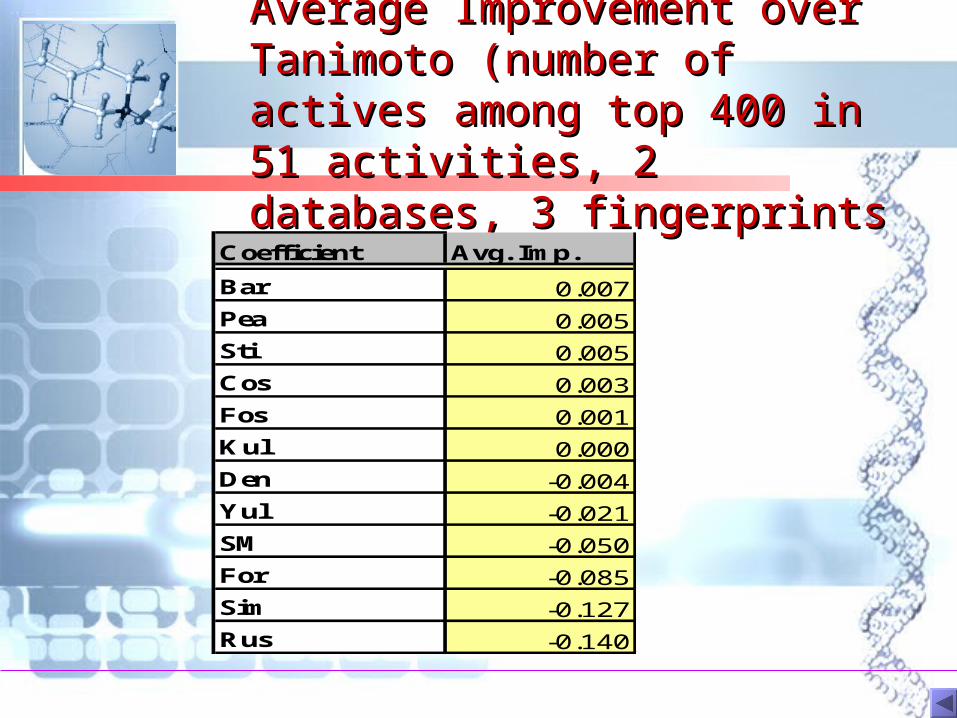
Average Improvement over Average Improvement over Tanimoto (number of actives Tanimoto (number of actives among top 400 in 51 among top 400 in 51 activities, 2 databases, 3 activities, 2 databases, 3 fingerprintsfingerprints
Coefficient Avg. Imp.
Bar 0.007
Pea 0.005
Sti 0.005
Cos 0.003
Fos 0.001
Kul 0.000
Den -0.004
Yul -0.021
SM -0.050
For -0.085
Sim -0.127
Rus -0.140
Is there any Is there any relationship between relationship between
performance of performance of coefficients and coefficients and
number of bits set in number of bits set in active compounds ?active compounds ?
Considering activities with the Considering activities with the lowest z-score in term of number lowest z-score in term of number of bits setof bits set
Best three coefficients for each activity are highlightedBest three coefficients for each activity are highlightedForbes appears in this best three list 11 out of 17 cases
Target
Avg Num Bit Set
Std Dev Bit Set
%of Bit Set
z-score of Bit Set
Num. Of Act. Best Ind. Tan Rus SM Bar Cos Kul For Fos Sim Pea Yul Sti Den
Antiarrhythmic agent 163 72.69 7.96 -0.95 6 For/Yul 12 13 3 4 4 4 1 4 4 4 1 4 4
Melatonin agonist 193 60.11 9.42 -0.865 132 For 10 13 4 5 8 11 1 8 12 7 2 6 3
Enkephalinase inhibitor 163 36.78 16.4315 -0.831 100 For 8 13 2 5 9 11 1 10 12 5 4 7 3
Adrenergic (alpha2) agonist 219 46.65 10.69 -0.626 113 Bar 7 13 8 1 9 11 2 10 12 5 3 6 4
Cyclooxygenase inhibitor 77 30.25 7.32 -0.60 22 For 6 6 2 5 10 9 1 10 3 10 3 10 6
PAF antagonist 167 66.59 16.83 -0.56 31 For 8 13 3 2 9 11 1 9 12 5 5 5 4
Prolylendopeptidase inhibitor 184 33.19 18.5484 -0.535 294 Den 6 13 5 2 7 9 11 8 12 3 10 3 1
Antiischemic, Myocardial 229 85.52 11.18 -0.534 135 For 12 13 4 6 10 11 1 9 3 8 2 7 5
Fibrinogen antagonist 213 89.78 10.40 -0.50 19 For 12 13 2 7 9 7 1 9 9 4 2 4 4
Dopamine (D2) antagonist 198 43.26 19.9597 -0.337 187 Den 9 13 6 4 7 10 11 8 12 2 5 3 1
TXA2 antagonist 184 76.94 18.55 -0.32 26 For 7 5 4 9 10 6 1 10 2 10 3 10 7
Squalene Synthetase inhibitor 92 36.28 8.75 -0.3 415 Yul 12 13 10 11 9 3 2 8 4 6 1 5 6
Adrenoceptor (beta3) agonist 255 76.25 12.45 -0.294 271 Pea/Sti 7 13 10 8 4 6 11 3 12 1 9 1 5
Neutral Endopeptidase inhibitor 255 79 12.45 -0.294 209 Fos 5 13 10 8 2 6 12 1 11 4 9 3 7
Antibacterial 88 27.71 8.37 -0.25 35 For 11 13 3 4 5 10 1 8 11 8 2 5 5
Vasolidator 206 62 20.7661 -0.224 407 Den 6 13 10 5 7 9 11 8 12 2 4 2 1
Considering activities with the highest z-Considering activities with the highest z-score in term of number of bits setscore in term of number of bits set
Best three coefficients for each activity are highlightedBest three coefficients for each activity are highlightedRussell/Rao appears in this best three list 10 out of 17 cases
Target
Avg Num Bit Set
Std Dev Bit Set
%of Bit Set
z-score of Bit Set
Num. Of Act. Best Ind. Tan Rus SM Bar Cos Kul For Fos Sim Pea Yul Sti Den
CRF antagonist 107 16.49 10.17 0.221 254 Tan 1 11 10 8 2 6 13 3 12 4 9 5 7
Factor Xa inhibitor 240 55.97 24.1935 0.2566 412 Kul 7 12 10 6 2 1 13 2 11 5 9 4 8
Acetylcholinesterase inhibitor 307 79.81 14.99 0.34 18 Bar/Pea/ Sti 7 4 12 1 7 4 13 7 10 1 10 1 4
ACAT inhibitor 232 72.51 23.39 0.35 54 Rus 6 1 11 7 4 2 13 3 5 9 12 8 10Systemic Lupus Erythematosus, agent for
111 30.15 10.55 0.36 99 Rus 9 1 12 7 3 6 13 2 10 5 11 4 7
Phosphodiesterase inhibitor 332 77.86 16.21 0.4137 130 Tan 1 9 12 5 3 4 13 2 11 5 10 5 8
PDE inhibitor 322 125.5 15.72 0.47 19 Rus 5 1 5 2 7 7 7 7 2 7 13 7 2
Cephalosporin 245 82.89 24.70 0.53 20 Rus 7 1 9 9 2 2 13 4 7 4 12 4 11
Adenosine (A2) antagonist 348 102.8 16.99 0.5608 106 Rus 7 1 10 11 8 2 13 8 3 4 12 4 6
Vasopressin V1 antagonist 119 19.33 11.31 0.6379 125 Kul 6 10 11 8 2 1 13 2 12 5 9 4 7
Progestogen antagonist 117 34.18 11.12 0.66 10 Rus 4 1 4 4 4 2 4 4 2 4 4 4 4
Endothelin ETA antagonist 272 60.77 27.4194 0.7087 158 Rus 3 1 10 6 3 5 13 2 12 8 11 6 9
Kappa opioid agonist 119 35.82 11.31 0.72 6 Rus 2 1 2 2 2 2 2 2 2 2 2 2 2
Oxazolidinone 123 12.1 11.69 0.7769 306 Bar 2 9 10 1 3 8 13 4 12 6 11 5 7
Neurokinin antagonist 125 20.03 11.88 0.8464 201 Rus 2 1 10 8 4 5 13 3 12 7 11 6 9
Anthracycline 126 14.89 11.98 0.8812 160
Tan/Bar/Cos/Kul/ Fos/Pea/ Sti/ Den
1 10 11 1 1 1 13 1 12 1 9 1 1
Penicillin 159 24.93 15.11 2.0278 79 Rus 5 1 11 9 4 2 13 3 12 6 10 6 8
Considering activities with the medium Considering activities with the medium z-score in term of number of bits setz-score in term of number of bits set
Best three coefficients for each activity are highlightedBest three coefficients for each activity are highlightedCos appears in this best three list 8 out of 17 cases, Tan and Fos 7/11
Target
Avg Num Bit Set
Std Dev Bit Set
%of Bit Set
z-score of Bit Set
Num. Of Act. Best Ind. Tan Rus SM Bar Cos Kul For Fos Sim Pea Yul Sti Den
Thromboxane antagonist 209 37.24 21.0685 -0.181 499 Den 6 13 9 2 7 9 11 8 12 2 5 4 1
Excitatory Amino acid inhibitor 209 59.23 21.0685 -0.181 122 Bar/Pea 7 13 10 1 5 8 11 6 12 1 9 3 4
Calcium channel blocker 252 88.62 12.30 -0.15 46 Den 10 13 7 3 7 5 11 9 12 2 4 6 1
Reverse Transcriptase inhibitor 97 23.56 9.22 -0.126 518 Bar 6 13 10 1 7 10 8 9 12 3 5 4 2
H+/K+ - ATPase inhibitor 276 73.63 13.48 -0.101 638 Sti 4 13 11 5 6 8 10 7 12 2 9 1 3
Antiischemic agent 99 22.76 9.41 -0.057 148 For 12 13 4 6 10 11 1 9 3 8 2 7 5
IL-8 inhibitor 281 81.08 13.72 -0.055 148 Kul 8 13 12 9 2 1 11 2 10 6 5 4 7
HMG CoA reductase inhibitor 204 70.02 20.56 -0.04 30 Cos/Fos 3 13 10 5 1 3 8 1 10 6 8 6 10
Immunosuppressant 95 39.42 9.03 -0.03 69 Sim 11 3 5 13 7 6 2 8 1 10 4 9 12
Potassium channel blocker 220 49.41 22.1774 -0.026 187 Cos 4 11 10 7 1 3 13 2 12 6 8 5 9
Leukotriene D4 antagonist 224 46.18 22.5806 0.0305 465 Bar 2 13 10 1 3 7 12 4 11 5 9 5 8
NMDA antagonist 97 32.86 9.22 0.03 52 Rus 2 1 12 5 4 9 13 3 10 5 10 5 5
Potassium channel blocker 275 98.9 13.43 0.05 29 Tan 1 12 10 6 2 4 11 3 12 5 9 6 8
Angiotensin II antagonist 211 71.3 21.27 0.06 115 Cos/Fos 3 13 10 5 1 3 12 1 10 8 6 7 9
Xanthine 299 69.15 14.60 0.1102 107 Cos/Fos 3 11 13 7 1 4 12 1 10 6 9 5 8
Fungicide 100 36.91 9.51 0.13 101 Rus 10 1 13 11 6 3 5 7 2 8 4 9 12
Tyrosine kinase inhibitor 218 70.81 21.98 0.15 23 Rus 2 1 11 6 2 4 13 4 9 7 11 7 9
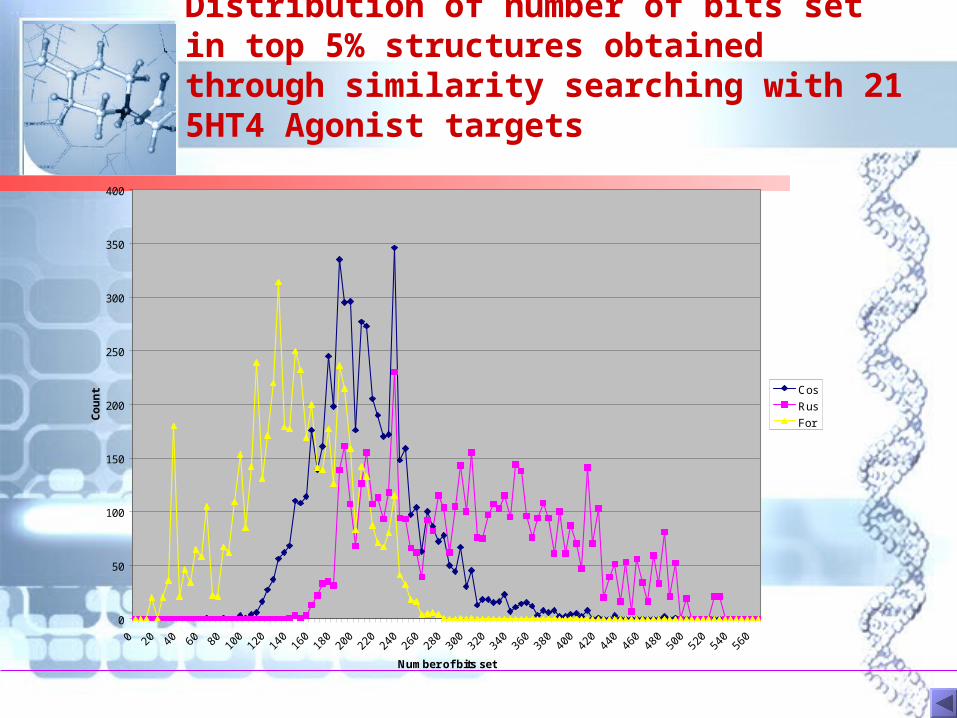
Distribution of number of bits set in top 5% structures obtained through similarity searching with 21 5HT4 Agonist targets
0
50
100
150
200
250
300
350
400
0 20 40 60 80 100
120
140
160
180
200
220
240
260
280
300
320
340
360
380
400
420
440
460
480
500
520
540
560
Number of bits set
Co
un
t Cos
Rus
For
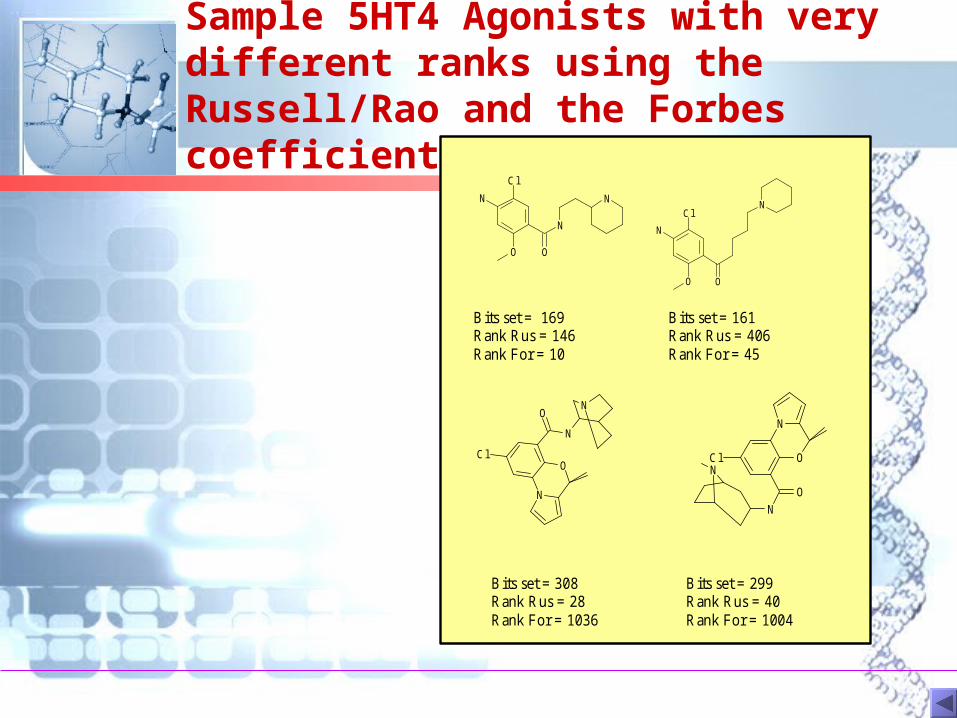
Sample 5HT4 Agonists with very different ranks using the Russell/Rao and the Forbes coefficients.
O
N
Cl
O
N
N
O
N
Cl
O
N
Bits set = 169 Rank Rus = 146 Rank For = 10
Bits set = 161 Rank Rus = 406 Rank For = 45
OCl
N
O
N
N
Bits set = 308 Rank Rus = 28 Rank For = 1036
N
N
O
Cl O
N
Bits set = 299 Rank Rus = 40 Rank For = 1004
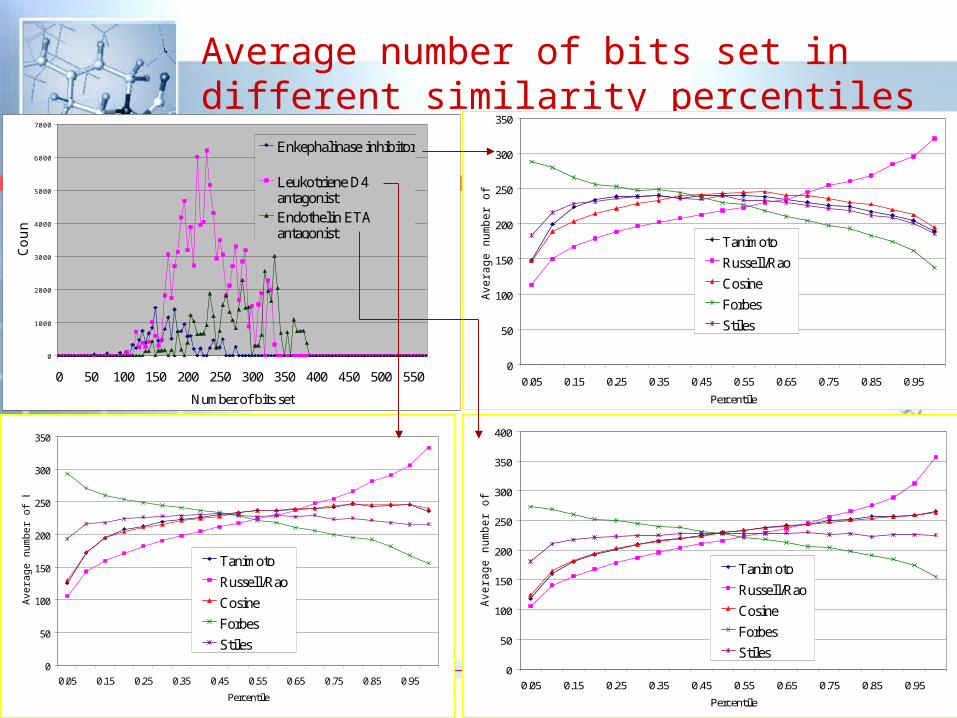
Average number of bits set in different similarity percentiles
0
50
100
150
200
250
300
350
0.05 0.15 0.25 0.35 0.45 0.55 0.65 0.75 0.85 0.95
Percentile
Ave
rage
num
ber
of b
its
set
0
50
100
150
200
250
300
350
0.05 0.15 0.25 0.35 0.45 0.55 0.65 0.75 0.85 0.95
Percentile
Ave
rage
num
ber
of b
its
set
0
50
100
150
200
250
300
350
400
0.05 0.15 0.25 0.35 0.45 0.55 0.65 0.75 0.85 0.95
Percentile
Av
erag
e nu
mbe
r of
bit
s se
t
0
10
20
30
40
50
60
70
0.05 0.2 0.35 0.5 0.65 0.8 0.95
Percentile
Av
er
ag
e
nu
mb
er
o
f
bi
ts
s
et
Tanimoto
Russell/Rao
Cosine
Forbes
Stiles
0
1000
2000
3000
4000
5000
6000
7000
0 50 100 150 200 250 300 350 400 450 500 550
Number of bits set
Cou
nt
0
10
20
30
40
50
60
70
0.05 0.2 0.35 0.5 0.65 0.8 0.95
Percentile
Av
er
ag
e
nu
mb
er
o
f
bi
ts
s
et
Tanimoto
Russell/Rao
Cosine
Forbes
Stiles
0
10
20
30
40
50
60
70
0.05 0.2 0.35 0.5 0.65 0.8 0.95
Percentile
Av
er
ag
e
nu
mb
er
o
f
bi
ts
s
et
Tanimoto
Russell/Rao
Cosine
Forbes
Stiles
0
1000
2000
3000
4000
5000
6000
7000
0 5 01 0 0
1 5 02 0 0
2 5 03 0 0
3 5 04 0 0
4 5 05 0 0
5 5 0
Number of bits set
Co
un
t
Enkephalinase inhibitor
Leukotriene D4antagonistEndothelin ETAantagonist
Can combination of Can combination of coefficients give better coefficients give better
performance?performance?
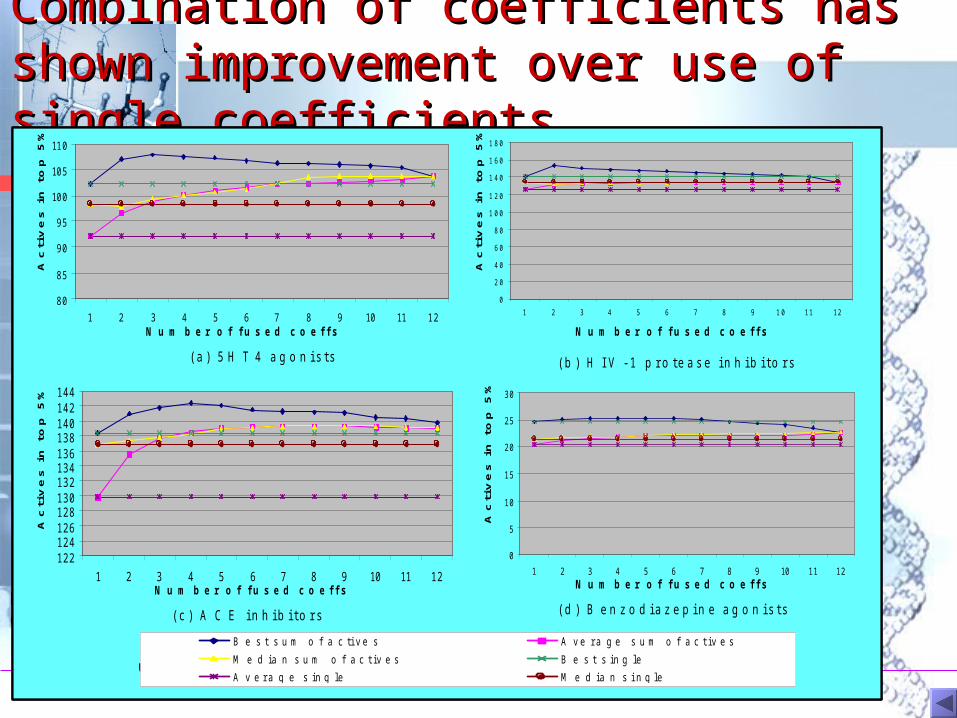
Combination of coefficients has shown Combination of coefficients has shown improvement over use of single improvement over use of single coefficientscoefficients
F i g u r e 3 . P e r f o r m a n c e o f f u s i o n s o f c o e f f i c i e n t s c o m p a r e d t o p e r f o r m a n c e o f s i n g l e c o e f f i c i e n t s . C o m p o u n d s w e r e c h a r a c t e r i s e d b y U n i t y 2 D b i t s t r i n g s .
0
5
1 0
1 5
2 0
2 5
3 0
1 2 3 4 5 6 7 8 9 10 1 1 1 2
0
2 0
4 0
6 0
8 0
1 0 0
1 2 0
1 4 0
1 6 0
1 8 0
1 2 3 4 5 6 7 8 9 1 0 1 1 1 2
122124126128130132134136138140142144
1 2 3 4 5 6 7 8 9 10 11 12
80
85
90
95
100
105
110
1 2 3 4 5 6 7 8 9 10 11 12
N u m b e r o f f u s e d c o e f f s N u m b e r o f f u s e d c o e f f s
N u m b e r o f f u s e d c o e f f s N u m b e r o f f u s e d c o e f f s
Ac
tiv
es
in
to
p 5
%
Ac
tiv
es
in
to
p 5
%A
cti
ve
s i
n t
op
5%
Ac
tiv
es
in
to
p 5
%
( a ) 5 H T 4 a g o n i s t s
( c ) A C E i n h i b i t o r s ( d ) B e n z o d i a z e p i n e a g o n i s t s
( b ) H I V - 1 p r o t e a s e i n h i b i t o r s
B e s t s u m o f a c t i v e s A v e r a g e s u m o f a c t i v e s
M e d i a n s u m o f a c t i v e s B e s t s i n g l e
A v e r a g e s i n g l e M e d i a n s i n g l e
What coefficients to What coefficients to include in combinations?include in combinations?
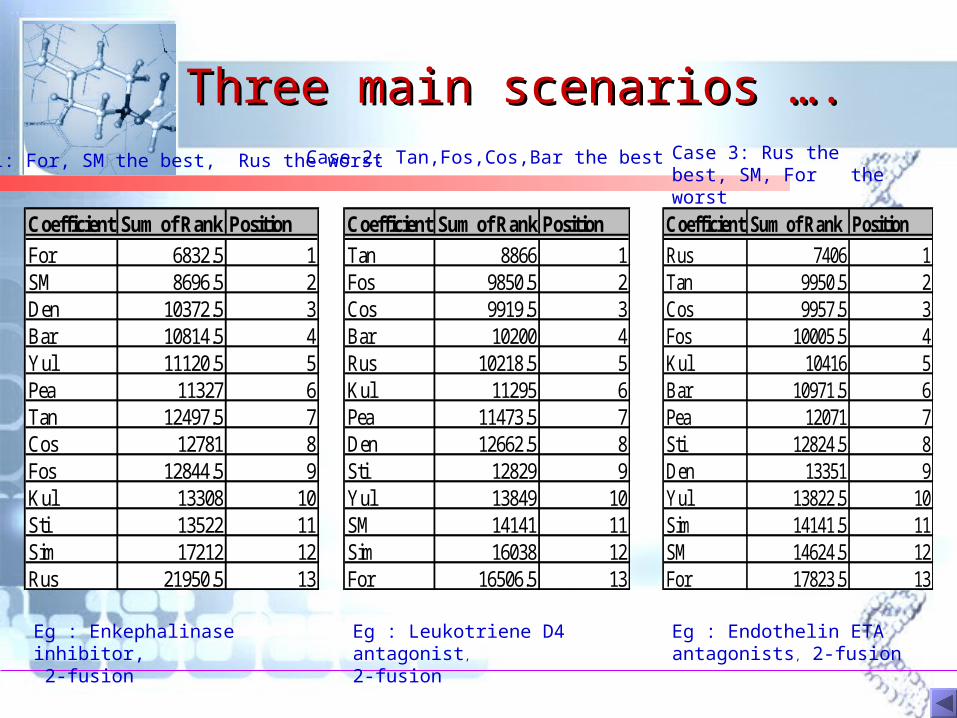
Three main scenarios ….Three main scenarios ….
Coefficient Sum of Rank Position
For 6832.5 1SM 8696.5 2Den 10372.5 3Bar 10814.5 4Yul 11120.5 5Pea 11327 6Tan 12497.5 7Cos 12781 8Fos 12844.5 9Kul 13308 10Sti 13522 11Sim 17212 12Rus 21950.5 13
Case 1: For, SM the best, Rus the worst
Eg : Enkephalinase inhibitor, 2-fusion
Coefficient Sum of Rank Position
Tan 8866 1Fos 9850.5 2Cos 9919.5 3Bar 10200 4Rus 10218.5 5Kul 11295 6Pea 11473.5 7Den 12662.5 8Sti 12829 9Yul 13849 10SM 14141 11Sim 16038 12For 16506.5 13
Case 2: Tan,Fos,Cos,Bar the best
Eg : Leukotriene D4 antagonist, 2-fusion
Coefficient Sum of Rank Position
Rus 7406 1Tan 9950.5 2Cos 9957.5 3Fos 10005.5 4Kul 10416 5Bar 10971.5 6Pea 12071 7Sti 12824.5 8Den 13351 9Yul 13822.5 10Sim 14141.5 11SM 14624.5 12For 17823.5 13
Case 3: Rus the best, SM, For the worst
Eg : Endothelin ETA antagonists, 2-fusion
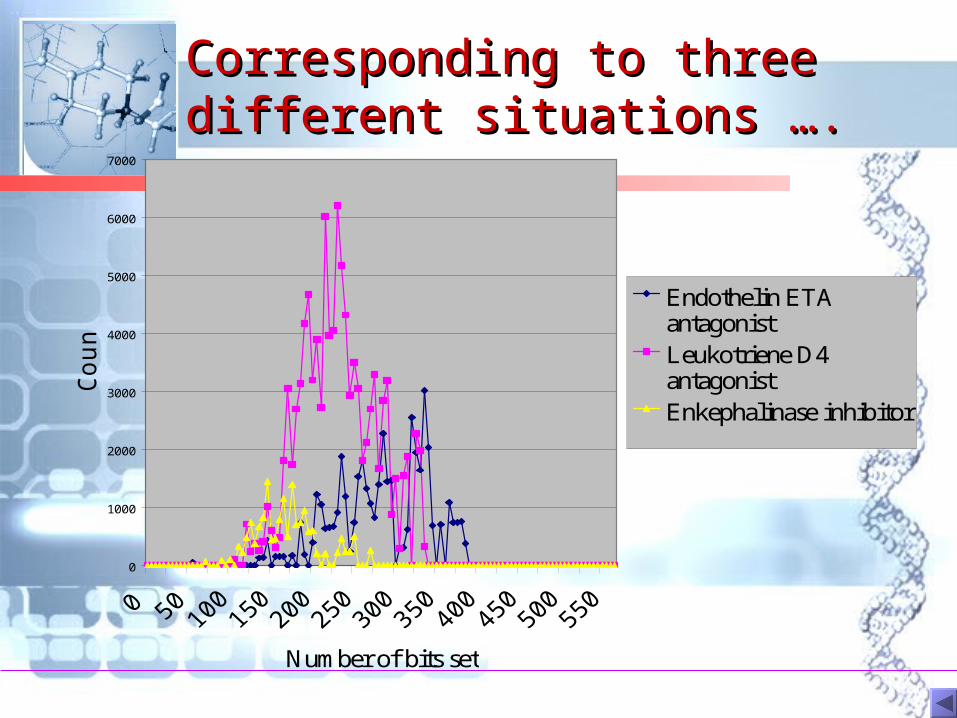
Corresponding to three Corresponding to three different situations ….different situations ….
0
1000
2000
3000
4000
5000
6000
7000
Number of bits set
Cou
nt
Endothelin ETAantagonistLeukotriene D4antagonistEnkephalinase inhibitor
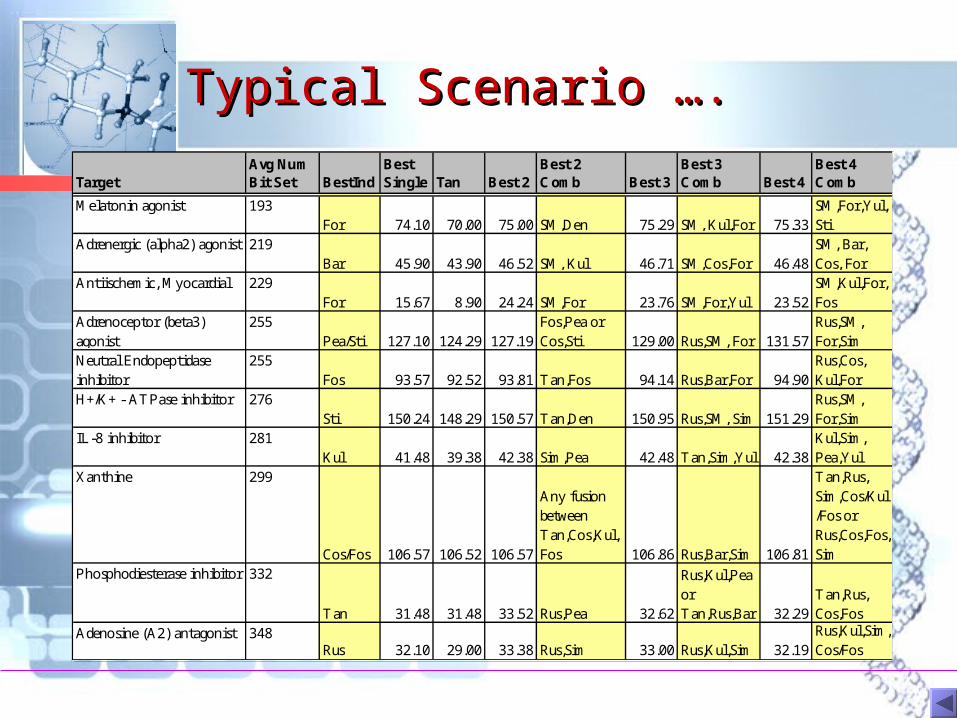
Typical Scenario ….Typical Scenario ….
TargetAvg Num Bit Set BestInd
Best Single Tan Best 2
Best 2 Comb Best 3
Best 3 Comb Best 4
Best 4 Comb
Melatonin agonist 193For 74.10 70.00 75.00 SM,Den 75.29 SM, Kul,For 75.33
SM,For,Yul,Sti
Adrenergic (alpha2) agonist 219Bar 45.90 43.90 46.52 SM, Kul 46.71 SM,Cos,For 46.48
SM, Bar, Cos, For
Antiischemic, Myocardial 229For 15.67 8.90 24.24 SM,For 23.76 SM,For,Yul 23.52
SM,Kul,For,Fos
Adrenoceptor (beta3) agonist
255Pea/Sti 127.10 124.29 127.19
Fos,Pea or Cos,Sti 129.00 Rus,SM, For 131.57
Rus,SM, For,Sim
Neutral Endopeptidase inhibitor
255Fos 93.57 92.52 93.81 Tan,Fos 94.14 Rus,Bar,For 94.90
Rus,Cos, Kul,For
H+/K+ - ATPase inhibitor 276Sti 150.24 148.29 150.57 Tan,Den 150.95 Rus,SM, Sim 151.29
Rus,SM, For,Sim
IL-8 inhibitor 281Kul 41.48 39.38 42.38 Sim,Pea 42.48 Tan,Sim,Yul 42.38
Kul,Sim, Pea,Yul
Xanthine 299
Cos/Fos 106.57 106.52 106.57
Any fusion between Tan,Cos,Kul,Fos 106.86 Rus,Bar,Sim 106.81
Tan,Rus, Sim,Cos/Kul/Fos or Rus,Cos,Fos,Sim
Phosphodiesterase inhibitor 332
Tan 31.48 31.48 33.52 Rus,Pea 32.62
Rus,Kul,Pea or Tan,Rus,Bar 32.29
Tan,Rus, Cos,Fos
Adenosine (A2) antagonist 348Rus 32.10 29.00 33.38 Rus,Sim 33.00 Rus,Kul,Sim 32.19
Rus,Kul,Sim,Cos/Fos
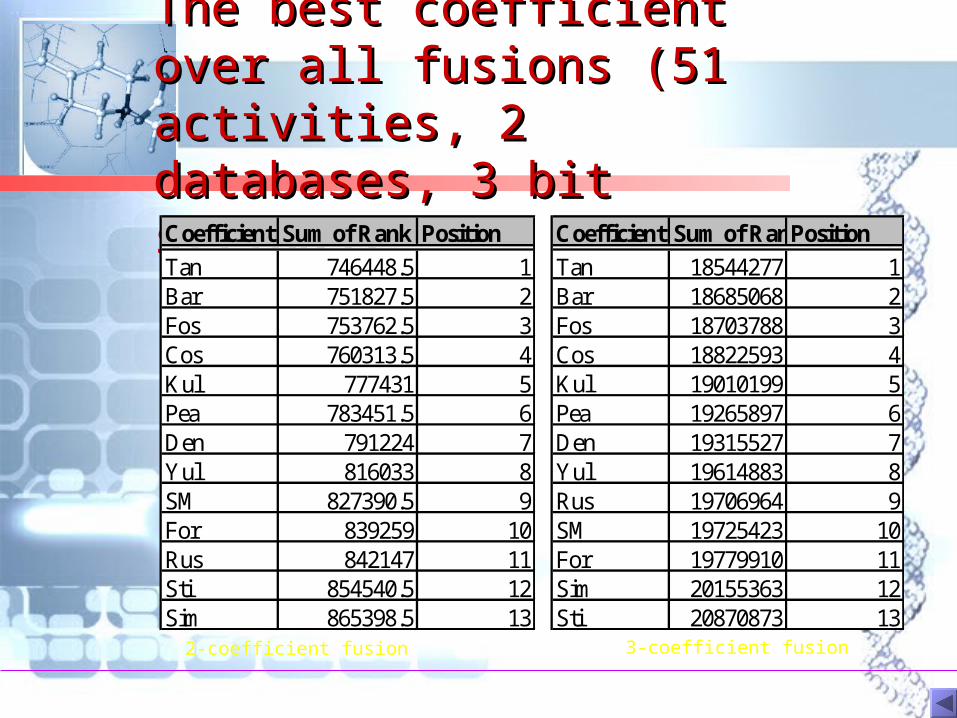
The best coefficient over The best coefficient over all fusions (51 activities, 2 all fusions (51 activities, 2 databases, 3 bit strings)?databases, 3 bit strings)?Coefficient Sum of Rank Position
Tan 746448.5 1Bar 751827.5 2Fos 753762.5 3Cos 760313.5 4Kul 777431 5Pea 783451.5 6Den 791224 7Yul 816033 8SM 827390.5 9For 839259 10Rus 842147 11Sti 854540.5 12Sim 865398.5 13
Coefficient Sum of RankPosition
Tan 18544277 1Bar 18685068 2Fos 18703788 3Cos 18822593 4Kul 19010199 5Pea 19265897 6Den 19315527 7Yul 19614883 8Rus 19706964 9SM 19725423 10For 19779910 11Sim 20155363 12Sti 20870873 13
2-coefficient fusion 3-coefficient fusion
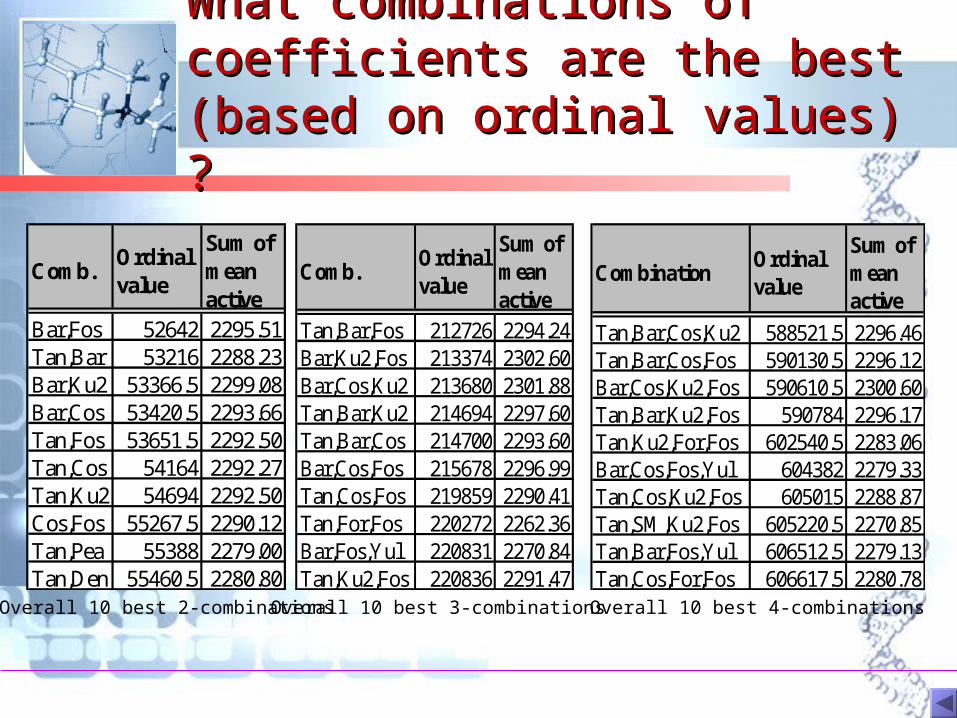
What combinations of What combinations of coefficients are the best coefficients are the best (based on ordinal values) ?(based on ordinal values) ?
Overall 10 best 2-combinations Overall 10 best 3-combinations Overall 10 best 4-combinations
Comb.Ordinal value
Sum of mean active
Bar,Fos 52642 2295.51Tan,Bar 53216 2288.23Bar,Ku2 53366.5 2299.08Bar,Cos 53420.5 2293.66Tan,Fos 53651.5 2292.50Tan,Cos 54164 2292.27Tan,Ku2 54694 2292.50Cos,Fos 55267.5 2290.12Tan,Pea 55388 2279.00Tan,Den 55460.5 2280.80
Comb.Ordinal value
Sum of mean active
Tan,Bar,Fos 212726 2294.24Bar,Ku2,Fos 213374 2302.60Bar,Cos,Ku2 213680 2301.88Tan,Bar,Ku2 214694 2297.60Tan,Bar,Cos 214700 2293.60Bar,Cos,Fos 215678 2296.99Tan,Cos,Fos 219859 2290.41Tan,For,Fos 220272 2262.36Bar,Fos,Yul 220831 2270.84Tan,Ku2,Fos 220836 2291.47
CombinationOrdinal value
Sum of mean active
Tan,Bar,Cos,Ku2 588521.5 2296.46Tan,Bar,Cos,Fos 590130.5 2296.12Bar,Cos,Ku2,Fos 590610.5 2300.60Tan,Bar,Ku2,Fos 590784 2296.17Tan,Ku2,For,Fos 602540.5 2283.06Bar,Cos,Fos,Yul 604382 2279.33Tan,Cos,Ku2,Fos 605015 2288.87Tan,SM,Ku2,Fos 605220.5 2270.85Tan,Bar,Fos,Yul 606512.5 2279.13Tan,Cos,For,Fos 606617.5 2280.78
How do combinations How do combinations compare with single compare with single coefficients ?coefficients ?
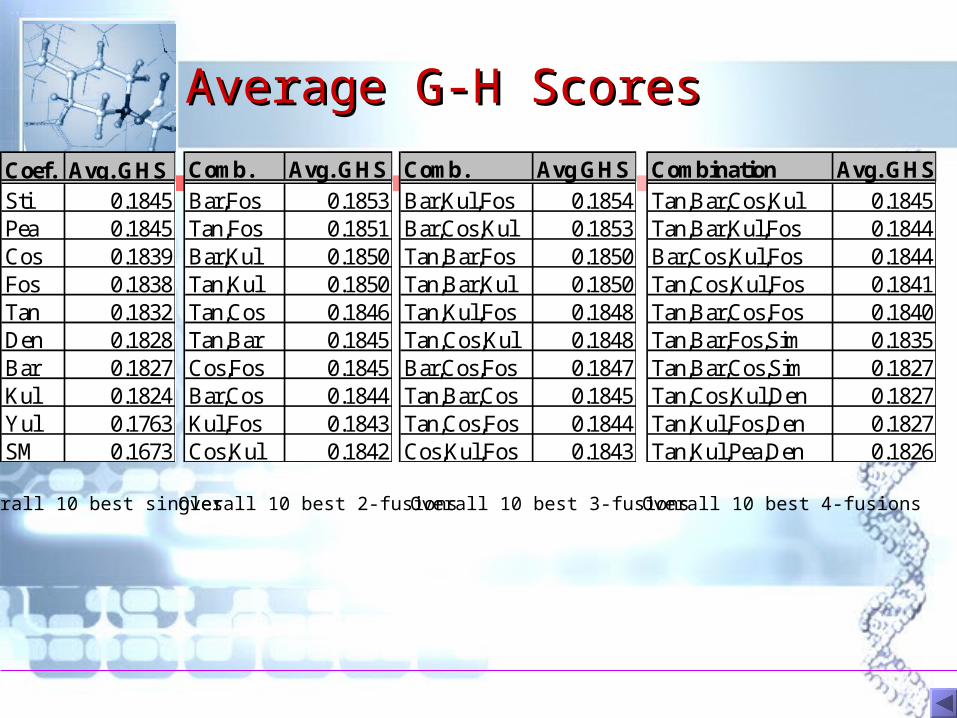
Average G-H ScoresAverage G-H Scores
Overall 10 best 4-fusionsOverall 10 best 3-fusionsOverall 10 best 2-fusionsOverall 10 best singles
Coef. Avg. GHSSti 0.1845Pea 0.1845Cos 0.1839Fos 0.1838Tan 0.1832Den 0.1828Bar 0.1827Kul 0.1824Yul 0.1763SM 0.1673
Comb. Avg. GHS
Bar,Fos 0.1853Tan,Fos 0.1851Bar,Kul 0.1850Tan,Kul 0.1850Tan,Cos 0.1846Tan,Bar 0.1845Cos,Fos 0.1845Bar,Cos 0.1844Kul,Fos 0.1843Cos,Kul 0.1842
Comb. Avg GHS
Bar,Kul,Fos 0.1854Bar,Cos,Kul 0.1853Tan,Bar,Fos 0.1850Tan,Bar,Kul 0.1850Tan,Kul,Fos 0.1848Tan,Cos,Kul 0.1848Bar,Cos,Fos 0.1847Tan,Bar,Cos 0.1845Tan,Cos,Fos 0.1844Cos,Kul,Fos 0.1843
Combination Avg. GHS
Tan,Bar,Cos,Kul 0.1845Tan,Bar,Kul,Fos 0.1844Bar,Cos,Kul,Fos 0.1844Tan,Cos,Kul,Fos 0.1841Tan,Bar,Cos,Fos 0.1840Tan,Bar,Fos,Sim 0.1835Tan,Bar,Cos,Sim 0.1827Tan,Cos,Kul,Den 0.1827Tan,Kul,Fos,Den 0.1827Tan,Kul,Pea,Den 0.1826
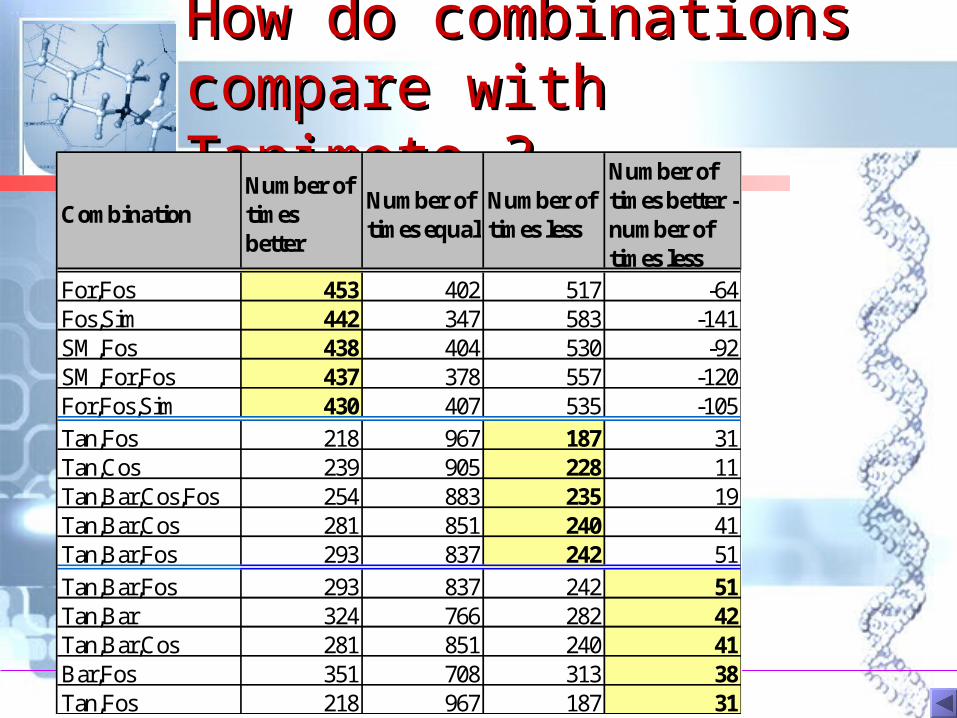
How do combinations How do combinations compare with Tanimoto compare with Tanimoto ??
CombinationNumber of times better
Number of times equal
Number of times less
Number of times better - number of times less
For,Fos 453 402 517 -64Fos,Sim 442 347 583 -141SM,Fos 438 404 530 -92SM,For,Fos 437 378 557 -120For,Fos,Sim 430 407 535 -105
Tan,Fos 218 967 187 31Tan,Cos 239 905 228 11Tan,Bar,Cos,Fos 254 883 235 19Tan,Bar,Cos 281 851 240 41Tan,Bar,Fos 293 837 242 51
Tan,Bar,Fos 293 837 242 51Tan,Bar 324 766 282 42Tan,Bar,Cos 281 851 240 41Bar,Fos 351 708 313 38Tan,Fos 218 967 187 31
Which have overall best Which have overall best improvement over improvement over Tanimoto:Tanimoto:2-fusions, 3-fusions, 4-2-fusions, 3-fusions, 4-fusions or certain single fusions or certain single coefficients ?coefficients ?
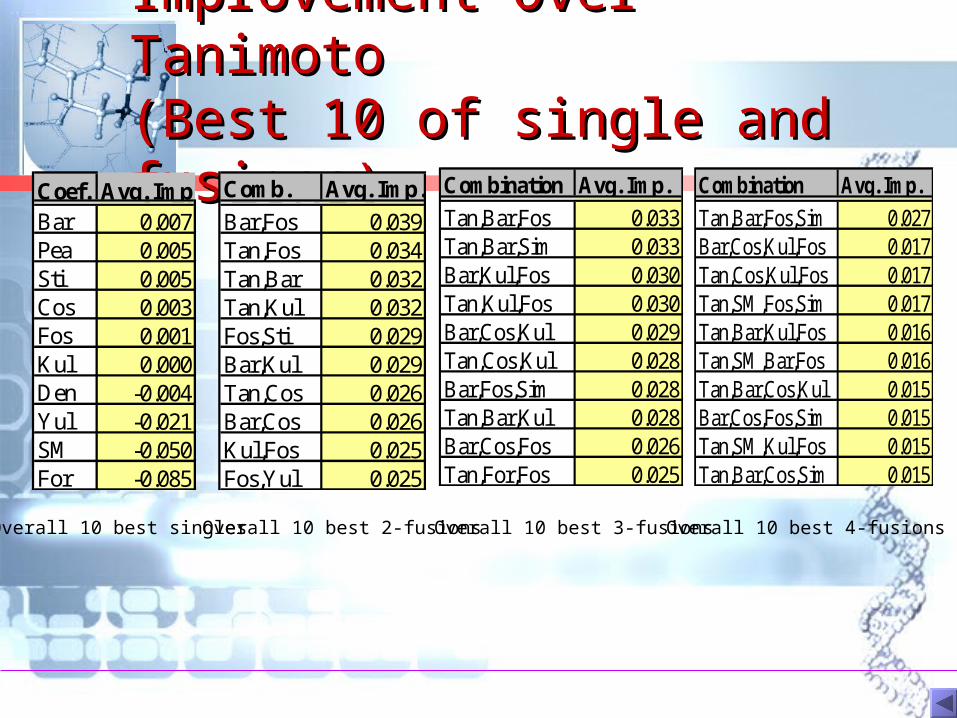
Improvement Over Improvement Over Tanimoto Tanimoto (Best 10 of single and (Best 10 of single and fusions)fusions)
Overall 10 best 4-fusions
Combination Avg. Imp.
Tan,Bar,Fos,Sim 0.027Bar,Cos,Kul,Fos 0.017Tan,Cos,Kul,Fos 0.017Tan,SM,Fos,Sim 0.017Tan,Bar,Kul,Fos 0.016Tan,SM,Bar,Fos 0.016Tan,Bar,Cos,Kul 0.015Bar,Cos,Fos,Sim 0.015Tan,SM,Kul,Fos 0.015Tan,Bar,Cos,Sim 0.015
Comb. Avg. Imp.
Bar,Fos 0.039Tan,Fos 0.034Tan,Bar 0.032Tan,Kul 0.032Fos,Sti 0.029Bar,Kul 0.029Tan,Cos 0.026Bar,Cos 0.026Kul,Fos 0.025Fos,Yul 0.025
Coef. Avg. Imp.Bar 0.007Pea 0.005Sti 0.005Cos 0.003Fos 0.001Kul 0.000Den -0.004Yul -0.021SM -0.050For -0.085
Overall 10 best 3-fusionsOverall 10 best 2-fusionsOverall 10 best singles
Combination Avg. Imp.
Tan,Bar,Fos 0.033Tan,Bar,Sim 0.033Bar,Kul,Fos 0.030Tan,Kul,Fos 0.030Bar,Cos,Kul 0.029Tan,Cos,Kul 0.028Bar,Fos,Sim 0.028Tan,Bar,Kul 0.028Bar,Cos,Fos 0.026Tan,For,Fos 0.025
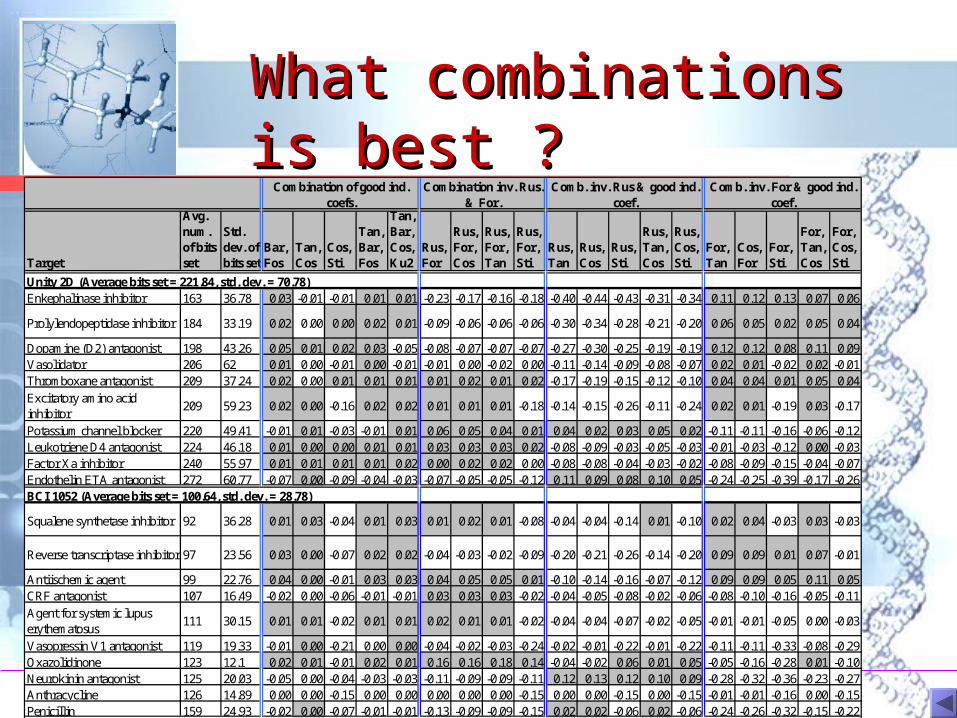
What combinations is What combinations is best ?best ?
Target
Avg. num. of bits set
Std. dev. of bits set
Bar, Fos
Tan, Cos
Cos, Sti
Tan, Bar, Fos
Tan, Bar, Cos, Ku2
Rus, For
Rus, For, Cos
Rus, For, Tan
Rus, For, Sti
Rus, Tan
Rus, Cos
Rus, Sti
Rus, Tan, Cos
Rus, Cos, Sti
For, Tan
Cos, For
For, Sti
For, Tan, Cos
For, Cos, Sti
Unity 2D (Average bits set = 221.84, std. dev. = 70.78)Enkephalinase inhibitor 163 36.78 0.03 -0.01 -0.01 0.01 0.01 -0.23 -0.17 -0.16 -0.18 -0.40 -0.44 -0.43 -0.31 -0.34 0.11 0.12 0.13 0.07 0.06
Prolylendopeptidase inhibitor 184 33.19 0.02 0.00 0.00 0.02 0.01 -0.09 -0.06 -0.06 -0.06 -0.30 -0.34 -0.28 -0.21 -0.20 0.06 0.05 0.02 0.05 0.04
Dopamine (D2) antagonist 198 43.26 0.05 0.01 0.02 0.03 -0.05 -0.08 -0.07 -0.07 -0.07 -0.27 -0.30 -0.25 -0.19 -0.19 0.12 0.12 0.08 0.11 0.09Vasolidator 206 62 0.01 0.00 -0.01 0.00 -0.01 -0.01 0.00 -0.02 0.00 -0.11 -0.14 -0.09 -0.08 -0.07 0.02 0.01 -0.02 0.02 -0.01Thromboxane antagonist 209 37.24 0.02 0.00 0.01 0.01 0.01 0.01 0.02 0.01 0.02 -0.17 -0.19 -0.15 -0.12 -0.10 0.04 0.04 0.01 0.05 0.04
Excitatory amino acid inhibitor
209 59.23 0.02 0.00 -0.16 0.02 0.02 0.01 0.01 0.01 -0.18 -0.14 -0.15 -0.26 -0.11 -0.24 0.02 0.01 -0.19 0.03 -0.17
Potassium channel blocker 220 49.41 -0.01 0.01 -0.03 -0.01 0.01 0.06 0.05 0.04 0.01 0.04 0.02 0.03 0.05 0.02 -0.11 -0.11 -0.16 -0.06 -0.12Leukotriene D4 antagonist 224 46.18 0.01 0.00 0.00 0.01 0.01 0.03 0.03 0.03 0.02 -0.08 -0.09 -0.03 -0.05 -0.03 -0.01 -0.03 -0.12 0.00 -0.03Factor Xa inhibitor 240 55.97 0.01 0.01 0.01 0.01 0.02 0.00 0.02 0.02 0.00 -0.08 -0.08 -0.04 -0.03 -0.02 -0.08 -0.09 -0.15 -0.04 -0.07Endothelin ETA antagonist 272 60.77 -0.07 0.00 -0.09 -0.04 -0.03 -0.07 -0.05 -0.05 -0.12 0.11 0.09 0.08 0.10 0.05 -0.24 -0.25 -0.39 -0.17 -0.26BCI 1052 (Average bits set = 100.64, std. dev. = 28.78)
Squalene synthetase inhibitor 92 36.28 0.01 0.03 -0.04 0.01 0.03 0.01 0.02 0.01 -0.08 -0.04 -0.04 -0.14 0.01 -0.10 0.02 0.04 -0.03 0.03 -0.03
Reverse transcriptase inhibitor 97 23.56 0.03 0.00 -0.07 0.02 0.02 -0.04 -0.03 -0.02 -0.09 -0.20 -0.21 -0.26 -0.14 -0.20 0.09 0.09 0.01 0.07 -0.01
Antiischemic agent 99 22.76 0.04 0.00 -0.01 0.03 0.03 0.04 0.05 0.05 0.01 -0.10 -0.14 -0.16 -0.07 -0.12 0.09 0.09 0.05 0.11 0.05CRF antagonist 107 16.49 -0.02 0.00 -0.06 -0.01 -0.01 0.03 0.03 0.03 -0.02 -0.04 -0.05 -0.08 -0.02 -0.06 -0.08 -0.10 -0.16 -0.05 -0.11
Agent for systemic lupus erythematosus
111 30.15 0.01 0.01 -0.02 0.01 0.01 0.02 0.01 0.01 -0.02 -0.04 -0.04 -0.07 -0.02 -0.05 -0.01 -0.01 -0.05 0.00 -0.03
Vasopressin V1 antagonist 119 19.33 -0.01 0.00 -0.21 0.00 0.00 -0.04 -0.02 -0.03 -0.24 -0.02 -0.01 -0.22 -0.01 -0.22 -0.11 -0.11 -0.33 -0.08 -0.29Oxazolidinone 123 12.1 0.02 0.01 -0.01 0.02 0.01 0.16 0.16 0.18 0.14 -0.04 -0.02 0.06 0.01 0.05 -0.05 -0.16 -0.28 0.01 -0.10Neurokinin antagonist 125 20.03 -0.05 0.00 -0.04 -0.03 -0.03 -0.11 -0.09 -0.09 -0.11 0.12 0.13 0.12 0.10 0.09 -0.28 -0.32 -0.36 -0.23 -0.27Anthracycline 126 14.89 0.00 0.00 -0.15 0.00 0.00 0.00 0.00 0.00 -0.15 0.00 0.00 -0.15 0.00 -0.15 -0.01 -0.01 -0.16 0.00 -0.15Penicillin 159 24.93 -0.02 0.00 -0.07 -0.01 -0.01 -0.13 -0.09 -0.09 -0.15 0.02 0.02 -0.06 0.02 -0.06 -0.24 -0.26 -0.32 -0.15 -0.22
Comb. inv. For & good ind. coef.
Combination of good ind. coefs.
Combination inv. Rus. & For.
Comb. inv. Rus & good ind. coef.
Probability-based Probability-based similarity searchingsimilarity searching
• Vector space similarity models (VSM) most Vector space similarity models (VSM) most widely used currently do not incorporate the widely used currently do not incorporate the importance of a particular fragment based importance of a particular fragment based on information gathered from previously on information gathered from previously known active and inactive compoundsknown active and inactive compounds
• In the probability-based models (PM), In the probability-based models (PM), formal probability theory and statistics are formal probability theory and statistics are used to estimate the probability that a used to estimate the probability that a structure is active (relevant) and non-active structure is active (relevant) and non-active (non-relevant) to the query. (non-relevant) to the query.
• In PM, structures with relevance probability In PM, structures with relevance probability exceeding its non-relevance probability are exceeding its non-relevance probability are ranked in decreasing order of their ranked in decreasing order of their relevance. relevance.
Probability-based Probability-based modelsmodels
• The Binary Independence Retrieval (BIR) The Binary Independence Retrieval (BIR) model model based on the presence or absence of independently
distributed bits in active and inactive structures. probability of any given bit occurring in a
structure is independent of the probability of occurrence of any other bits, whether in active structures or inactive structures.
• The Binary Dependence (BD) model The Binary Dependence (BD) model assumes the probability of any given bit occurring
in an active structure is dependent of the probability of any other bit occurring in an active structure and similarly for inactive structures.
Query fusion in Query fusion in probability modelsprobability models
• Results and information obtained from Results and information obtained from previous queries used in subsequent queries previous queries used in subsequent queries
• Based on these compounds, the probability Based on these compounds, the probability that bit that bit bi bi appearing in an active structure appearing in an active structure and and the the probability that bit probability that bit bi bi appearing in appearing in an inactive structurean inactive structure for each bit for each bit i i is is computed. computed. Information is used to obtained the ranking score
function (RSV) for the second set.
• The same procedure is repeated for The same procedure is repeated for subsequent search on other datasetssubsequent search on other datasets
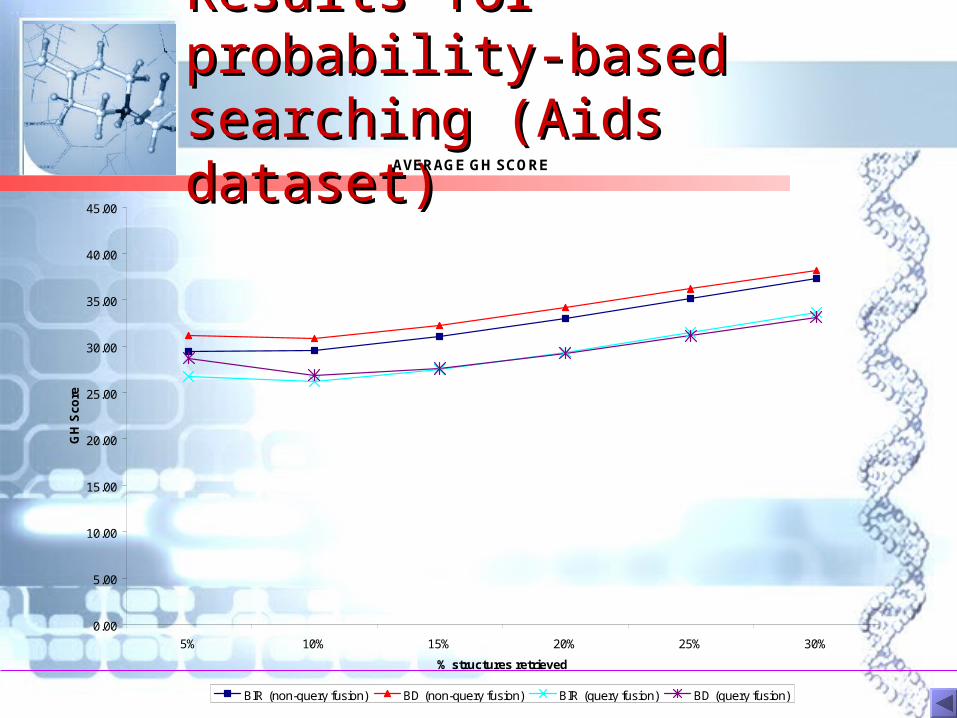
Results for probability-Results for probability-based searching (Aids based searching (Aids dataset)dataset)AVERAGE GH SCORE
0.00
5.00
10.00
15.00
20.00
25.00
30.00
35.00
40.00
45.00
5% 10% 15% 20% 25% 30%
% structures retrieved
GH
Sco
re
BIR (non-query fusion) BD (non-query fusion) BIR (query fusion) BD (query fusion)
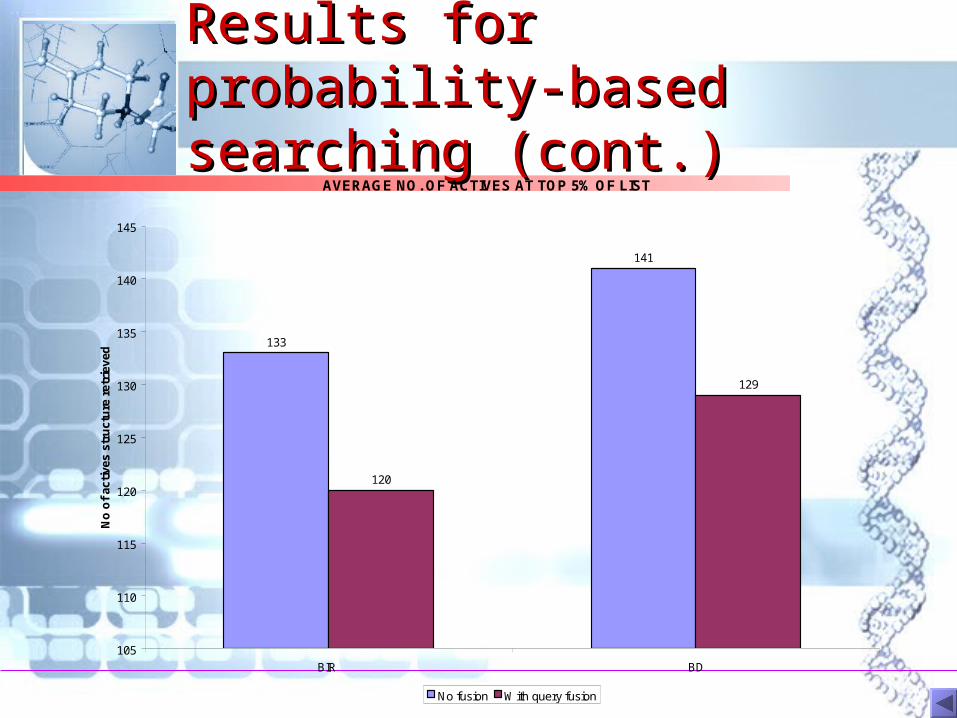
Results for probability-Results for probability-based searching (cont.)based searching (cont.)
AVERAGE NO. OF ACTIVES AT TOP 5% OF LIST
133
141
120
129
105
110
115
120
125
130
135
140
145
BIR BD
No
of
acti
ves
stru
ctu
re r
etri
eved
No fusion With query fusion
Compound selectionCompound selection
• More compounds are available than More compounds are available than can be screened cost-effectively can be screened cost-effectively
• Compound selection techniques can Compound selection techniques can be used tobe used to select compounds for screening choose compounds to purchase from
external suppliers design combinatorial libraries
Virtual Screening Virtual Screening StrategiesStrategies
• DiversityDiversitylead generation libraries for
screening against a number of targets
a structurally diverse library should cover biological activity space well
Diverse Subset Diverse Subset SelectionSelection
• Dissimilarity-based compound Dissimilarity-based compound selection (DBCS)selection (DBCS)
• ClusteringClustering
• Partitioning/Cell-based methodsPartitioning/Cell-based methods
• Optimisation techniquesOptimisation techniques
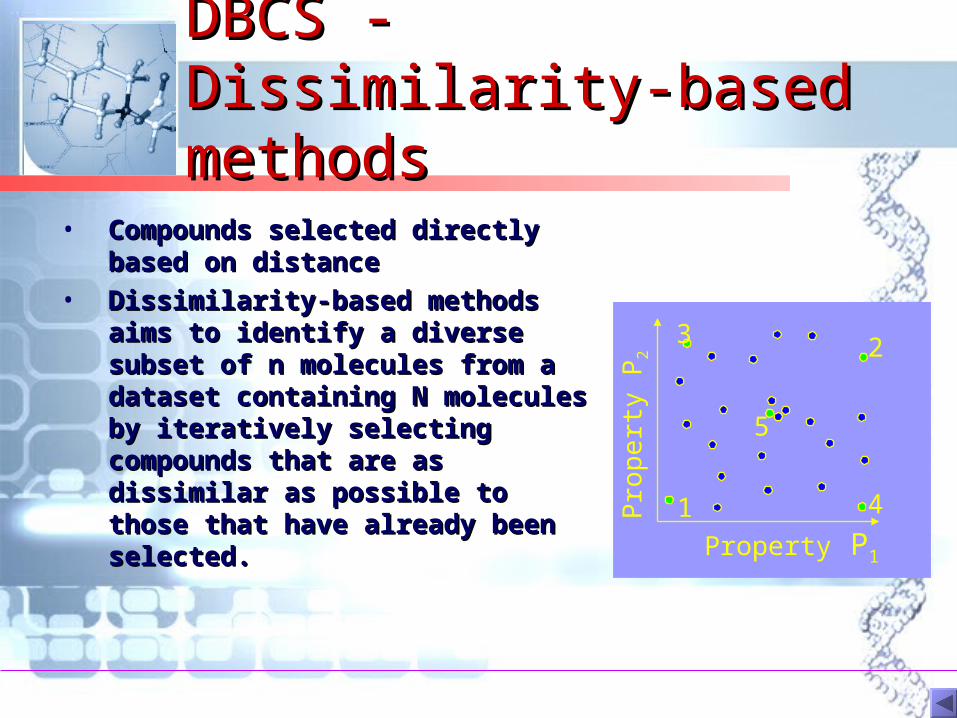
DBCS - Dissimilarity-DBCS - Dissimilarity-based methods based methods
• Compounds selected directly Compounds selected directly based on distancebased on distance
• Dissimilarity-based methods Dissimilarity-based methods aims to identify a diverse subset aims to identify a diverse subset of n molecules from a dataset of n molecules from a dataset containing N molecules by containing N molecules by iteratively selecting compounds iteratively selecting compounds that are as dissimilar as possible that are as dissimilar as possible to those that have already been to those that have already been selected. selected.
Pro
pert
y P
2
1
23
4
5
Property P1
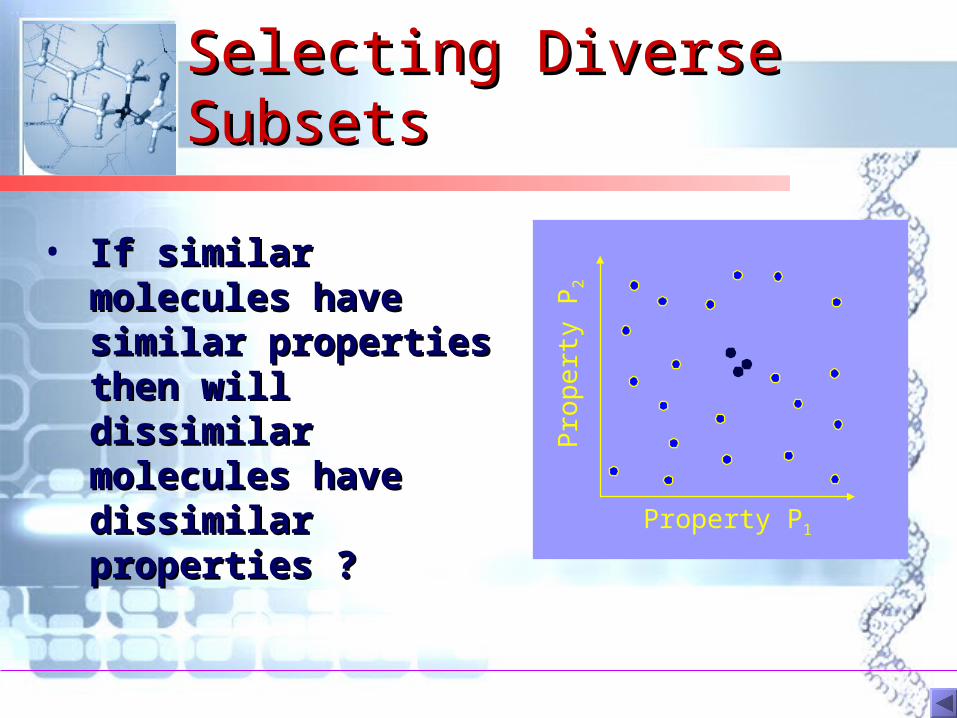
Selecting Diverse Selecting Diverse Subsets Subsets
• If similar molecules If similar molecules have similar have similar properties then will properties then will dissimilar molecules dissimilar molecules have dissimilar have dissimilar properties ?properties ?
Property P1
Pro
pert
y P
2
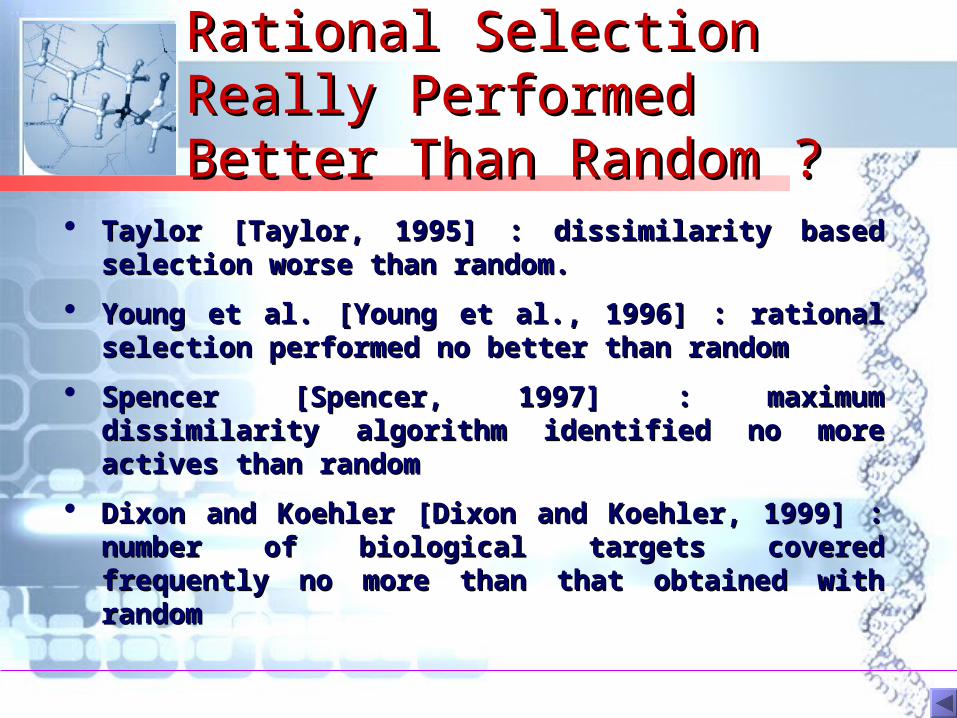
Rational Selection Really Rational Selection Really Performed Better Than Performed Better Than Random ?Random ?
Taylor [Taylor, 1995] : dissimilarity based Taylor [Taylor, 1995] : dissimilarity based selection worse than random. selection worse than random.
Young et al. [Young et al., 1996] : rational Young et al. [Young et al., 1996] : rational selection performed no better than random selection performed no better than random
Spencer [Spencer, 1997] : maximum dissimilarity Spencer [Spencer, 1997] : maximum dissimilarity algorithm identified no more actives than random algorithm identified no more actives than random
Dixon and Koehler [Dixon and Koehler, 1999] : Dixon and Koehler [Dixon and Koehler, 1999] : number of biological targets covered frequently number of biological targets covered frequently no more than that obtained with randomno more than that obtained with random
Could This Be Attributed To Could This Be Attributed To Weaknesses of Similarity Weaknesses of Similarity Measures in Measuring Measures in Measuring Dissimilarity ?Dissimilarity ?
• Can similar property principle also Can similar property principle also claim that structurally dissimilar claim that structurally dissimilar compound also have dissimilar compound also have dissimilar activity ? activity ?
• Can bit string based similarity Can bit string based similarity measures be effectively used as a measures be effectively used as a quantitative measure of dissimilarity?quantitative measure of dissimilarity?
What Have Been What Have Been Found Thus FarFound Thus Far
•Non-intuitive results of bit Non-intuitive results of bit string based measures, string based measures, especially at low similarity levelespecially at low similarity level Size factor (Lajiness, 1997; Flower, 1997; Dixon and
Koehler, 1999) Shape factor (Flower, 1997) Global similarity (Flower, 1997)
• molecules with low similarity values are not necessarily dissimilar from one another
What have been found What have been found thus far (cont.)thus far (cont.)
• Statistical preferenceStatistical preference of of values (Godden et. al., 1999)values (Godden et. al., 1999) only certain range of values occupied distribution peaks at around 0.3 to 0.4, with
some discrete peaks this statistically preferred values are not
outside the range of values normally used for dissimilarity measures - thus dissimilarity measures can be influence by chance occurrence or biased by statistically preferred Tanimoto values
What we want to What we want to know ….know ….
Is there a threshold point in similarity value or Is there a threshold point in similarity value or distance between two compounds such that they distance between two compounds such that they still have a meaningful biological similarity ?still have a meaningful biological similarity ?
If that is so, then we can say that ….If that is so, then we can say that ….
DBCS way of finding most dissimilar molecule is DBCS way of finding most dissimilar molecule is not very useful because at low level of similarity, not very useful because at low level of similarity, the values do not have much meaning and the values do not have much meaning and compounds might as well be selected randomly. compounds might as well be selected randomly.
Now, how do we find Now, how do we find out about this ?out about this ?
• Try to see whether distribution of bit string based similarity measures can be Try to see whether distribution of bit string based similarity measures can be reproduced by randomly generated bit strings, especially at lower similarity values reproduced by randomly generated bit strings, especially at lower similarity values
• If the above is true, then we know that the similarity values range of which the If the above is true, then we know that the similarity values range of which the distribution between real and random are the same, does not bear much meaningdistribution between real and random are the same, does not bear much meaning
Real life datasets usedReal life datasets used
ID Alert,ID Alert, a database of 11607 investigational a database of 11607 investigational drugs of various activities.drugs of various activities.
Aids99Aids99, a selection of 5772 compounds , a selection of 5772 compounds tested for Aids, which contains various tested for Aids, which contains various actives, moderately actives and inactivesactives, moderately actives and inactives..
Types of bit strings testedTypes of bit strings tested• BCI bit stringsBCI bit strings
structural key based (dictionary used - BCI 1052 ) folded into 1052 bits
Daylight fingerprintsDaylight fingerprints Hashed fingerprints length = 2048
Unity 2-DUnity 2-D hashed + structural key based length = 992 bits
Purely random generated bit strings.Purely random generated bit strings. Randomly generated bit string dataset with priority given to bits Randomly generated bit string dataset with priority given to bits
that occur more frequently in the real datasetthat occur more frequently in the real dataset Randomly generated bit string dataset with co-occurrence of Randomly generated bit string dataset with co-occurrence of
bits derived from the real dataset taken into accountbits derived from the real dataset taken into account Randomly generated bit string dataset with priority given to bits Randomly generated bit string dataset with priority given to bits
that occur more frequently in the real dataset and co-occurrence that occur more frequently in the real dataset and co-occurrence of bits derived from the real dataset taken into account of bits derived from the real dataset taken into account
Types of random bit strings Types of random bit strings testedtested
Similarity measures Similarity measures studiedstudied
• Tanimoto coefficient Tanimoto coefficient
• Complement of Euclidean Complement of Euclidean distancedistance
• Cosine coefficientCosine coefficient
3 way comparisons 3 way comparisons donedone
Line graphsLine graphs Chi squareChi square Kolmogorov-Kolmogorov-SmirnovSmirnov
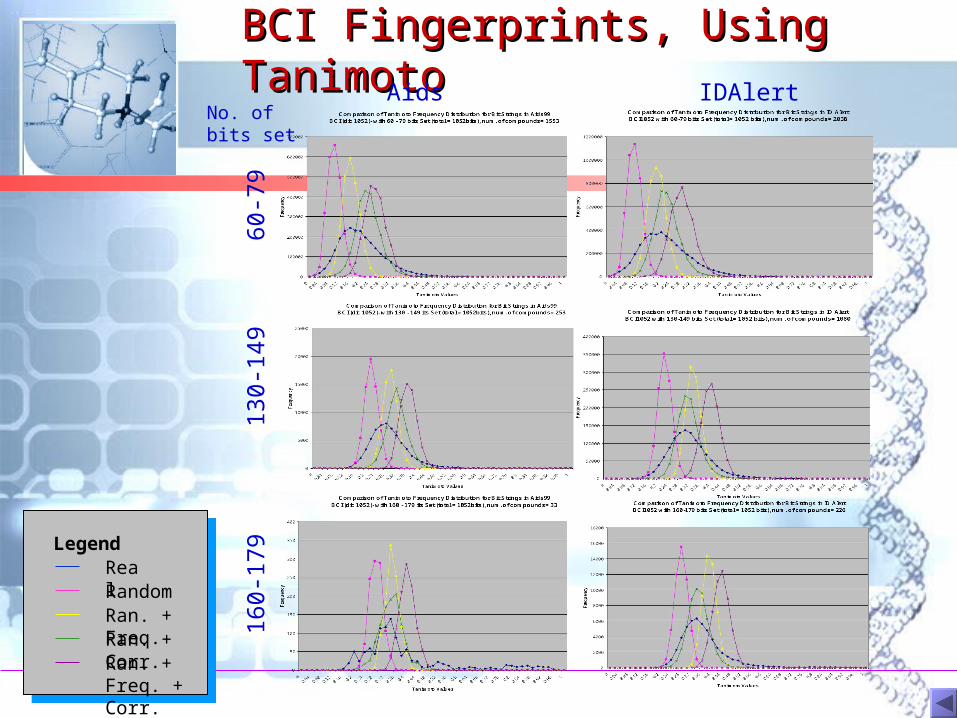
BCI Fingerprints, Using BCI Fingerprints, Using TanimotoTanimotoAids IDAlert
60-7
913
0-14
916
0-17
9
No. of bits set
Ran. + Freq.Ran. + Corr.
Real
Ran. + Freq. + Corr.
Legend
Random
The ability of random bit strings The ability of random bit strings to obtain similar distribution of to obtain similar distribution of intermolecular similarity valuesintermolecular similarity values
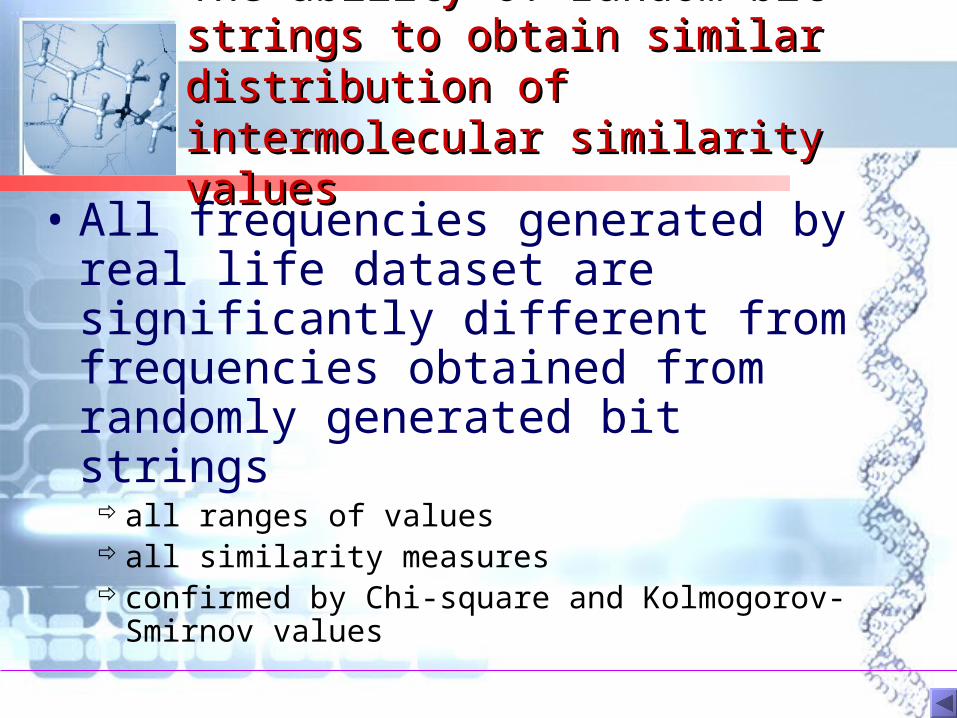
• All frequencies generated by real life dataset are significantly different from frequencies obtained from randomly generated bit strings
all ranges of values all similarity measures confirmed by Chi-square and Kolmogorov-
Smirnov values
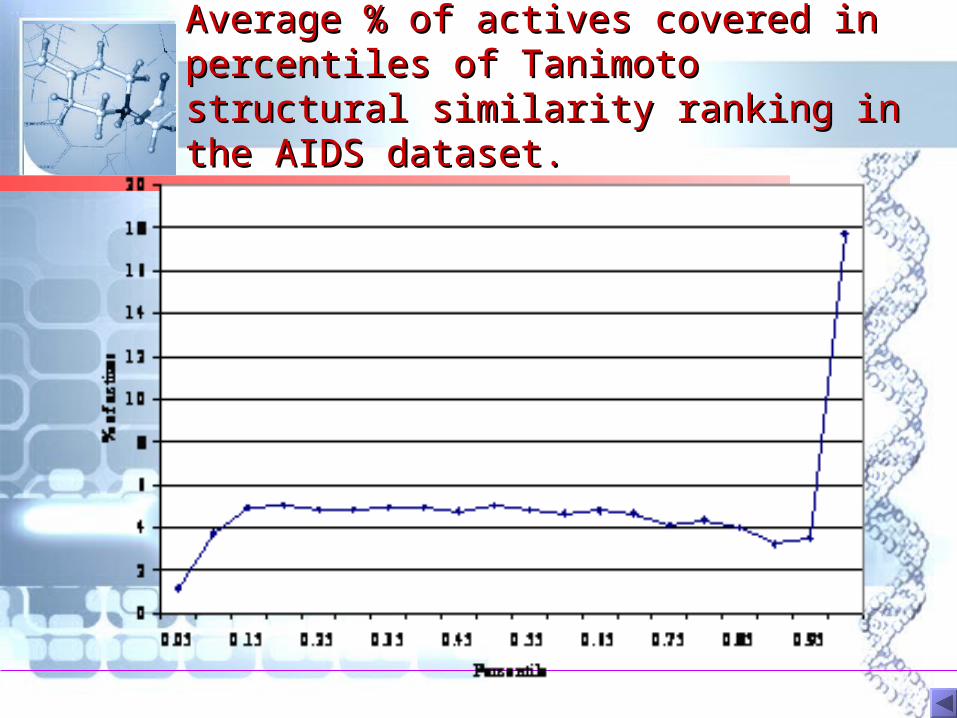
Average % of actives covered in Average % of actives covered in percentiles of Tanimoto structural percentiles of Tanimoto structural similarity ranking in the AIDS similarity ranking in the AIDS dataset. dataset.
All similarity values do All similarity values do have some meaninghave some meaning
• Distribution of bit string based similarity Distribution of bit string based similarity measures cannot be reproduced by measures cannot be reproduced by randomly generated bit strings, even at randomly generated bit strings, even at lower similarity values lower similarity values
• Randomly generated bit strings produce Randomly generated bit strings produce significantly different distribution from the significantly different distribution from the real datasetreal dataset
ClusteringClustering
• Group molecules into clusters Group molecules into clusters so that so that molecules within a cluster are
similar molecules from different
clusters are dissimilar
• Choose one or more from Choose one or more from each clustereach cluster
• Ward’s clustering has been Ward’s clustering has been used as the industry standardused as the industry standard
Soft-computing based Soft-computing based clusteringclustering
• Fuzzy c-means clusteringFuzzy c-means clustering• Genetic-algorithm based clusteringGenetic-algorithm based clustering• Kohonen Self Organizing Maps Kohonen Self Organizing Maps • Neural Gas NetworkNeural Gas Network• Enhanced Neural Gas NetworkEnhanced Neural Gas Network• Fuzzy C-meansFuzzy C-means• Fuzzy Gustafson KesselFuzzy Gustafson Kessel• Hierarchical Fuzzy C-meansHierarchical Fuzzy C-means• Fuzzy Kohonen Self Organizing MapsFuzzy Kohonen Self Organizing Maps
Performance MeasurePerformance Measure
• Proportion of actives in active cluster Proportion of actives in active cluster subsetsubset
• A cluster is active if it contain at least A cluster is active if it contain at least one active moleculeone active molecule
• A set of all the active clusters is called A set of all the active clusters is called Active cluster subsetActive cluster subset
• All the singletons are omitted from All the singletons are omitted from the active cluster subsetthe active cluster subset
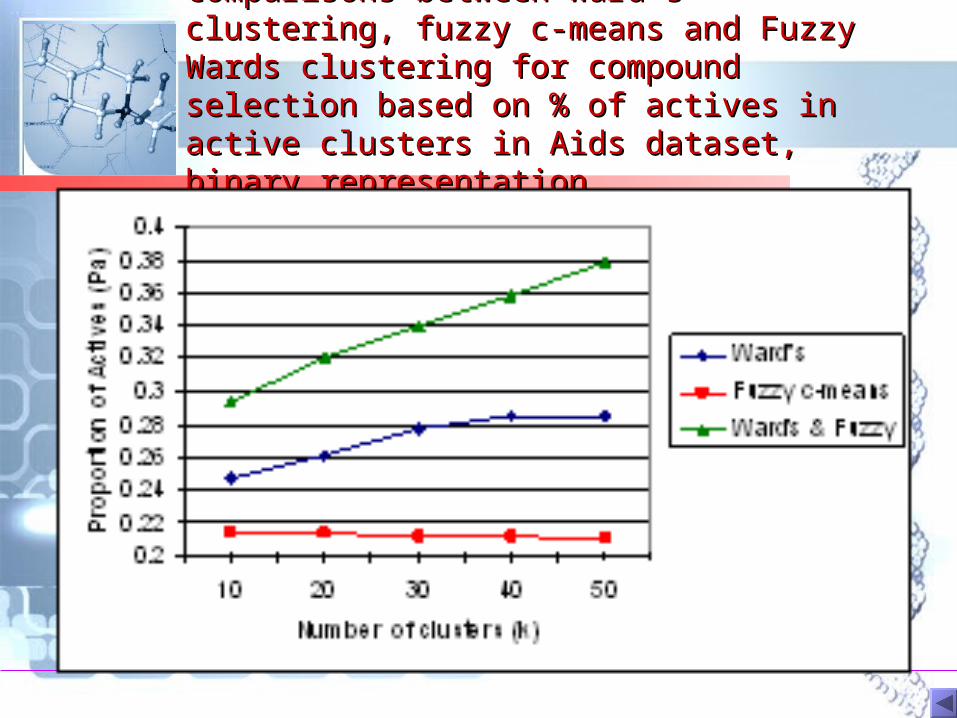
Comparisons between Ward’s clustering, Comparisons between Ward’s clustering, fuzzy c-means and Fuzzy Wards clustering fuzzy c-means and Fuzzy Wards clustering for compound selection based on % of for compound selection based on % of actives in active clusters in Aids dataset, actives in active clusters in Aids dataset, binary representationbinary representation
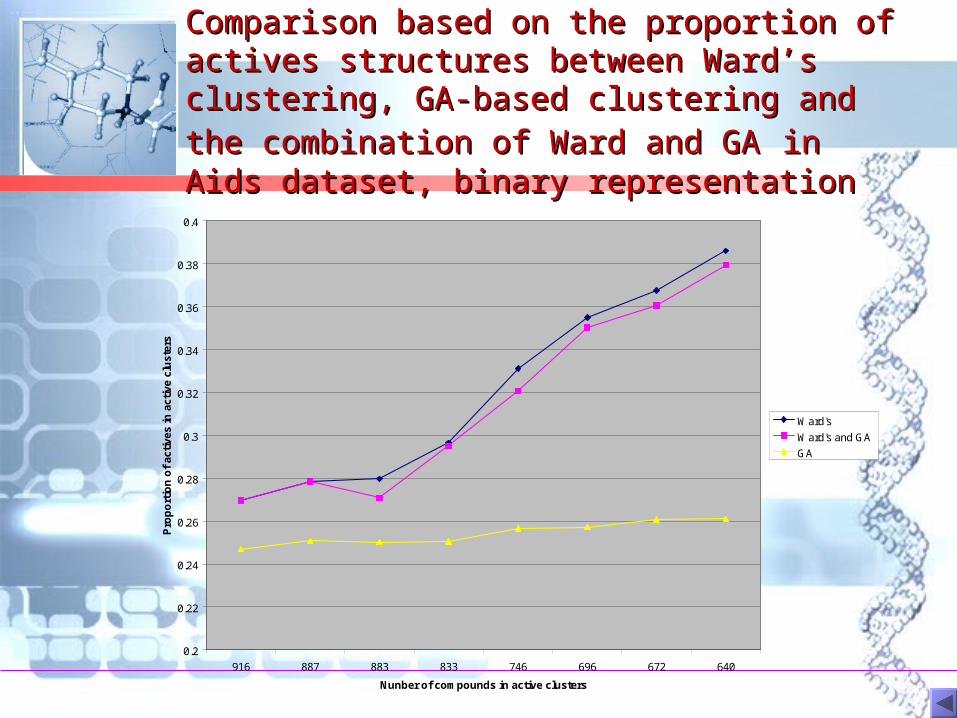
Comparison based on the proportion of Comparison based on the proportion of actives structures between Ward’s actives structures between Ward’s clustering, GA-based clustering and the clustering, GA-based clustering and the combination of Ward and GAcombination of Ward and GA in Aids in Aids dataset, binary representationdataset, binary representation
0.2
0.22
0.24
0.26
0.28
0.3
0.32
0.34
0.36
0.38
0.4
916 887 883 833 746 696 672 640
Nunber of compounds in active clusters
Pro
po
rtio
n o
f ac
tiv
es in
act
ive
clu
ste
rs
Ward's
Ward's and GA
GA
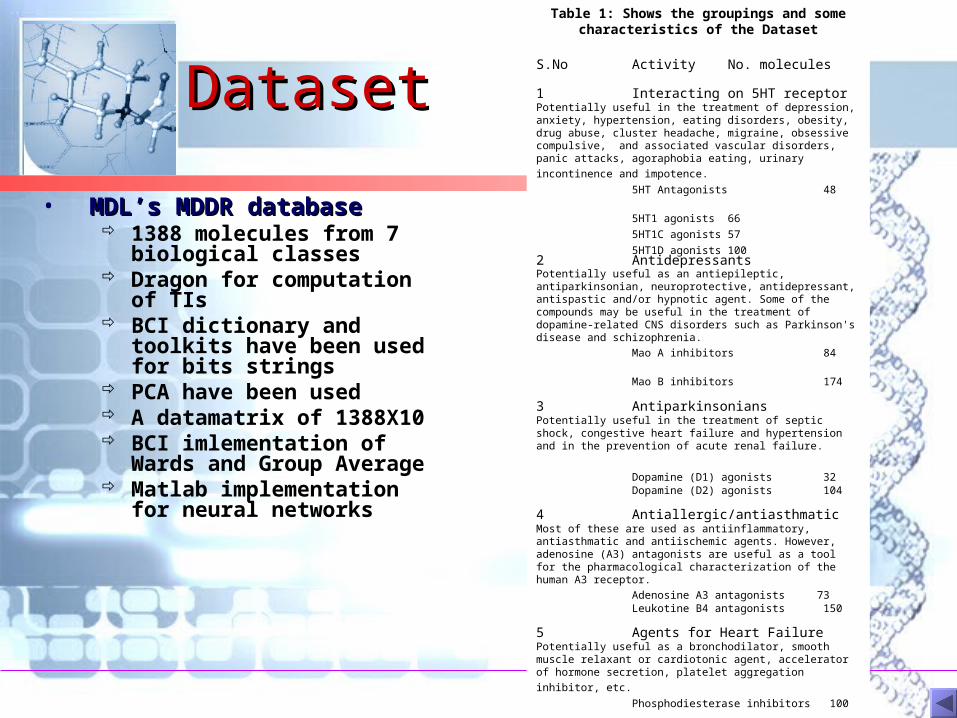
DatasetDataset
• MDL’s MDDR databaseMDL’s MDDR database 1388 molecules from 7
biological classes Dragon for computation
of TIs BCI dictionary and
toolkits have been used for bits strings
PCA have been used A datamatrix of 1388X10 BCI imlementation of
Wards and Group Average Matlab implementation
for neural networks
Table 1: Shows the groupings and some characteristics of the Dataset
S.No Activity No. molecules1 Interacting on 5HT receptorPotentially useful in the treatment of depression, anxiety, hypertension, eating disorders, obesity, drug abuse, cluster headache, migraine, obsessive compulsive, and associated vascular disorders, panic attacks,
agoraphobia eating, urinary incontinence and impotence.
5HT Antagonists 48
5HT1 agonists 66
5HT1C agonists 57
5HT1D agonists 1002 AntidepressantsPotentially useful as an antiepileptic, antiparkinsonian, neuroprotective, antidepressant, antispastic and/or hypnotic agent. Some of the compounds may be useful in the treatment of dopamine-related CNS disorders such as Parkinson's disease and schizophrenia.
Mao A inhibitors 84
Mao B inhibitors 1743 AntiparkinsoniansPotentially useful in the treatment of septic shock, congestive heart failure
and hypertension and in the prevention of acute renal failure.
Dopamine (D1) agonists 32Dopamine (D2) agonists 1044 Antiallergic/antiasthmaticMost of these are used as antiinflammatory, antiasthmatic and antiischemic agents. However, adenosine (A3) antagonists are useful as a tool for the pharmacological characterization of the human A3 receptor.
Adenosine A3 antagonists 73Leukotine B4 antagonists 1505 Agents for Heart FailurePotentially useful as a bronchodilator, smooth muscle relaxant or cardiotonic agent, accelerator of hormone secretion, platelet aggregation
inhibitor, etc.
Phosphodiesterase inhibitors 1006 AntiArrythmicsMost of the Potassium channel blockers block the cardiac ion channel carrying the rapid component of the delayed rectifier potassium current.
Potassium channel blockers 100 Calcium channel blockers 100
7 Antihypertensives ACE inhibitors 100 Adrenergic (alpha 2) blockers 100
Total molecules 1388
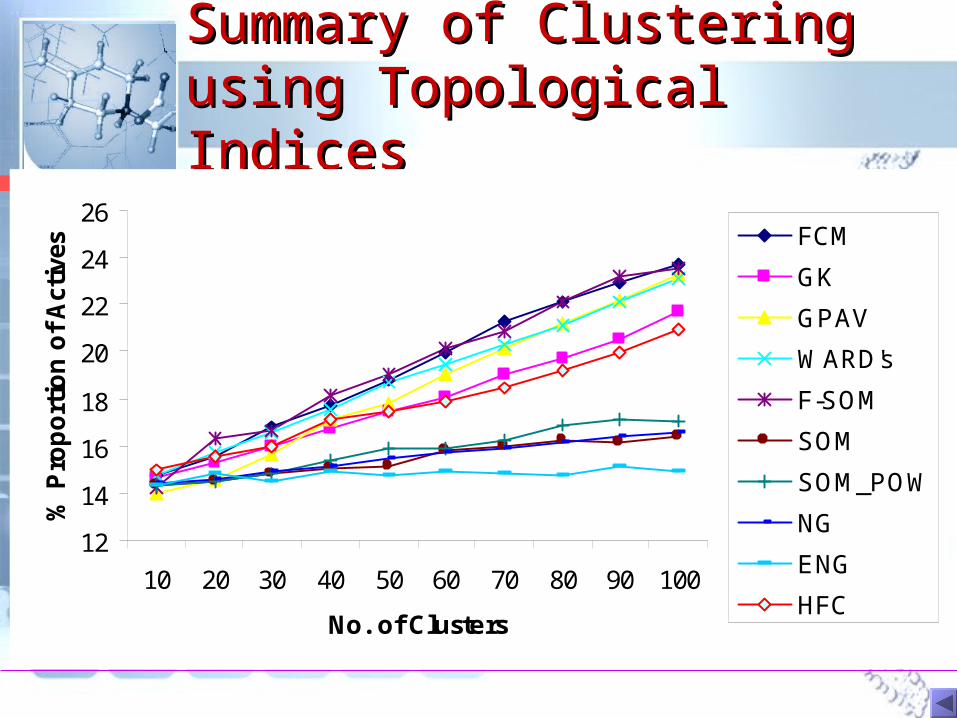
Summary of Clustering Summary of Clustering using Topological Indicesusing Topological Indices
12
14
16
18
20
22
24
26
10 20 30 40 50 60 70 80 90 100
No. of Clusters
% P
rop
ort
ion
of
Act
ives
|
FCM
GK
GPAV
WARD's
F-SOM
SOM
SOM_POW
NG
ENG
HFC
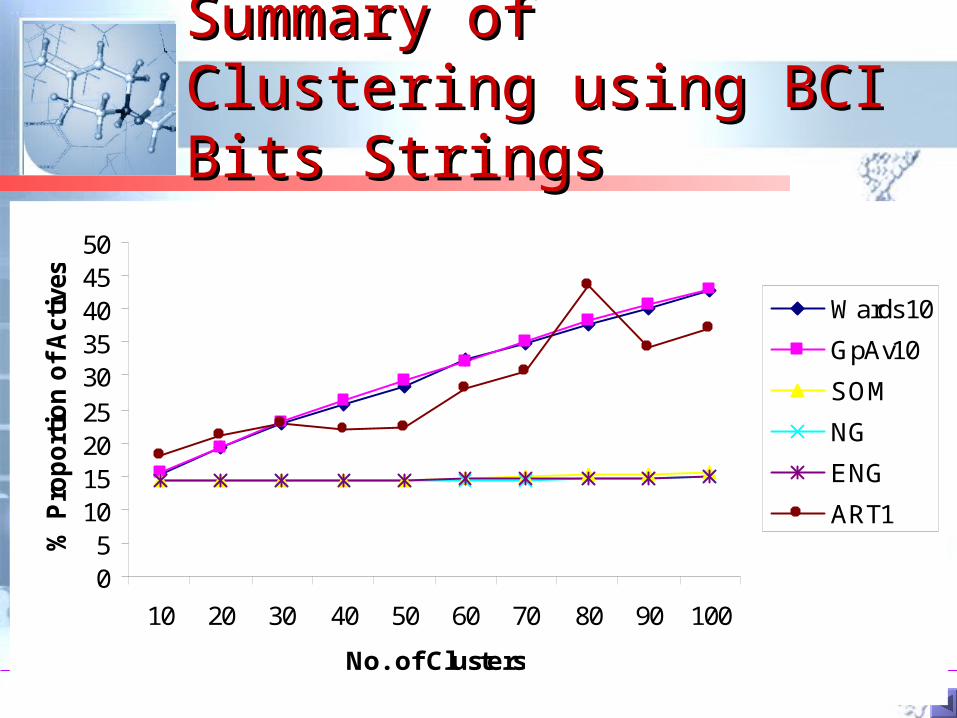
Summary of Clustering Summary of Clustering using BCI Bits Stringsusing BCI Bits Strings
05
101520253035404550
10 20 30 40 50 60 70 80 90 100
No. of Clusters
% P
rop
ort
ion
of
Act
ives
|
Wards10
GpAv10
SOM
NG
ENG
ART1
AcknowledgementsAcknowledgements
• Jehan Zeb Shah, Shahrin Huspi, Rosmayati Jehan Zeb Shah, Shahrin Huspi, Rosmayati Mohamed, Abo Obaida, Willa Welmina Geoffrey, Mohamed, Abo Obaida, Willa Welmina Geoffrey, Peter Willett, John HollidayPeter Willett, John Holliday
• Barnard Chemical Information Ltd., United Barnard Chemical Information Ltd., United Kingdom – provision of cheminformatics Kingdom – provision of cheminformatics software software
• Kerbs Insitute of Biomolecular Research, United Kerbs Insitute of Biomolecular Research, United Kingdom Kingdom – research collaborator, external – research collaborator, external supervision for research student supervision for research student
• Daylight Chemical Information Systems, Inc., Daylight Chemical Information Systems, Inc., Mission Veijo, California Mission Veijo, California – provision of – provision of cheminformatics software and datacheminformatics software and data
• CyberChem Group, Fakulti Sains UTM – CyberChem Group, Fakulti Sains UTM – provision of cheminformatics software and dataprovision of cheminformatics software and data
Thank youThank you