Embed Size (px)
Citation preview
p 1
Simple, Fast and Robust Method for Plasmid Purity Testing and Degradation Monitoring
Capillary Electrophoresis-Laser Induced Fluorescence Detection (CE-LIF)
Jane Luo, Tingting Li, and Mukesh Malik SCIEX, Brea, California
Introduction
Plasmid DNA is often used as the gene delivery vehicle for vaccinations and gene-therapy products. It is also an important intermediate in making Adeno-associated viruses and lentiviruses. The Food and Drug Administration (FDA) guidelines recommend manufacturers include a specification of > 80% supercoiled plasmid content for bulk release (Ref 1). Capillary electrophoresis with laser-induced fluorescence detection (CE-LIF) provides a rapid, sensitive, reproducible and automated method for the quantitative analysis of plasmid DNA isoforms. Advantages of CE-LIF over slab-gel electrophoresis include rapid analysis time, minimal sample handling, simpler set up and preparation time, greater sensitivity and reproducibility, more accurate quantitation, automated sample loading, and reduced waste generation. This technical note describes a CE-LIF method for plasmid analysis. In this method, the supercoiled, linearized and open circular plasmid isoforms for 5 kilobase and 7 kilobase plasmids can be reproducibly separated with baseline resolution in less than 15 minutes.
Figure 1. The PA 800 Plus Pharmaceutical Analysis System (A), the dsDNA 1000 Kit (B) and the LIFluor EnhanCE Stain (C).
Key Features
• Complete workflow solution for plasmid analysis including
hardware, software and reagent kits
• Baseline resolution of supercoiled, linear and open circular
plasmid isoforms
• Sample separation takes less than 12 minutes
• Increased throughput for analysis via automated sample
separation and data analysis
• Robust, good repeatability quantitative assay with RSD of
0.23% for migration time and 0.61% for % area
• Capable of monitoring low-level plasmid degradants
• Less waste generation than slab gel method
• LIFluor EnhanCE stain in this method is safer than ethidium
bromide used in slab gel method
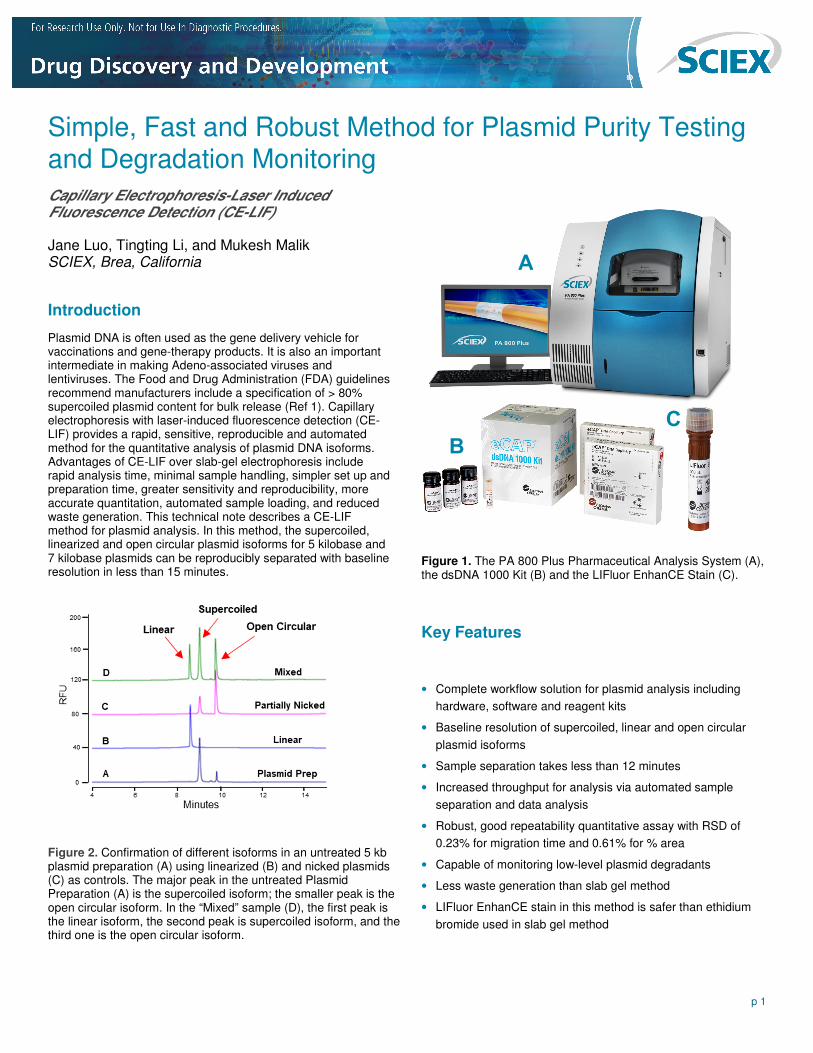
Figure 2. Confirmation of different isoforms in an untreated 5 kb plasmid preparation (A) using linearized (B) and nicked plasmids (C) as controls. The major peak in the untreated Plasmid Preparation (A) is the supercoiled isoform; the smaller peak is the open circular isoform. In the “Mixed” sample (D), the first peak is the linear isoform, the second peak is supercoiled isoform, and the third one is the open circular isoform.
A
B
C
p 2
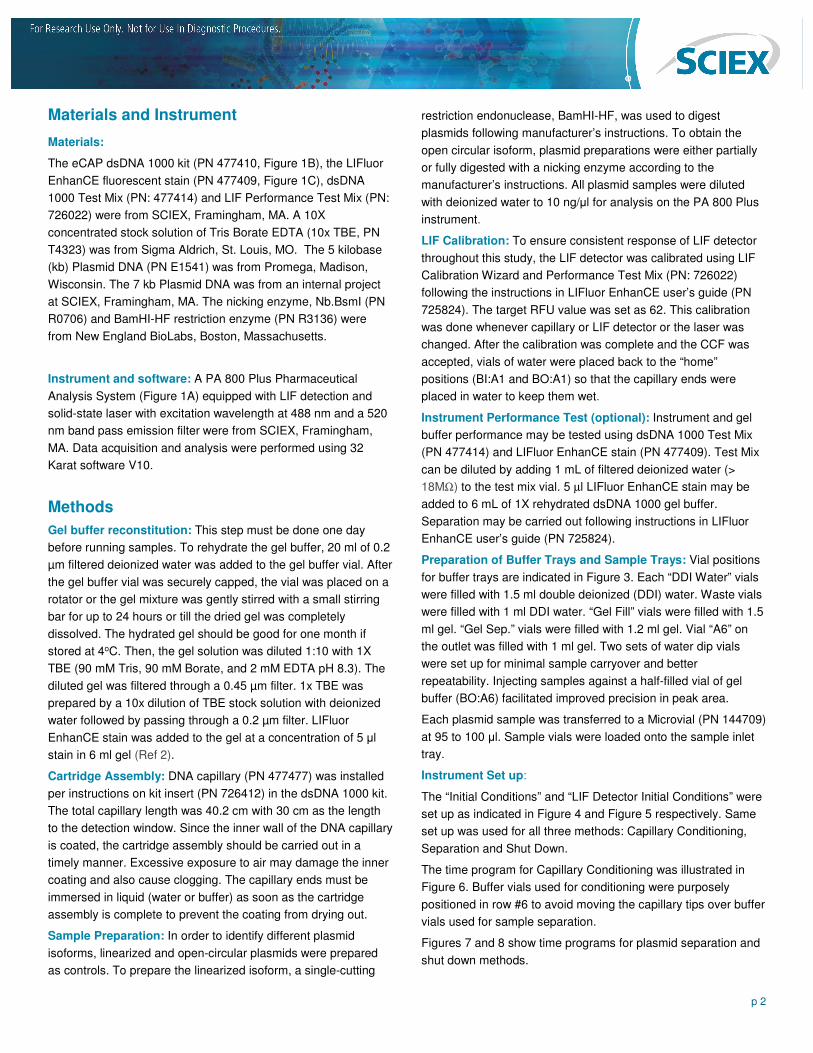
Materials and Instrument
Materials:
The eCAP dsDNA 1000 kit (PN 477410, Figure 1B), the LIFluor
EnhanCE fluorescent stain (PN 477409, Figure 1C), dsDNA
1000 Test Mix (PN: 477414) and LIF Performance Test Mix (PN:
726022) were from SCIEX, Framingham, MA. A 10X
concentrated stock solution of Tris Borate EDTA (10x TBE, PN
T4323) was from Sigma Aldrich, St. Louis, MO. The 5 kilobase
(kb) Plasmid DNA (PN E1541) was from Promega, Madison,
Wisconsin. The 7 kb Plasmid DNA was from an internal project
at SCIEX, Framingham, MA. The nicking enzyme, Nb.BsmI (PN
R0706) and BamHI-HF restriction enzyme (PN R3136) were
from New England BioLabs, Boston, Massachusetts.
Instrument and software: A PA 800 Plus Pharmaceutical
Analysis System (Figure 1A) equipped with LIF detection and
solid-state laser with excitation wavelength at 488 nm and a 520
nm band pass emission filter were from SCIEX, Framingham,
MA. Data acquisition and analysis were performed using 32
Karat software V10.
Methods
Gel buffer reconstitution: This step must be done one day
before running samples. To rehydrate the gel buffer, 20 ml of 0.2
µm filtered deionized water was added to the gel buffer vial. After
the gel buffer vial was securely capped, the vial was placed on a
rotator or the gel mixture was gently stirred with a small stirring
bar for up to 24 hours or till the dried gel was completely
dissolved. The hydrated gel should be good for one month if
stored at 4oC. Then, the gel solution was diluted 1:10 with 1X
TBE (90 mM Tris, 90 mM Borate, and 2 mM EDTA pH 8.3). The
diluted gel was filtered through a 0.45 µm filter. 1x TBE was
prepared by a 10x dilution of TBE stock solution with deionized
water followed by passing through a 0.2 µm filter. LIFluor
EnhanCE stain was added to the gel at a concentration of 5 μl
stain in 6 ml gel (Ref 2).
Cartridge Assembly: DNA capillary (PN 477477) was installed
per instructions on kit insert (PN 726412) in the dsDNA 1000 kit.
The total capillary length was 40.2 cm with 30 cm as the length
to the detection window. Since the inner wall of the DNA capillary
is coated, the cartridge assembly should be carried out in a
timely manner. Excessive exposure to air may damage the inner
coating and also cause clogging. The capillary ends must be
immersed in liquid (water or buffer) as soon as the cartridge
assembly is complete to prevent the coating from drying out.
Sample Preparation: In order to identify different plasmid
isoforms, linearized and open-circular plasmids were prepared
as controls. To prepare the linearized isoform, a single-cutting
restriction endonuclease, BamHI-HF, was used to digest
plasmids following manufacturer’s instructions. To obtain the
open circular isoform, plasmid preparations were either partially
or fully digested with a nicking enzyme according to the
manufacturer’s instructions. All plasmid samples were diluted
with deionized water to 10 ng/μl for analysis on the PA 800 Plus
instrument.
LIF Calibration: To ensure consistent response of LIF detector
throughout this study, the LIF detector was calibrated using LIF
Calibration Wizard and Performance Test Mix (PN: 726022)
following the instructions in LIFluor EnhanCE user’s guide (PN
725824). The target RFU value was set as 62. This calibration
was done whenever capillary or LIF detector or the laser was
changed. After the calibration was complete and the CCF was
accepted, vials of water were placed back to the “home”
positions (BI:A1 and BO:A1) so that the capillary ends were
placed in water to keep them wet.
Instrument Performance Test (optional): Instrument and gel
buffer performance may be tested using dsDNA 1000 Test Mix
(PN 477414) and LIFluor EnhanCE stain (PN 477409). Test Mix
can be diluted by adding 1 mL of filtered deionized water (>
18MΩ) to the test mix vial. 5 µl LIFluor EnhanCE stain may be
added to 6 mL of 1X rehydrated dsDNA 1000 gel buffer.
Separation may be carried out following instructions in LIFluor
EnhanCE user’s guide (PN 725824).
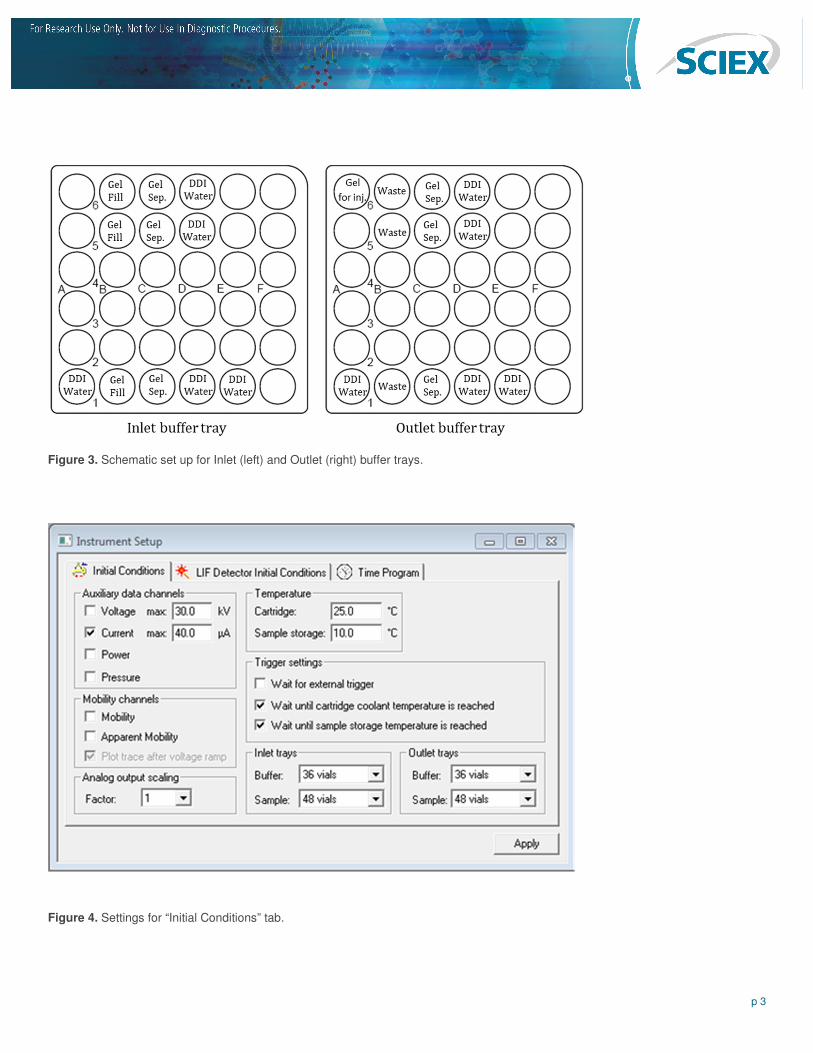
Preparation of Buffer Trays and Sample Trays: Vial positions
for buffer trays are indicated in Figure 3. Each “DDI Water” vials
were filled with 1.5 ml double deionized (DDI) water. Waste vials
were filled with 1 ml DDI water. “Gel Fill” vials were filled with 1.5
ml gel. “Gel Sep.” vials were filled with 1.2 ml gel. Vial “A6” on
the outlet was filled with 1 ml gel. Two sets of water dip vials
were set up for minimal sample carryover and better
repeatability. Injecting samples against a half-filled vial of gel
buffer (BO:A6) facilitated improved precision in peak area.
Each plasmid sample was transferred to a Microvial (PN 144709)
at 95 to 100 μl. Sample vials were loaded onto the sample inlet
tray.
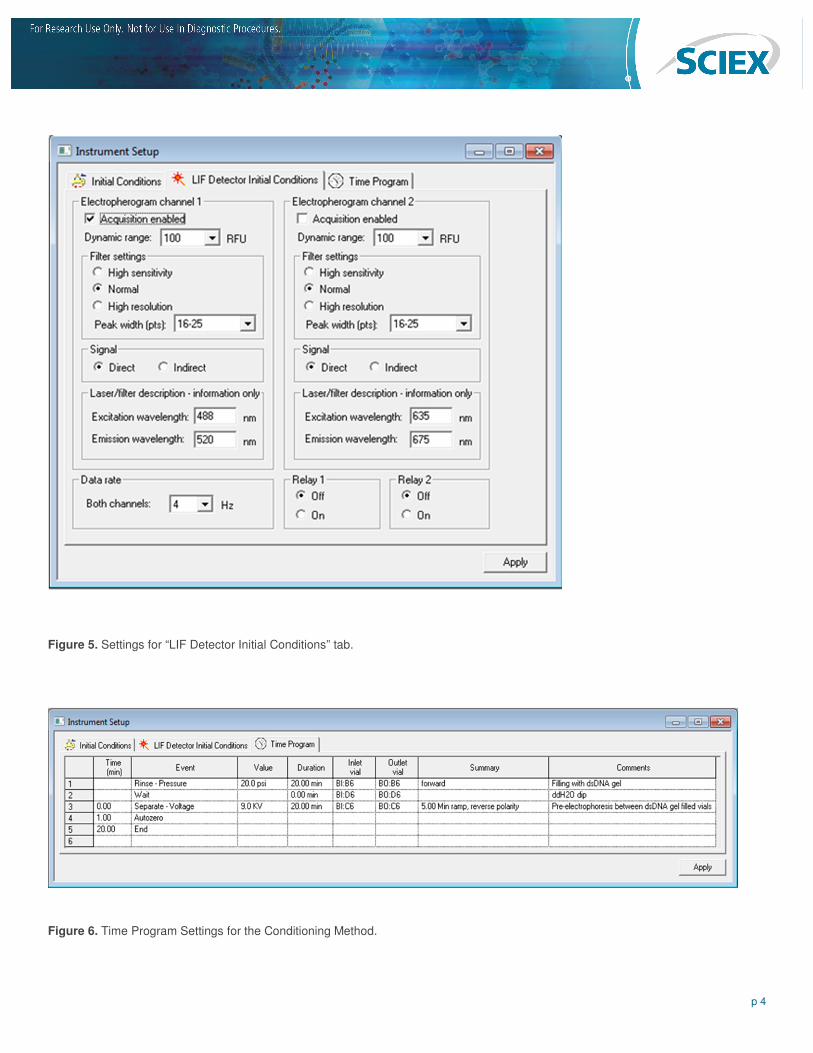
Instrument Set up:
The “Initial Conditions” and “LIF Detector Initial Conditions” were
set up as indicated in Figure 4 and Figure 5 respectively. Same
set up was used for all three methods: Capillary Conditioning,
Separation and Shut Down.
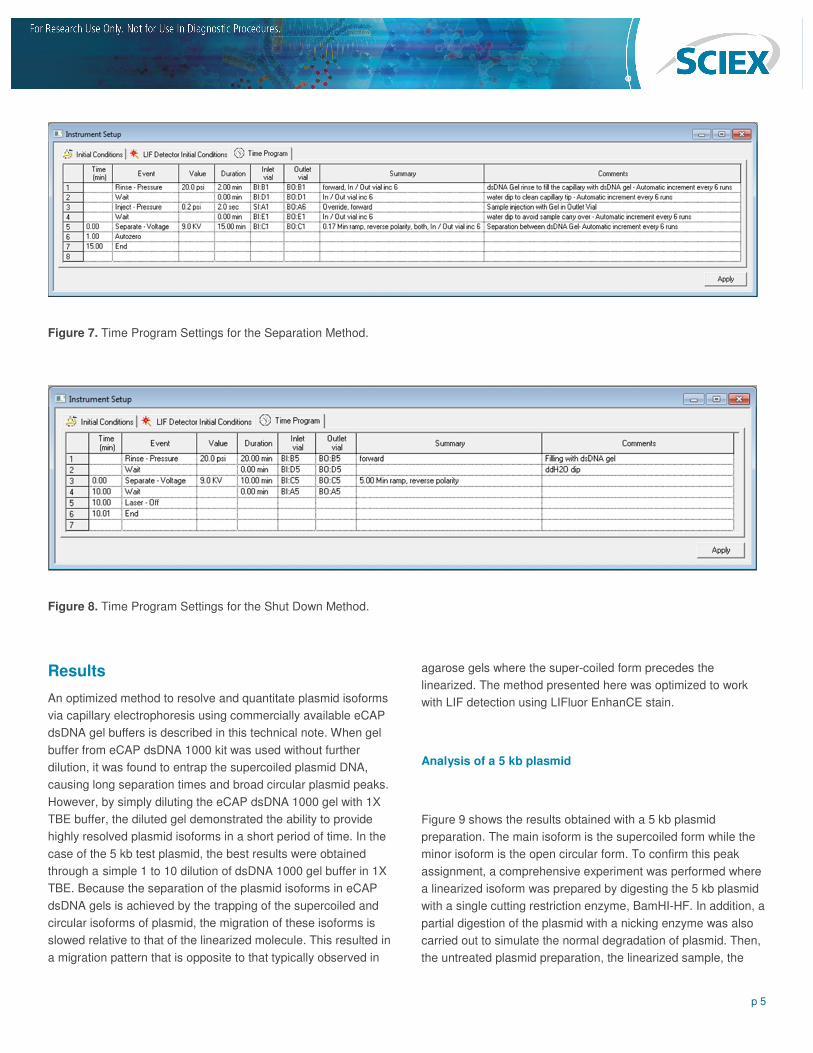
The time program for Capillary Conditioning was illustrated in
Figure 6. Buffer vials used for conditioning were purposely
positioned in row #6 to avoid moving the capillary tips over buffer
vials used for sample separation.
Figures 7 and 8 show time programs for plasmid separation and
shut down methods.
p 3
Figure 3. Schematic set up for Inlet (left) and Outlet (right) buffer trays.
Figure 4. Settings for “Initial Conditions” tab.
p 4
Figure 5. Settings for “LIF Detector Initial Conditions” tab.
Figure 6. Time Program Settings for the Conditioning Method.
p 5
Results
An optimized method to resolve and quantitate plasmid isoforms
via capillary electrophoresis using commercially available eCAP
dsDNA gel buffers is described in this technical note. When gel
buffer from eCAP dsDNA 1000 kit was used without further
dilution, it was found to entrap the supercoiled plasmid DNA,
causing long separation times and broad circular plasmid peaks.
However, by simply diluting the eCAP dsDNA 1000 gel with 1X
TBE buffer, the diluted gel demonstrated the ability to provide
highly resolved plasmid isoforms in a short period of time. In the
case of the 5 kb test plasmid, the best results were obtained
through a simple 1 to 10 dilution of dsDNA 1000 gel buffer in 1X
TBE. Because the separation of the plasmid isoforms in eCAP
dsDNA gels is achieved by the trapping of the supercoiled and
circular isoforms of plasmid, the migration of these isoforms is
slowed relative to that of the linearized molecule. This resulted in
a migration pattern that is opposite to that typically observed in
agarose gels where the super-coiled form precedes the
linearized. The method presented here was optimized to work
with LIF detection using LIFluor EnhanCE stain.
Analysis of a 5 kb plasmid
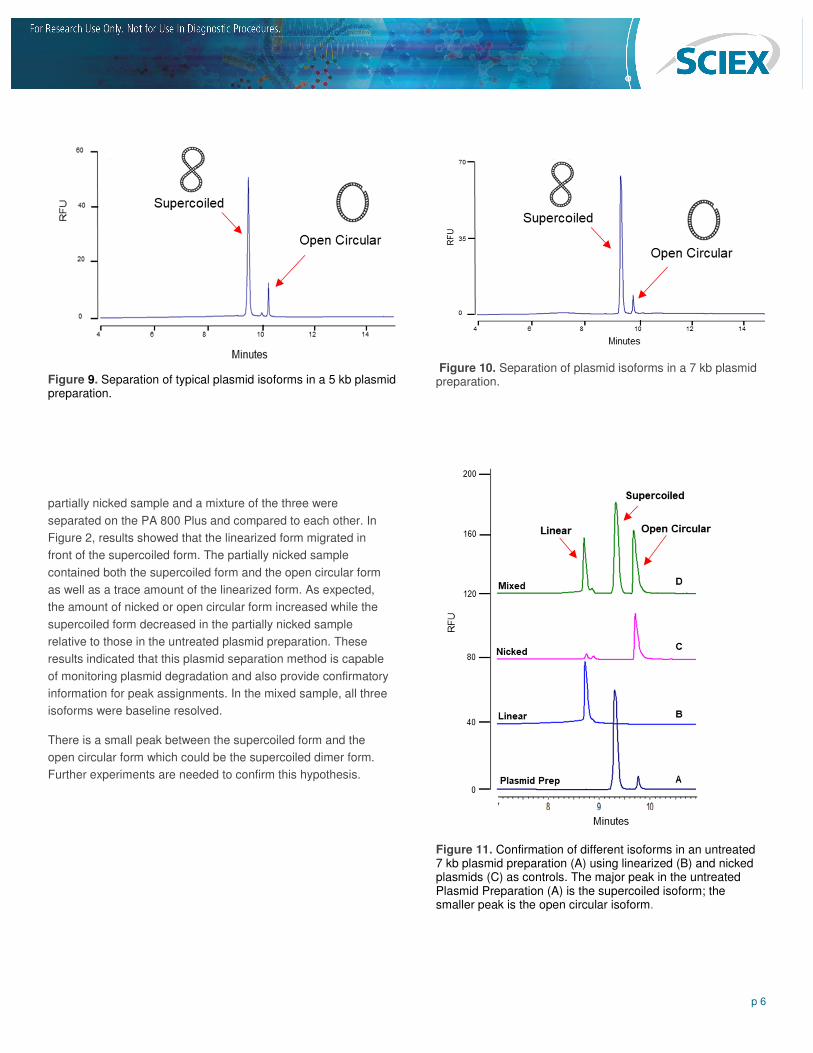
Figure 9 shows the results obtained with a 5 kb plasmid
preparation. The main isoform is the supercoiled form while the
minor isoform is the open circular form. To confirm this peak
assignment, a comprehensive experiment was performed where
a linearized isoform was prepared by digesting the 5 kb plasmid
with a single cutting restriction enzyme, BamHI-HF. In addition, a
partial digestion of the plasmid with a nicking enzyme was also
carried out to simulate the normal degradation of plasmid. Then,
the untreated plasmid preparation, the linearized sample, the
Figure 7. Time Program Settings for the Separation Method.
Figure 8. Time Program Settings for the Shut Down Method.
p 6
partially nicked sample and a mixture of the three were
separated on the PA 800 Plus and compared to each other. In
Figure 2, results showed that the linearized form migrated in
front of the supercoiled form. The partially nicked sample
contained both the supercoiled form and the open circular form
as well as a trace amount of the linearized form. As expected,
the amount of nicked or open circular form increased while the
supercoiled form decreased in the partially nicked sample
relative to those in the untreated plasmid preparation. These
results indicated that this plasmid separation method is capable
of monitoring plasmid degradation and also provide confirmatory
information for peak assignments. In the mixed sample, all three
isoforms were baseline resolved.
There is a small peak between the supercoiled form and the
open circular form which could be the supercoiled dimer form.
Further experiments are needed to confirm this hypothesis.
Figure 10. Separation of plasmid isoforms in a 7 kb plasmid preparation.
Figure 11. Confirmation of different isoforms in an untreated 7 kb plasmid preparation (A) using linearized (B) and nicked plasmids (C) as controls. The major peak in the untreated Plasmid Preparation (A) is the supercoiled isoform; the smaller peak is the open circular isoform.
Figure 9. Separation of typical plasmid isoforms in a 5 kb plasmid preparation.
p 7
Analysis of a 7 kb plasmid
The plasmid analysis method using dsDNA 1000 gel, coated
DNA capillary and LIFluor EnhanCE stain was further evaluated
using a 7 kb plasmid. In Figure 10, results show a baseline
resolution of the supercoiled form and the open circular form.
The amount of open circular form was very low. There was no
other isoform present, indicating that this is a high quality
plasmid preparation. Further experiments were carried out to
ensure that the small open circular peak was the nicked isoform.
A linearized isoform was prepared by digesting this 7 kb plasmid
with a single cutting restriction enzyme, BamHI-HF. In addition, a
complete digestion of the plasmid with a nicking enzyme was
also carried out. At the end of the digestion with the nicking
enzyme, the reaction mixture was also heated at 80oC for 20 min
to inactivate the enzyme. Then, the untreated plasmid
preparation, the linearized sample, the fully nicked sample and a
mixture of the three were separated on the PA 800 Plus and
compared to each other. In Figure 11, results shows the small
peak in the untreated plasmid preparation was indeed the open
circular form. In the fully nicked plasmid sample, there was no
supercoiled isoform present. In addition, there was a small
amount of linear form present possibly due to further degradation
during the heat inactivation of the nicking enzyme. Once again,
the results in this experiment indicates that this plasmid analysis
method provides accurate assessment of the isoforms in plasmid
preparation and is also capable of monitoring plasmid
degradation.
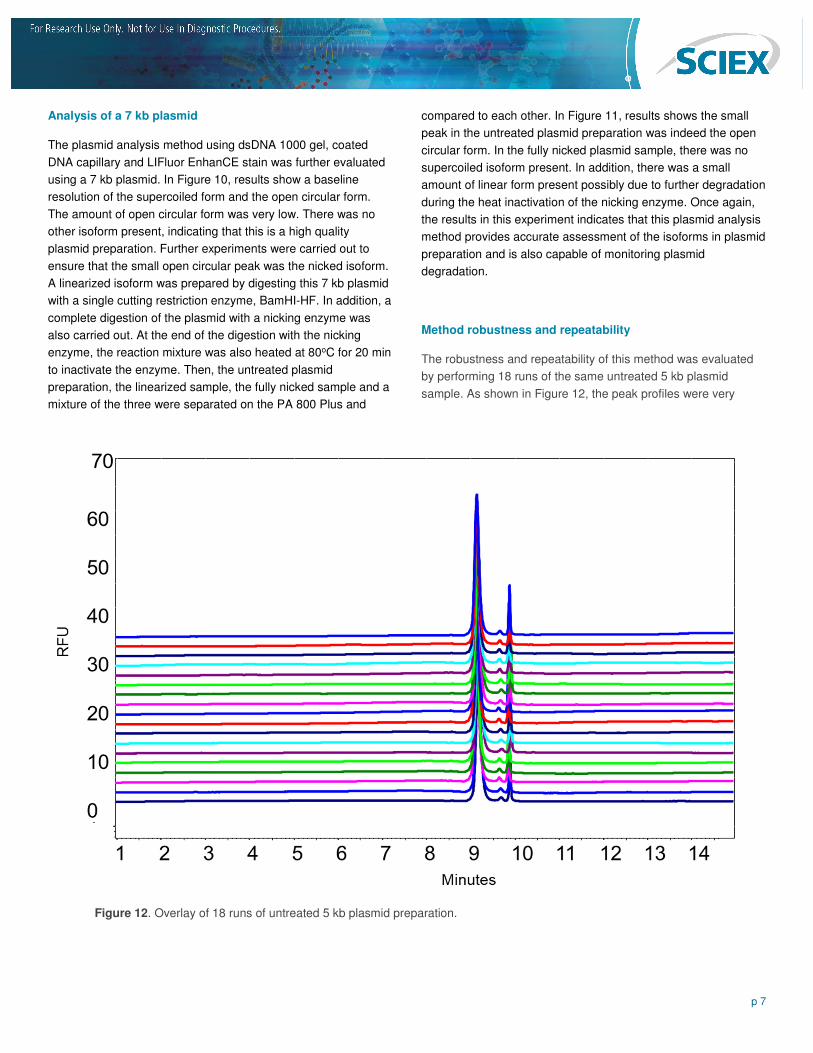
Method robustness and repeatability
The robustness and repeatability of this method was evaluated
by performing 18 runs of the same untreated 5 kb plasmid
sample. As shown in Figure 12, the peak profiles were very
Figure 12. Overlay of 18 runs of untreated 5 kb plasmid preparation.
p 8
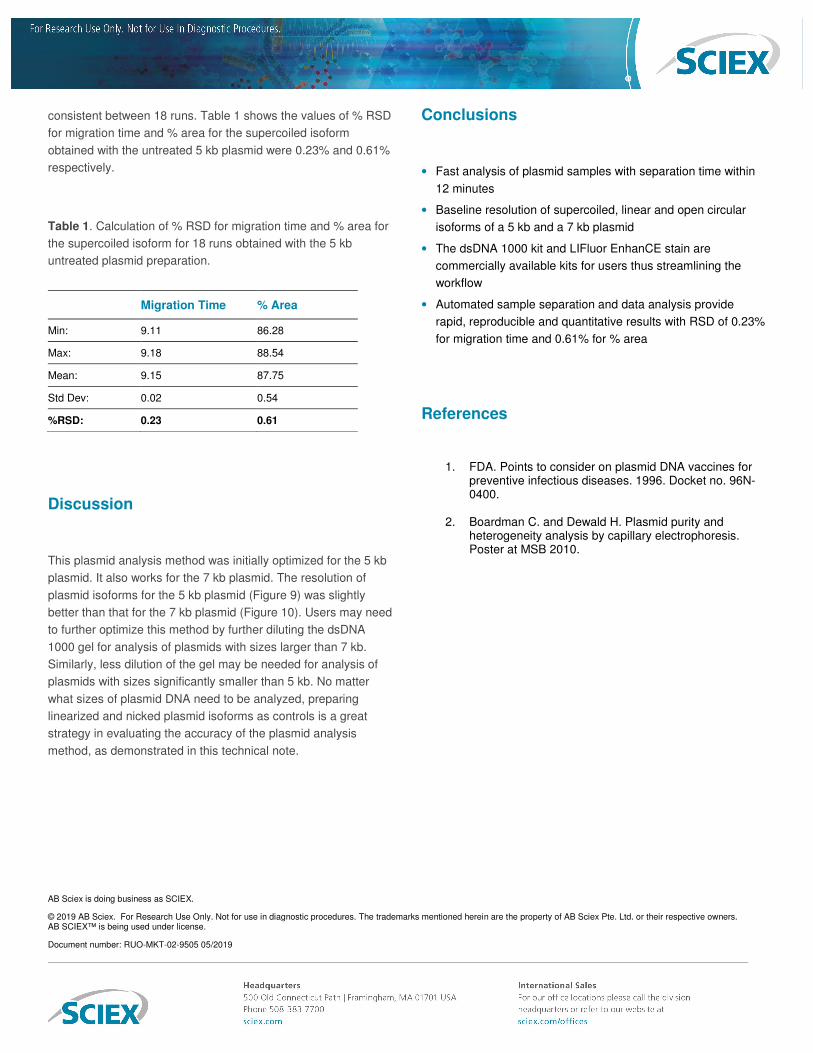
consistent between 18 runs. Table 1 shows the values of % RSD
for migration time and % area for the supercoiled isoform
obtained with the untreated 5 kb plasmid were 0.23% and 0.61%
respectively.
Table 1. Calculation of % RSD for migration time and % area for
the supercoiled isoform for 18 runs obtained with the 5 kb
untreated plasmid preparation.
Discussion
This plasmid analysis method was initially optimized for the 5 kb
plasmid. It also works for the 7 kb plasmid. The resolution of
plasmid isoforms for the 5 kb plasmid (Figure 9) was slightly
better than that for the 7 kb plasmid (Figure 10). Users may need
to further optimize this method by further diluting the dsDNA
1000 gel for analysis of plasmids with sizes larger than 7 kb.
Similarly, less dilution of the gel may be needed for analysis of
plasmids with sizes significantly smaller than 5 kb. No matter
what sizes of plasmid DNA need to be analyzed, preparing
linearized and nicked plasmid isoforms as controls is a great
strategy in evaluating the accuracy of the plasmid analysis
method, as demonstrated in this technical note.
Conclusions
• Fast analysis of plasmid samples with separation time within
12 minutes
• Baseline resolution of supercoiled, linear and open circular
isoforms of a 5 kb and a 7 kb plasmid
• The dsDNA 1000 kit and LIFluor EnhanCE stain are
commercially available kits for users thus streamlining the
workflow
• Automated sample separation and data analysis provide
rapid, reproducible and quantitative results with RSD of 0.23%
for migration time and 0.61% for % area
References
1. FDA. Points to consider on plasmid DNA vaccines for preventive infectious diseases. 1996. Docket no. 96N-0400.
2. Boardman C. and Dewald H. Plasmid purity and heterogeneity analysis by capillary electrophoresis. Poster at MSB 2010.
Migration Time % Area
Min: 9.11 86.28
Max: 9.18 88.54
Mean: 9.15 87.75
Std Dev: 0.02 0.54
%RSD: 0.23 0.61
AB Sciex is doing business as SCIEX.
© 2019 AB Sciex. For Research Use Only. Not for use in diagnostic procedures. The trademarks mentioned herein are the property of AB Sciex Pte. Ltd. or their respective owners. AB SCIEX™ is being used under license.
Document number: RUO-MKT-02-9505 05/2019