Embed Size (px)
Citation preview
Single molecule spectroscopy of tetrahedraloligophenylenevinylene molecules
Melissa A. Summers a, Matthew R. Robinson b, Guillermo C. Bazan a,b,Steven K. Buratto a,*
a Department of Chemistry and Biochemistry, Department of Materials, University of California, Santa Barbara, CA 93106-9510, USAb Department of Materials, University of California, Santa Barbara, CA 93106-9510, USA
Received 18 January 2002; in final form 17 July 2002
Abstract
We probe the fluorescence from single molecules of a new class of tetrahedral oligo(phenylenevinylene) (OPV)
molecules. Our results show that the tetrahedral molecules contain multiple chromophores with limited inter-arm
coupling, but significant molecular motion about the central carbon results in fluctuations in the polarizability axis of
the molecule. Loss in luminescence intensity is also observed during the fluctuations which is attributed to inter-arm
coupling occurring when adjacent arms come close together. These fluctuations occur on the timescale of 100 ms to 10 s
and are shown to be absent in the �arm� molecules alone.� 2002 Elsevier Science B.V. All rights reserved.
1. Introduction
A current trend in the development of organicmolecules for application in organic light emittingdiodes (OLEDs) is to synthesize designer lumines-cent molecules with high luminescence quantumyields and that can be cast into films with con-trolled morphology. Oligomers based on poly(phenylenevinylene) (PPV) represent classes ofmolecules that have high fluorescence quantumyields ðUFL � 0:80Þ, and can be synthesized with acontrolled chain length. The morphology of thesecompounds in thin films can be controlled by
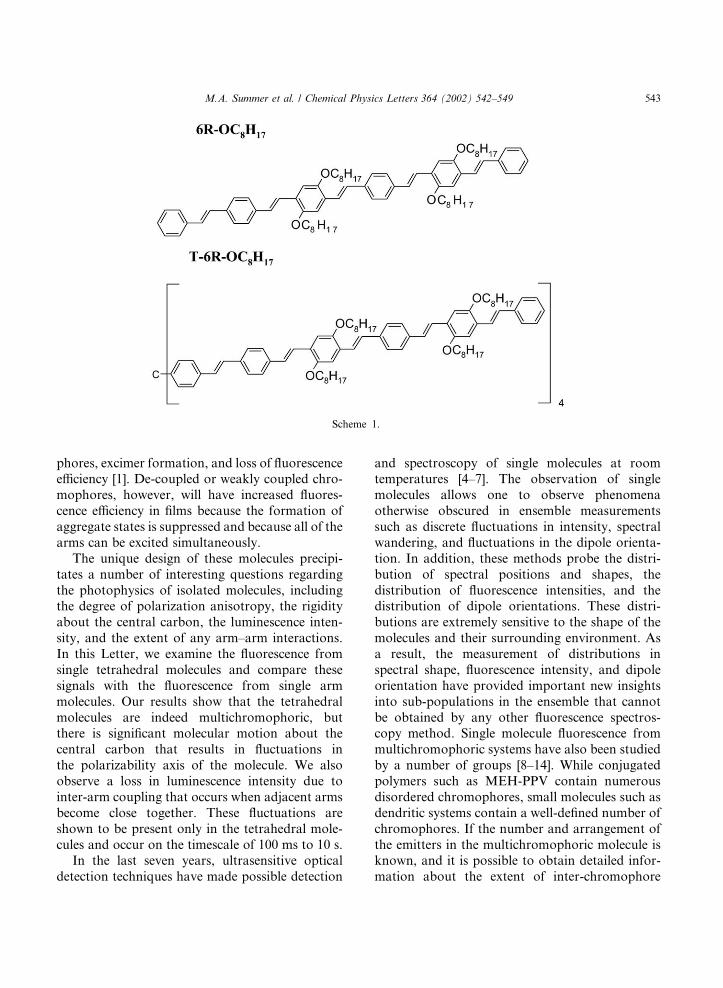
adding substituents to the monomer unit or bylinking several oligomers via a central carbon [1].As an example, several recent papers from theBazan group at UCSB have described the synthesisand characterization of a new class of tetrahedraloligo-[p-phenylenevinylene] (TOPV) molecules[1–3]. These compounds, depicted in Scheme 1,contain �arms� consisting of phenylenevinyleneoligomers with up to six phenyl rings bound to-gether by an sp3 hybridized carbon core.Thesemolecules are designed such that each arm ema-nating from the central carbon is a trans-oligo-PPVmolecule and that the rigidity of each arm preventsthe arms from interacting in each individual mol-ecule. The geometry of these molecules alsodiscourages crystallinity in thin films, which canlead to strong coupling between adjacent chromo-
16 October 2002
Chemical Physics Letters 364 (2002) 542–549
www.elsevier.com/locate/cplett
* Corresponding author. Fax: +805-893-4120.
E-mail address: [email protected] (S.K. Buratto).
0009-2614/02/$ - see front matter � 2002 Elsevier Science B.V. All rights reserved.
PII: S0009 -2614 (02 )01315 -5
phores, excimer formation, and loss of fluorescenceefficiency [1]. De-coupled or weakly coupled chro-mophores, however, will have increased fluores-cence efficiency in films because the formation ofaggregate states is suppressed and because all of thearms can be excited simultaneously.The unique design of these molecules precipi-
tates a number of interesting questions regardingthe photophysics of isolated molecules, includingthe degree of polarization anisotropy, the rigidityabout the central carbon, the luminescence inten-sity, and the extent of any arm–arm interactions.In this Letter, we examine the fluorescence fromsingle tetrahedral molecules and compare thesesignals with the fluorescence from single armmolecules. Our results show that the tetrahedralmolecules are indeed multichromophoric, butthere is significant molecular motion about thecentral carbon that results in fluctuations inthe polarizability axis of the molecule. We alsoobserve a loss in luminescence intensity due tointer-arm coupling that occurs when adjacent armsbecome close together. These fluctuations areshown to be present only in the tetrahedral mole-cules and occur on the timescale of 100 ms to 10 s.In the last seven years, ultrasensitive optical
detection techniques have made possible detection
and spectroscopy of single molecules at roomtemperatures [4–7]. The observation of singlemolecules allows one to observe phenomenaotherwise obscured in ensemble measurementssuch as discrete fluctuations in intensity, spectralwandering, and fluctuations in the dipole orienta-tion. In addition, these methods probe the distri-bution of spectral positions and shapes, thedistribution of fluorescence intensities, and thedistribution of dipole orientations. These distri-butions are extremely sensitive to the shape of themolecules and their surrounding environment. Asa result, the measurement of distributions inspectral shape, fluorescence intensity, and dipoleorientation have provided important new insightsinto sub-populations in the ensemble that cannotbe obtained by any other fluorescence spectros-copy method. Single molecule fluorescence frommultichromophoric systems have also been studiedby a number of groups [8–14]. While conjugatedpolymers such as MEH-PPV contain numerousdisordered chromophores, small molecules such asdendritic systems contain a well-defined number ofchromophores. If the number and arrangement ofthe emitters in the multichromophoric molecule isknown, and it is possible to obtain detailed infor-mation about the extent of inter-chromophore
Scheme 1.
M.A. Summer et al. / Chemical Physics Letters 364 (2002) 542–549 543
interactions within the system by monitoring thefluorescence intensity, the polarization anisotropy,and any fluctuations in these parameters [11–13].
2. Experimental
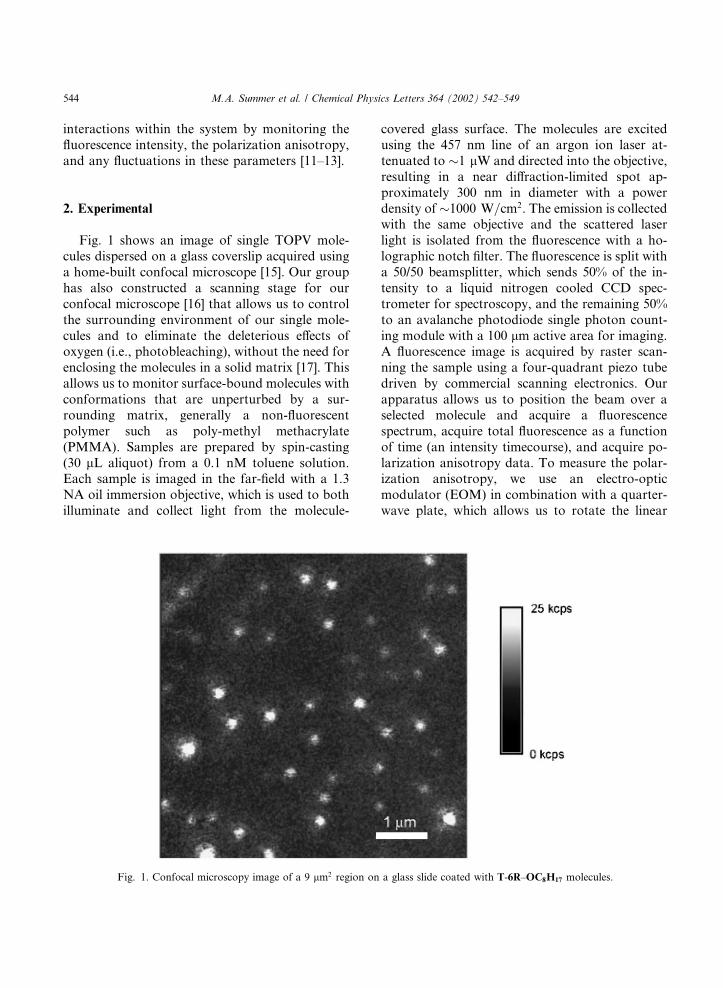
Fig. 1 shows an image of single TOPV mole-cules dispersed on a glass coverslip acquired usinga home-built confocal microscope [15]. Our grouphas also constructed a scanning stage for ourconfocal microscope [16] that allows us to controlthe surrounding environment of our single mole-cules and to eliminate the deleterious effects ofoxygen (i.e., photobleaching), without the need forenclosing the molecules in a solid matrix [17]. Thisallows us to monitor surface-bound molecules withconformations that are unperturbed by a sur-rounding matrix, generally a non-fluorescentpolymer such as poly-methyl methacrylate(PMMA). Samples are prepared by spin-casting(30 lL aliquot) from a 0.1 nM toluene solution.Each sample is imaged in the far-field with a 1.3NA oil immersion objective, which is used to bothilluminate and collect light from the molecule-
covered glass surface. The molecules are excitedusing the 457 nm line of an argon ion laser at-tenuated to �1 lW and directed into the objective,resulting in a near diffraction-limited spot ap-proximately 300 nm in diameter with a powerdensity of �1000 W=cm2. The emission is collectedwith the same objective and the scattered laserlight is isolated from the fluorescence with a ho-lographic notch filter. The fluorescence is split witha 50/50 beamsplitter, which sends 50% of the in-tensity to a liquid nitrogen cooled CCD spec-trometer for spectroscopy, and the remaining 50%to an avalanche photodiode single photon count-ing module with a 100 lm active area for imaging.A fluorescence image is acquired by raster scan-ning the sample using a four-quadrant piezo tubedriven by commercial scanning electronics. Ourapparatus allows us to position the beam over aselected molecule and acquire a fluorescencespectrum, acquire total fluorescence as a functionof time (an intensity timecourse), and acquire po-larization anisotropy data. To measure the polar-ization anisotropy, we use an electro-opticmodulator (EOM) in combination with a quarter-wave plate, which allows us to rotate the linear
Fig. 1. Confocal microscopy image of a 9 lm2 region on a glass slide coated with T-6R–OC8H17 molecules.
544 M.A. Summer et al. / Chemical Physics Letters 364 (2002) 542–549
polarization of the excitation laser through 180� ata fixed frequency [17]. A molecule with a net ab-sorption dipole (or anisotropic polarizability ten-sor) will exhibit a sinusoidal intensity trajectory.
3. Results and discussion
In order to differentiate the fluorescence be-havior attributed to a single tetrahedral molecule
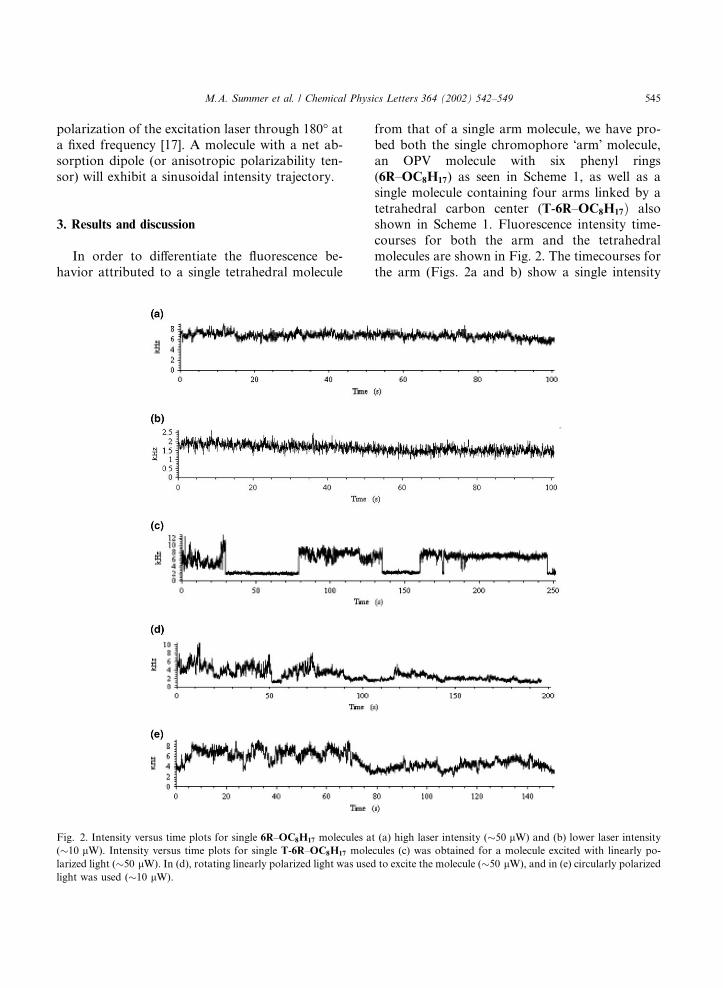
from that of a single arm molecule, we have pro-bed both the single chromophore �arm� molecule,an OPV molecule with six phenyl rings(6R–OC8H17) as seen in Scheme 1, as well as asingle molecule containing four arms linked by atetrahedral carbon center (T-6R–OC8H17Þ alsoshown in Scheme 1. Fluorescence intensity time-courses for both the arm and the tetrahedralmolecules are shown in Fig. 2. The timecourses forthe arm (Figs. 2a and b) show a single intensity
Fig. 2. Intensity versus time plots for single 6R–OC8H17 molecules at (a) high laser intensity (�50 lW) and (b) lower laser intensity(�10 lW). Intensity versus time plots for single T-6R–OC8H17 molecules (c) was obtained for a molecule excited with linearly po-
larized light (�50 lW). In (d), rotating linearly polarized light was used to excite the molecule (�50 lW), and in (e) circularly polarizedlight was used (�10 lW).
M.A. Summer et al. / Chemical Physics Letters 364 (2002) 542–549 545
level that indicates the molecule is emitting with-out interruption in a single �on� level. With ourcontrolled environment scanner, we have observedconstant fluorescence from these molecules forseveral (>6) minutes prior to single-step photo-bleaching (we observe rapid, <10 s, single-stepphotobleaching for molecules exposed to air). Thisresult is in sharp contrast to that observed forother single molecule systems such as DiI whereblinking is observed even in the absence of O2 dueto intersystem crossing to the triplet state [17]. Theemission ceases until the ground state is recoveredon a timescale equal to the triplet lifetime. Inprevious experiments on DiI, the triplet lifetimeincreased dramatically when O2 was removed re-sulting in off times of greater than 10 ms. The lackof blinking in the 6R–OC8H17 molecules suggeststhat the intersystem crossing efficiency is extremelylow, or that even in the absence of O2 the tripletlifetime is unusually fast compared with our 160 lsbin time.Three timecourses for the tetrahedral molecule
(T-6R–OC8H17) are presented in Figs. 2c–e andshow a wide range of intensity fluctuations, in-dicative of molecular dynamics. We have observedfluctuations on timescales ranging from a few msto several seconds. Different intensity fluctuationsare observed if the polarization of the exciting lightis fixed (Fig. 2c), rapidly modulated at a frequencyof �40 Hz (Fig. 2d), or circularly polarized (Fig.2e). We note that the fluctuations in the data ob-tained with modulated and circularly polarizedlight are often not discreet, and it is difficult toassign intensity levels corresponding to the emis-sion of one or more chromophores. This suggeststhat the fluctuations are due to changes in thepolarizability axis of the molecule, as well as theblinking behavior of the chromophores. Autocor-relation analysis shows no well-defined functionalform such as an exponential or power-law depen-dence.Figs. 3 and 4 show the polarization modulation
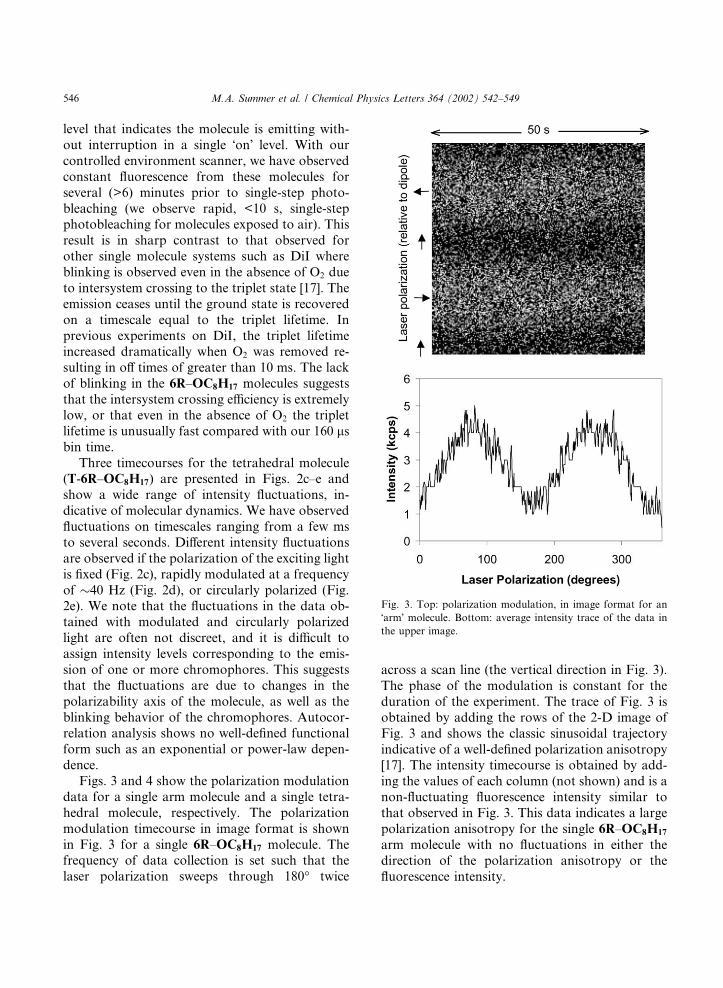
data for a single arm molecule and a single tetra-hedral molecule, respectively. The polarizationmodulation timecourse in image format is shownin Fig. 3 for a single 6R–OC8H17 molecule. Thefrequency of data collection is set such that thelaser polarization sweeps through 180� twice
across a scan line (the vertical direction in Fig. 3).The phase of the modulation is constant for theduration of the experiment. The trace of Fig. 3 isobtained by adding the rows of the 2-D image ofFig. 3 and shows the classic sinusoidal trajectoryindicative of a well-defined polarization anisotropy[17]. The intensity timecourse is obtained by add-ing the values of each column (not shown) and is anon-fluctuating fluorescence intensity similar tothat observed in Fig. 3. This data indicates a largepolarization anisotropy for the single 6R–OC8H17
arm molecule with no fluctuations in either thedirection of the polarization anisotropy or thefluorescence intensity.
Fig. 3. Top: polarization modulation, in image format for an
�arm� molecule. Bottom: average intensity trace of the data inthe upper image.
546 M.A. Summer et al. / Chemical Physics Letters 364 (2002) 542–549
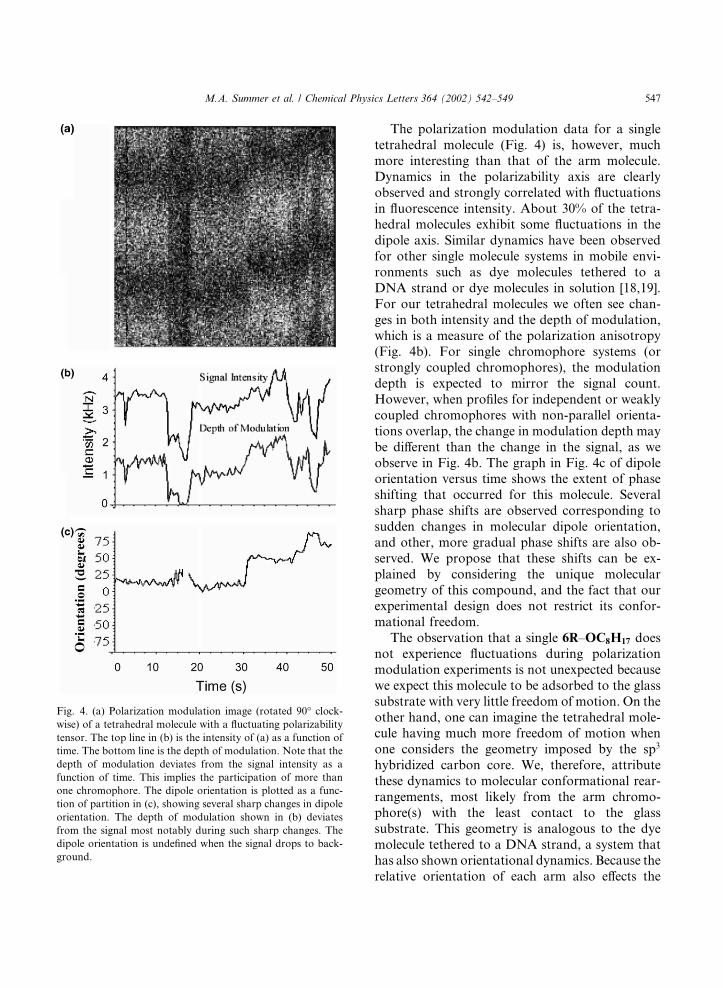
The polarization modulation data for a singletetrahedral molecule (Fig. 4) is, however, muchmore interesting than that of the arm molecule.Dynamics in the polarizability axis are clearlyobserved and strongly correlated with fluctuationsin fluorescence intensity. About 30% of the tetra-hedral molecules exhibit some fluctuations in thedipole axis. Similar dynamics have been observedfor other single molecule systems in mobile envi-ronments such as dye molecules tethered to aDNA strand or dye molecules in solution [18,19].For our tetrahedral molecules we often see chan-ges in both intensity and the depth of modulation,which is a measure of the polarization anisotropy(Fig. 4b). For single chromophore systems (orstrongly coupled chromophores), the modulationdepth is expected to mirror the signal count.However, when profiles for independent or weaklycoupled chromophores with non-parallel orienta-tions overlap, the change in modulation depth maybe different than the change in the signal, as weobserve in Fig. 4b. The graph in Fig. 4c of dipoleorientation versus time shows the extent of phaseshifting that occurred for this molecule. Severalsharp phase shifts are observed corresponding tosudden changes in molecular dipole orientation,and other, more gradual phase shifts are also ob-served. We propose that these shifts can be ex-plained by considering the unique moleculargeometry of this compound, and the fact that ourexperimental design does not restrict its confor-mational freedom.The observation that a single 6R–OC8H17 does
not experience fluctuations during polarizationmodulation experiments is not unexpected becausewe expect this molecule to be adsorbed to the glasssubstrate with very little freedom of motion. On theother hand, one can imagine the tetrahedral mole-cule having much more freedom of motion whenone considers the geometry imposed by the sp3
hybridized carbon core. We, therefore, attributethese dynamics to molecular conformational rear-rangements, most likely from the arm chromo-phore(s) with the least contact to the glasssubstrate. This geometry is analogous to the dyemolecule tethered to a DNA strand, a system thathas also shown orientational dynamics. Because therelative orientation of each arm also effects the
Fig. 4. (a) Polarization modulation image (rotated 90� clock-wise) of a tetrahedral molecule with a fluctuating polarizability
tensor. The top line in (b) is the intensity of (a) as a function of
time. The bottom line is the depth of modulation. Note that the
depth of modulation deviates from the signal intensity as a
function of time. This implies the participation of more than
one chromophore. The dipole orientation is plotted as a func-
tion of partition in (c), showing several sharp changes in dipole
orientation. The depth of modulation shown in (b) deviates
from the signal most notably during such sharp changes. The
dipole orientation is undefined when the signal drops to back-
ground.
M.A. Summer et al. / Chemical Physics Letters 364 (2002) 542–549 547
depth of modulation, this model accounts for thechanges in both modulation depth and signal in-tensity.While steps in the intensity versus time plotsof other multi-chromophoric molecules are easilyexplained by the concurrent blinking behavior of
the individual chromophores [8,9], we often noticedintensity fluctuations that were too small to be at-tributed to one chromophore blinking off or on(Figs. 2d and e). Slight changes are more likely dueto changes in the polarization anisotropy.
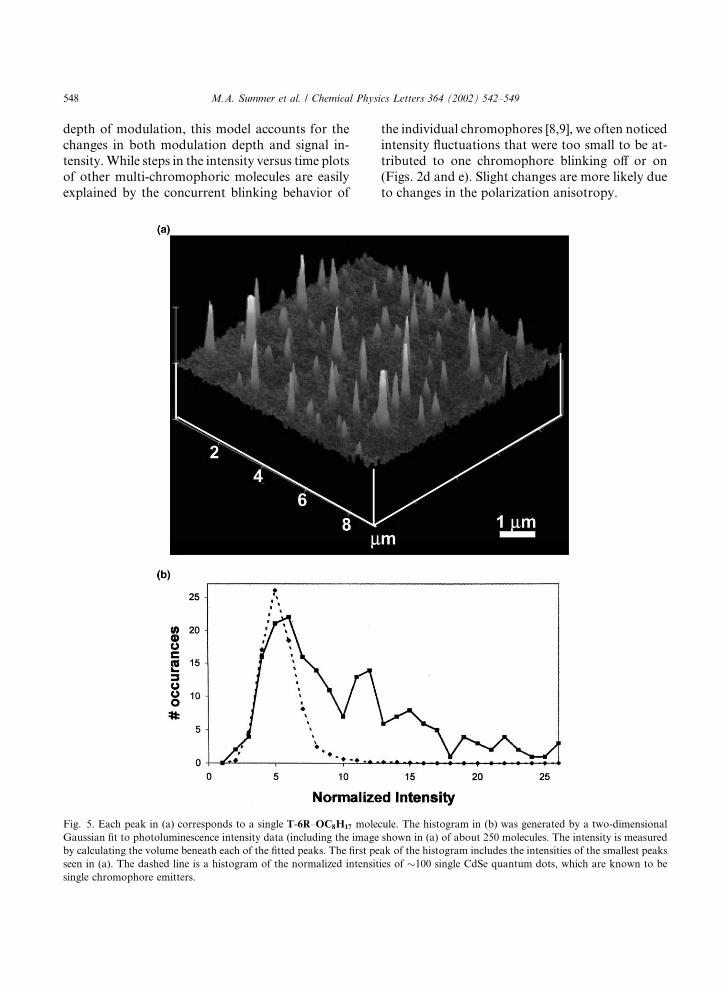
Fig. 5. Each peak in (a) corresponds to a single T-6R–OC8H17 molecule. The histogram in (b) was generated by a two-dimensional
Gaussian fit to photoluminescence intensity data (including the image shown in (a) of about 250 molecules. The intensity is measured
by calculating the volume beneath each of the fitted peaks. The first peak of the histogram includes the intensities of the smallest peaks
seen in (a). The dashed line is a histogram of the normalized intensities of �100 single CdSe quantum dots, which are known to besingle chromophore emitters.
548 M.A. Summer et al. / Chemical Physics Letters 364 (2002) 542–549
Inter-chromophore interaction due to arm–armcoupling within a single T-6R–OC8H17 is possibleif the arm molecules are allowed to move withrespect to the central carbon as suggested by ourfluctuating fluorescence signals. During intensitytimecourses such as the one seen in Fig. 2c, at leasttwo chromophores appear to suddenly switch toan �off� state simultaneously. As has been observedfor other multiple chromophore systems, this eventis highly unlikely for independent chromophores.Also, the polarization modulation data for T-6R–OC8H17 is perfectly sinusoidal in appearance,which implies that the molecules have only onepolarizability tensor. If the chromophores werecompletely independent, we would expect to see amore isotropic polarizability. In addition to theseobservations, however, we have also seen evidenceof multi-level multichromophore emission, whichimplies that for some of the tetrahedral moleculesthe chromophores emit independently. One meth-od for determining the number of emitting speciesis to plot a histogram of the fluorescence intensityfor a distribution of single molecules. The intensityhistogram in Fig. 5 was obtained by fitting two-dimensional Gaussians to fluorescence intensitydata (such as the image in Fig. 5a) for 250 mole-cules. The maximum intensity (or volume of fittedpeak) of each fitted peak was recorded, and theintensity for each molecule fitted was binned intothe histogram in Fig. 5b. The skewness of thehistogram to higher intensity is evidence for mul-tichromophore emission [8]. It is clear that thechromophores possess some degree of indepen-dence, and that energy transfer or inter-arm cou-pling does not, in general, prevent emission frommultiple chromophores in a molecule. Most of themolecules, however, emit with a fluorescence in-tensity equal to that of a single chromophore.While these observations appear initially at odds,the fluctuations in intensity allow them to be rec-onciled. The dynamic time-averaged fluorescencesignal for a single tetrahedral molecule may blinkoff as an image is obtained, or a component of thetransition dipole moment may be parallel to thelaser light, either of which will cause the intensityof the fit to decrease.We have shown that single molecule fluores-
cence spectroscopy can be used to probe the
luminescence properties of tetrahedral OPV mol-ecules. Our results indicate significant molecularmotion about the sp3 carbon center that altersboth the polarization anisotropy as well as theextent of inter-arm coupling. Furthermore, weshow that these fluctuations are specific to thetetrahedral molecules and do not occur for the armmolecules by themselves. These data provide im-portant new insights into the luminescence fromthis novel class of compounds and the dependenceon the luminescence on the shape or conformationof the molecule.
References
[1] W.J. Oldham Jr., R.J. Lachicotte, G.C. Bazan, J. Am.
Chem. Soc. 120 (1998) 2987.
[2] M.R. Robinson, S. Wang, G.C. Bazan, Y. Cao, Adv.
Mater. 12 (2000) 1701.
[3] M.R. Robinson, S. Wang, A.J. Heeger, G.C. Bazan, Adv.
Funct. Mater. 11 (2001) 413.
[4] E. Betzig, R.J. Chichester, Science 262 (1993) 1422.
[5] R.M. Dickson, D.J. Norris, Y.L. Tzeng, W.E. Moerner,
Science 274 (1996) 966.
[6] S.M. Nie, D.T. Chiu, R.N. Zare, 266 (1994) 1018.
[7] X.S. Xie, J.K. Trautman, Ann. Rev. Phys. Chem. 49 (1998)
441.
[8] M.D. Mason, D.J. Sirbuly, P.J. Carson, S.K. Buratto,
J. Chem. Phys. 114 (2001) 8119.
[9] D. Hu, J. Yu, P.F. Barbara, J. Am. Chem. Soc. 121 (1999)
6936.
[10] W.T. Yip, D. Hu, J. Yu, D.A. Vanden Bout, P.F. Barbara,
J. Phys. Chem. A 102 (1998) 7564.
[11] T. Gensch, J. Hofkens, A. Herrmann, K. Tsuda, W.
Verheijen, T. Vosch, T. Christ, T. Basche, K. Mullen, F.C.
De Schryver, Angew. Chem. Int. Ed. 38 (1999) 3752.
[12] J. Hofkens, M. Maus, T. Gensch, T. Vosch, M. Cotlet,
F. Kohn, A. Herrmann, K. Mullen, F.C. De Schryver,
J. Am. Chem. Soc. 122 (2000) 9278.
[13] T. Gensch, J. Hofkens, F. Kohn, T. Vosch, A. Herrmann,
K. Mullen, F.C. De Schryver, Single Mol. 2 (2001) 35.
[14] J.D. White, J.H. Hsu, W.S. Fann, S.C. Yang, G.Y. Pern,
S.A. Chen, Chem. Phys. Lett. 338 (2001) 263.
[15] K.D. Weston, S.K. Buratto, J. Phys. Chem. B 101 (1997)
5684.
[16] D.J. Sirbuly, M.D. Mason, J.P. Schmidt, M.A. Summers,
S.K. Buratto, Rev. Sci. Instrum., submitted.
[17] D.S. English, A. Furube, P.F. Barbara, Chem. Phys. Lett.
324 (2000) 15.
[18] K.D. Weston, L.S. Goldner, J. Phys. Chem. B 105 (2001)
3453.
[19] T. Ha, T. Enderle, D.S. Chemla, P.R. Selvin, S. Weiss,
Phys. Rev. Lett. 77 (1996) 3979.
M.A. Summer et al. / Chemical Physics Letters 364 (2002) 542–549 549