Embed Size (px)
Citation preview
Site Feasibility Analysis for a Sports Themed Bar and Restaurant at 3005 South Boulevard near the New Bern Light Rail Station
Ed Yankowski GEOG 6102 Final Draft Fall 2006
Table of Contents I. Introduction
Map 1: Area Overview Map 2: Selected Parcel
II. Market Area Analysis
Map 3: Overview of Charlotte Metropolitan Area Graph 1: Demographic Trends Comparing Charlotte CBSA vs. National Averages Table 1: Sourced from the Charlotte Regional Partnership Development Guide, 2006 Table 2: Précis Metro Class Handout, Moody’s 2006 Table 3: Saturation Measurement Comparisons Table 4: Retail Market Place Profile, ESRI, Business Analyst Online Table 5: Source: ACCRA Cost of Living Index 2005 Q3
III. Trade Area Analysis
Table 6: Summarized from ESRI, Business Analyst Reports, for Trade area compared to CBSA Map 4: Analog Stores in Mecklenburg County Table 7: Summarized from ESRI, Business Analyst Reports, for Trade area compared to CBSA Map 5: Map of Primary Competition Map 6: Map of Indirect competition symbolized by annual sales
IV. Site Analysis
Map 7: Proposed New Bern Light Rail Station Map 8: Future Light Rail System Table 8: Future Residential Developments Photo 1, 2: View of Site Parcel and Uptown Charlotte from Site Photo 3: Panoramic Photo of residential development across from selected parcel
V. Financial issues
Table 9: Comparative Sales Table 10: Calculation of Floor Area Ratio Site Calculation Worksheet Table 11: Estimated Costs Table 12: Estimated Costs of Furnishings Table 13: Mortgage worksheet Table 14: Resale Opportunities
VI. Statement of Feasibility VII. Self-Assessment VIII. Works Cited
Introduction:
The purpose of this feasibility study is to determine the likelihood of the financial success
of a sports themed restaurant at 3005 South Boulevard, in Charlotte, North Carolina
which is located in Mecklenburg County, the most populated county in both North and
South Carolina. This study will contain four major areas, followed by a conclusion to
determine if this project will receive any funding. After a brief description of the subject
parcel, we will discuss the strength of the entire Charlotte market, an analysis of the trade
area that we are proposing, an in depth analysis of the subject site, and finally a financial
analysis to determine the viability of this project moving forward. Our direct competition
will be casual dining restaurants that serve alcohol and have a variety of sporting events
on the televisions, and our indirect competition will be any other full service or quick
service restaurant that fall in our trade area,
Parcel Description:
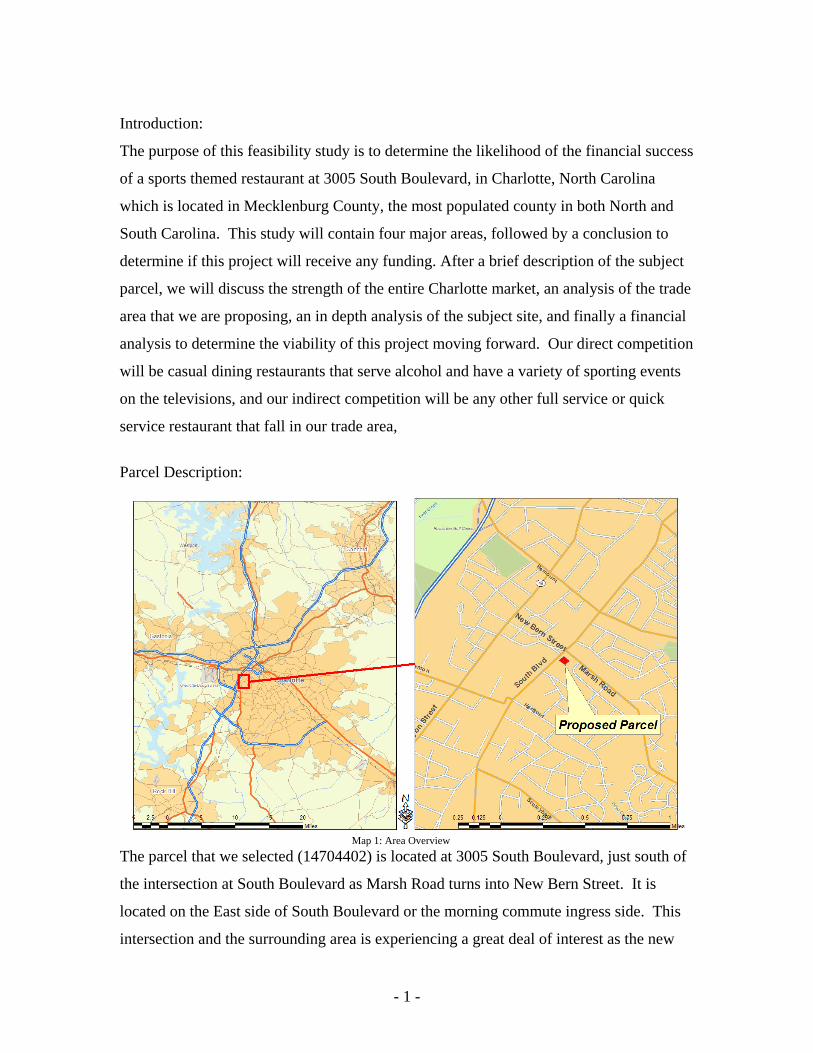
The parcel that we selected (14704402) is located at 3005 South Boulevard, just south of
the intersection at South Boulevard as Marsh Road turns into New Bern Street. It is
located on the East side of South Boulevard or the morning commute ingress side. This
intersection and the surrounding area is experiencing a great deal of interest as the new
Map 1: Area Overview
- 1 -
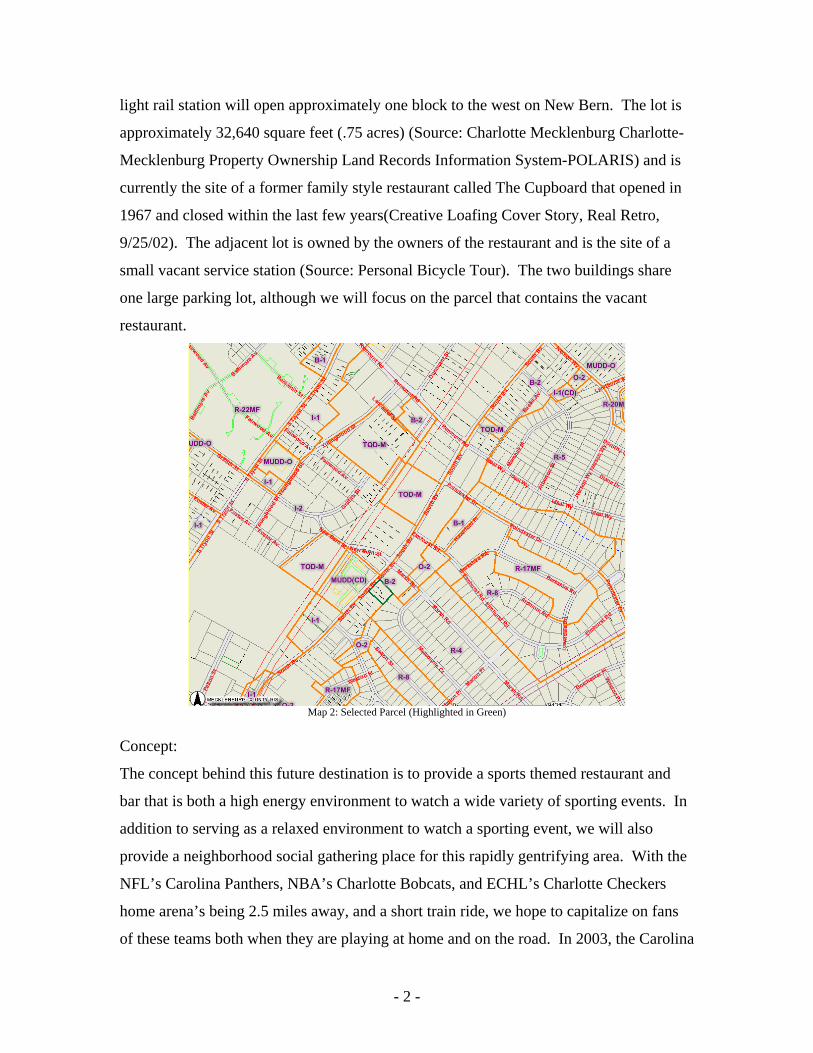
light rail station will open approximately one block to the west on New Bern. The lot is
approximately 32,640 square feet (.75 acres) (Source: Charlotte Mecklenburg Charlotte-
Mecklenburg Property Ownership Land Records Information System-POLARIS) and is
currently the site of a former family style restaurant called The Cupboard that opened in
1967 and closed within the last few years(Creative Loafing Cover Story, Real Retro,
9/25/02). The adjacent lot is owned by the owners of the restaurant and is the site of a
small vacant service station (Source: Personal Bicycle Tour). The two buildings share
one large parking lot, although we will focus on the parcel that contains the vacant
restaurant.
Map 2: Selected Parcel (Highlighted in Green)
Concept:
The concept behind this future destination is to provide a sports themed restaurant and
bar that is both a high energy environment to watch a wide variety of sporting events. In
addition to serving as a relaxed environment to watch a sporting event, we will also
provide a neighborhood social gathering place for this rapidly gentrifying area. With the
NFL’s Carolina Panthers, NBA’s Charlotte Bobcats, and ECHL’s Charlotte Checkers
home arena’s being 2.5 miles away, and a short train ride, we hope to capitalize on fans
of these teams both when they are playing at home and on the road. In 2003, the Carolina
- 2 -
Panthers averaged 72,820 fans per game for a total of over 582,500 fans for their season
(Source: Infoplease Daily Almanac). The first year the Charlotte Bobcats played at the
new uptown arena, they averaged over 14,000 fans a game for a total attendance of
545,178 over their 38 home games (Source: Slam Sports, Charlotte Bobcats Attendance
Comparison ). Finally, the ECHL Charlotte Checkers averaged 5,800 fans per game,
which ranks fourth highest in the league (Source: Slapshot for Success, Greater Charlotte
Biz, November, 2006). With these arena’s being so close, our location is an ideal
restaurant to visit prior to or after any of these home games. While our local fans can
enjoy many of these events live, we also plan to televise their road contests, as well as
offer satellite cable packages to watch out of market games across the country. We will
differentiate ourselves from other restaurants by offering an upscale yet friendly
environment that appeals to both men and women by providing a wide selection of high
quality food and drink. We will also have state of the art televisions with satellite
coverage local, regional and national sporting events in order to appeal to customers on
off peak times. Included in the technology will be an audio control at each table so each
party can decide which sporting event to listen to without trying to hear over other games
or the atmosphere of the bar.
Target Market:
After observing numerous local sports-themed bars in the Charlotte area, it appears that
the typical consumer is a younger male (ages 25-44) that appears to be middle to upper
middle income with above average disposable income. Some of the sports themed bars
in town are also restaurants which would allow children to visit, but for this preliminary
analysis we will focus on a target market of professional males ages 25-44 with income
between $35,000 and $74,999. During the year, there are a range of sports that young
men would view at a sports bar, from local and distant professional and college football,
basketball, baseball, and hockey, as well as NASCAR. Because we are also attempting to
cater to the neighborhood residents who would desire a local neighborhood bar, we will
add the professional women of the same ages with the same income $35,000 and
$74,999. In our trade area, there are several restaurants that our potential customers can
choose to visit that currently have similar formats, and these locations would be our
- 3 -
direct competition. These include Mac’s Speed Shop, Southend Brewery, Picasso’s
Sports Bar and Grill, Fox & The Hound, Stool Pigeons, Angry Ale’s, and the Graduate
Pub. Each of these establishments has been open for a lengthy time, and we would
certainly be viewed as newcomer to this format in Charlotte. We believe that our
restaurant will differentiate by our high quality food and our quality service added with
our great atmosphere. Our indirect competition in the area would be any quick service or
other restaurant that serves food in a casual dining atmosphere. We will not classify fast
food restaurants as indirect competition because of the major difference in our full
service nature and alcohol sales.
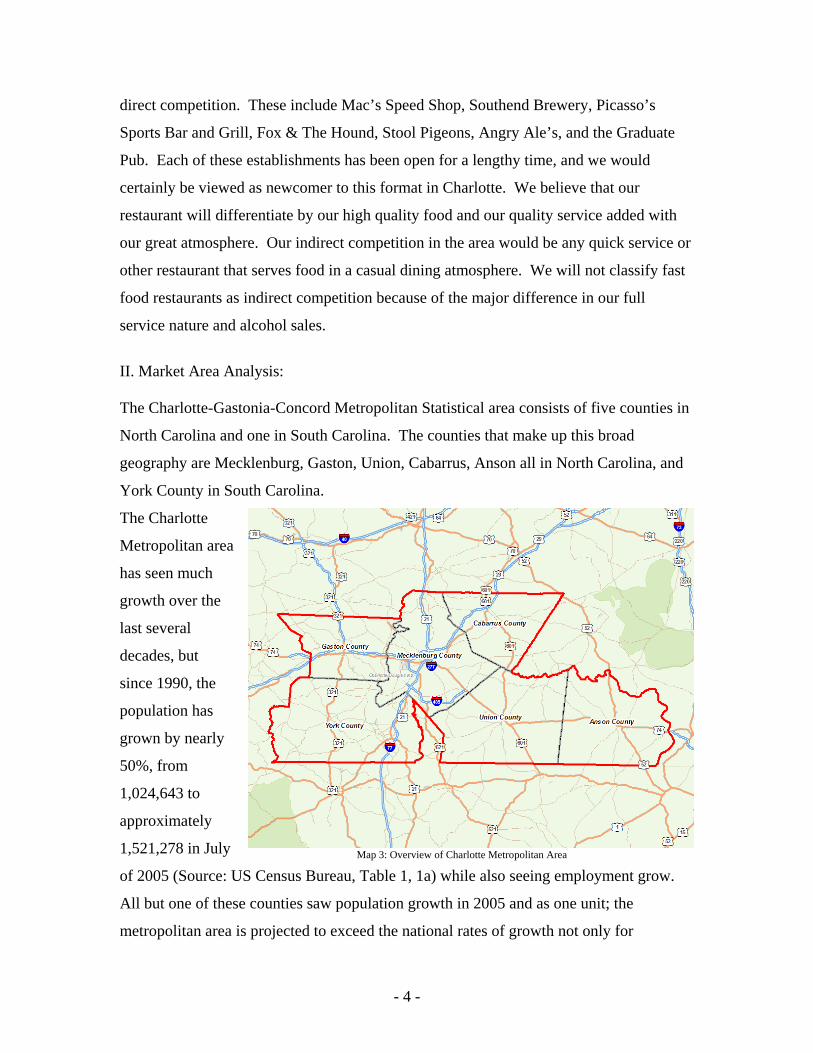
II. Market Area Analysis: The Charlotte-Gastonia-Concord Metropolitan Statistical area consists of five counties in
North Carolina and one in South Carolina. The counties that make up this broad
geography are Mecklenburg, Gaston, Union, Cabarrus, Anson all in North Carolina, and
York County in South Carolina.
The Charlotte
Metropolitan area
has seen much
growth over the
last several
decades, but
since 1990, the
population has
grown by nearly
50%, from
1,024,643 to
approximately
1,521,278 in July
of 2005 (Source: US Census Bureau, Table 1, 1a) while also seeing employment grow.
All but one of these counties saw population growth in 2005 and as one unit; the
metropolitan area is projected to exceed the national rates of growth not only for
Map 3: Overview of Charlotte Metropolitan Area
- 4 -
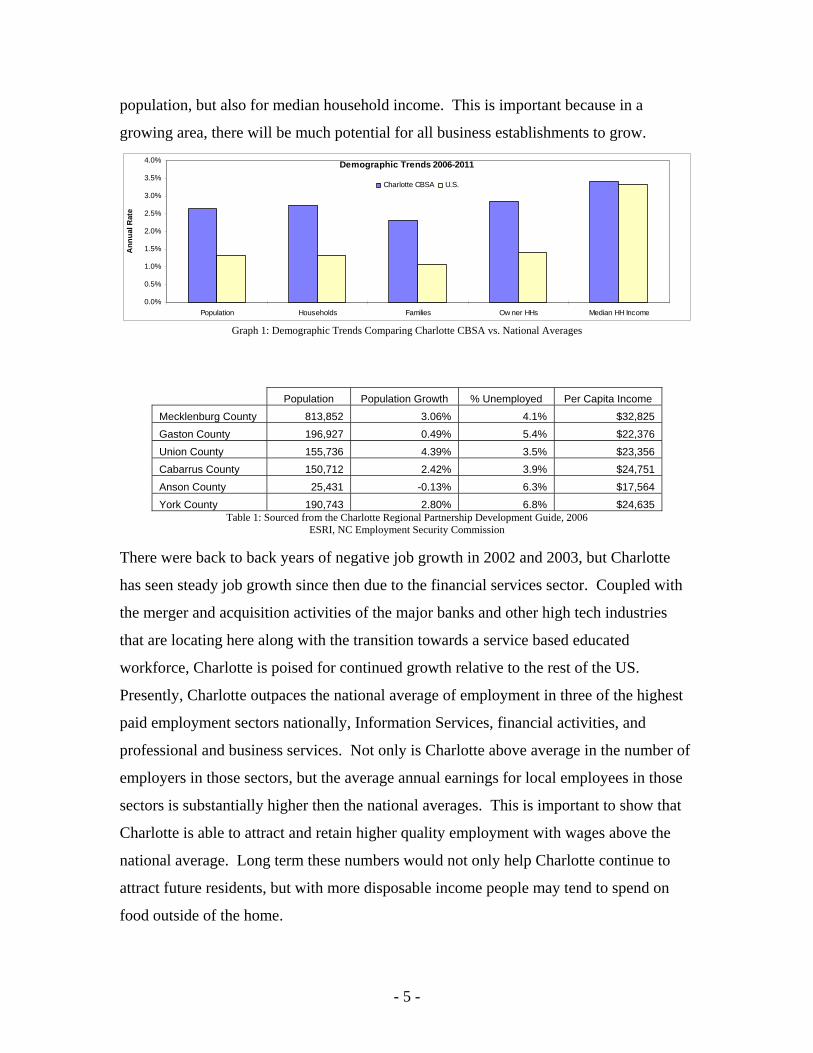
population, but also for median household income. This is important because in a
growing area, there will be much potential for all business establishments to grow.
Demographic Trends 2006-2011
0.0%
0.5%
1.0%
1.5%
2.0%
2.5%
3.0%
3.5%
4.0%
Population Households Families Ow ner HHs Median HH Income
Ann
ual R
ate
Charlotte CBSA U.S.
Graph 1: Demographic Trends Comparing Charlotte CBSA vs. National Averages
Population Population Growth % Unemployed Per Capita Income Mecklenburg County 813,852 3.06% 4.1% $32,825 Gaston County 196,927 0.49% 5.4% $22,376 Union County 155,736 4.39% 3.5% $23,356 Cabarrus County 150,712 2.42% 3.9% $24,751 Anson County 25,431 -0.13% 6.3% $17,564 York County
Table 1: Sourced from the Charlotte Regional Partnership Development Guide, 2006 190,743 2.80% 6.8% $24,635
ESRI, NC Employment Security Commission There were back to back years of negative job growth in 2002 and 2003, but Charlotte
has seen steady job growth since then due to the financial services sector. Coupled with
the merger and acquisition activities of the major banks and other high tech industries
that are locating here along with the transition towards a service based educated
workforce, Charlotte is poised for continued growth relative to the rest of the US.
Presently, Charlotte outpaces the national average of employment in three of the highest
paid employment sectors nationally, Information Services, financial activities, and
professional and business services. Not only is Charlotte above average in the number of
employers in those sectors, but the average annual earnings for local employees in those
sectors is substantially higher then the national averages. This is important to show that
Charlotte is able to attract and retain higher quality employment with wages above the
national average. Long term these numbers would not only help Charlotte continue to
attract future residents, but with more disposable income people may tend to spend on
food outside of the home.
- 5 -
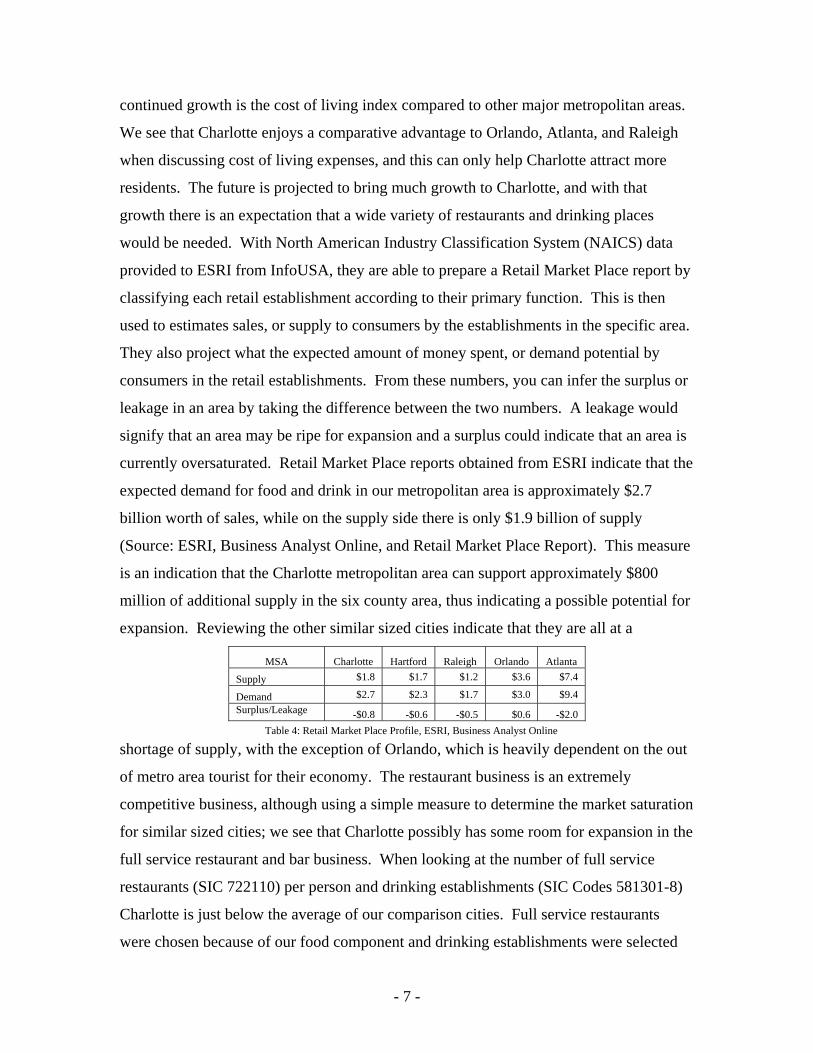
Average Annual Earnings Sector % Total Employment
Charlotte US Charlotte US Information 3.3% 2.3% $85,172 $74,870 Financial Activities 8.9% 6.1% $60,599 $50,152 Prof. and Business Services 14.6% 12.6% $48,895 $46,927
Table 2: Précis Metro Class Handout, Moody’s 2006
The metro area has outpaced the national economy and through 2006 has shown the
continuation with the announcement of the NASCAR Hall of Fame in downtown
Charlotte and the 350-acre North Carolina Research Campus on the edge of the metro
area. The Research Campus will help increase Charlotte’s presence in the fast-growing,
high-wage area of biotechnology. With above average percentage of employment in high
wage sectors such as information, financial activities, professional and business services,
Charlotte is well positioned to continue the strong economy that we have experienced
over the last several years. While Charlotte has much strength, the one sector that could
possibly hurt this metropolitan area in a negative way is the possible merger of one of the
local banks and the possibility of these high wage jobs moving to another city. Again,
the future appears to be positive for a small restaurant and the growth potential this area
is expected to see.
Comparing the Charlotte CBSA (Core Based Statistical Area) to the national average of
growth, Charlotte is projected to grow approximately 2.7% annually through 2010. This
far surpasses the national average of .65%, although it is in line with other Southeastern
metro areas. Raleigh-Durham, NC is expected to grow 2.7%, Atlanta, GA is projected at
annual growth of 3.1% and Orlando, FL is forecasted to grow 3.5% annually.
These cities were chosen based on the criteria of being
very close in population, other than Atlanta, of which
Charlotte shares many other similarities. According to
the most recent American Community Survey,
approximately 80,000 people from outside North and
South Carolina move to the Charlotte area each year.
This does not represent the total net migration, which is
estimated to be approximately 34,084 in the calendar year
2005 (Source: Moody’s). One reason that we may see
New York (Manhattan) 201.2
San Jose, CA 166.2
Los Angeles, CA 157.4
Richmond, VA 108.4
Chicago, IL 103.3
Orlando, FL 100.8
Denver, CO 99.6
Phoenix, AZ 99.0
Atlanta, GA 97.7
Austin, TX 97.0
Raleigh-Durham, NC 94.0
Cincinnati, OH 92.8
Charlotte, NC 92.2 Table 3: ACCRA Cost of Living Index 2005 Q3
- 6 -
continued growth is the cost of living index compared to other major metropolitan areas.
We see that Charlotte enjoys a comparative advantage to Orlando, Atlanta, and Raleigh
when discussing cost of living expenses, and this can only help Charlotte attract more
residents. The future is projected to bring much growth to Charlotte, and with that
growth there is an expectation that a wide variety of restaurants and drinking places
would be needed. With North American Industry Classification System (NAICS) data
provided to ESRI from InfoUSA, they are able to prepare a Retail Market Place report by
classifying each retail establishment according to their primary function. This is then
used to estimates sales, or supply to consumers by the establishments in the specific area.
They also project what the expected amount of money spent, or demand potential by
consumers in the retail establishments. From these numbers, you can infer the surplus or
leakage in an area by taking the difference between the two numbers. A leakage would
signify that an area may be ripe for expansion and a surplus could indicate that an area is
currently oversaturated. Retail Market Place reports obtained from ESRI indicate that the
expected demand for food and drink in our metropolitan area is approximately $2.7
billion worth of sales, while on the supply side there is only $1.9 billion of supply
(Source: ESRI, Business Analyst Online, and Retail Market Place Report). This measure
is an indication that the Charlotte metropolitan area can support approximately $800
million of additional supply in the six county area, thus indicating a possible potential for
expansion. Reviewing the other similar sized cities indicate that they are all at a
MSA Charlotte Hartford Raleigh Orlando Atlanta $1.8 $1.7 $1.2 $3.6 $7.4 Supply $2.7 $2.3 $1.7 $3.0 $9.4 Demand
Surplus/Leakage -$0.8 -$0.6 -$0.5 $0.6 -$2.0
Table 4: Retail Market Place Profile, ESRI, Business Analyst Online
shortage of supply, with the exception of Orlando, which is heavily dependent on the out
of metro area tourist for their economy. The restaurant business is an extremely
competitive business, although using a simple measure to determine the market saturation
for similar sized cities; we see that Charlotte possibly has some room for expansion in the
full service restaurant and bar business. When looking at the number of full service
restaurants (SIC 722110) per person and drinking establishments (SIC Codes 581301-8)
Charlotte is just below the average of our comparison cities. Full service restaurants
were chosen because of our food component and drinking establishments were selected
- 7 -
because that will be our primary business. So many SIC codes were used because of the
different classifications of bars, but we feel that this number is an adequate measure of
the Charlotte metropolitan area.
MSA Charlotte Hartford Raleigh Orlando Atlanta Average
Population 1,499,293 1,183,110 1,187,941 1,644,561 4,112,198 1,925,421
Total Full Service Rest 1,034 906 590 1,203 3,239
Looking at the numbers with comparable sized cities, we have determined that the market
is not oversaturated with full service restaurants or drinking establishments and from the
measure of supporting approximately $800 million of additional supply, this market can
certainly support an additional restaurant/sports bar.
III. Trade Area Analysis
The trade area used for this analysis was a three mile radius around our selected site.
This area was selected for ease of data collection and also because we felt that most local
residents would visit a restaurant within that area, specifically one located on a major
thoroughfare in Charlotte and in such close proximity to a new light rail stop opening up
in the fall of 2007. Our trade area encompasses the Charlotte neighborhoods Dilworth,
Sedgefield, Colonial Village, Wilmore, Madison Park, Myers Park and much of the
uptown residential area. Our trade area also includes the Downtown, Midtown,
Southwest, Park Road, and South Park office markets. While we have included the
uptown area both in residential and office, further analysis may delete this area from our
primary trade area, especially as more and more restaurant and food services are available
to both residents and daily employees. Many of the residential neighborhoods that are in
our trade area have seen very healthy residential real estate appreciation over the last
several years as residents have returned to the inner first suburbs of Charlotte. In addition
to this increase in living closer to the urban core, the City of Charlotte is nearing
completion of the South Corridor Light Rail line, which is a major portion of the 2025
Integrated Transit/Land-Use. Because of this major infrastructure initiative, many of
these population and employment projections possibly could be very conservative. There
1,394 Table 5: Saturation Measurement Comparisons, Data Derived from the 2002 Economic Census
Population / FSR 1,450.0 1,305.9 2,013.5 1,367.0 1,269.6 1,481
Total Drinking Establishments 176 93 127 270 288 191 Population / Drinking Establishments 8,519 12,722 9,354 6,091 14,278 10,193
- 8 -
are major developers that are proposing developments all along this corridor and also in
close proximity to our proposed restaurant. Historically this has not been a very
residential area, and because of that there are very few restaurants that cater to the
residential population. By entering this market before much of the expected population
would position us to gain many first mover advantages. By initially capturing the market
in the trade are, we can build up our faithful clientele, so in the future once this area
continues to grow, we will have our solid customer base to grow with. We will position
the restaurant to have certain loyalty programs and also a revolving menu to continue
attracting our core market all the while solidifying our relationship with them. We would
expect a large number of our customers to either live in our immediate trade area, or
possibly all along the light rail corridor if they were to be using the train for
transportation to our establishment.
Again our target markets are those customers between the ages of 25-44 that would like
to enjoy a full service restaurant with a sports theme. In the immediate trade area the
total resident population is 75,125, of which 25,625 of the population (34.1%) is our
target market. Looking at the entire metropolitan area shows that only 31.5% of the total
population would be our target market, so our target market is above average compared
to the entire area. These numbers however do not include the estimated residential units
that are under construction in this area. Our anticipation is that the future residents of this
area would visit and spend money at a local establishment within walking distance or a
short car or train ride. Since our trade area dips into the uptown office market, we see
that of the 8,308 business in the trade area, we see that we have approximately 117,899
employees that work here in this. The ration of daytime to nighttime population is also
very high because of the major employment center that falls in our trade area. While we
enjoy more favorable demographics from our immediate trade area, there is also a great
deal of competition that comes with this initially promising area. Of each variable
summarized in the following table, the only two that our site is less favorable than the
Charlotte Core Based Statistical Area (CBSA) as a region are persons per establishment
and the Leakage/Surplus figures. These leakage/surplus figures are the estimated demand
of a trade area minus the estimated supply of the area based on the NAICS codes and
ESRI’s proprietary equations for these estimates. The CBSA is an Office of Management
- 9 -
and Budget defined term that collectively refers to the entire metropolitan and
micropolitan area (Source: US Census Bureau Website). This measure was used for ease
of data collection and consistency when comparing to other metropolitan areas. One
other important variable is the food away from home spending potential index. The
expenditure data captured here was obtained from the Retail Goods and Services
Expenditure report, using data from Consumer Expenditure Surveys, the Bureau of Labor
Statistics, with ESRI forecasting present and projected years. The spending potential
index represents the amount spent in our area of interest relative to the national average
of 100. This shows that based on national averages, consumers in our trade area, as well
as our CBSA are expected to spend more on food away from the home then others.
Charlotte CBSA Proposed Site % Difference
Total Businesses: 61,013 8,308
Total Employees: 680,894 117,899
Total Residential Population: 1,570,787 75,125
Daytime/Nighttime Population Ratio: 0.43 1.57 265.1% 3,011 Eating & Drinking Places (NAICS 722) 473
Persons Per Establishment 521.7 158.8 -69.6%
Population Summary 1,570,787 75,125 2006 Population 1,788,980 82,851 2011 Population
Target Market 232,185 12,966 25-34 (2006) 263,313 12,659 35-44 (2006)
Total 495,498 25,625
% of Population (2006) 31.5% 34.1% 8.1% 233,754 11,345 25-34 (2011) 284,928 14,065 35-55 (2011)
Total 518,682 25,410
% of Population (2011) 29.0% 30.7% 5.8% Average Household Income 2006 $78,275 $81,329 3.9% Average Household Income 2011 $95,967 $100,360 4.6%
Food Away from Home 112 Spending Potential Index 121 8.0%
Supply (Retail Sales) $1,865,358,181 $57,667,634 Demand (Retail Potential) $2,735,629,979 $47,660,051
Leakage/ Surplus -$870,271,798 $10,007,583 -150.3% Table 6: ESRI, Business Analyst Online Reports, Retail Goods and Services Expenditures, Retail Market Place Profile, Demographic
and Income Profile, Market Profile, Business Summary for Trade area compared to entire CBSA
- 10 -
In the Charlotte CBSA area, there are approximately 3,000 food service and drinking
places and of that number roughly half of them are located in Mecklenburg County. That
should not come to a surprise as over half of the metropolitan area resides in
Mecklenburg County. While these could all potentially serve as direct or indirect
competition, we feel that our concept will separate us out from a vast majority of these
restaurants. Of course most people will patronize a restaurant if it is convenient to their
home or work, so ultimately all of these restaurants may be considered indirect
competition. According to ESRI, the Food service and drinking places supply in our
three mile trade area is approximately $57
billion, while the demand is only $47.6
billion. ESRI obtains data from a variety of
sources based on businesses primary
industry code and calculates this estimate f
different sized geographies. For our
suggested area this presently represents a
surplus in the designated trade area,
although this does not account for all of the
growth that is expected in this area. With
the expected growth we anticipate even
more supply coming into this trade area,
which is another reason to establish our
restaurant now. Comparing our three mile trade area to three similar type restaurants in
Mecklenburg County shows how similar these sites are with our proposed restaurant.
The one difference in our location is that our site is a more urban area that will hope to
attract both customers that drive here, but also take mass transit or walk to or location.
The analog locations that were selected are Fox & Hound Ballantyne, Hops Restaurant
Bar & Brewery, and Midtown Sundries University because of their distribution
throughout Mecklenburg County. All three locations exhibit a higher spending index
then the national average; however our site far exceeds the analog stores when comparing
employees in the area, which is a positive. One negative is that our location has over
triple the competition of the next closest analog. Our population numbers are higher,
or
Map 4: Analog Stores in Mecklenburg County
- 11 -
which reinforces that this is a more urban location then the others. Our per capita income
and percentage of population in our target market are also in line with other stores,
indicating that our sales forecasts conservatively should be fairly close to what the other
stores are reporting.
Proposed Site Fox & Hound Hops Midtown Sundries
Table 7: Summarized from ESRI, Business Analyst Online Reports, Retail Goods and Services Expenditures, Retail Market Place
Profile, Demographic and Income Profile, Market Profile, Business Summary for Trade area comparisons
For a more specific analysis we will focus on the three mile radius surrounding our
proposed location. Within three miles of our proposed location we have approximately
351 food and drinking establishments, of which 79 are considered full service restaurants.
The major sources of competition in our trade area will be the other sports themed
restaurants as well as the closest restaurant that is focused on our target market. Further
Sales $2,821,000 (Estimated) $2,000,000 $2,400,000 $3,600,000
Total Businesses: 8,308 2,145 2,457 1,423
Total Employees: 117,899 18,099 23,779 17,654
Total Residential Population: 75,125 64,535 50,123 52,279
Daytime/Nighttime Population Ratio: 1.57 0.28 0.47 0.34 Eating & Drinking Places (measure of competition) 473 134 137 83
Persons Per Establishment 158.8 481.6 365.9 629.9
Population Summary 75,125 64,535 50,123 52,279 2006 Population 82,851 77,217 55,792 62,361 2011 Population
Target Market 12,966 9,939 7,370 12,089 25-34 (2006) 12,659 13,246 8,351 10,128 35-44 (2006)
Total 25,625 23,185 15,721 22,217
% of Population (2006) 34.1% 35.9% 31.4% 42.5% 11,345 10,166 8,266 10,632 25-34 (2011) 14,065 15,272 8,138 12,958 35-55 (2011)
Total 25,410 25,438 16,404 23,590
% of Population (2011) 30.7% 32.9% 29.4% 37.8% Average Household Income 2006 $81,329 $115,647 $83,962 $89,703 Average Household Income 2011 $100,360 $147,087 $101,592 $110,506
Food Away from Home
Index 121 164 121 130 Supply (Retail Sales) $57,667,634 $72,991,332 $70,516,388 $14,341,030
Demand (Retail Potential) $47,660,051 $37,169,107 $27,326,608 $26,804,532 Leakage/ Surplus $10,007,583 $35,822,225 $43,189,780 -$12,463,502
- 12 -
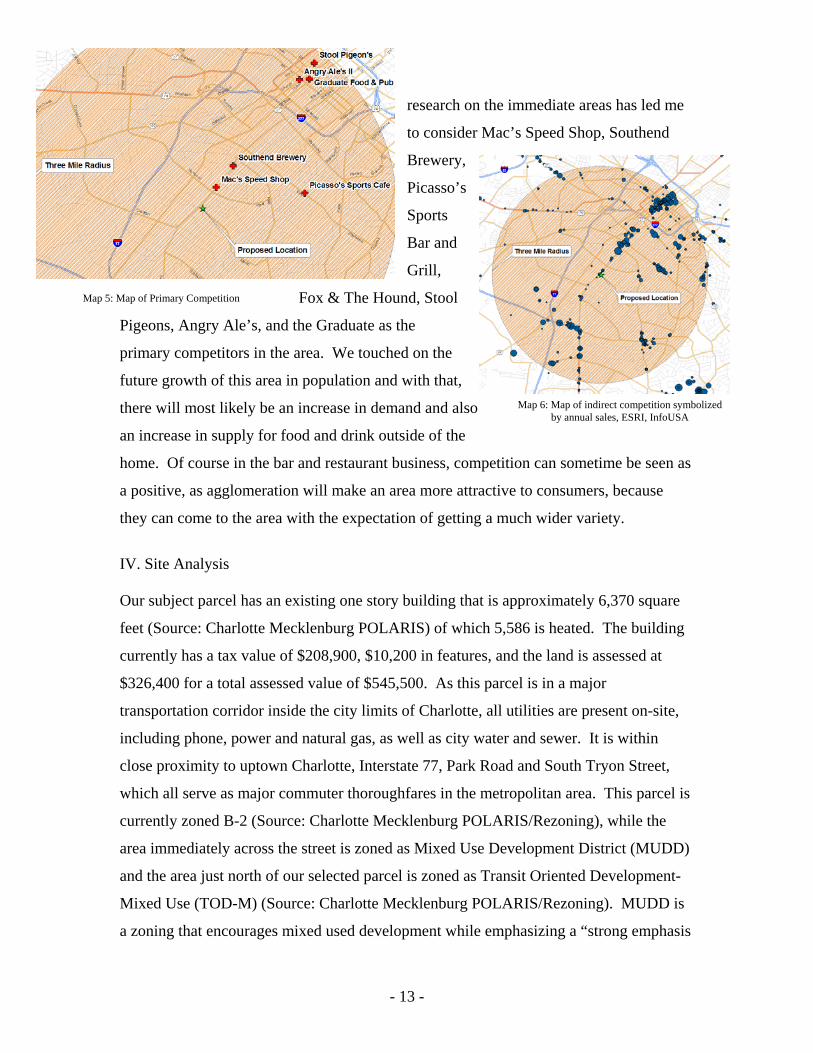
research on the immediate areas has led me
to consider Mac’s Speed Shop, Southend
Brewery,
Picasso’s
Sports
Bar and
Grill,
Fox & The Hound, Stool
Pigeons, Angry Ale’s, and the Graduate as the
primary competitors in the area. We touched on the
future growth of this area in population and with tha
there will most likely be an increase in demand and also
an increase in supply for food and drink outsid
t,
e of the
ome. Of course in the bar and restaurant business, com
meration will make an area more attractive to consumers, because
ng a much wider variety.
ng that is approximately 6,370 square
) of which 5,586 is heated. The building
his parcel is
D)
ment-
asis
Map 5: Map of Primary Competition
Map 6: Map of indirect competition symbolized by annual sales, ESRI, InfoUSA
h petition can sometime be seen as
a positive, as agglo
they can come to the area with the expectation of getti
IV. Site Analysis Our subject parcel has an existing one story buildi
feet (Source: Charlotte Mecklenburg POLARIS
currently has a tax value of $208,900, $10,200 in features, and the land is assessed at
$326,400 for a total assessed value of $545,500. As this parcel is in a major
transportation corridor inside the city limits of Charlotte, all utilities are present on-site,
including phone, power and natural gas, as well as city water and sewer. It is within
close proximity to uptown Charlotte, Interstate 77, Park Road and South Tryon Street,
which all serve as major commuter thoroughfares in the metropolitan area. T
currently zoned B-2 (Source: Charlotte Mecklenburg POLARIS/Rezoning), while the
area immediately across the street is zoned as Mixed Use Development District (MUD
and the area just north of our selected parcel is zoned as Transit Oriented Develop
Mixed Use (TOD-M) (Source: Charlotte Mecklenburg POLARIS/Rezoning). MUDD is
a zoning that encourages mixed used development while emphasizing a “strong emph
- 13 -
on pedestrian scale, urban development and amenities” (Source: Charlotte Zoning Code,
Chapter 9). TOD-M is a special zoning that is very similar to mixed use, however it o
occurs within ½ half mile or a 10-minute walk of a transit station.. While the proposed
business is approved for B-2 zoning, we may receive less stringent parking requirement
if the location was zoned either MU
nly
s
DD or TOD-M.
he
osing
s
s
el
.
s
th
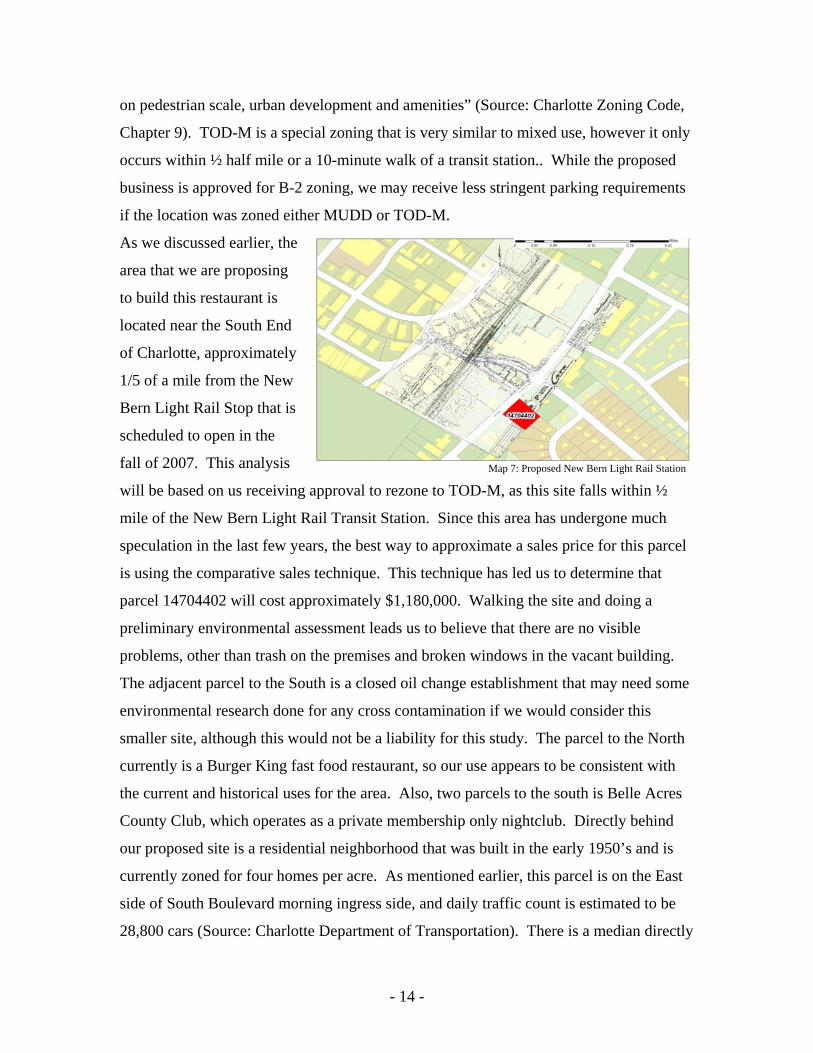
As we discussed earlier, t
area that we are prop
to build this restaurant i
located near the South End
of Charlotte, approximately
1/5 of a mile from the New
Bern Light Rail Stop that i
scheduled to open in the
fall of 2007. This analysis
will be based on us receiving approval to rezone to TOD-M, as this site falls within ½
mile of the New Bern Light Rail Transit Station. Since this area has undergone much
speculation in the last few years, the best way to approximate a sales price for this parc
is using the comparative sales technique. This technique has led us to determine that
parcel 14704402 will cost approximately $1,180,000. Walking the site and doing a
preliminary environmental assessment leads us to believe that there are no visible
problems, other than trash on the premises and broken windows in the vacant building
The adjacent parcel to the South is a closed oil change establishment that may need some
environmental research done for any cross contamination if we would consider thi
smaller site, although this would not be a liability for this study. The parcel to the North
currently is a Burger King fast food restaurant, so our use appears to be consistent wi
the current and historical uses for the area. Also, two parcels to the south is Belle Acres
County Club, which operates as a private membership only nightclub. Directly behind
our proposed site is a residential neighborhood that was built in the early 1950’s and is
currently zoned for four homes per acre. As mentioned earlier, this parcel is on the East
side of South Boulevard morning ingress side, and daily traffic count is estimated to be
28,800 cars (Source: Charlotte Department of Transportation). There is a median directly
Map 7: Proposed New Bern Light Rail Station
- 14 -
in front of the parcel that would prohibit cars turning directly into our parking lot drivin
southbound, but currently access coming from the North is done through the adjacen
shared parking lot. Since this was parcel was a restaurant for many years, there are no
expectations that there will be any adverse reaction from the surrounding residen
Attempts to interview residents in the neighborhood immediately bordering the rear of
the restaurant proved to be unproductive, however we can expect a positive reaction as
the site will no longer be a vacant building. One criticism of a recently opened full
service restaurant which also serves alcohol in the immediate trade area is complaints of
loud motorcycles and other noise pollution from the building and parking lot. Further
analysis should be done to determine if a noise barrier is to be built on the back of our
property to separate and buffer the neighborhood.
g
t
ts.
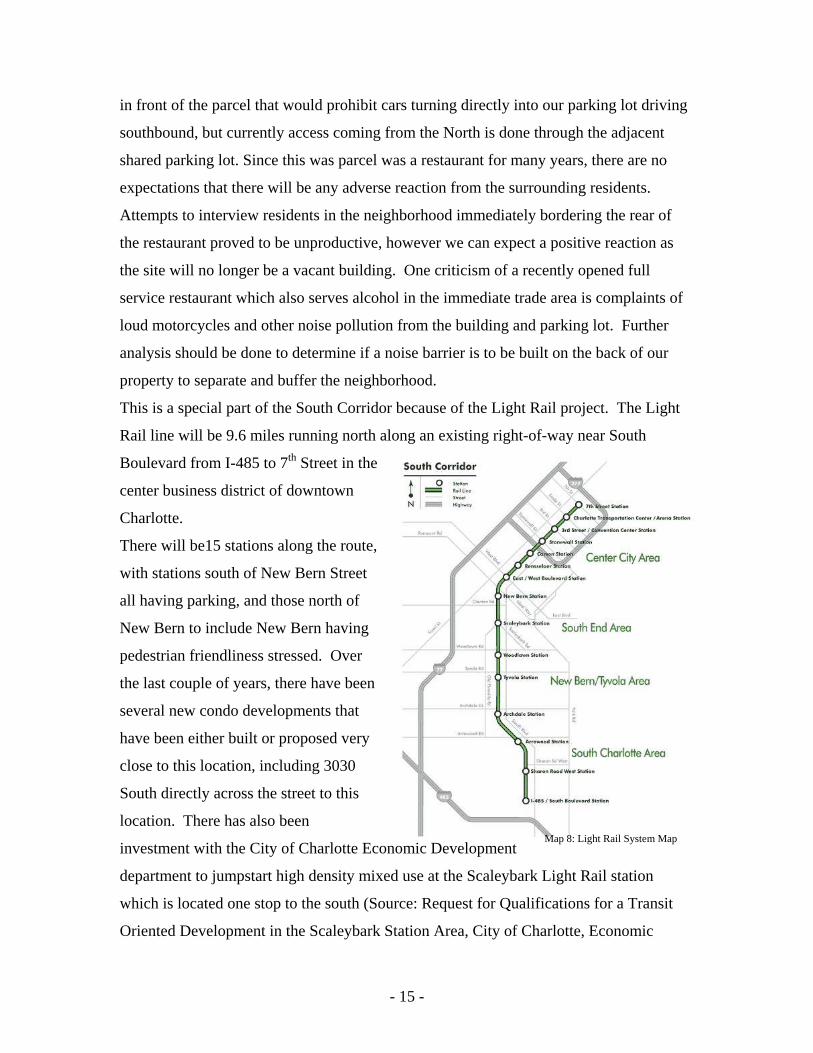
This is a special part of the South Corridor because of the Light Rail project. The Light
Rail line will be 9.6 miles running north along an existing right-of-way near South
Boulevard from I-485 to 7th Street in the
center business district of downtown
Charlotte.
There will be15 stations along the route,
with stations south of New Bern Street
all having parking, and those north of
New Bern to include New Bern having
pedestrian friendliness stressed. Over
the last couple of years, there have been
several new condo developments that
have been either built or proposed very
close to this location, including 3030
South directly across the street to this
location. There has also been
investment with the City of Charlotte Economic Development
department to jumpstart high density mixed use at the Scaleybark Light Rail station
which is located one stop to the south (Source: Request for Qualifications for a Transit
Oriented Development in the Scaleybark Station Area, City of Charlotte, Economic
Map 8: Light Rail System Map
- 15 -
Development Office). After a cursory search of the Charlotte Mecklenburg Rezoning
website, there are approximately 2800 residential condominium units proposed or
currently built within ½ mile of our proposed site (Source: Charlotte Rezoning Petitions
2006-128, 129; 2005-091,117). As these developments are all under development,
with the exception of 3030 South, we do not
know the future sales prices of these units. A
cursory search of real estate listings shows that
units in 3030 South range from $175,000 for a
692 square foot unit to 296,900 for a 1,112 square
foot unit (Source: MyTownhome Available Listings). Future residents in a development
such as this or the proposed similar developments in the future are expected to be
younger, and in the higher income categories; both characteristics that our business
requires. While the area demographics could lean towards the site not working, with the
upcoming light rail, the investment that the city is making towards high-density growth in
the South Corridor and the rapid higher income residential growth of this area may push
this over the edge. After consideration of costs based on the size of the parcel and size of
our proposed building, we may want to consider parcels within the area that are much
smaller to save on land acquisition costs as well as obtain a site that can be accessed from
both north and south on South Boulevard. The site adjacent may be a qualified site,
although we discussed the potential for environmental contamination.
Proposed Units
3030 South 110
Blue Sky Partners 200
Poindexter Village Up to 1000
Scaleybark Station Up to 1180
HH Hunt Corp 320
Total 2800 Table 8: Future Residential Developments
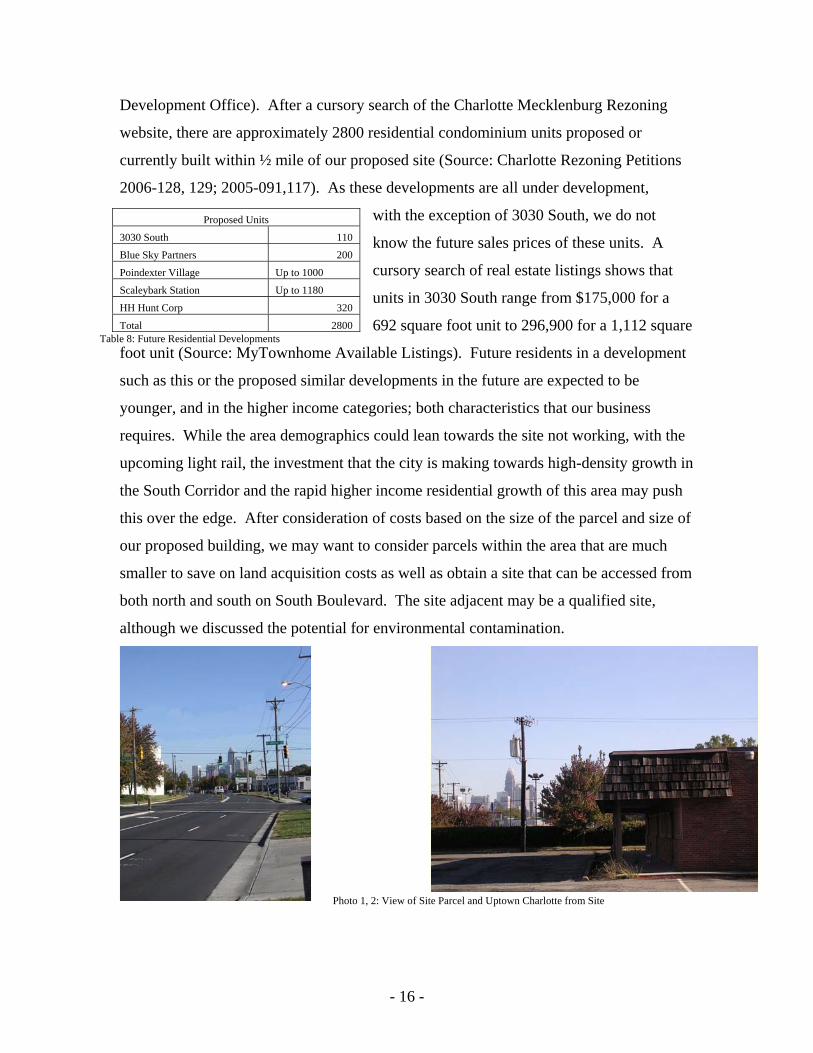
Photo 1, 2: View of Site Parcel and Uptown Charlotte from Site
- 16 -
Photo 3: Photo of Residential Complex across street from Parcel
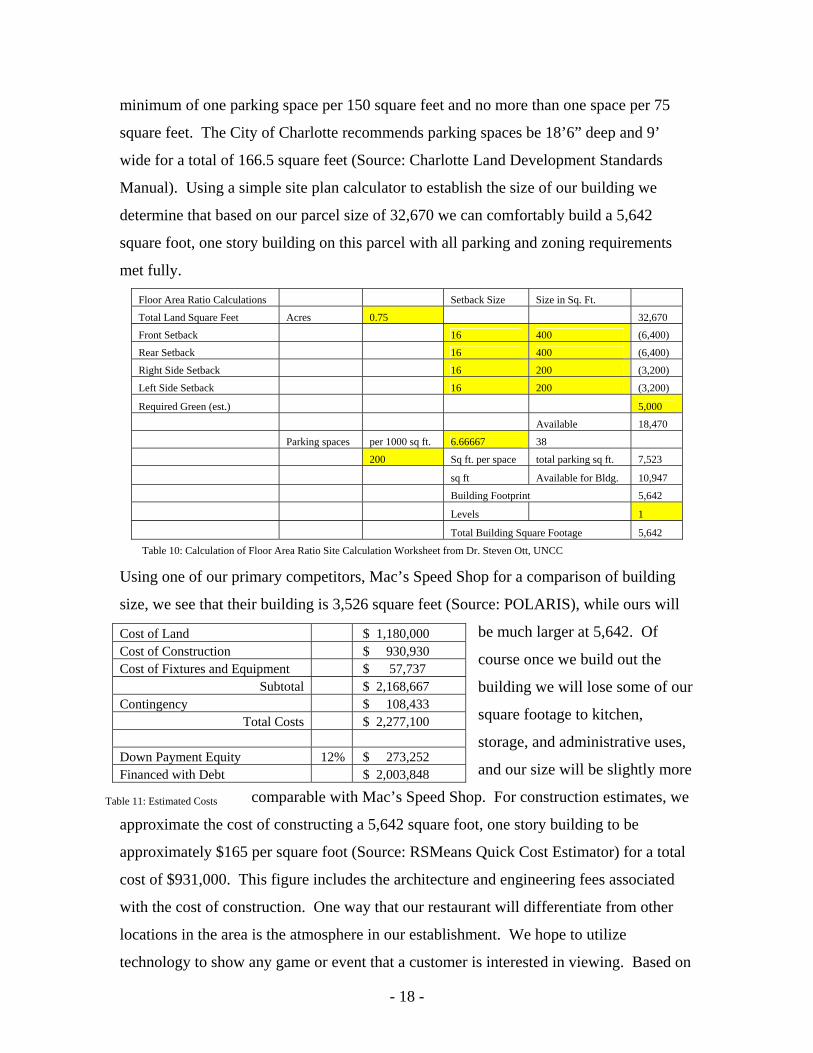
V. Financial Analysis: This analysis is based on us purchasing the selected site (Parcel ID 14704402), although
it is not currently on the market. Since this area is about to experience a massive change
with the introduction of the light rail, there has been much speculative purchasing to
position for the major changes. In order to get a better approximation for the cost of the
property, I used the comparative sales technique by selecting seven parcels in the
immediate area that have sold from August of 2005 until now. These parcels were both
vacant and had abandoned buildings on them, so for this analysis we calculated the
average price per square foot of the parcel, as most buildings if they exist would need to
be torn down or completely remodeled, as is the case with our parcel. Because of the
heightened interest that this area has shown, the prices have escalated substantially in this
time, so if the purchase is delayed substantially, we may need to recalculate this at a
different, higher cost.
Parcel # Date purchased Acres Square Feet Sales Price $/Sq Ft 14701710 8/23/2005 4.92 214,271.64 $5,143,000 $24.00 12104112 11/3/2005 0.74 32,234.40 $1,750,000 $54.29 12104412 3/1/2006 1.90 82,764.00 $4,225,000 $51.05 12104116 1/31/2006 1.78 77,536.80 $2,226,000 $28.71 12104115 8/30/2005 2.13 92,957.04 $3,800,000 $40.88 12104120 3/3/2006 1.27 55,103.40 $1,600,000 $29.04 14701713 6/14/2006 0.84 36,590.40 $950,000 $25.96
Average 1.94 84,493.95 $2,813,429 $36.28 14704402 Subject Parcel 0.75 32,640.00 $1,184,031 $36.28 14704403 Parcel next door 0.50 21,570.00 $782,462 $36.28
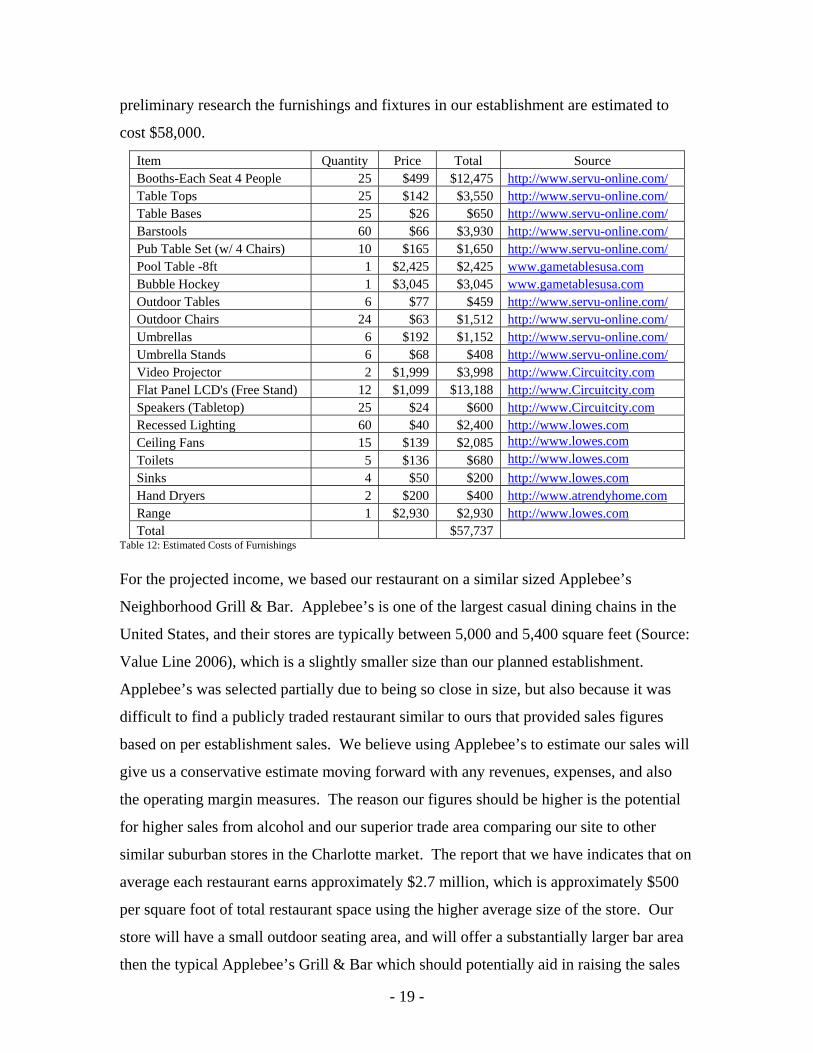
Table 9: Comparative Sales sourced from Charlotte-Mecklenburg Property Ownership Land Records Information System (POLARIS) In order to determine the size of the building that would be permitted on this site that is
zoned TOD-M we have accounted for several variables. As defined by the Charlotte City
Zoning Ordinance, if a station area plan does not specify a setback, one of sixteen feet
shall be used (Source: Charlotte Zoning Code, Chapter 9): The base height for all
structures shall be 40 feet, although based on us constructing a one story building; this
should not affect our location. Lastly, when the land use is a restaurant, there is a
- 17 -
minimum of one parking space per 150 square feet and no more than one space per 75
square feet. The City of Charlotte recommends parking spaces be 18’6” deep and 9’
wide for a total of 166.5 square feet (Source: Charlotte Land Development Standards
Manual). Using a simple site plan calculator to establish the size of our building we
determine that based on our parcel size of 32,670 we can comfortably build a 5,642
square foot, one story building on this parcel with all parking and zoning requirements
met fully.
Floor Area Ratio Calculations Setback Size Size in Sq. Ft.
Total Land Square Feet Acres 0.75 32,670
Front Setback 16 400 (6,400)
Rear Setback 16 400 (6,400)
Right Side Setback 16 200 (3,200)
Left Side Setback 16 200 (3,200)
Required Green (est.) 5,000
Available 18,470
Parking spaces per 1000 sq ft. 6.66667 38
200 Sq ft. per space total parking sq ft. 7,523
sq ft Available for Bldg. 10,947
Building Footprint 5,642
Levels 1 Total Building Square Footage 5,642
Table 10: Calculation of Floor Area Ratio Site Calculation Worksheet from Dr. Steven Ott, UNCC
Using one of our primary competitors, Mac’s Speed Shop for a comparison of building
size, we see that their building is 3,526 square feet (Source: POLARIS), while ours will
be much larger at 5,642. Of
course once we build out the
building we will lose some of our
square footage to kitchen,
storage, and administrative uses,
and our size will be slightly more
comparable with Mac’s Speed Shop. For construction estimates, we
approximate the cost of constructing a 5,642 square foot, one story building to be
approximately $165 per square foot (Source: RSMeans Quick Cost Estimator) for a total
cost of $931,000. This figure includes the architecture and engineering fees associated
with the cost of construction. One way that our restaurant will differentiate from other
locations in the area is the atmosphere in our establishment. We hope to utilize
technology to show any game or event that a customer is interested in viewing. Based on
Cost of Land $ 1,180,000 Cost of Construction $ 930,930 Cost of Fixtures and Equipment $ 57,737
Subtotal $ 2,168,667 Contingency $ 108,433
Total Costs $ 2,277,100
Down Payment Equity 12% $ 273,252 Financed with Debt $ 2,003,848
Table 11: Estimated Costs
- 18 -
preliminary research the furnishings and fixtures in our establishment are estimated to
cost $58,000.
Item Quantity Price Total Source Booths-Each Seat 4 People 25 $499 $12,475 http://www.servu-online.com/Table Tops 25 $142 $3,550 http://www.servu-online.com/Table Bases 25 $26 $650 http://www.servu-online.com/Barstools 60 $66 $3,930 http://www.servu-online.com/Pub Table Set (w/ 4 Chairs) 10 $165 $1,650 http://www.servu-online.com/Pool Table -8ft 1 $2,425 $2,425 www.gametablesusa.com Bubble Hockey 1 $3,045 $3,045 www.gametablesusa.com Outdoor Tables 6 $77 $459 http://www.servu-online.com/Outdoor Chairs 24 $63 $1,512 http://www.servu-online.com/Umbrellas 6 $192 $1,152 http://www.servu-online.com/Umbrella Stands 6 $68 $408 http://www.servu-online.com/Video Projector 2 $1,999 $3,998 http://www.Circuitcity.com Flat Panel LCD's (Free Stand) 12 $1,099 $13,188 http://www.Circuitcity.com Speakers (Tabletop) 25 $24 $600 http://www.Circuitcity.com Recessed Lighting 60 $40 $2,400 http://www.lowes.com
http://www.lowes.comCeiling Fans 15 $139 $2,085 Toilets 5 $136 $680 http://www.lowes.com Sinks 4 $50 $200 http://www.lowes.comHand Dryers 2 $200 $400 http://www.atrendyhome.com Range 1 $2,930 $2,930 http://www.lowes.comTotal $57,737
Table 12: Estimated Costs of Furnishings For the projected income, we based our restaurant on a similar sized Applebee’s
Neighborhood Grill & Bar. Applebee’s is one of the largest casual dining chains in the
United States, and their stores are typically between 5,000 and 5,400 square feet (Source:
Value Line 2006), which is a slightly smaller size than our planned establishment.
Applebee’s was selected partially due to being so close in size, but also because it was
difficult to find a publicly traded restaurant similar to ours that provided sales figures
based on per establishment sales. We believe using Applebee’s to estimate our sales will
give us a conservative estimate moving forward with any revenues, expenses, and also
the operating margin measures. The reason our figures should be higher is the potential
for higher sales from alcohol and our superior trade area comparing our site to other
similar suburban stores in the Charlotte market. The report that we have indicates that on
average each restaurant earns approximately $2.7 million, which is approximately $500
per square foot of total restaurant space using the higher average size of the store. Our
store will have a small outdoor seating area, and will offer a substantially larger bar area
then the typical Applebee’s Grill & Bar which should potentially aid in raising the sales
- 19 -
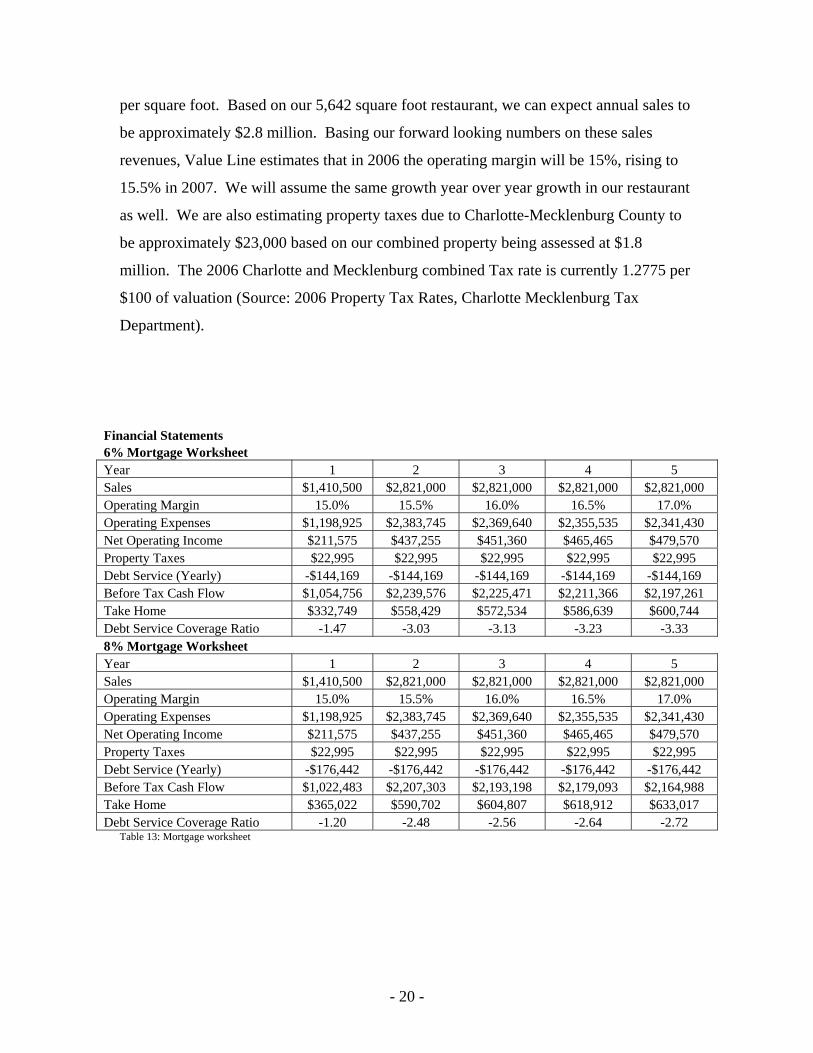
per square foot. Based on our 5,642 square foot restaurant, we can expect annual sales to
be approximately $2.8 million. Basing our forward looking numbers on these sales
revenues, Value Line estimates that in 2006 the operating margin will be 15%, rising to
15.5% in 2007. We will assume the same growth year over year growth in our restaurant
as well. We are also estimating property taxes due to Charlotte-Mecklenburg County to
be approximately $23,000 based on our combined property being assessed at $1.8
million. The 2006 Charlotte and Mecklenburg combined Tax rate is currently 1.2775 per
$100 of valuation (Source: 2006 Property Tax Rates, Charlotte Mecklenburg Tax
Department).
Financial Statements 6% Mortgage Worksheet Year 1 2 3 4 5 Sales $1,410,500 $2,821,000 $2,821,000 $2,821,000 $2,821,000 Operating Margin 15.0% 15.5% 16.0% 16.5% 17.0% Operating Expenses $1,198,925 $2,383,745 $2,369,640 $2,355,535 $2,341,430 Net Operating Income $211,575 $437,255 $451,360 $465,465 $479,570 Property Taxes $22,995 $22,995 $22,995 $22,995 $22,995 Debt Service (Yearly) -$144,169 -$144,169 -$144,169 -$144,169 -$144,169 Before Tax Cash Flow $1,054,756 $2,239,576 $2,225,471 $2,211,366 $2,197,261 Take Home $332,749 $558,429 $572,534 $586,639 $600,744 Debt Service Coverage Ratio -1.47 -3.03 -3.13 -3.23 -3.33 8% Mortgage Worksheet Year 1 2 3 4 5 Sales $1,410,500 $2,821,000 $2,821,000 $2,821,000 $2,821,000 Operating Margin 15.0% 15.5% 16.0% 16.5% 17.0% Operating Expenses $1,198,925 $2,383,745 $2,369,640 $2,355,535 $2,341,430 Net Operating Income $211,575 $437,255 $451,360 $465,465 $479,570 Property Taxes $22,995 $22,995 $22,995 $22,995 $22,995 Debt Service (Yearly) -$176,442 -$176,442 -$176,442 -$176,442 -$176,442 Before Tax Cash Flow $1,022,483 $2,207,303 $2,193,198 $2,179,093 $2,164,988 Take Home $365,022 $590,702 $604,807 $618,912 $633,017 Debt Service Coverage Ratio -1.20 -2.48 -2.56 -2.64 -2.72
Table 13: Mortgage worksheet
- 20 -
0% Appreciation 4% Appreciation 6% Mortgage 8% Mortgage 6% Mortgage 8% Mortgage
$2,277,100 $2,277,100 Project Costs $ 2,277,100 $ 2,277,100 Project Costs $2,770,440 $2,770,440 Sales Price $ 2,277,100 $ 2,277,100 Sales Price 3.0% 3.0% Sales Charge 3.0% 3.0% Sales Charge $83,113 $83,113 Cost of Sale $ 68,313 $ 68,313 Cost of Sale $2,687,327 $2,687,327 Net Sale $ 2,208,787 $ 2,208,787 Net Sale $1,864,668 $1,905,055 Mortgage Balance $ 1,864,668 $ 1,905,055 Mortgage Balance $822,659 $782,272 Net Profit $ 344,119 $ 303,732 Net Profit $273,252 $273,252 Down Payment $ 273,252 $ 273,252 Down Payment $549,407 $509,020 Pre-Tax Equity Gain $ 70,867 $ 30,480 Pre-Tax Equity Gain
Years 5 5 Years 5 5 201.1% 186.3% Total ROI 25.9% 11.2% Total ROI 16.8% 15.5% Annual 2.2% 0.9% Annual
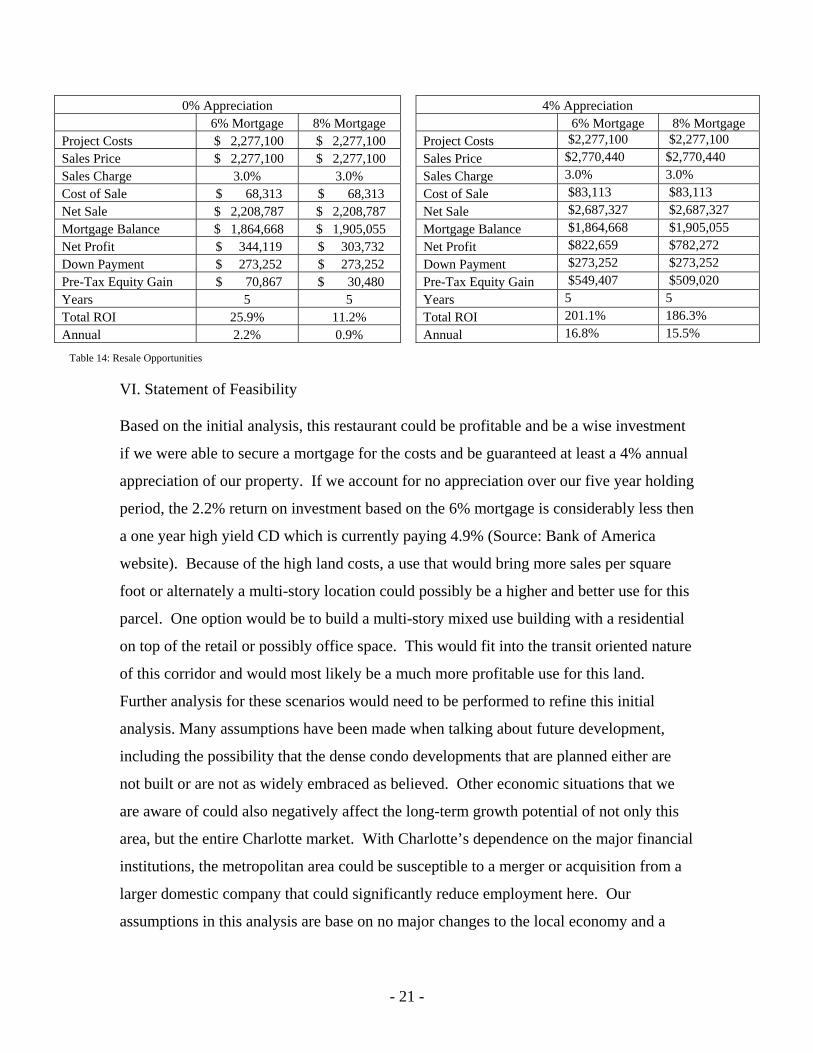
Table 14: Resale Opportunities
VI. Statement of Feasibility Based on the initial analysis, this restaurant could be profitable and be a wise investment
if we were able to secure a mortgage for the costs and be guaranteed at least a 4% annual
appreciation of our property. If we account for no appreciation over our five year holding
period, the 2.2% return on investment based on the 6% mortgage is considerably less then
a one year high yield CD which is currently paying 4.9% (Source: Bank of America
website). Because of the high land costs, a use that would bring more sales per square
foot or alternately a multi-story location could possibly be a higher and better use for this
parcel. One option would be to build a multi-story mixed use building with a residential
on top of the retail or possibly office space. This would fit into the transit oriented nature
of this corridor and would most likely be a much more profitable use for this land.
Further analysis for these scenarios would need to be performed to refine this initial
analysis. Many assumptions have been made when talking about future development,
including the possibility that the dense condo developments that are planned either are
not built or are not as widely embraced as believed. Other economic situations that we
are aware of could also negatively affect the long-term growth potential of not only this
area, but the entire Charlotte market. With Charlotte’s dependence on the major financial
institutions, the metropolitan area could be susceptible to a merger or acquisition from a
larger domestic company that could significantly reduce employment here. Our
assumptions in this analysis are base on no major changes to the local economy and a
- 21 -
continuation of the population growth that Charlotte has historically had and is projected
to gain in the next several years.
VII. Self-Assessment From the beginning I felt that this would not be a financial success because I struggled to
find an accurate projection to the future population and demographics of this corridor.
The trade area that I drew accounted for a large portion West of I-77, even though that is
not part of our target market. In addition to capturing non-targeted areas, we also
captured the center business district of Charlotte, which skewed many of numbers,
mainly in competition and the number of employees. I would need to do further research
to determine if someone that works uptown and did not commute home via South
Boulevard would patronize our proposed location. For the next phase of analysis I could
add some metric for commuters or visitors to Charlotte that actually ride the light rail,
and possibly add some consumer studies to see what types of people would ride a train to
a restaurant in Charlotte.
- 22 -
VIII. Works Cited US Census Bureau, (www.census.gov) Table 1. Annual Estimates of the Population of Metropolitan and Micropolitan Statistical Areas: April 1, 2000 to July 1, 2005; Table 1a Population in Metropolitan and Micropolitan Statistical Areas in Alphabetical Order and Numerical and Percent Change for the United States and Puerto Rico: 1990 and 2000, Regional Economic Profiles https://bea.gov/bea/regional/reis/action.cfm comparison of 1969 -2004 accessed 9/24/06. Fast Facts about CATS http://216.1.6.76/cgi-bin/MsmGo.exe?grab_id=103499000&EXTRA_ARG=B1%3DGo&CFGNAME=MssFind%2Ecfg&host_id=1&page_id=768&query=1998+transit+tax&hiword=1998+TRANSIT+TAX+TRANSITION+TRANSITIONS+TRANSITO+TRANSITE+TRANSITS+ accessed 9/24/06 ESRI Business Analyst Reports for Metropolitan areas, analog trade areas, and proposed trade areas. http://www.esri.com/software/bao/index.html Reports include Retail Goods and Services Expenditures, Retail Market Place Profile, Demographic and Income Profile, Market Profile, Business Summary. All reports can be provided at request. South Corridor Light Rail Project History http://www.charmeck.org/Departments/CATS/Rapid+Transit+Planning/South+Corridor/South+History.htm Charlotte Future for Transportation and Light Rail information http://www.charmeck.org/Departments/Charlotte+Future/ County Business Patterns (http://censtats.census.gov) for number of establishments in area. Core Based Statistical Area Definition, US Census Bureau Website http://www.census.gov/hhes/www/housing/resseg/cbsa.html Charlotte Chamber of Commerce Website, Economic Profile http://www.charlottechamber.com/content.cfm?category_level_id=133&content_id=190 Charlotte Rezoning Petitions 2006-129 2006-128 2005-117 2005-091 National Restaurant Association, Restaurant Industry at a Glance, North Carolina http://www.restaurant.org/research/state/index.cfm 2006 Property Tax Rates, Charlotte Mecklenburg Tax Department http://charmeck.org/Departments/Tax+Collections/Tax+Rates/2006TaxRates.htm
- 23 -
Bizstats.com RSMeans Quick Cost Estimator http://www.realestatejournal.com/toolkit/constructioncosts/ Request for Qualifications for a Transit Oriented Development in the Scaleybark Station Area, City of Charlotte Economic Development Office Charlotte Department of Transportation, Data collected 2003, 2004 and through June 2005 by CDOT Data Collection Section http://www.charmeck.org/Departments/Transportation/Roads/Traffic+Counts.htm Charlotte Zoning Code, Chapter 9 http://www.charmeck.org/NR/rdonlyres/epjh4qq5b6l7hwu7wkl7gsqyb72ecnqzl452trgowmgnjjherel6gmoflzp3pflm2low2ox56oqht7xz4uylc5sfbhf/ZoningOrdCityChapter09.pdf Charlotte Land Development Standards Manual (Effective December 1, 2006) Parking Standards, 50.09A Bank of America Website, www.bankofamerica.com to obtain prevailing interest rates. Infoplease 2003 NFL Attendance (http://www.infoplease.com/ipsa/A0905961.html, accessed December 1, 2006) Slam Sports, Charlotte Bobcats Attendance Comparison (http://slam.canoe.ca/StatsBKP/BC-BKP-STAT-CHARLOTTEATTCOMP-R.html accessed December 1, 2006) Slapshot for Success, Greater Charlotte Biz, November 2006, Checkers Attendance Figure. MyTownhome Website: Available Listings for 3030 South Community. http://www.mytownhome.com/cgi-bin/searchbrs2.pl accessed December 2, 2006
- 24 -